
Examination of User Emotions and Task Performance in Indoor Space Design Using Mixed-Reality

Abstract
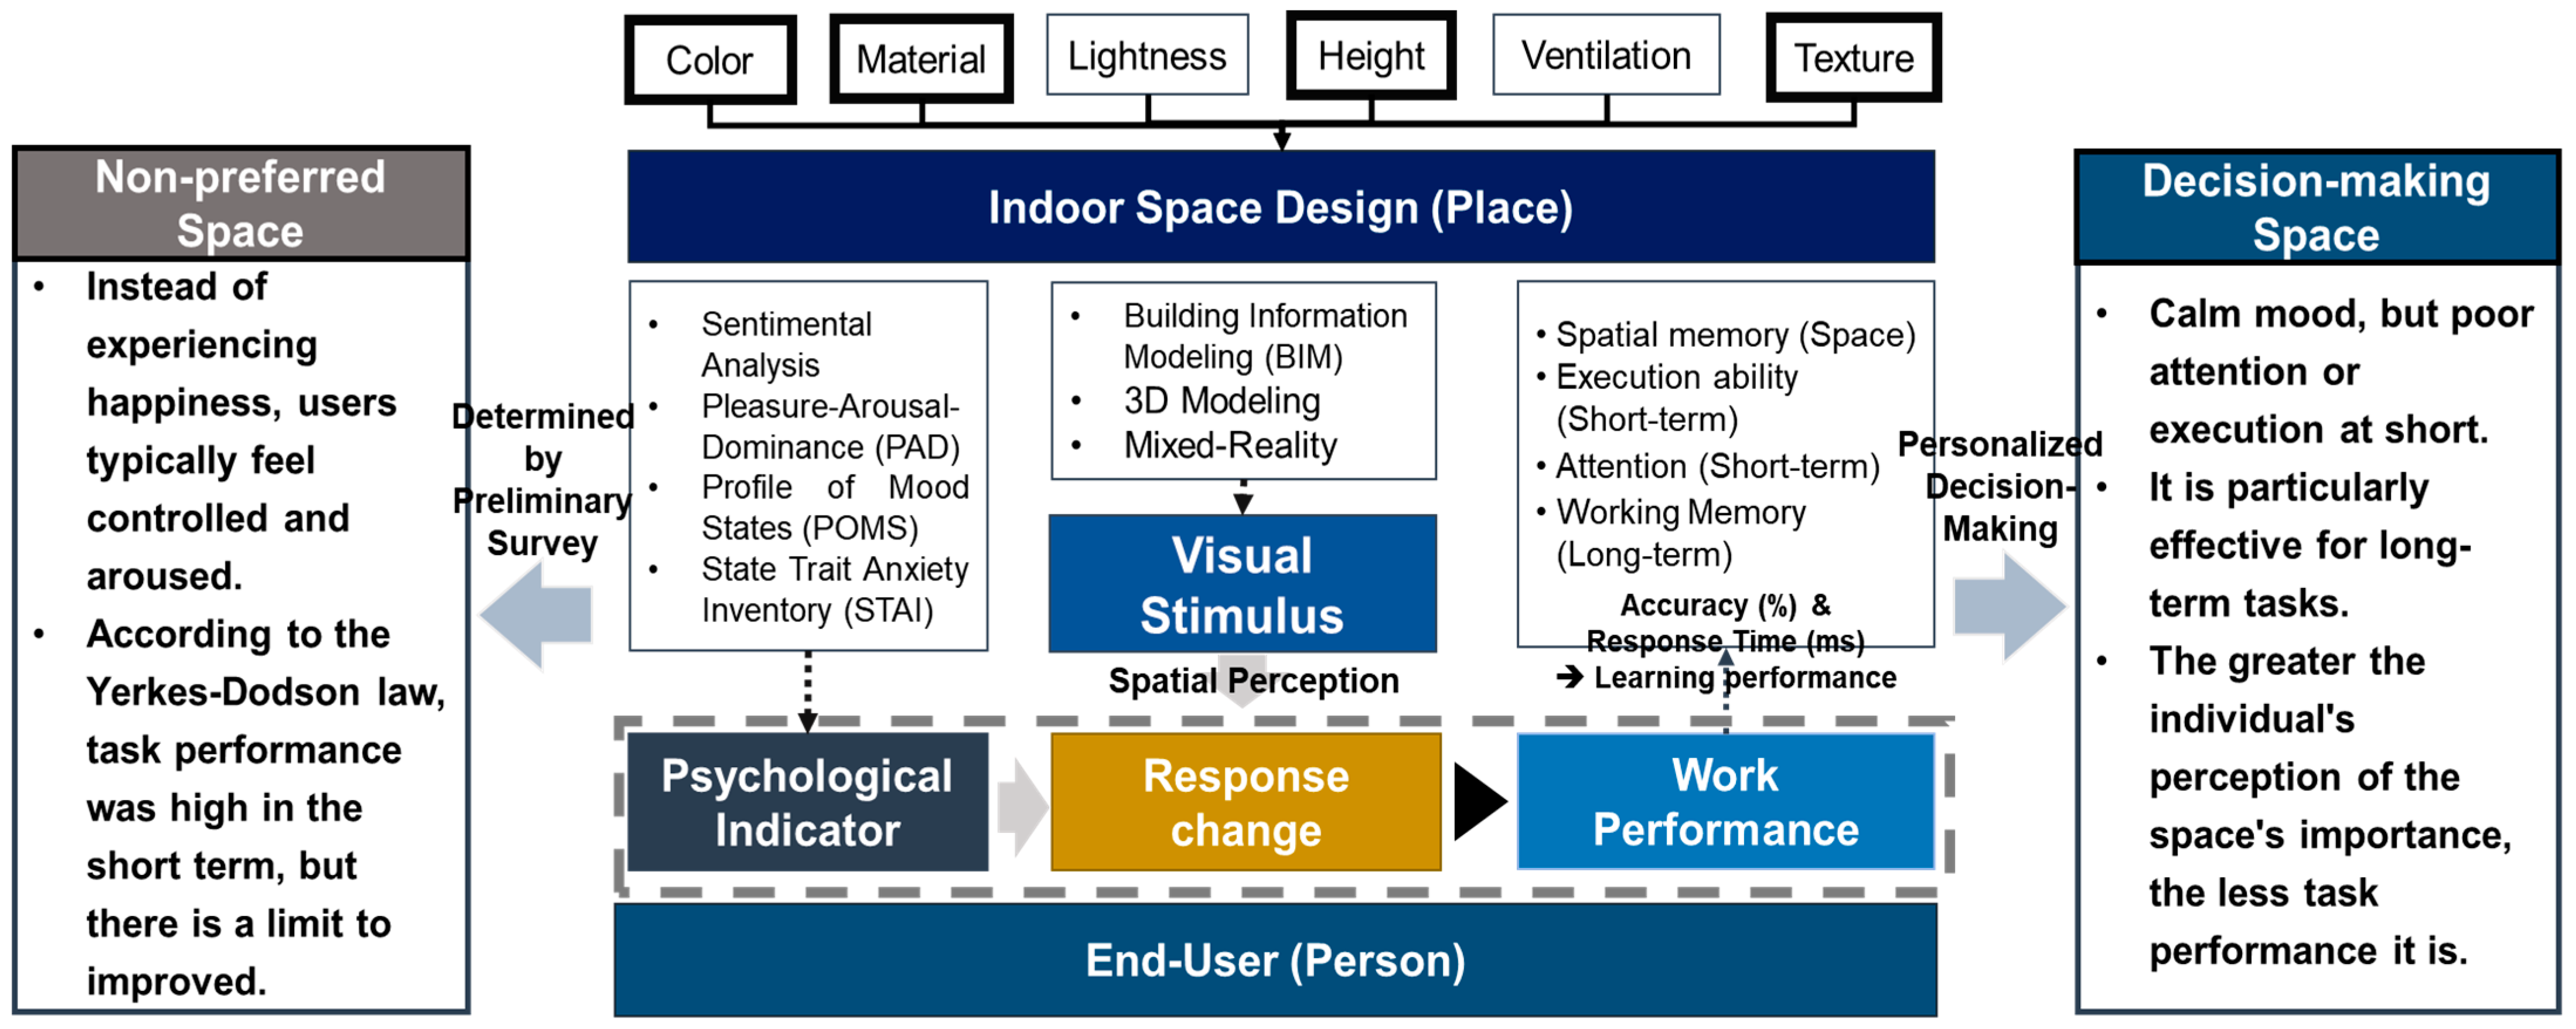
:1. Introduction
2. Materials and Methods
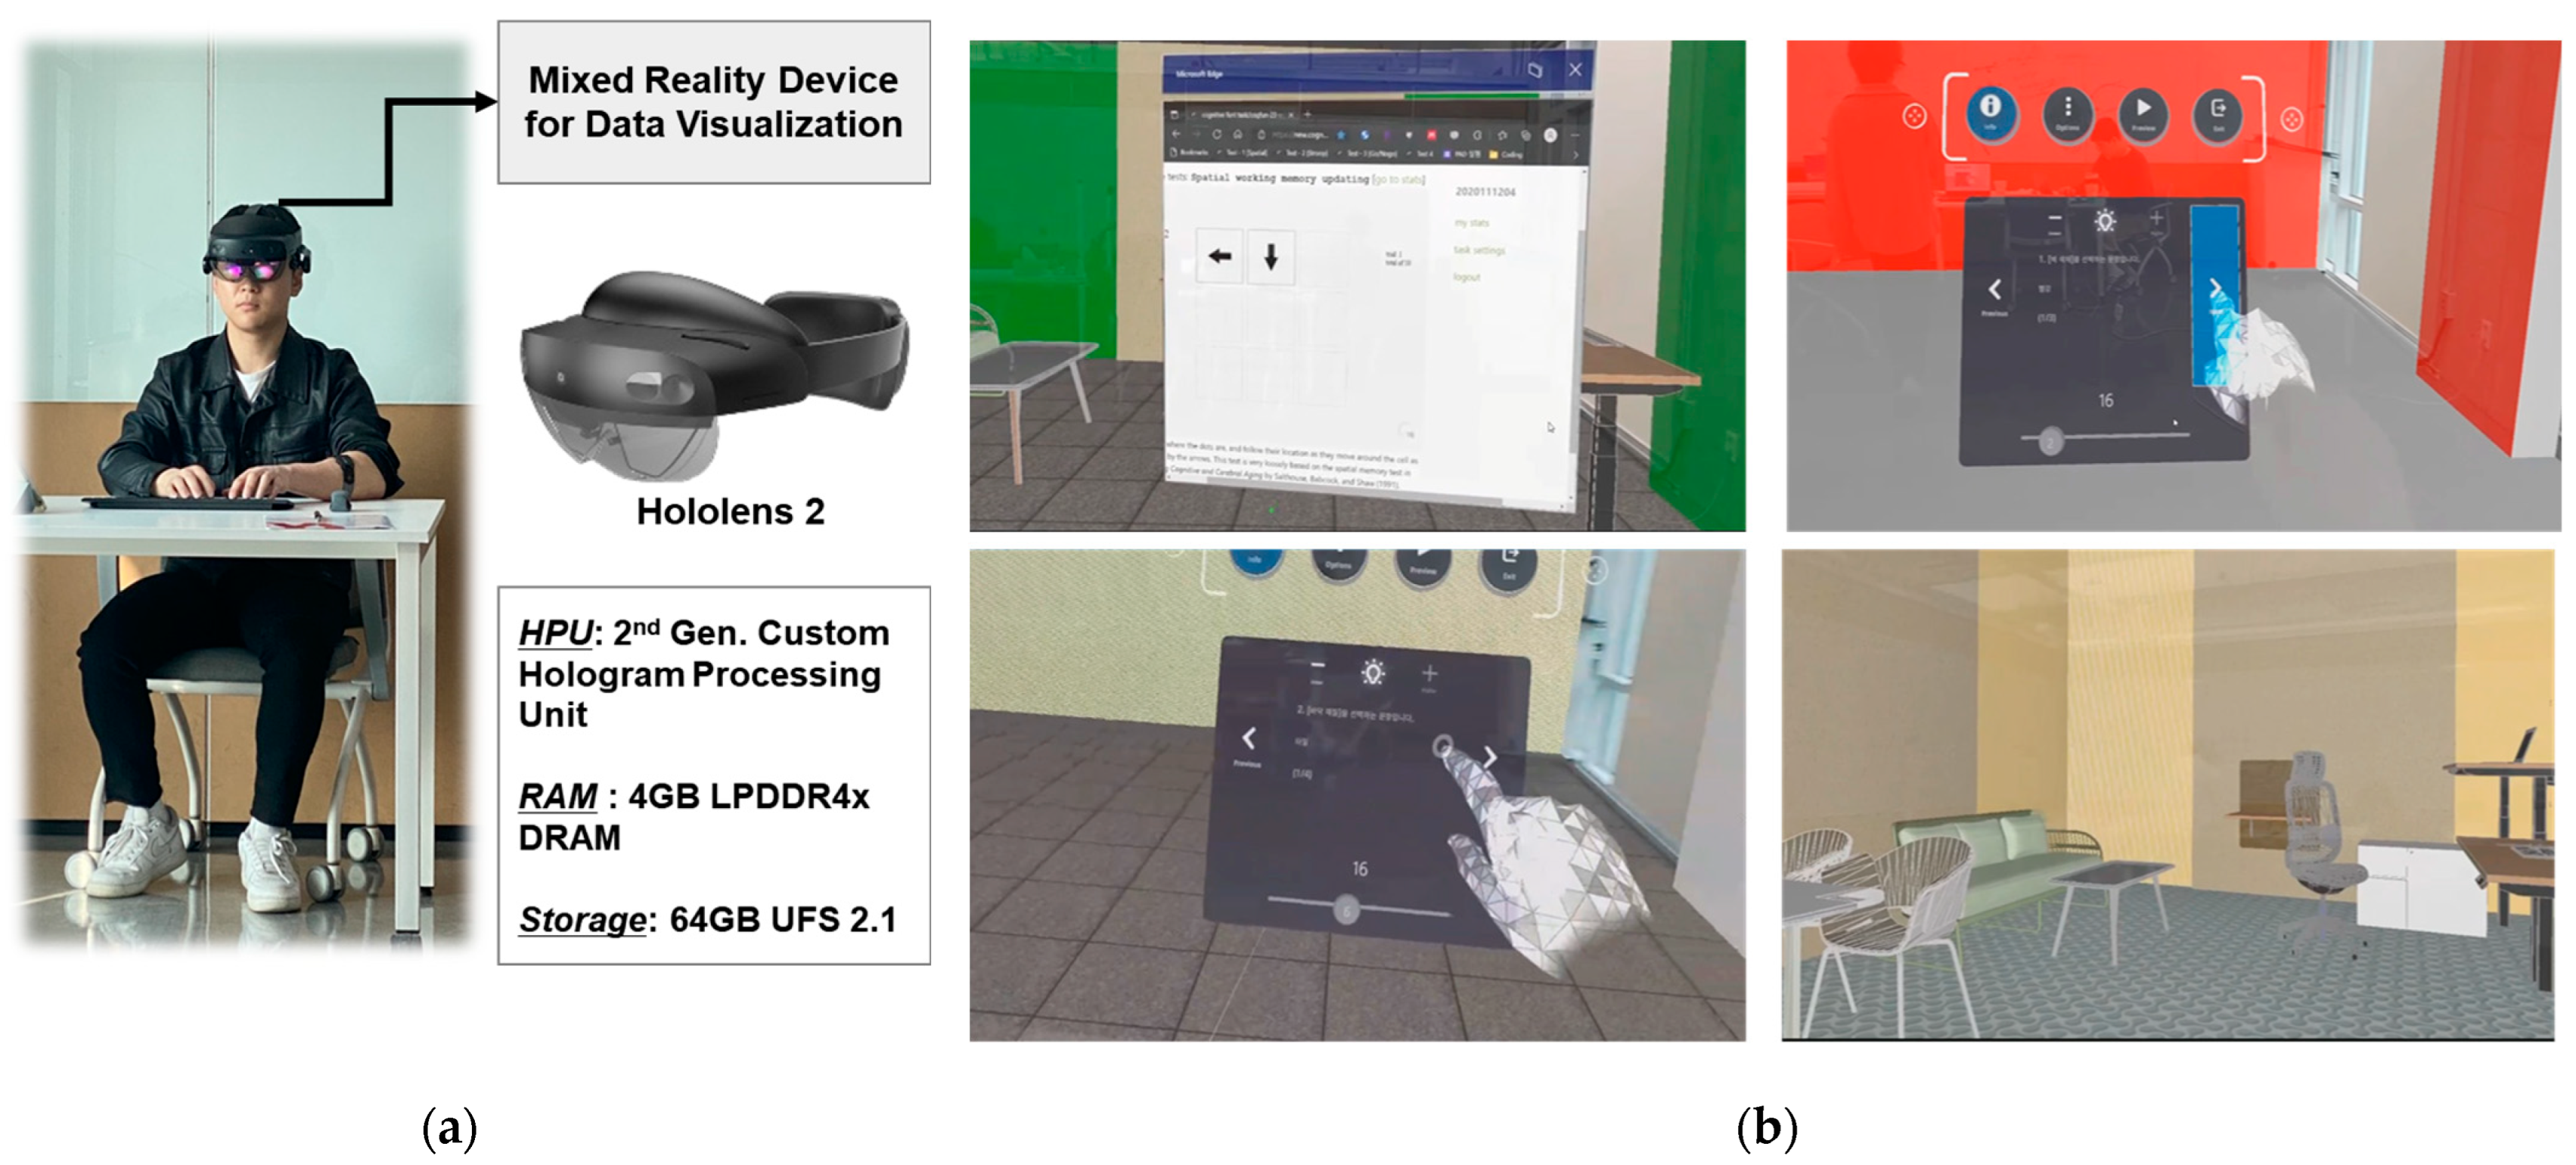
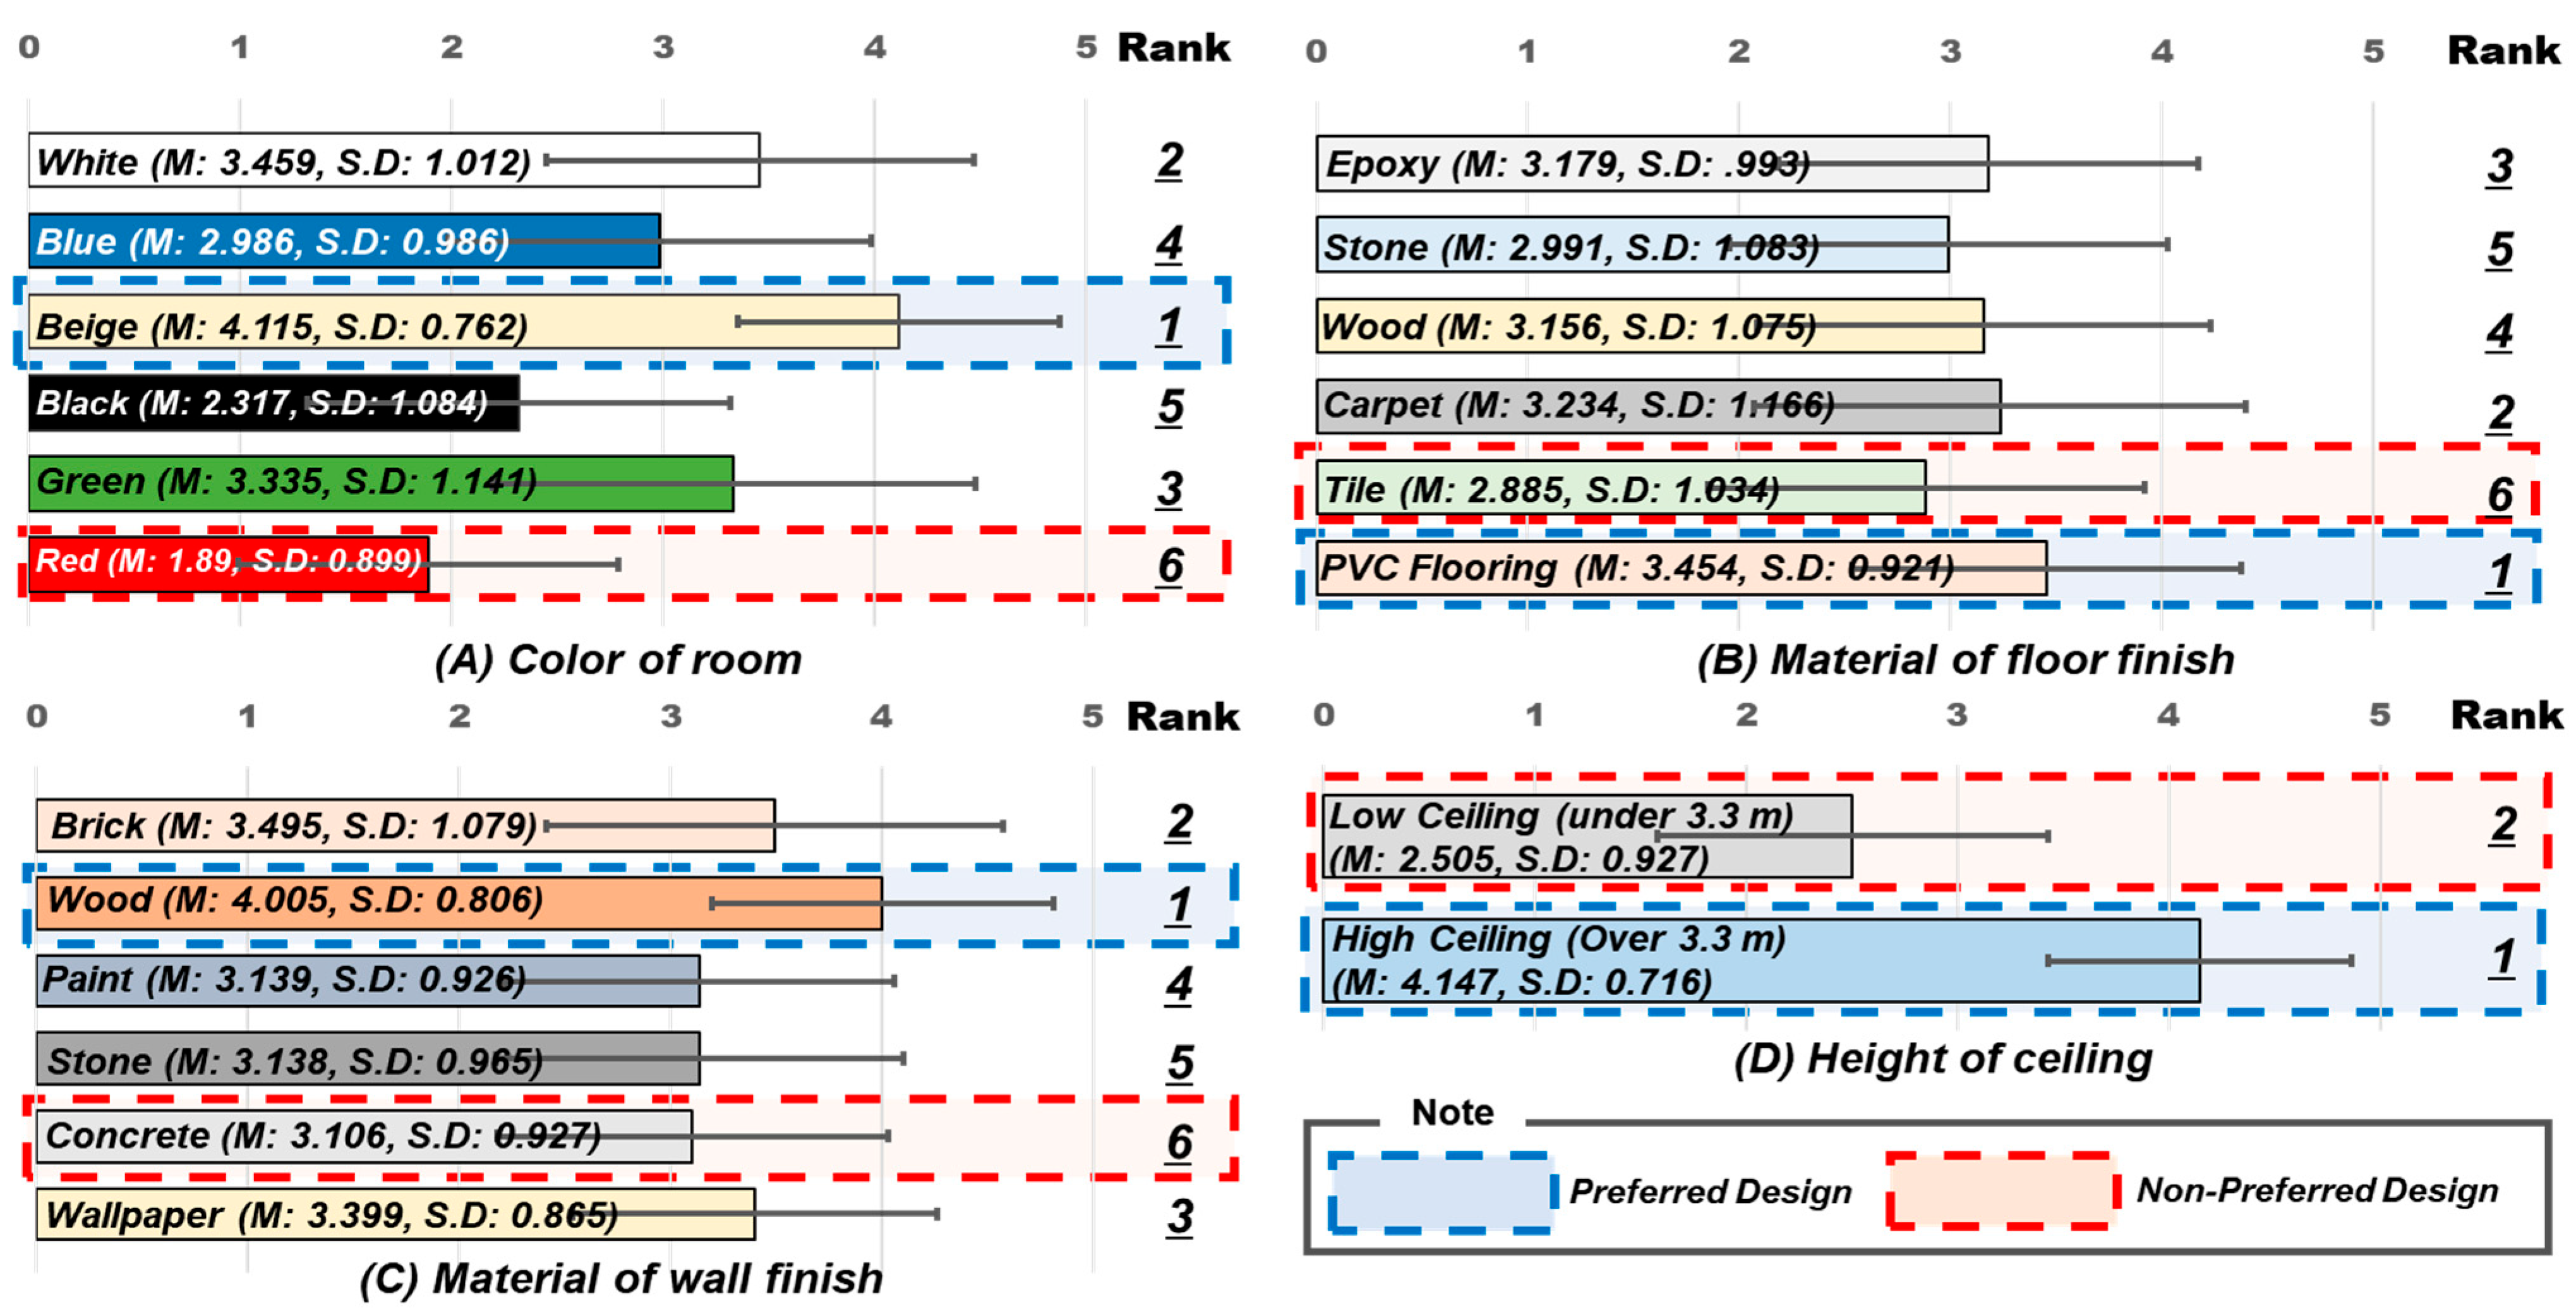
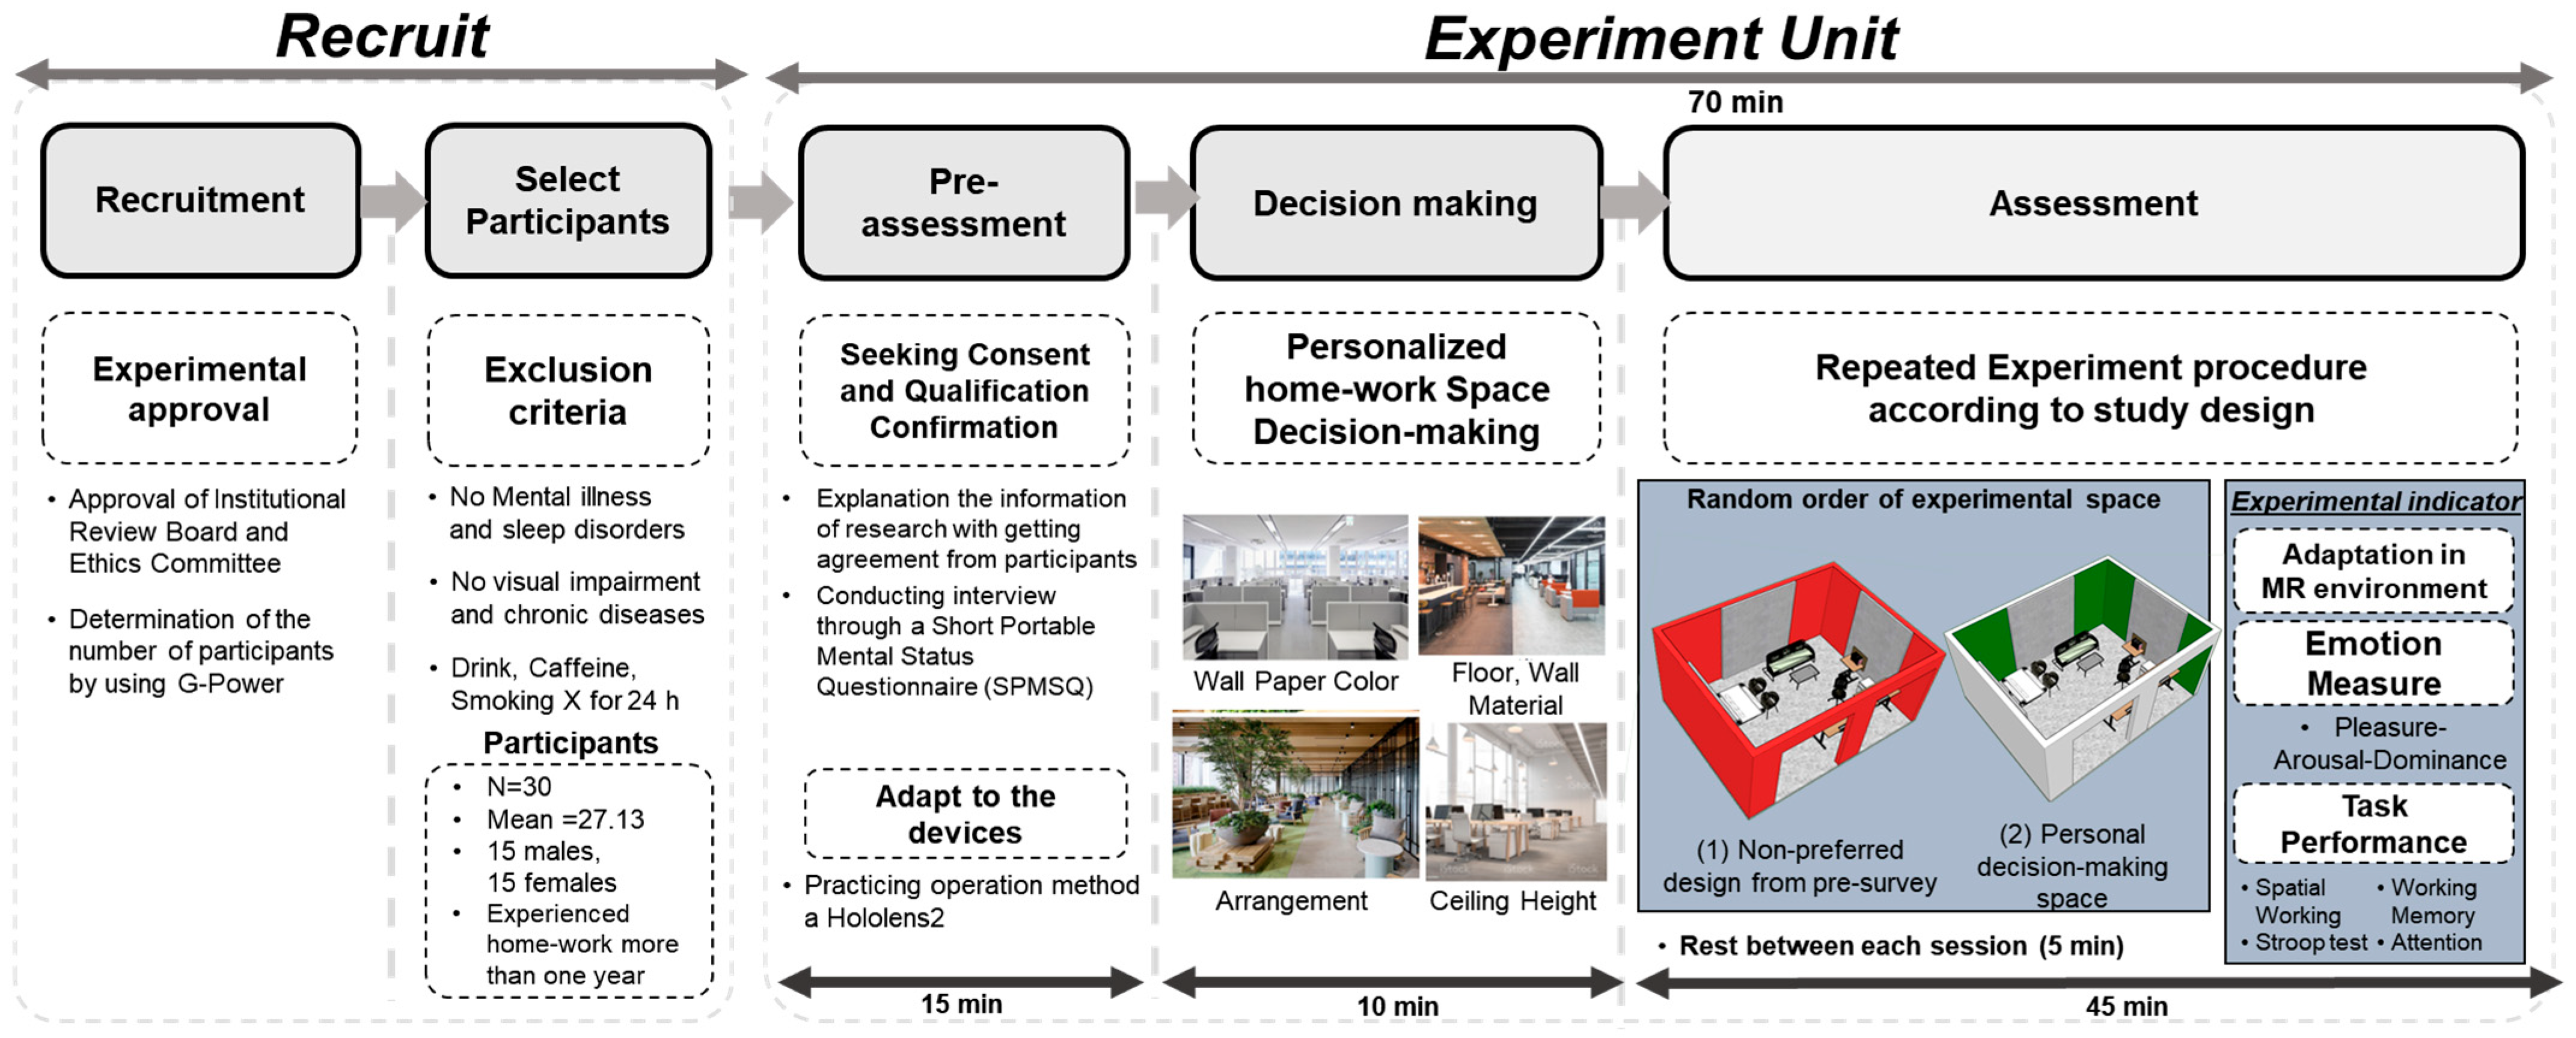
2.1. Design of Experiment
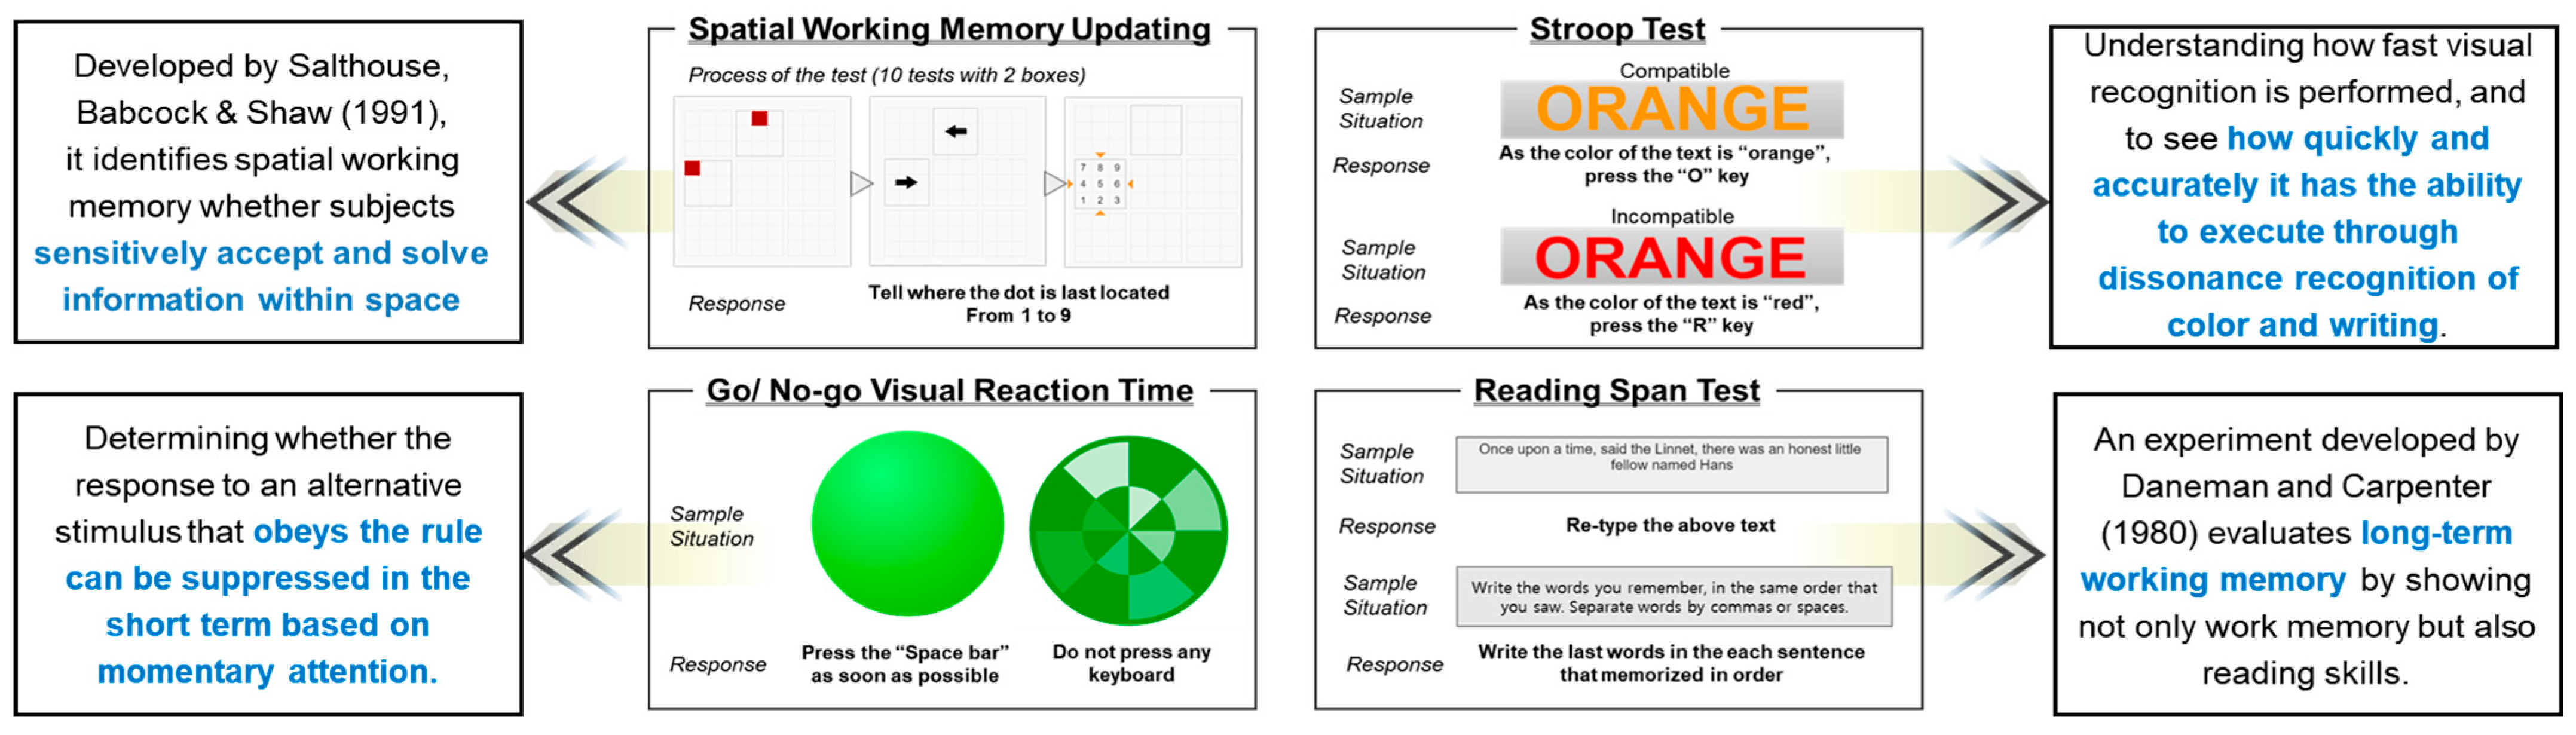
2.2. Data Collection
2.3. Data Analysis
3. Results
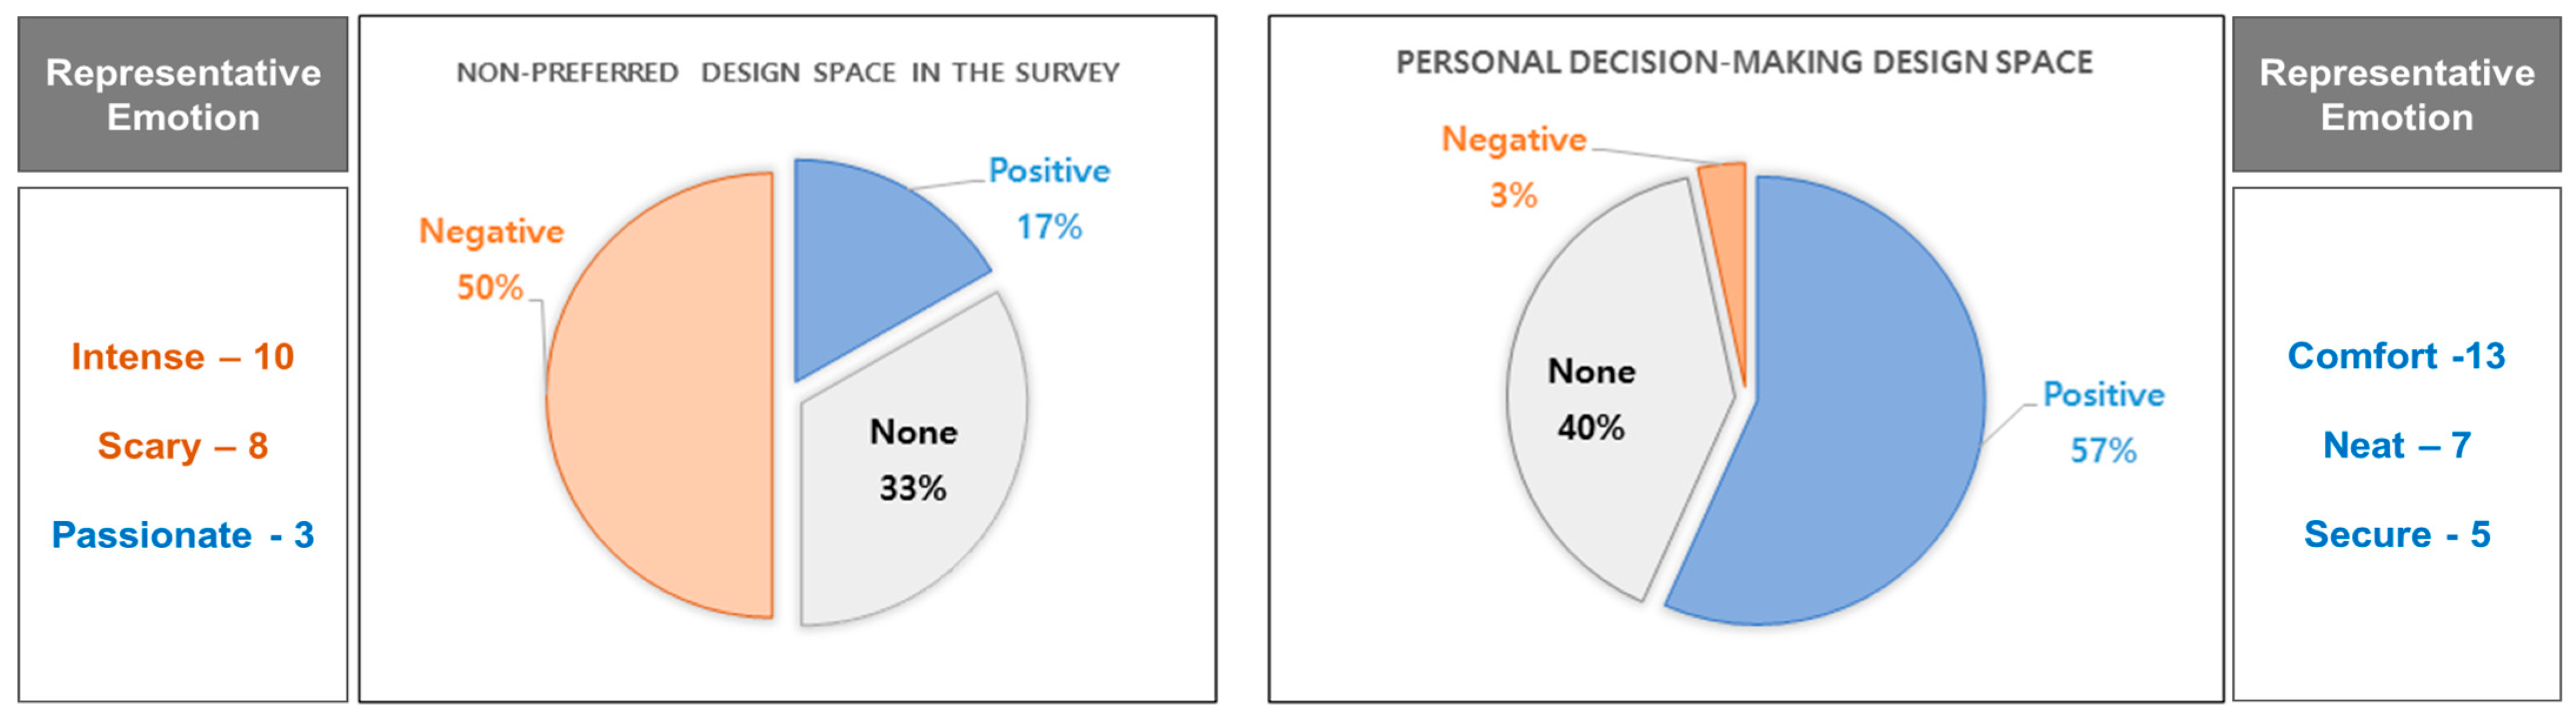
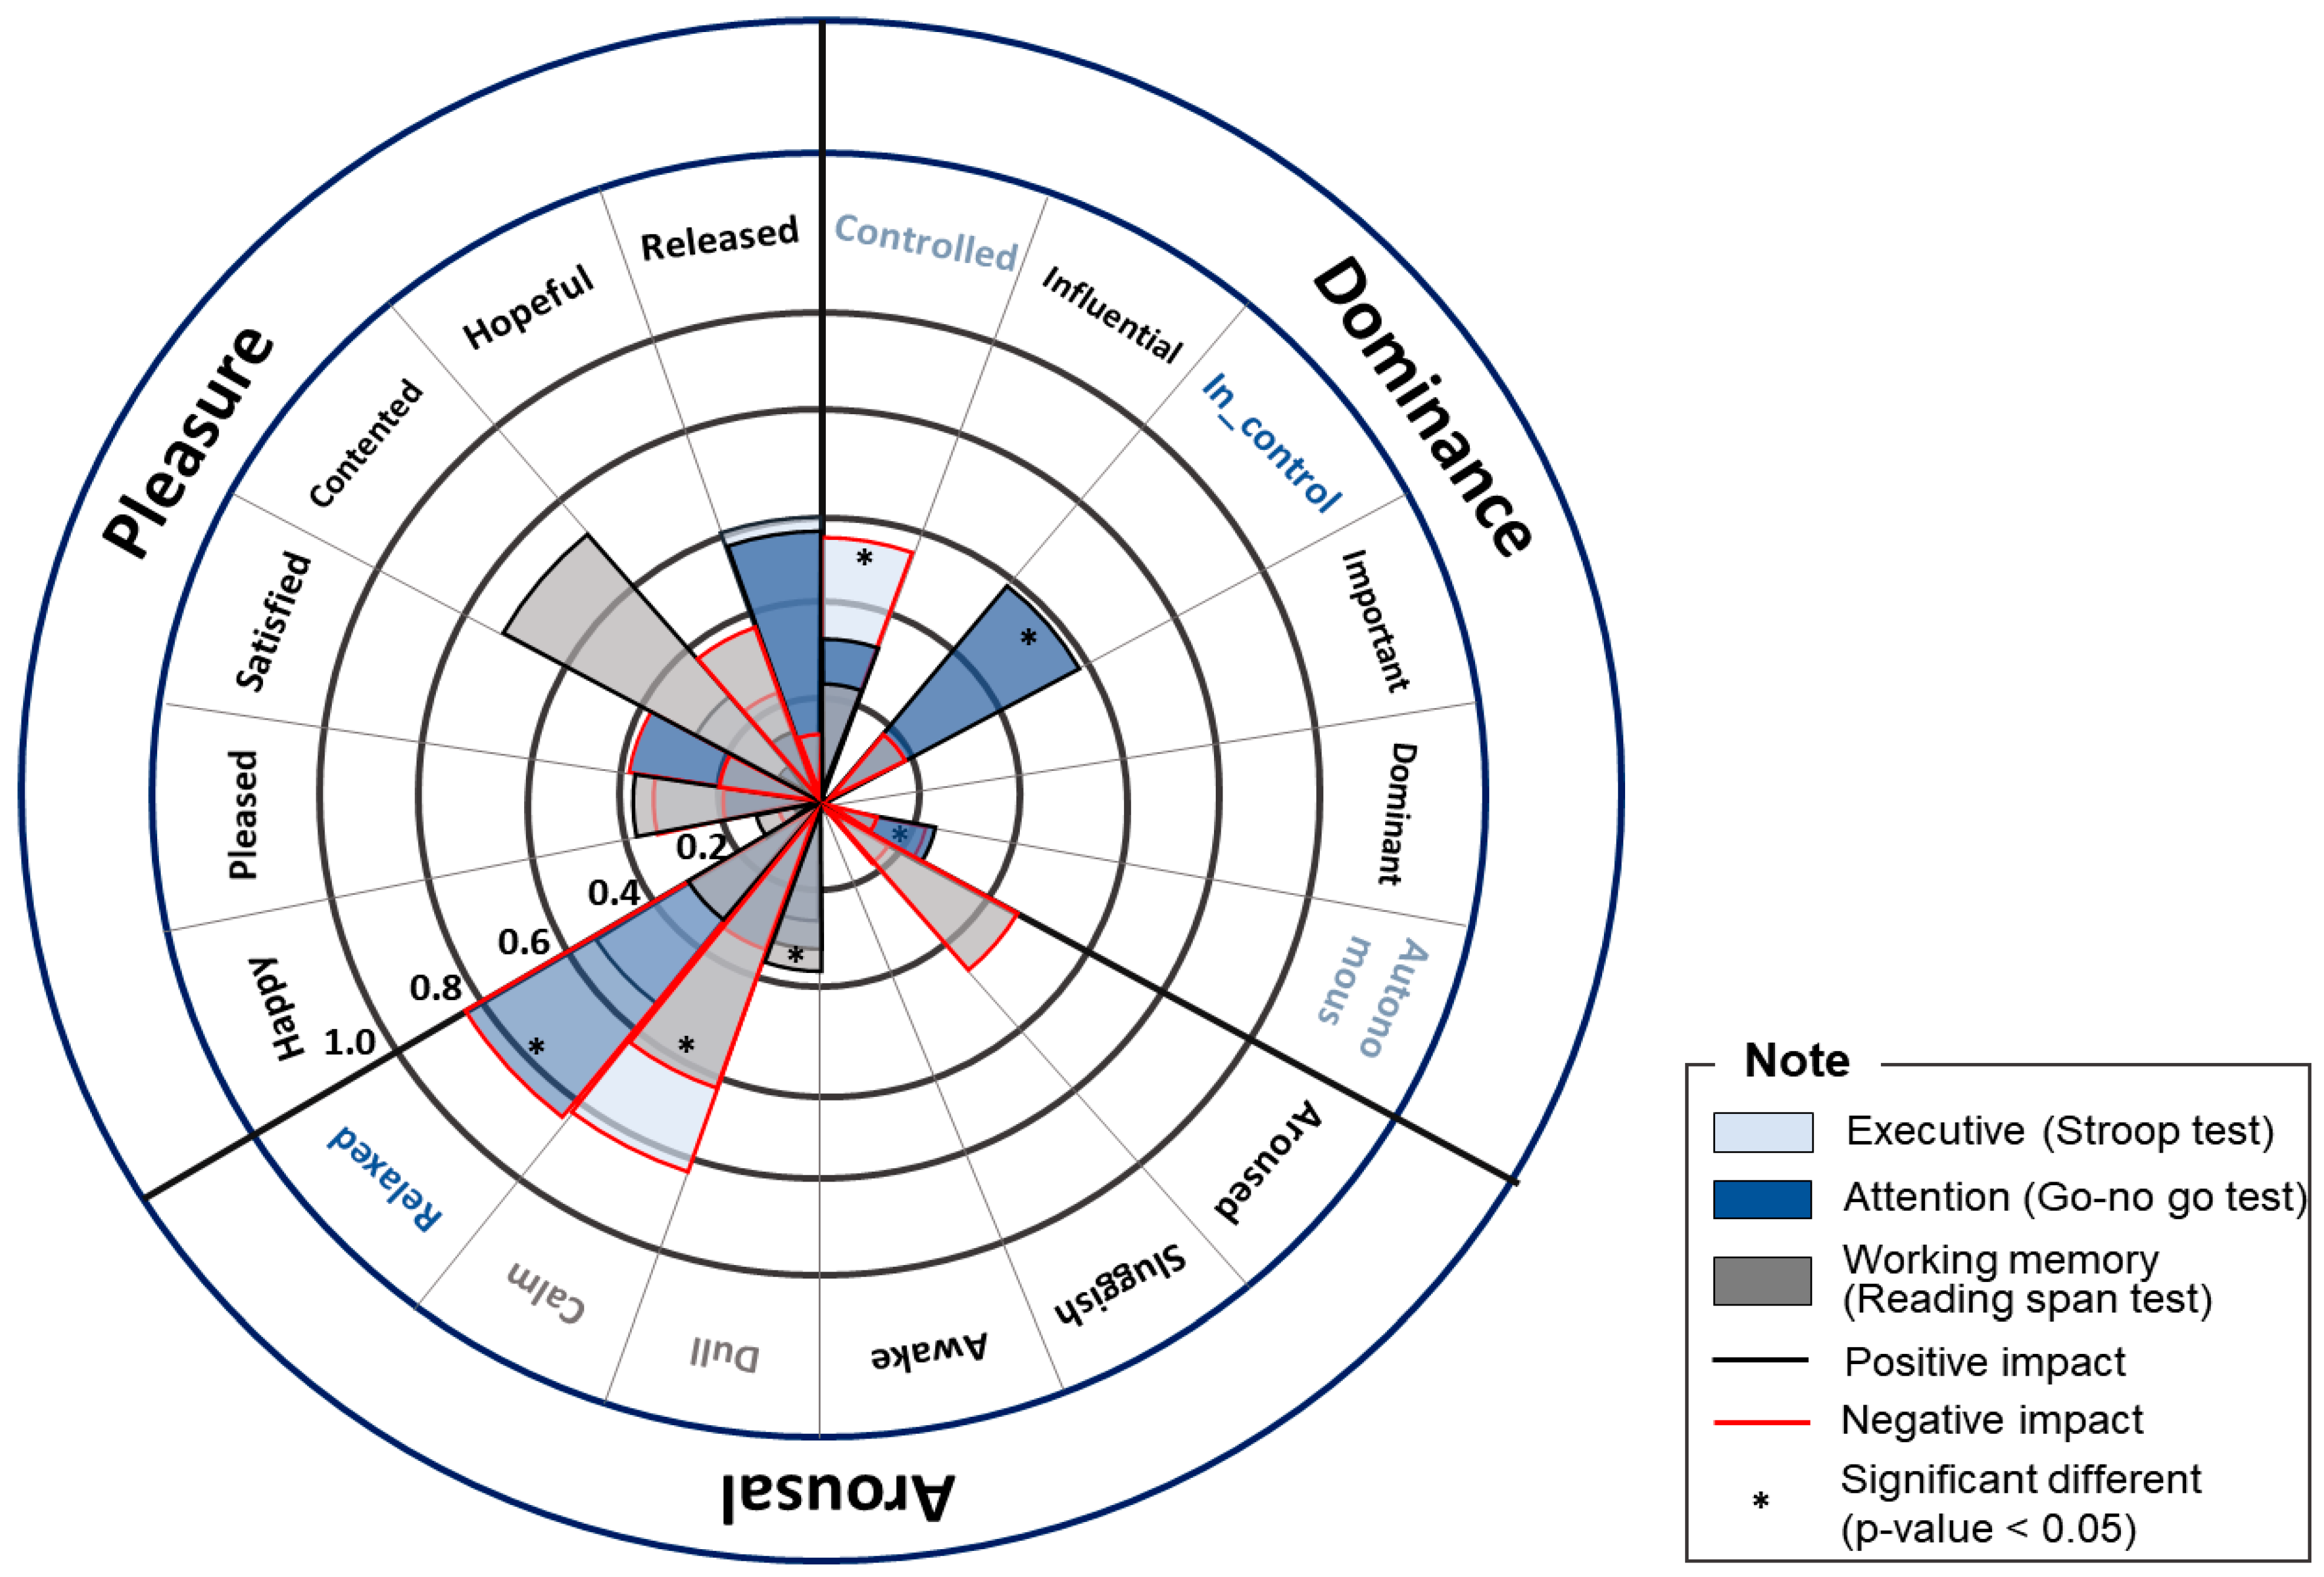
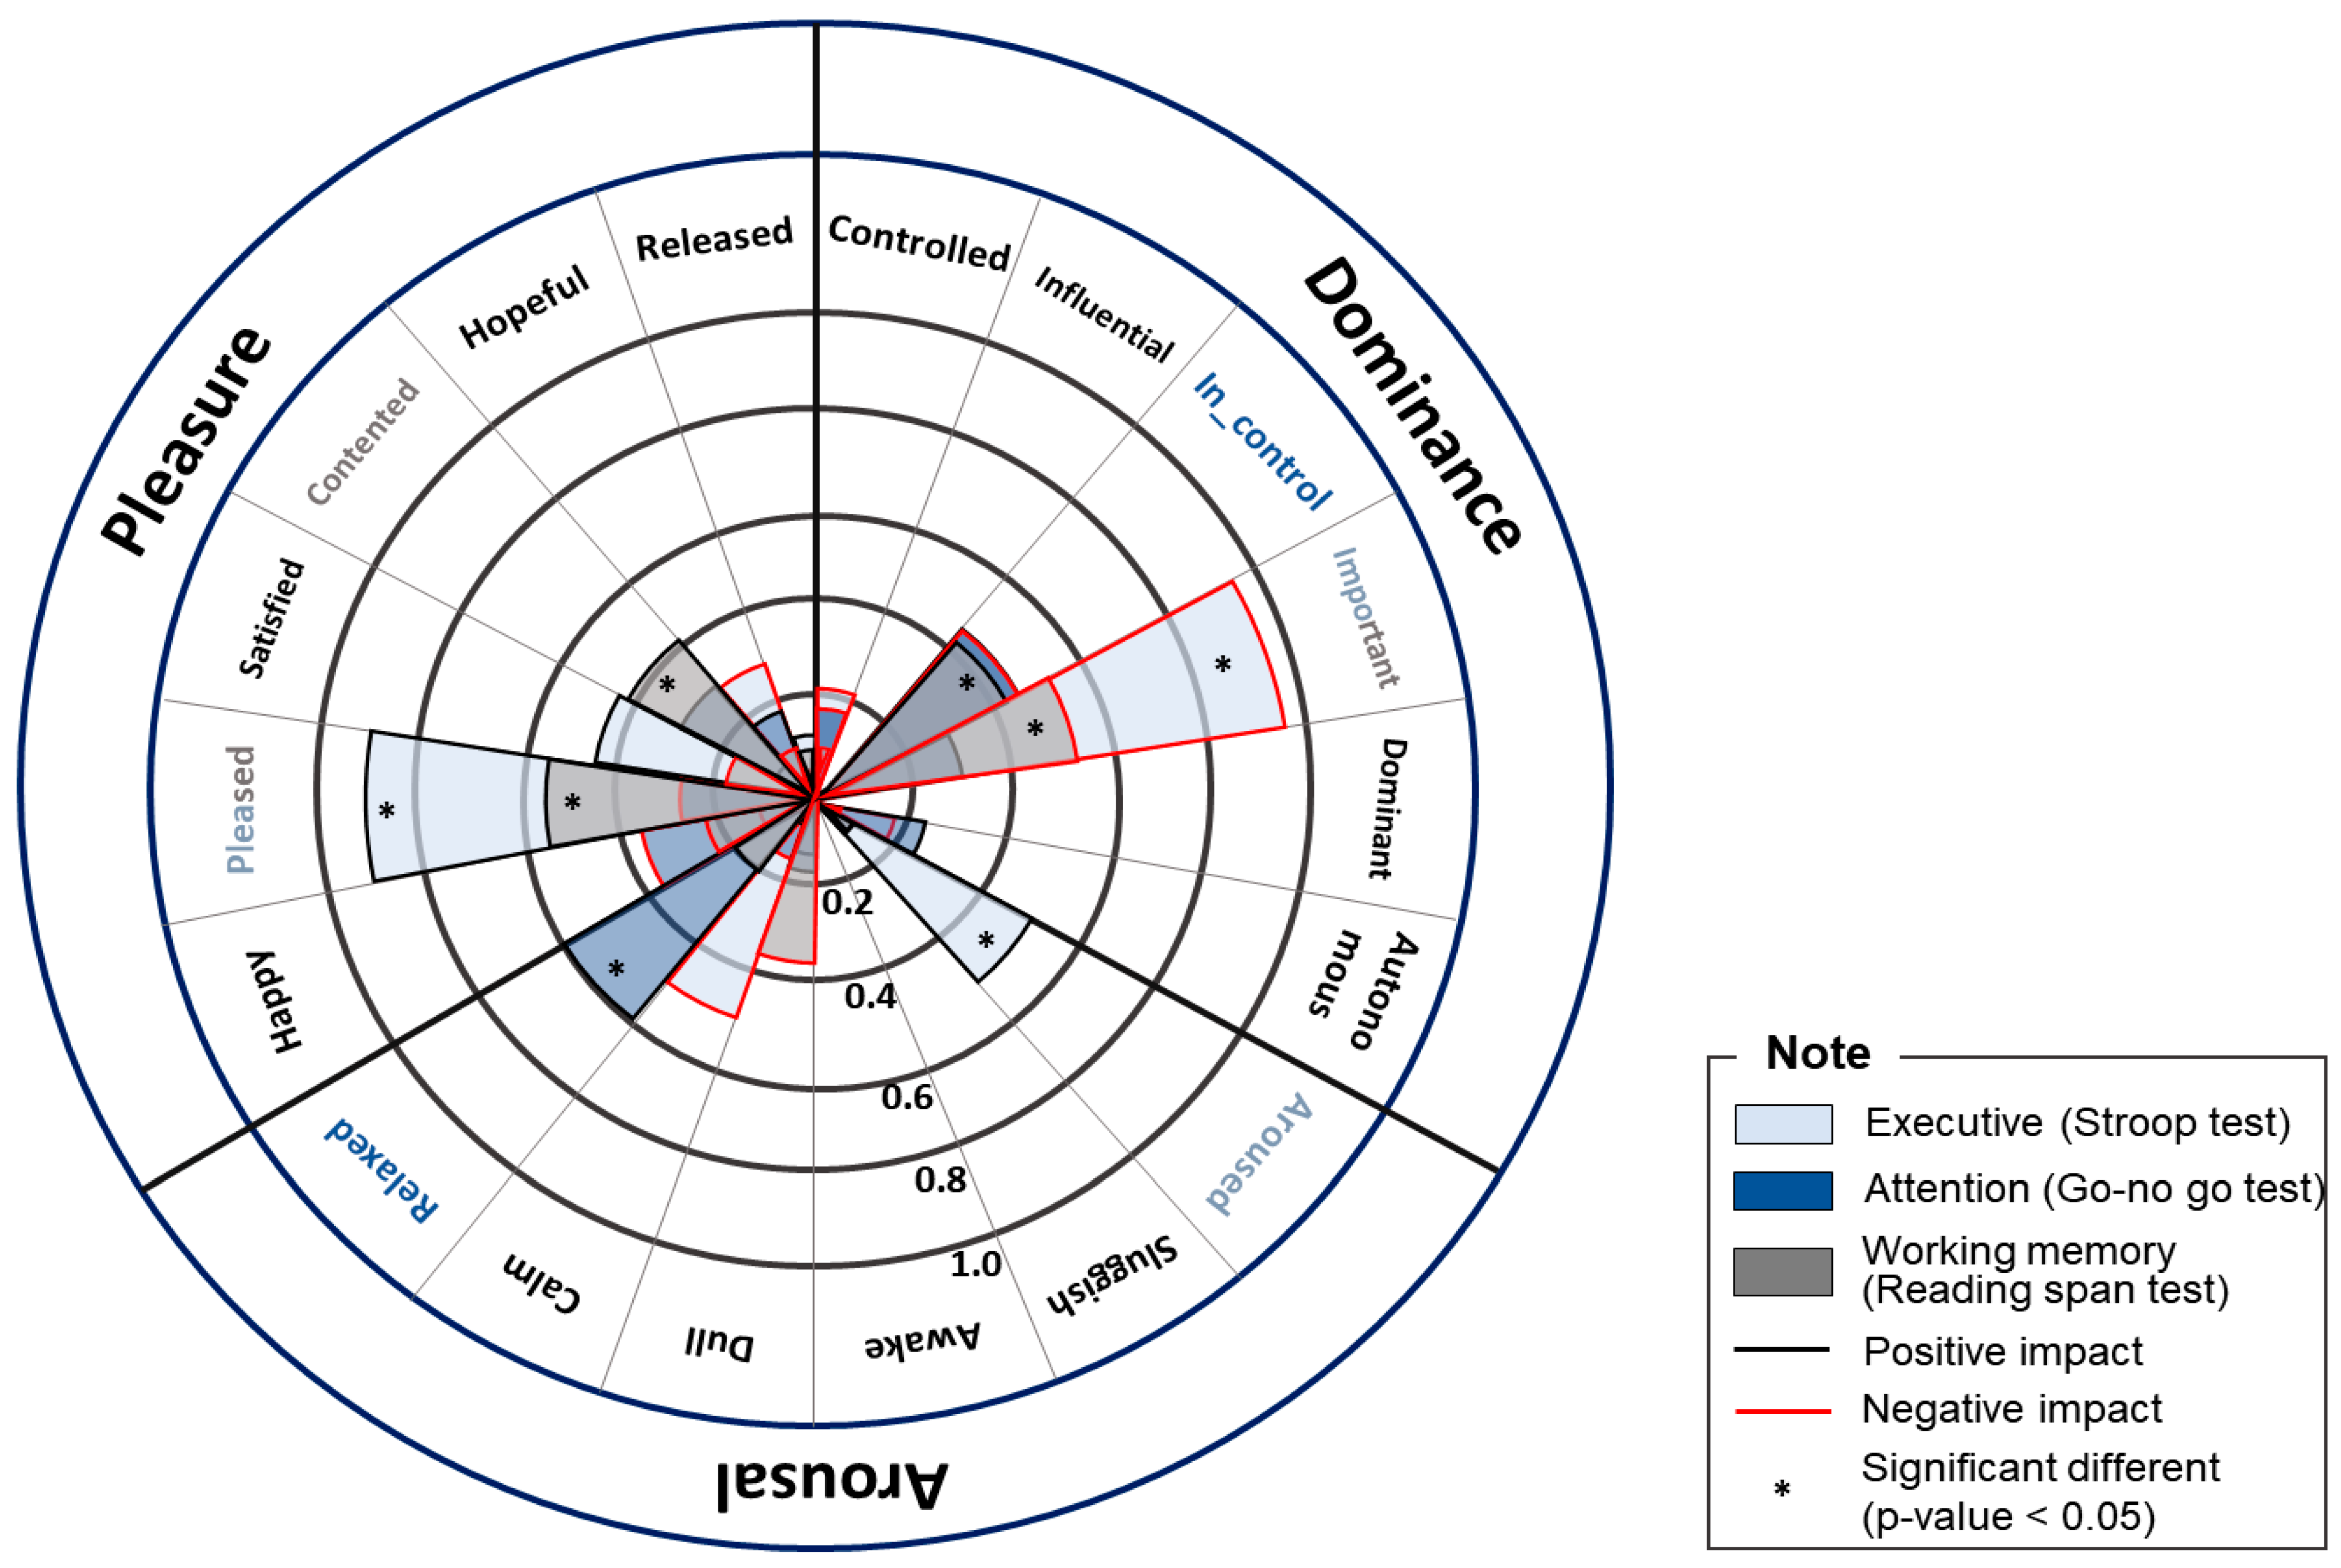
3.1. Analysis of Emotional Differences according to Indoor Space Design
3.2. Comparison of Task Efficiency according to Indoor Space Design
3.3. Identification the Impact of Emotion on Work Efficiency through Stepwise Regression Analysis
4. Discussion
5. Conclusions
Author Contributions
Funding
Institutional Review Board Statement
Data Availability Statement
Acknowledgments
Conflicts of Interest
Appendix A. Short Portable Mental Status Questionnaire (SPMSQ)
- What are the date, month, and year?
- What is the day of the week?
- What is the name of this place?
- What is your phone number?
- How old are you?
- When were you born?
- Who is the current president?
- Who was the president before him?
- What was your mother’s maiden name?
- Can you count backward from 20 by 3’s?
Appendix B. PAD Test to Identify the Emotion in Each Experimental Place
- <7-point Likert Scale—Options>
- 1—Strongly disagree, 2—Disagree, 3—Somewhat Disagree, 4—Neutral,
- 5—Somewhat agree, 6—Agree, 7—Strongly Agree
- <Pleasure>
- Do you feel happy in the experimental space?
- Do you feel pleasure in the experimental space?
- Do you feel satisfied in the experimental space?
- Do you feel contented in the experimental space?
- Do you feel hopeful in the experimental space?
- Do you feel surprised in the experimental space?
- <Arousal>
- Do you feel stimulated in the experimental space?
- Do you feel sluggish in the experimental space?
- Do you feel awake in the experimental space?
- Do you feel excited in the experimental space?
- Do you feel jittery in the experimental space?
- Do you feel aroused in the experimental space?
- <Dominance>
- Do you feel controlling in the experimental space?
- Do you feel crowded in the experimental space?
- Do you feel dominant in the experimental space?
- Do you feel influential in the experimental space?
- Do you feel important in the experimental space?
- Do you feel free in the experimental space?
References
- Shamaileh, A.A. Responding to COVID-19 pandemic: Interior designs’ trends of houses in Jordan. Int. J. Hum. Rights Health 2021, 15, 137–150. [Google Scholar] [CrossRef]
- Lee, K.T.; Im, J.B.; Park, S.J.; Kim, J.H. Conceptual Framework to Support Personalized Indoor Space Design Decision-Making: A Systematic Literature Review. Buildings 2022, 12, 716. [Google Scholar] [CrossRef]
- Candido, C.; Chakraborty, P.; Tjondronegoro, D. The Rise of Office Design in High-Performance, Open-Plan Environments. Buildings 2019, 9, 100. [Google Scholar] [CrossRef]
- Banaei, M.; Ahmadi, A.; Gramann, K.; Hatami, J. Emotional evaluation of architectural interior forms based on personality differences using virtual reality. Front. Archit. Res. 2020, 9, 138–147. [Google Scholar] [CrossRef]
- Cho, S.H.; Lee, K.T.; Kim, S.H.; Kim, J.H. Image processing for sustainable remodeling: Introduction to real-time quality inspection system of external wall insulation works. Sustainability 2019, 11, 1081. [Google Scholar] [CrossRef]
- Zhou, M. On the Interior Space Design of “With and Without”. In Applied Mechanics and Materials; Trans Tech Publications Ltd.: Stafa-Zurich, Switzerland, 2014; Volume 522, pp. 1731–1733. [Google Scholar]
- Yeom, S.; Kim, H.; Hong, T.; Park, H.S.; Lee, D.E. An integrated psychological score for occupants based on their perception and emotional response according to the windows’ outdoor view size. Build. Environ. 2020, 180, 107019. [Google Scholar] [CrossRef]
- Yan, R.; Masood, A.; Li, P.; Ali, S.G.; Sheng, B.; Ren, J. 3d simulation of interior house design in vr using vr3id method. In Proceedings of the 2018 IEEE International Conference on Progress in Informatics and Computing (PIC), Suzhou, China, 14–16 December 2018; IEEE: New York, NY, USA, 2018; pp. 236–240. [Google Scholar]
- Im, J.B.; Hwang, S.J.; Jang, J.H.; Kim, J.H.; Lee, K.T. Introduction of Mixed Reality on Special Tree Landscape Design Review Phase. J. Archit. Inst. Korea 2022, 38, 71–81. [Google Scholar]
- Han, M.; Baek, K.; Lee, K.T.; Ko, S.; Kim, J.H. A study on supporting design decision making in office building remodeling projects by introducing mixed reality. Korean J. Constr. Eng. Manag. 2021, 22, 3–12. [Google Scholar]
- Kalantari, S.; Rounds, J.D.; Kan, J.; Tripathi, V.; Cruz-Garza, J.G. Comparing physiological responses during cognitive tests in virtual environments vs. in identical real-world environments. Sci. Rep. 2021, 11, 10227. [Google Scholar] [CrossRef]
- Hong, J.Y.; Lam, B.; Ong, Z.-T.; Ooi, K.; Gan, W.-S.; Kang, J.; Yeong, S.; Lee, I.; Tan, S.-T. A mixed-reality approach to soundscape assessment of outdoor urban environments augmented with natural sounds. Build. Environ. 2021, 194, 107688. [Google Scholar] [CrossRef]
- Duyan, F.; Ünver, R. A research on the effect of classroom wall colours on student’s attention. A|Z ITU J. Fac. Archit. 2016, 13, 73–78. [Google Scholar] [CrossRef]
- Marchand, G.C.; Nardi, N.M.; Reynolds, D.; Pamoukov, S. The impact of the classroom built environment on student perceptions and learning. J. Environ. Psychol. 2014, 40, 187–197. [Google Scholar] [CrossRef]
- Cruz-Garza, J.G.; Darfler, M.; Rounds, J.D.; Gao, E.; Kalantari, S. EEG-based investigation of the impact of room size and window placement on cognitive performance. J. Build. Eng. 2022, 53, 104540. [Google Scholar] [CrossRef]
- Ko, Y.C.; Lo, C.H.; Chen, C.C. Influence of personality traits on consumer preferences: The case of office chair selection by attractiveness. Sustainability 2018, 10, 4183. [Google Scholar] [CrossRef]
- Celadyn, M.; Celadyn, W. Application of Advanced Building Techniques to Enhance the Environmental Performance of Interior Components. Buildings 2021, 11, 309. [Google Scholar] [CrossRef]
- Bai, L. Human-oriented design of color elements in the interior design. In Proceedings of the 2010 IEEE 11th International Conference on Computer-Aided Industrial Design & Conceptual Design 1, Yiwu, China, 17–19 November 2010; IEEE: New York, NY, USA, 2010; Volume 1, pp. 213–217. [Google Scholar]
- Balta, A.; Read, J.C. Colour preference in teenage boys’ bedrooms. In Proceedings of the 28th International BCS Human Computer Interaction Conference: Sand, Sea and Sky-Holiday HCI, Swindon, UK, 9–12 September 2014; HCI, BCS Learning and Development Ltd.: Swindon, UK, 2014. [Google Scholar]
- Augustin, S.J.; Apter, M.J. Designing for motivation and wellbeing: Reversal theory, doors, and colors. In Proceedings of the D and E 2016: 10th International Conference on Design and Emotion-Celebration and Contemplation, Amsterdam, The Netherlands, 27–30 September 2016; Universidad de Los Andes: Bogotá, Colombia, 2016. [Google Scholar]
- Xu, Y.; Guo, Y.; Jumani, A.K.; Khatib, S.F. Application of ecological ideas in indoor environmental art design based on hybrid conformal prediction algorithm framework. Environ. Impact Assess. Rev. 2020, 86, 106494. [Google Scholar] [CrossRef]
- Zhong, W.; Schröder, T.; Bekkering, J. Biophilic design in architecture and its contributions to health, well-being, and sustainability: A critical review. Front. Arch. Res. 2021, 11, 114–141. [Google Scholar] [CrossRef]
- Mehrabian, A.; Russell, J.A. An Approach to Environmental Psychology; MIT Press: Cambridge, MA, USA, 1974. [Google Scholar]
- Wolber, G.; Romaniuk, M.; Eastman, E.; Robinson, C. Validity of the Short Portable Mental Status Questionnaire with elderly psychiatric patients. J. Consult. Clin. Psychol. 1984, 52, 712. [Google Scholar] [CrossRef]
- Yeom, S.; Kim, H.; Hong, T.; Ji, C.; Lee, D.E. Emotional impact, task performance and task load of green walls exposure in a virtual environment. Indoor Air 2022, 32, e12936. [Google Scholar] [CrossRef]
- Kim, M.; Chung, K. The Effects of Hotel Restaurants’ Physical Environment on Customer’s Emotional Responses and Loyalty. Int. J. Tour. Hosp. Res. 2014, 28, 149–165. [Google Scholar]
- Seo, J.M.; Kim, H.W.; Yeo, J.Y.; Byun, E.H.; Chung, S. Executive function in attention-deficit/hyperactivity disorder: Relationship of comprehensive attention, stoop color-word, children’s color trails, and Wisconsin card sorting tests. J. Korean Neuropsychiatr. Assoc. 2012, 51, 59–69. [Google Scholar] [CrossRef]
- Salthouse, T.A.; Babcock, R.L.; Shaw, R.J. Effects of adult age on structural and operational capacities in working memory. Psychol. Aging 1991, 6, 118. [Google Scholar] [CrossRef] [PubMed]
- Daneman, M.; Carpenter, P.A. Individual differences in working memory and reading. J. Verbal Learn. Verbal Behav. 1980, 19, 450–466. [Google Scholar] [CrossRef]
- Medhat, W.; Hassan, A.; Korashy, H. Sentiment analysis algorithms and applications: A survey. Ain Shams Eng. J. 2014, 5, 1093–1113. [Google Scholar] [CrossRef]
- Park, S.-M.; Na, C.-W.; Choi, M.-S.; Lee, D.-H.; On, B.-W. KNU Korean Sentiment Lexicon: Bi-LSTM-based Method for Building a Korean Sentiment Lexicon. J. Intell. Inf. Syst. 2018, 24, 219–240. [Google Scholar] [CrossRef]
- Lee, K.T.; Ann, H.; Kim, J.W.; Kim, J.H. A Comparative Analysis of Risk Impacts on Cost Overrun between Actual Cases and Managers’ Perception on Overseas Construction Projects. Korean J. Constr. Eng. Manag. 2021, 22, 52–60. [Google Scholar]
- Lee, K.T.; Park, S.J.; Kim, J.H. Comparative analysis of managers’ perception in overseas construction project risks and cost overrun in actual cases: A perspective of the Republic of Korea. J. Asian Arch. Build. Eng. 2022, 22, 2291–2308. [Google Scholar] [CrossRef]
- Ko, S.J.; Lee, K.T.; Kim, K.H.; Kim, J.H. Prediction of Compensation Costs in Apartment Housing Defects Lawsuits using Regression Analysis. J. Archit. Inst. Korea 2021, 37, 197–204. [Google Scholar]
- Kim, H.J.; Hong, J.S.; Hwang, H.C.; Kim, S.M.; Han, D.H. Comparison of psychological status and investment style between bitcoin investors and share investors. Front. Psychol. 2020, 11, 3230. [Google Scholar] [CrossRef] [PubMed]
- Arnheim, R. The Power of the Center: A Study of Composition in the Visual Arts; University of California Press: Berkeley, CA, USA, 1982. [Google Scholar]
- Kim, G.-Y. A Study on Spatial Perceptions and Behaviors through the Perception Phenomenon of the User—The Relationship between Spatial Perception and User Behavior. Korean Inst. Inter. Des. J. 2013, 22, 143–151. [Google Scholar] [CrossRef]
- Bäumler, G. On the validity of the Yerkes-Dodson law. Stud. Psychol. 1994, 36, 205. [Google Scholar]
- Cho, S.; Lee, K.T.; Choi, Y.I.; Jung, S.J.; Park, S.J.; Bae, S.; Kim, J. Networking human biomarker and hazardous chemical elements from building materials: Systematic literature review and in vivo test. Build. Environ. 2021, 192, 107603. [Google Scholar] [CrossRef]


| Aspect, Dimension | Item | ||
|---|---|---|---|
| Pleasure–displeasure | Happy–unhappy | Pleasure–annoyed | Satisfied–unsatisfied |
| Contented–melancholic | Hopeful–despairing | Surprised–bored | |
| Arousal–non arousal | Stimulated–relaxed | Frenzied–sluggish | Awake–sleepy |
| Excited–calm | Jittery–dull | Aroused–unaroused | |
| Dominance–submissive | Controlling–controlled | Uncrowded–crowded | Dominant–submissive |
| Influential–influenced | Important–awed | Free–restricted | |
| Non-Preferred Design Space in the Survey | Personal Decision-Making Design Space | |
|---|---|---|
| Pleasure | 0.846 | 0.768 |
| Arousal | 0.650 | 0.643 |
| Dominance | 0.602 | 0.620 |
| Pleasure | ||||||||||||
| Happy | Pleased | Satisfied | Contented | Hopeful | Released | |||||||
| Experiment | 1 | 2 | 1 | 2 | 1 | 2 | 1 | 2 | 1 | 2 | 1 | 2 |
| Mean | 2.07 | 5.83 | 3.47 | 5.80 | 2.43 | 6.03 | 1.83 | 5.77 | 2.67 | 5.47 | 2.00 | 6.20 |
| Standard deviation | 0.868 | 0.95 | 1.613 | 0.925 | 1.104 | 0.890 | 0.874 | 0.971 | 1.398 | 1.306 | 0.871 | 0.847 |
| Average rank | 1.25 | 3.6 | 1.98 | 3.62 | 1.32 | 3.43 | 1.20 | 3.33 | 1.68 | 3.40 | 1.25 | 3.52 |
| p-value | 0.000 * | 0.000 * | 0.000 * | 0.000 * | 0.000 * | 0.000 * | ||||||
| Arousal | ||||||||||||
| Relaxed | Calm | Dull | Awake | Sluggish | Aroused | |||||||
| Experiment | 1 | 2 | 1 | 2 | 1 | 2 | 1 | 2 | 1 | 2 | 1 | 2 |
| Mean | 2.00 | 5.37 | 2.13 | 5.40 | 2.73 | 3.87 | 4.77 | 4.33 | 3.80 | 4.63 | 5.20 | 3.90 |
| Standard deviation | 0.910 | 1.377 | 1.196 | 1.221 | 1.388 | 1.737 | 1.478 | 1.398 | 1.730 | 1.671 | 1.424 | 1.447 |
| Average rank | 1.33 | 3.25 | 1.23 | 3.07 | 1.85 | 2.55 | 2.78 | 2.50 | 2.55 | 2.97 | 3.33 | 2.52 |
| p-value | 0.000 * | 0.000 * | 0.006 * | 0.193 | 0.170 | 0.001 * | ||||||
| Dominance | ||||||||||||
| Controlled | Influential | In Control | Important | Dominant | Autonomous | |||||||
| Experiment | 1 | 2 | 1 | 2 | 1 | 2 | 1 | 2 | 1 | 2 | 1 | 2 |
| Mean | 4.63 | 2.10 | 5.07 | 4.77 | 1.80 | 5.07 | 3.30 | 5.10 | 3.00 | 2.40 | 3.50 | 5.70 |
| Standard deviation | 1.629 | 0.923 | 1.081 | 1.501 | 0.805 | 1.617 | 1.368 | 1.094 | 1.742 | 1.354 | 1.480 | 0.837 |
| Average rank | 3.33 | 1.68 | 2.85 | 2.80 | 1.37 | 3.45 | 2.03 | 3.48 | 2.50 | 2.13 | 1.62 | 3.18 |
| p-value | 0.000 * | 0.100 | 0.000 * | 0.000 * | 0.195 | 0.000 * | ||||||
| Working Type | Average | Standard Deviation | t | p | ||
|---|---|---|---|---|---|---|
| Non-Preferred | Decision-Making | Non-Preferred | Decision-Making | |||
| Spatial working memory | 3.186 | 2.949 | 1.729 | 1.506 | 1.547 | 0.102 |
| Executive ability | 14.790 | 14.275 | 4.088 | 4.044 | 27.966 | 0.000 ** |
| Attention | 14.762 | 14.530 | 1.707 | 1.765 | 4.602 | 0.000 ** |
| Working memory | 0.916 | 1.301 | 0.660 | 0.492 | 2.815 | 0.042 * |
| Non-Preferred Space | Decision-Making Space | |||||
|---|---|---|---|---|---|---|
| Executive | Attention | Working Memory | Executive | Attention | Working Memory | |
| Executive | 1 | 1 | ||||
| Attention | 0.038 | 1 | 0.250 | 1 | ||
| Working Memory | 0.150 | 0.060 | 1 | 0.268 | 0.166 | 1 |
| Model | Unstandardized Coefficient | Standardized Coefficients | t | Significance | Collinearity Statistics | |||
|---|---|---|---|---|---|---|---|---|
| B | Std. Error | Beta | Tolerance | VIF | ||||
| Executive | Model Summary: R2 = 0.587, F = 7.095, significance of model = 0.003, Durbin-Watson = 1.845 | |||||||
| (Constant) | 50.931 | 6.920 | 7.360 | 0.000 | ||||
| Autonomous | −2.824 | 1.096 | −0.411 | −2.576 | 0.016 | 0.955 | 1.047 | |
| Controlled | 2.094 | 0.979 | 0.341 | 2.140 | 0.042 | 0.955 | 1.047 | |
| Attention | Model Summary: R2 = 0.333, F = 6.736, Significance of model = 0.004, Durbin-Watson = 1.755 | |||||||
| (Constant) | 55.017 | 4.078 | 13.491 | 0.000 | ||||
| Relaxed | −8.957 | 2.440 | −0.815 | −3.670 | 0.001 | 0.501 | 1.995 | |
| In control | 7.165 | 2.757 | 0.577 | 2.599 | 0.015 | 0.501 | 1.995 | |
| Working memory | Model Summary: R2 = 0.676, F = 11.389, Model Significance = 0.000, Durbin-Watson = 2.179 | |||||||
| (Constant) | 41.496 | 3.528 | 11.763 | 0.000 | ||||
| Dull | 5.190 | 1.092 | 0.720 | 4.752 | 0.000 | 0.874 | 1.144 | |
| Calm | −2.664 | 1.268 | −0.318 | −2.101 | 0.045 | 0.874 | 1.144 | |
| Model | Unstandardized Coefficient | Standardized Coefficients | t | Significance | Collinearity Statistics | |||
|---|---|---|---|---|---|---|---|---|
| B | Std. Error | Beta | Tolerance | VIF | ||||
| Executive | Model Summary: R2 = 0.564, F = 7.658, significance of model = 0.027, Durbin-Watson = 2.057 | |||||||
| (Constant) | 36.477 | 11.064 | 3.297 | 0.003 | ||||
| Pleased | 6.702 | 2.228 | 0.620 | 3.008 | 0.006 | 0.636 | 1.572 | |
| Aroused | 0.888 | 1.176 | 0.129 | 0.756 | 0.047 | 0.934 | 1.071 | |
| Important | −5.650 | 1.936 | −0.618 | −2.918 | 0.007 | 0.602 | 1.660 | |
| Attention | Model Summary: R2= 0.435, F= 9.709, significance of model = 0.009, Durbin-Watson = 1.909 | |||||||
| (Constant) | 39.700 | 7.324 | 5.421 | 0.000 | ||||
| relaxed | 3.586 | 1.592 | 0.494 | 2.252 | 0.033 | 0.649 | 1.541 | |
| In_control | −1.766 | 1.355 | −0.286 | −1.303 | 0.044 | 0.649 | 1.541 | |
| Working memory | Model Summary: R2 = 0.578, F = 8.039, significance of model= 0.019, Durbin-Watson = 2.336 | |||||||
| (Constant) | 21.137 | 13.121 | 1.611 | 0.119 | ||||
| Pleased | 4.366 | 2.251 | 0.404 | 1.940 | 0.043 | 0.636 | 1.573 | |
| Contented | 4.123 | 1.770 | 0.401 | 2.329 | 0.018 | 0.931 | 1.074 | |
| Important | −3.968 | 1.919 | −0.434 | −2.068 | 0.039 | 0.625 | 1.601 | |
Disclaimer/Publisher’s Note: The statements, opinions and data contained in all publications are solely those of the individual author(s) and contributor(s) and not of MDPI and/or the editor(s). MDPI and/or the editor(s) disclaim responsibility for any injury to people or property resulting from any ideas, methods, instructions or products referred to in the content. |
© 2023 by the authors. Licensee MDPI, Basel, Switzerland. This article is an open access article distributed under the terms and conditions of the Creative Commons Attribution (CC BY) license (https://creativecommons.org/licenses/by/4.0/).
Share and Cite
Lee, K.-T.; Park, C.-H.; Kim, J.-H. Examination of User Emotions and Task Performance in Indoor Space Design Using Mixed-Reality. Buildings 2023, 13, 1483. https://doi.org/10.3390/buildings13061483
Lee K-T, Park C-H, Kim J-H. Examination of User Emotions and Task Performance in Indoor Space Design Using Mixed-Reality. Buildings. 2023; 13(6):1483. https://doi.org/10.3390/buildings13061483
Chicago/Turabian StyleLee, Kyung-Tae, Chang-Han Park, and Ju-Hyung Kim. 2023. "Examination of User Emotions and Task Performance in Indoor Space Design Using Mixed-Reality" Buildings 13, no. 6: 1483. https://doi.org/10.3390/buildings13061483