Article

The Necessity for Multi-Spectral Simulations of the Indoor Non-Visual Luminous Environment: A Simplified Annual Approach

Faculty of Civil and Geodetic Engineering, University of Ljubljana, Jamova cesta 2, 1000 Ljubljana, Slovenia
*
Author to whom correspondence should be addressed.
Buildings 2023, 13(5), 1357; https://doi.org/10.3390/buildings13051357
Submission received: 4 May 2023 / Revised: 12 May 2023 / Accepted: 15 May 2023 / Published: 22 May 2023
(This article belongs to the Section Building Energy, Physics, Environment, and Systems)

Abstract

:
The difference between the functioning of the human non-visual and photopic systems has elicited the need for complex in situ measurements or time-consuming multi-spectral simulations to accurately predict the non-visual luminous content of the indoor environment. As such methodologies are time-consuming, the aim of the present study was to determine whether such complex methodologies are needed. The issue was studied through simulations of four cardinally oriented identical offices located in Ljubljana, Slovenia. Each was studied using orange, grey and blue walls. Diurnal luminous conditions were studied under clear, hazy and overcast skies on December, March and June 21st. The non-visual content was evaluated using novel metrics, the Autonomy of Circadian Potential and Circadian Autonomy, which assess temporal circadian luminous content. Diurnal results were used to construct climate-based spectral months to evaluate the monthly non-visual potential of the studied offices. Furthermore, simulations addressed the question of whether the requirements of the non-visual system might contradict the visual comfort of indoor environments. The results show that compliance with non-visual requirements for indoor spaces with spectrally neutral surfaces or those in shades of blue could be assessed using photopic methodologies. However, this is not true for spaces characterised by orange and red materials.

1. Introduction

A better understanding of the light-induced mechanisms that control the human circadian clock has increased the importance of light, especially daylight, in built environments. Several studies have shown that people in contemporary industrialised societies spend a considerable portion of a typical day indoors [1,2,3]. Therefore, they primarily depend on the quantity and quality of light as influenced by the properties of the building envelope, which is the primary regulator for indoor comfort [4]. Such living or working environments are usually evaluated and designed considering photopic/visual requirements [5,6], targeting optimal visual comfort and allowing sufficiently luminous environments to perform specific tasks. However, it is now known that the mechanisms of the non-visual system are primarily regulated by the signal from the melanopsin-containing intrinsically photosensitive Retinal Ganglion Cells (ipRGC) [7,8]. The signal is then sent to the Suprachiasmatic Nucleus (SCN), where human bodily rhythms are regulated. Due to the spectral sensitivity of the photopigment melanopsin, the non-visual pathway responds most to light richer in the blue part of the visible spectrum (~490 nm) [9,10]. In addition, the response of the non-visual system is strongly time-dependent, as it is entrained to the Earth’s natural cycle. In practice, high light exposure is required in the morning and midday to heighten alertness and regularly synchronise the daily human cycle, which averages 24.2 h [11]. The human cycle is longer than the Earth’s 24 h astronomical cycle, which means that regular synchronisation with the Earth’s clock is necessary. Consequentially, exposure to high light intensity in the morning [12] promotes the circadian clock. On the other hand, exposure in the evening delays the circadian clock and is to be avoided [13]. Furthermore, the effect of light on the circadian system is also strongly dependent on the duration of exposure and history of prior light dosage [14]. In prolonged desynchronisation with the astronomical day/night cycle, one is exposed to various psychological (e.g., delayed sleep phase disorder, depression, etc.) [15] and physiological risks (e.g., various types of cancer) [15,16]. Such extremes of physiological states can be found in shift workers. Therefore, shift work was stated as potentially carcinogenic by the International Agency for Research on Cancer (IARC) [17]. On the other hand, SADs—Seasonal Affective Disorders [18,19,20]—are a common psychological consequence of the scarcity of luminous environmental cues in winter.

1.1. Quantifying the Non-Visual Aspects of Light in the Built Environment

The specific functioning of the non-visual pathway and its discrepancy with the visual system requires a principle for quantifying the light from a non-visual standpoint. Many methods have been presented in the literature [21,22,23,24]. However, Equivalent Melanopic Irradiance or Illuminance and Circadian Stimuli or Circadian Light are the most used in the literature. The first was introduced by Lucas et al. [23] and it was later also adopted in the standard CIE S 026 [21]. Equivalent Melanopic Illuminance [23] and Irradiance evaluate the signal of each photoreceptor individually. On the other hand, the Circadian Light (CLA) and Circadian Stimulus (CS) methodologies proposed by Rea et al. [25,26] express the common signal of all photoreceptors involved in circadian cognition. Additionally, a large body of research has identified that the threshold of 0.3 CS or 275 CLA is beneficial for the non-visual or circadian system [27,28,29]. However, a metric which would involve the duration of effective circadian exposure, or perhaps even more critically the exact dosage (i.e., the time needed) for adequate circadian exposure, has yet to be precisely determined [30].
As described above, the complexity of the non-visual response requires a plethora of input data to properly evaluate circadian-weighted units. Thus, in the studied literature, a large body of research focusing on the effects of artificial lighting can be found [30,31,32,33,34]. This is inherently easier to evaluate than daylight, which is dynamic and constantly changing. In this respect, the study by Diakite-Kortlever and Knoop [35] pointed out that using standard illuminants, such as D65, is not universally appropriate to forecast daylight spectral properties. The issue is exacerbated particularly under clear sky conditions, which can be underestimated by almost 3500 K, as the highest CCT in the northern sky can reach up to 10,000 K. Therefore, more complex methods are required to perform studies for circadian daylighting design. Early attempts by Andersen et al. [36] and Mardaljevic et al. [13] to use generalised sky spectral properties for the simulations of circadian luminous evaluations date back to 2013. They implemented DAYSIM [37] for non-spectral circadian simulations. Such simulation attempts utilised only spectrally neutral surfaces (i.e., no colours). At the same time, the illumination source was calculated as the total radiation received, and then the standard CIE sky illuminants were applied over the entire simulated hemisphere. A similar approach was adopted by Acosta et al. [27] and Konis [38]. The first software capable of multi-spectral simulations was Lark, developed by Inanici et al. [39]. Lark uses parallel three-channel Radiance [40] simulations to calculate a nine-channel spectrum analysis of the received daylight. Later, in 2019, ALFA [41] simulation software was released, capable of performing 81-channel simulations and accurately reproducing spectral sky conditions using the libRadTran library of radiative transfer [42]. ALFA and Lark have proven accurate enough to be used in research for artificial lighting [43] and daylight conditions [44]. While Lark has been more accurate under overcast sky conditions [44], ALFA has been more applicable in clear sky conditions [45]. However, a recent study conducted by Inanici et al. [46] evaluated spectral sky models available in lighting simulation software (i.e., Lark, Radiance-implemented Coloured-Perez sky and ALFA) versus natural skies recorded using high dynamic range photography. The results demonstrated high variability between different sky models and between modelled and measured results. The authors conclude that the differences between studied sky models originate from different sky spectrum characterisation methods. In the end, they emphasised that we need to move towards a consensus regarding appropriate methodologies for spectral sky variability, as such models are becoming increasingly more important in lighting simulations.

1.2. Study Motivation

Even though the existing simulation tools have proven to be accurate, in reality they are capable only of point-in-time simulations, which means that we are still not able to perform annual evaluations efficiently. This issue was also stressed by Bellia and Fragliasso [30] in their thorough literature review on the role of architecture in determining the non-visual effects of light. They highlighted the problem of spectral-data-based simulation tools that require a lot of computational effort to evaluate non-visual content. Consequentially, there is a lack of methods to compute non-visual content in built environments, which would benefit researchers and designers who want to incorporate such simulations into health-driven indoor design. Thus, attempts have been made to mitigate this issue through simplified approaches. For example, Maskarenj et al. [47] employed a method for predicting yearly based circadian data that uses weather files and considers only direct sky luminance as observed by a hypothetical observer, while neglecting inter-reflected rays due to material properties of the built environments. On the other hand, Truong et al. [48] proposed a simplified model intended for artificial lighting practitioners. Using an experimental setup, they devised a model for CS prediction using only the z chromaticity coordinate and the measured vertical illuminance (Ev). The devised approach was tested on LEDs and up to 10,000 lx of Ev. Later, the method was also proven to be applicable in real-life situations with a mix of artificial and natural light using an imaging photometer [49]. Another simplified model based on the colour rendering index (CRI), correlated colour temperature (CCT) and illuminance was successfully applied for the calculation of circadian content for white light sources by Truong et al. [50].
Findings of an experimental study conducted by Potočnik and Košir [51] suggest that the circadian luminous environment of a room with spectrally neutral- (e.g., grey) and blue-coloured walls combined with spectrally neutral glazing can be evaluated using the established photopic methodologies under midday clear sky conditions. If this is also true for prolonged periods of the day and different sky conditions, the approach will represent a substantial simplification for evaluating the indoor circadian environment sufficiency. Furthermore, the latest study by Potočnik and Košir [52], where Useful Daylight Illuminance (UDI) and CS requirements were paralleled to each other in a north-oriented office, suggests no significant trade-offs between circadian and photopic requirements. The only exceptions were the areas near windows, which implies that the relation between circadian and photopic requirements, or specifically the relation between Daylight Glare Probability and circadian effective environment, should be examined for other orientations, especially in situations where direct sunlight is present. High illuminance is beneficial for circadian content, but it may also increase the risk of increased glare. The mentioned problem was addressed by an experimental study of real-life south-oriented offices [53] conducted by Potočnik and Košir. Under clear sky conditions, circadian requirements were found to hinder the photopic luminous aspects (e.g., visual comfort) of the workplace in the aforementioned south-oriented office.

1.3. Study Objectives

Based on the above-presented literature survey and extending on the findings in our previous work [51,52,53], the present study aims to answer two fundamental scientific questions related to circadian and photopic daylit indoor environments:
  • Given the known effects of daylight spectral properties on humans, is it still necessary to evaluate the indoor built environment non-visual luminous content using complex multi-spectral methodologies or are the established photopic methods sufficient for an adequate evaluation?
  • Considering the inherent differences in the functioning of the photopic and circadian systems, to what extent are the circadian potential of light and the photopic requirements (visual comfort) of the indoor environment contradictive considering the window orientation?
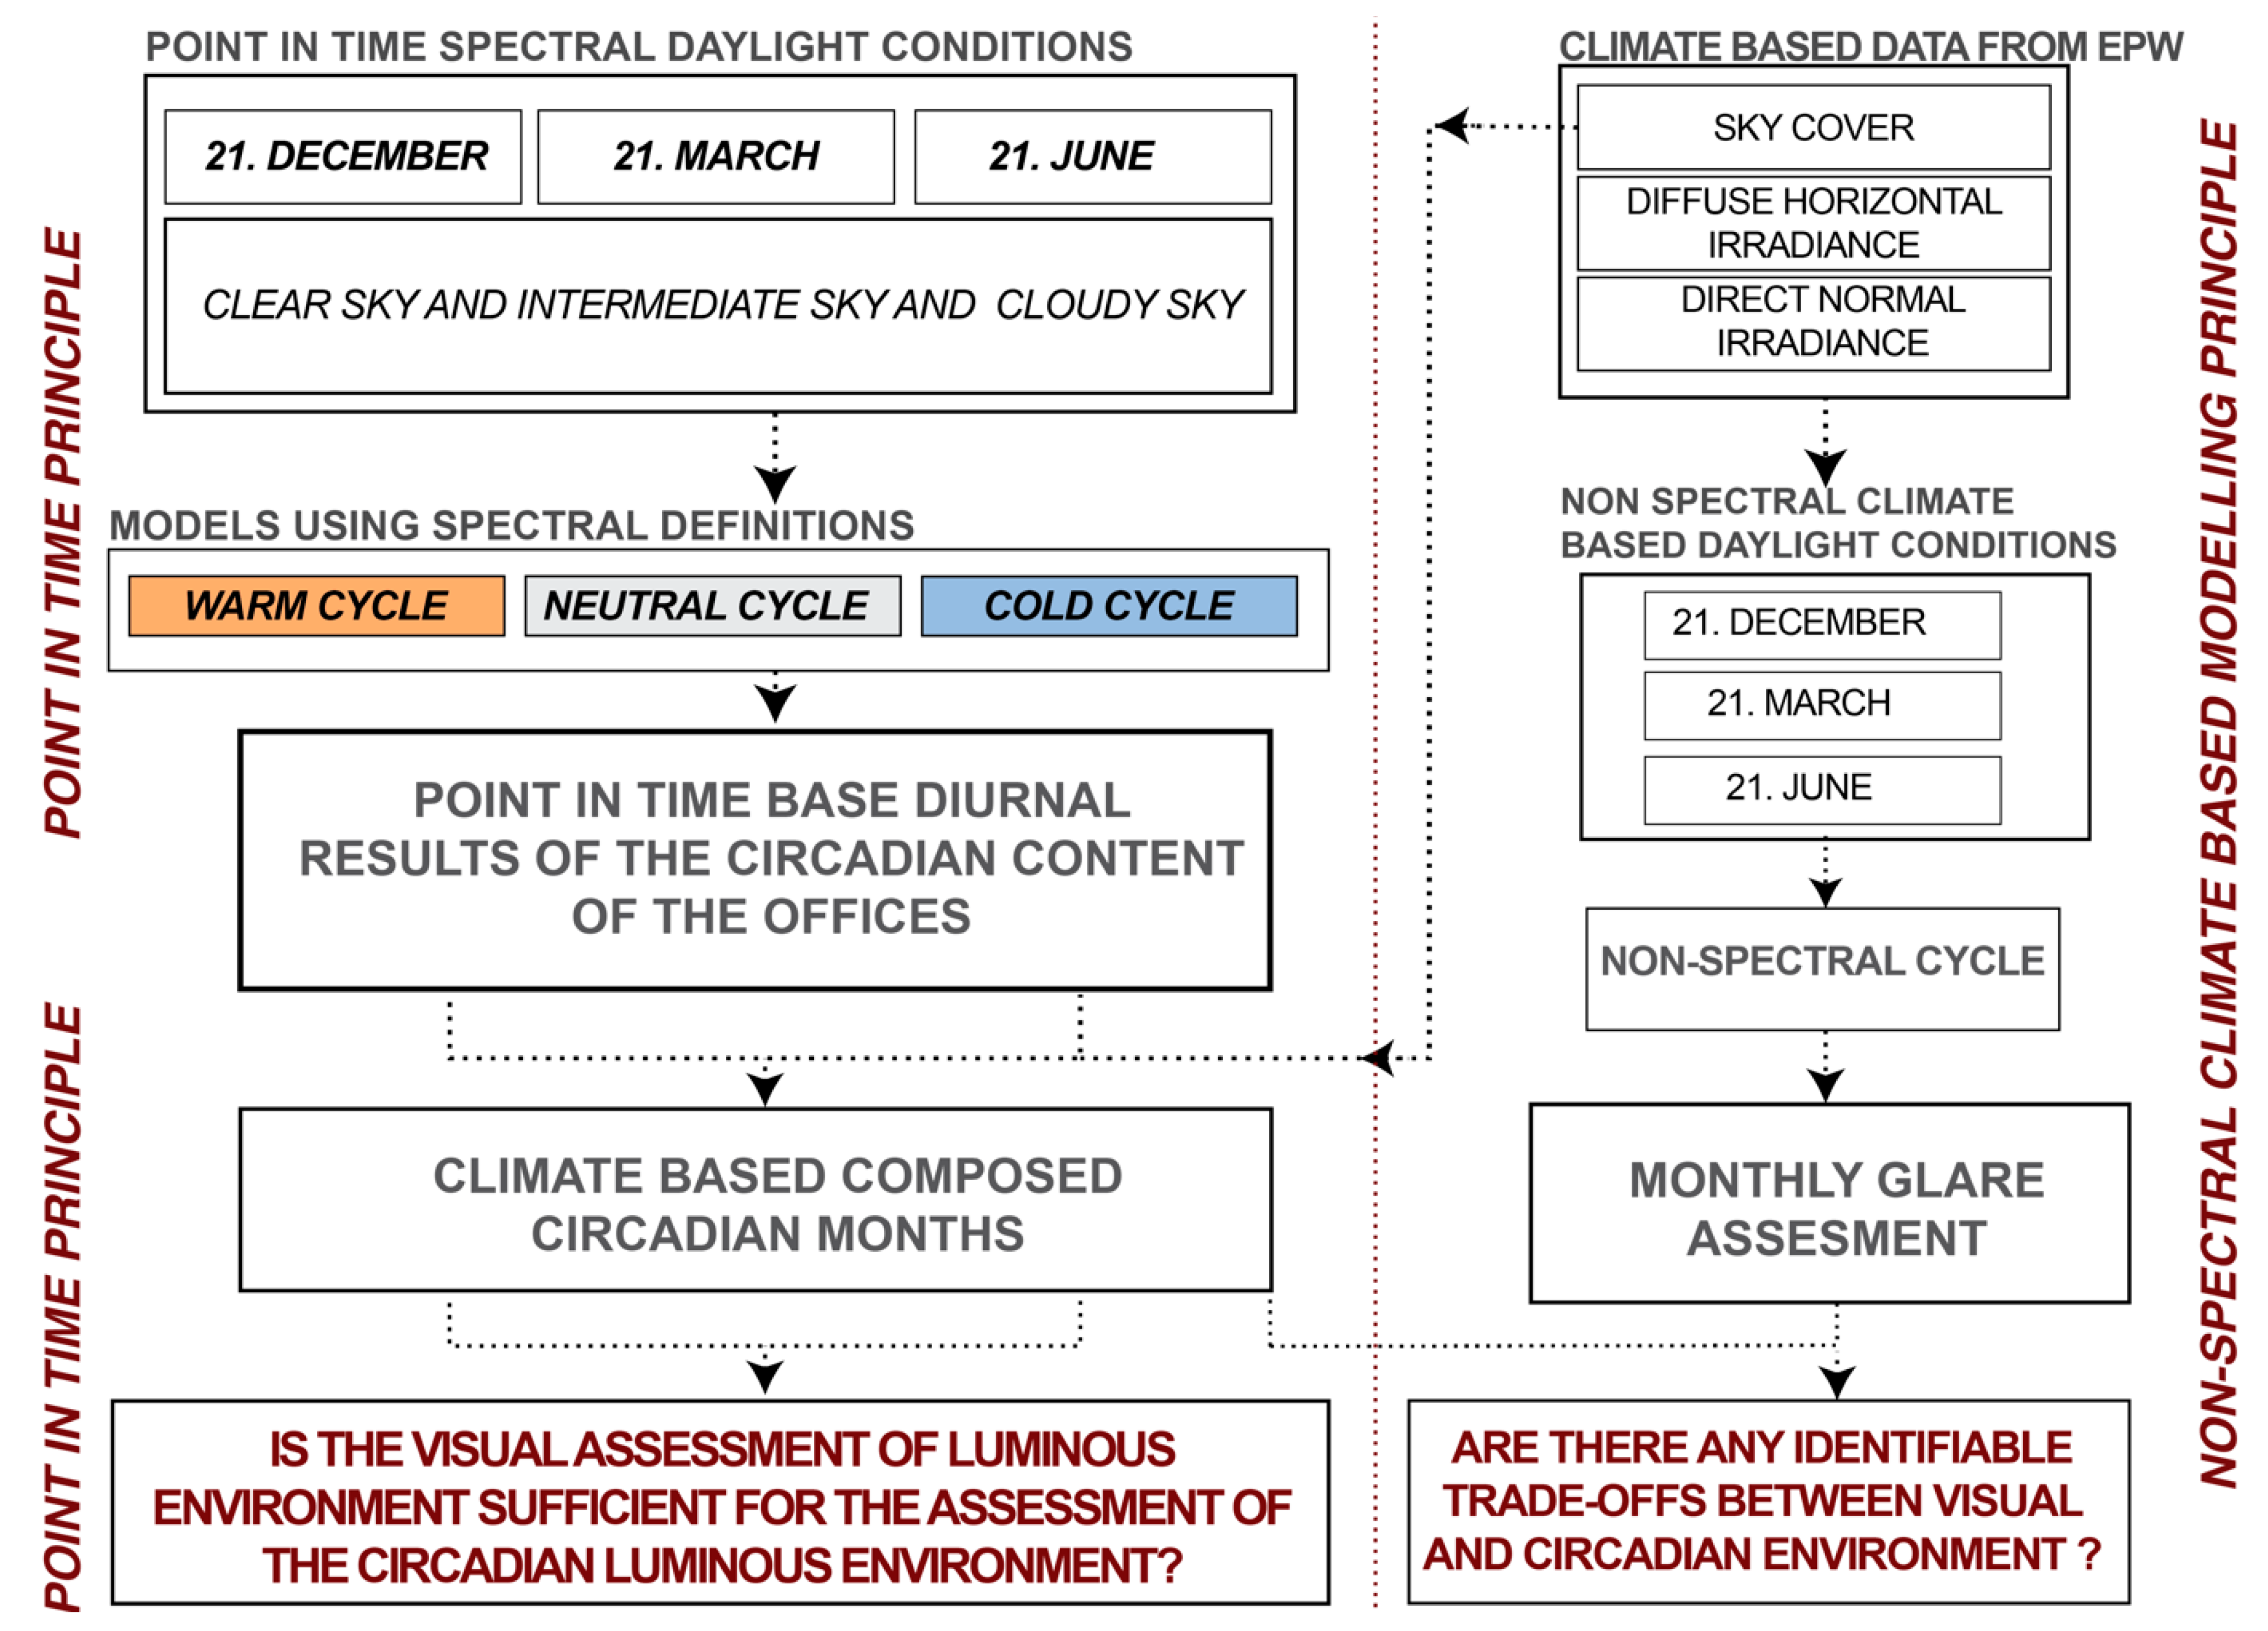
2. Methodology

To answer the above questions, this study consists of two simulation-based approaches to investigate the unilaterally daylighted cellular office in Ljubljana, Slovenia (46°3′ N, 14°30′ E), for four cardinal directions. The first approach consists of diurnal point-in-time simulations and addresses the first question exposed in the Introduction. Specifically, point-in-time multi-spectral simulation studies were used to assess the diurnal non-visual luminous environment using the software ALFA [41]. The second approach relies on the Climate-Based Daylight Modelling (CBDM) method used to study daylight’s monthly photopic and non-visual aspects. Thus, it addresses the second question stated in the study objectives.
Firstly, the external daylight conditions for the non-visual and photopic simulations were defined. December, March and June 21st were selected as representative days for the diurnal non-visual assessment, presuming that the selected days represent the extreme daylight conditions during the year. A novel approach to developing climate-based spectral months was used to perform a climate-based non-visual assessment. On the other hand, a conventional approach using Climate Studio software [54] and hourly irradiance data from the EnergyPlus weather file was used for monthly climate-based photopic evaluation of Daylight Glare Probability (DGP). For the diurnal non-visual and monthly climate-based photopic assessments, space geometry and materials were defined for each model. In the final step, the diurnal non-visual results were evaluated from the temporal and spatial perspectives implementing the proposed Circadian Autonomy (CA) and Autonomy of Circadian Potential (ACP). The results of CA and ACP were used to answer the first research question, while climate-based results of the non-visual and visual aspects (i.e., glare) were studied to answer the second research question. The overall methodological outline of the conducted study is presented in Figure 1.

2.1. Environmental Conditions

The external environmental conditions for the non-visual and photopic simulations were defined for the location of Ljubljana, separately for spectrally discerning and spectrally nondiscerning simulations. The environmental conditions for the simulations are described in the following subsections.

2.1.1. Spectral Daylight Conditions for Point-in-Time Non-Visual Simulations

External daylight conditions for the multi-spectral simulations used for the non-visual evaluation were derived within the capabilities of the ALFA spectral sky algorithm, which is based on the radiative transfer library—libRadtran [42]. Multi-spectral simulations were conducted under three sky typologies available in ALFA: clear, hazy and overcast skies for December, March and June 21st. Point-in-time simulations were performed in hourly increments from sunrise to sunset. Sunrise was defined as the first non-zero outcome of the simulations, while sunset was defined as the first zero outcome in the second half of the analysed day. Data on the spectral power distribution (SPD) for externally positioned and unobstructed sensors facing north, east, south and west portions of the sky hemisphere were recorded for each simulation iteration. SPDs of the normalised skies at hourly increments for December, March and June 21st under ALFA clear, hazy and overcast sky conditions are given in Appendix A. The calculated CCT ranges of all the simulated skies are presented in Table 1.

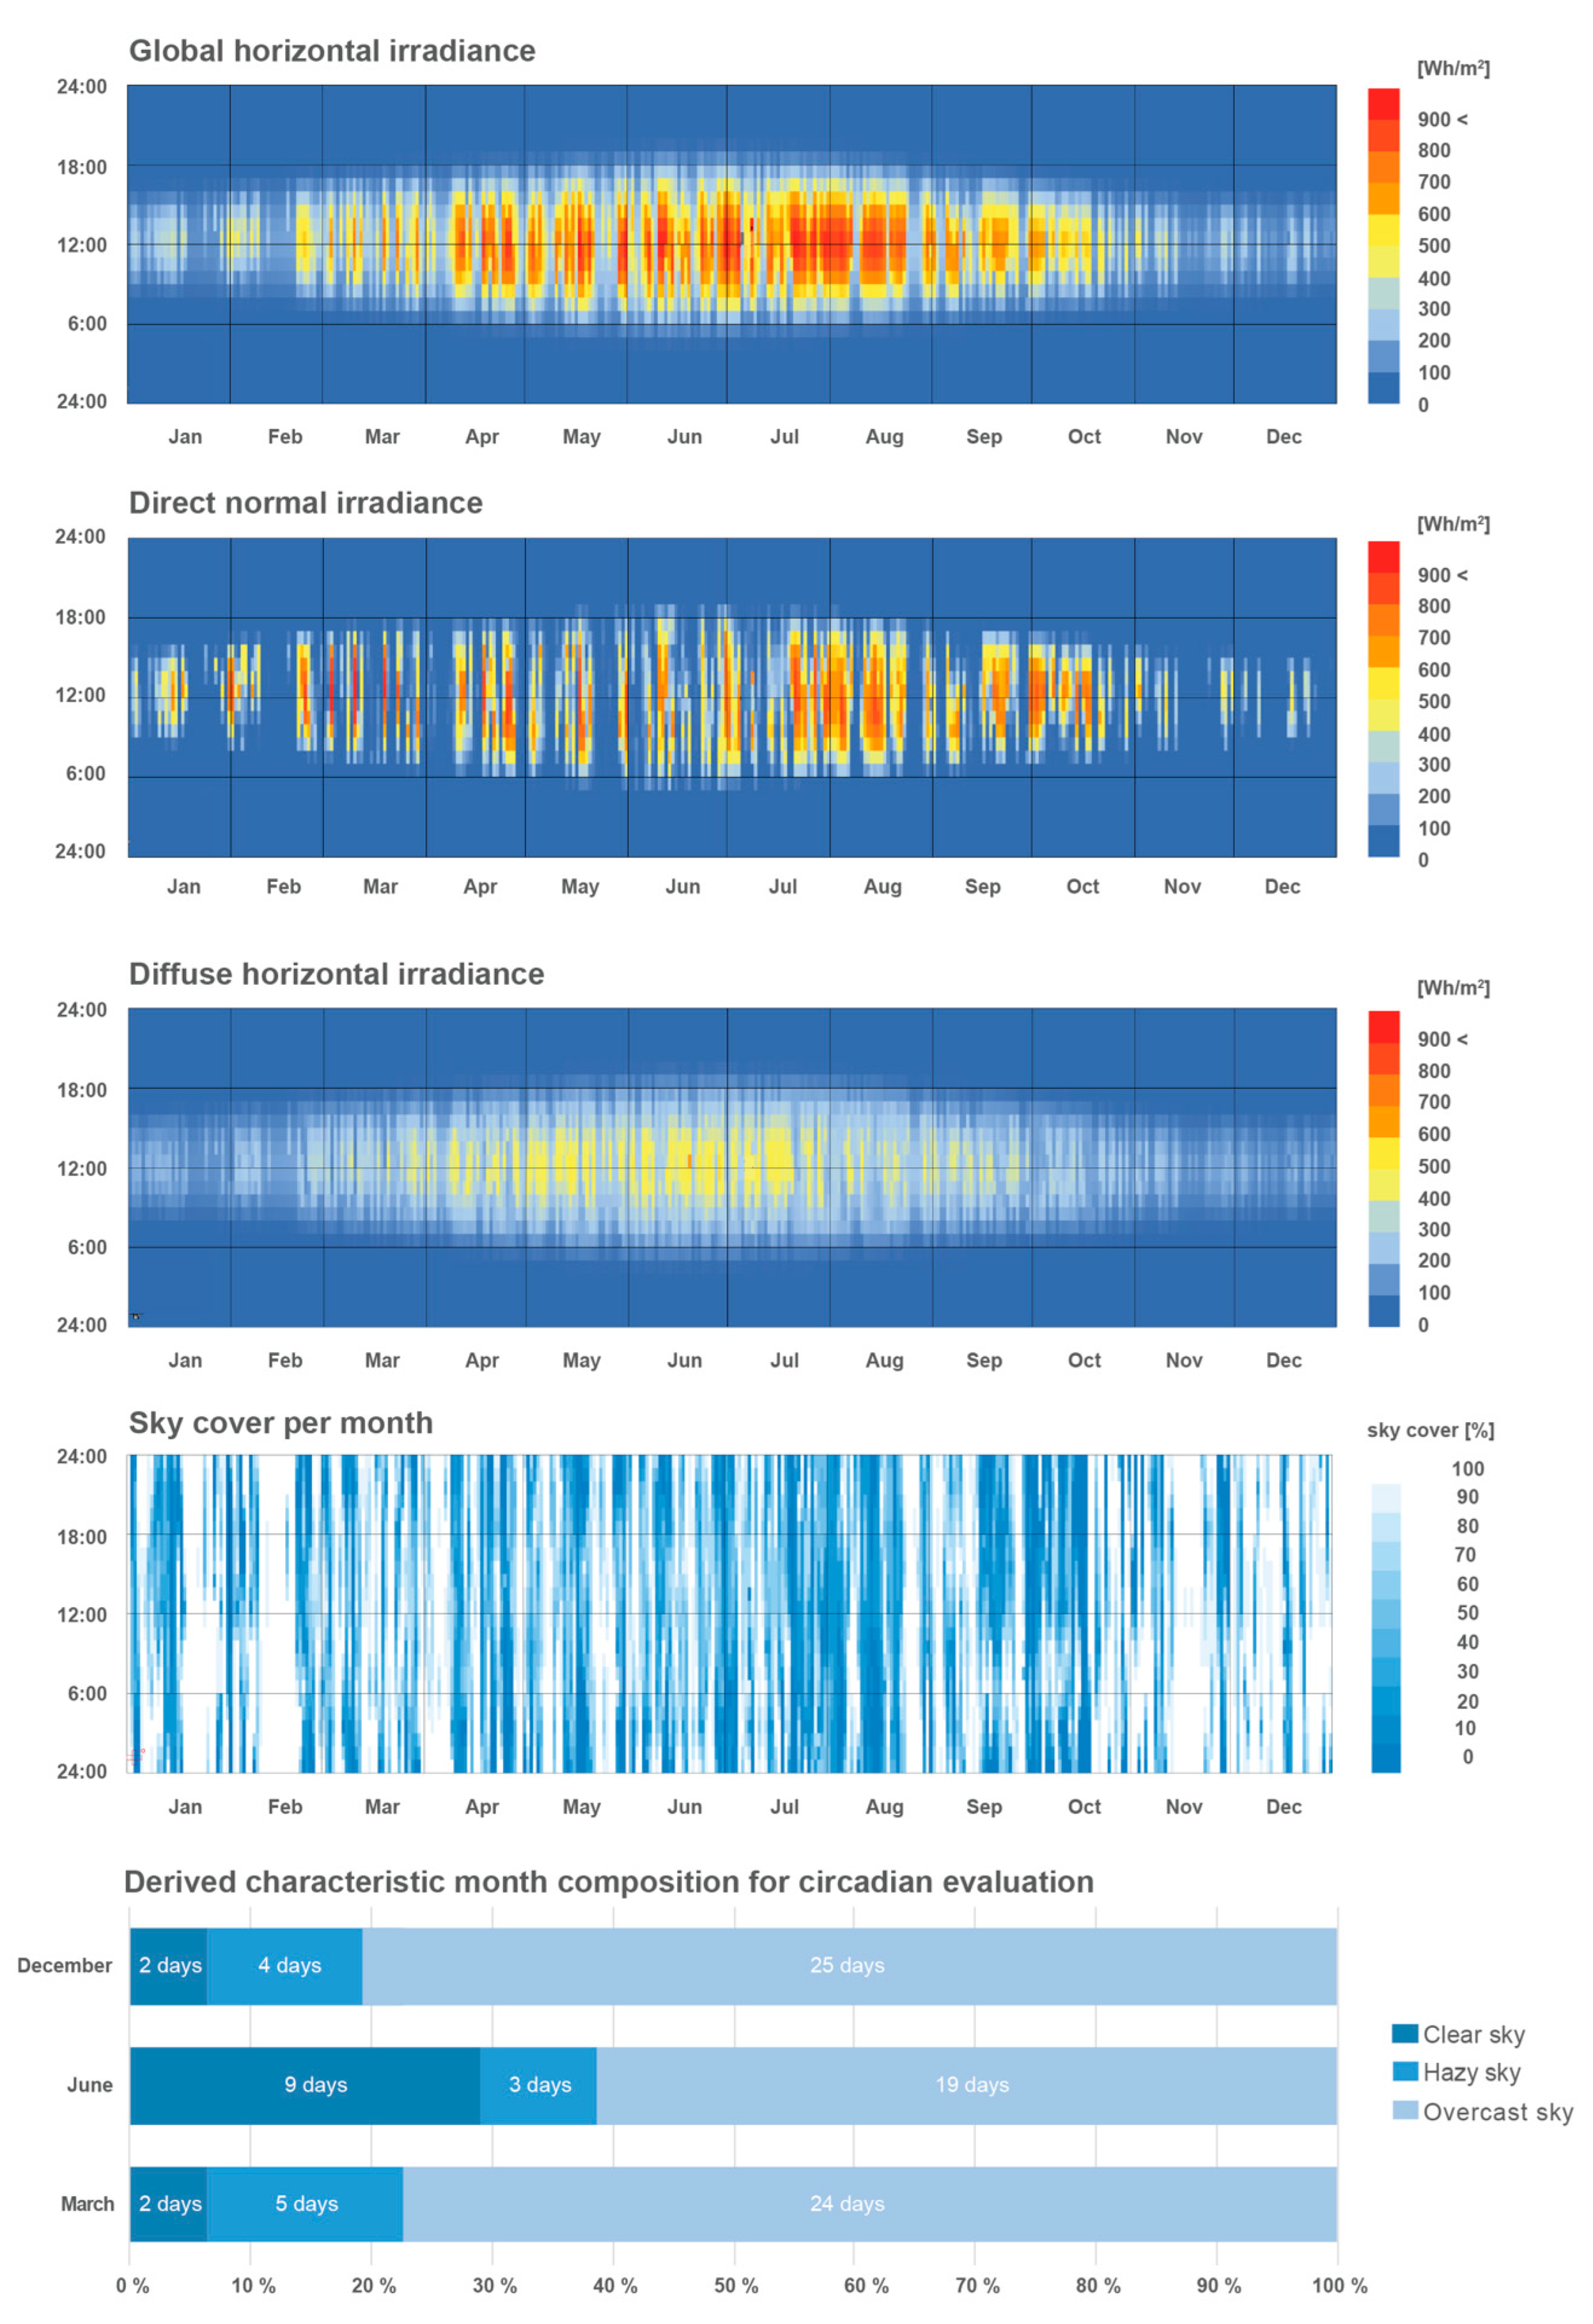
2.1.2. Monthly Climate-Based Visual and Non-Visual Daylight Conditions

As mentioned above, the climate-based evaluation was performed for the photopic and non-visual aspects. The photopic evaluation was performed for the entire daylit parts of days for December, March and June, according to the established CBDM methodology. Climate Studio, a progressive raytracing software based on Radiance, was used to calculate monthly daylight conditions. Global horizontal, direct normal and diffuse horizontal illuminance and sky cover obtained from the weather file for Ljubljana are shown in Figure 2.
As the functionality of ALFA is inherently limited to point-in-time simulations and three sky typologies (i.e., clear, hazy and overcast), a modified approach to the monthly CBDM simulations was implemented in multi-spectral non-visual simulations. The selected representative days (December, March and June 21st) were evaluated on an hourly time step using ALFA for all three sky typologies. These were then used to construct a simplified climate-based spectral month. The structure of the month was determined according to representative sky cover for each day of the month. The sky classification methodology was adopted after Vaz and Inanici [55], where sky cover between 0–40% was classified as clear sky, 40–60% as hazy sky and 60–100% as overcast sky. As shown in Figure 2, a simplified climate-based month, for example March, consisted of 2 clear sky days, 5 hazy sky days and 24 overcast sky days.
The implemented approach to CBDM modelling of photopic and non-visual daylight inherently represents a limitation of the applied methodology. Because the methodologies of sky models for photopic and non-visual CBDM simulations are different, the obtained results cannot be directly compared. However, DGP results can still be used as a reliable proxy for the photopic requirements of the studied indoor environment, even though the calculation is not based on the values of the ALFA simulations.

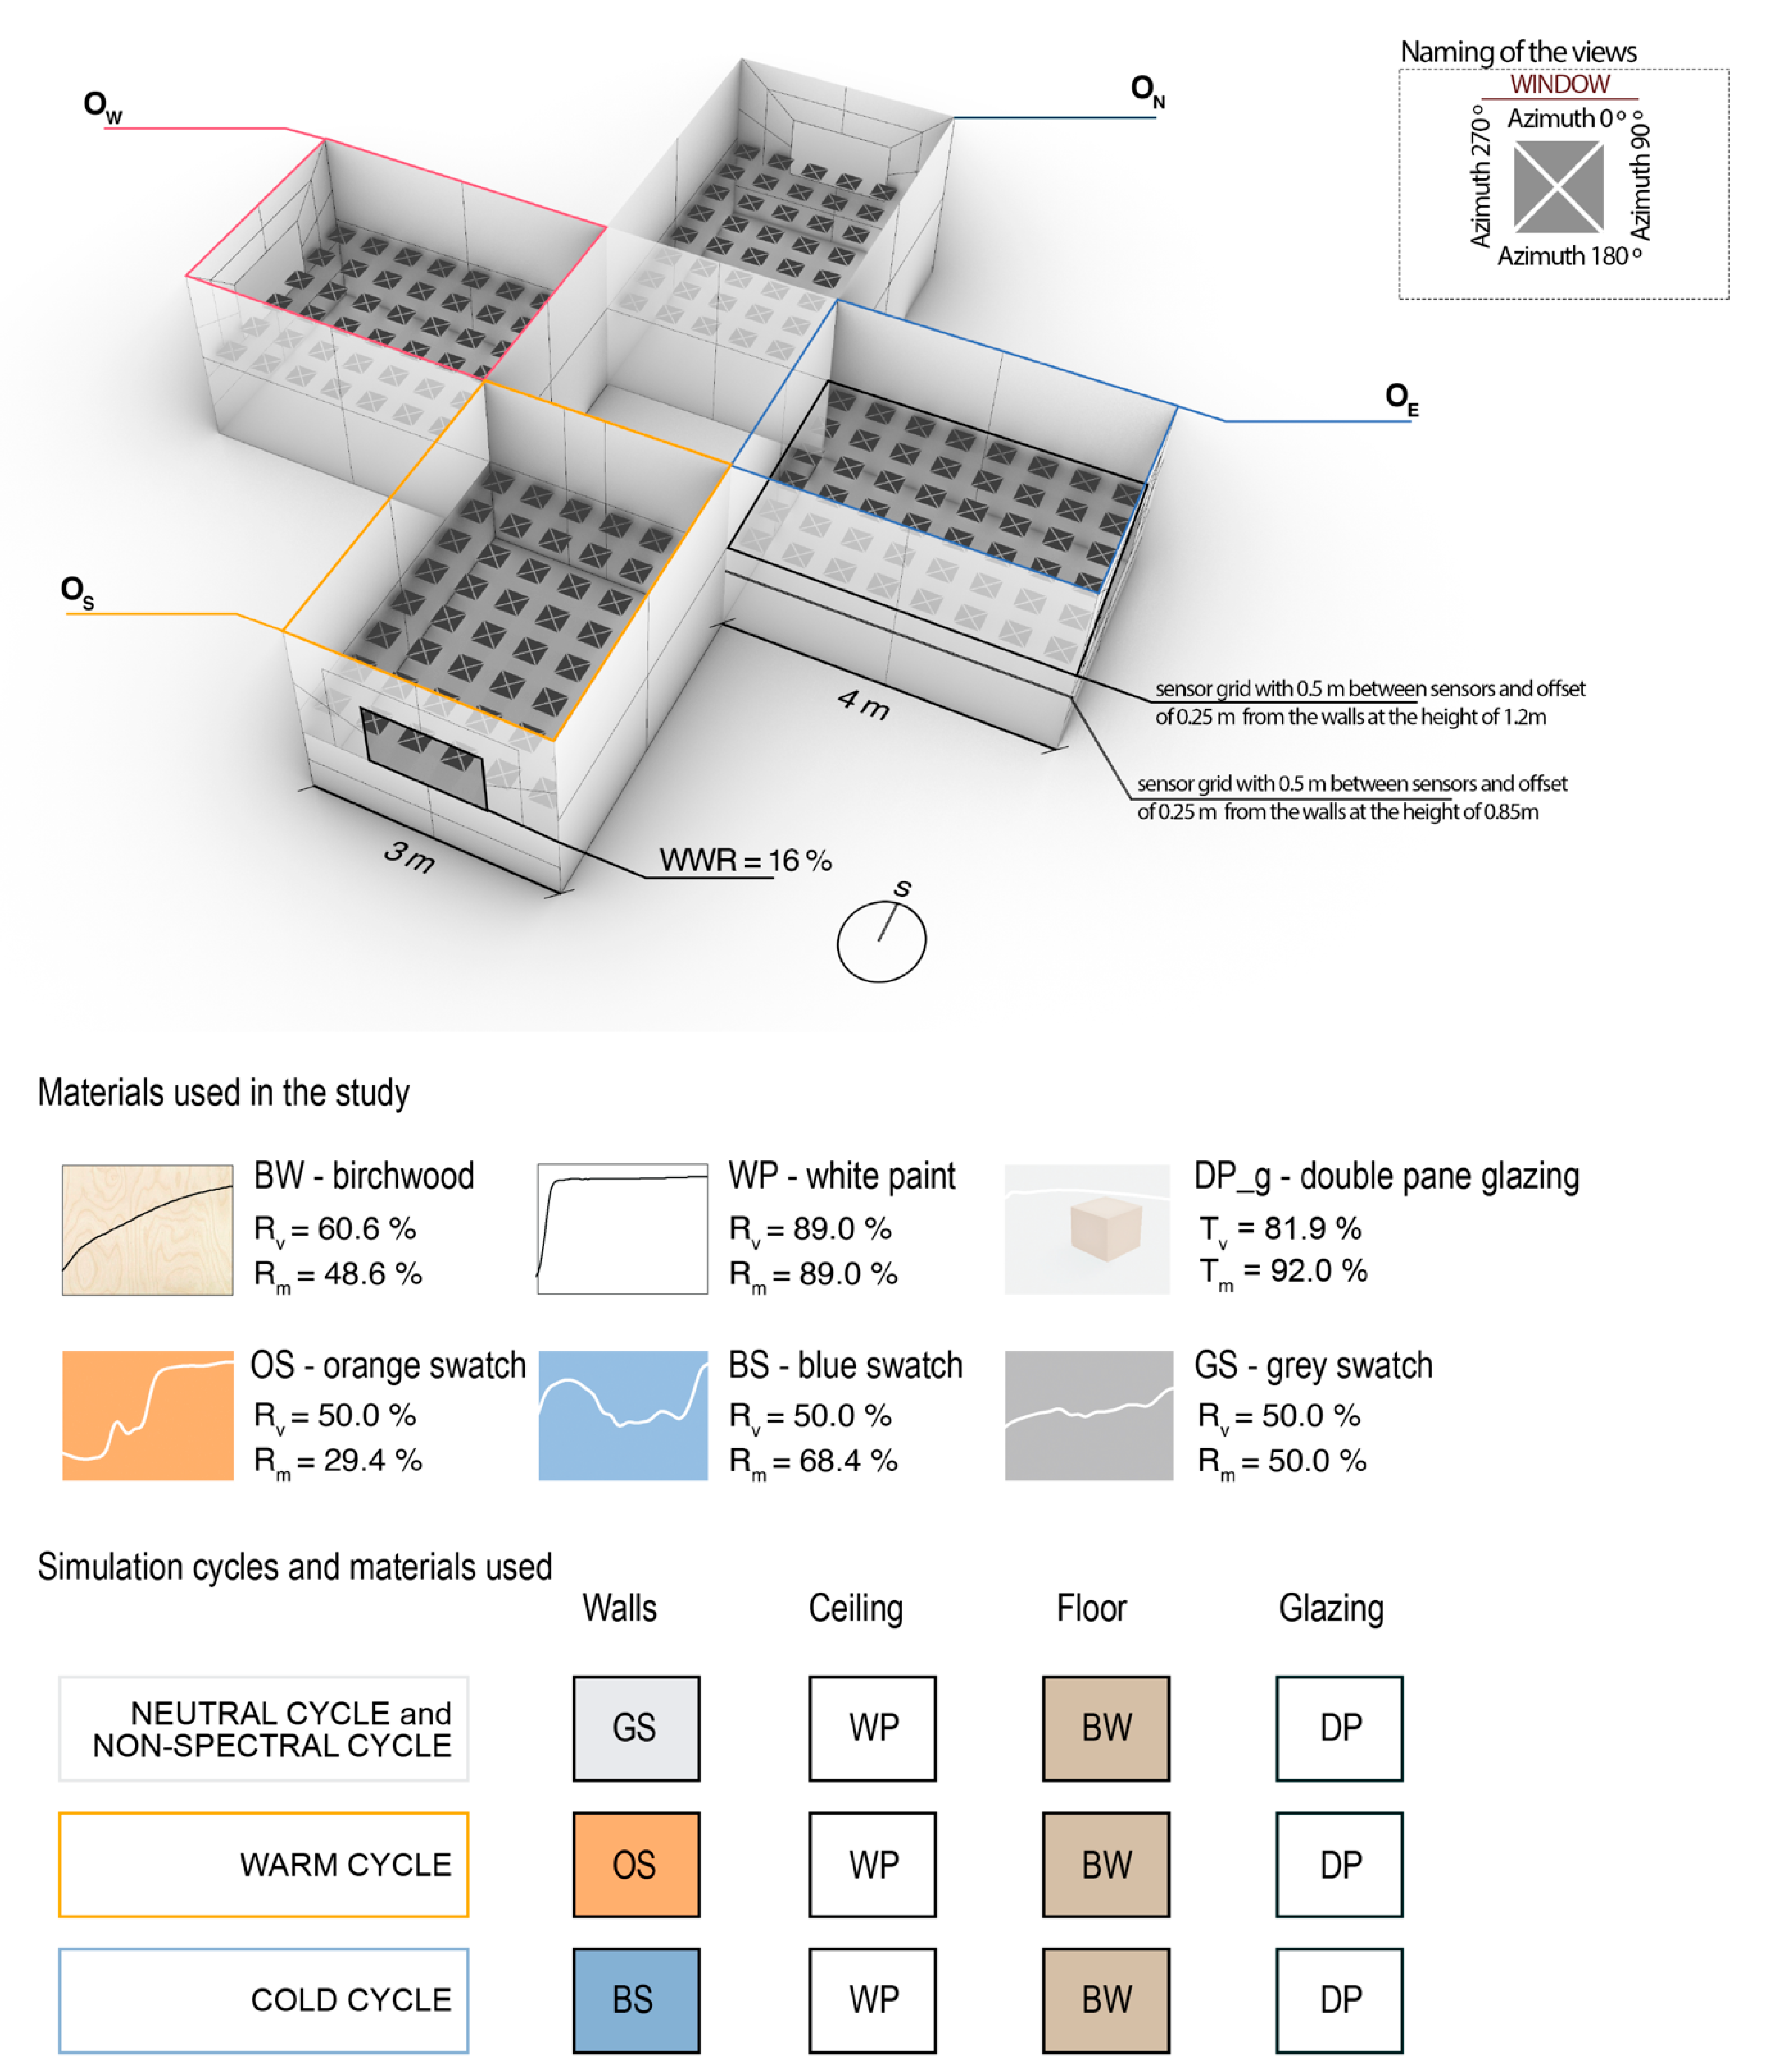
2.2. Geometry and Optical Properties of the Cellular Office

Four identical cellular offices were used for the study. These are based on the geometric characteristics of the experimental research conducted by Potočnik and Košir in 2019 [51]. Thus, the dimensions of the offices are 4.0 × 3.0 × 2.6 m (length by width by height). The interior is unilaterally daylit through a symmetrically placed window of 1.4 × 0.9 m (width by height) with a sill height of 0.9 m, resulting in a Window-to-Wall Ratio (WWR) of 16%. The offices were designated according to the window orientation, i.e., ON—north-oriented office, OE—east-oriented office, OS—south-oriented office and OW—west-oriented office. An analysis grid of 8 by 6 sensor points, 0.25 m offset from the wall and 0.5 m distance between individual points, was set up for this study. The grid was located at 1.2 m (i.e., eye level of seated occupant) above the finished floor, where vertical SPDs were simulated for each cardinal view orientation for the non-visual and glare evaluation. The views were named according to the view azimuth angle (Az), with an Az = 0° always corresponding to a view oriented towards the window, followed by Azs = 90°, 180° and 270° in the clockwise direction, as shown in Figure 3.
For the non-visual evaluation, three versions of wall colours were evaluated in the three materiality simulation cycles (i.e., cold, neutral and warm cycles) (Figure 3). The opaque material properties were determined by SPD reflectance laboratory measurements of real-life samples [51]. These values were then used to determine the photopic reflectance (Rv) used for the non-spectral photopic simulations (evaluation of glare) and melanopic reflectance (Rm) values of materials. The wall colours were selected to have the same Rv value of 50.0% but very different Rm values, ranging from 29.4% for orange (OS) to 68.4% for blue (BS). Thus, the wall materials had a ratio of melanopically to photopically weighted reflectance (MRp or M/P) [56,57] of 0.58 for OS and 1.37 for BS colours. The grey (GS) colour had an MRp = 1 (Rv = Rm = 50.0%). In the instance of transparent materials (i.e., glazing), the spectral transmittance and photopic transmittance (Tv) of the material were determined using the Optics software [58] according to the glazing manufacturer’s specifications. Only the neutral cycle materials (Figure 3) were considered for the CBDM monthly photopic simulations, as all wall colours had equal Rv. All materials used in the photopic simulations were defined as Radiance materials based on the photopic reflectance values. For all simulations, the material properties of the floor (natural birch wood, Rv = 60.6%, Rm = 48.6%, MRp = 0.80), ceiling (white paint, Rv = Rm = 89.0%, MRp = 1) and window glazing (double pane thermally insulating glazing, Tv = 81.9%, Tm = 92.0%) were constant (Figure 3).

2.3. Evaluation of Simulation Results

2.3.1. Non-Visual Aspects

The output spectral data from the ALFA software were used to interpret non-visual aspects. The methodology of Circadian Light proposed by Rea et al. [24] and their respective recommendations of 275 CLA or 0.3 CS light dosage, consistent with 275 lx at 4000 K and resulting in favourable effects on acute alertness and consequentially circadian propagation, were used as the basis for our evaluation methodology. Non-visual aspects were assessed using three methods which incorporated spatial and temporal characteristics of circadian exposure and are presented in the following subsections.

Relative Circadian Efficacy

Analogous to our previous studies, where we used Relative Melanopic Efficacy, RME [54], we introduced Relative Circadian Efficacy—RCE. In contrast to RME, which addressed only the functioning of ipRGCs, RCE evaluates the non-visual luminous environment by incorporating the response of all photoreceptors involved in circadian functioning as evaluated by the CLA methodology.
The proposed RCE metric (Equation (1)) represents a coefficient between CLA and Ev. However, unlike the established photopic methodology V(λ) or α-opic lx, CLA considers the non-linear response of photoreceptors to light. The primary intention of RCE is to indicate whether the non-visual aspects can be evaluated purely by photopic measures. Specifically, RCE ≥ 1.00 indicates that CLA is equal to or higher than photopic illuminance. Therefore, visually based metrics can be used to evaluate whether the indoor non-visual luminous environment would reach a specific threshold (e.g., 0.3 CS or 275 CLA), as they are on the safe side.
R C E = C L A E v

Temporal Evaluation of the Non-Visual Luminous Environment

To evaluate non-visual luminous environment conditions for a given time interval, the Circadian Autonomy (CA) metric was introduced and is analogous to the Daylight Autonomy (DA) metric [59]. CA expresses the fraction of time in a given period that satisfies the criterion of circadian effective light of CS ≥ 0.3 [29]. Thus, the following equation calculates CA:
C A = t C S t · 100
where the components are as follows:
C A —Circadian Autonomy [%];
t C S —duration of circadian effective conditions [h];
t —chosen time interval [h].
Similar to CA, we also defined a measure for quantifying the non-visual potential using the Autonomy of Circadian Potential (ACP). ACP expresses the fraction of time in the selected time interval when RCE ≥ 1.00. In other words, the fraction of time in the time interval chosen for the evaluation of the circadian luminous environment based on the photopic illuminances of Ev would be adequate for the non-visual evaluation. The Autonomy of Circadian Potential is calculated according to the following equation:
A C P = t R C E t · 100
where the components are as follows:
A C P —Autonomy of Circadian Potential [%];
t R C E —time, when RCE ≥ 1.0 [h];
t —chosen time interval [h].

2.3.2. Visual Aspects—Daylight Glare Assessment

In parallel to the non-visual evaluation of the considered offices, a climate-based photopic assessment was performed for the investigated spaces by calculating the Daylight Glare Probability (DGP). The evaluation of DGP was chosen because the requirement of high vertical illuminances of the non-visual response likely contradicts the visual comfort requirements expressed as DGP. To study this relation, monthly DGP was calculated for each of the selected months based on the weather file data. The used DGP calculation is based on the method defined in EN 17037 [60]. The monthly glare occurrence was evaluated according to the medium-level requirement of DGPe<5%, representing a DGP value exceeding no more than 5% of the occupied time. The glare value of 0.4 DGP was taken as a threshold for the evaluation. The fraction of time with conditions above 0.4 DGP (fDGP) was evaluated using the following equation, Equation (4), as proposed in EN 17037 [5]:
f D G P = t g l a r e t r e f · 100
where the components are as follows:
t g l a r e —time when DGP ≥ 0.4 [h];
t r e f —chosen time interval [h].

3. Results

The results are presented in two sections. Section 3.1 shows the ACP results of the diurnal point-in-time non-visual simulations for four identical offices with different orientations under three sky typologies and on three critical days. The ACPs of the same offices are evaluated in Section 3.2 according to the constructed climate-based spectral months for the non-visual CBDM evaluation and paralleled with the monthly DGP results of the photopic evaluation to indicate potential contradiction between photopic and non-visual aspects. For the results of the CA calculations of the diurnal point-in-time and the climate-based monthly simulations, see Appendix C.

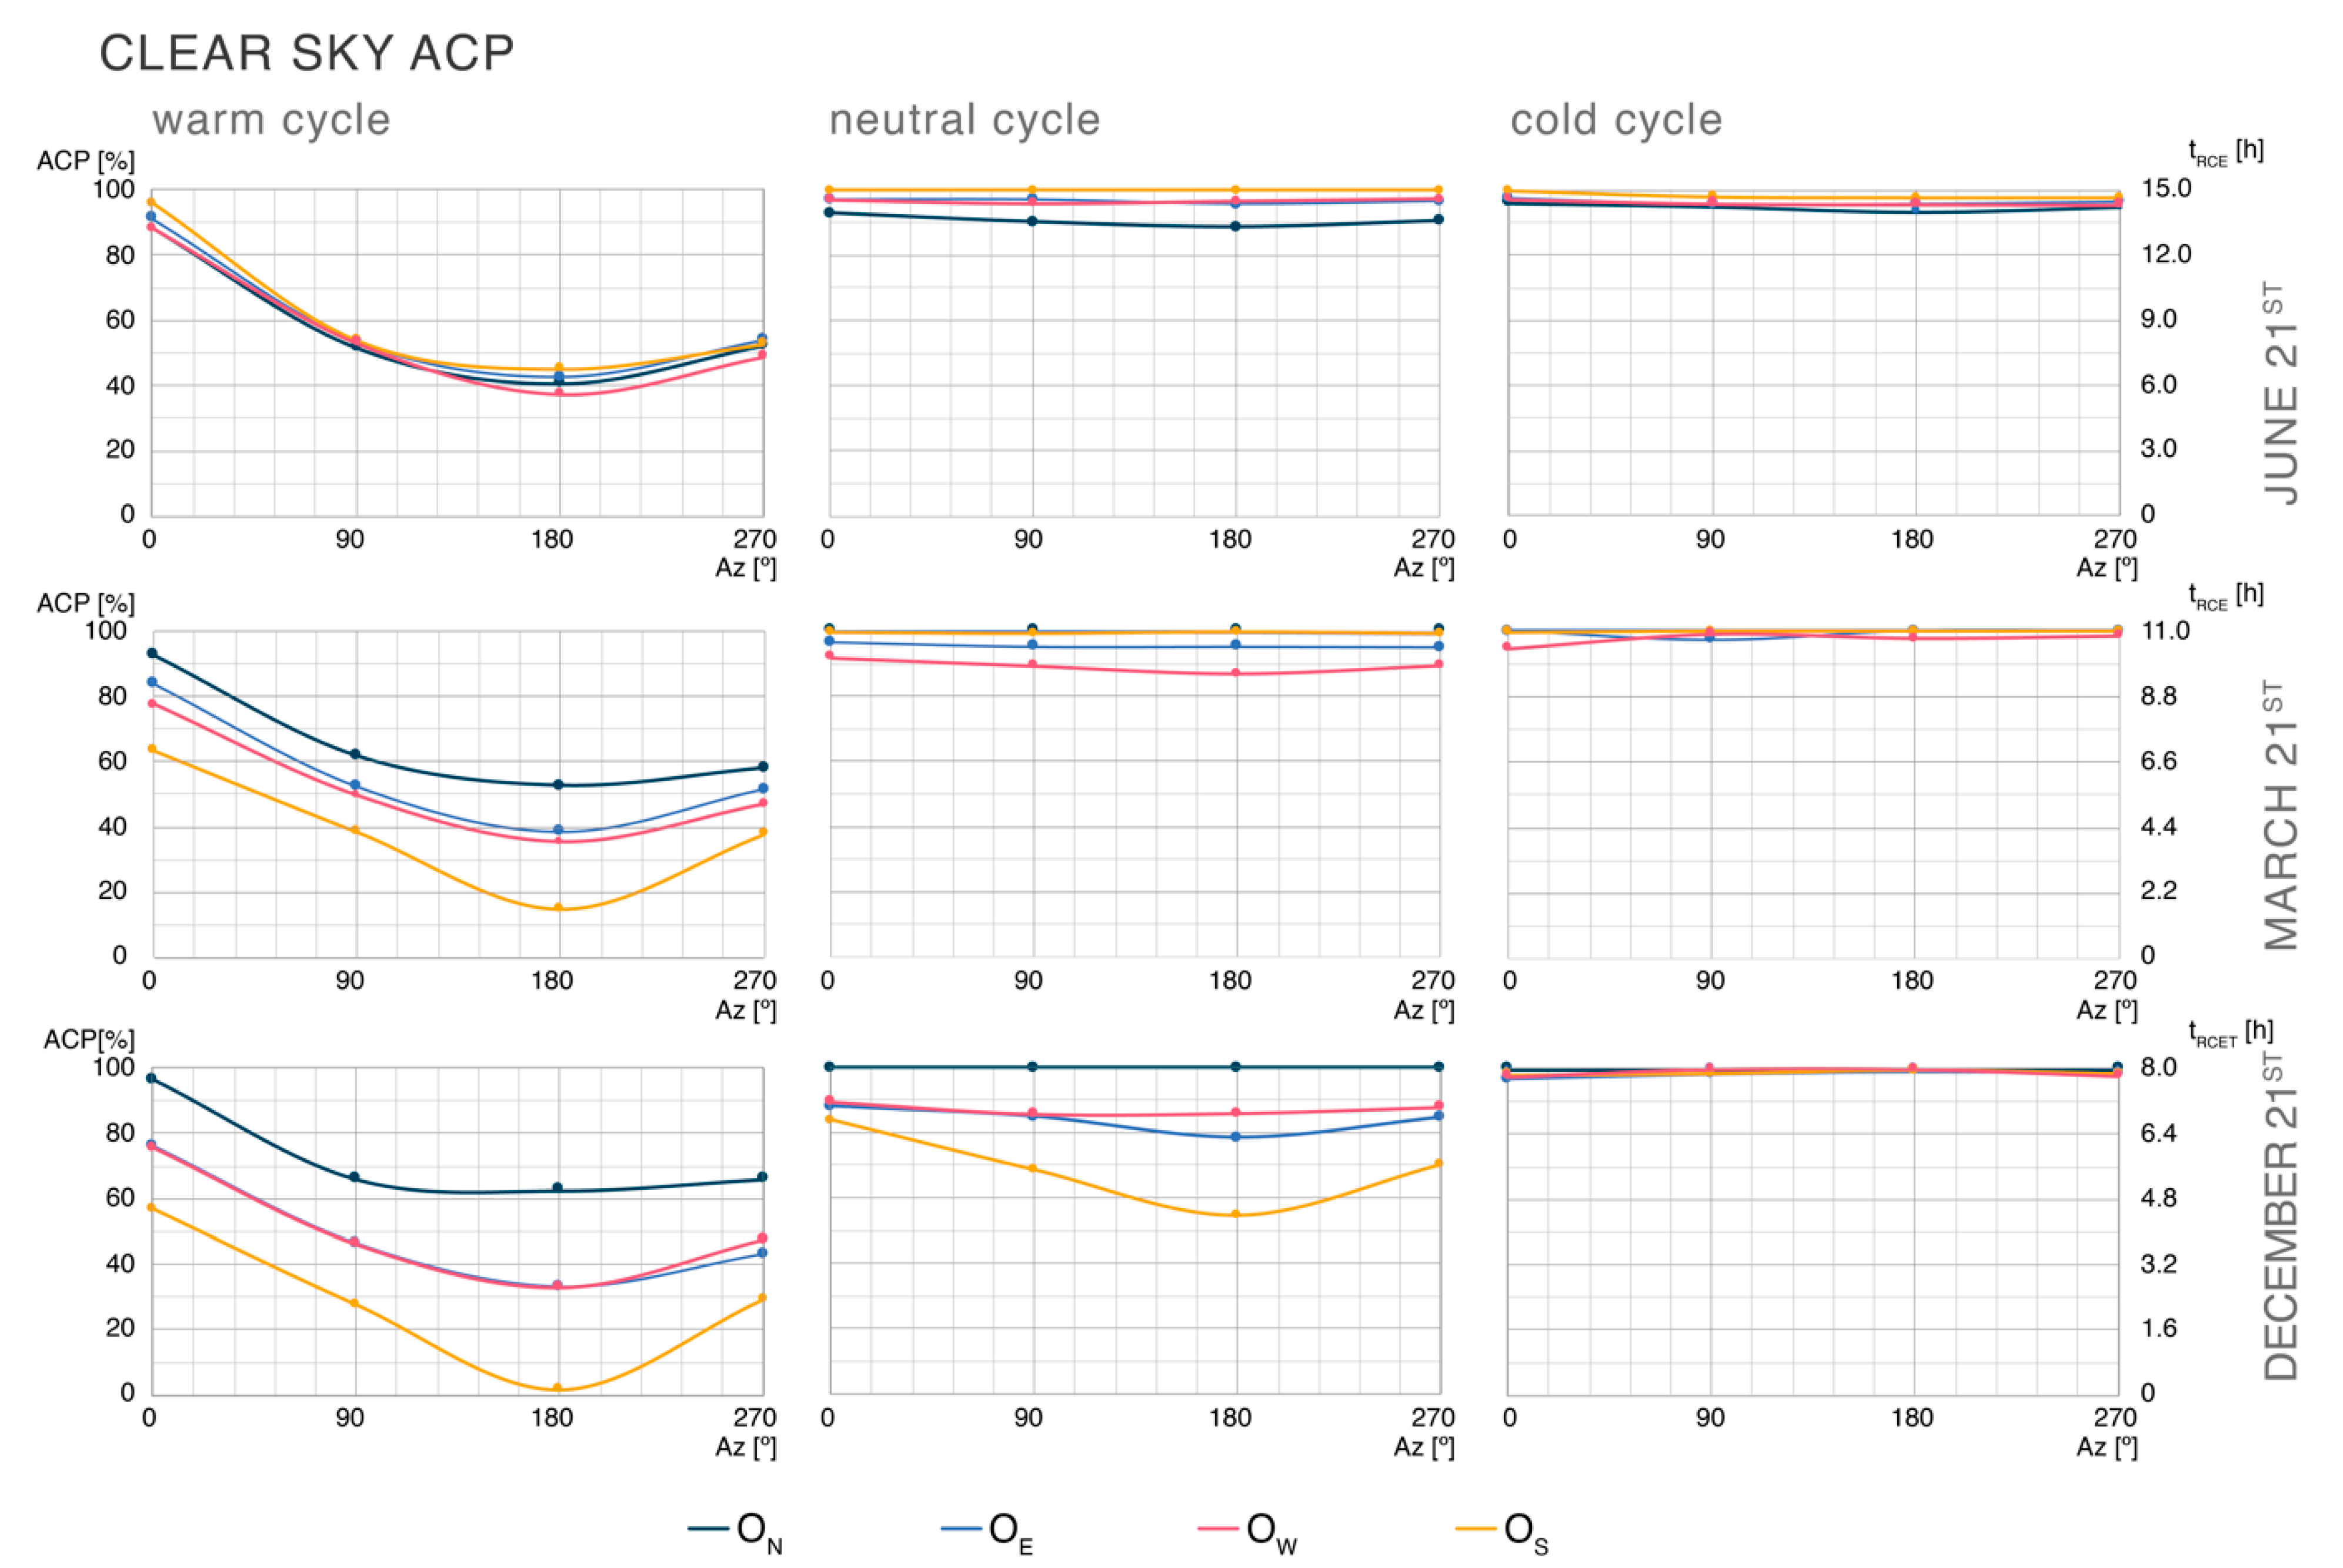
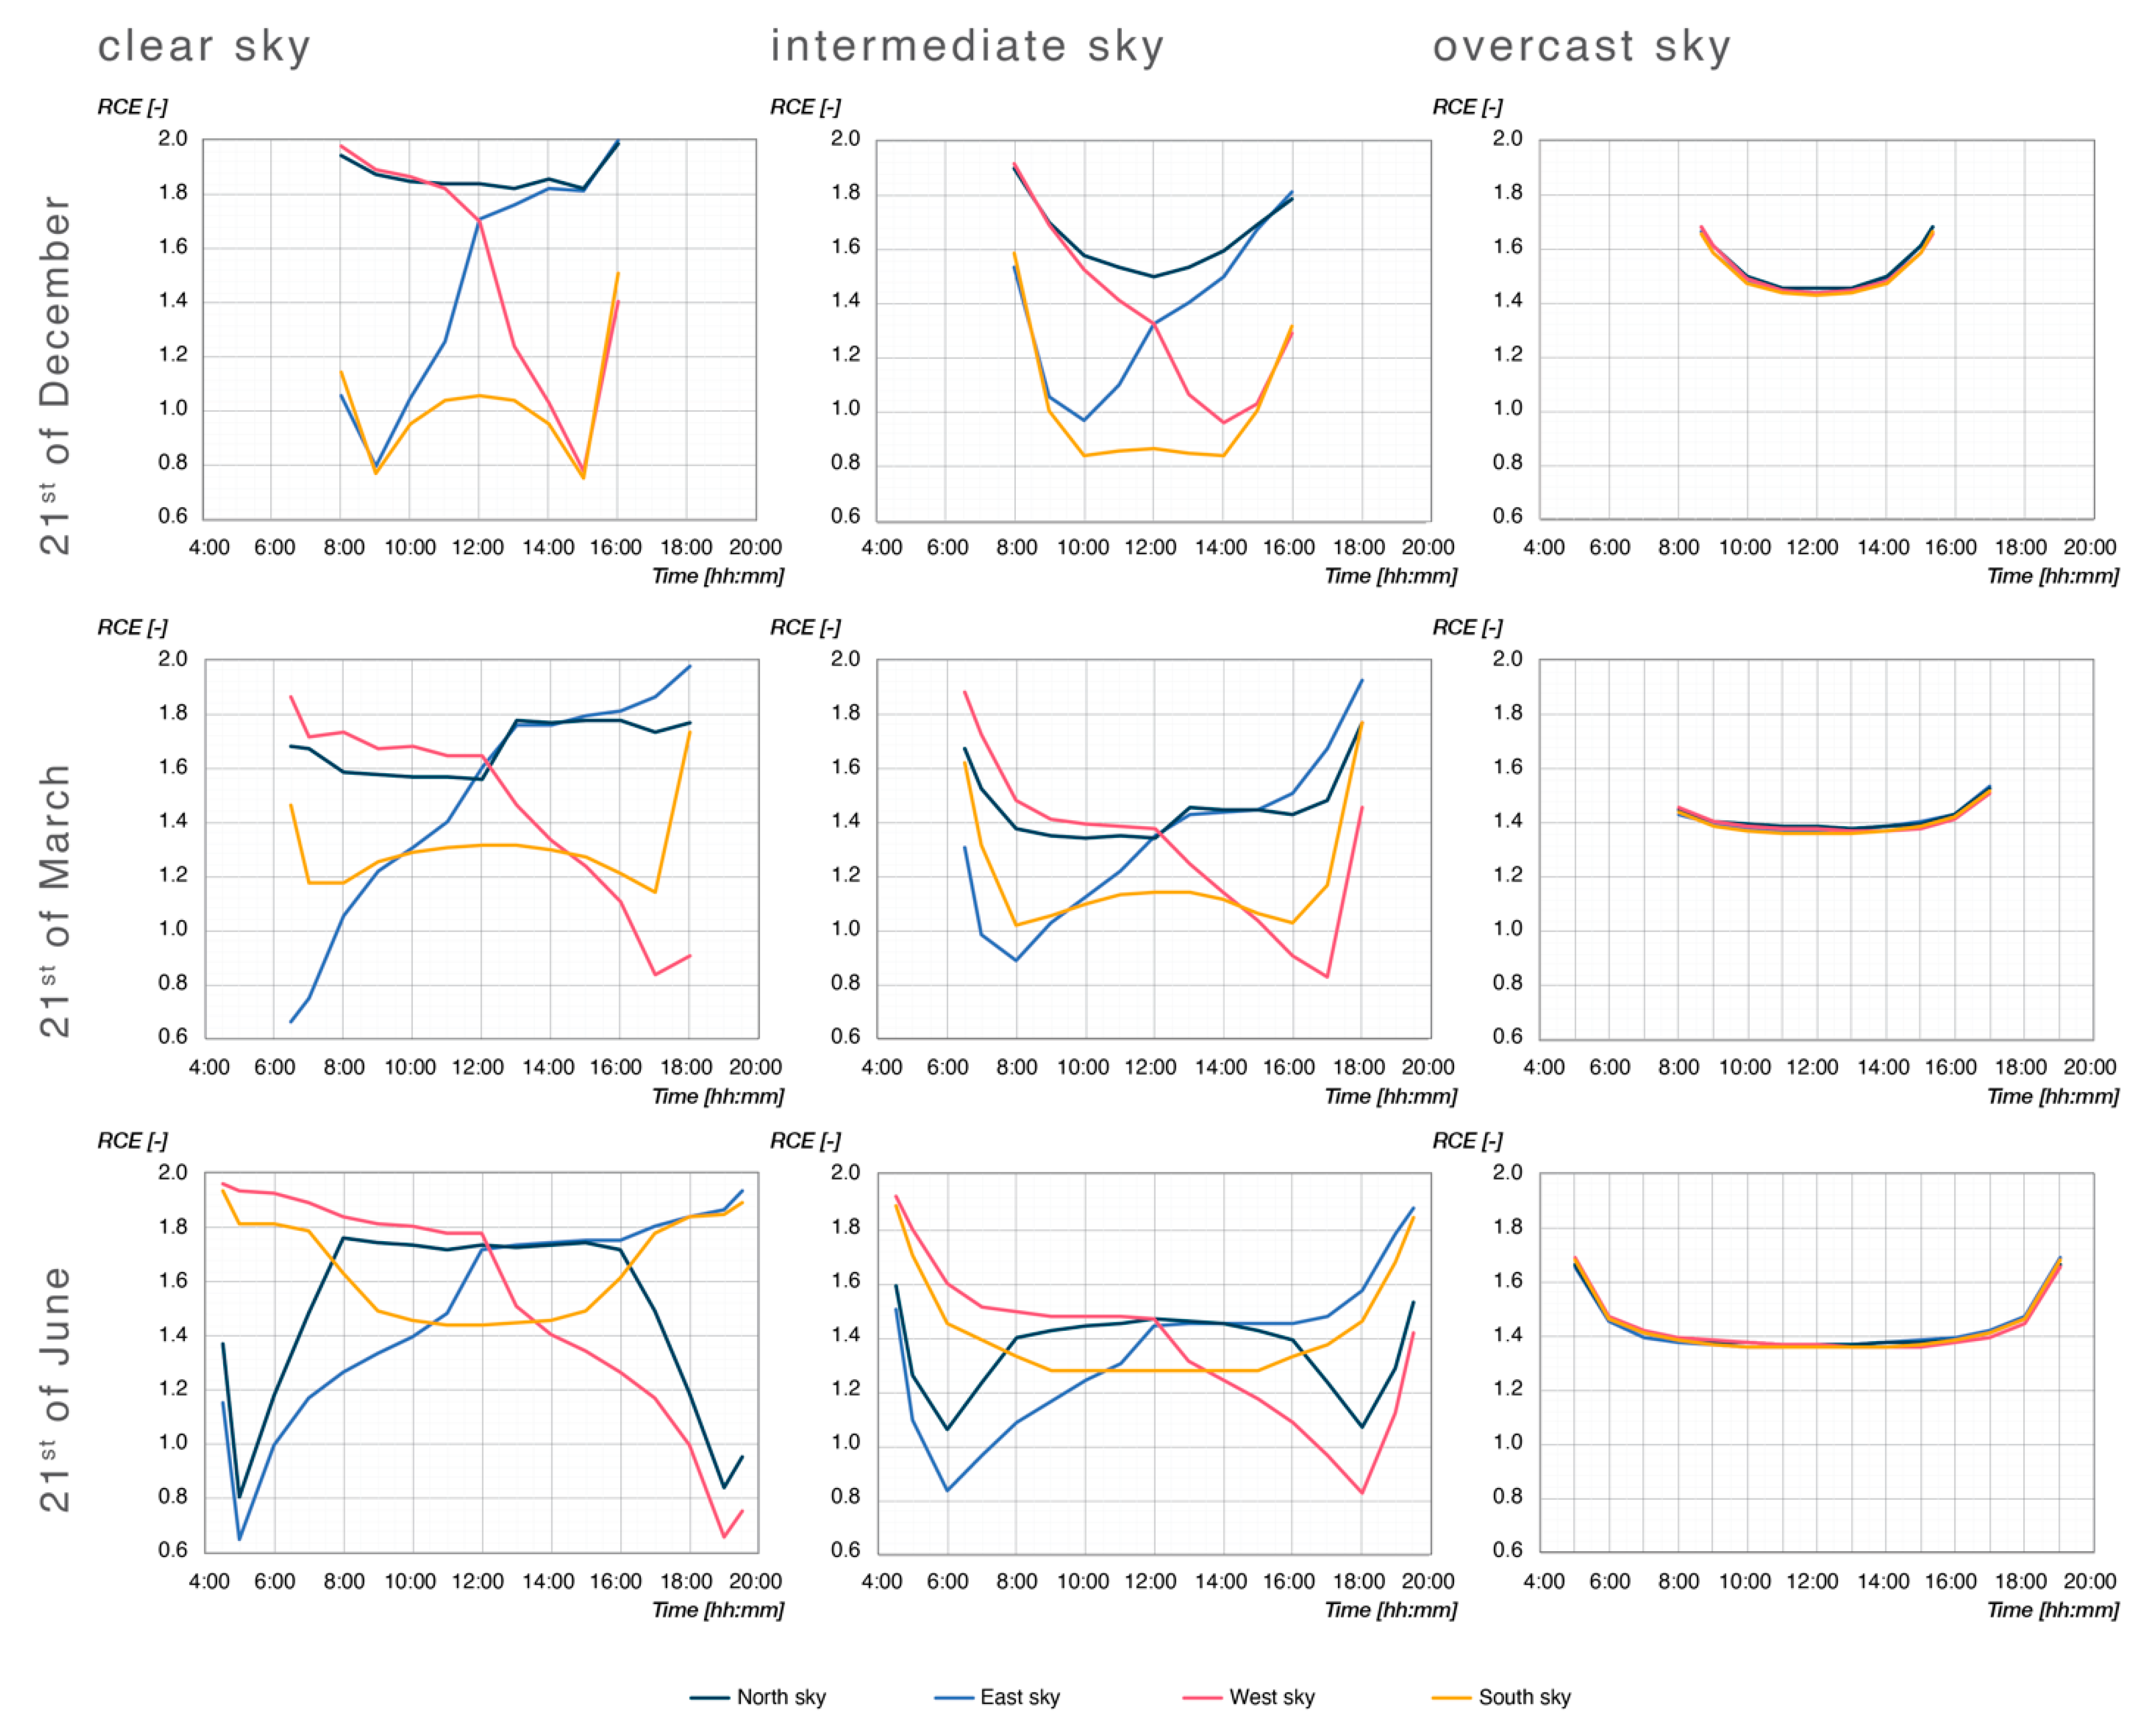
3.1. Diurnal Point-in-Time Non-Visual Evaluation

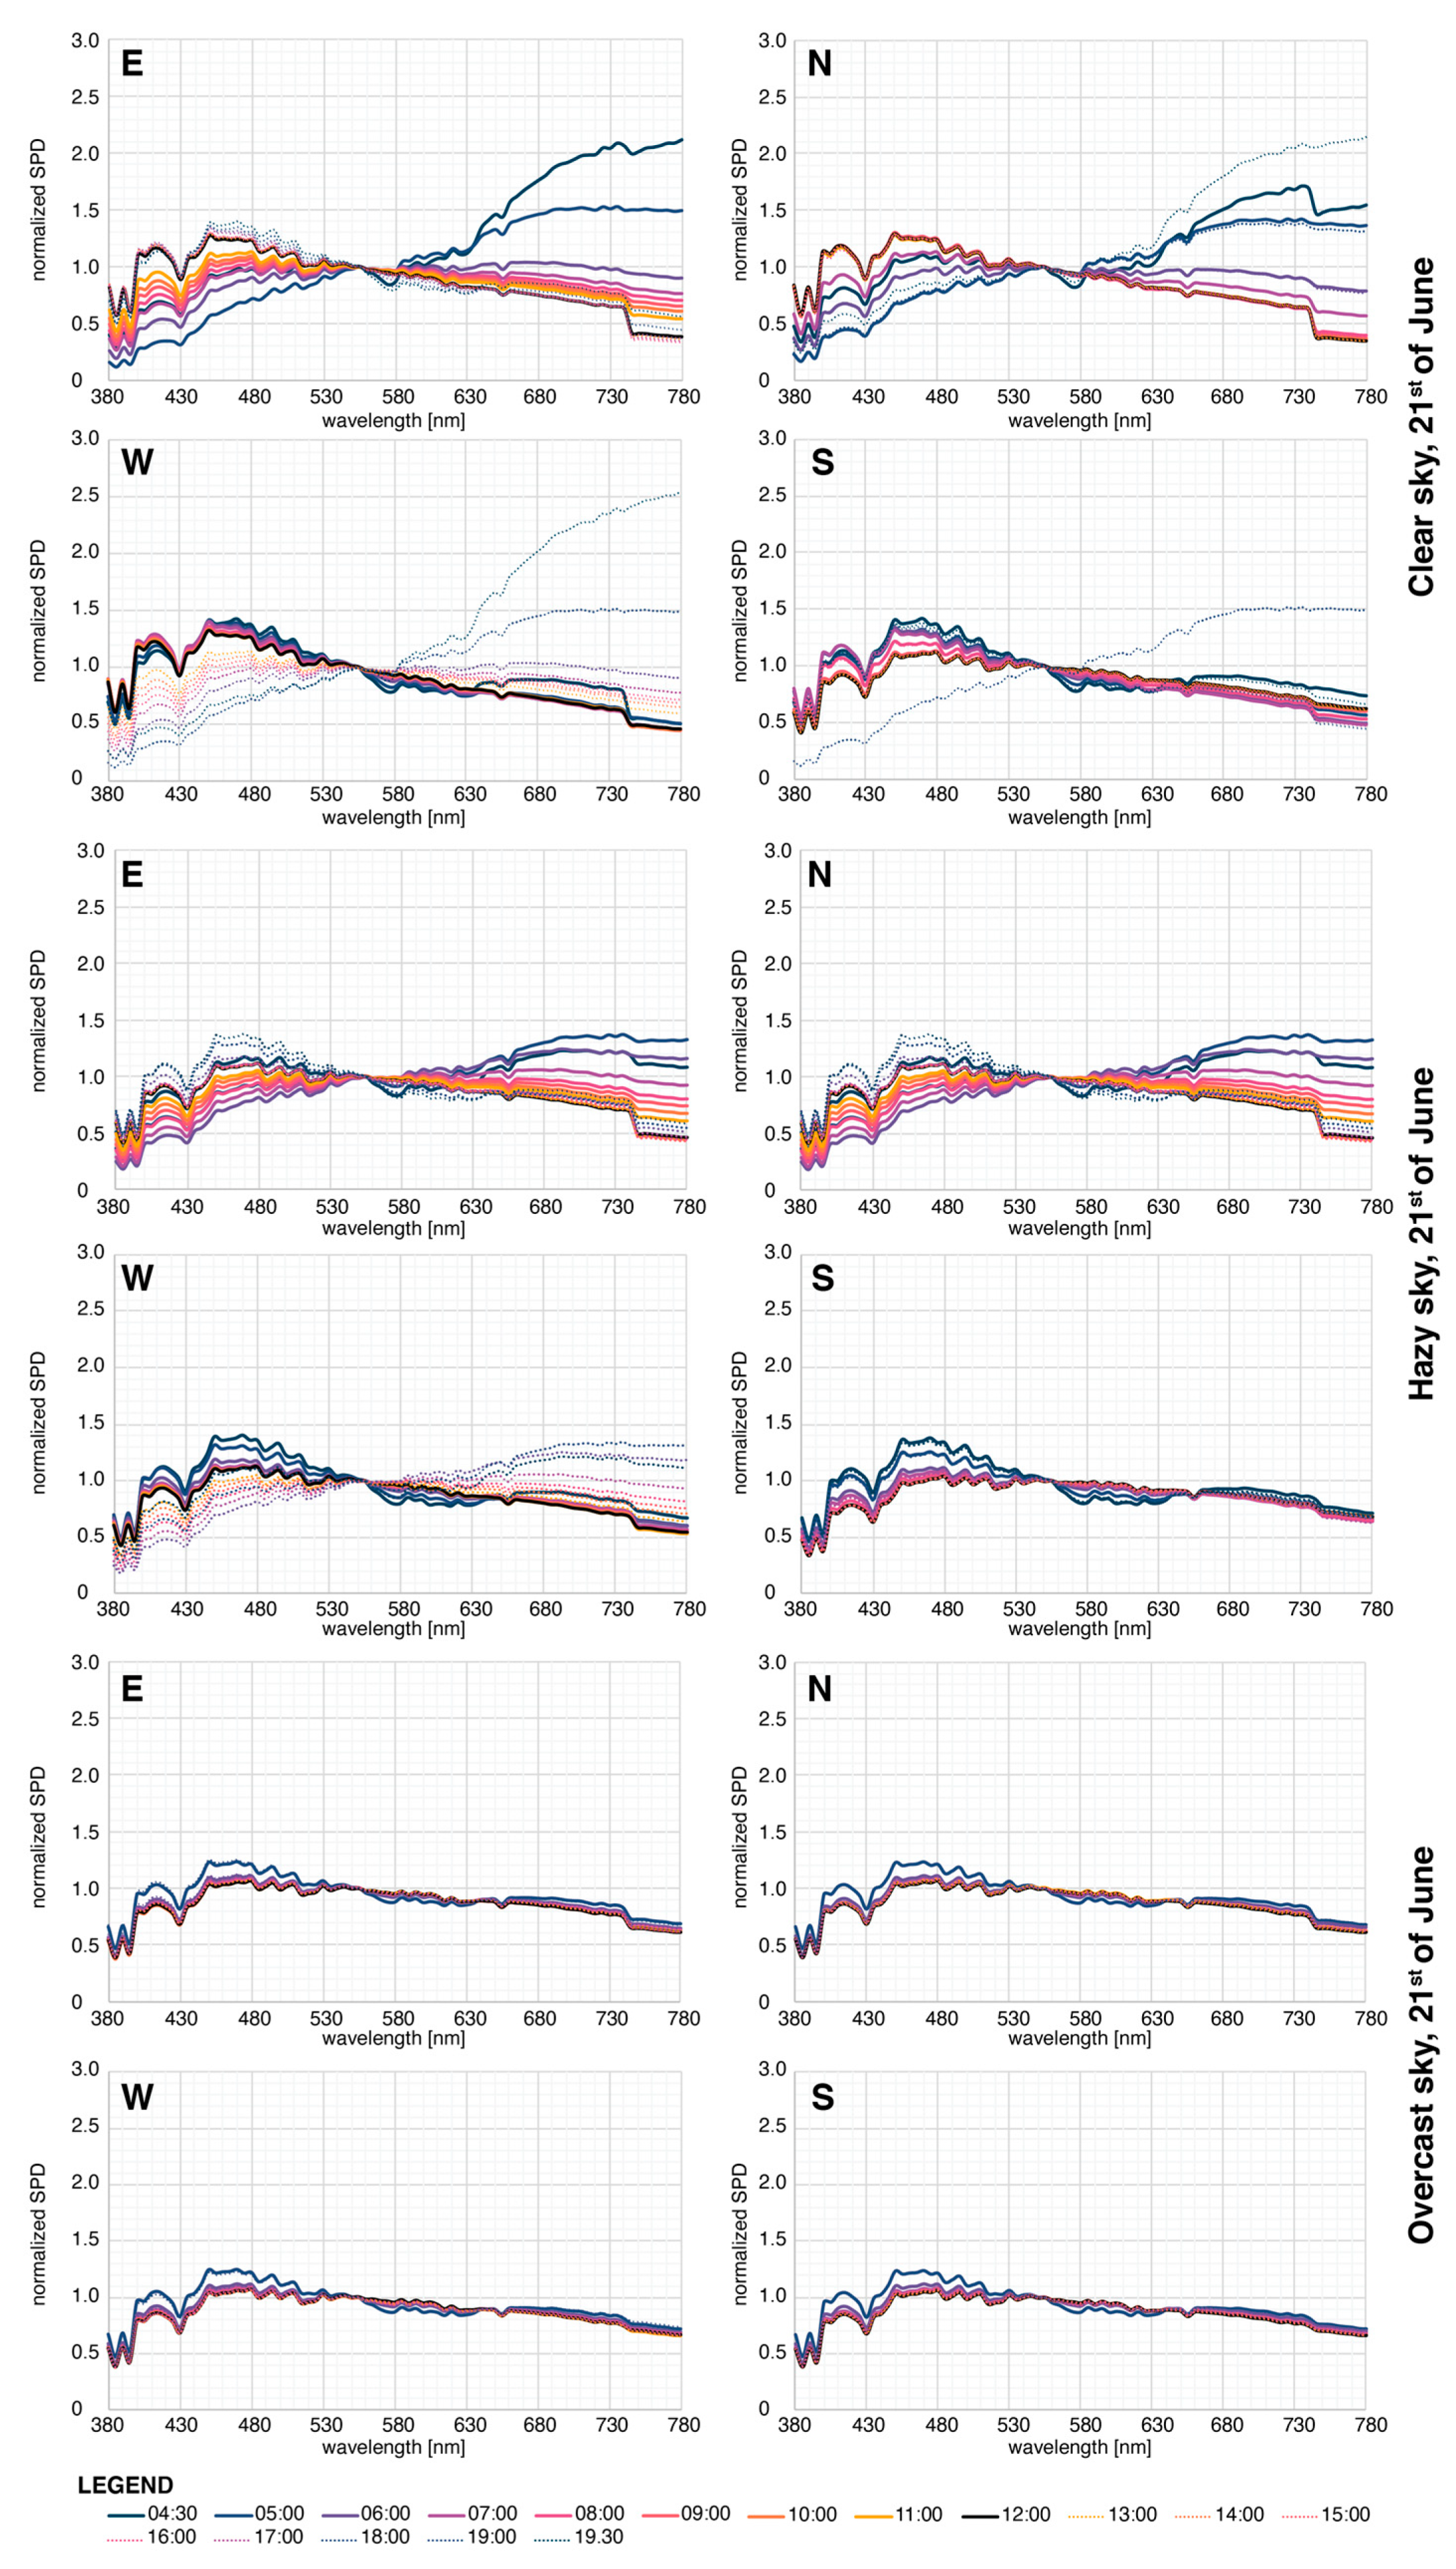
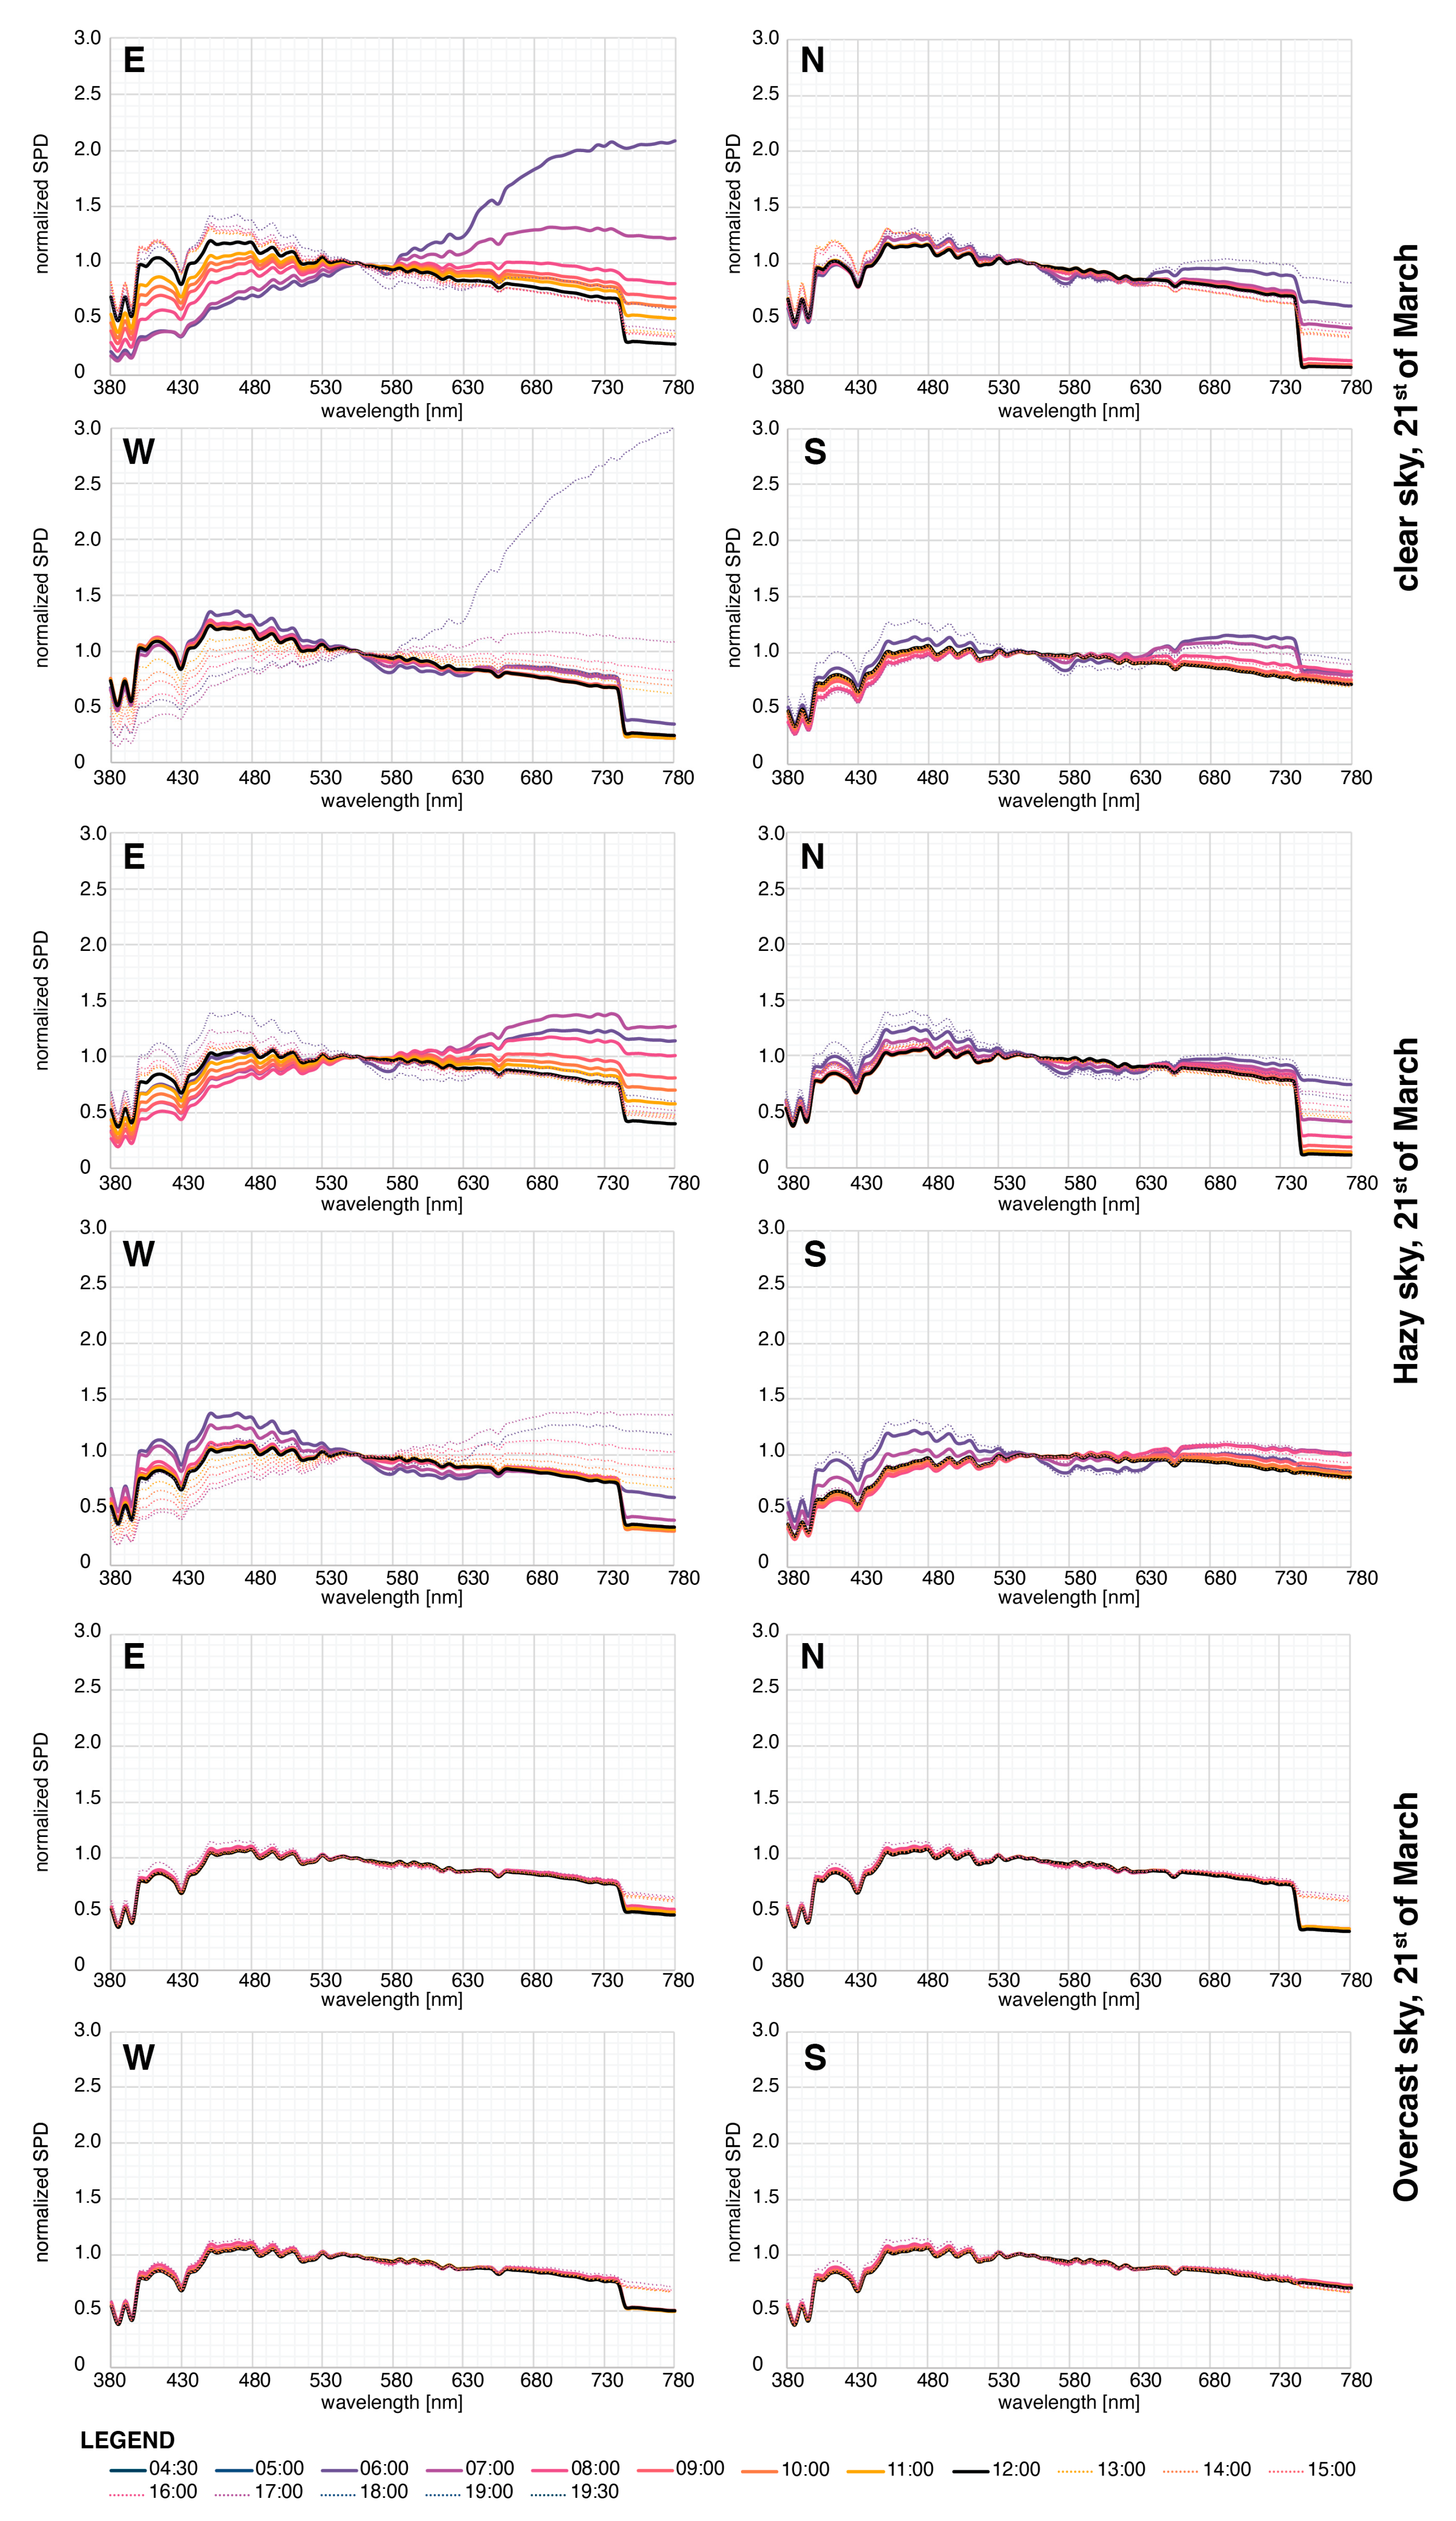
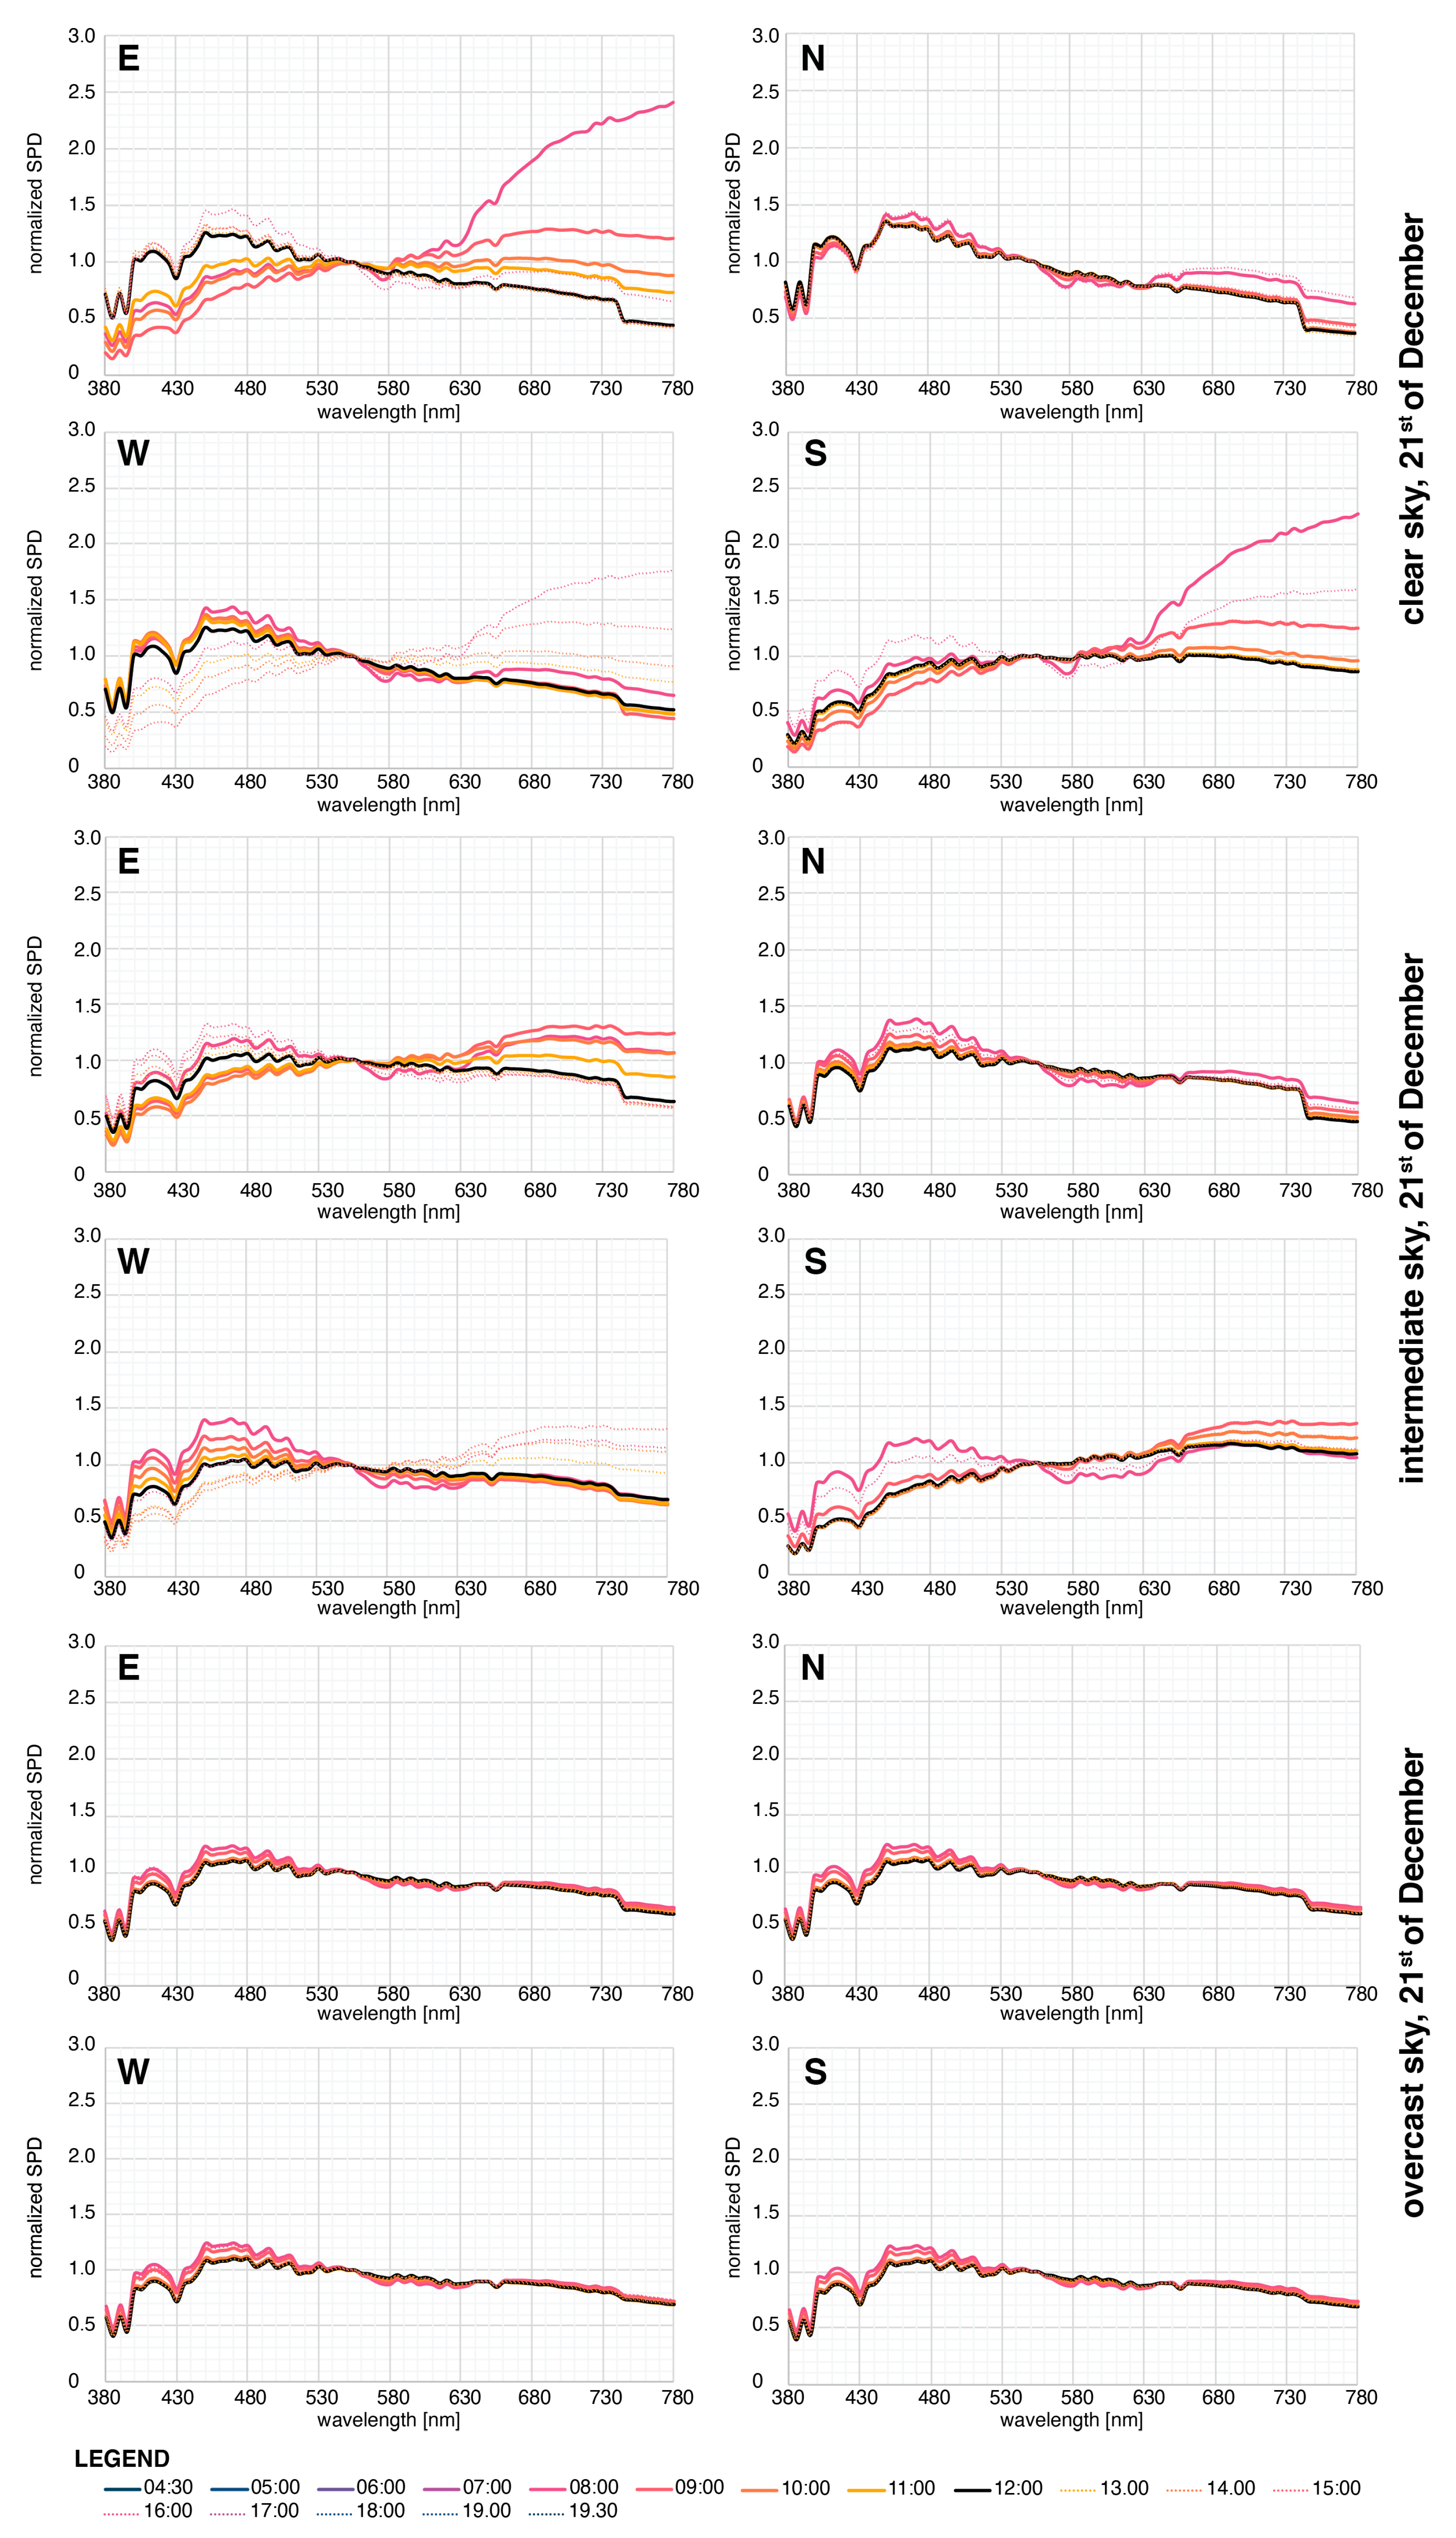
3.1.1. Clear Sky Conditions

The average ACP and CA results for the entire sensor point grid, four office orientations and neutral, warm and cold cycles under clear sky conditions are presented in Figure 4. The results show that RCEs of the OS office under a neutral cycle (i.e., spectrally neutral walls) are above 1.0 for all daylit hours (ACP = 100%) and all view orientations on June and March 21st. Under such conditions, the photopic methodology can evaluate compliance with circadian requirements. On the other hand, the OS office has the overall lowest ACP during December 21st, with the absolute lowest average of 54.6% (tRCE = 4.64 h) at an Az = 180° (i.e., view facing away from the window) among all cases of the neutral cycle (Figure 4). The ON office contrasts these results with an average ACP of 100% for all view orientations during December and March 21st and the lowest ACP during June 21st. In the latter case, the lowest average ACP of 88.8% (tRCE = 13.3 h) is achieved at an Az = 180° (Figure 4). As for the east (OE)- and west (OW)-oriented offices, the results of the neutral cycle lie between those of the OS and ON cases.
Turning our attention to the results of the warm cycle (i.e., OS-coloured walls), a significant reduction in average ACP can be seen for all office and view orientations (Figure 4). The most significant impact of changing the wall colour to OS can be observed at an Az = 180° for all dates and office orientations, while the most negligible impact is in the case of the window-facing view (Az = 0°). The most significant change compared to the neutral cycle can be observed for the OS office, with an Az =180° on December 21st, where the average ACP was reduced by 53 percentage points (pp). Therefore, in the above case, there is an insignificant average ACP of only 1.8% (tRCE = 0.13 h, i.e., 8 min) when the non-visual environment could be assessed based on photopic illuminances. On the other hand, comparing the cold and neutral cycles results shows that the average ACPs of all offices and view orientations are significantly higher when BS colour is used on the walls. Specifically, all achieved ACPs were higher than 93.5% (tRCE = 13.95 h), which was the lowest value of the cold cycle simulations achieved for the ON office at an AZ = 180° on June 21st (Figure 4). Thus, the compliance with the non-visual requirements of the cold cycle could be estimated during all days and for all offices and view orientations by applying the photopic illuminances alone, except for a small portion of the day (i.e., <1.0 h) when ACPs do not reach 100%.

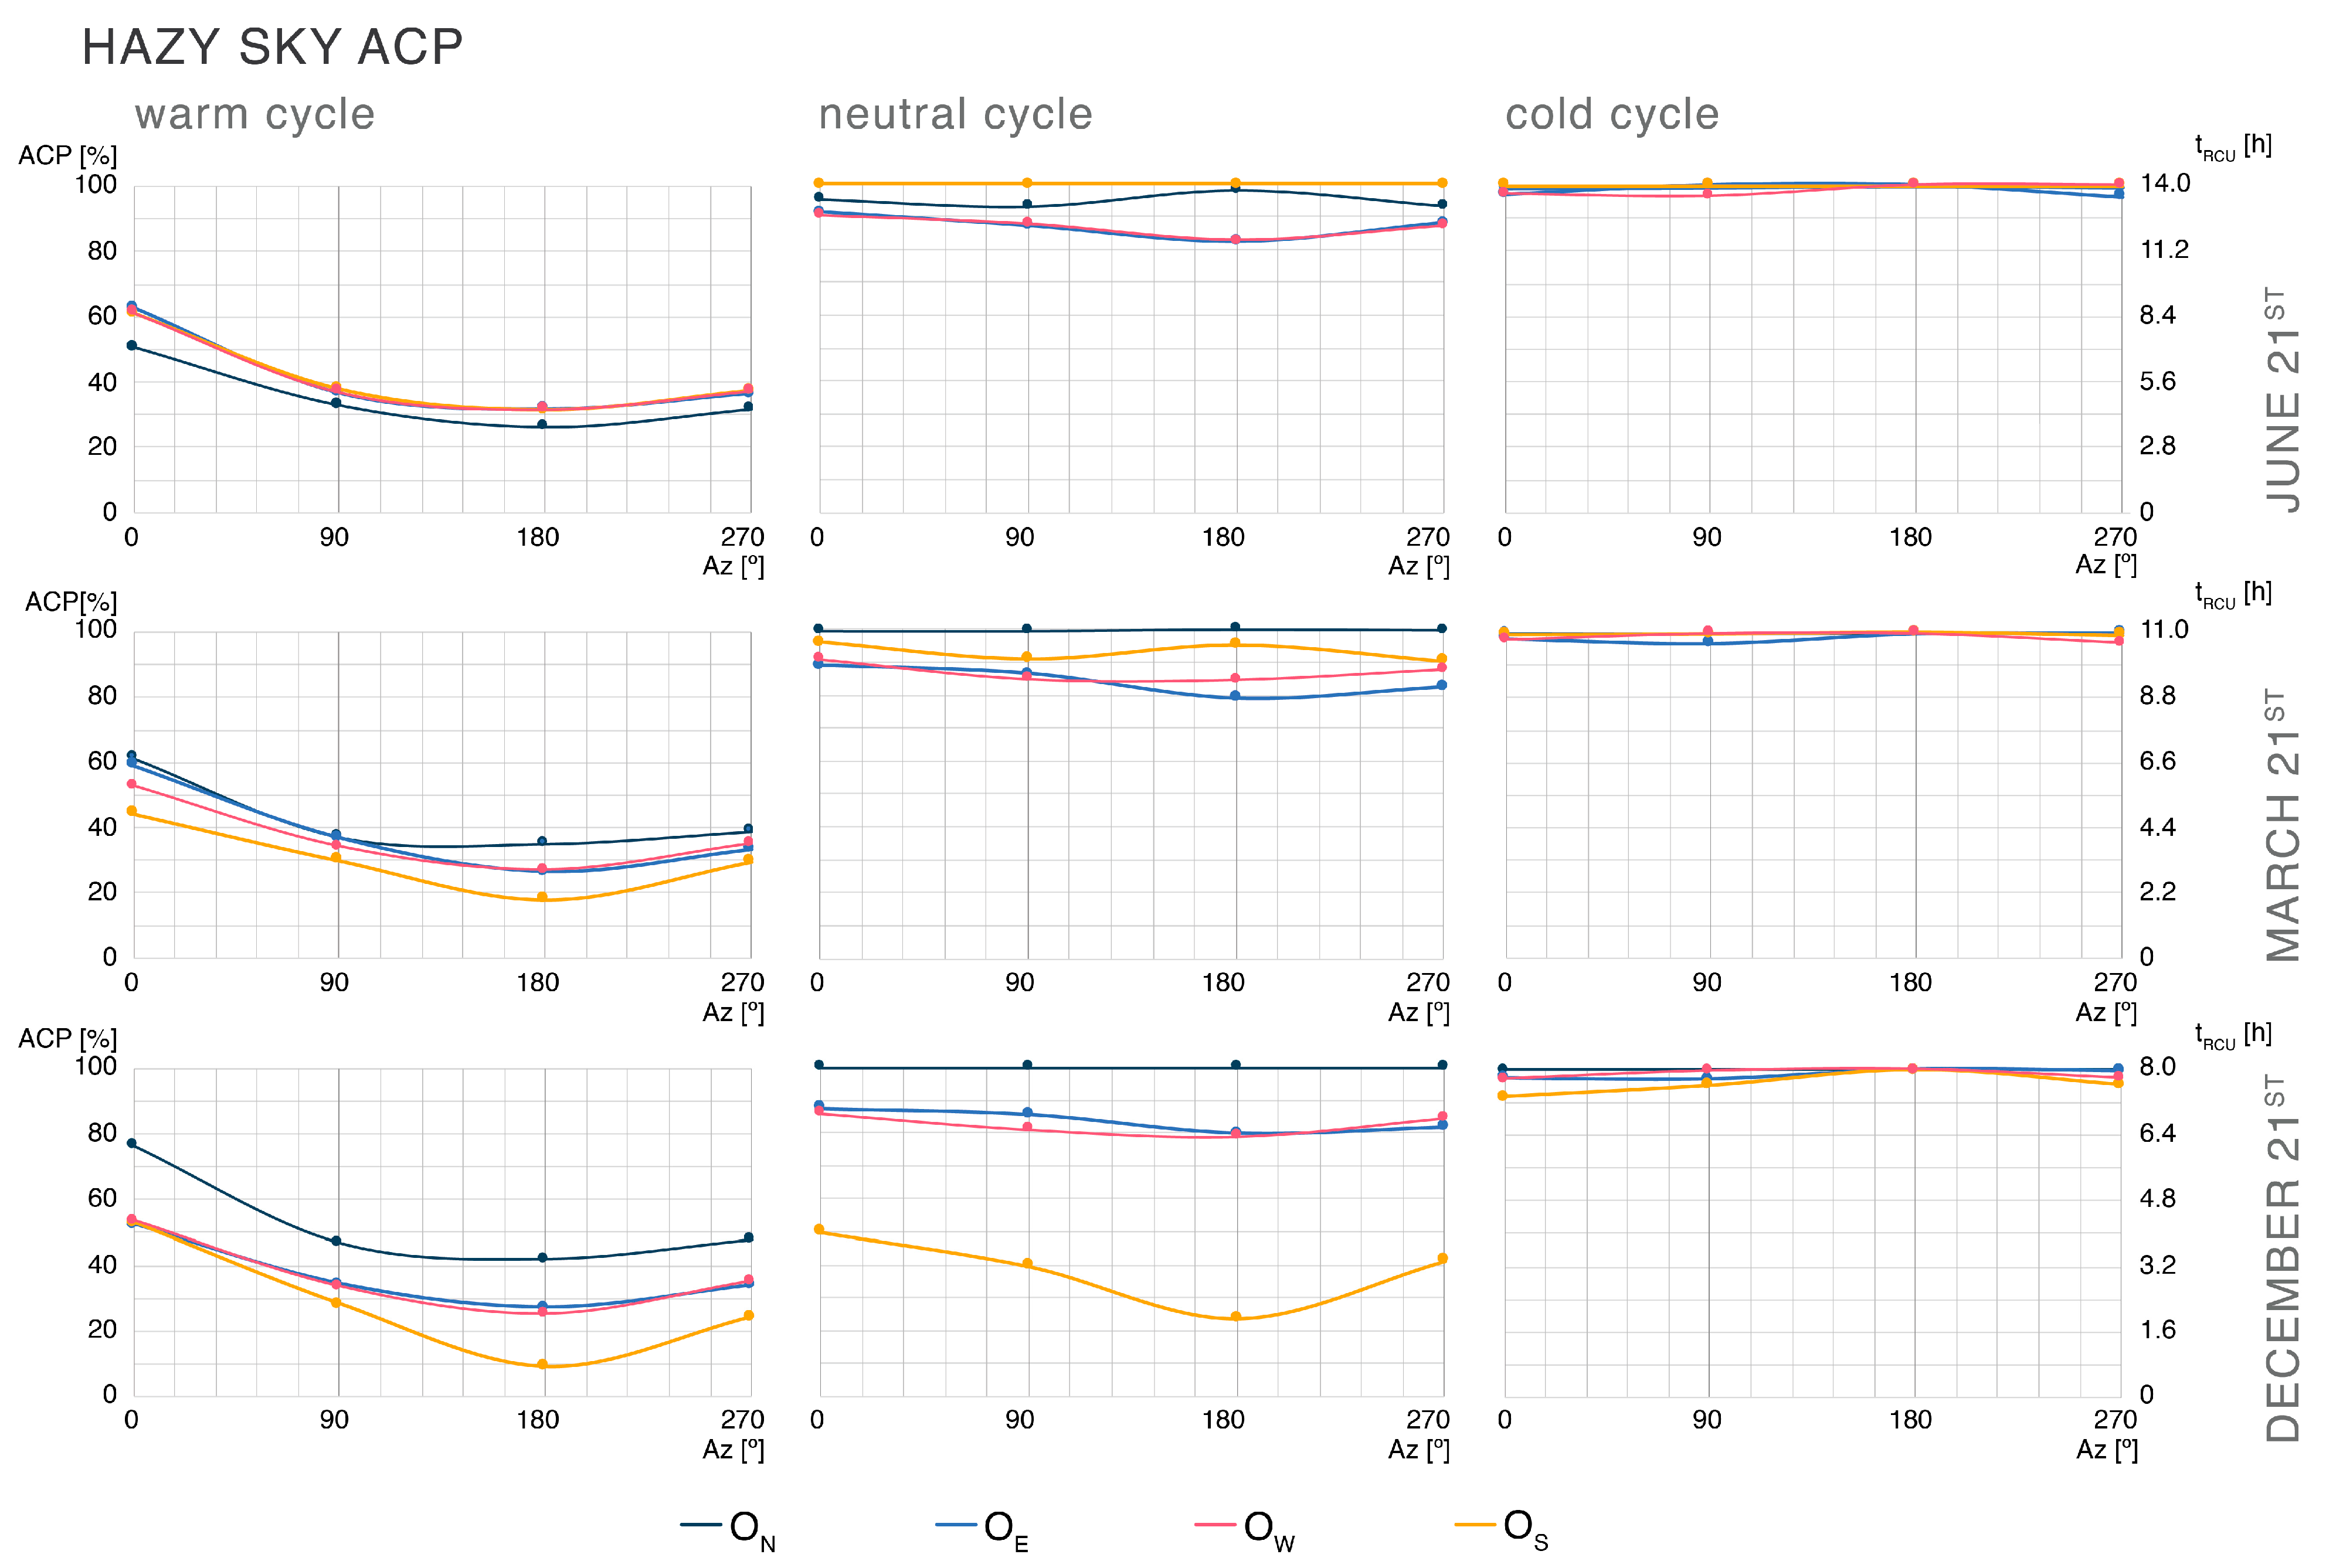
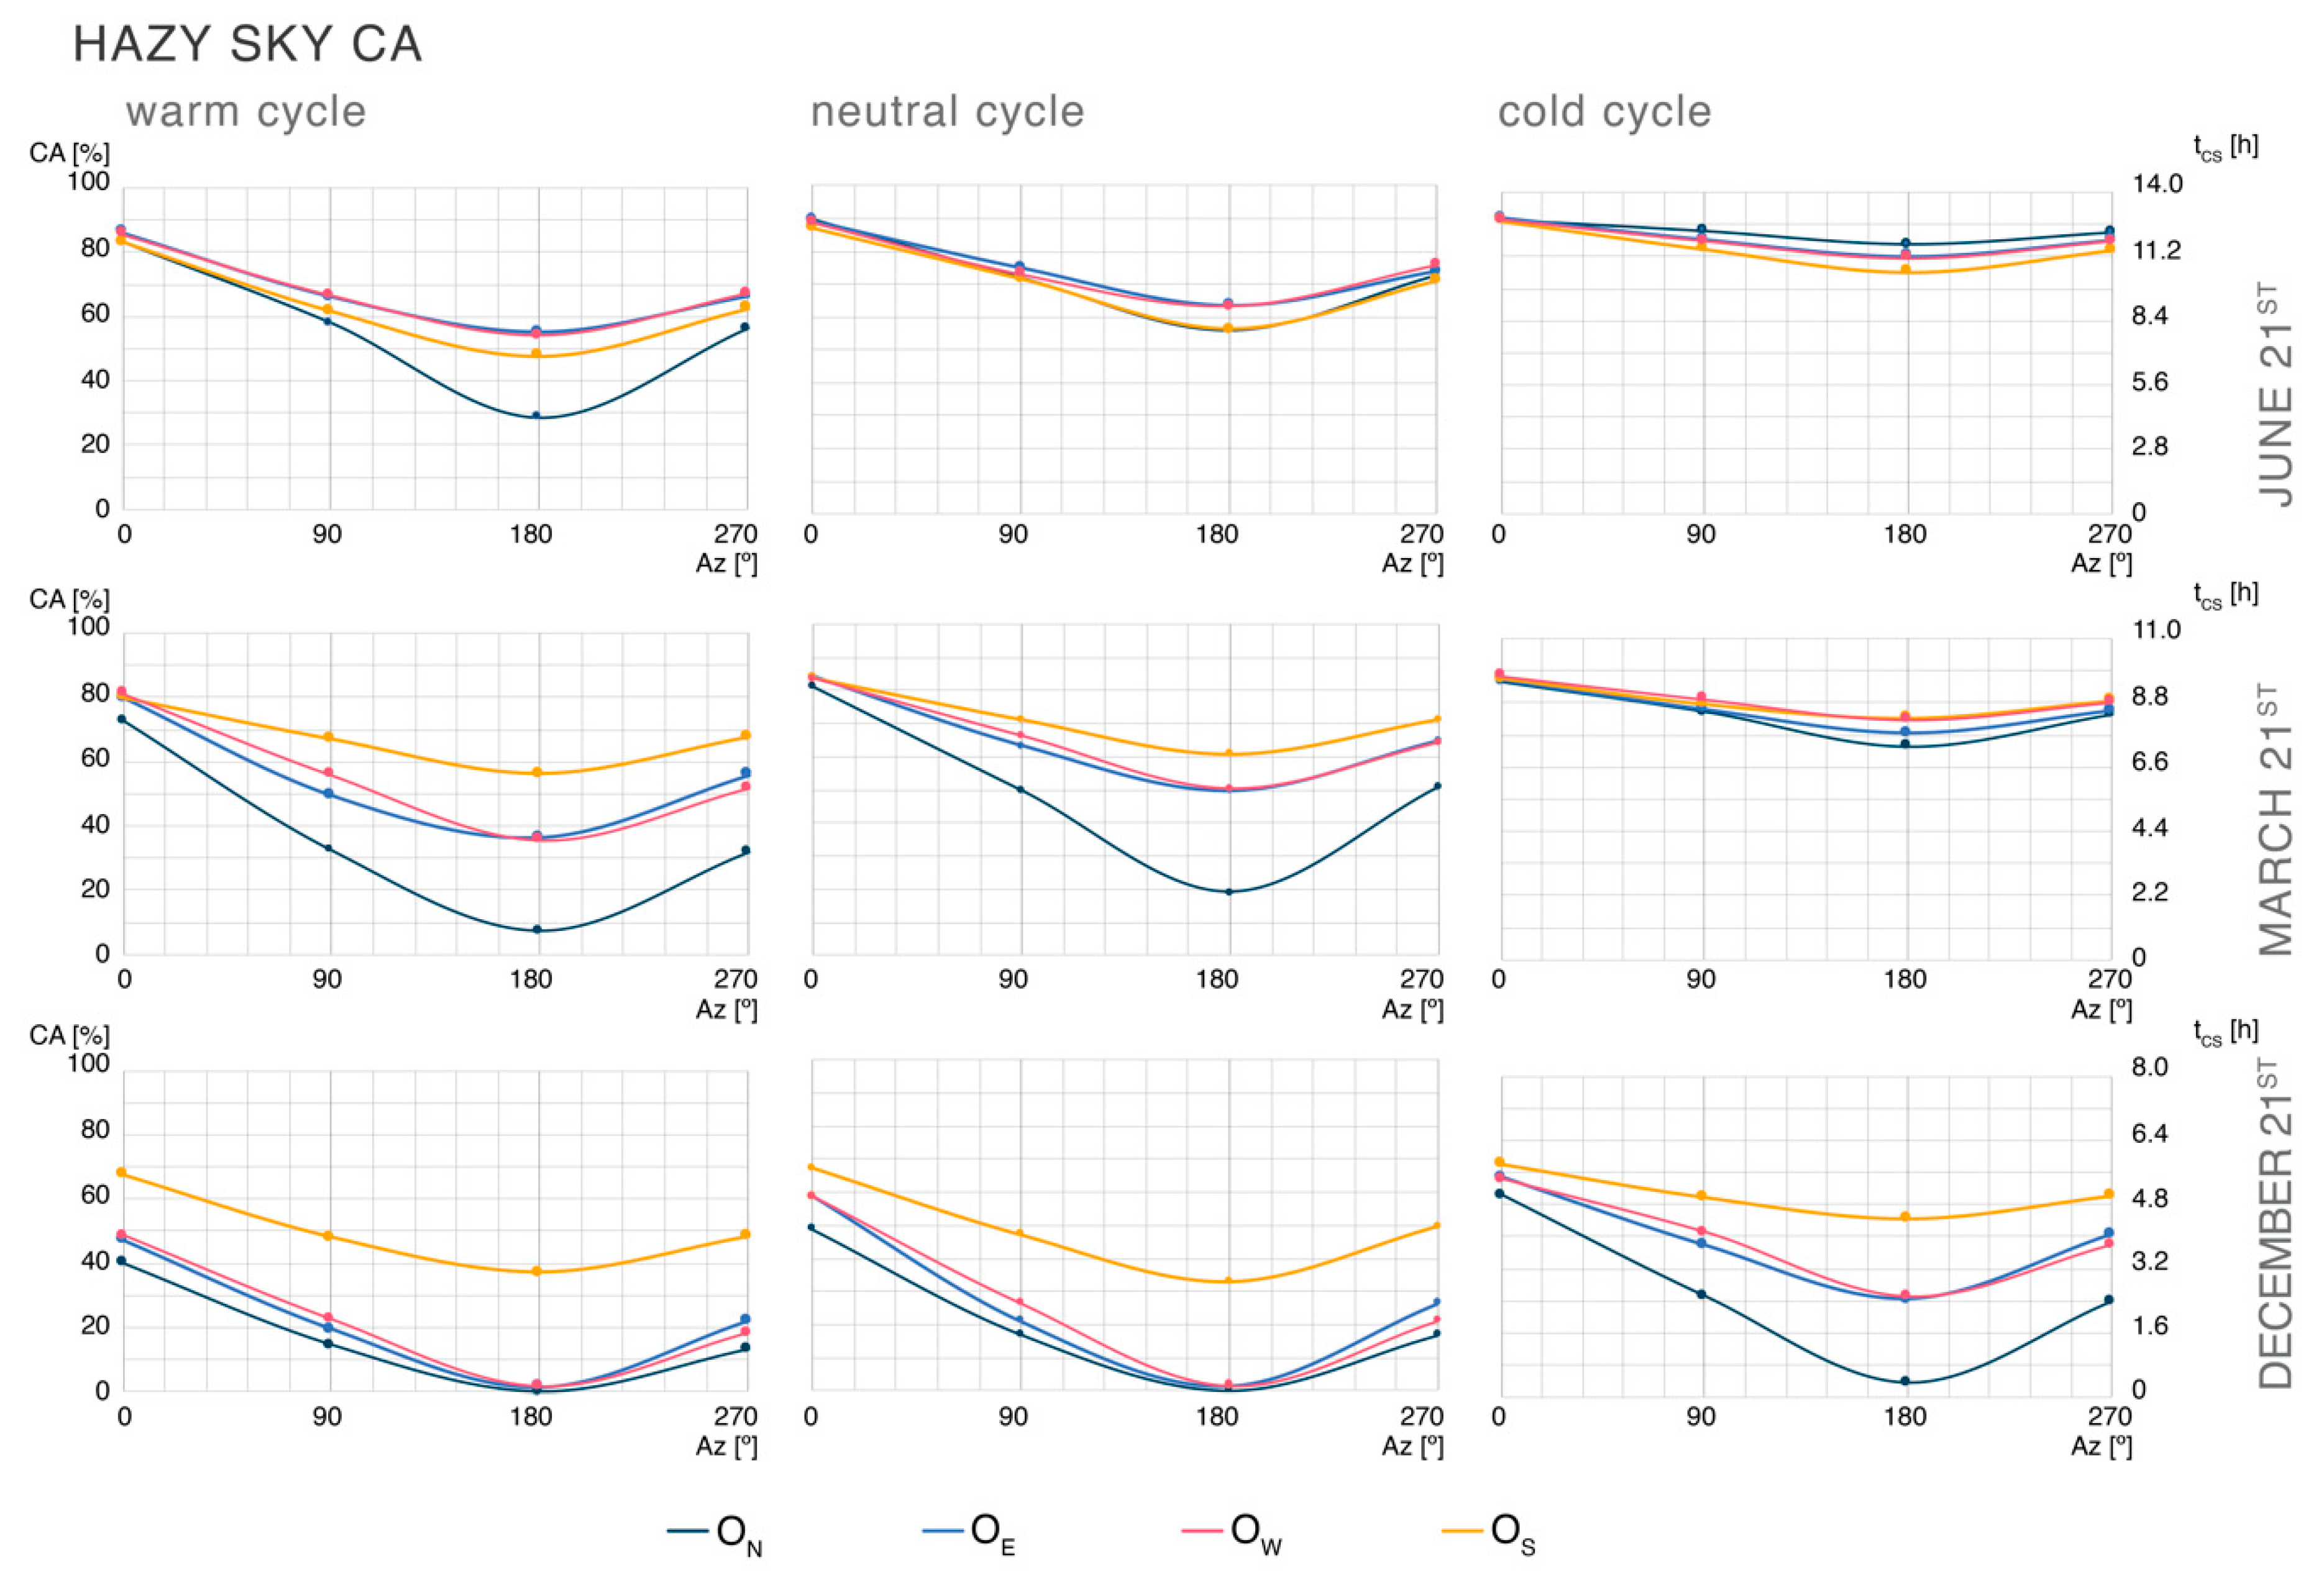
3.1.2. Hazy Sky Conditions

Figure 5 presents average ACP simulation results under hazy sky conditions. Comparing these results to clear sky conditions (Section 3.1.1), it becomes evident that a change in the sky typology inherently reduces the ACP values. However, similar to the clear sky simulations, the highest average ACP of 100% for the neutral cycle is reached during December and March 21st for the ON office and June 21st for the OS office (Figure 5). Furthermore, the same trend holds for the lowest average ACPs (ranging from 23.6%, tRCE = 1.88 h at an Az = 180° to 50.0%, tRCE = 4.0 h at an Az = 0°) in the case of the OS office on December 21st and vice versa for the ON office. Further examination of the neutral cycle results shows that the compliance to the non-visual requirements can be evaluated using photopic illuminance for a minimum tRCE = 12.3 h (ACP = 82.0%) on June 21st and tRCE = 8.7 h (ACP = 79.9%) on March 21st (OE office, Az = 180°). However, on December 21st photopic illuminance can be used to check the non-visual compliance for at least 1.8 h (ACP = 22.5%), as is the case of the OS office at an Az = 180°.
Overall, the average ACP increases or decreases when the wall colours are changed from spectrally neutral to either BS (cold cycle) or OS (warm cycle). The effect is similar to that seen in clear sky simulations, with less pronounced differences in view directions (Az) and minor variability in the average ACP among different office orientations. The most significant negative change concerning neutral cycle simulations in average ACP was 66.9 pp calculated for the ON office and an Az = 180° in the case of the warm cycle on December 21st. On the other hand, the most significant positive change in average ACP was 76.4 pp for the OS office and an Az = 180° on December 21st when the colours of walls were switched from GR to BS.

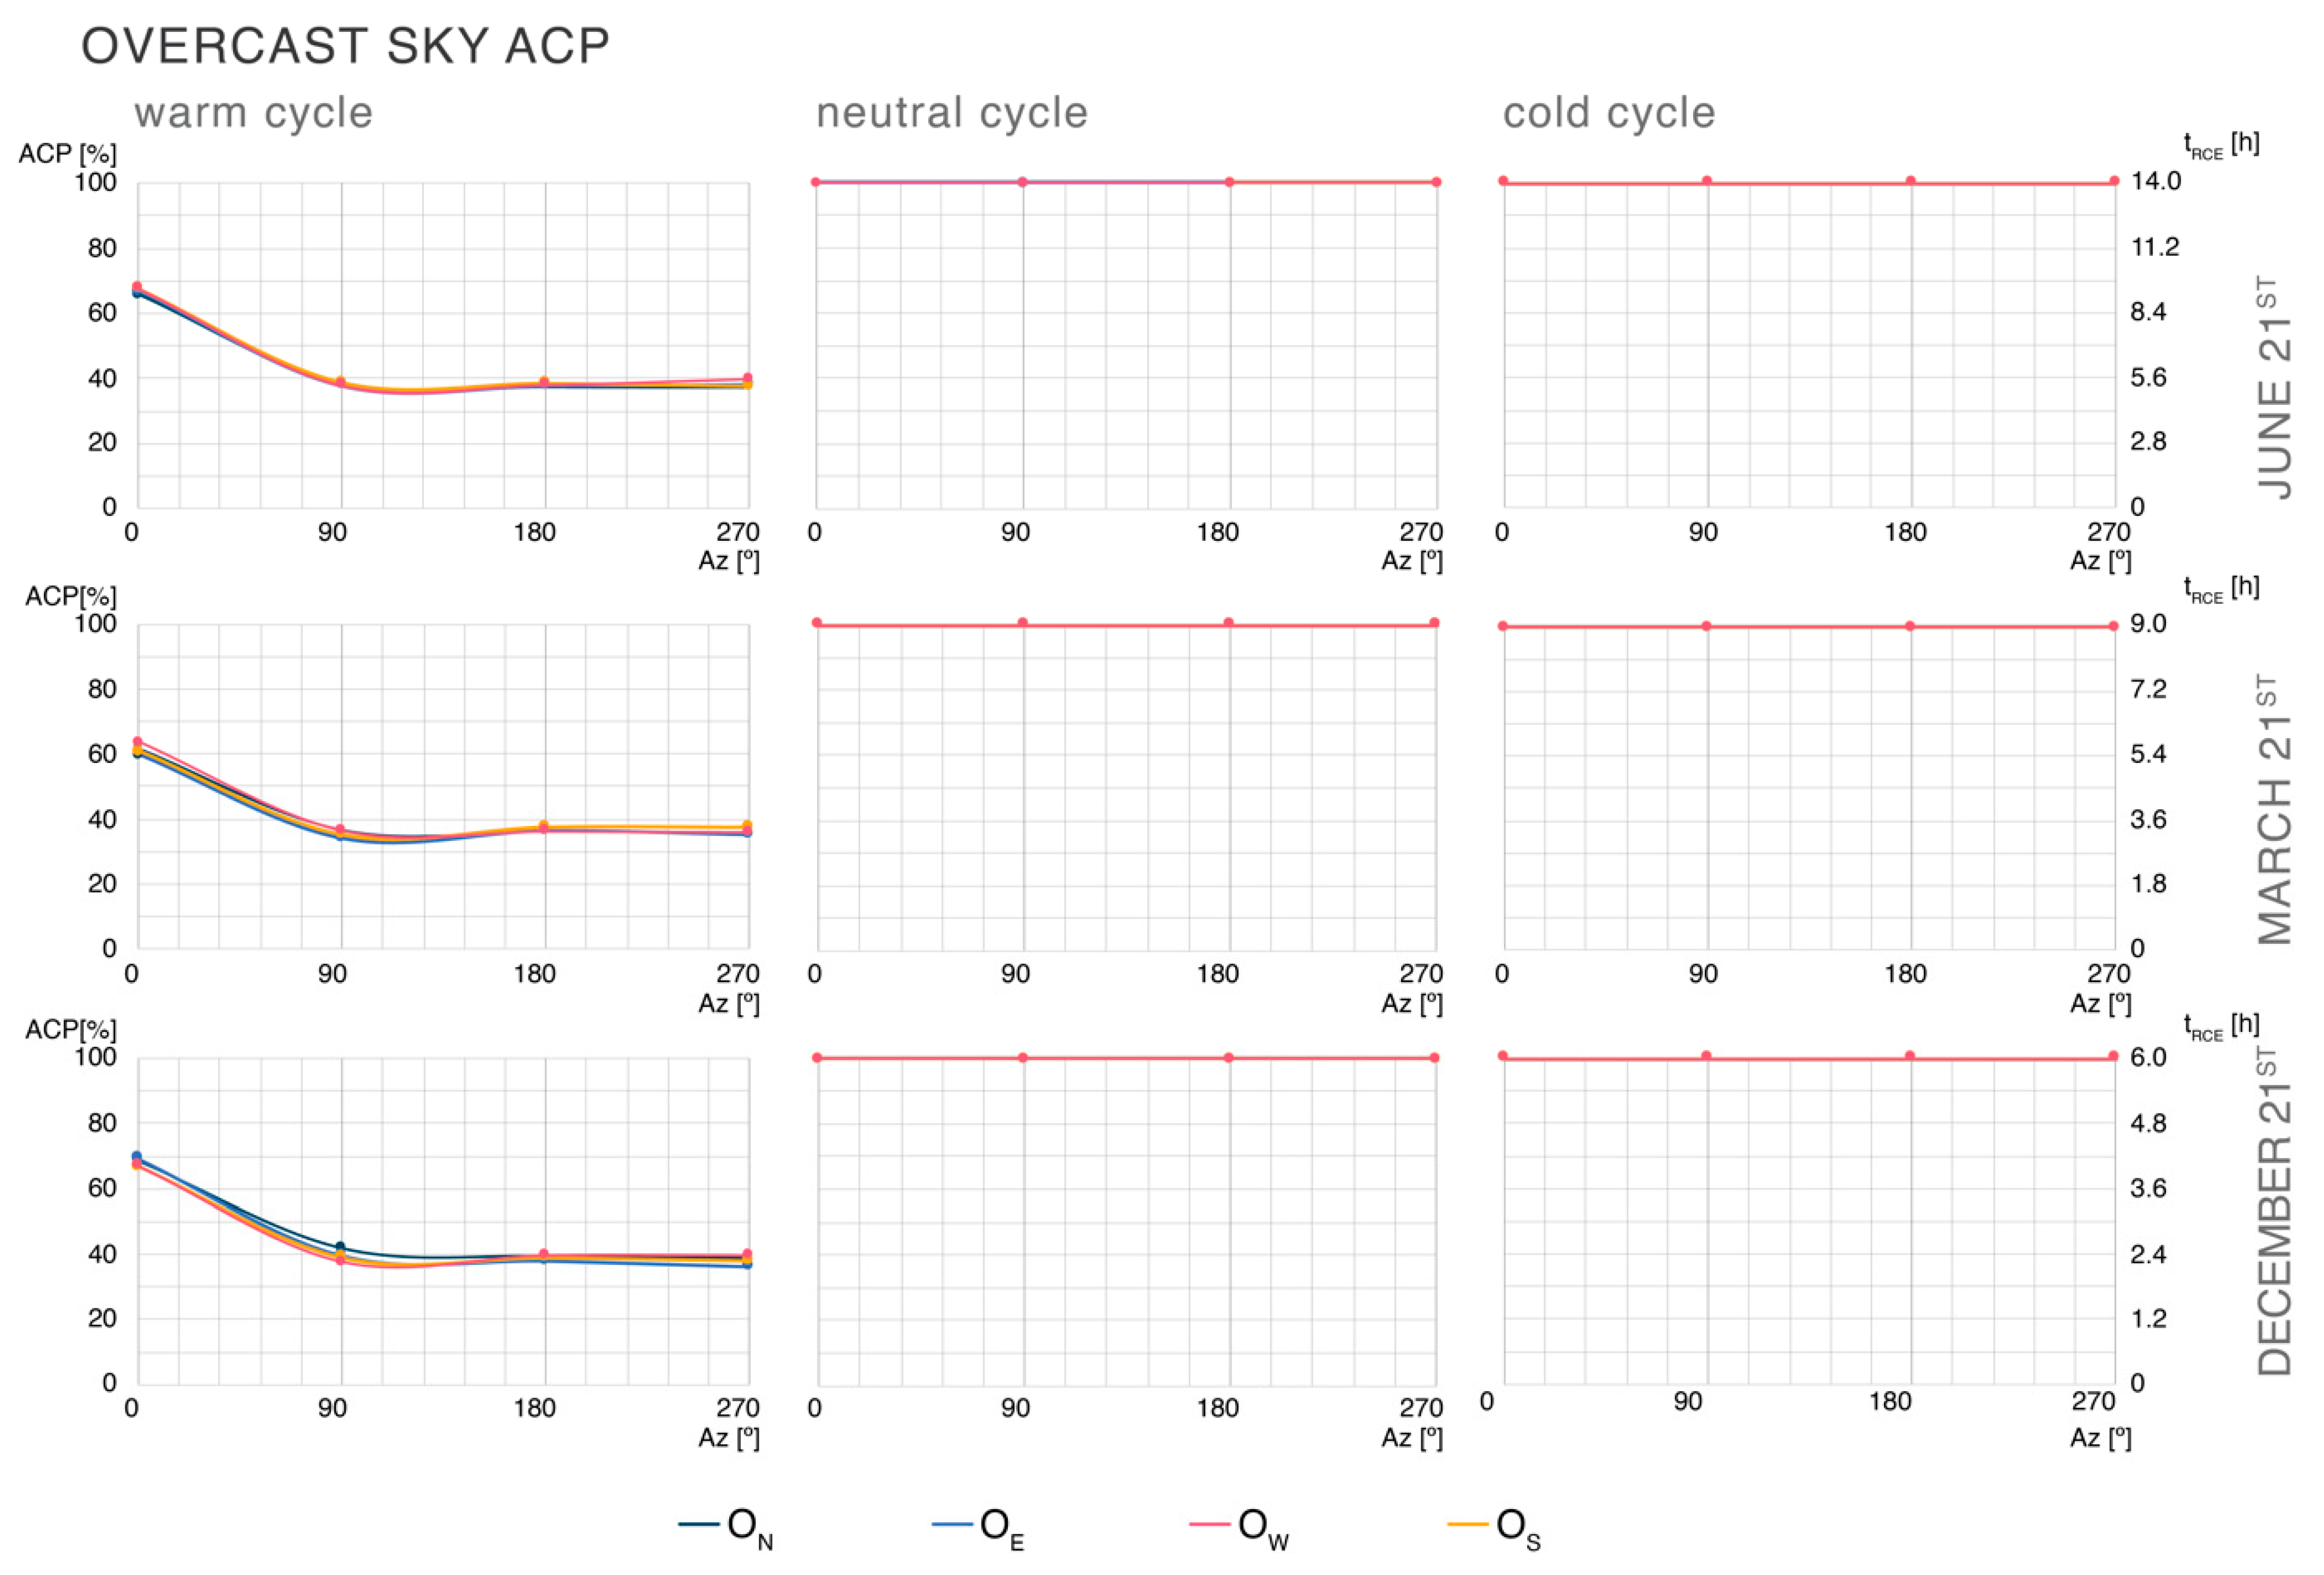
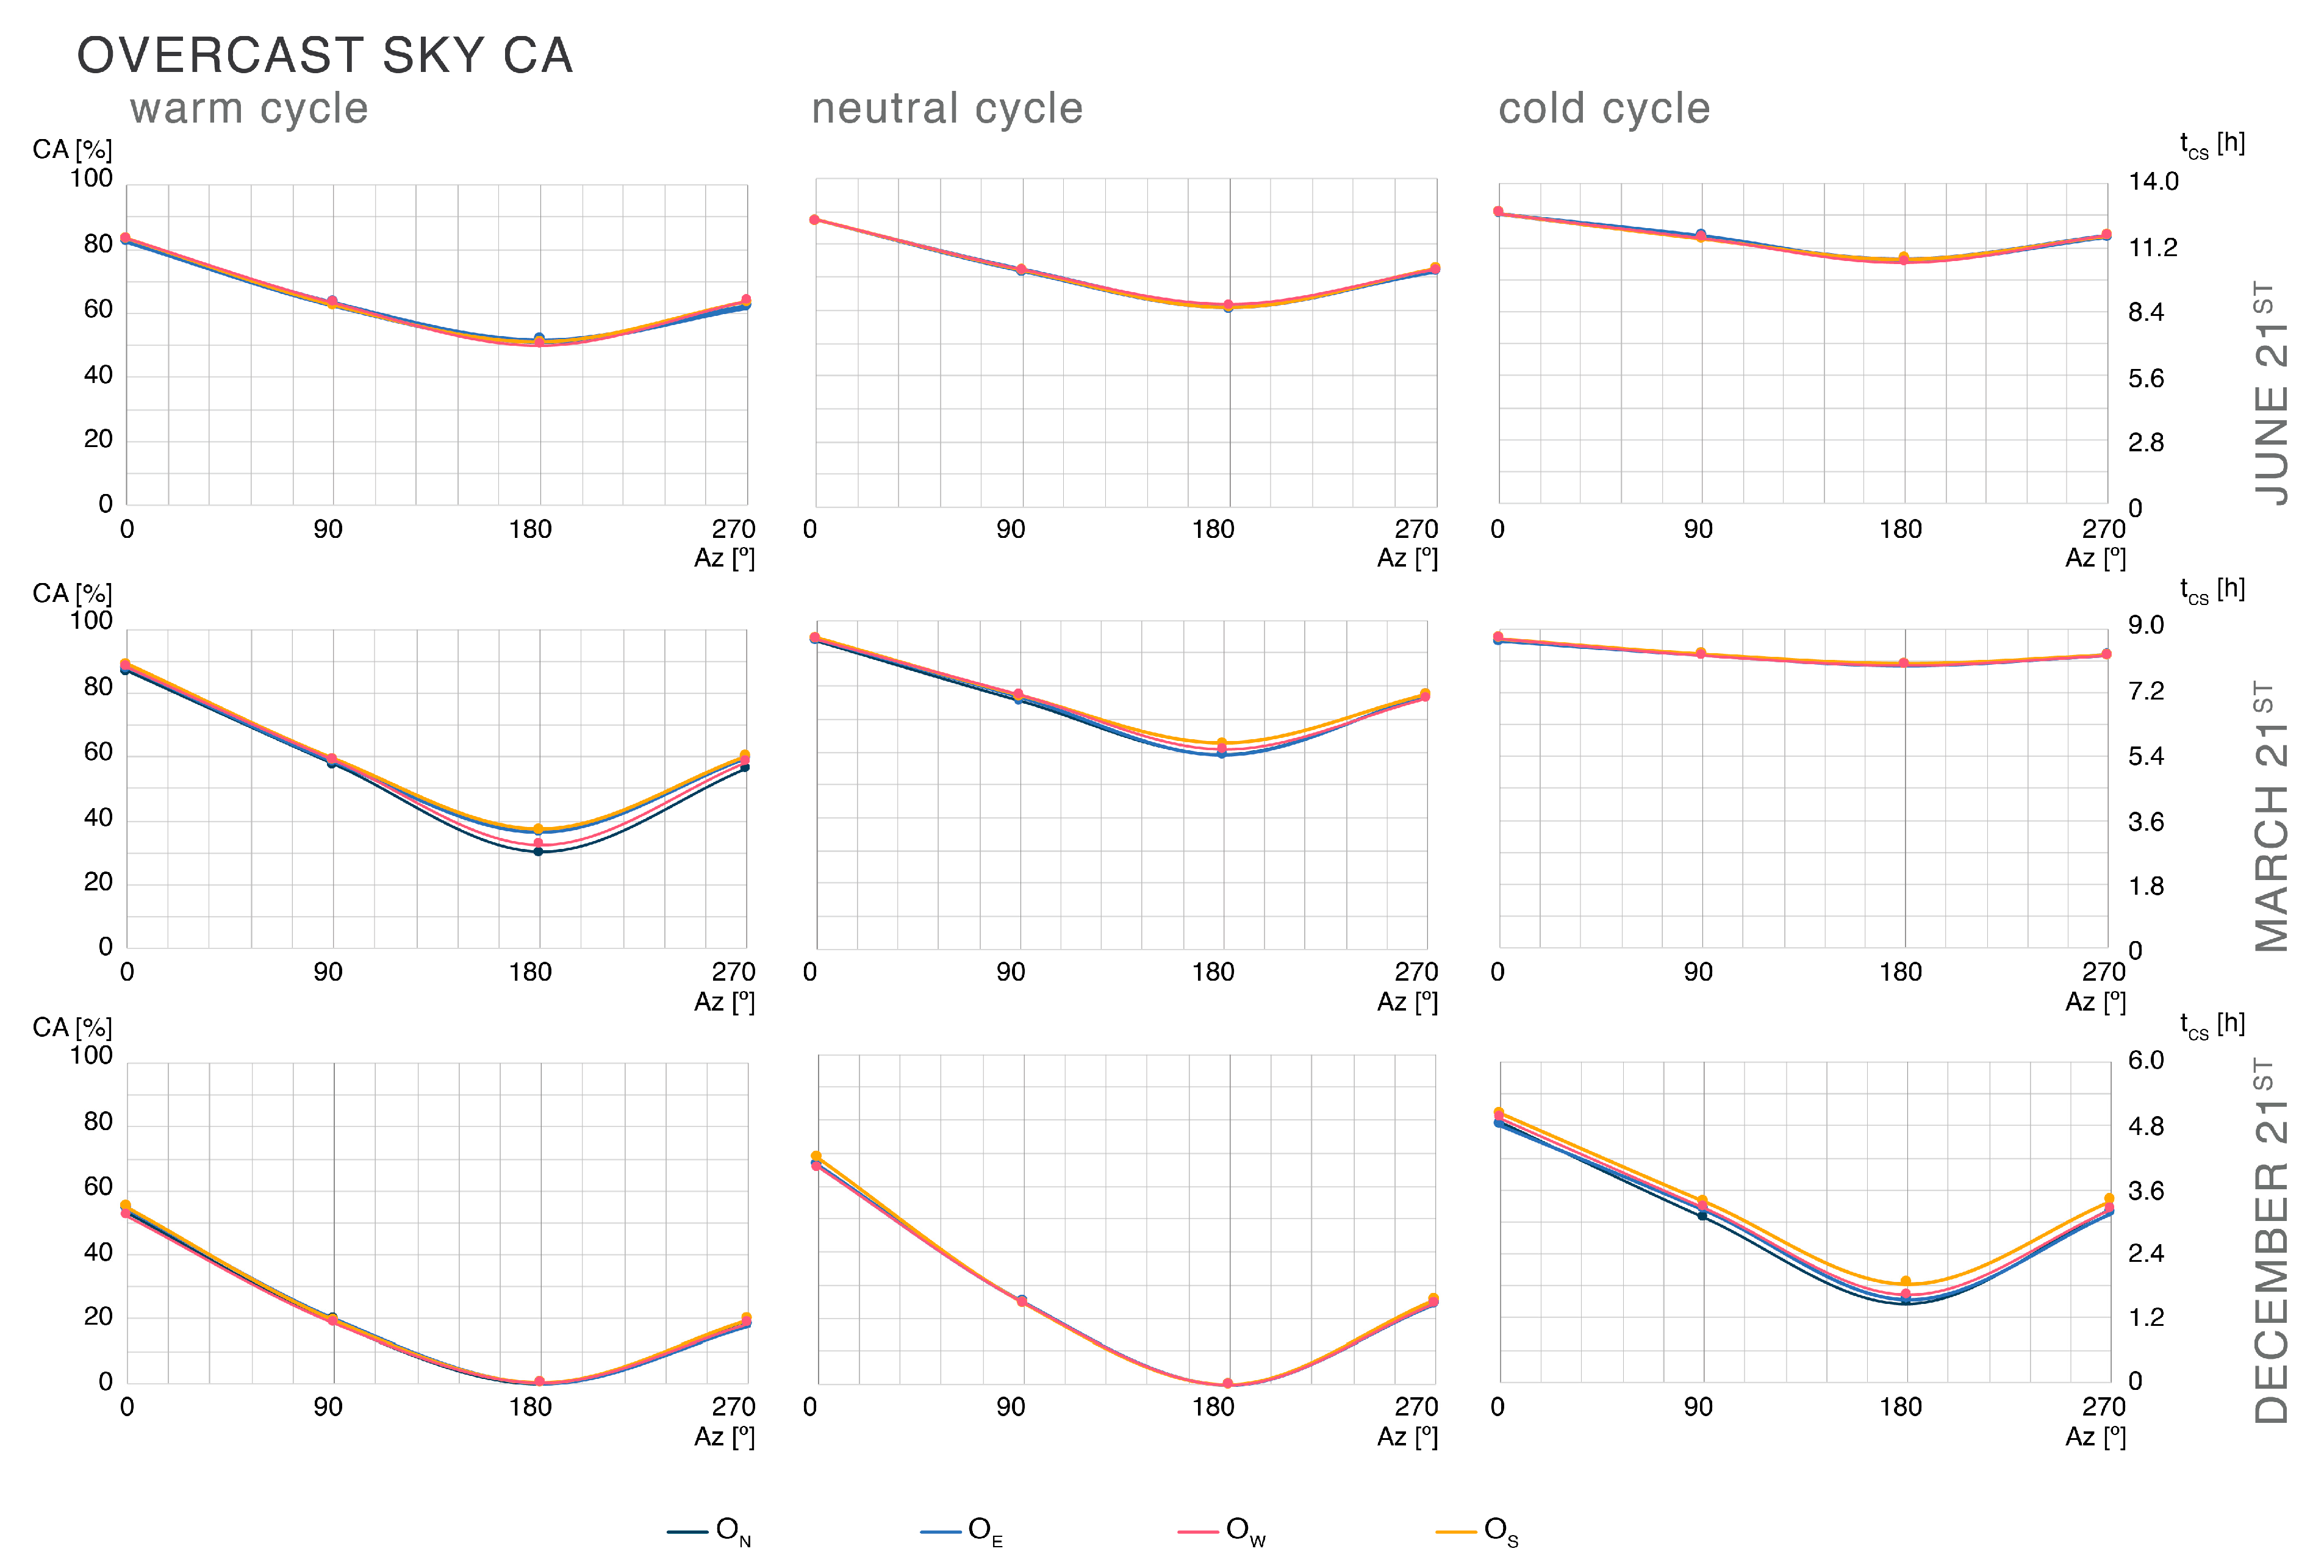
3.1.3. Overcast Sky Conditions

The simulation results under overcast sky conditions are presented in Figure 6. The results of the neutral cycle simulations confirm that regardless of the office orientation, view direction and date, under overcast sky conditions the average ACP will always be 100% (Figure 6). An analogous conclusion could already be drawn based on the RCEs of the external conditions for the overcast sky presented in Appendix A. Therefore, compliance with non-visual requirements in spaces under overcast conditions can be evaluated solely by photopic illuminances regardless of orientation, view direction and time of year. The same conclusions apply to the cold cycle simulations. However, this does not hold for the warm cycle results (Figure 6), as the average ACP substantially decreases compared to the neutral and cold cycles. The most significant difference between the neutral and the warm cycles in average ACP results is 62.5 pp for the OW office at an Az = 90° on December 21st. However, there are minimal differences in attained ACPs among other office orientations resulting from numerical errors. Therefore, for a warm cycle and overcast sky, the non-visual requirements in the office cannot be predicted only by photopic illuminances. The data presented in Figure 6 indicate that office orientation does not impact ACP, which is a direct consequence of the overcast sky type characterised by azimuthal uniformity.

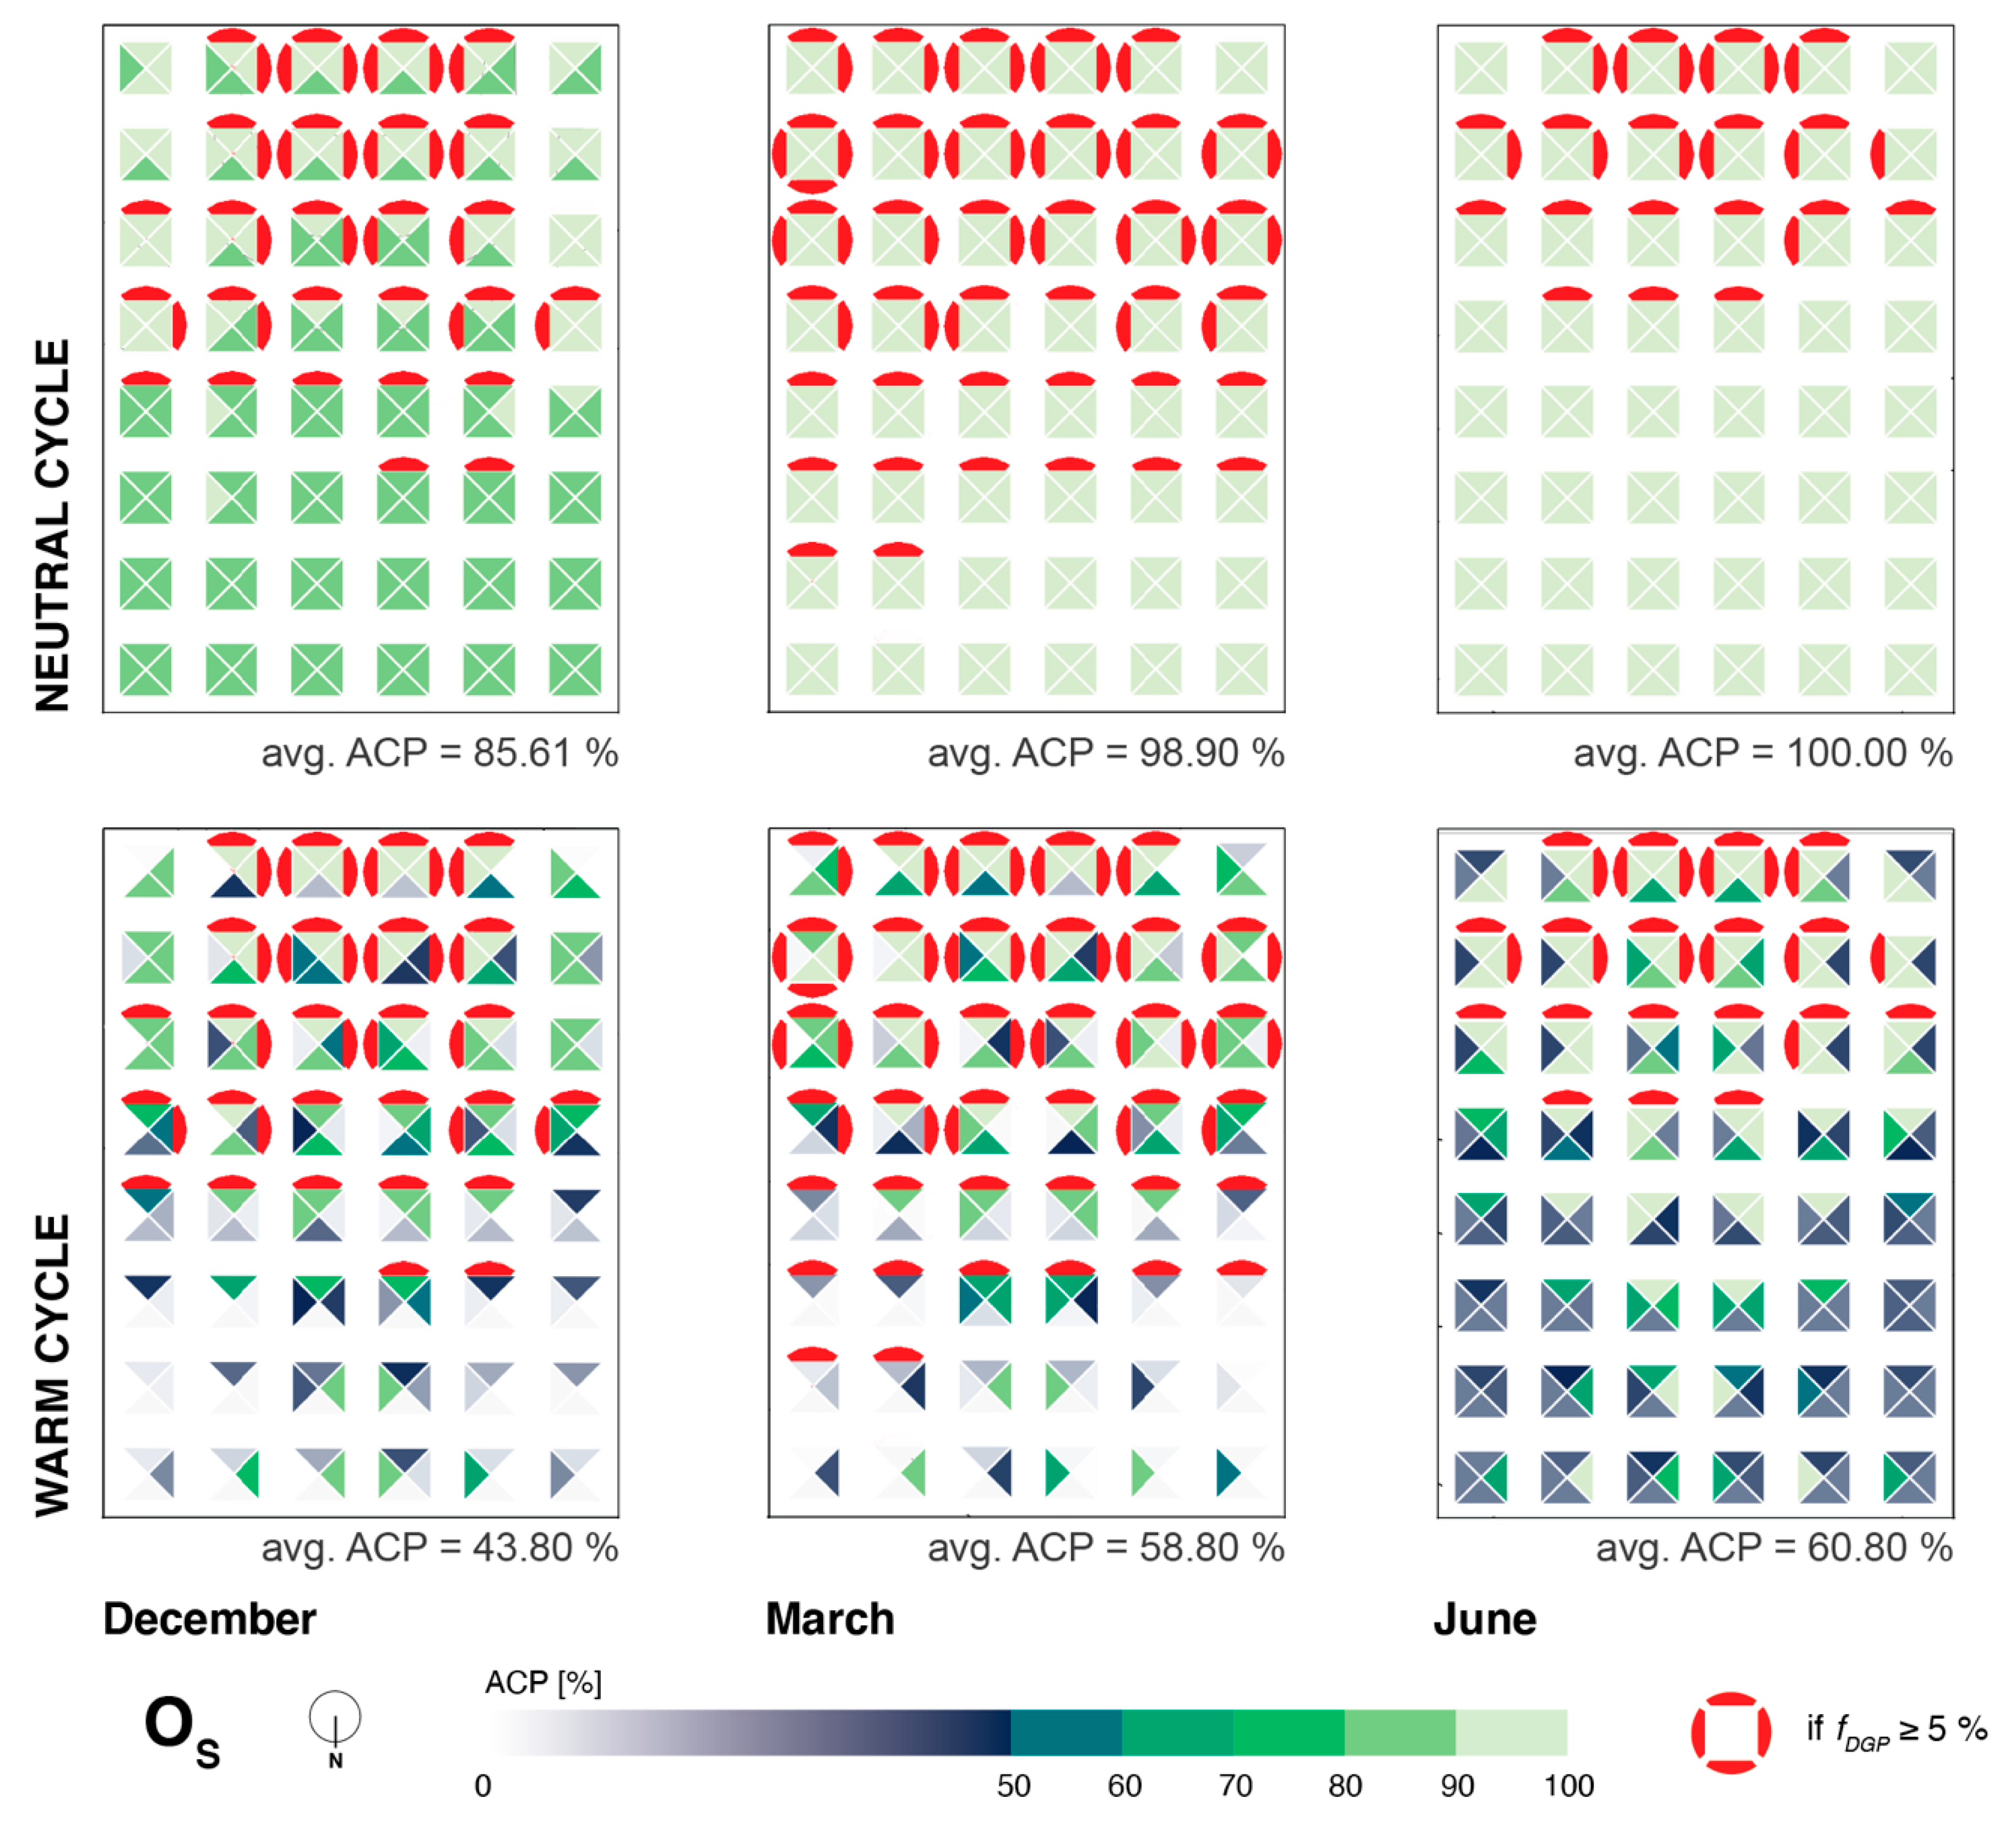
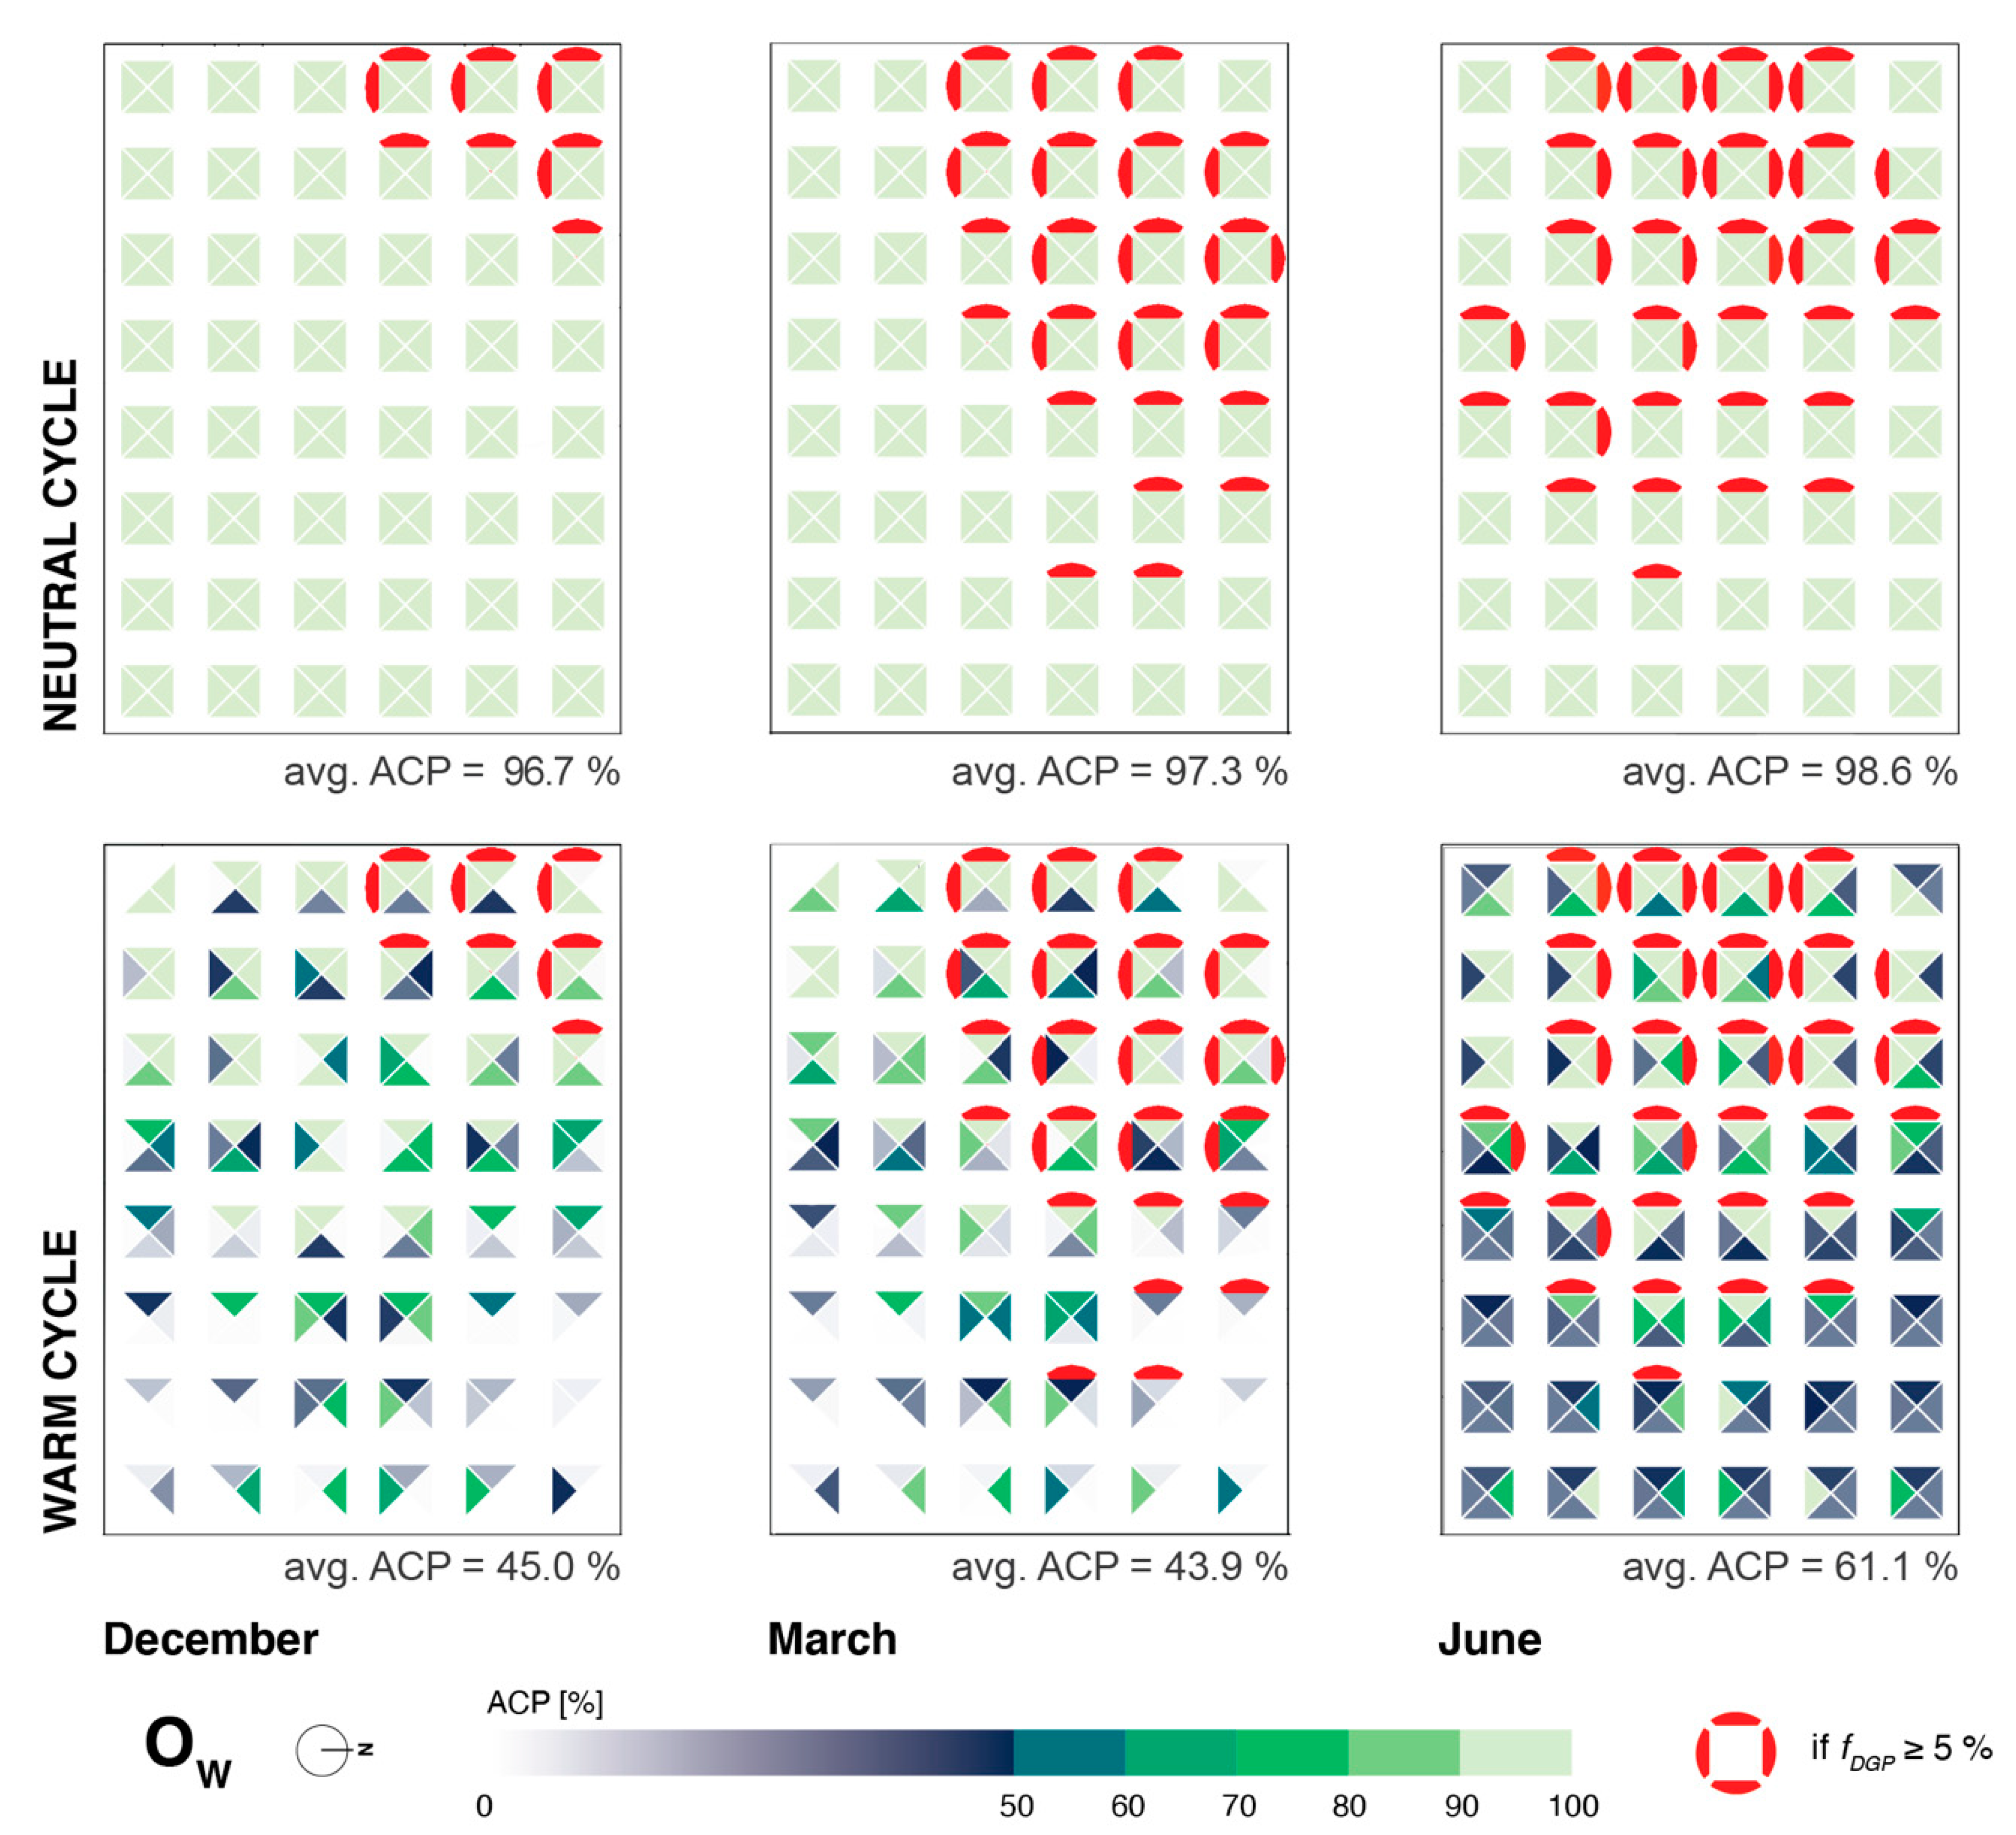
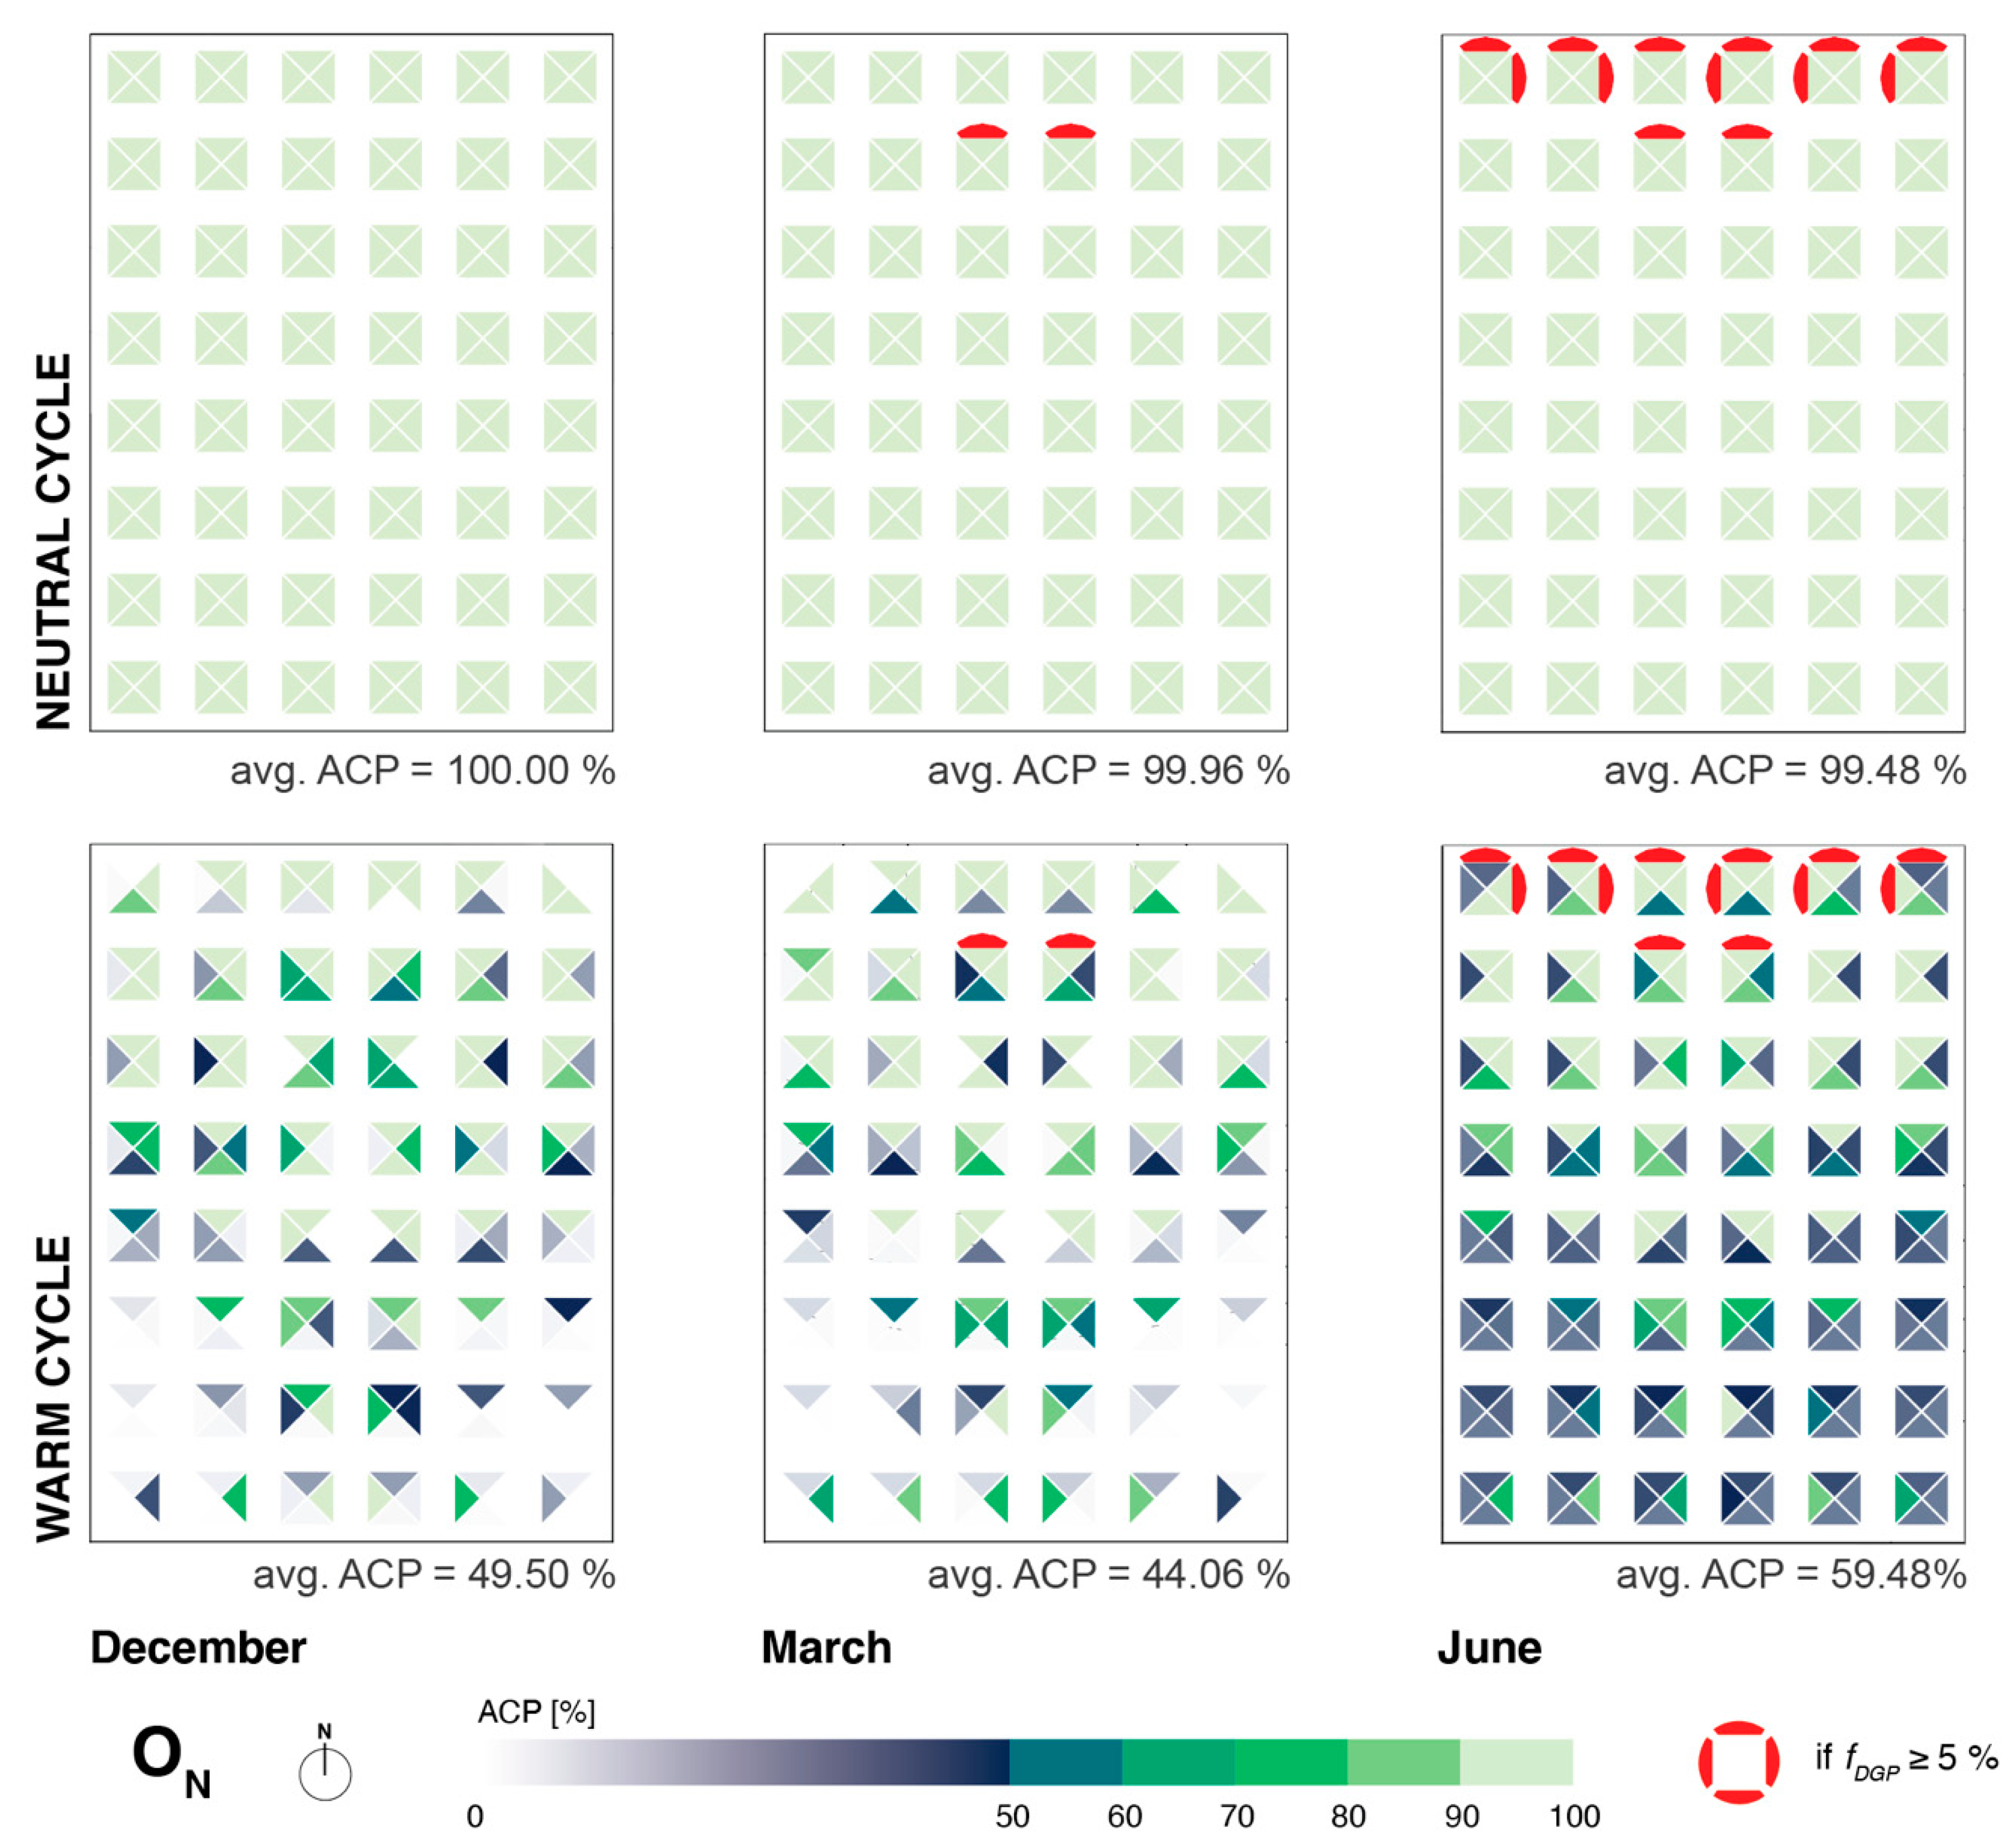
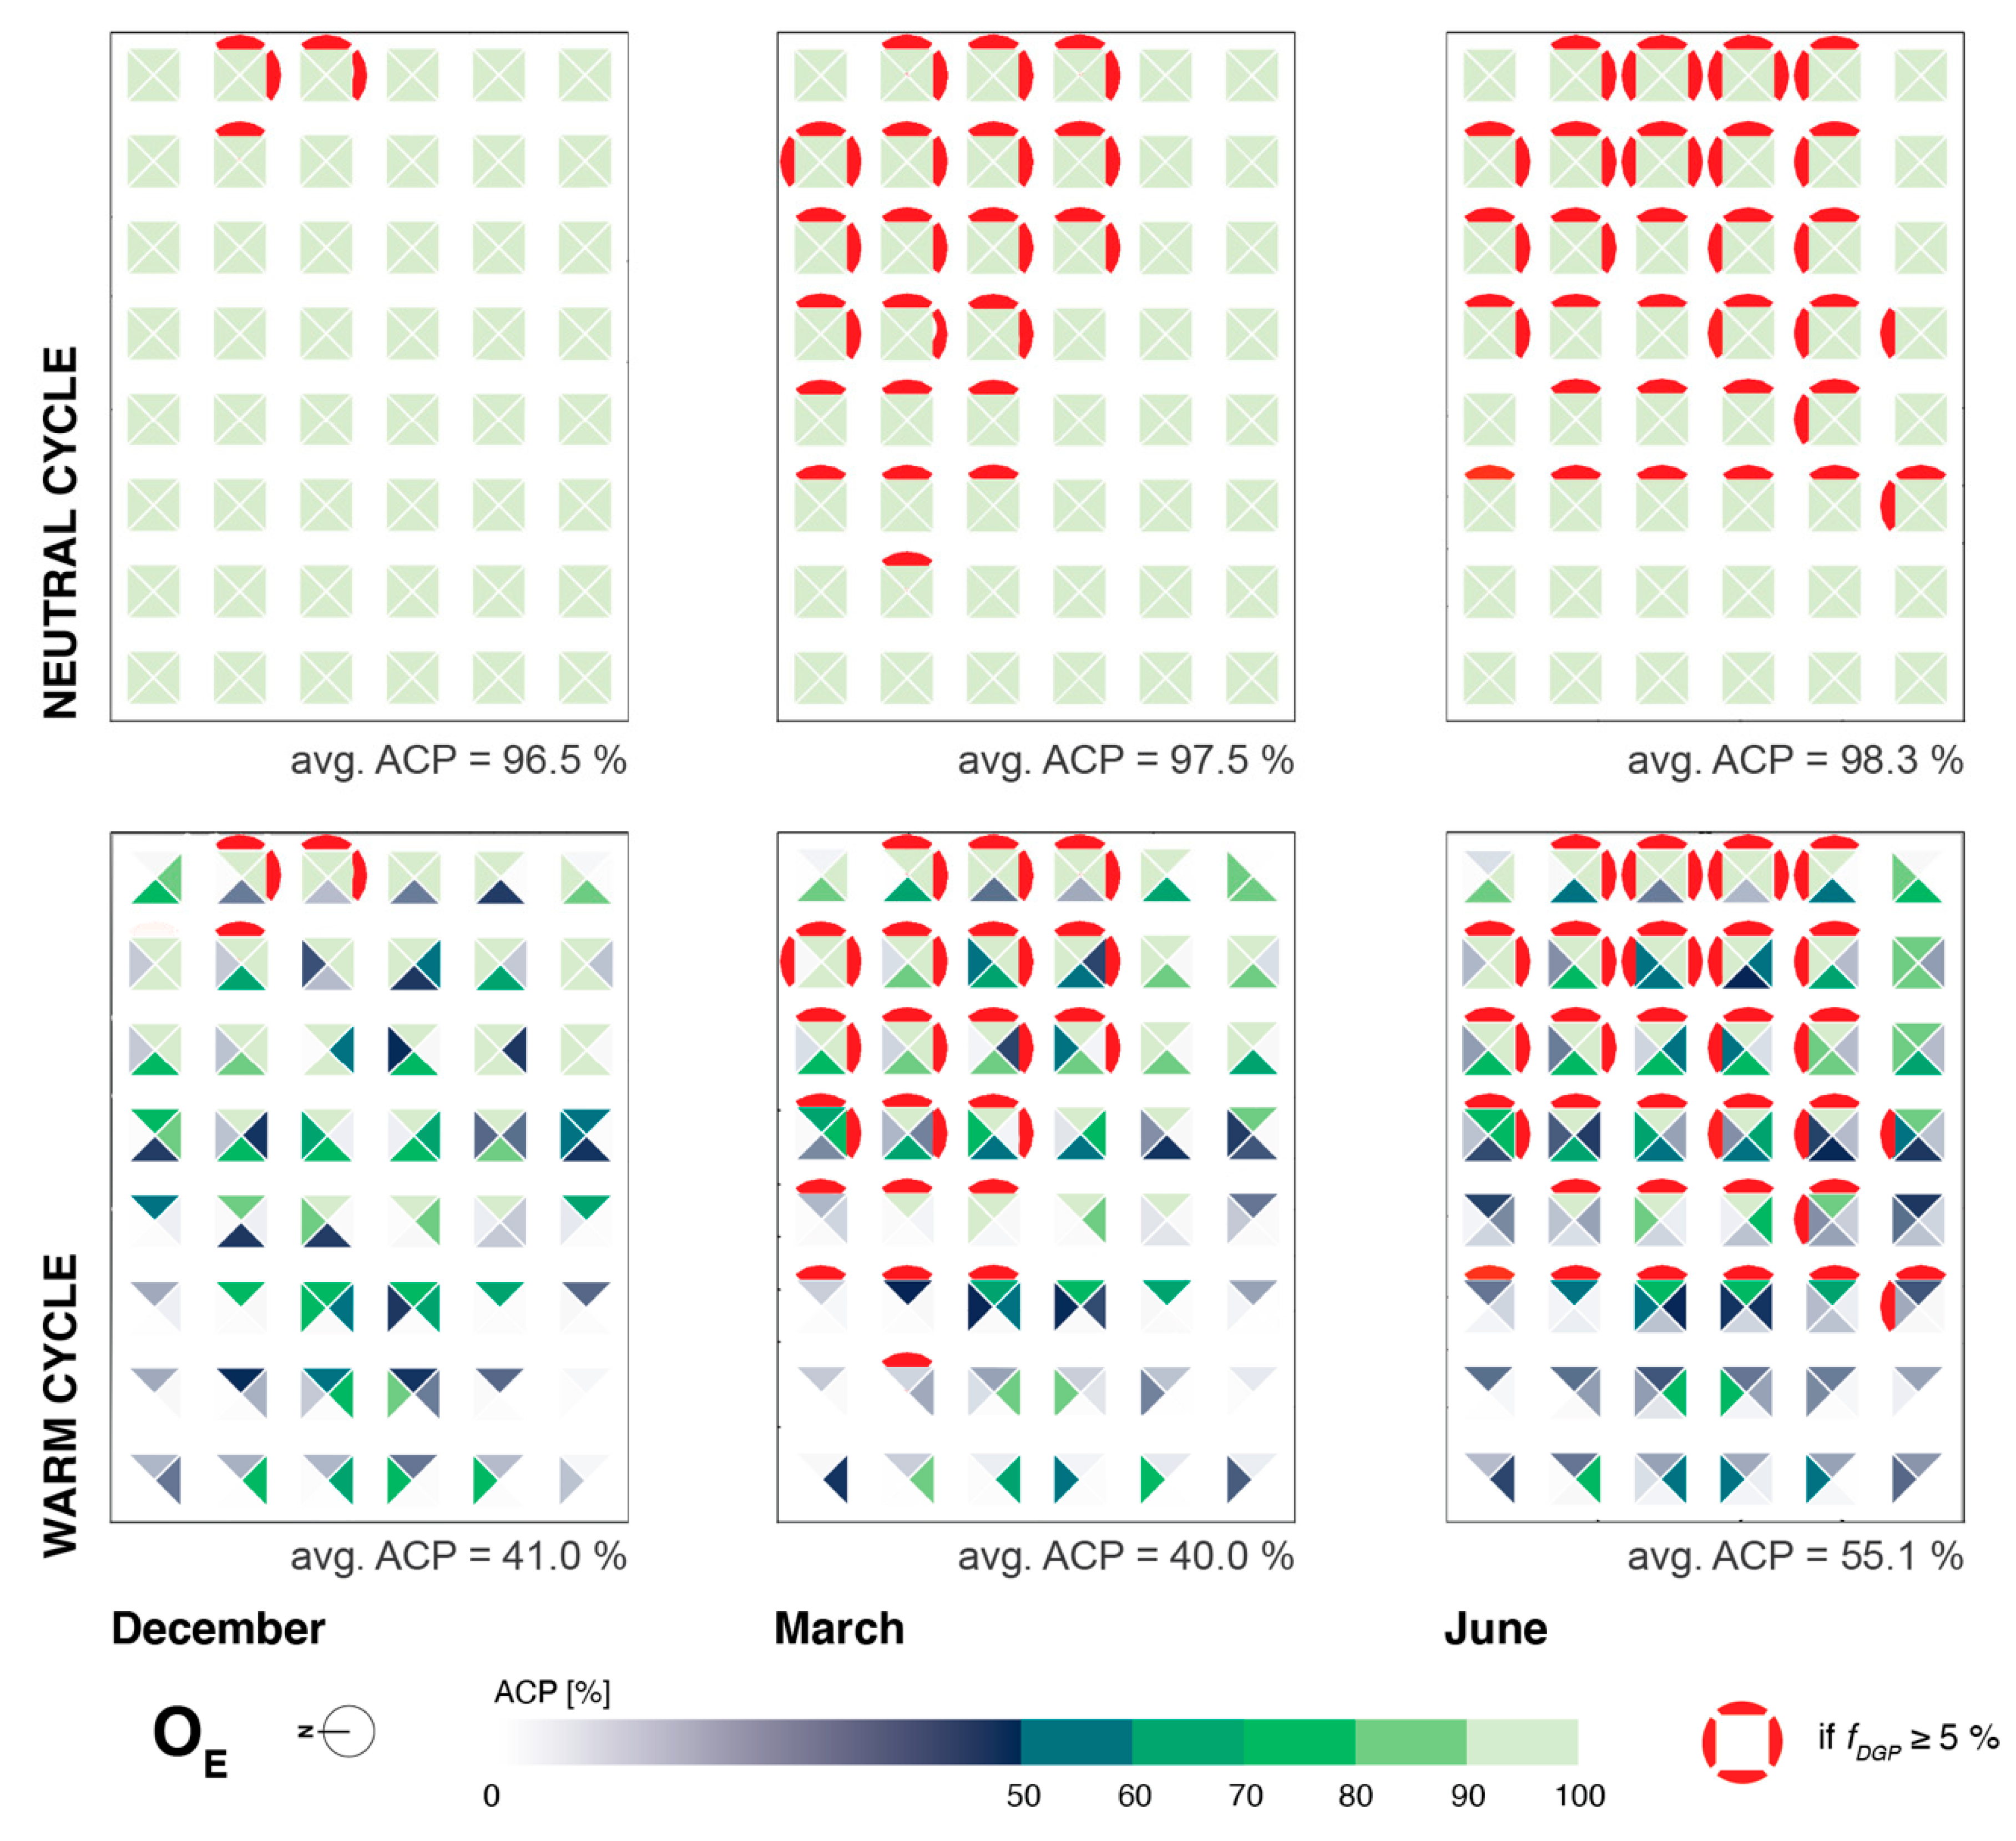
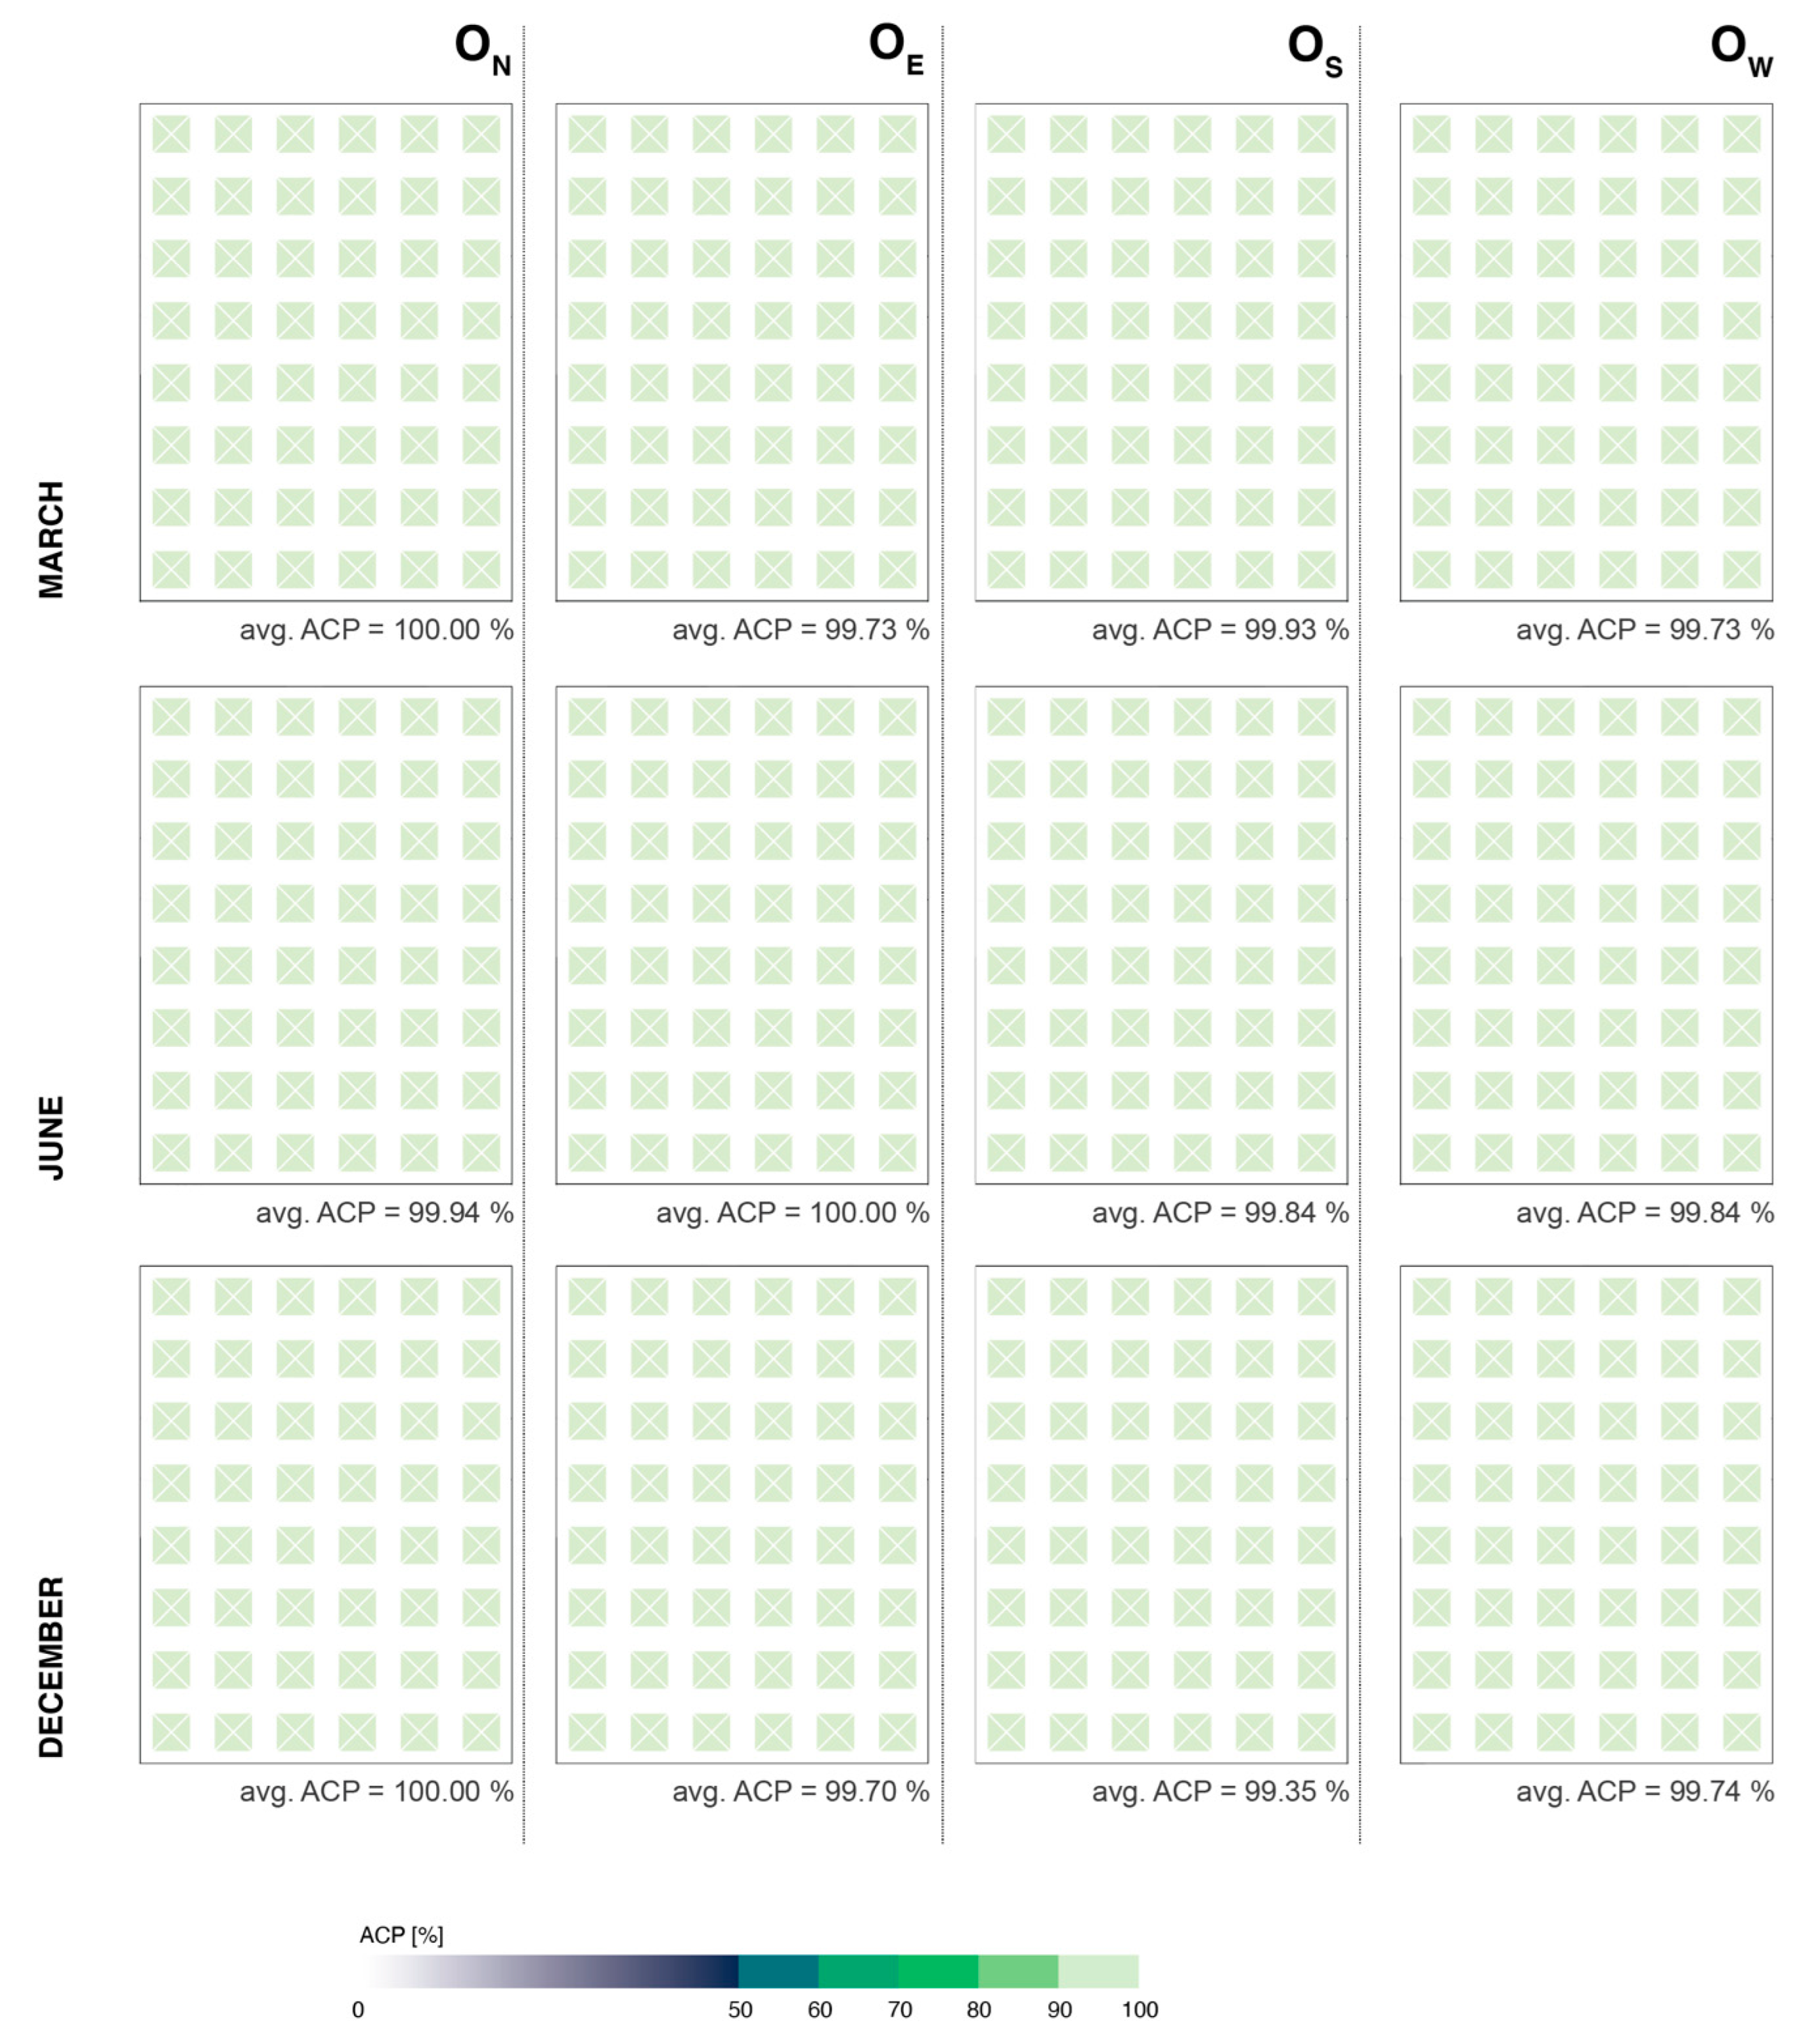
3.2. Evaluation of Monthly Climate-Based ACP and Correlation with DGP

For the sake of brevity, this section presents the climate-based spatial distribution of monthly ACP (spectral non-visual evaluation) and monthly DGP (visual evaluation) for the OS (Figure 7), OW (Figure 8) and ON (Figure 9) offices in the case of neutral and warm cycle walls. The OE office and cold cycle results are presented in Appendix B. The omission of the mentioned cases is based on the fact that non-visual results of the cold cycle are consistently higher (i.e., better) than those of the neutral cycle. Furthermore, the OE results can be considered symmetrical to the OW results (see Appendix B and results presented in Section 3.1). In addition, in the case of the cold cycle, the ACP results reveal that the compliance of the analysed spaces with the non-visual requirements can be verified using photopic methodologies throughout the daylit time of the analysed months (i.e., average ACP > 99%). As mentioned in Section 2.1.2, the fDGP presented in the following sections indicates a high probability of discomfort glare calculated by established photopic methodologies. However, the DGP values are not directly comparable to the ACP results due to inherent differences in calculation methodologies.
The ACP monthly climate-based results for the OS office are presented in Figure 7. The results for the neutral cycle case and the months of March and June indicate a high monthly ACP, with values above 90% of the daylit time for all views across the sensor grid. Predictably, the neutral cycle results for December show 14.4 pp and 12.4 pp lower average ACP values than those for March and June. The spatial distribution of ACP values during December concerning the position and view directionality shows a predominant ACP between 80 and 90% (80.2% of views) and a concentration of views with such an ACP deeper in the space (second half). On the other hand, a significant majority of views with the ACP over 90% are concentrated closer to the window and have an Az of 0°, 90°or 270° (Figure 7). Changing the wall colours from GR to OS (warm cycle) substantially influences the monthly climate-based ACP, as average values for all three months drop considerably. In particular, the average ACP decreases by 41.8, 40.4 and 39.2 pp for December, March and June, respectively, compared to neutral cycle results. The effect of wall colour change is particularly pronounced in the second half of the office and near the walls, where the ACP for views with Az values of 90°, 180° or 270° is often equal to 0% (Figure 7). Specifically, this means that the RCE is below 1.0 throughout the observed daylit time in a month.
The simulated ACP values of the OW office and neutral cycle are comparable with the south-oriented case results. They yield ACP values over 90% across the entire space and for all view directions during the three months (Figure 8). These values are comparable to the OS office and are even higher in the instance of the December simulations. Changing wall colours from GR (neutral cycle) to OS (warm cycle) significantly changes the ACP calculation results. Most views fall under 50% of ACP, which is most pronounced deeper in the room (second half) and when facing the walls (Figure 8). In such instances, the resulting ACP during December and March is usually 0%, with values below 50% during June. Compared to the neutral cycle, the average monthly ACP of the warm cycle is lower by 51.8 pp for December, 53.4 pp for March and 37.7 pp for June. Almost identical results apply to the OE office—see Appendix B.
In line with previous results, ACPs for the ON office (Figure 9) with neutral cycle walls are consistently over 90% and are the highest average results of all window orientations. As with other orientations, a significant drop in ACP values due to the change in wall colours to OS (warm cycle) can also be seen in the case of the ON office. Again, the most pronounced impact is in the second half of the room and for views facing the walls, where ACP can regularly drop to 0% (Figure 9). As for the average monthly ACP values, the difference between neutral and warm cycles is 50.5, 54.9 and 40.1 pp for December, March and June, respectively.
Results of the monthly DGP evaluation, presented through fDGP ≥ 5% (see Section 2.3.2), are independent of the wall colours, as photopic reflectances of the wall surfaces are the same (Rv = 50%). As a result, the probability of daylight glare does not change among the cold, neutral and warm cycle simulations. However, view, position in the office, month and window orientation play substantial roles, which results in vast differences in the DGP for the OS, OW and ON offices (Figure 7, Figure 8 and Figure 9). The DGP results of the OW and OS offices (for OE, see Appendix B) during the studied months show a considerable frequency of glare occurrence (fDGP > 5%) near the window as well as deeper in the office when the view is directed towards the window. More specifically, the highest glare occurrence in the OS office is during March, with 35.9% of views exceeding the DGP threshold, followed by December (23.9%) and June (16.1%). On the other hand, the number of views affected by glare exceeding fDGP ≥ 5% for the OW office is the highest during June (25.0%), followed by March (18.7%) and December (5.7%). Based on the results for the OS and OW offices (Figure 7 and Figure 8), it can also be concluded that the frequency of the DGP occurrence, when exceeded deeper (second half) in the space, occurs only at window-facing views (Az = 0°). On the other hand, glare occurrence is relatively low in the ON office, where it is only present during June with 6.8% and March with 2.0% of views exceeding fDGP ≥ 5%. Nevertheless, the glare occurrence frequency is exceeded only near the window and not beyond the second row of sensor points (Figure 9). The described results were expected, as east, south and west orientations are much more susceptible to daylight glare due to their higher exposure to direct sunlight than is the case for the north-oriented window.
Paralleling the fDGP and ACP analyses of the warm cycle simulations, a clear correlation between higher ACP and daylight glare occurrence can be observed. Closer inspection reveals that the frequency of the DGP occurrence is consistent with an ACP > 50% in at least 72.2% (i.e., 26 views out of 36 in the instance of the OW office, March) of views with an fDGP ≥ 5%. More so, an ACP > 90% corresponds with an fDGP ≥ 5% in at least 46.0% of cases, as is the case for the OS office during March, but is typically above 60.0% for other window orientations. The described trend indicates a negative correlation between the potential for evaluating the non-visual luminous aspects by photopic methodologies and the daylight glare occurrence.

4. Discussion

4.1. Can We Assess Non-Visual Content by Photopic Methodologies?

No would be a short and generally valid answer to the above-mentioned question. However, the presented results (see results in Section 3 and Appendix A and Appendix B) demonstrate that the indoor surface spectral characteristics and sky type connected with window orientation substantially impact the relationship between the non-visual and photopic evaluation. Therefore, it can be stated that when the Relative Circadian Efficacy (RCE) in a given analysed point in space ≥ 1, the compliance with a specific non-visual threshold (e.g., 275 CLA) can be evaluated using photopic illuminance, as in such cases it will always be the same or lower. In terms of specific spectral properties of materials, this means that such conditions will be met for spectrally neutral-coloured (i.e., grey) and so-called cold (e.g., blue, purple and aquamarine)-coloured materials [51,56,57]. For such materials, the ratio between melanopically and photopically weighted reflectance (i.e., MRp or M/P ratio) is equal to or higher than 1.
Nevertheless, the external spectral conditions (i.e., sky type) can play an important role, as was shown by the point-in-time diurnal simulations with an hourly time step (see Section 3.1). Specifically, it was demonstrated that under overcast sky type, the condition of RCE ≥ 1 was met for 100% of daylit hours during all three critical days when the internal walls were either grey- or blue-coloured. On the other hand, the situation for clear and hazy sky types was not as straightforward. Nevertheless, even for these two sky types, high ACP values were calculated for blue and grey walls, indicating that luminous indoor conditions are predominantly characterised by an RCE ≥ 1 during most of the day. The latter is pronounced for the blue-coloured walls on all investigated days and for March and June 21st for the grey walls. These conclusions are further confirmed by the monthly climate-based evaluation of the non-visual luminous environment presented in Section 3.2. In the case of the spectrally neutral grey walls and blue walls, for all orientations, view directions and all three months evaluated, the ACPs were above 90% of the daylit time of the month. The only exception is the results for the south-oriented office during December in the case of grey walls. In this instance, an ACP > 90% was reached only in the first half of the office. These facts point to the conclusion, already implicitly suggested by Potočnik and Košir [52], that as long as the space is characterised by materials with an MRp ≥ 1, there is no need for distinct non-visual evaluations of the luminous environment, as the calculation of vertical illuminance can provide sufficient information about the compliance with specific non-visual criteria. The presented simulations demonstrated that this is true even under the warmer nature of the direct sunlight of the clear and hazy sky types for most of the day.
Nevertheless, the above does not apply to the warm cycle simulations where the wall colours had an MRp below 1. These results demonstrate that it is impossible to simplify the non-visual evaluation for calculating or measuring the vertical photopic illuminances in such cases. Both point-in-time diurnal results and climate-based monthly ACP calculations show that the photopic methodologies are not applicable for evaluating the non-visual aspects under such indoor surface spectral conditions.

4.2. Is There a Contradiction between Visual Comfort and Non-Visual Aspects?

Regarding the above question, the answer is yes, as there is a substantial correlation between daylight-induced glare expressed as DGP and the potential for evaluating the non-visual luminous aspects by photopic methodologies. The correlation is evident, as high DGP values correspond to higher ACPs but not vice versa, which means that higher ACP values can also be the result of other factors, such as material spectral properties, and are not necessarily related to high vertical illuminance, which plays a prominent role in the occurrence of DGP (see Section 2.3.2). The analysis of the monthly climate-based warm cycle results supports the stated interpretation. In this instance, there was a clear and substantial overlap between the views with high DGP (i.e., high vertical illuminance) and those with high ACP values. Hence, exposure to high photopic illuminance will also result in a high potential for evaluating the non-visual aspects using the photopic methodology.
In practice, shading would be applied when DGP is high, modifying multiple aspects (e.g., illuminance, view out, CCT, etc.) of the indoor luminous environment [61]. However, the effect of shading on the non-visual aspects of the space considerably depends on the type and spectral characteristics of the shading device. For instance, using textile screens as an example, Villalba et al. [62] demonstrated that the selection of the shade of the textile influences the CCT of the transmitted daylight, with darker screens resulting in higher CCTs. On the other hand, Potočnik and Košir [53] investigated the correlation between DGP, horizontal task illuminance and melanopic illuminance through in situ experiments in an office equipped with a spectrally neutral (white) opaque roller blind. When the roller blind was used to control the horizontal illuminance, the impact on the melanopic corneal illuminance was substantial. However, because the roller blind was spectrally neutral, the influence of the device on the ratio between photopic and melanopic illuminances was negligible. Therefore, it could be speculated that shading used to control the DGP is more problematic from the perspective of the non-visual environment when the material properties of the surrounding surfaces and/or shading device are characterised by MRp < 1, as already indicated by Parsaee et al. [63], where red-coloured shading louvers decreased the measured melanopic illuminance.

4.3. What Are the Limitations of the Study?

Firstly, the present study is limited by the decision to select just one location (i.e., Ljubljana). The latter is significant for the construction of climate-based spectral months, as different weather patterns would result in substantially different ratios between the used sky types in a specific month. This would affect the results of the climate-based non-visual evaluation and the ACP and CA values. In the case of Ljubljana, the overcast sky type was dominant; the results of the climate-based analysis for a location with a different climate could be substantially different. This is particularly important because an overcast sky was the best suited for evaluating non-visual content using photopic methodologies.
Secondly, the study did not consider the influence of exterior surroundings (e.g., architectural and landscape features) on the results. The omission of the surrounding obstructions was intentional, as this would substantially increase the complexity of the simulations and the interpretation of the results. However, as Sadeghi and Mistrick [64] have shown, the urban landscape and architectural elements considerably affect indoor luminous conditions, particularly deeper in the rooms and under clear sky conditions. Furthermore, the correlation between urban density and morphology and the resulting indoor luminous conditions is relevant to both photopic [65] and non-visual [66] aspects of daylight. At the same time, the reflectance of the opposing façades is decisive for indoor daylighting in high-density urban environments, as demonstrated by Iversen et al. [67]. Extending on the above-referenced studies and the results of our research, it could be concluded that the spectral material properties and geometrical characteristics of the surrounding obstructions will inevitably affect the resulting non-visual daylighting in a space. However, to what extent and when the inclusion of surrounding obstructions is vital for the non-visual evaluation of indoor luminous conditions should be investigated in a separate study.
Thirdly, as stressed by Gkaintatzi-Masouti et al. [68] and Inanici et al. [46], a limiting factor of the present study is also the limitations of the sky model implemented in the ALFA tool. The results presented by Inanici et al. demonstrated that ALFA’s atmospheric sky model underestimates the CCT variability of the sky when compared to high dynamic range photography of the real sky. Therefore, the CCT ranges of sky models used in simulations (see Table 1) could be considered conservative. Much higher values can be reached, particularly during mornings and evenings. Therefore, underestimating the CCT of the sky leads to a conservative estimate of the ACP, which means that under more realistic conditions (i.e., with higher CCT variability), the ACP of the studied environment would be even higher.
Lastly, the selection of the ACP metric as the primary indicator of the non-visual potential evaluation has to be addressed. In itself, this is not a limitation of the study. However, it must be emphasised that judging the non-visual content (i.e., circadian stimulative environment) based on the ACP is impossible, as the former only shows whether it is possible to evaluate the non-visual content by photopic methodologies. Therefore, a calculation of CA needs to be conducted, as it indicates the share of time during a defined period when the selected circadian threshold is reached or exceeded. For these results, see Appendix C.

5. Conclusions

Concerning the first question posed in the study objectives, the conclusion based on the study results would be that (unfortunately) non-visual luminous aspects in buildings need to be evaluated by multi-spectral simulations. Only these methods can provide reliable and accurate results, as there are too many differences in the design of indoor environments and material selection. Nevertheless, it was also demonstrated that compliance with non-visual requirements for indoor spaces characterised by spectrally neutral reflective surfaces or those in shades of blue and purple could be performed using photopic methodologies. The latter is particularly useful as a reference and guide for architects and engineers who can make design decisions based on surface material properties (i.e., colour and/or ratio between melanopic and visual reflectance/transmittance) and photopic illuminance calculations. Such a “rule of thumb” approach is convenient for the early stages of building design, where complex multi-spectral simulations are not a realistic option.
A monthly climate-based analysis of non-visual and visual aspects was conducted to answer the second question posed in the study objectives, particularly the correlation between the Autonomy of Circadian Potential (ACP) and the Daylight Glare Probability (DGP). The results indicate a strong negative correlation between a high ACP (and CA—Circadian Autonomy) and the occurrence of DGP at south, east and west orientations. This relationship was evident in the orange wall office simulations, where high ACPs were reached almost exclusively at views affected by glare, linking both parameters to high vertical illuminances. Because shading would be used in real-life situations to control glare, this could be an issue in environments characterised by materials that do not promote circadian entrainment (i.e., orange- and red-coloured materials). In such configurations, shading could further reduce the non-visual potential of such rooms. All in all, this points to the fact that the type and spectral characteristics of shading devices must be considered in the design of non-visually stimulating environments.

Author Contributions

Conceptualisation, Methodology, Software, Validation, Formal Analysis, Investigation, Data Curation, Writing—Original Draft, Writing—Review and Editing, Visualisation, J.P. Conceptualisation, Methodology, Validation, Investigation, Resources, Writing—Original Draft, Writing—Review and Editing, Supervision, Project Administration, Funding Acquisition, M.K. All authors have read and agreed to the published version of the manuscript.

Funding

The research presented in this paper results from a project funded by the Slovenian Research Agency (project no. J2—3036). The authors further acknowledge the financial support from the Slovenian Research Agency (research core funding no. P2—0158).

Data Availability Statement

The data presented in this study are available on request from the corresponding author. The data are not publicly available as they are not stored on a publicly accessible repository.

Conflicts of Interest

The authors declare no conflict of interest.

Appendix A. External Conditions: Spectral Hourly Data and RCE According to Sky Type

Figure A1. Normalised diurnal spectral distributions of the north, east, south and west skies for June 21st under clear, hazy and overcast conditions.
Buildings 13 01357 g0a1
Figure A2. Normalised diurnal spectral distributions of the north, east, south and west skies for March 21st under clear, hazy and overcast conditions.
Buildings 13 01357 g0a2
Figure A3. Normalised diurnal spectral distributions of the north, east, south and west skies for December 21st under clear, hazy and overcast conditions.
Buildings 13 01357 g0a3
Figure A4. Relative circadian efficacy—RCE—of external daylight conditions for all the simulated cases.
Buildings 13 01357 g0a4

Appendix B. DGP and ACP for Monthly Climate-Based Simulations

Figure A5. Monthly climate-based evaluation of ACP (non-visual aspects) and DGP (visual aspects) for December, March and June, west office orientation (Ow) under neutral (top) and warm cycles (bottom).
Buildings 13 01357 g0a5
Figure A6. Monthly climate-based evaluation of ACP of all investigated rooms for December, March and June for cold cycle (blue-coloured walls).
Buildings 13 01357 g0a6

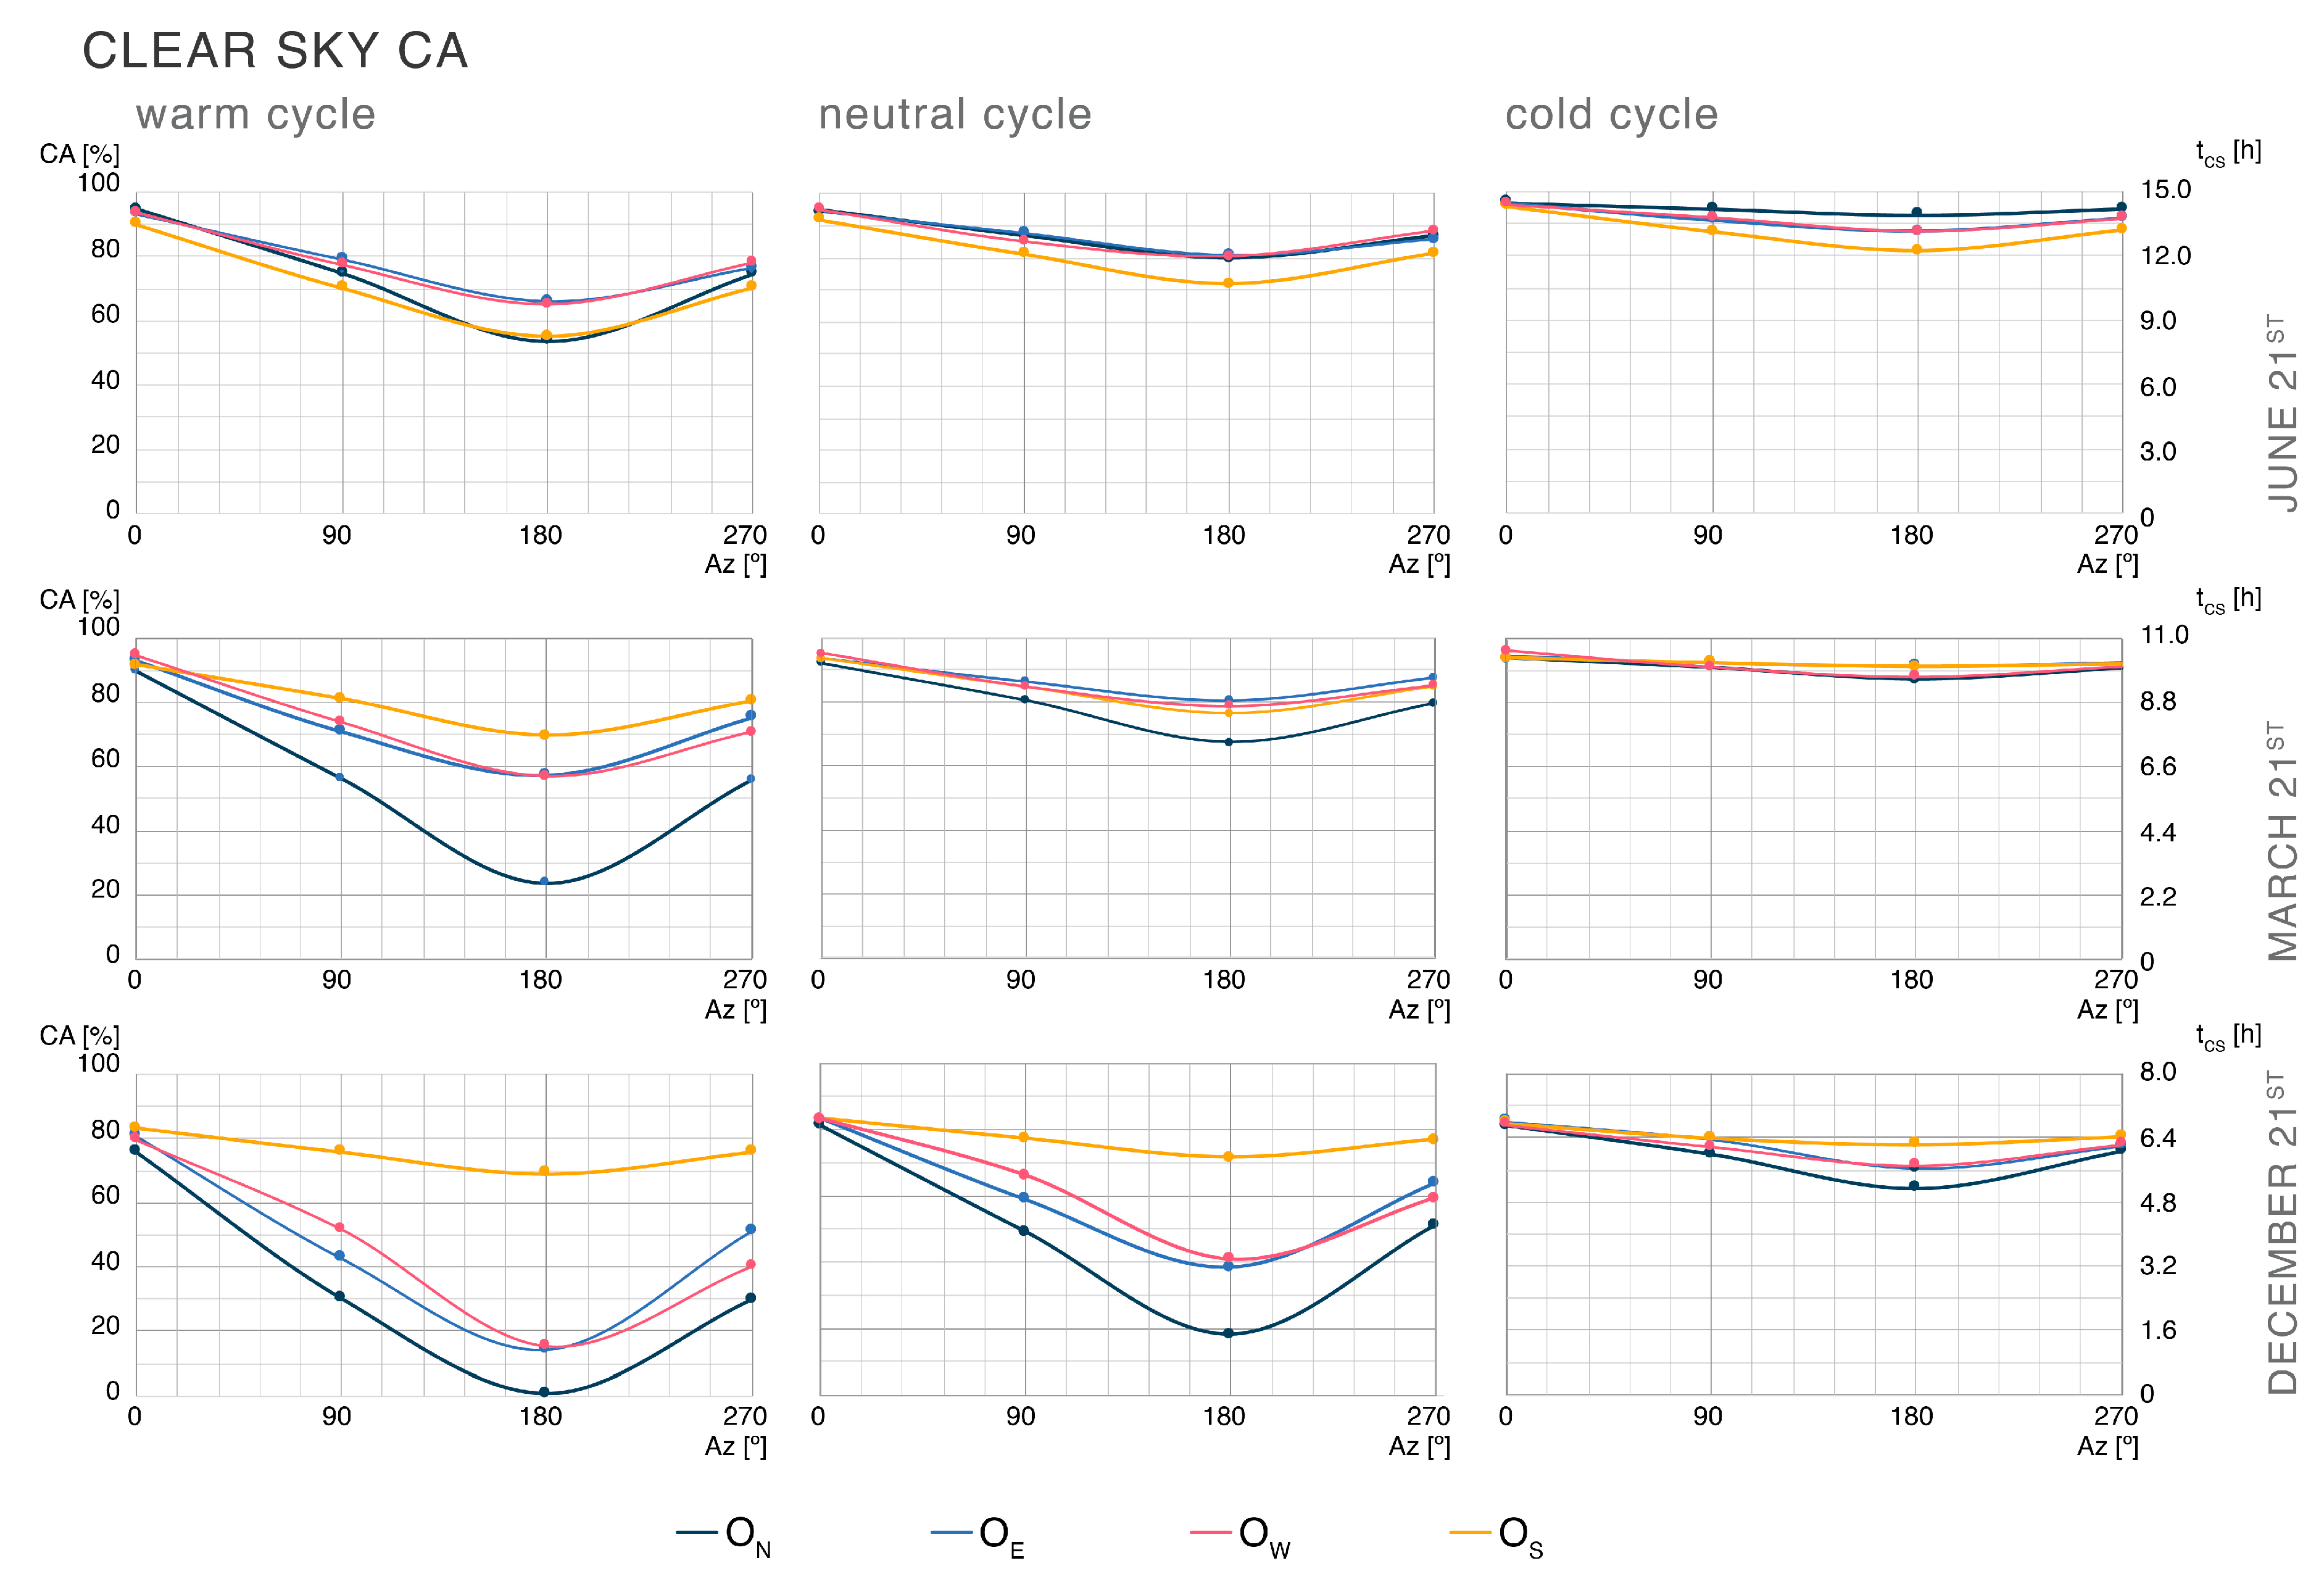
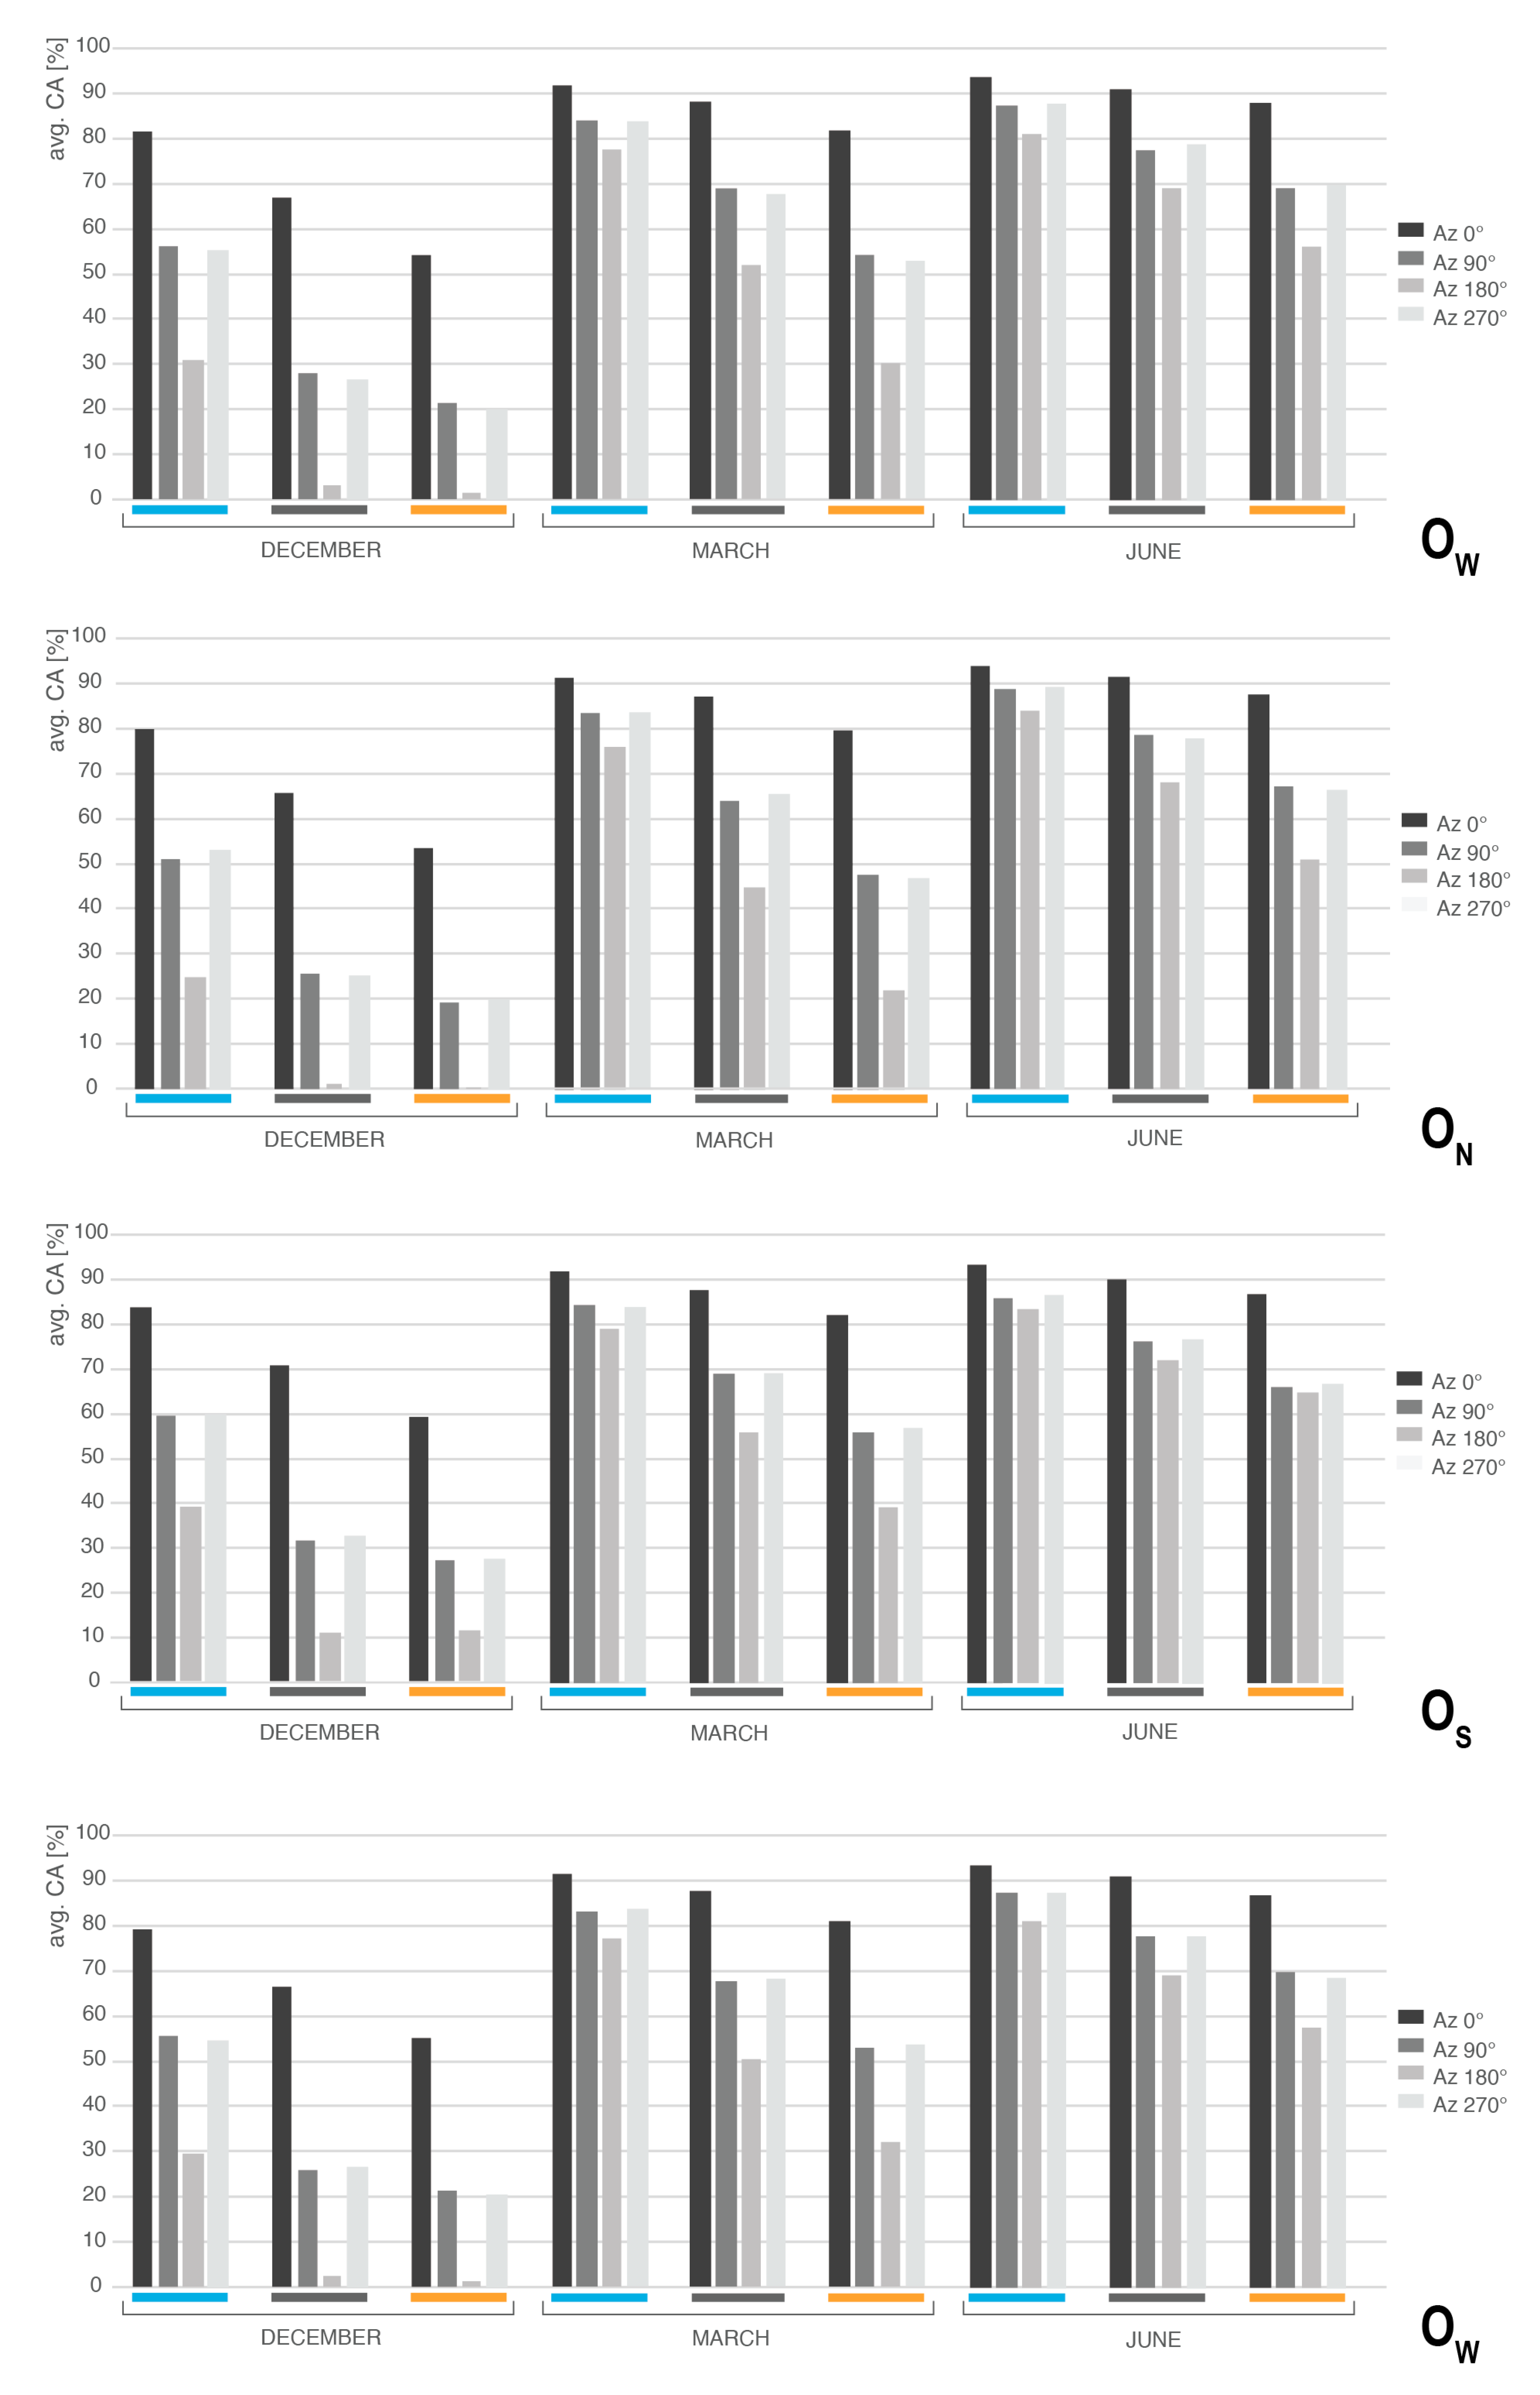
Appendix C. CA for Diurnal Point-in-Time and Climate-Based Monthly Simulations

The average CA analysis presented in Figure A7 predictably shows that the highest CA values are achieved by views directed towards the window (Az = 0°) and the lowest CA values by views directed away from it (Az = 180°). Furthermore, the results indicate a clear increasing trend in CA from December 21st to June 21st (Figure A7), in proportion to the seasonal change in the Sun’s incident angles and the consequent higher external illuminances. If we first inspect the result of the neutral cycle simulations, the highest average CA of 95.4% (tCS = 14.3 h) was calculated for an Az = 0° in the OS office on June 21st, while the lowest average CA of 18.3% (tCS = 1.5 h) was recorded for the ON office, Az of 180° view on December 21st (Figure A7). Comparing these results to either warm or cold cycle results demonstrates that changing the wall colours has a marginal effect on the average CA for an Az = 0°. Nevertheless, it can substantially impact the average CA values in other view directions. In particular, for an Az = 180° and the ON office, changing the wall colour to OS (warm cycle) reduced the average CA by 39.5 pp (∆tCS = 1.86 h) on June 21st. Similarly, the average CA is increased by 12.4 pp (∆tCS = 1.86 h) when the wall colour changes from neutral BS (Figure A7).
Figure A7. Average CA (Circadian Autonomy) and tCA of the offices according to different view orientations (Az) and studied dates concerning warm, neutral and cold cycles under clear sky conditions.
Buildings 13 01357 g0a7
Simulations under the hazy sky type express markedly lower CA values than under clear sky conditions, which results from lower external and internal illuminances (Figure A8). On December 21st, for the neutral cycle, the average CA equals to 0.0% for all office orientations except the south (OS) at a view direction Az = 180°. This means that for ON, OE and OW, for the view facing away from the window the criterion of circadian effective light CS ≥ 0.3 is never reached on December 21st (Figure A8). The situation is almost identical for the warm cycle and just slightly better in the case of the cold cycle (Figure A8). When the average CA of the warm and neutral cycles are compared, the largest negative difference in CA is 27.8 pp (June 21st, ON, Az = 180°). Compared to the results of the clear sky simulations, it becomes evident that the OS wall colour (warm cycle) has a smaller influence on the reached CA than under clear sky conditions. The same applies to the influence of blue walls, where the highest positive difference in CA is 43.5 pp (December 21st, ON, Az = 180°). More minor differences between neutral and warm and cold cycles under intermediate sky conditions than in the case of clear sky can be directly attributed to lower reached illuminances.
Figure A8. Average CA (Circadian Autonomy) and tCA of the offices according to different view orientations (Az) and studied dates concerning warm, neutral and cold cycles under hazy sky conditions.
Buildings 13 01357 g0a8
Data presented in Figure A9 indicate that office orientation does not impact the CA results under the overcast sky type, which is characterised by azimuthal uniformity. However, in contrast to the APC results (APC = 100% for neutral and cold cycles), the average CA results coincide with the trends evident in the case of the clear and hazy sky simulations (Figure A7 and Figure A8). This means that the average CA is diminishing from June 21st to December 21st due to decreasing external global illuminances. As observed in the ACP warm cycle results, there are minimal differences among office orientations that result from numerical errors in the software ALFA. The lowest CA values of the neutral cycle were calculated on December 21st for an Az = 180°, where the circadian effective light criteria (CS > 0.3) are never exceeded. Changing the colour of the walls from GS (neutral cycle) to OS (warm cycle) equally negatively affects the reached average CS off all offices, with the maximum CA reduction of 28.9 pp on March 21st with an Az = 180°. The reverse is valid for the cold cycle simulations, where the most significant increase of 31.2 pp in average CA was also on March 21st and with an Az = 180°.
Figure A9. Average CA (Circadian Autonomy) and tCA of the offices according to different view orientations (Az) and studied dates concerning warm, neutral and cold cycles under overcast sky conditions.
Buildings 13 01357 g0a9
The present study also performed climate-based monthly CA calculations for December, March and June. The results of these calculations are presented in Figure A10 through average CA values concerning the months, office orientation, view direction and wall spectral properties. Investigating these results clearly points to the importance of the internal surface material properties, particularly in views directed away from the window (Az = 90°, 180° and 270°). Specifically, suppose the December results for the warm cycle simulations are compared with the neutral or cold cycle results. In that case, the average difference in CA for an Az = 0° is approximately 10 pp between each cycle, while for other view directions the results of the blue cycle stand out, as the CA in that case can be more than 30 pp higher (e.g., Az = 90°, OW office, blue to warm cycles). The results in Figure A10 also demonstrate that the differences between months, particularly between December and March or June, are substantial, predominantly in the instance of the warm cycle where the difference between the average CA in December and March is approximately 25 pp, while the difference between March and June is negligible (i.e., approx. 5 pp) for the window-oriented view and a little larger at other views (i.e., approx. 20 pp). These results indicate that exposure to the appropriate period of circadian effective daylight might be an issue during December and that indoor environments with an RCE < 1 should be avoided when occupants’ primary view direction is not facing the window.
Figure A10. Average climate-based monthly CA for each office orientation by month and view (Az).
Buildings 13 01357 g0a10

References

  1. Dovjak, M.; Kukec, A. Creating Healthy and Sustainable Buildings; Springer Nature Switzerland AG: Cham, Switzerland, 2019; ISBN 978-3-030-19412-3. [Google Scholar]
  2. Brasche, S.; Bischof, W. Daily Time Spent Indoors in German Homes—Baseline Data for the Assessment of Indoor Exposure of German Occupants. Int. J. Hyg. Env. Health 2005, 208, 247–253. [Google Scholar] [CrossRef] [PubMed]
  3. Klepeis, N.E.; Nelson, W.C.; Ott, W.R.; Robinson, J.P.; Tsang, A.M.; Switzer, P.; Behar, J.V.; Hern, S.C.; Engelmann, W.H. The National Human Activity Pattern Survey (NHAPS): A Resource for Assessing Exposure to Environmental Pollutants. J. Expo. Sci. Environ. Epidemiol. 2001, 11, 231–252. [Google Scholar] [CrossRef] [PubMed]
  4. Sommese, F.; Badarnah, L.; Ausiello, G. A Critical Review of Biomimetic Building Envelopes: Towards a Bio-Adaptive Model from Nature to Architecture. Renew. Sustain. Energy Rev. 2022, 169, 112850. [Google Scholar] [CrossRef]
  5. EN 17037; Daylight of Buildings. CEN—European Committee for Standardization: Brussels, Belgium, 2019.
  6. EN 12464-1; Light and Lighting—Lighting of Work Places—Part 1: Indoor Work Places. CEN—European Committee for Standardization: Brussels, Belgium, 2011.
  7. Berson, D.M. Strange Vision: Ganglion Cells as Circadian Photoreceptors. Trends Neurosci. 2003, 26, 314–320. [Google Scholar] [CrossRef]
  8. Berson, D.M.; Dunn, F.A.; Takao, M. Phototransduction by Retinal Ganglion Cells That Set the Circadian Clock. Science 2002, 295, 1070–1073. [Google Scholar] [CrossRef]
  9. Foster, R.G. Fundamentals of Circadian Entrainment by Light. Light. Res. Technol. 2021, 53, 377–393. [Google Scholar] [CrossRef]
  10. Hankins, M.W.; Lucas, R.J. The Primary Visual Pathway in Humans Is Regulated According to Long-Term Light Exposure through the Action of a Nonclassical Photopigment. Curr. Biol. 2002, 12, 191–198. [Google Scholar] [CrossRef]
  11. Czeisler, C.A.; Duffy, J.F.; Shanahan, T.L.; Brown, E.N.; Mitchell, J.F.; Rimmer, D.W.; Ronda, J.M.; Silva, E.J.; Allan, J.S.; Emens, J.S.; et al. Stability, Precision, and Near-24-Hour Period of the Human Circadian Pacemaker. Science 1999, 284, 2177–2181. [Google Scholar] [CrossRef]
  12. Brown, T.M. Melanopic Illuminance Defines the Magnitude of Human Circadian Light Responses under a Wide Range of Conditions. J. Pineal Res. 2020, 69, e12655. [Google Scholar] [CrossRef]
  13. Mardaljevic, J.; Andersen, M.; Roy, N.; Christoffersen, J. A Framework for Predicting the Non-Visual Effects of Daylight—Part II: The Simulation Model. Light. Res. Technol. 2013, 46, 388–406. [Google Scholar] [CrossRef]
  14. Chang, A.M.; Scheer, F.A.J.L.; Czeisler, C.A. The Human Circadian System Adapts to Prior Photic History. J. Physiol. 2011, 589, 1095–1102. [Google Scholar] [CrossRef] [PubMed]
  15. Baron, K.G.; Reid, K.J. Circadian Misalignment and Health. Int. Rev. Psychiatry 2014, 26, 139–154. [Google Scholar] [CrossRef] [PubMed]
  16. Poole, E.M.; Schernhammer, E.S.; Tworoger, S.S. Rotating Night Shift Work and Risk of Ovarian Cancer. Cancer Epidemiol. Biomark. Prev. 2011, 20, 934–938. [Google Scholar] [CrossRef]
  17. International Agency for Research on Cancer—IARC. Monographs on the Identification of Carcinogenic Hazards to Humans. Available online: https://monographs.iarc.who.int/list-of-classifications (accessed on 1 March 2021).
  18. Boubekri, M. Chapter 3—Seasonal Affective Disorder, Depression, and Their Relationship to Daylight. In Daylighting, Architecture and Health; Architectural Press: Oxford, UK, 2008; pp. 53–62. ISBN 978-0-7506-6724-1. [Google Scholar]
  19. Roecklein, K.A.; Wong, P.M.; Miller, M.A.; Donofry, S.D.; Kamarck, M.L.; Brainard, G.C. Melanopsin, Photosensitive Ganglion Cells, and Seasonal Affective Disorder. Neurosci. Biobehav. Rev. 2013, 37, 229–239. [Google Scholar] [CrossRef]
  20. Westland, S.; Pan, Q.; Lee, S. A Review of the Effects of Colour and Light on Non-Image Function in Humans. Color. Technol. 2017, 133, 349–361. [Google Scholar] [CrossRef]
  21. CIE S 026/E; CIE System for Metrology of Optical Radiation for IpRGC-Influenced Responses to Light. CIE—International Commision on Illumination: Vienna, Austria, 2018.
  22. Gall, D.; Bieske, K. Definition and measurement of Circadian Radiometric Quantities. In Proceedings of CIE Symposium ’04, Vienna, Austria, 30 September–2 October 2004.
  23. Lucas, R.J.; Peirson, S.N.; Berson, D.M.; Brown, T.M.; Cooper, H.M.; Czeisler, C.A.; Figueiro, M.G.; Gamlin, P.D.; Lockley, S.W.; O’Hagan, J.B.; et al. Measuring and Using Light in the Melanopsin Age. Trends Neurosci. 2014, 37, 1–9. [Google Scholar] [CrossRef]
  24. Rea, M.S.; Figueiro, M.G.; Bullough, J.D.; Bierman, A. A Model of Phototransduction by the Human Circadian System. Brain Res. Rev. 2005, 50, 213–228. [Google Scholar] [CrossRef]
  25. Rea, M.S.; Figueiro, M.G.; Bierman, A.; Hamner, R. Modelling the Spectral Sensitivity of the Human Circadian System. Light. Res. Technol. 2012, 44, 386–396. [Google Scholar] [CrossRef]
  26. Rea, M.S.; Figueiro, M.G.; Bierman, A.; Hamner, R. Corrigendum. Light. Res. Technol. 2012, 44, 516. [Google Scholar] [CrossRef]
  27. Acosta, I.; Leslie, R.P.; Figueiro, M.G. Analysis of Circadian Stimulus Allowed by Daylighting in Hospital Rooms. Light. Res. Technol. 2015, 49, 49–61. [Google Scholar] [CrossRef]
  28. Figueiro, M.G.; Steverson, B.; Heerwagen, J.; Kampschroer, K.; Hunter, C.M.; Gonzales, K.; Plitnick, B.; Rea, M.S. The Impact of Daytime Light Exposures on Sleep and Mood in Office Workers. Sleep Health 2017, 3, 204–215. [Google Scholar] [CrossRef] [PubMed]
  29. Figueiro, M.G.; Nagare, R.; Price, L.L.A. Non-Visual Effects of Light: How to Use Light to Promote Circadian Entrainment and Elicit Alertness. Light. Res. Technol. 2018, 50, 38–62. [Google Scholar] [CrossRef] [PubMed]
  30. Bellia, L.; Fragliasso, F. Good Places to Live and Sleep Well: A Literature Review about the Role of Architecture in Determining Non-Visual Effects of Light. Int. J. Environ. Res. Public Health 2021, 18, 1002. [Google Scholar] [CrossRef] [PubMed]
  31. Bellia, L.; Bisegna, F.; Spada, G. Lighting in Indoor Environments: Visual and Non-Visual Effects of Light Sources with Different Spectral Power Distributions. Build. Environ. 2011, 46, 1984–1992. [Google Scholar] [CrossRef]
  32. Nie, J.; Chen, Z.; Jiao, F.; Zhan, J.; Chen, Y.; Chen, Y.; Pan, Z.; Kang, X.; Wang, Y.; Wang, Q.; et al. Low Blue Light Hazard for Tunable White Light Emitting Diode with High Color Fidelity and Circadian Performances. Opt. Laser Technol. 2021, 135, 106709. [Google Scholar] [CrossRef]
  33. Nie, J.; Zhou, T.; Chen, Z.; Dang, W.; Jiao, F.; Zhan, J.; Chen, Y.; Chen, Y.; Pan, Z.; Kang, X.; et al. Investigation on Entraining and Enhancing Human Circadian Rhythm in Closed Environments Using Daylight-like LED Mixed Lighting. Sci. Total Environ. 2020, 732, 139334. [Google Scholar] [CrossRef]
  34. Rahman, S.A.; St. Hilaire, M.A.; Lockley, S.W. The Effects of Spectral Tuning of Evening Ambient Light on Melatonin Suppression, Alertness and Sleep. Physiol. Behav. 2017, 177, 221–229. [Google Scholar] [CrossRef]
  35. Diakite-Kortlever, A.K.; Knoop, M. Forecast Accuracy of Existing Luminance-Related Spectral Sky Models and Their Practical Implications for the Assessment of the Non-Image-Forming Effectiveness of Daylight. Light. Res. Technol. 2021, 53, 657–676. [Google Scholar] [CrossRef]
  36. Andersen, M.; Mardaljevic, J.; Lockley, S. A Framework for Predicting the Non-Visual Effects of Daylight—Part I: Photobiology-Based Model. Light. Res. Technol. 2012, 44, 37–53. [Google Scholar] [CrossRef]
  37. Daysim. Available online: http://daysim.ning.com/main/index (accessed on 10 January 2019).
  38. Konis, K. A Novel Circadian Daylight Metric for Building Design and Evaluation. Build. Environ. 2017, 113, 22–38. [Google Scholar] [CrossRef]
  39. Inanici, M.; Brennan, M.; Clark, E. Spectral Daylighting Simulations: Computing Circadian Light; International Building Performance Simulation Association: Hyderabad, India, 2015; Volume 2015, pp. 1103–1109. [Google Scholar]
  40. RADSITE. Available online: https://www.radiance-online.org/learning/documentation (accessed on 28 October 2020).
  41. LLC Sollemma ALFA—Adaptive Lighting for Alertness. Available online: https://www.solemma.com/Alfa.html (accessed on 30 October 2020).
  42. Emde, C.; Buras-Schnell, R.; Kylling, A.; Mayer, B.; Gasteiger, J.; Hamann, U.; Kylling, J.; Richter, B.; Pause, C.; Dowling, T.; et al. The LibRadtran Software Package for Radiative Transfer Calculations (Version 2.0.1). Geosci. Model. Dev. 2016, 9, 1647–1672. [Google Scholar] [CrossRef]
  43. Pierson, C.; Gkaintatzi-Masouti, M.; Aarts, M.P.J.; Andersen, M. Validation of Spectral Simulation Tools for the Prediction of Indoor Electric Light Exposure. In Proceedings of the CIE x048:2021, International Commission on Illumination, Online, 27–29 September 2021; pp. 52–62. [Google Scholar]
  44. Pierson, C.; Aarts, M.P.J.; Andersen, M. Validation of Spectral Simulation Tools for the Prediction for Indoor Daylight Exposure. In Proceedings of the Building Simulations 2021, Bruges, Belgium, 1–3 September 2021; pp. 1–8. [Google Scholar]
  45. Potočnik, J.; Košir, M. Assessment of multispectral simulation tools for the evaluation of the circadian luminous environment. Gradbeni Vestnik 2022, 71, 111–125. [Google Scholar]
  46. Inanici, M.; Abboushi, B.; Safranek, S. Evaluation of Sky Spectra and Sky Models in Daylighting Simulations. Light. Res. Technol. 2022, 1–28. [Google Scholar] [CrossRef]
  47. Maskarenj, M.; Bertrand, D.; Altmonde, S. A New Tool and Workflow for the Simulation of the Non-Image Forming Effects of Light. Energy Build. 2022, 262, 112012. [Google Scholar] [CrossRef]
  48. Truong, W.; Trinh, V.; Khanh, T.Q. Circadian Stimulus—A Computation Model with Photometric and Colorimetric Quantities. Light. Res. Technol. 2019, 52, 751–762. [Google Scholar] [CrossRef]
  49. Babilon, S.; Beck, S.; Kunkel, J.; Klabes, J.; Myland, P.; Benkner, S.; Khanh, T.Q. Measurement of Circadian Effectiveness in Lighting for Office Applications. Appl. Sci. 2021, 11, 6936. [Google Scholar] [CrossRef]
  50. Truong, W.; Zandi, B.; Trinh, V.Q.; Khanh, T.Q. Circadian Metric—Computation of Circadian Stimulus Using Illuminance, Correlated Colour Temperature and Colour Rendering Index. Build. Env. 2020, 184, 107146. [Google Scholar] [CrossRef]
  51. Potočnik, J.; Košir, M. Influence of Commercial Glazing and Wall Colours on the Resulting Non-Visual Daylight Conditions of an Office. Build. Environ. 2020, 171, 106627. [Google Scholar] [CrossRef]
  52. Potočnik, J.; Košir, M. Influence of Geometrical and Optical Building Parameters on the Circadian Daylighting of an Office. J. Build. Eng. 2021, 42, 102402. [Google Scholar] [CrossRef]
  53. Potočnik, J.; Košir, M. In-Situ Determined Circadian and Visual Daylighting Potential of an Office. In Proceedings of the International Conference on Sustainable Built Environment, SBE19 Seoul, Seoul, Korea, 12–13 December 2019. [Google Scholar]
  54. Solemma Climate Studio. Available online: https://www.solemma.com/climatestudio (accessed on 18 September 2022).
  55. Vaz, N.A.; Inanici, M. Syncing with the Sky: Daylight-Driven Circadian Lighting Design. Leukos 2020, 17, 291–309. [Google Scholar] [CrossRef]
  56. Potočnik, J.; Košir, M. Predicting the Melanopic Potential of Indoor Coloured Surfaces Using Artificial Neural Networks. In GNP 2022 Proceedings, Proceedings of the The Eighth International Conference Civil Engineering—Science & Practice, Kolašin, Montenegro, 8–12 March 2022; Rakočević, M., Šćepanović, B., Eds.; University of Montenegro Faculty of Civil Engineering: Kolašin, Montenegro, 2022; pp. 688–691. [Google Scholar]
  57. Jakubiec, A. A Data-Driven Selection of Typical Opaque Material Reflectances for Lighting Simulation. Leukos 2022, 19, 176–189. [Google Scholar] [CrossRef]
  58. LBL Optics. Available online: https://windows.lbl.gov/tools/optics/software-download (accessed on 21 April 2020).
  59. Reinhart, C.F.; Walkenhorst, O. Validation of Dynamic RADIANCE-Based Daylight Simulations for a Test Office with External Blinds. Energy Build. 2001, 33, 683–697. [Google Scholar] [CrossRef]
  60. Sollemma Climate Studio Docs. Available online: https://climatestudiodocs.com/docs (accessed on 18 September 2022).
  61. Yamín Garretón, J.; Villalba, A.M.; Rodriguez, R.G.; Pattini, A. Roller Blinds Characterization Assessing Discomfort Glare, View Outside and Useful Daylight Illuminance with the Sun in the Field of View. Sol. Energy 2021, 213, 91–101. [Google Scholar] [CrossRef]
  62. Villalba, A.; Correa, E.; Yamín, J.; Pattini, A. Effect of Roller Shades on Chromaticity and Colour Rendering Performance of Transmitted Daylight. J. Daylighting 2022, 9, 1–12. [Google Scholar] [CrossRef]
  63. Parsaee, M.; Demers, C.M.H.; Lalonde, J.-F.; Potvin, A.; Inanici, M.; Hébert, M. Human-Centric Lighting Performance of Shading Panels in Architecture: A Benchmarking Study with Lab Scale Physical Models under Real Skies. Sol. Energy 2020, 204, 354–368. [Google Scholar] [CrossRef]
  64. Sadeghi, R.; Mistrick, R. The Impact of Exterior Surround Detail on Daylighting Simulation Results. Leukos 2021, 18, 341–356. [Google Scholar] [CrossRef]
  65. Šprah, N.; Košir, M. Daylight Provision Requirements According to EN 17037 as a Restriction for Sustainable Urban Planning of Residential Developments. Sustainability 2019, 12, 315. [Google Scholar] [CrossRef]
  66. Diakite-Kortlever, A.K.; Knoop, M. Non-Image Forming Potential in Urban Settings—An Approach Considering Orientation-Dependent Spectral Properties of Daylight. Energy Build. 2022, 265, 112080. [Google Scholar] [CrossRef]
  67. Iversen, A.; Nielsen, T.R.; Svendsen, S.H. Illuminance Level in the Urban Fabric and in the Room. Indoor Built Environ. 2011, 20, 456–463. [Google Scholar] [CrossRef]
  68. Gkaintatzi-Masouti, M.; van Duijnhoven, J.; Aarts, M.P.J. Review of Spectral Lighting Simulation Tools for Non-Image- Forming Effects of Light. J. Phys. Conf. Ser. 2021, 2042, 012122. [Google Scholar] [CrossRef]
Figure 1. Methodological approaches of the study. Spectrally discerning methodology for non-visual assessment (left) and non-spectral methodology for the visual assessment of the study (right).
Buildings 13 01357 g001
Figure 2. Sky cover, global horizontal, diffuse horizontal and direct normal illuminances for Ljubljana used in CBDM photopic simulations and simplified climate-based spectral months used in the non-visual CBDM simulations.
Buildings 13 01357 g002
Figure 3. Simulation model setup of four identical offices. Materials used in the simulations (top) and combinations used in individual simulation cycles (bottom). The lines drawn in the material swatches represent the relative SPDs of material reflectance/transmittance for the range from 380 to 780 nm.
Buildings 13 01357 g003
Figure 4. Average ACP and tRCE of the offices according to different view orientations (Az) and studied dates concerning the warm, neutral and cold cycles under clear sky conditions.
Buildings 13 01357 g004
Figure 5. Average ACP and tRCE of the offices according to different view orientations (Az) and studied dates concerning the warm, neutral and cold cycles under hazy sky conditions.
Buildings 13 01357 g005
Figure 6. Average ACP and tRCE of the offices according to different view orientations (Az) and studied dates concerning the warm, neutral and cold cycles under overcast sky conditions.
Buildings 13 01357 g006
Figure 7. Monthly climate-based evaluation of ACP and DGP for December, March and June, south office orientation (OS) under neutral (top) and warm cycles (bottom).
Buildings 13 01357 g007
Figure 8. Monthly climate-based evaluation of ACP and DGP for December, March and June, south office orientation (OW) under neutral (top) and warm cycles (bottom).
Buildings 13 01357 g008
Figure 9. Monthly climate-based evaluation of ACP and DGP for December, March and June, south office orientation (ON) under neutral (top) and warm cycles (bottom).
Buildings 13 01357 g009
Table 1. CCT ranges of all simulated skies.
Sky Type DecemberMarchJune
clear skyNorth sky7479–8366 K6312–7237 K3746–8147 K
East sky4123–8617 K3530–8373 K5923–8118 K
South sky4033–5855 K3752–7754 K4041–7164 K
West sky4071–8370 K4971–6951 K3560–8271 K
hazy skyNorth sky6116–7898 K5576–7167 K4710–6115 K
East sky4452–7452 K4298–8051 K4147–7828 K
South sky4134–6320 K4051–7851 K4136–6485 K
West sky4414–8034 K4618–7144 K5385–7599 K
overcast skyNorth sky5930–6793 K5719–6207 K5670–6720 K
East sky5902–6790 K5707–6242 K5659–6804 K
South sky5865–6696 K5694–6145 K5653–6799 K
West sky5897–6793 K5674–6183 K5650–5877 K
Disclaimer/Publisher’s Note: The statements, opinions and data contained in all publications are solely those of the individual author(s) and contributor(s) and not of MDPI and/or the editor(s). MDPI and/or the editor(s) disclaim responsibility for any injury to people or property resulting from any ideas, methods, instructions or products referred to in the content.

