Article

Development of Engineered Cementitious Composites (ECCs) Incorporating Iron Ore Tailings as Eco-Friendly Aggregates

1
School of Civil Engineering, Xi’an University of Architecture & Technology, Xi’an 710055, China
2
China Railway 20th Bureau Group Co., Ltd., Xi’an 710016, China
*
Author to whom correspondence should be addressed.
Buildings 2023, 13(5), 1341; https://doi.org/10.3390/buildings13051341
Submission received: 1 April 2023 / Revised: 20 April 2023 / Accepted: 17 May 2023 / Published: 20 May 2023

Abstract

:
In this study, iron ore tailings (IOTs) are used as aggregates to prepare iron-ore-tailing-engineered cementitious composites (IOT-ECCs) to achieve clean production. Some mechanical indexes, such as compressive strength (fcu), four-point flexural strength (ff), axial compressive strength (fc), deformation properties, flexural toughness, and stress–strain behavior, are studied. The mass loss, fcu loss, relative dynamic modulus elasticity (RDEM), and deterioration mechanism after the sulfate freeze–thaw (F-T) cycle are discussed in detail. In addition, pore structure analysis is performed using nuclear magnetic resonance (NMR), while a scanning electron microscope (SEM) is utilized to study the micro-morphology. The results showed that under the 20–80% IOT replacement ratio, IOT-ECCs exhibited improvements in their mechanical properties, pore structure, and resistance to sulfate freeze–thaw (F-T). The most notable mechanical properties and sulfate F-T resistance were demonstrated by the IOT-ECC with 40% IOTs (namely, IOT40-P2.0). Meanwhile, IOT40-P2.0 exhibited good pore structure as well as the bonding interface of the PF and the matrix. The pore structure and compactness of the matrix of IOT-ECCs gradually deteriorated as the F-T cycle increased. The research results will promote the application of IOTs in ECCs.

1. Introduction

Engineered cementitious composites (ECCs), a type of cement-based composite material, demonstrate exceptional tensile ductility [1,2,3]. It was reported that the deformability of ECCs with 2% polyvinyl alcohol (PVA) fiber (PF) can reach 3–5% [3]. The ability of outstanding tensile ductility and multi-crack expansion result in significant enhancements to their mechanical properties and durability, compared to normal concrete. However, the raw material silica sand (S) used to prepare ECCs is relatively expensive, which leads to an increase in the production cost of ECCs and restricts their wider application. In addition, the manufacture of S emits a large amount of CO2, which creates a greater environmental burden. Therefore, looking for a replacement for S to produce eco-friendly ECCs has become a popular research topic [4,5]. To date, some waste materials, including waste glass aggregate [6], recycled fine aggregates [7], limestone powder [8], etc., have been used to produce green ECCs, and it has been found that industrial waste as an eco-friendly substitute for the preparation of ECCs can not only reduce the excessive consumption of natural resources but also reduces the production cost of ECCs.
Iron ore tailings (IOTs), as one of the main industrial by-products, are gradually growing, which results in both land occupation and soil pollution, seriously affecting the ecological environment [9]. The effective utilization of IOTs has aroused great concern globally [10,11]. At present, some studies have found that because the composition is similar to that of S and the microstructure and quality are relatively stable, IOTs have better potential to be used as an alternative to S in preparing IOT cementitious composites than other industrial by-products [12]. Meanwhile, some researchers have found that adding IOTs can improve the performance of the cementitious composite [13,14]. For example, Shettima et al. [15] found that some strength indexes of concrete mixed with IOTs are better than those of the control group (without IOTs), but the workability is the opposite. Jz et al. [16] reported that the workability, mechanical properties, and durability of concrete are improved by adding appropriate replacement IOTs. Similarly, Liu et al. [17] found that the ideal IOT replacement ratio is 40% in concrete. The concrete incorporating 40% IOTs had the lowest porosity and a denser microstructure, which exhibited the best mechanical properties and sulfate attack, and dry–wet cycle resistance. In addition, Huang et al. [18] prepared ECCs by incorporating IOTs with different particle sizes as aggregates and reported that when the particle size of the IOTs used was within a reasonable range, the same mechanical properties as conventional ECCs could be obtained. Previous studies have found that industrial by-product IOTs have a good prospect for the production of cementitious composites as potential aggregates.
However, previous studies found that there are still few studies on using IOTs as a fine aggregate to prepare ECCs. It is noteworthy that limited studies on iron-ore-tailing-engineered cementitious composites (IOT-ECCs) have focused on the effects of IOTs on the macroscopic mechanical properties of ECCs, while studies on the effects of sulfate freeze–thaw resistance, pore structure from nuclear magnetic resonance (NMR), and microstructure are relatively scarce. It is necessary to conduct more in-depth research on IOT-ECC from mesoscopic and microscopic points of view. This paper provides a comprehensive evaluation of IOT-ECCs prepared by replacing S with IOTs. It mainly explains the influence of IOTs on macroscopic mechanical properties and sulfate freeze–thaw resistance through the analysis method of the combination of pore structure and microstructure. The results of this study will broaden the existing literature on IOTs and promote the application of IOTs in ECCs.
Thus, this paper is devoted to carrying out comprehensive research on IOT-ECCs from both mesoscopic and microscopic points of view. Firstly, the main components, micro-morphology, and physical properties of the IOTs were tested. Secondly, the mechanical properties including the compressive strength (fcu), four-point flexural strength (ff), axial compressive strength (fc), deformation properties, flexural toughness, and stress–strain behavior of IOT-ECCs were analyzed in detail. At the same time, the test of sulfate F-T cycles was carried out. Some indexes including mass loss, fcu loss, and relative dynamic elastic modulus (RDEM) of IOT-ECCs were measured. Finally, nuclear magnetic resonance (NMR) was employed to analyze pore structure, and the scanning electron microscope (SEM) was utilized to conduct microscopic characteristics analysis.

2. Materials and Methods

2.1. Materials

2.1.1. Cementitious Material

The cementitious materials included cement (PO42.5R of Type II), metakaolin, and first-grade fly ash. The chemical composition of the three materials are shown in Table 1.

2.1.2. Fine Aggregate

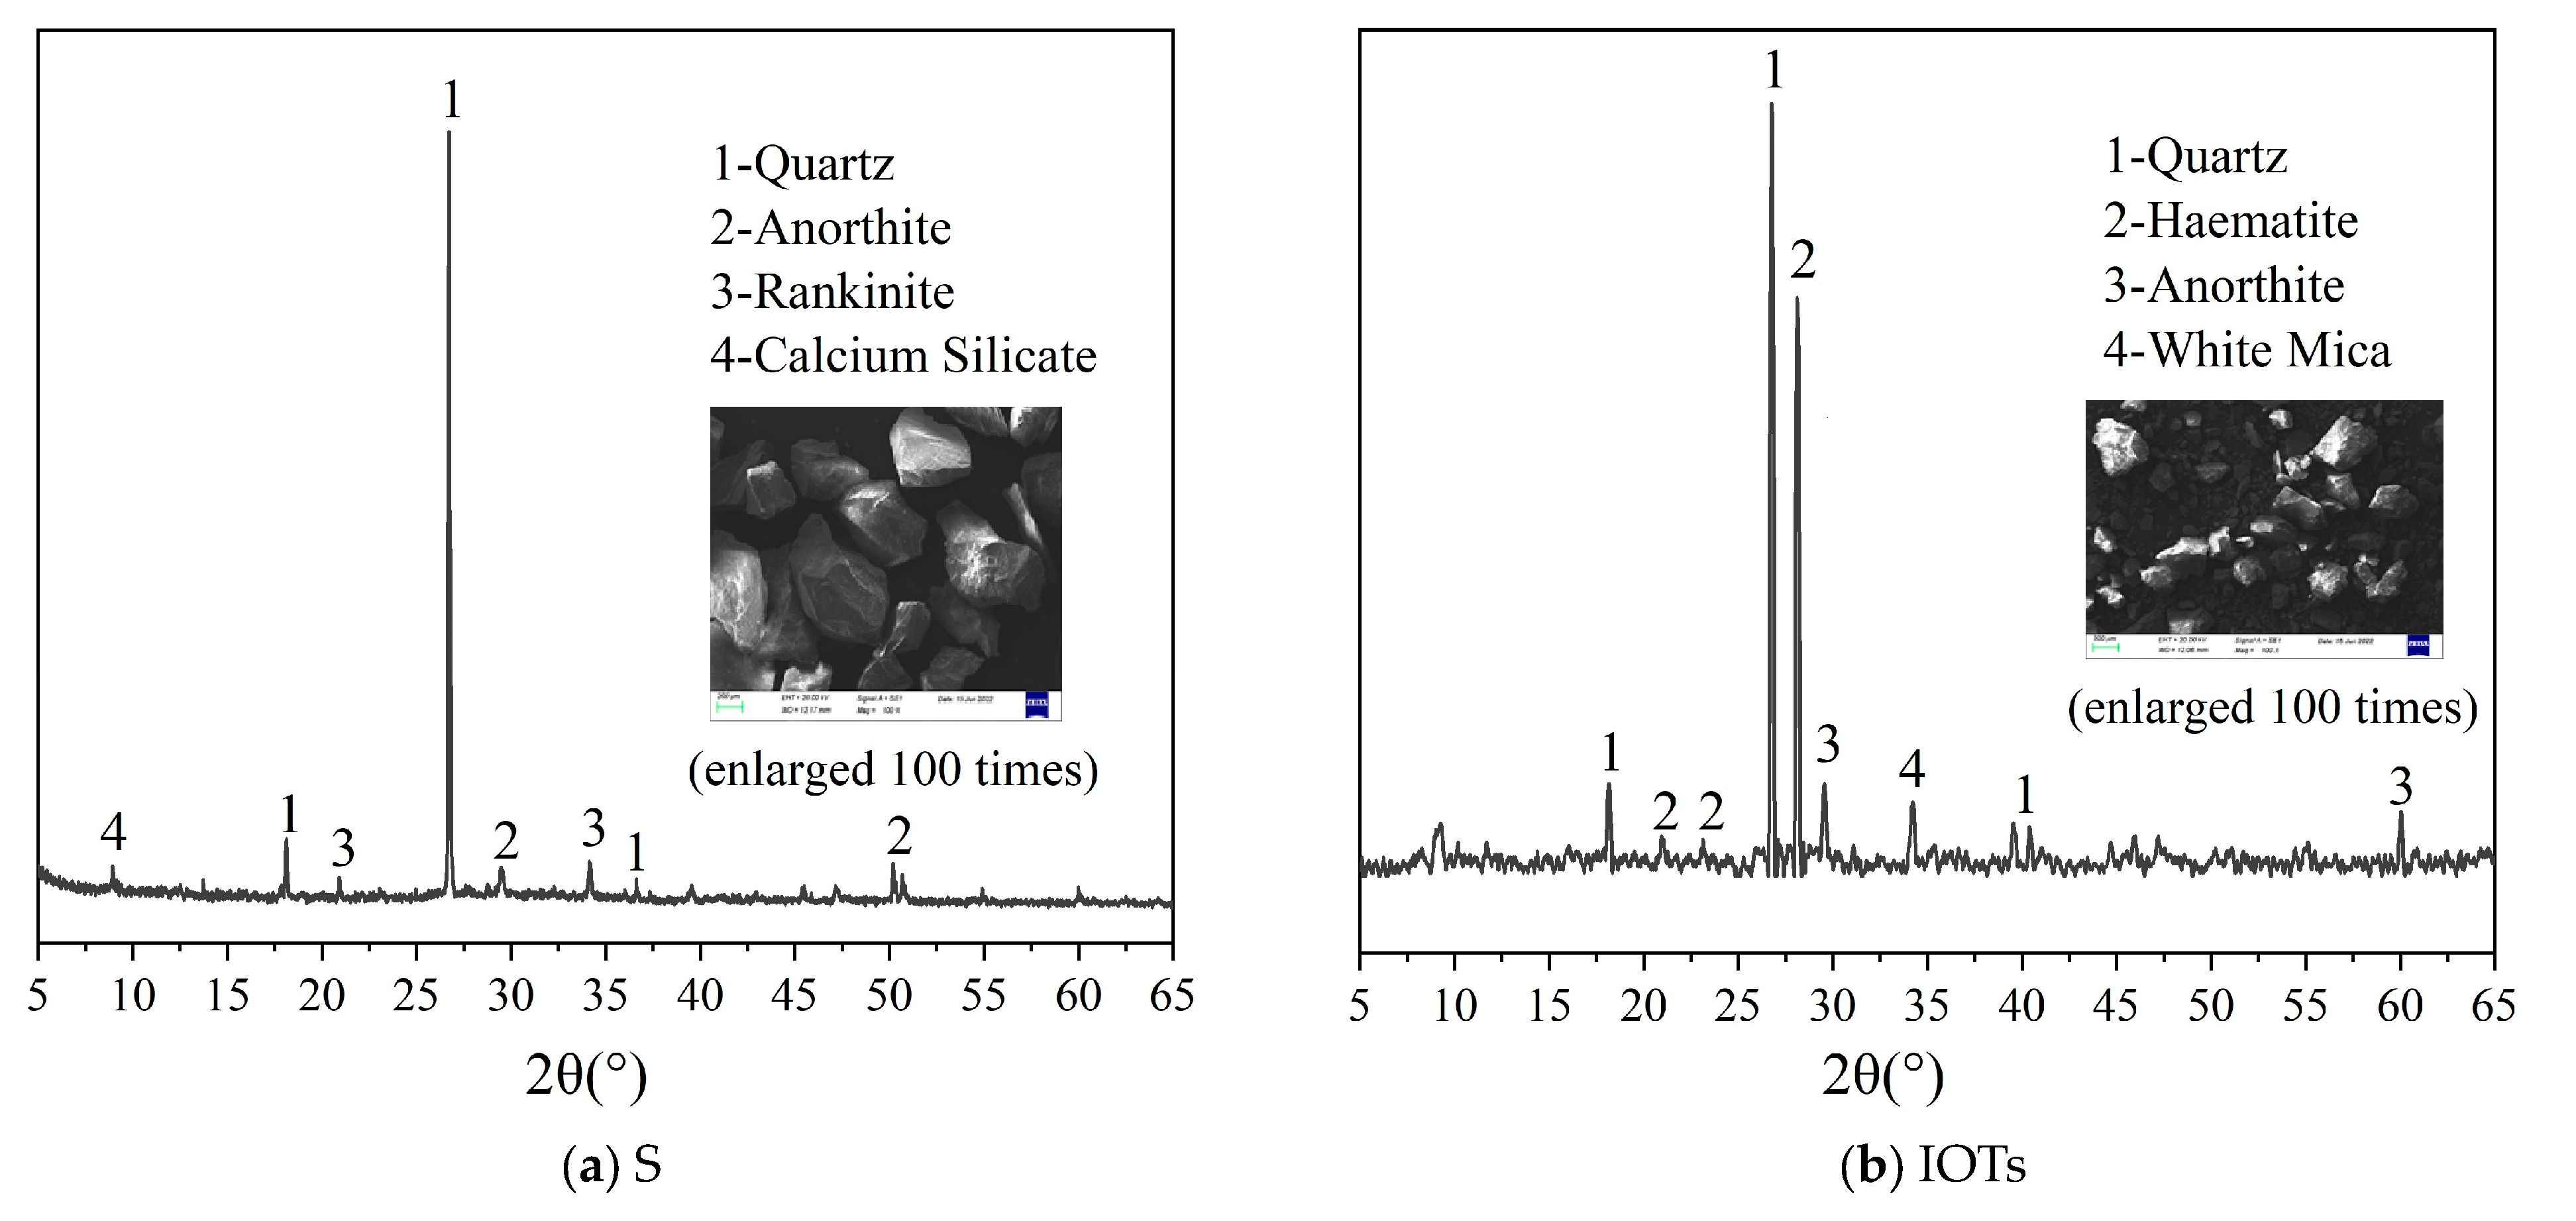
The fine aggregate used in this study comprised S and IOTs obtained from the Yaogou tailings pond in Shaanxi Province, and the main physical characteristics of S and IOTs are listed in Table 2. Meanwhile, the XRD and SEM techniques were employed to determine the main components and micro-morphology of S and IOTs, as shown in Figure 1. 
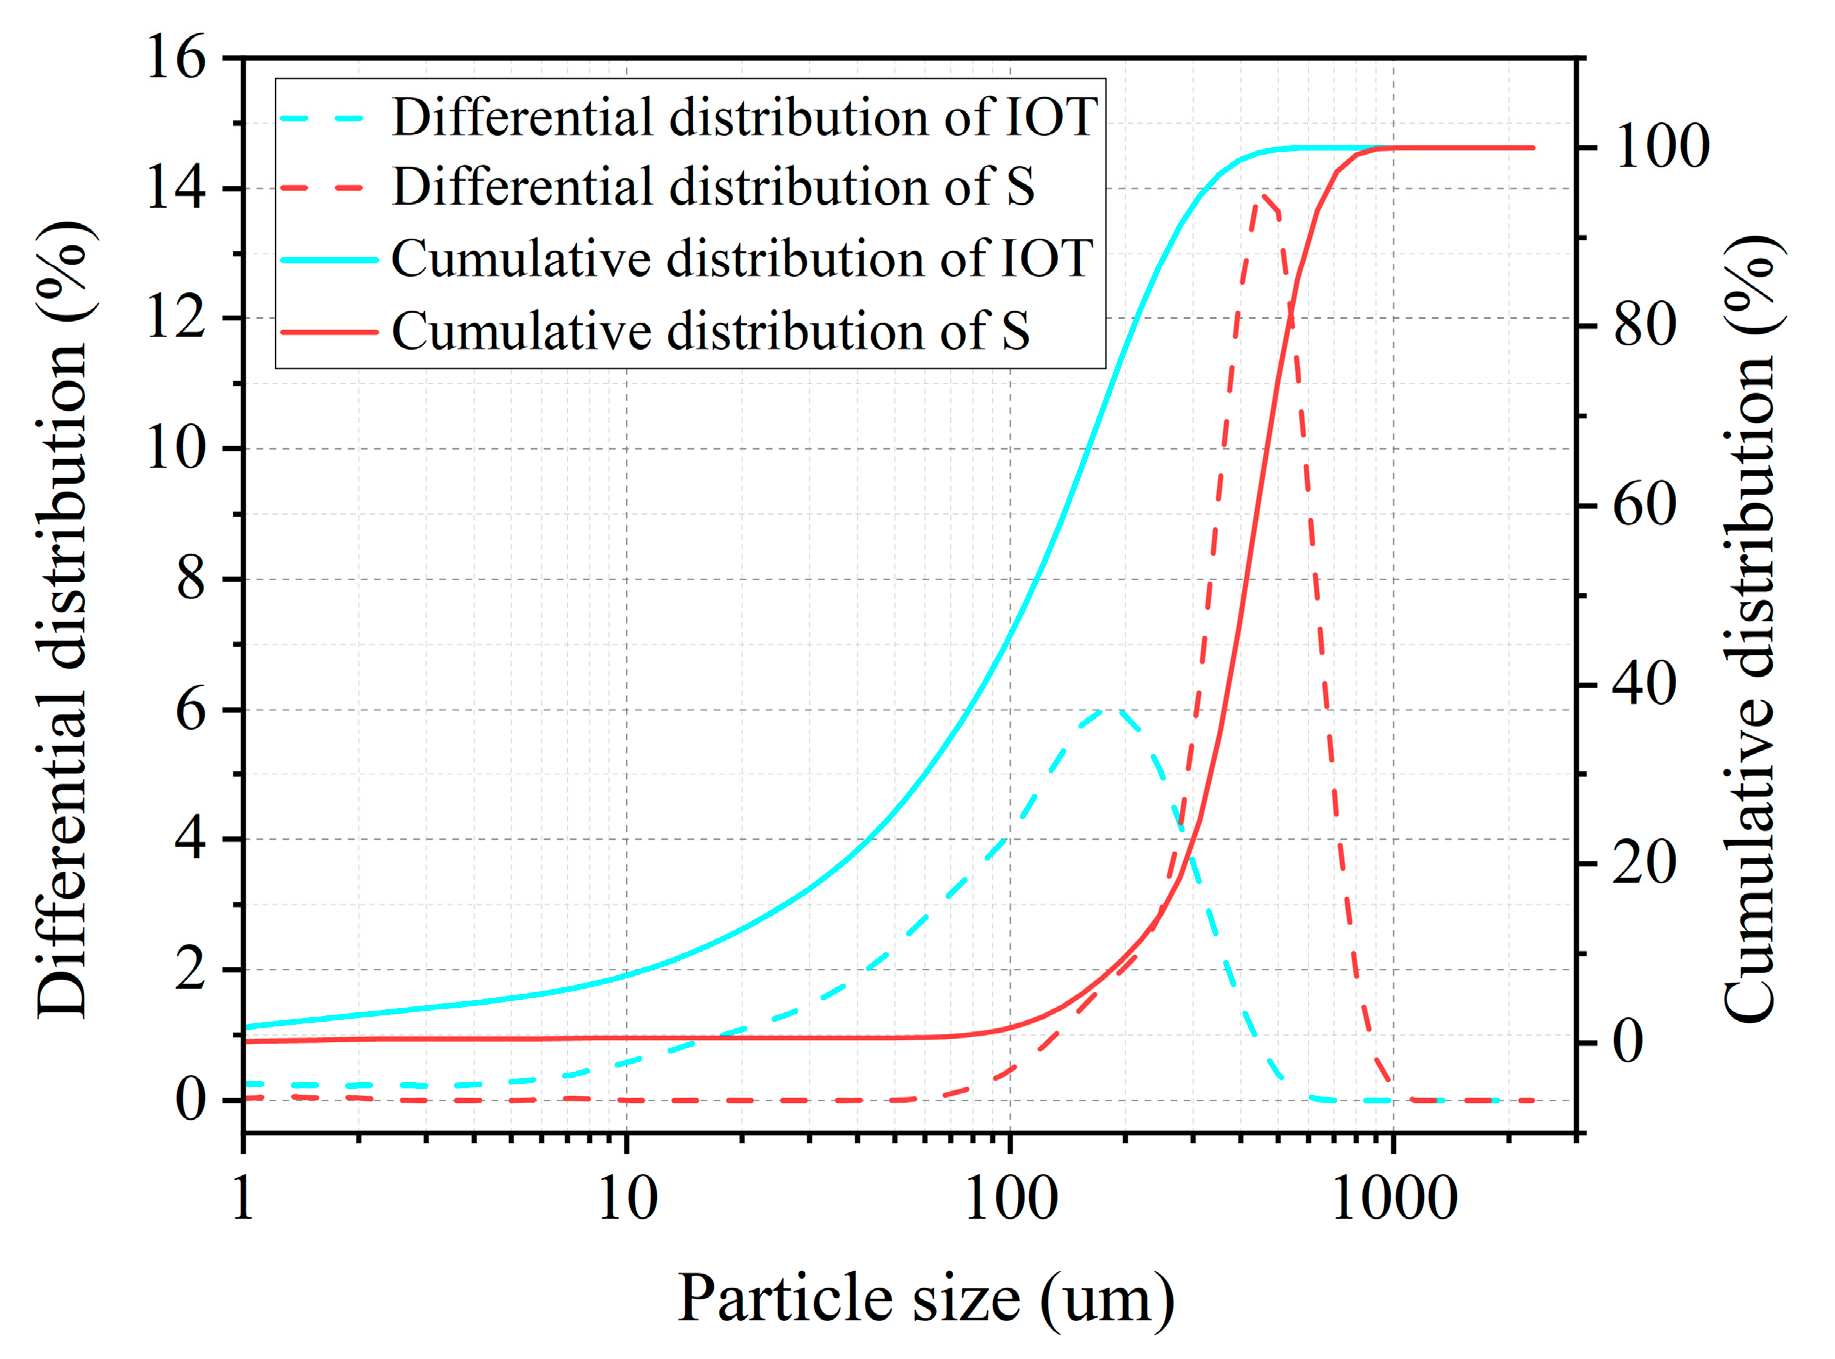
Figure 2 presents the particle size distribution curves of S and IOTs.

2.1.3. Fiber

The fiber used was PF, with its characteristic parameters shown in Table 3.

2.2. Mix Proportions

According to our team’s existing research results [12,17], as well as some previous studies [19,20,21], the IOT replacement ratio was 0%, 20%, 40%, 60%, 80%, and 100%, respectively. The water/cementitious and cementitious/aggregates were set at 0.3 and 0.45, respectively. The volume content of PF was designed to be 2% [3,18]. Table 4 lists the mix proportions for the six groups.
In the nomenclature, “IOT20-P2.0” is used as an example, where “IOT” refers to iron ore tailing. “P” stands for polyvinyl alcohol (PVA) fiber. The numbers “20” and “2.0” represent the IOT replacement ratio of 20% and PF volume content of 2.0%, respectively.

2.3. Experimental Instruments

The testing instrument mainly comprised a computer-controlled electro-hydraulic servo universal testing machine from MTS, an NMR instrument (MacroMR12-150H-I) manufactured by New’mai Company (Suzhou, China), and a rapid freeze–thaw (F-T) machine. In addition, S-4800 cold field emission SEM was also used.

2.4. Research Program

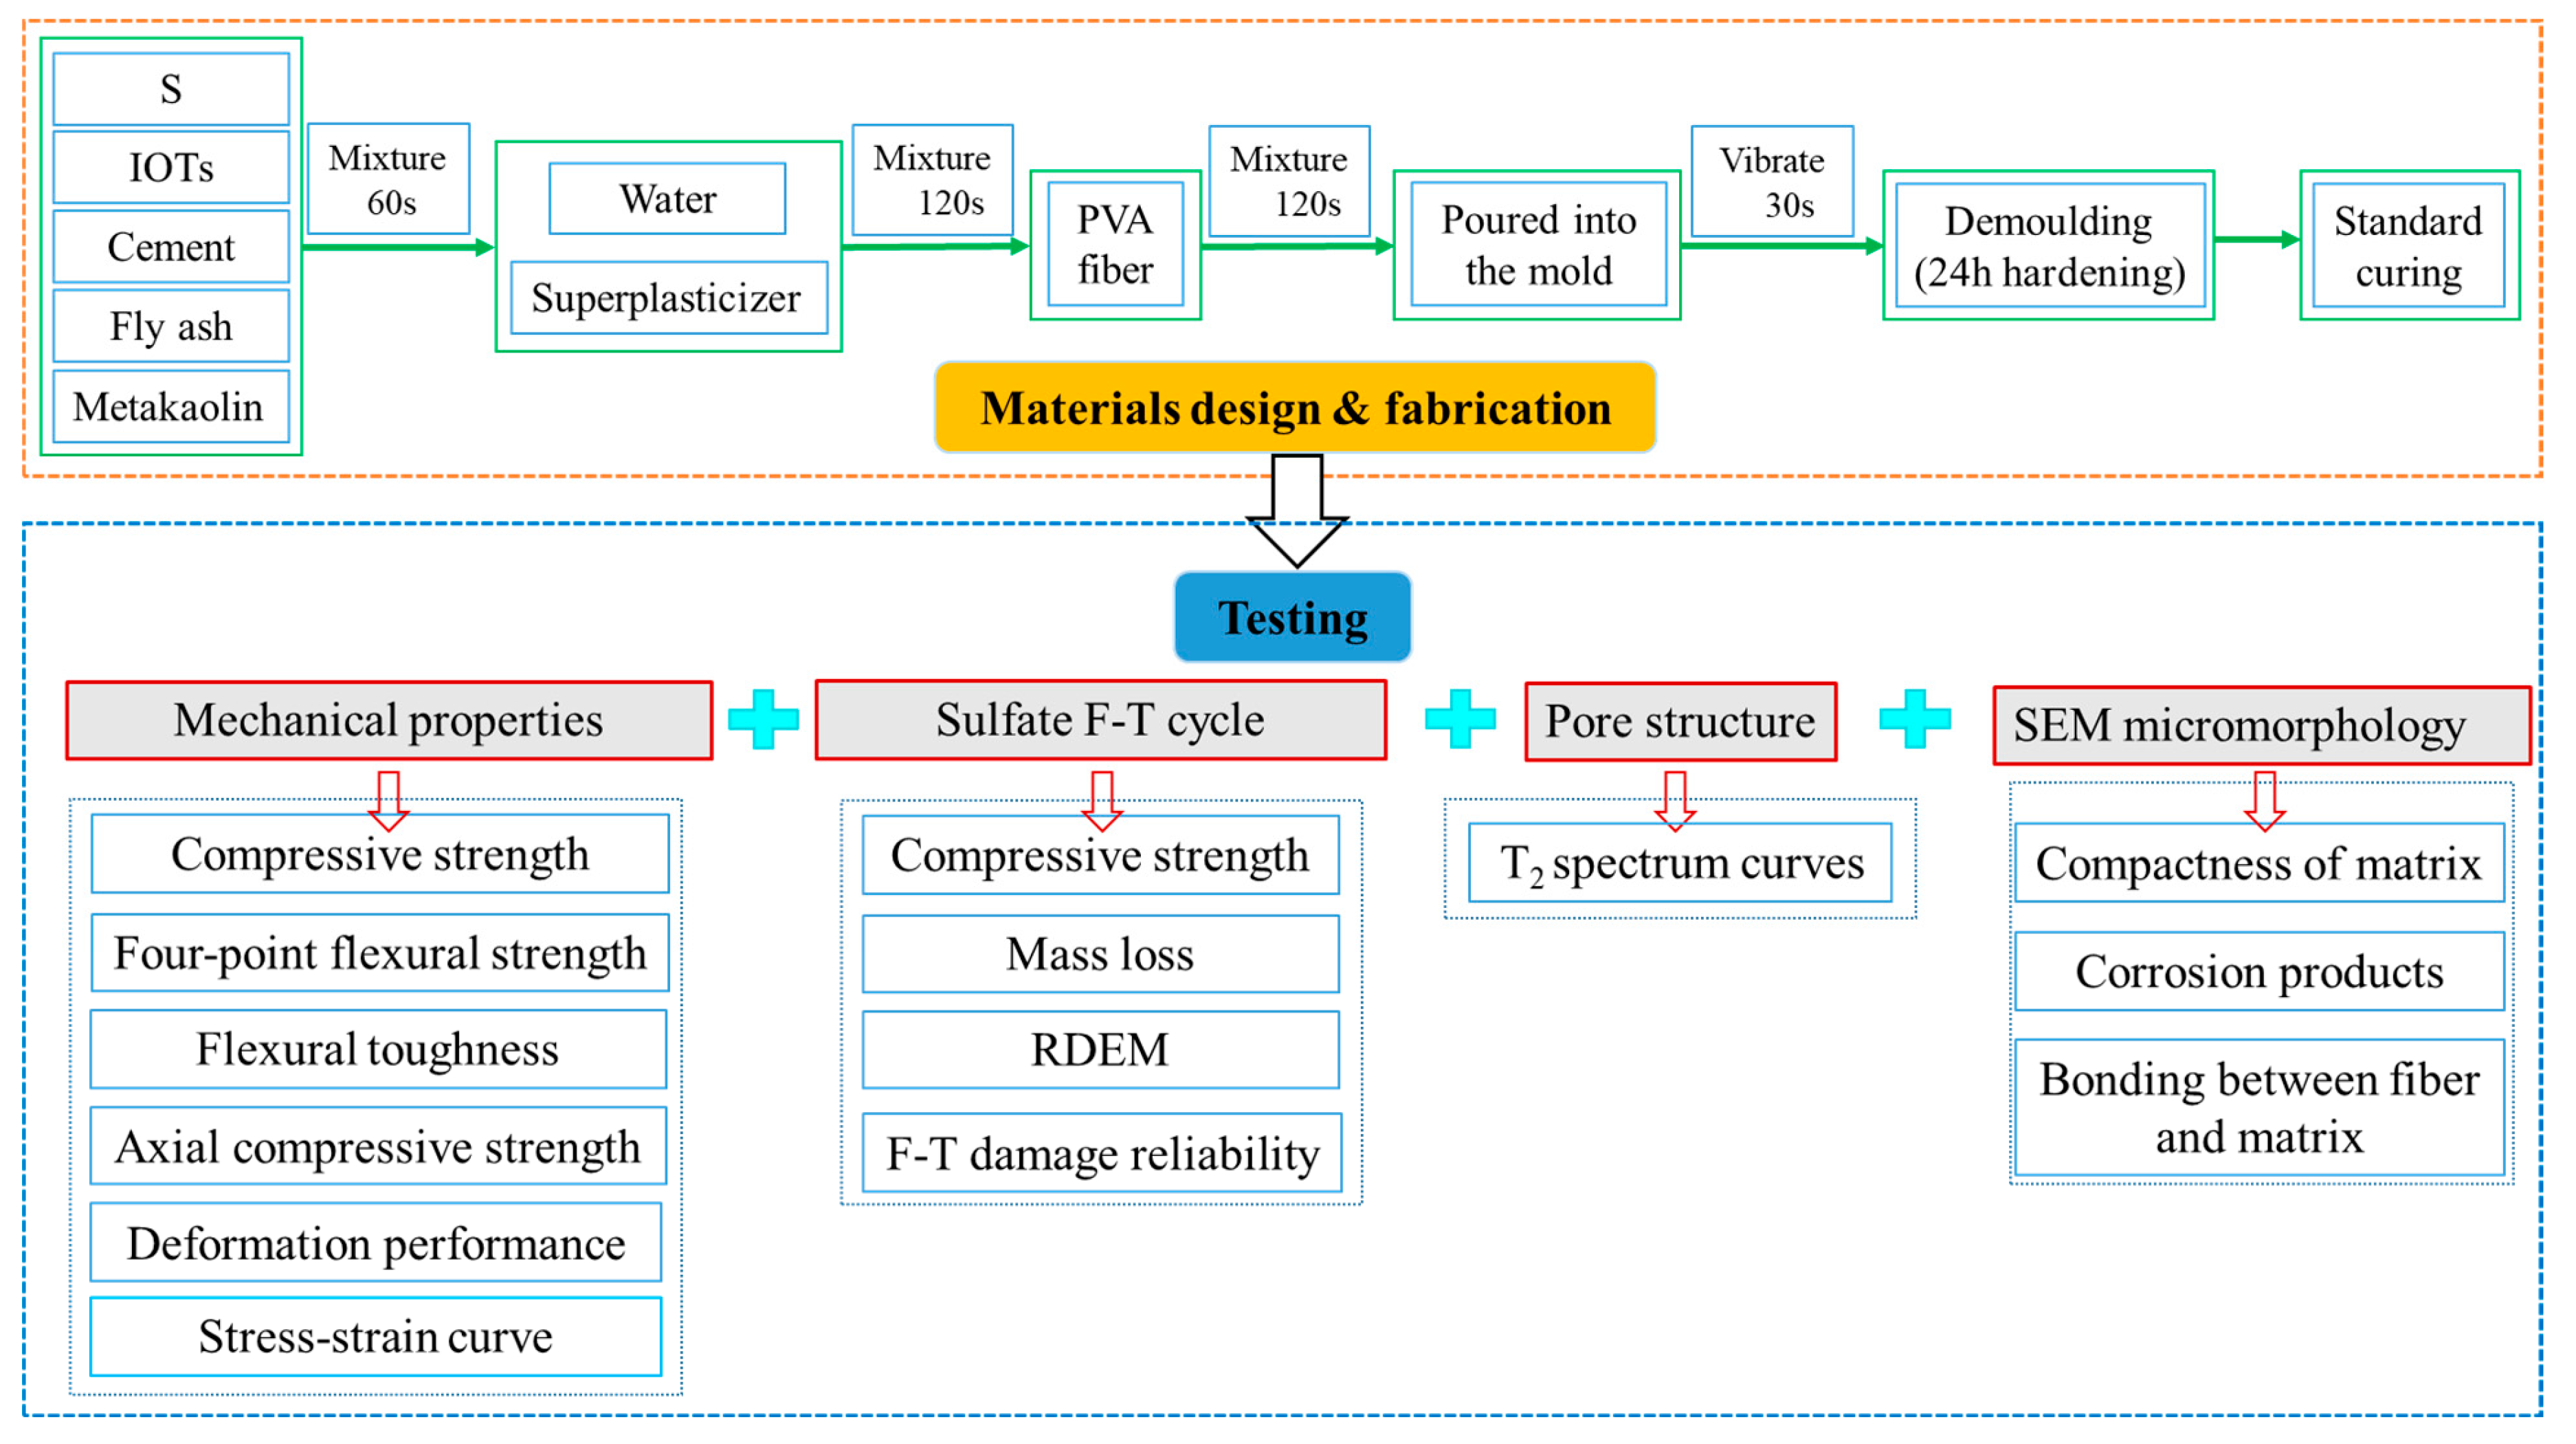
The research program for this paper is presented in Figure 3. Six groups of mixtures were prepared and then studied. The mechanical properties, sulfate F-T cycles, pore structure, as well as microscopic characteristics of the IOT-ECC were evaluated.

2.5. Test Method

According to the Chinese national standard GB/T 50081-2018 and CESC13-2009, the fcu, four-point ff, and fc were evaluated using 100 mm × 100 mm × 100 mm cubes, 300 mm (length) × 76 mm (width) × 13 mm (thickness) plates, and Φ100 mm (diameter) × 200 mm (high) cylinders, respectively. In addition, the control method of displacement was applied for fc test and the loading speed selected was 0.1 mm/min.
The sulfate F-T resistance test was conducted using the rapid F-T machine (temperature of the specimen center from −18.0 ±1 to 5.0 ±1 °C) following the Chinese standard GB/T 50082-2009. A solution of Na2SO4 with a concentration of 5% was utilized. Before the test, the specimens—that is, (100 × 100 × 100 mm) cubes and (100 × 100 × 400 mm) prisms—were placed in the water and immersed for 4 days and then were dried, to test the initial compressive strength, initial elastic modulus, and initial mass, respectively. Finally, the specimens were placed in the automatic rapid concrete freeze–thaw machine and related indexes were tested after every 50 F-T cycles.
In terms of microstructure, the pore structure and micro-morphology were tested. Before conducting the pore structure test, specimens were saturated in a pressurized device to allow complete water penetration before testing, after which the test was carried out. In addition, the specimens with sizes being approximately 5 mm × 5 mm × 2 mm were taken from 100 mm × 100 mm × 100 mm specimens with varying sulfate F-T cycles and then were imaged using an S-4800 cold field emission SEM. The prepared samples underwent pre-treatment, which involved drying at 40 °C for 24 h and coating with gold spray before testing.

3. Mechanical Properties of IOT-ECC

3.1. Compressive Strength

The fcu of IOT-ECCs was tested after 28 d, as shown in Figure 4. It can be seen from Figure 4a that the fcu of the IOT-ECCs increases first and then decreases as the IOT replacement ratio increases. Upon reaching 80% of the IOT replacement ratio, the IOTs have a positive effect on the fcu of the IOT-ECCs, especially 40%. For example, the fcu of IOT20-P2.0, IOT40-P2.0, IOT60-P2.0, and IOT80-P2.0 are increased by 10.73%, 15.94%, 7%, and 8.7%, respectively, compared with IOT0-P2.0. Similar observations have been observed in previous studies [22]. However, under the 100% IOT replacement ratio, the fcu of IOT100-P2.0 is lower than that of IOT0-P2.0. Similarly, Zhang et al. [23] and Zhao et al. [5] reported that the fcu of ultra-high-performance concrete with a 100% IOT replacement ratio decreased by 9.5% and 14%. This is because internal pores could be filled and optimized by the fine IOT particles when incorporating up to 80% IOTs, increasing the bonding stress between the PF and the matrix [24], resulting in the spatial grid system formed by the randomly distributed fibers in the matrix being firm [25,26]. However, when incorporating a 100% IOT replacement ratio, the decrease in cement slurry per unit area is caused by the high specific surface area of the IOTs, which reduces the bonding strength. Another main reason for the decrease in fcu is due to the formation of hydration products around the un-hydrated cement, which hinders further hydration, resulting in increased porosity. This is also confirmed in Section 5 and Section 6.
The relationship between the IOT replacement ratio and the fcu obtained is shown in Equation (1). Figure 3 shows the comparison between the experimental values and the predicted values calculated by Equation (1). It can be seen that the error range is −4–7%, which is relatively small.
f c u , i = f c u , 0 ( 1 + 0.00627 i 0.000065 i 2 )
where i is the IOT replacement ratio. The fcu,0 presents the compressive strength of ECCs without IOTs. The fcu,i present the compressive strength of ECCs with IOTs.

3.2. Four-Point Flexural Strength

The ff test results are shown in Figure 5. Similar to the changing trend of the fcu, an increase initially and then a decreasing trend is also observed in the ff as the IOT replacement ratio increases. The ff of IOT40-P2.0 reaches the maximum value at the 40% IOT replacement ratio. Unfortunately, when the IOT replacement ratio is more than 80%, the ff of the IOT-ECC is reduced. For example, the ff of IOT20-P2.0, IOT40-P2.0, and IOT60-P2.0 increased by 8.17%, 14%, and 10.3%, respectively. The ff of IOT80-P2.0 and IOT100-P2.0 decreased by −1.7% and −3.14%, respectively, compared with IOT0-P2.0. This is mainly due to the fact that the fine particles of IOTs can effectively fill the pores inside the matrix and at the interface of the PF and the matrix so that the crack resistance of the IOT-ECC is further strengthened by the increased bonding stress between the matrix and the PF. However, when the IOT replacement ratio is large, the amount of cement slurry attached to the IOTs per unit area is reduced, which weakens the bonding matrix and the PF. Meanwhile, poor gradation increases in the porosity result in the deterioration of the bonding between the matrix and the PF. Macroscopically, the ff is reduced.
It is well known that Equation (2) was used to describe the correlation between the fcu and ff. Various parameters a and b have been proposed by several national standards. For example, ACI(318-95) [27]: a = 0.54, b = 0.5; CEB-FIP: a = 0.81, b = 0.5. The relationship between the fcu and ff is fitted, as shown in Equation (3). The comparison between the test results and calculation results is shown in Table 5. The results obtained using the ACI(318-95) standard are relatively lower, with an error range from −24% to 33.6%, while the calculation results of CEB-FIP are higher and the error range is 0.1–13.9%. In summary, the results calculated by the ACI (318-95) and CEB-FIP are higher than those of the experimental results, making it difficult to apply them directly. However, the difference between the experimental results and the calculated values using Equation (3) is relatively small, with an error range from −7.7% to 5.5%.
f f = a × f c u b
f f = 0.75 f c u 0.5

3.3. Evaluation of Flexural Toughness

3.3.1. Load–Deflection Curve

The load–deflection curves under the four-point flexural test of the IOT-ECCs are shown in Figure 6. Each load–deflection curve shows obvious deflection hardening. When the IOT replacement ratio is up to 80%, the load–deflection curve is full and the deflection-hardening part is obvious, especially for IOT40-P2.0. As shown in Figure 7, the specimens of IOT40-P2.0 and IOT60-P2.0 are broken by multiple cracks, while the number of cracks in IOT100-P2.0 is less.

3.3.2. Flexural Toughness Index

Flexural toughness is also an important indicator of material performance. At present, the flexural toughness of composite materials can be evaluated according to standards such as JSCE-SF4 in Japan, ASTM C1018 in the United States, CECS 13-2009 in China, and RILEM TDF-C162 in Europe, which define and evaluate flexural toughness from different angles. Among many evaluation methods, the ASTMC 1018 standard, as the basic evaluation method, has been widely used because of its clear physical meaning and independence from the size and shape of specimens. Therefore, the ASTMC 1018 standard was used to calculate the toughness index, with the results shown in Table 6.
The flexural toughness indexes I5, I10, and I20 are calculated using Equations (4)–(6), respectively.
I 5 = Ω 3.0 δ Ω δ
I 10 = Ω 5.5 δ Ω δ
I 20 = Ω 10.5 δ Ω δ
where δ is the mid-span deflection corresponding to the initial cracking point of the specimen (mm); Ωδ, Ω3., Ω5., and Ω10. are the areas under the load–deflection curves (N.mm) corresponding to the mid-span deflections of δ, 3.0δ, 5.5δ, and 10.5δ, respectively.
The toughness index of the IOT-ECCs was calculated. As the IOT replacement ratio increases, the toughness indexes (including I5, I10, and I20) of the IOT-ECCs first increase and then decrease, as shown in Table 6. The toughness indexes of IOT40-P2.0 are higher than those of others. For example, the I20 of IOT40-P2.0 increases by 43.7%, compared with IOT0-P2.0. The primary factor is that the “filling effect” of IOTs becomes prominent at an IOT replacement ratio of 40%, which reflects a significantly stronger bonding stress between the PF and the matrix.

3.4. Axial Compressive Strength

The fc is also a crucial parameter for evaluating the mechanical properties of IOT-ECCs in engineering design. Figure 8 illustrates in detail the effect of the IOT replacement ratio on the fc. Similarly, the fc of IOT40-P2.0 with a 40% IOT replacement ratio undergoes a marked increase, which increases by 12.5%. In contrast, the fc of IOT100-P2.0 shows a reduction of 5.7% when IOTs are completely replaced. Figure 9a–d show the failure phenomena. No spalling occurred in the samples as the IOT replacement ratio increased.
Similar to the ff discussed above, the fc could also be expressed by fcu. A linear relationship is established, as shown in Equation (7).
f c = 0.86 f c u

3.5. Deformation Performance

The deformation performance of the IOT-ECCs can be evaluated by peak strain and elastic modulus, as shown in Table 7. As the IOT replacement ratio increases, the increase in elastic modulus is not significant, while the peak strain of the IOT-ECCs first increases and then decreases. Under a 40% IOT replacement ratio, the peak strain of IOT40-P2.0 increases by 9.7%.

3.6. Compressive Stress–Strain Curve

The stress–strain curves of the IOT-ECCs under axial compression are shown in Figure 10. The ascending parts of the curves are approximately the same, and stress increases linearly before reaching peak stress. Beyond the point of maximum stress, the capacity to bear loads reduces, while the descending segments of the curves become steeper with the IOT replacement ratio.
A piecewise expression can be used to represent the dimensionless stress–strain curve, as described in the literature [28], as shown in Equations (8) and (9):
y = A x 1 + ( 2 A 3 ) x 2 + ( 2 A ) x 3 , 0 x 1
y = x B ( x 1 ) 2 + x , x 1
where x = ε/εcr, y = σ/σcr; εcr represents peak strain; σcr represents peak stress; and A and B represent the parameters of the shape of the curve.
Nonlinear regression analysis was carried out on the dimensionless stress–strain curve using Equations (8) and (9), and the theoretical curve obtained is shown in Figure 10. Table 8 displays the values of parameters A and B, and the correlation coefficients (R2). It can be found that the theoretical curve obtained is in excellent agreement with the test curve.

4. Sulfate F-T Resistance of IOT-ECCs

4.1. Compressive Strength

After 50, 100, 150, and 200 F-T cycles, the fcu of the IOT-ECCs under the sulfate F-T cycle is shown in Figure 11. The fcu of each species quickly decreases with the F-T cycle. For example, the fcu of IOT0-P2.0, IOT20-P2.0, IOT40-P2.0, IOT60-P2.0, IOT80-P2.0, and IOT100-P2.0 after 200 F-T cycles decreased by 54.19%, 46.13%, 42.17%, 42.33%, 52.4%, and 59.56%, respectively. The main cause of this is the gradual increase in internal deformation with the F-T cycle. Up to 80% IOTs can inhibit the decrease in fcu, especially 40%, which is significantly higher than that of IOT0-P2.0. However, a 100% IOT replacement ratio accelerates fcu reduction.

4.2. Mass Loss

The mass losses of the IOT-ECCs after 50, 100, 150, and 200 F-T cycles are presented in Figure 12. The mass loss of each specimen first increases and then quickly decreases with the F-T cycle. This is because, initially, SO42− diffuses by the pores into the specimens, which is consumed by Ca(OH)2, forming CaSO4·2H2O and 3CaO·Al2O3·CaSO4·31H2O, increasing specimen mass, as demonstrated in Equations (10) and (11). As corrosion progresses, an increasing amount of corrosion products (gypsum and ettringite) accumulate, exerting expansion forces on the inner walls of the pores. The pores undergo rapid expansion due to the combined effect of expansion force and F-T force, resulting in the formation of interconnected micro-cracks that hasten the deterioration of the matrix. After 200 F-T cycles, the mass losses of the IOT-ECCs with 20%, 40% 60%, and 80% IOTs are less than that of the IOT0-P2.0. Unfortunately, the mass loss of the IOT-ECC with 100% increased by 6.3% more than that of the IOT0-P2.0.
Na2SO4 + Ca(OH)2 + 2H2O→CaSO4·2H2O + 2Na2OH
4CaO·Al2O3·12H2O + 3Na2SO4 + 2Ca(OH)2 + 20H2O→3CaO·Al2O3·CaSO4·31H2O + 6NaOH

4.3. RDEM

The RDEM is another crucial indicator for assessing the durability of IOT-ECCs. The RDEM of the IOT-ECCs after 50, 100, 150, and 200 F-T cycles are shown in Figure 13. The RDEM trend follows a similar pattern to the mass loss. The RDEM of the IOT-ECCs increases as a result of effective pore filling by gypsum and ettringite under fewer than 50 F-T cycles. However, the RDEM of each specimen decreases rapidly after 100–200 F-T cycles, especially for IOT100-P2.0. This is mainly because the change in the RDEM is closely linked to the internal pores. The increase in F-T cycles leads to the formation of numerous micro-cracks, which accelerate deterioration and decrease the RDEM. The RDEM of the IOT-ECC with 100% IOTs decreased by 8% more than that of the IOT0-P2.0 after 200 F-T cycles. In contrast, the RDEM of the remaining specimens, including IOT-ECCs with 20%, 40%, 60%, and 80% IOTs, are higher than that of the IOT0-P2.0.

4.4. F-T Damage Reliability

Gradual concrete structure failure under the influence of F-T cycles is seen as a process of gradual accumulation of fatigue damage. The performance degradation caused by fatigue damage can be used to analyze the reliability of concrete for a certain period, to comprehensively understand the frost resistance of concrete and accurately quantify the F-T damage. Therefore, referring to the literature [29], the reliability coefficient (β(n)) of the IOT-ECCs under the sulfate F-T cycle is calculated by Equations (12) and (13) and shown in Figure 14.
k E = e σ N 2 2 N f ; k D = e σ N 2 2 ( e σ N 2 2 1 ) N f
β ( n ) = μ D σ D = 1 2 ln ( 1 + k D k E 2 n ) + ln ( k E n ) ln ( 1 + k D k E 2 n )
where σN = σD is the log standard deviation; the Nf is the F-T damage life; and the kE and kD are expectation and variance. The n is the time of F-T cycles. The μD is the logarithmic average of instantaneous cumulative damage and the β(n) is the reliability coefficient.
The calculation results of the F-T damage reliability analysis model are shown in Figure 14. The β(n) decreases as the number of F-T cycles increases. The β(n) of IOT0-P2.0, IOT20-P2.0, IOT40-P 2.0, and IOT60-P2.0 remain at a high level after 200 F-T cycles, especially IOT40-P2.0. The β(n) of IOT100-P2.0 is lower than that of IOT0-P2.0. The β(n) of the IOT-ECCs from highest to lowest is IOT40-P2.0 > IOT60-P2.0 > IOT20-P2.0 > IOT80-P2.0 > IOT100-P2.0, which is consistent with the test results. This indicates that the reliability model can better reflect the F-T damage to the IOT-ECCs.

5. Pore Structure of IOT-ECCs

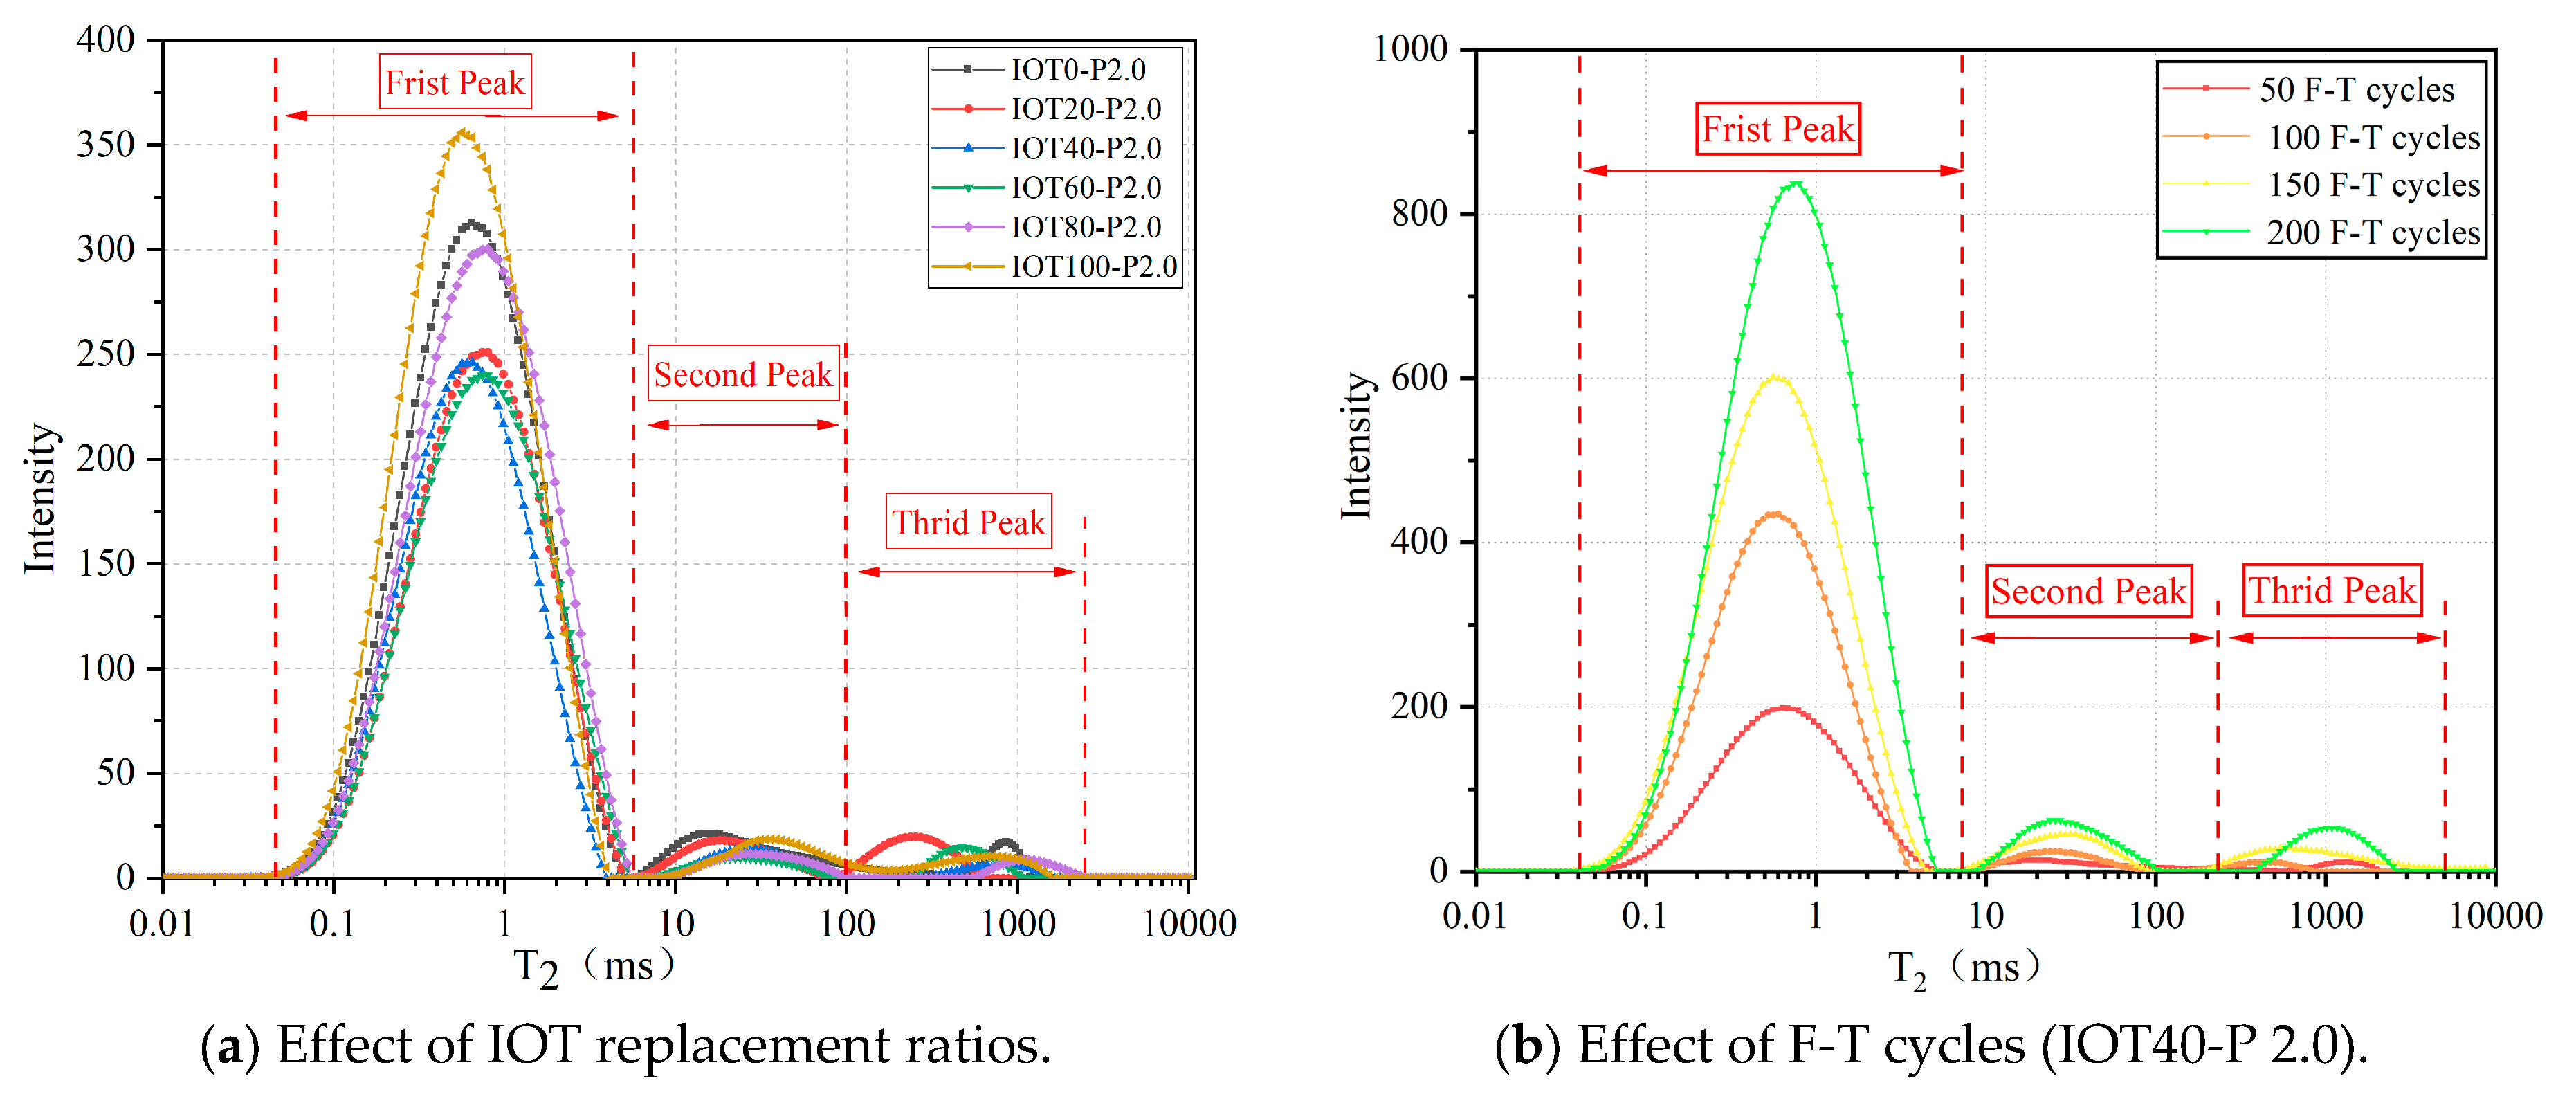
Figure 15 shows the T2 spectrum curves of the IOT-ECCs. Three signal peaks including a main signal peak and two secondary signal peaks are observed in each T2 spectrum curve, and the primary signal peak has a significantly higher signal intensity than the secondary signal peaks, as shown in Figure 15a,b. This suggests that the specimen contains a greater number of micro-pores, compared to medium and large pores, and the matrix mainly contains micro-pores [30,31]. The T2 spectral curve shows a rightward shift as an increase in both the IOT replacement ratio and F-T cycles, which indicates that the percentage of medium and large pores increases.
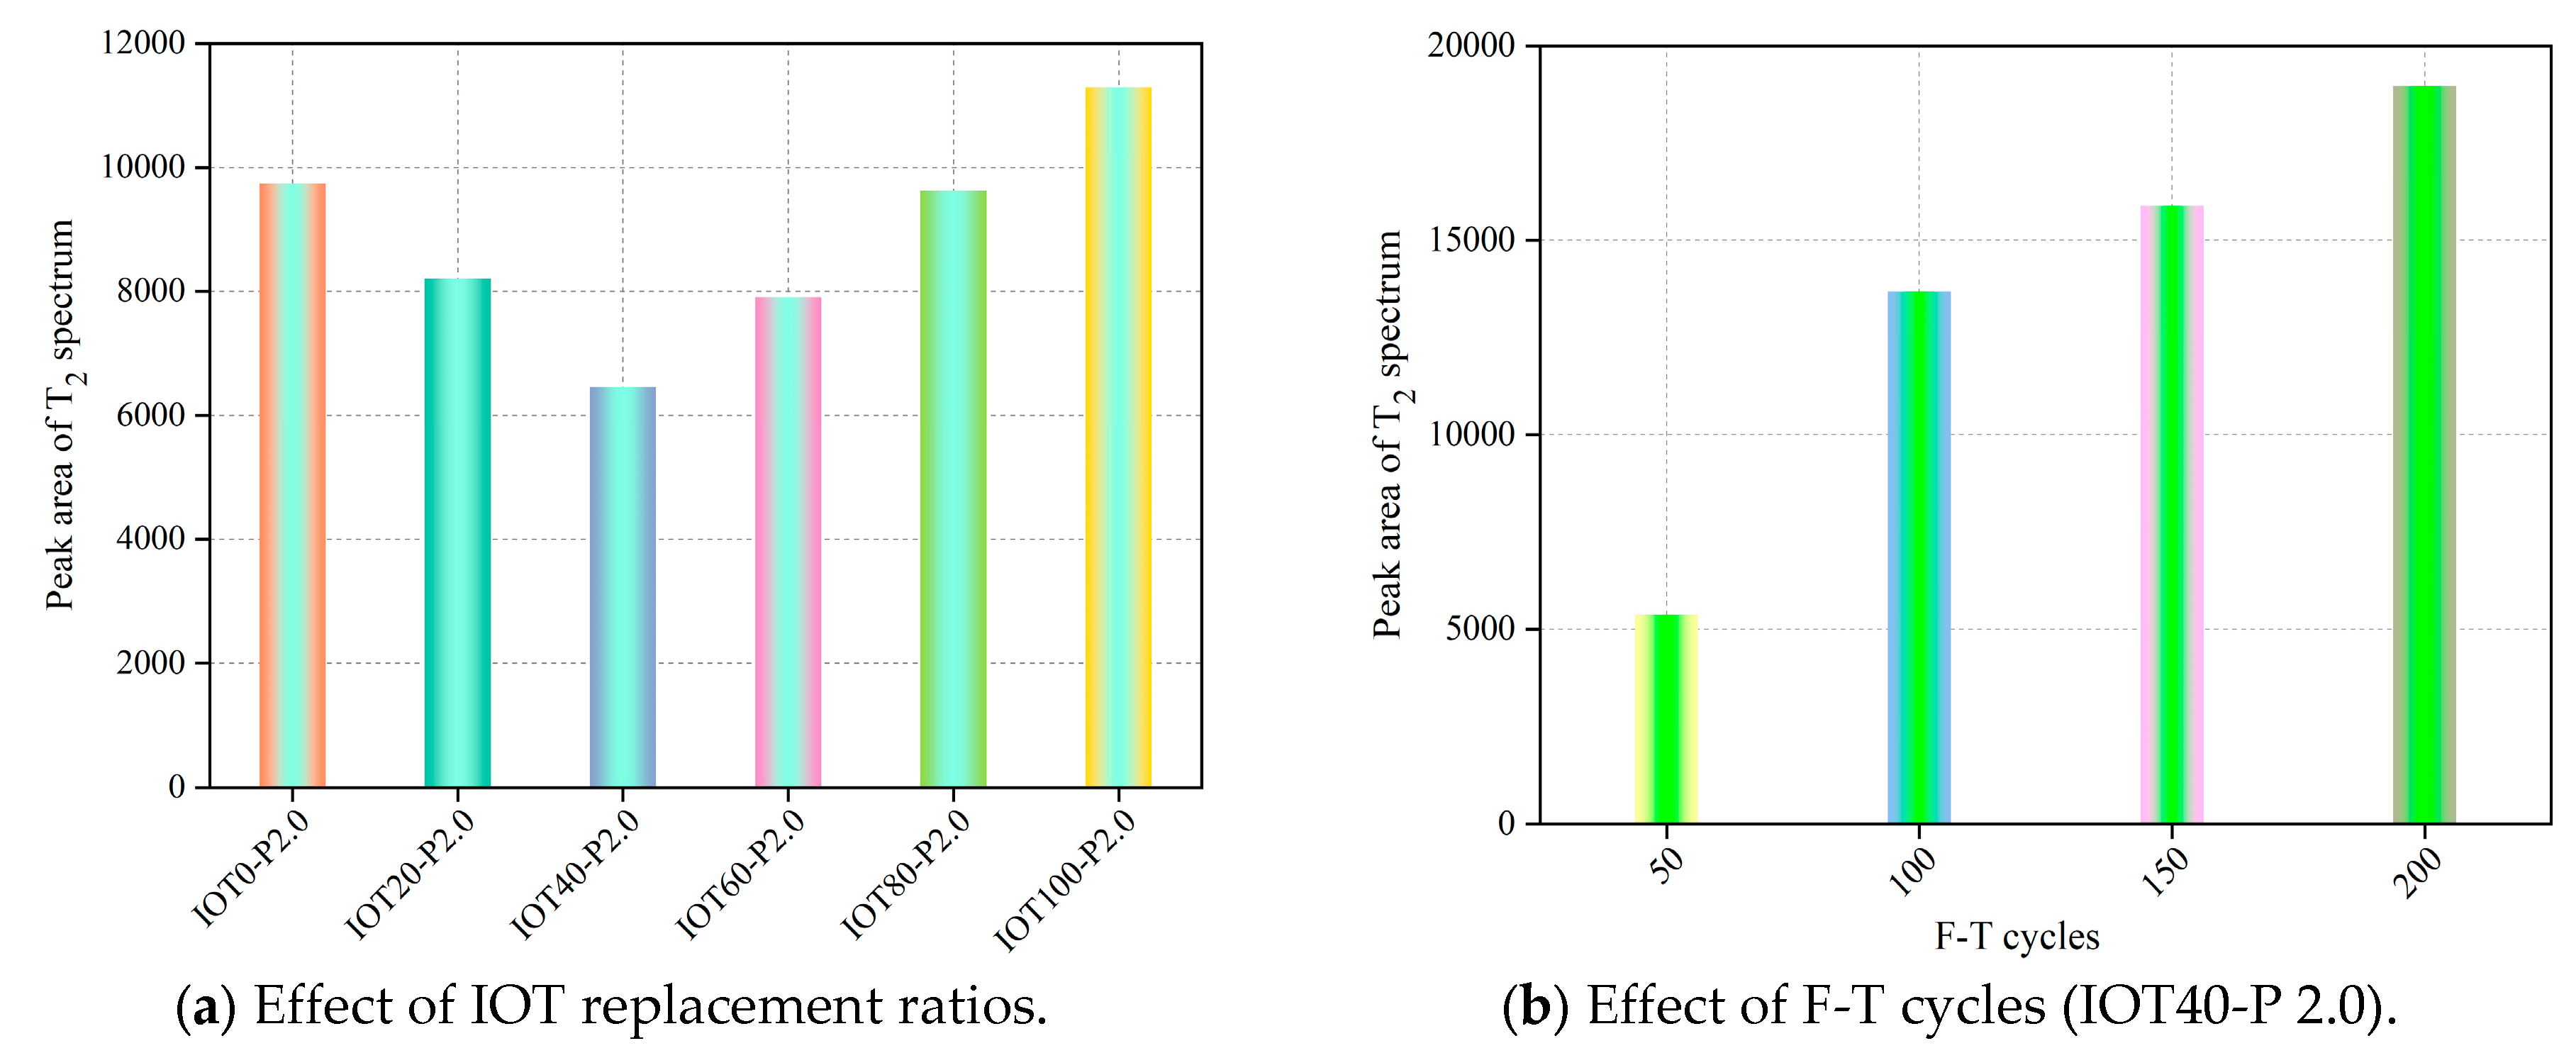
The area of each T2 spectrum curve’s three peaks is presented in Figure 16a,b. When replacing S with 20–80% IOTs, the peak areas are reduced by 15.78%, 33.75%, 18.8%, and 1.19%, respectively, indicating that incorporating IOTs can effectively reduce the internal pores, especially 40%, which is one of the reasons why IOT40-P2.0 has the highest strength compared to that of others. Under a 100% IOT replacement ratio, the internal porosity of IOT100-P2.0 is higher than that of IOT0-P2.0. Moreover, the peak areas increase gradually with the increase in the F-T cycle, especially more than 100 F-T cycles, which increased the peak areas significantly.

6. SEM Micro-Morphology

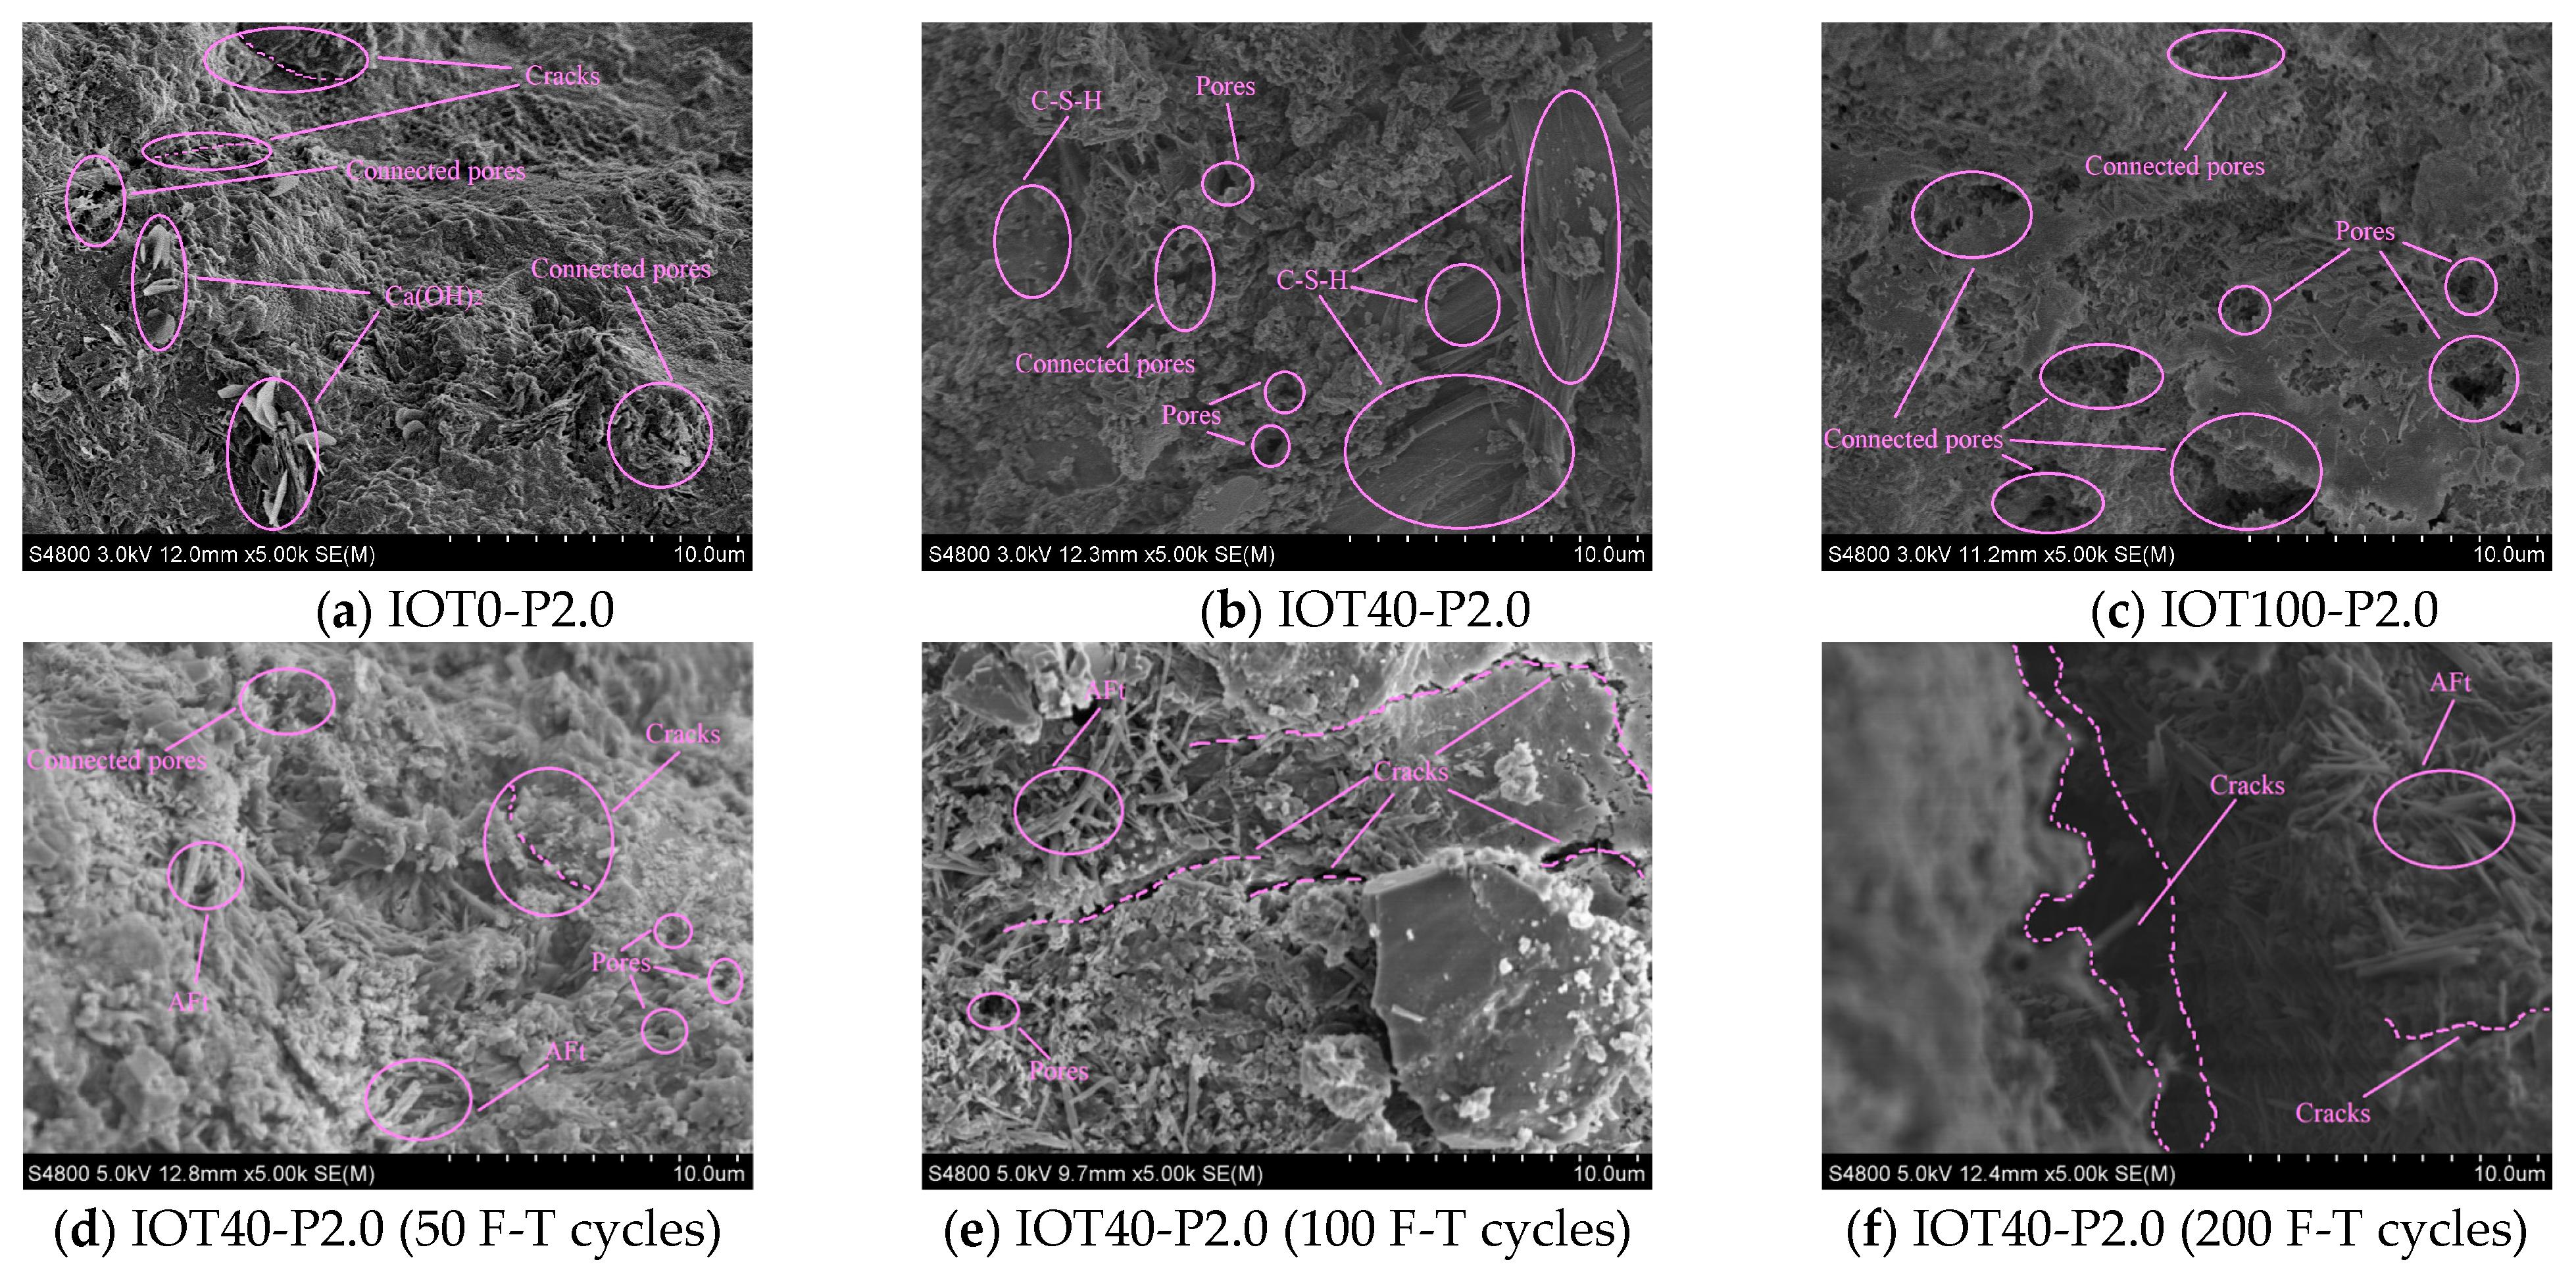
The micro-morphology of the IOT-ECCs is shown in Figure 17. As can be seen from Figure 17a–c, the IOT0-P2.0 matrix contains a small amount of Ca (OH)2, cracks, and connected pores. Under a 40% IOT replacement ratio, a significant reduction in the number of connected pores and micro-pores of the IOT40-P2.0 matrix is observed, while Ca (OH)2 is eliminated. In addition, many amorphous C-S-H gels are generated. However, the total number of connected pores and pores in the IOT100-P2.0 matrix has a noticeable increase when S is completely replaced by IOTs. Meanwhile, the density of the matrix is relatively poor compared with IOT40-P2.0 and IOT0-P2.0. Figure 17d–f show that within the pores and cracks of the IOT40-P2.0, corrosion products are formed, including rod-like gypsum and acicular ettringite after different F-T cycles. With the increase in F-T cycles, the dimensions of the pores and cracks are progressively expanding. Meanwhile, the abundance of acicular ettringite is observed near pores and cracks, especially at 200 F-T cycles. 
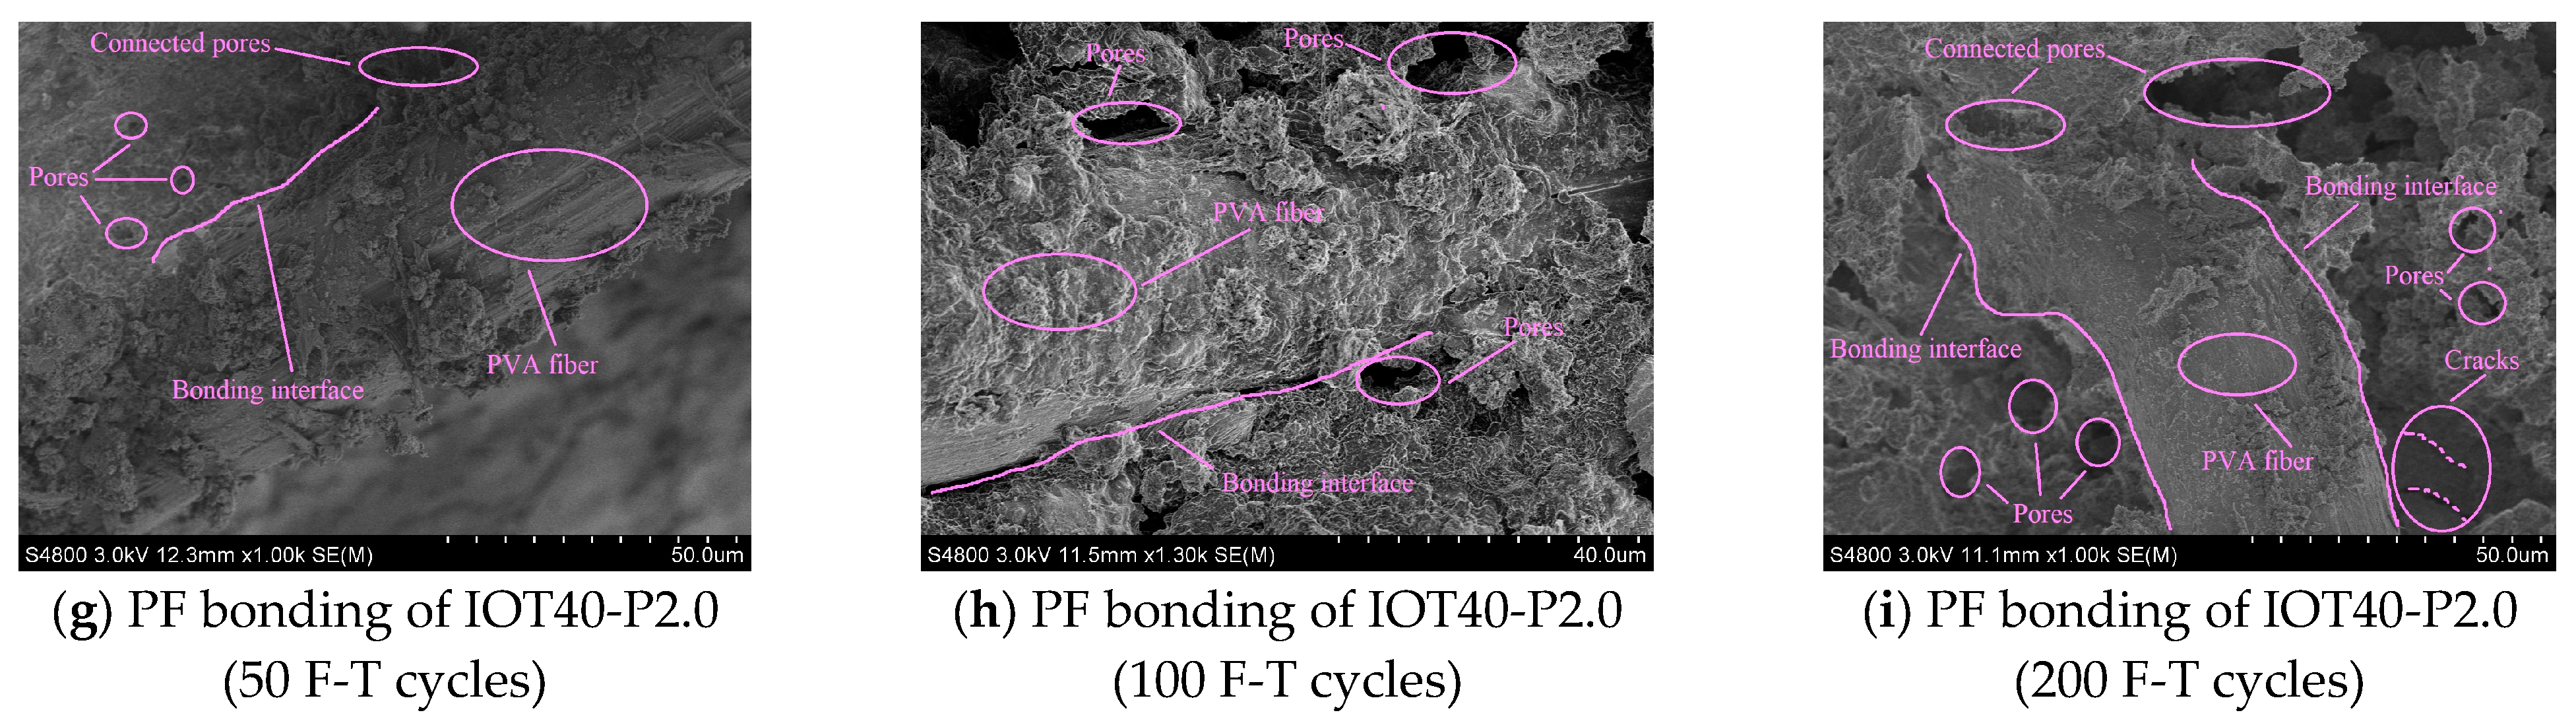
Figure 17g–i found that the PF and the matrix have good adhesion after 50 F-T cycles, and there are few pores at the bonding interface. However, after 100 F-T cycles, there are many pores at the bonding interface of the PF and the matrix. The bonding interface of the PF and the matrix significantly deteriorated after 200 F-T cycles.

7. Conclusions

This study explored the mechanical properties, sulfate F-T cycle resistance, pore structure, and micro-morphology of IOT-ECCs with different replacement ratios of IOTs. Some conclusions were obtained:
(1)
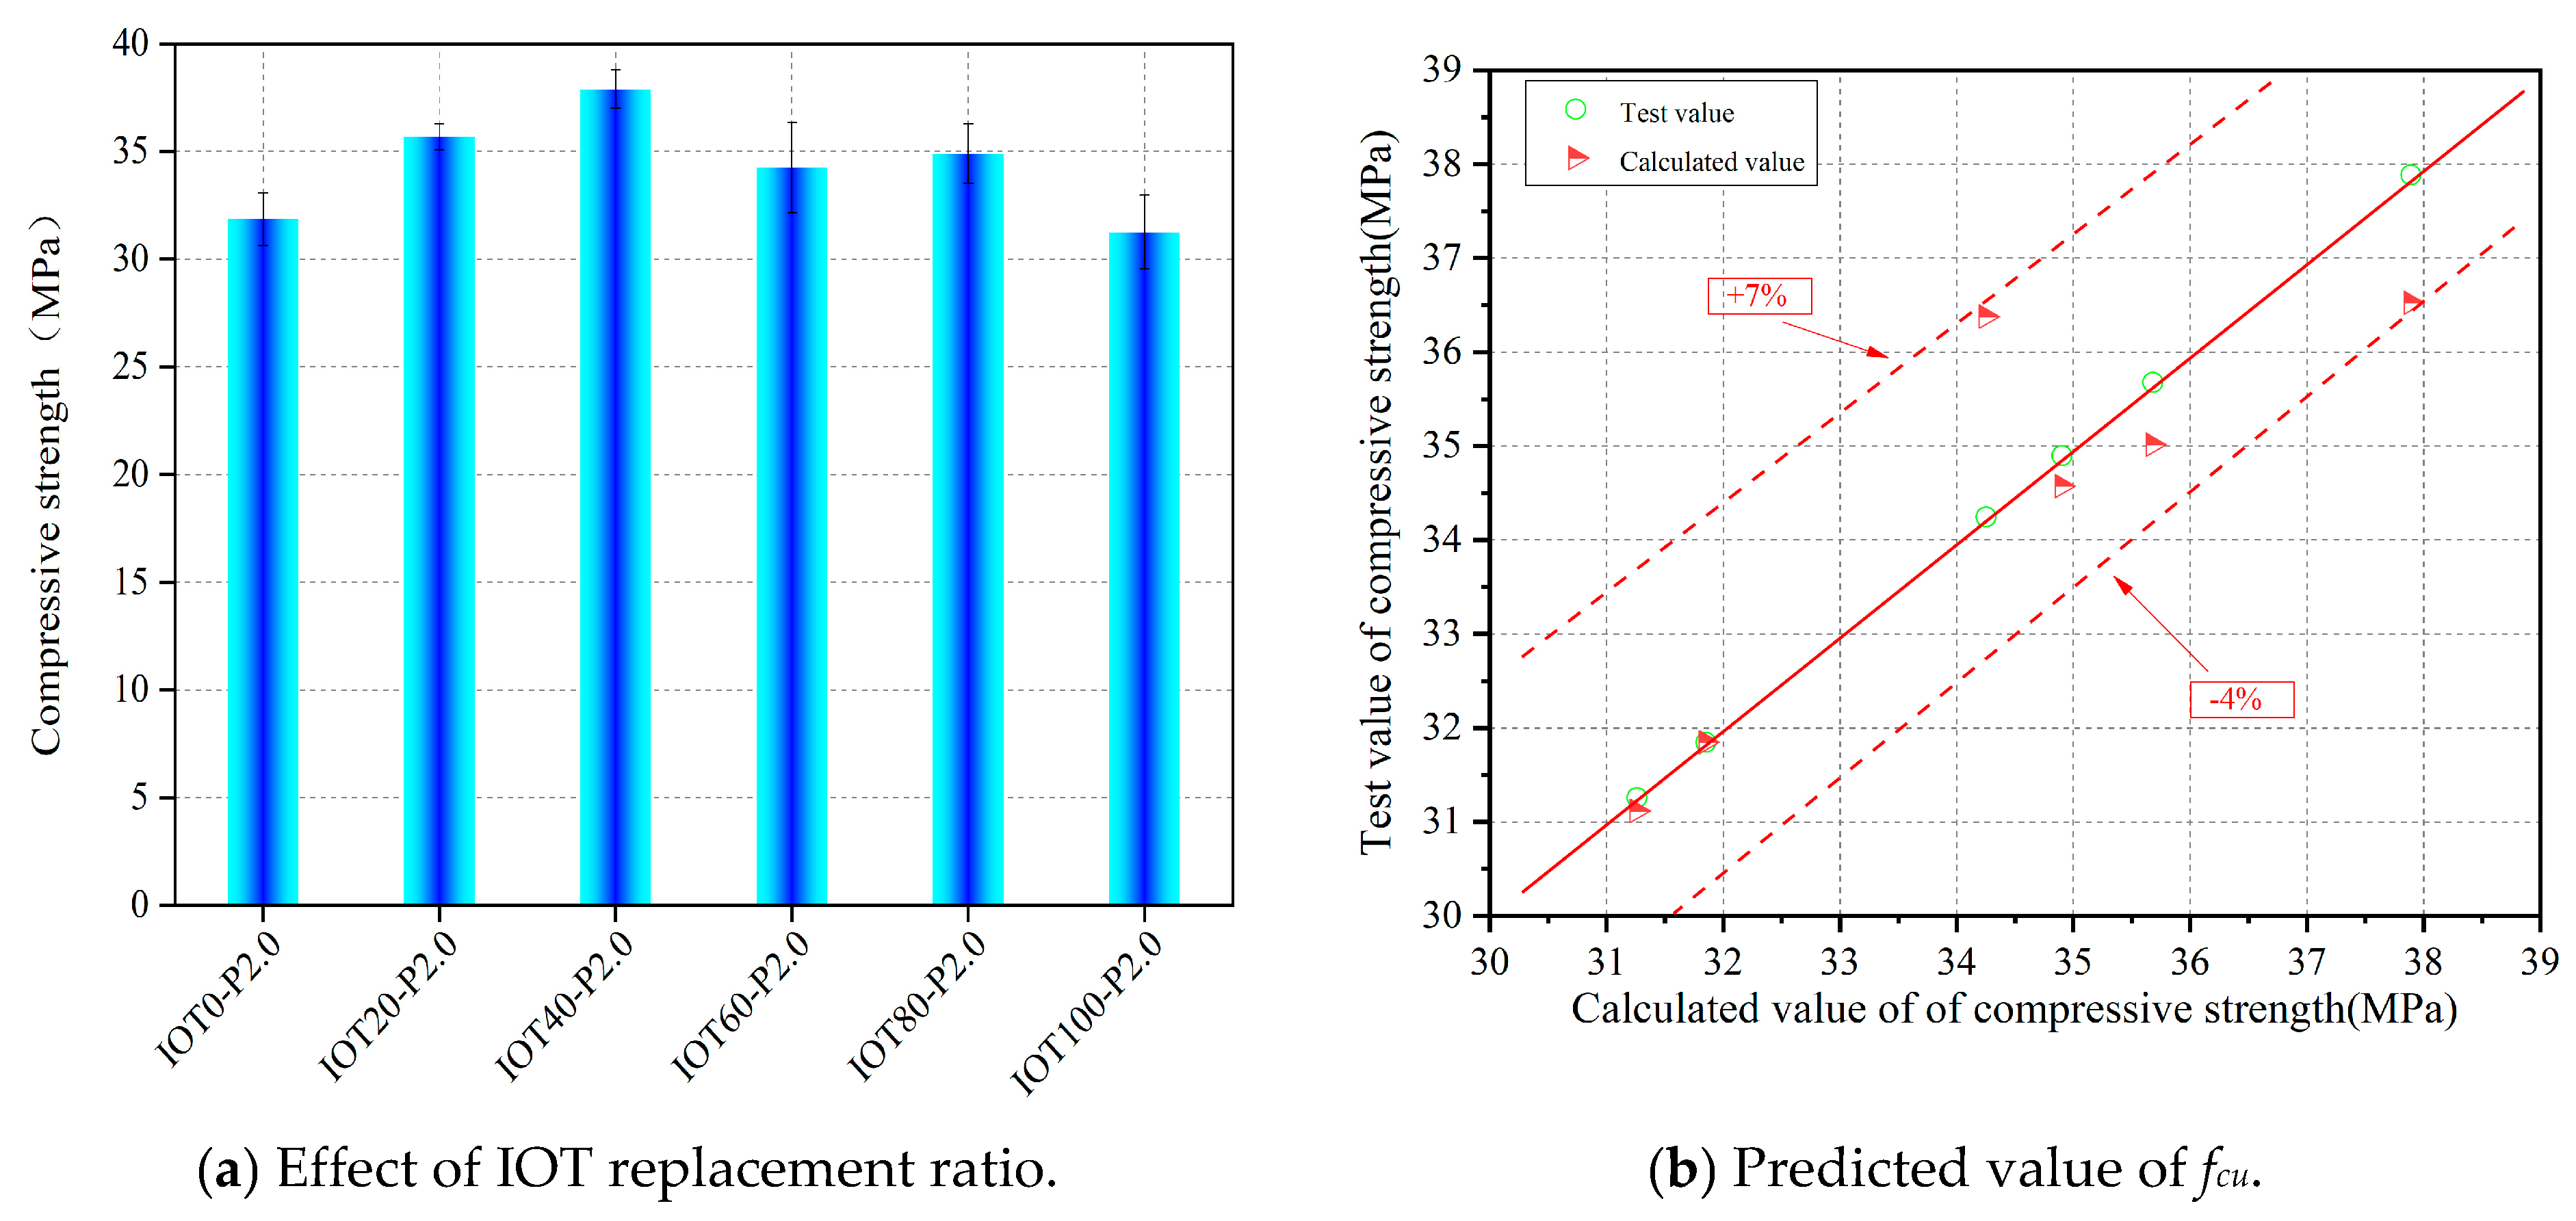
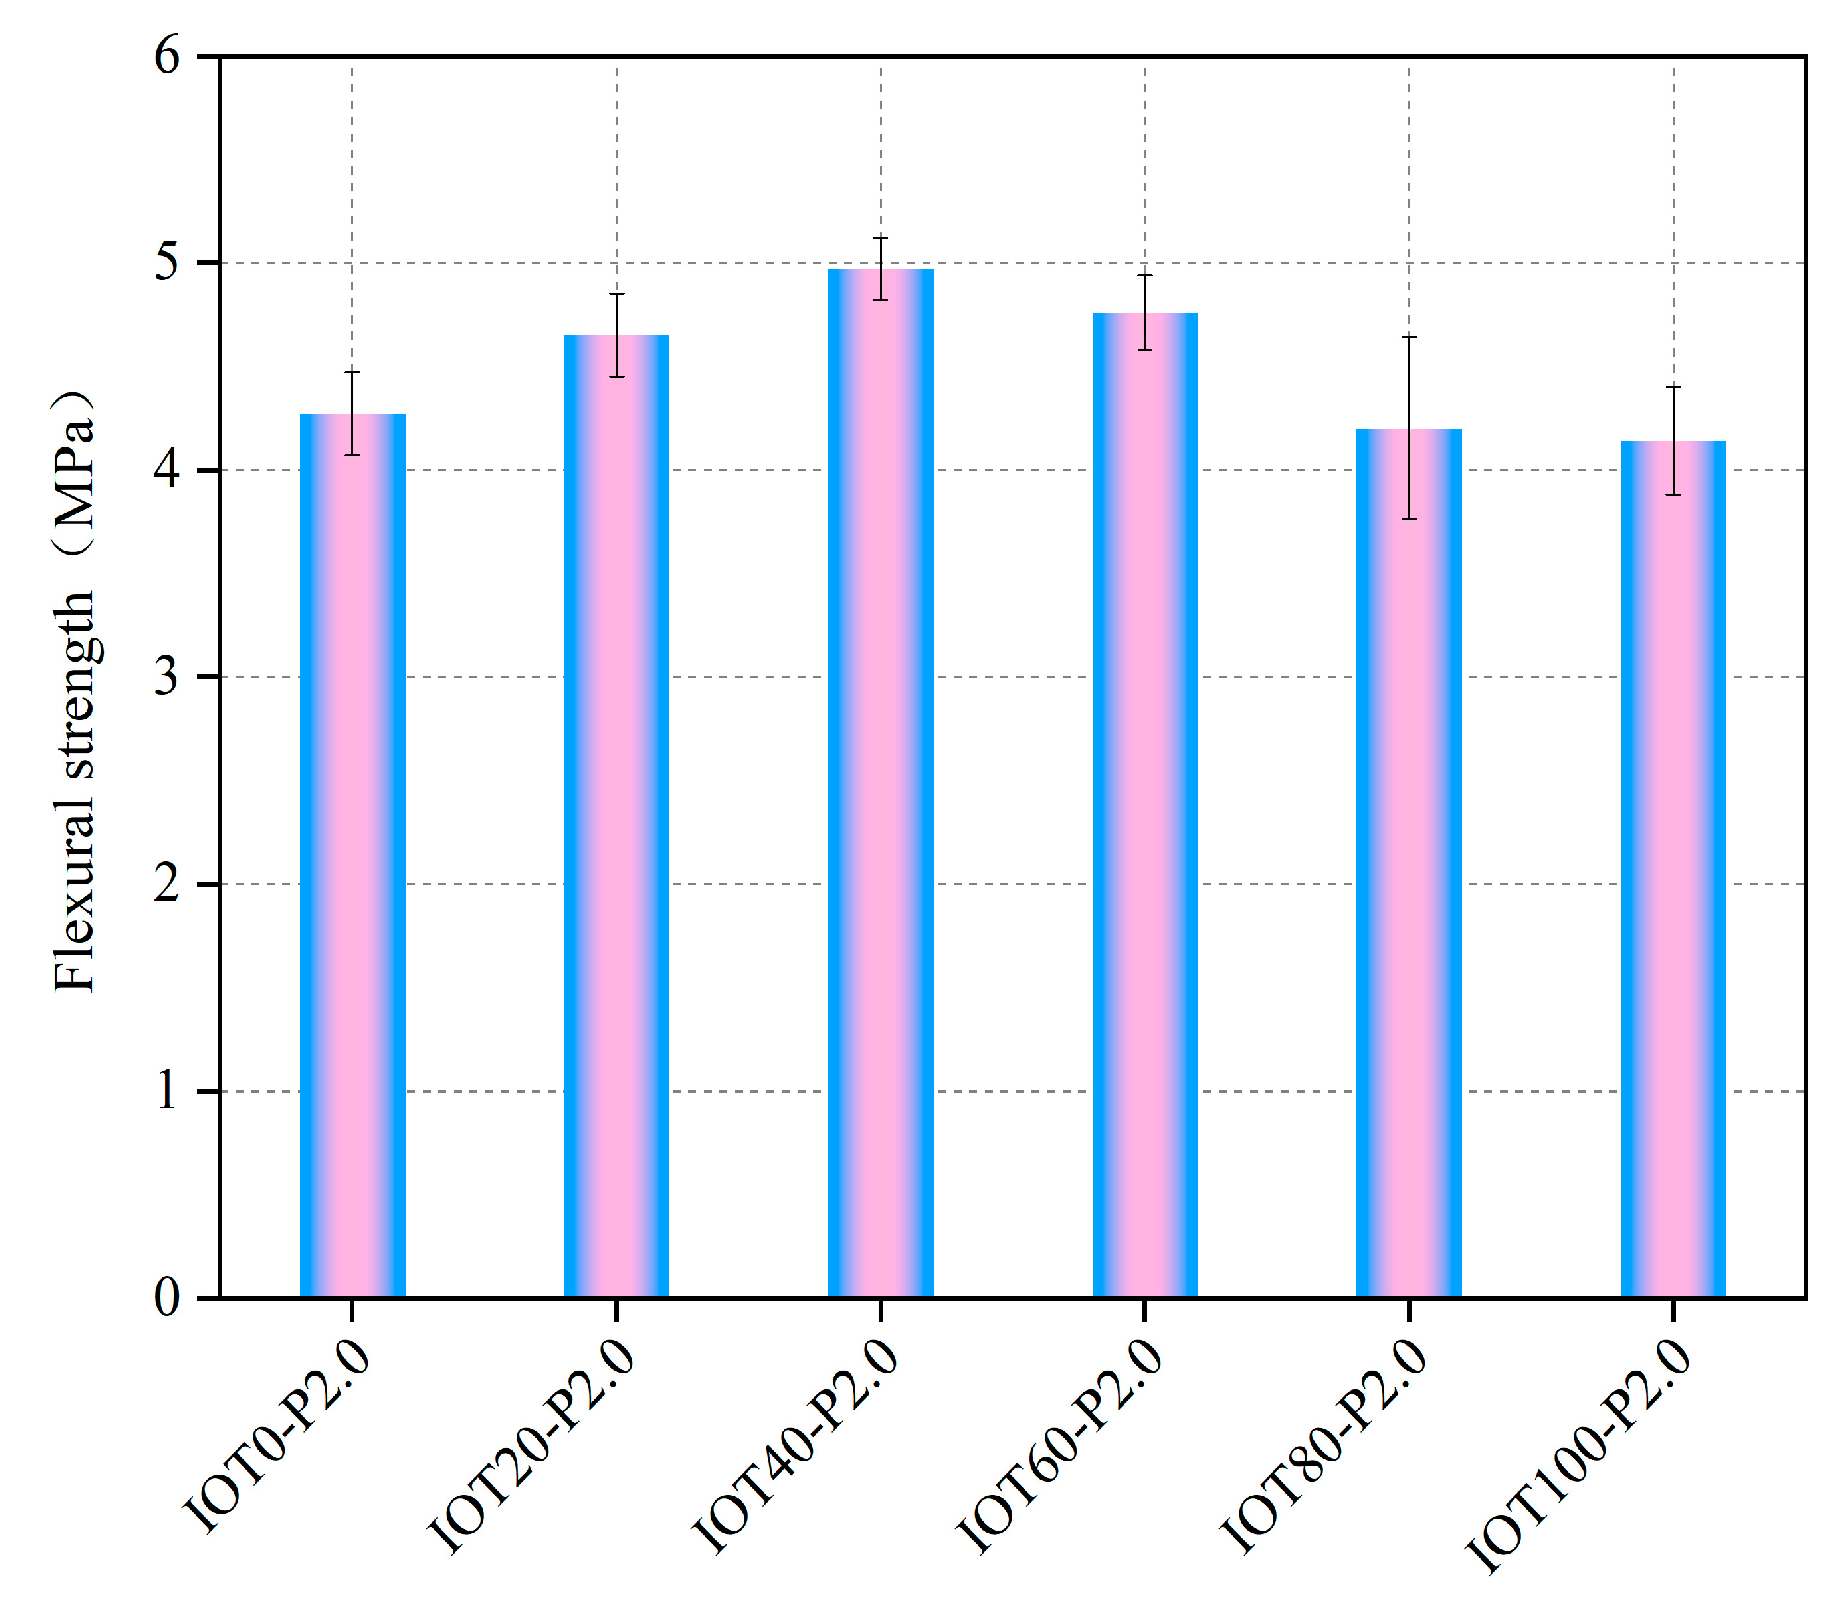
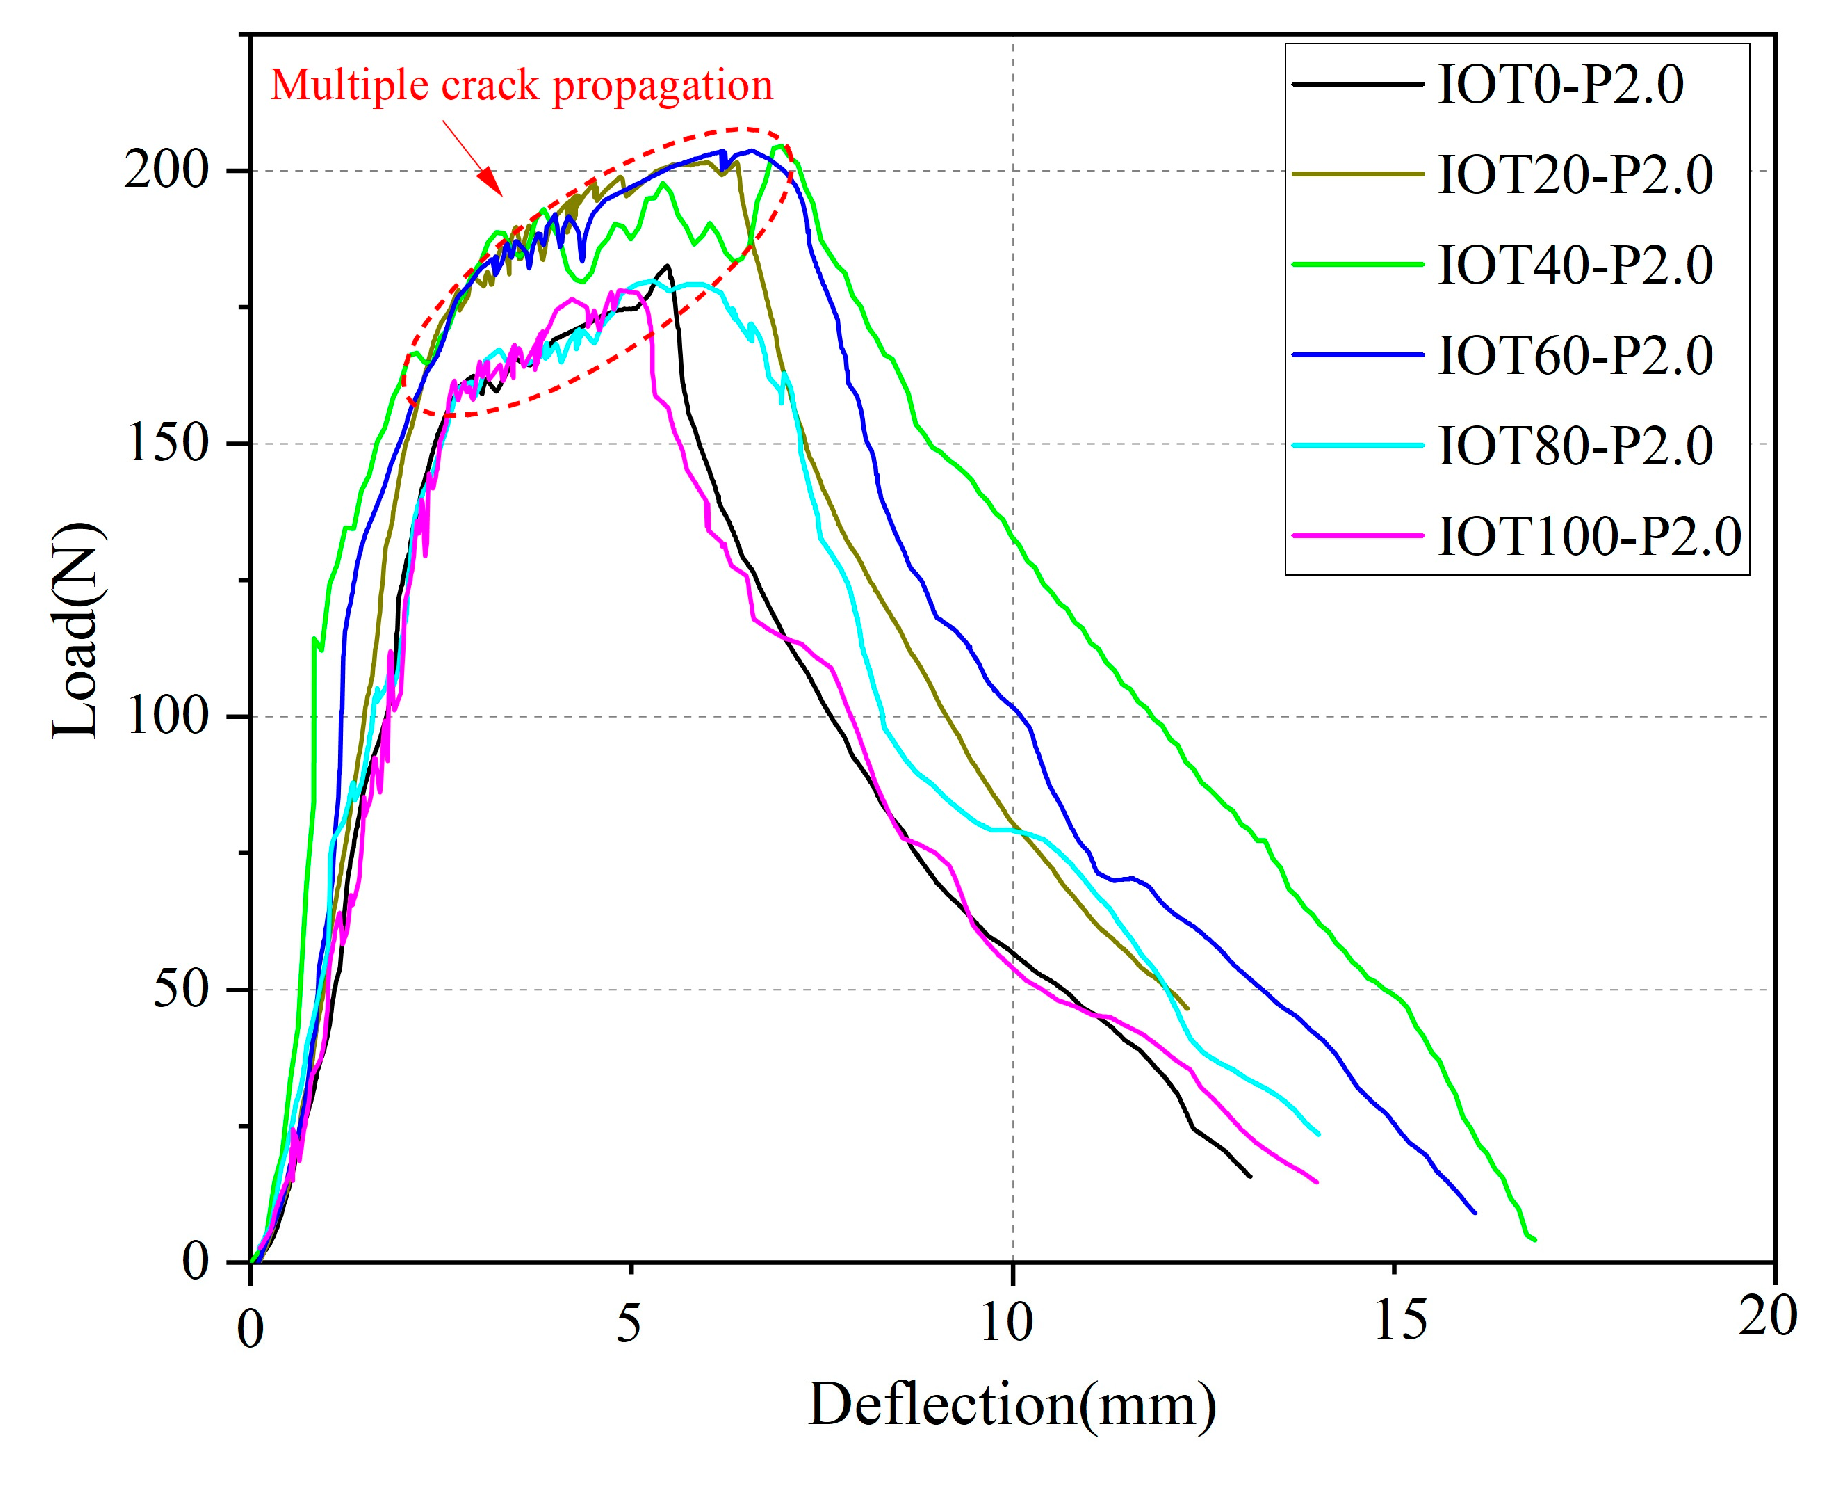
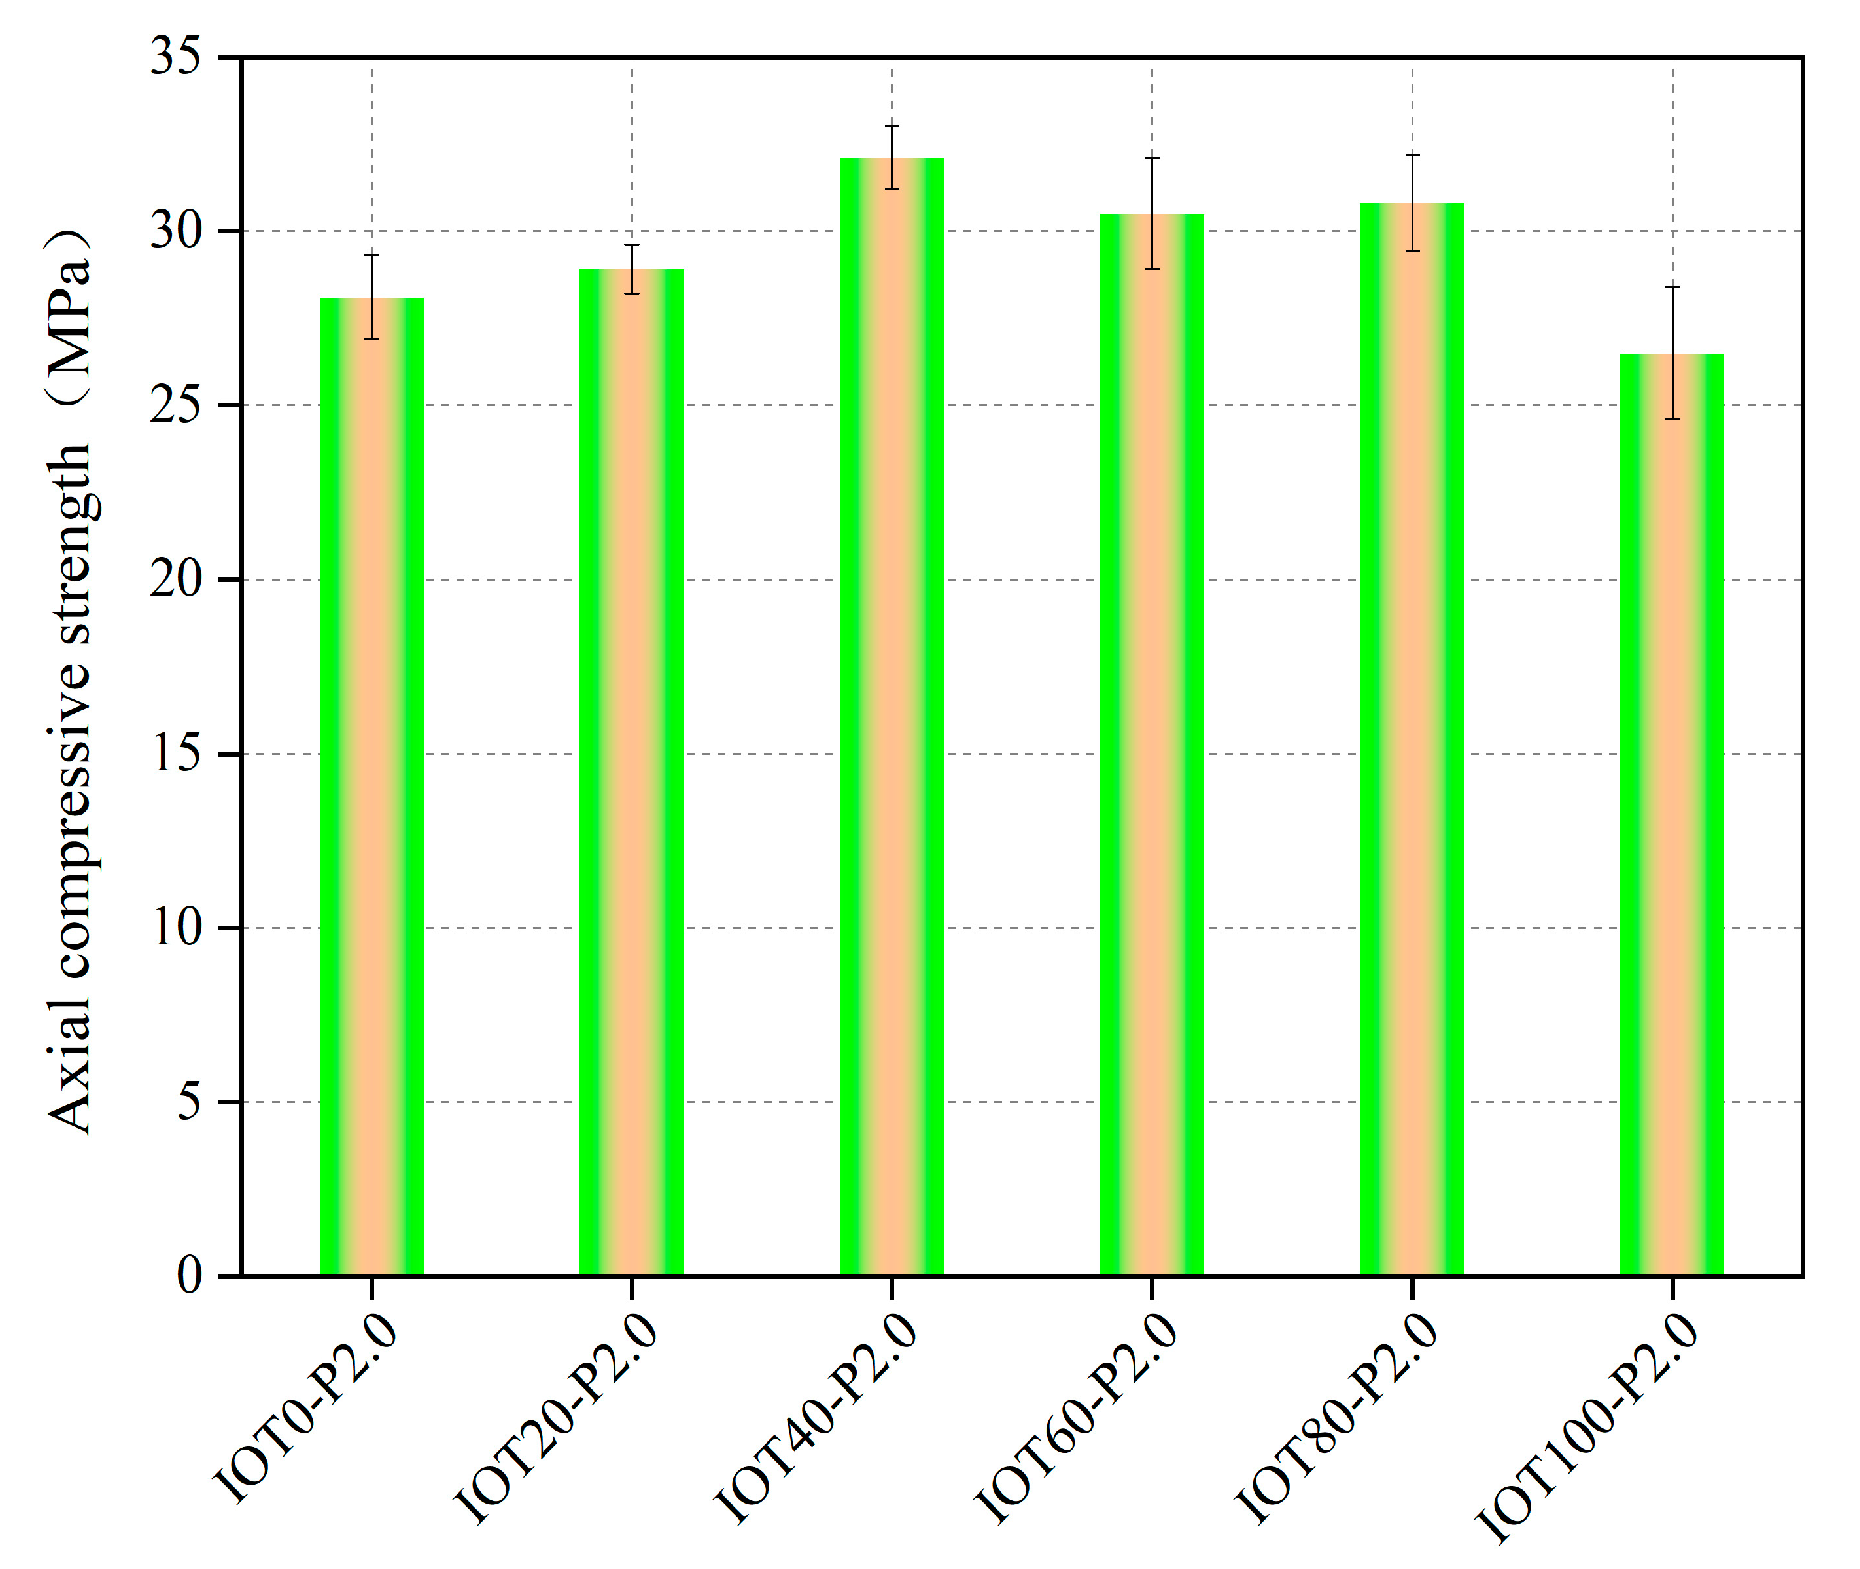
The chemical composition and physical properties of IOTs confirmed the feasibility of preparing IOT-ECCs using IOTs as fine aggregates instead of S. By incorporating up to 80% IOTs, the mechanical properties of IOT-ECCs were improved. IOT-ECCs with 40% IOTs (namely, IOT40-P2.0) can ensure the highest mechanical properties.
(2)
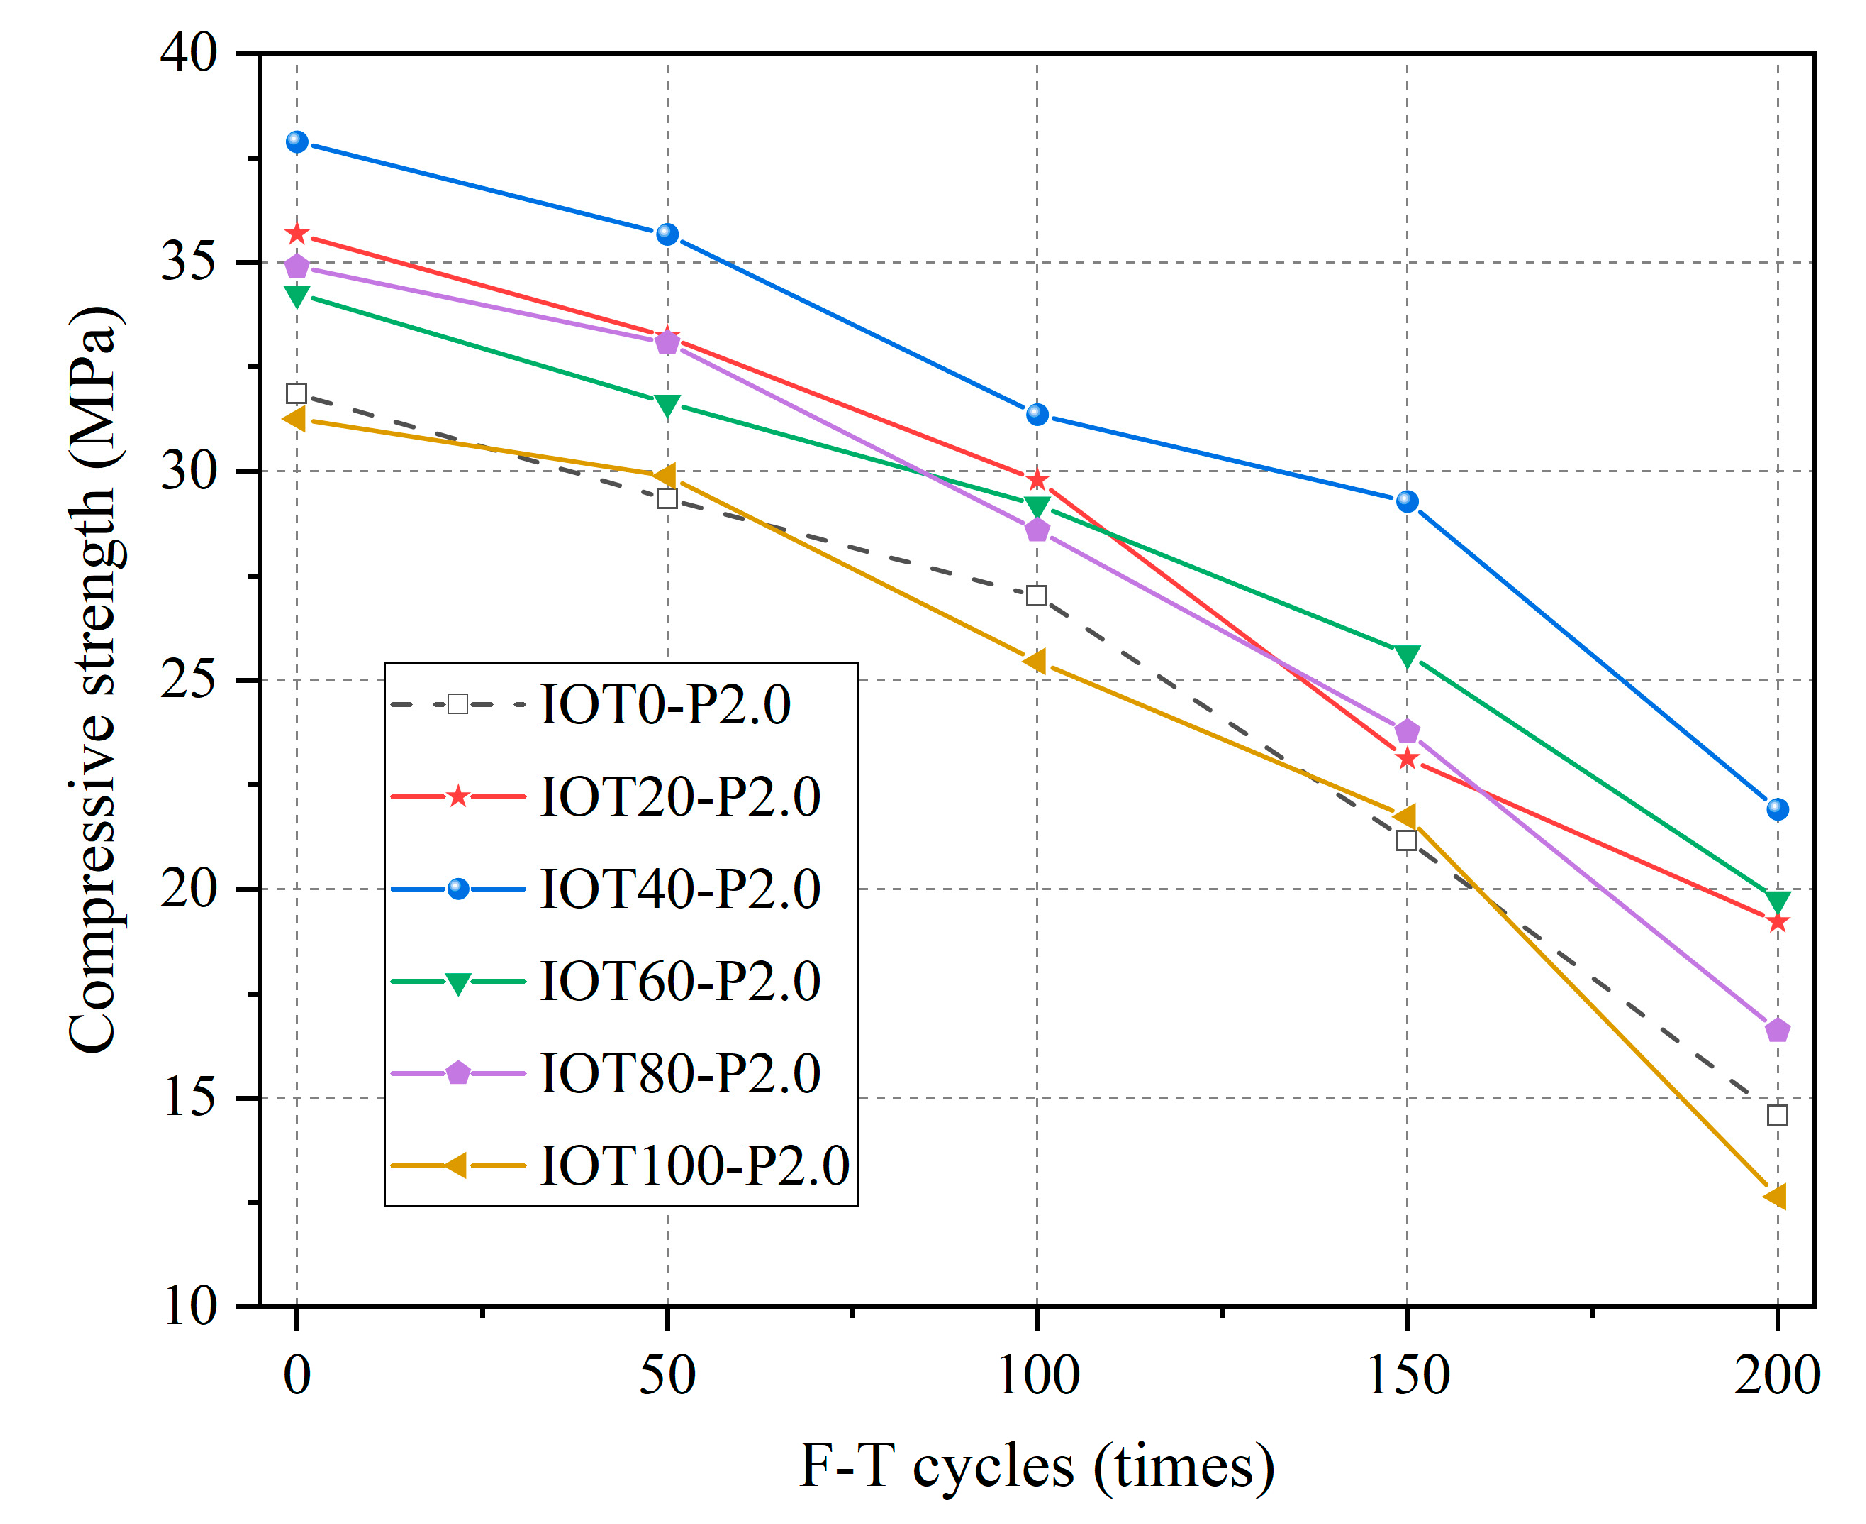
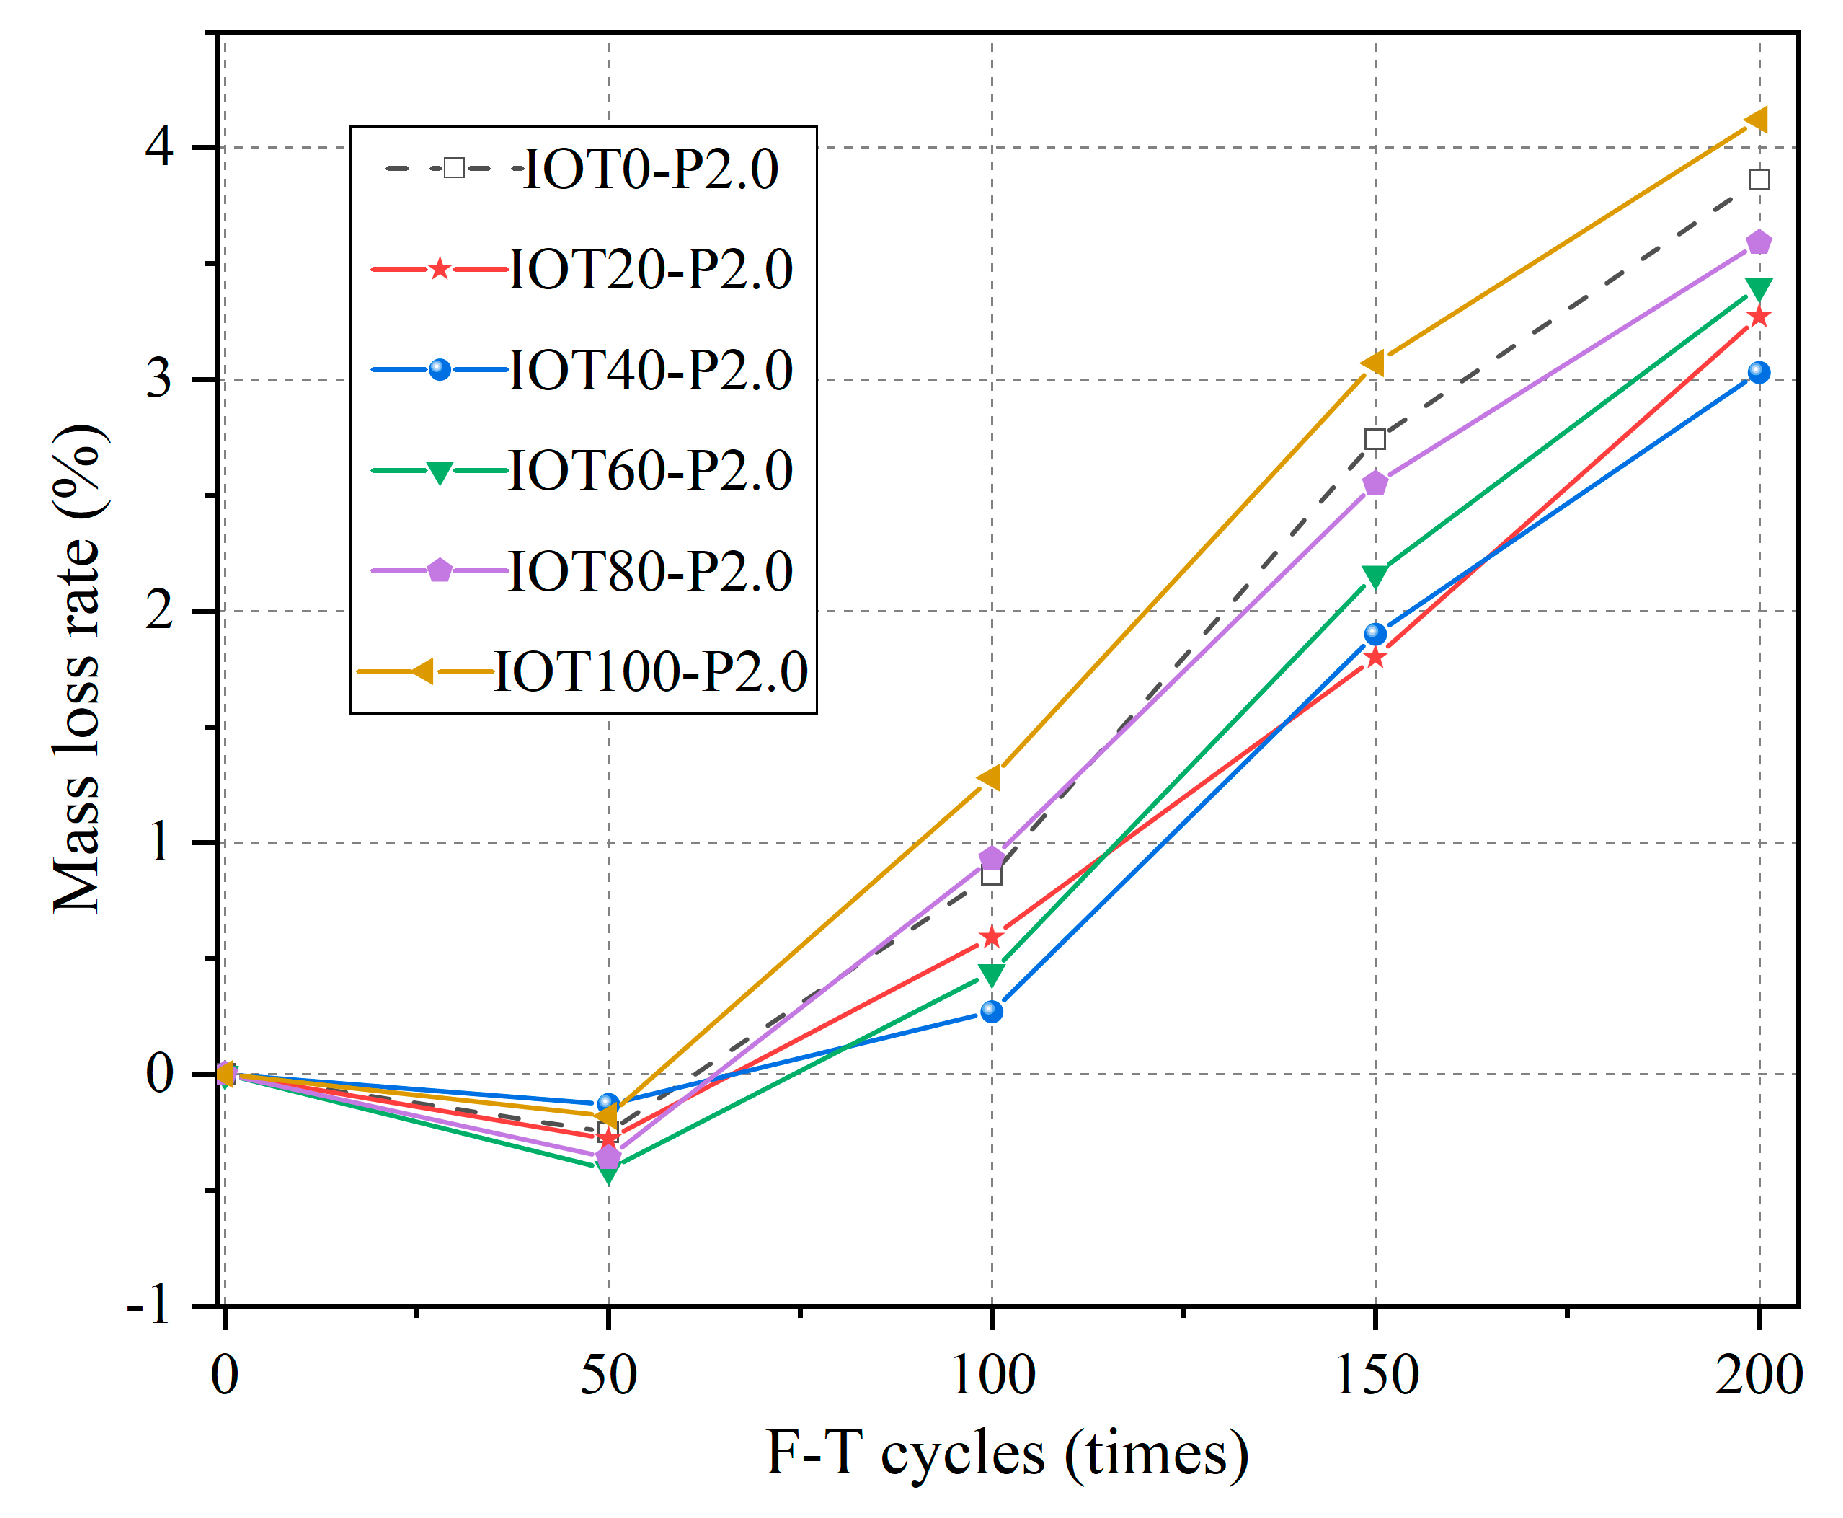
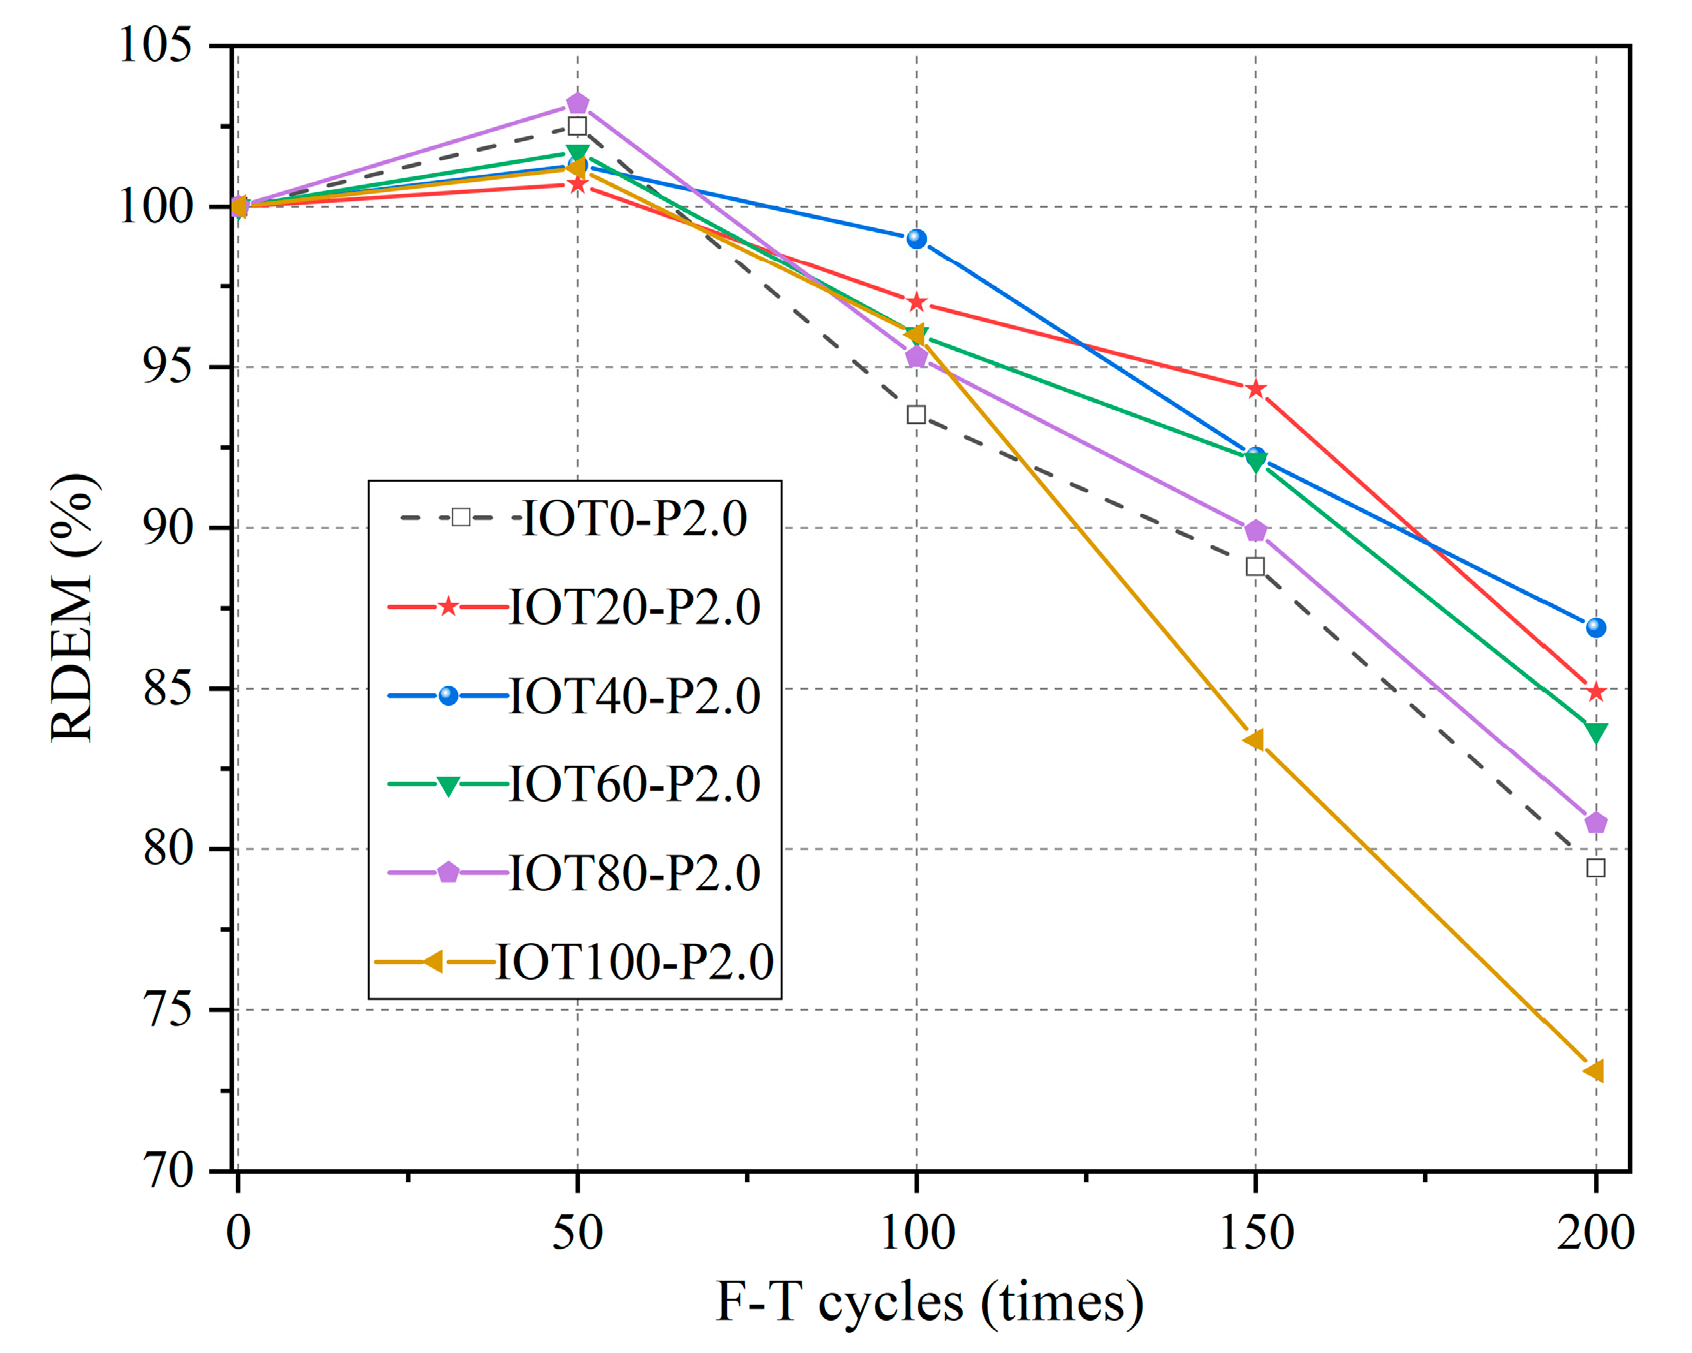
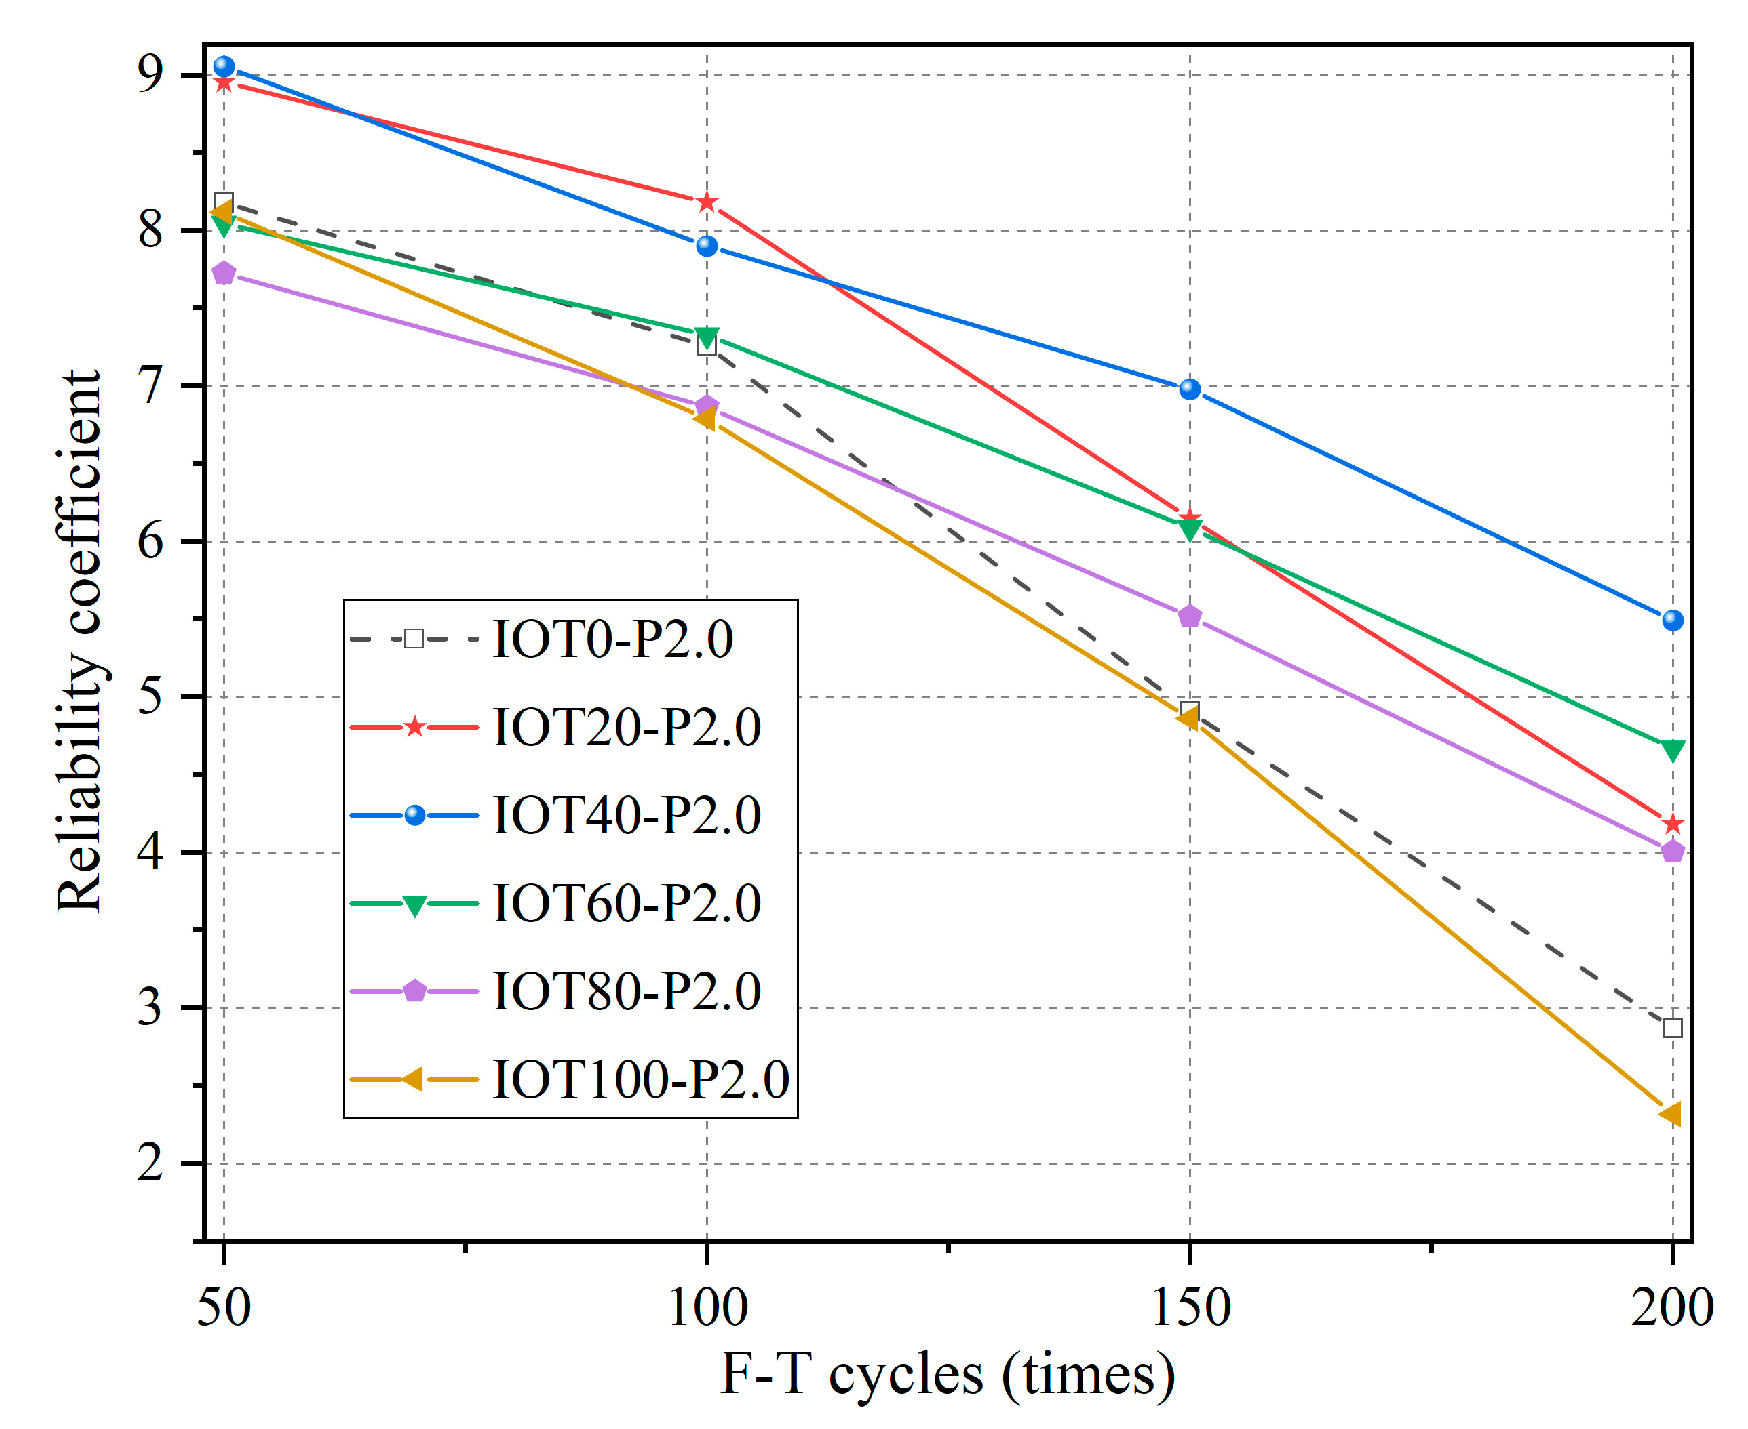
As the F-T cycles increased, the mass loss and RDEM of the IOT-ECCs increased first and then rapidly decreased, while the fcu decreased. The F-T damage in the IOT-ECC incorporating 40% IOTs was the smallest, which reflected the best reliability.
(3)
NMR results found that when replacing S with 20–80% IOTs, it was beneficial to optimize the internal pore structure of the IOT-ECCs, especially at the 40% IOT replacement ratio. The pore structure of IOT-ECCs gradually deteriorated as the F-T cycle increased, and exhibited a notable deterioration after 100 F-T cycles.
(4)
The SEM results showed that the compactness of IOT-ECCs was improved substantially by incorporating 40% IOTs. After 100 F-T cycles, the dimensions of the pores and cracks and the bonding interface of the PF and the matrix significantly deteriorated.
The macroscopic and microscopic results showed that using 40% IOTs to replace S to produce IOT-ECCs resulted in superior mechanical properties and durability compared to ordinary ECCs. It can be applied to practical projects such as seismic walls, beams, and columns with energy-dissipating joints, and in the reinforcement of masonry structures. The successful application of industrial by-product IOTs as eco-friendly materials will further promote the sustainable development of the construction industry. Further studies on structural members (beams, joints, and walls) should be conducted.

Author Contributions

K.L.: conceptualization, methodology, and writing—original draft. S.W.: conceptualization, investigation, and funding acquisition. X.Q.: methodology, resources, investigation, and writing—review and editing. J.W.: resources. J.X.: methodology and formal analysis. N.Z.: investigation. B.L.: data curation and formal analysis. All authors have read and agreed to the published version of the manuscript.

Funding

This research was funded by J.X. grant number [No.2021SF-521]. This research was funded by B.L. grant number [No.2022SF-375].

Data Availability Statement

The data presented in this study are available on request from the corresponding author.

Acknowledgments

This work was supported by the Project on Key Research and Development of Shaanxi, China (No. 2021SF-521 and 2022SF-375).

Conflicts of Interest

The authors declare that they have no known competing financial interests or personal relationships that could have appeared to influence the work reported in this paper.

References

  1. Zhao, N.; Wang, S.; Quan, X.; Wang, C. Study on the Coupled Effects of Bentonite and High-Volume Fly Ash on Mechanical Properties and Microstructure of Engineered Cementitious Composites (ECC). KSCE J. Civ. Eng. 2019, 23, 2628–2635. [Google Scholar] [CrossRef]
  2. Zhang, D.; Jaworska, B.; Zhu, H.; Dahlquist, K.; Li, V.C. Engineered Cementitious Composites (ECC) with limestone calcined clay cement (LC3). Cem. Concr. Compos. 2020, 114, 103766. [Google Scholar] [CrossRef]
  3. Li, V.C.; Leung, C. Steady-State and Multiple Cracking of Short Random Fiber Composites. J. Eng. Mech. 1992, 118, 2246–2264. [Google Scholar] [CrossRef]
  4. Ahmed, T.; Elchalakani, M.; Basarir, H.; Karrech, A.; Sadrossadat, E.; Yang, B. Development of ECO-UHPC utilizing gold mine tailings as quartz sand alternative. Clean. Eng. Technol. 2021, 4, 100176. [Google Scholar] [CrossRef]
  5. Zhao, S.; Fan, J.; Sun, W. Utilization of iron ore tailings as fine aggregate in ultra-high performance concrete. Constr. Build. Mater. 2014, 50, 540–548. [Google Scholar] [CrossRef]
  6. Adesina, A.; Das, S. Mechanical performance of engineered cementitious composite incorporating glass as aggregates—ScienceDirect. J. Clean. Prod. 2020, 260, 121113. [Google Scholar] [CrossRef]
  7. Li, J.; Yang, E.H. Macroscopic and microstructural properties of engineered cementitious composites incorporating recycled concrete fines. Cem. Concr. Compos. 2017, 78, 33–42. [Google Scholar] [CrossRef]
  8. Turk, K.; Demirhan, S. The mechanical properties of engineered cementitious composites containing limestone powder replaced by microsilica sand. Can. J. Civ. Eng. 2013, 40, 151–157. [Google Scholar] [CrossRef]
  9. Lu, H.; Qi, C.; Chen, Q.; Gan, D.; Xue, Z.; Hu, Y. A new procedure for recycling waste tailings as cemented paste backfill to underground stopes and open pits. J. Clean. Prod. 2018, 188, 601–612. [Google Scholar] [CrossRef]
  10. Zhang, C.; Li, S. Utilization of iron ore tailing for the synthesis of zeolite A by hydrothermal method. J. Mater. Cycles Waste Manag. 2018, 20, 1605–1614. [Google Scholar] [CrossRef]
  11. Zhang, N.; Tang, B.; Liu, X. Cementitious activity of iron ore tailing and its utilization in cementitious materials, bricks and concrete. Constr. Build. Mater. 2021, 288, 123022. [Google Scholar] [CrossRef]
  12. Liu, K.N.; Wang, S.L.; Quan, X.Y.; Jing, W.; Xu, J.; Zhao, N.; Liu, B.; Ying, H. Industrial byproduct Iron ore tailings as ecofriendly materials in the utilization of cementitious composites. Constr. Build. Mater. 2023, 372, 130182. [Google Scholar] [CrossRef]
  13. Li, T.; Wang, S.; Xu, F.; Meng, X.; Li, B.; Zhan, M. Study of the basic mechanical properties and degradation mechanism of recycled concrete with tailings before and after carbonation. J. Clean. Prod. 2020, 259, 120923. [Google Scholar] [CrossRef]
  14. Xu, F.; Wang, S.; Li, T.; Liu, B.; Zhao, N.; Liu, K. The mechanical properties and resistance against the coupled deterioration of sulfate attack and freeze-thaw cycles of tailing recycled aggregate concrete. Constr. Build. Mater. 2020, 269, 121273. [Google Scholar] [CrossRef]
  15. Shettima, A.U.; Hussin, M.W.; Ahmad, Y.; Mirza, J. Evaluation of iron ore tailings as replacement for fine aggregate in concrete. Constr. Build. Mater. 2016, 120, 72–79. [Google Scholar] [CrossRef]
  16. Zhao, J.; Ni, K.; Su, Y.; Shi, Y. An evaluation of iron ore tailings characteristics and iron ore tailings concrete properties—ScienceDirect. Constr. Build. Mater. 2021, 286, 122968. [Google Scholar] [CrossRef]
  17. Liu, K.; Wang, S.; Quan, X.; Jing, W.; Xu, J.; Zhao, N.; Liu, B. Effect of iron ore tailings industrial by-product as eco-friendly aggregate on mechanical properties, pore structure, and sulfate attack and dry-wet cycles resistance of concrete. Case Stud. Constr. Mater. 2022, 17, 1472. [Google Scholar] [CrossRef]
  18. Huang, X.; Ranade, R.; Ni, W.; Li, V.C. Development of green engineered cementitious composites using iron ore tailings as aggregates. Constr. Build. Mater. 2013, 44, 757–764. [Google Scholar] [CrossRef]
  19. Batista, R.P.; Costa, J.O.; Borges, P.H.R.; Dos Santos, F.A.; Lameiras, F.S. High-performance alkali-activated composites containing an iron-ore mine tailing as aggregate. MATEC Web Conf. 2019, 274, 2004. [Google Scholar] [CrossRef]
  20. Huang, X.; Ranade, R.; Li, V.C. Feasibility Study of Developing Green ECC Using Iron Ore Tailings Powder as Cement Replacement. J. Mater. Civ. Eng. 2013, 25, 923–931. [Google Scholar] [CrossRef]
  21. Tosun-Felekoglu, K.; Godek, E.; Keskinates, M.; Felekoğlu, B. Utilization And Selection of Proper Fly Ash in Cost Effective Green HTPP-ECC Design. J. Clean. Prod. 2017, 149, 557–568. [Google Scholar] [CrossRef]
  22. Ismail, Z.Z.; Al-Hashmi, E.A. Reuse of waste iron as a partial replacement of sand in concrete. Waste Manag. 2008, 28, 2048–2053. [Google Scholar] [CrossRef]
  23. Zhang, W.F.; Gu, X.W.; Qiu, J.P.; Liu, J.; Zhao, Y.; Li, X. Effects of iron ore tailings on the compressive strength and permeability of ultra-high performance concrete. Constr. Build. Mater. 2020, 260, 119917. [Google Scholar] [CrossRef]
  24. Dandautiya, R.; Singh, A.P. Utilization potential of fly ash and copper tailings in concrete as partial replacement of cement along with life cycle assessment. Waste Manag. 2019, 99, 90–101. [Google Scholar] [CrossRef] [PubMed]
  25. Wang, L.; Zhou, S.H.; Shi, Y.; Tang, S.W.; Chen, E. Effect of silica fume and PVA fiber on the abrasion resistance and volume stability of concrete. Compos. Part B Eng. 2017, 130, 28–37. [Google Scholar] [CrossRef]
  26. High, C.; Seliem, H.M.; El-Safty, A.; Rizkalla, S.H. Use of basalt fibers for concrete structures. Constr. Build. Mater. 2015, 96, 37–46. [Google Scholar] [CrossRef]
  27. Aci, C. Building Code Requirements for Structural Concrete-ACI 318-95; ACI: Montreal, QC, Canada, 1995. [Google Scholar]
  28. Guo, Z. Strength and Constitutive Relationship of Concrete: Principle and Application; China Construction Industry Press: Beijing, China, 2004. [Google Scholar]
  29. Shang, H.-S.; Ou, J.P. Analysis on reliability and freeze-thaw damage theory of concrete. Eng. Mech. 2011, 28, 70–74. [Google Scholar]
  30. Xu, F.; Wang, S.; Li, T.; Liu, B.; Li, B.; Zhou, Y. Mechanical properties and pore structure of recycled aggregate concrete made with iron ore tailings and polypropylene fibers. J. Build. Eng. 2020, 33, 101572. [Google Scholar] [CrossRef]
  31. Liu, K.; Wang, S.; Quan, X.; Duan, W.; Nan, Z.; Wei, T.; Xu, F.; Li, B. Study on the mechanical properties and microstructure of fiber reinforced metakaolin-based recycled aggregate concrete. Constr. Build. Mater. 2021, 294, 123554. [Google Scholar] [CrossRef]
Figure 1. Microscopic analysis of S and IOTs.
Buildings 13 01341 g001
Figure 2. Aggregate particle size curves.
Buildings 13 01341 g002
Figure 3. Research program of IOT-ECC.
Buildings 13 01341 g003
Figure 4. IOT-ECC of fcu at 28 d.
Buildings 13 01341 g004
Figure 5. IOT-ECC of ff at 28d.
Buildings 13 01341 g005
Figure 6. Load–deflection curve.
Buildings 13 01341 g006
Figure 7. Typical multi-crack phenomenon.
Buildings 13 01341 g007
Figure 8. fc of IOT-ECCs at 28 d.
Buildings 13 01341 g008
Figure 9. Failure phenomena under axial compression.
Buildings 13 01341 g009
Figure 10. Axial compressive stress–strain curve.
Buildings 13 01341 g010
Figure 11. fcu of IOT-ECC under sulfate F-T cycle.
Buildings 13 01341 g011
Figure 12. Mass loss of IOT-ECCs under sulfate F-T cycle.
Buildings 13 01341 g012
Figure 13. RDEM of IOT-ECC under sulfate F-T cycle.
Buildings 13 01341 g013
Figure 14. β(n) of IOT-ECCs under sulfate F-T cycle.
Buildings 13 01341 g014
Figure 15. T2 spectrum curves of IOT-ECCs.
Buildings 13 01341 g015
Figure 16. Peak areas of T2 spectrum curves of IOT-ECCs.
Buildings 13 01341 g016
Figure 17. SEM micro-morphology.
Buildings 13 01341 g017aBuildings 13 01341 g017b
Table 1. Chemical compositions of cement, metakaolin, and fly ash.
Chemical Compositions
SiO2Al2O3CaOMgOFe2O3TiO2SO3Others
Cement55.7%42.5%0.4% 0.3%0.9% 0.2%
Metakaolin22.1%5.0%63.8%0.9%5.5% 2.1%0.6%
Fly ash52.97%29.96%3.66%1.52%7.98% 0.65%3.26%
Table 2. Physical properties of S and IOTs.
AggregatesApparent Density (kg m−3)Loose Bulk Density (kg m−3)Crushing Index (%)Water Absorption (%)Mud Content (%)Water Content (%)
S2756184416.452.160.51.48
IOTs2734182720.378.92.64.36
Table 3. Characteristic parameters of fiber.
MaterialsLength (mm)Diameter (mm)Density
(g cm−3)
Fracture Elongation (%)Tensile Strength (MPa)Modulus of Elasticity (GPa)
PF120.041.37160042
Table 4. Mix proportions (kg m−3).
TypeSIOTsWaterFly AshMetakaolinCementSuperplasticizerPVA
IOT0-P2.0565.60440.3377.4188.76925.6626
IOT20-P2.0452.48113.12440.3377.4188.76925.6626
IOT40-P2.0339.36226.24440.3377.4188.76925.6626
IOT60-P2.0226.24339.36440.3377.4188.76925.6626
IOT80-P2.0113.12452.48440.3377.4188.76925.6626
IOT100-P2.00565.6440.3377.4188.76925.6626
Table 5. Comparison results between calculated and test.
Equation (3)ACI (318-95)CEB-FIP
Error range−7.7–5.5%−24–−33.6%0.1–13.9%
Table 6. Toughness indexes.
TypeI5I10I20
IOT0-P2.05.6310.3515.67
IOT20-P2.06.4514.9525.89
IOT40-P2.06.9815.2627.70
IOT60-P2.06.5714.2226.95
IOT80-P2.05.9810.8217.95
IOT100-P2.05.310.4412.95
Table 7. Test results of the peak strain and elastic modulus.
Typefc (MPa)Peak Strain (×10−3)Elastic Modulus (GPa)
IOT0-P2.028.13.9222.4
IOT20-P2.028.94.1622.3
IOT40-P2.032.14.3422.9
IOT60-P2.030.53.9622.7
IOT80-P2.030.83.8922.2
IOT100-P2.026.53.9121.9
Table 8. Curve-fitting parameters of stress–strain.
TypeAscending SectionDescending Section
AR2BR2
IOT0-P2.01.7490.996451.8470.8352
IOT20-P2.01.7330.999491.9850.80681
IOT40-P2.01.8040.99062.3800.8374
IOT60-P2.01.7370.992782.0240.88052
IOT80-P2.01.7250.99851.9130.8569
IOT100-P2.01.6960.99142.2650.8488
Disclaimer/Publisher’s Note: The statements, opinions and data contained in all publications are solely those of the individual author(s) and contributor(s) and not of MDPI and/or the editor(s). MDPI and/or the editor(s) disclaim responsibility for any injury to people or property resulting from any ideas, methods, instructions or products referred to in the content.

