Article

Research on Campus Space Features and Visual Quality Based on Street View Images: A Case Study on the Chongshan Campus of Liaoning University

1
School of Design and Art, Shenyang Jianzhu University, Shenyang 110168, China
2
School of Architecture and Urban Planning, Shenyang Jianzhu University, Shenyang 110168, China
3
Department of Architecture, The University of Kitakyushu, Kitakyushu 808-0135, Japan
*
Author to whom correspondence should be addressed.
Buildings 2023, 13(5), 1332; https://doi.org/10.3390/buildings13051332
Submission received: 31 March 2023 / Revised: 23 April 2023 / Accepted: 13 May 2023 / Published: 19 May 2023
(This article belongs to the Section Architectural Design, Urban Science, and Real Estate)

Abstract

:
As the university campus is a place for learning, conducting scientific research, and communication, campus street spatial quality has an impact on its users. Therefore, refinement evaluations of campus spatial quality are essential for constructing high-quality campuses. In this study, machine learning was used to conduct semantic segmentation and spatial perception prediction on street view images. The physical features and perception quality of the surrounding areas of the Chongshan campus of Liaoning University were obtained. The study found that the visual beautiful quality (VBQ) of the student living area was the highest, and the VBQ of the teacher living area was the lowest when compared to the research and study area, student living area, sports area, and surrounding area. Greenness and openness had positive influences on VBQ, while enclosure had a negative influence. This study analyzed the influence mechanism operating between spatial physical features and VBQ. The results provide theoretical and technical support for campus space spatial quality construction and improvement.

1. Introduction

Currently, the construction of campuses in China has focused on high-quality development, particularly when it comes to the quality of campus space environments [1,2]. The public has proposed refined requirements for campus space quality. Campus spaces, which provide research, living, teaching, communication, and rest functions, have a significant influence on the comfort and satisfaction of students and teachers. Thus, convenience, comfort, and beauty have become the main factors for evaluating campus space quality. Abu-Ghazzeh’s (1999) paper found that campus space quality depends on three main components: physical environment quality, behavioral quality, and visual quality [3,4,5]. As it is an important part of the campus space, the campus street is an important site in which to conduct a quantitative analysis of campus spatial quality. The prerequisites for and difficulties in improving the quality of the campus street space involve accurately quantifying the campus’ built environment and public perception.
With the increasing the numbers of buildings and facilities, some problems are seriously affecting the perception of campus space, such as low greenness, less openness, differential distribution of spatial quality, and declining environmental quality [3]. At present, the study of campus space focuses on spatial imagery, the street landscape, aesthetics, the protection of the campus’ historical buildings, green ecological energy saving, and the post-use evaluation of the campus built environment [6,7].
The Chongshan campus of Liaoning University, China was selected as the study site for this study. Firstly, the study determined 245 sample points by using ArcGIS, then panoramic street view images were obtained from Baidu data sources. Semantic segmentation was used to recognize landscape elements in the street view images, and five physical features, including greenness and openness, were calculated. Secondly, the Place Pulse 2.0 (PP 2.0) data set was used to quantify the spatial perception in the study area. Finally, the study comprehensively analyzed the relationship and mechanism between visual spatial features and human perceptions by using statistical analysis. The results could be applied to the construction and sustainable development of Chinese campuses, as they provided a theoretical basis, and data support, for improving campus spatial quality and coordinating internal and external spatial qualities.

2. Literature Review

2.1. Campus Space Features and Visual Quality Based on Street View Images

Previous studies on space quality measurement were mainly conducted from the perspective of urban morphology and environmental behavior. Researchers of spatial features used to adopt some methods, drawing from sociology, environmental behavior, and other disciplines. These methods, such as field survey and obtaining information on both sides of the street from existing data, involve a high workload and the need for support from other disciplines [8,9].
Human perception and the physical elements in the street space are the important parts of evaluating space quality [10]. Related studies have showed that spatial features and quality are related to the physical elements in the street landscape, such as the buildings, sky, greening, and sidewalk. Previous studies pointed out that the greening and open space layout, building density, and spatial features are directly affected by the behaviors and moods of pedestrians [11,12,13]. Meanwhile, the spatial features were found to have an impact on spatial quality [14], involving factors such as the green landscape index [15], sky openness index [16], long sight line [17], critical buildings, pedestrian space [18], enclosure [19,20], and width of the sidewalk [21,22,23].
In a street environment, the physical features can accurately reflect the objective street spatial quality, but the human overall perception cannot be obtained from these features. Vision is the most direct way to perceive the environment, and so, some scholars have suggested understanding the visual features of street landscapes based on visual perception [24,25]. Some theories in previous studies have confirmed a close relationship between perception and quality, highlighting spatial scores [26] and sensory qualities [27]. The aesthetic quality in the urban street landscape is a dimension of the human perception environment [28], which influences the attractiveness of urban spaces [29].

2.2. Machine Learning in Semantic Segmentation and Spatial Perception

With the development of street view imagery and computer vision technology [30], obtaining basic data and efficiently using street view images have turned out to be possible [31] (Table 1). Thus, street view images and semantic segmentation are the main data sources and methods for processing data that enable the continuous measurement of spatial and perceptual features on a large scale and with high precision, allowing for the rapid and accurate evaluation of spatial quality in large-scale data. The problems of the large-scale nature and difficult refinement of traditional data have been solved [32]. Machine learning and street-level images are now widely used in research design and data analysis for dealing with the interrelationships between complex built environment features [33]. The development of these new technologies and methods has brought about promising potential for future research on spatial quality.
Street view images can represent the objective environment in a city [34,35,36], and thus, are important for studying the urban objective environment from subjective perceptions [37]. They have been used to measure street landscape features including street spatial qualities, three-dimensional (3D) urban reconstructions [38,39,40], specific scene recognition [41], investigations of plant and animal species [42,43,44], route selection [45], perceived safety evaluation [46], street visual evaluation perception [15,47,48], and urban design qualities. Moreover, some scholars have analyzed street features in entire cities by using street view images, and have described urban street spaces [11] using physical features such as green view rate, openness, building interface, diversity, and road motorization. For example, Wu used street view images and semantic segmentation technology to quantify the visual features in the streets of Shenzhen [49].
Machine learning has been used to analyze the correlation between urban big data and individual public perception behavior using tools such as deep learning computer vision models and semantic segmentation [26]. On the one hand, semantic segmentation can segregate different urban landscape elements into segmented regions along their boundaries, creating annotated color images for differentiation and observation. With the powerful feature extraction capability of neural networks, semantic segmentation achieves end-to-end, pixel-to-pixel segmentation algorithms which significantly enhance the accuracy of image segmentation [50]. This has not only been used to analyze the constitutive elements in the urban objective environment [51,52], but has also solved the problem of measuring landscape elements. An influence study of urban spatial features and spatial quality at the micro-level can be conducted [24,53,54,55].
On the other hand, crowdsourcing data and machine learning provide opportunities for studying urban perception [56]. Deep-learning computer vision models provide an opportunity to study urban perception. Related scholars have become focused on utilizing techniques that simulate human vision to perceive the urban landscape. Researchers have been able to recognize features and conduct spatial perception prediction in complex street environments [57,58]. For instance, Dubey et al. trained the Place Pulse 2.0 dataset to develop a deep-learning computer vision model which can predict up to 74% of the perceived comparisons between two images by rating the public’s perception of 100,000 street images using labels such as ‘safe’, ‘vibrant’, ‘uninteresting’, ‘affluent’, ‘downtrodden’, and ‘beautiful’ [59,60]. This large-scale perception prediction approach enables automated audits of urban appearance in cities around the world. Meanwhile, urban change has been quantified by using time-series street-level imagery [61], and the impact of urban design on human perception has been confirmed [62]. Currently, researchers focus on quantifying urban perception and analyzing the influence of urban perception on urban activities and the physical environment [63]. For example, Zhang et.al. utilized a deep residual layer network DCNN model to construct and predict six perceptual features such as the subjective perceptual discrimination of beauty in street space [49].
Table 1. The key literature on machine learning.
AuthorsYearResearch Method
Semantic SegmentationLee et al. [10]
2022
2022By using a machine learning prediction model and the SHAP algorithm, the physical and visual characteristics that affect pedestrian satisfaction were analyzed.
Wang et al. [11]
2022
2022The study analyzed the Panoramic green view index by SegNet.
Xu et al. [19]
2022
2022This study quantified both subjective and objective human-scale streetscape perceptual quality and compared the effects of the two perceptions on house prices.
Ki and Lee [64]
2021
2021This study examined the street Green View Index (GVI) and its associations with walking activities by using semantic segmentation and Google View images.
Zhang and Hu [30]
2022
2022Using Google Street View and deep learning, the study analyzed and studyied street-level greenery.
Sun et al. [65]
2023
2023The study showed the relationship between the green view index and visual comfort.
Zhang et al. [66]
2022
2022Using deep learning algorithms, the study tracked subtle emotional responses and classified finer visual variables. The regression results for valence and arousal were obtained.
Space perceptual prediction Ye et al. [18]2019By using street view images and machine learning algorithms, an evaluation model was trained to assess perceived visual quality.
Wang et al. [67]
2022
2022The study used multiple linear regression to explain the association between the spatial quality and the constituent elements of the included streets.
Dubey et al. [59]
2016
2016The study showed that crowdsourcing, when combined with neural networks, can quantify perceptions of the urban environment.
Larkin et al. [60]
2021
2021Using GIS, remote-sensing datasets, and deep learning image segmentation, the study offered a new research avenue to explore how to predict perceptions of the built environment.
Harvey et al. [61]
2015
2015The study indicated a relationship between the physical characteristics of the streetscape and perceived safety.
Zhang et al. [49]
2019
2019Using a DCNN model with a deep residual layer network, the study predicted six perceptual features such as the subjective perceptual discrimination of beauty in street spaces.

3. Materials and Methods
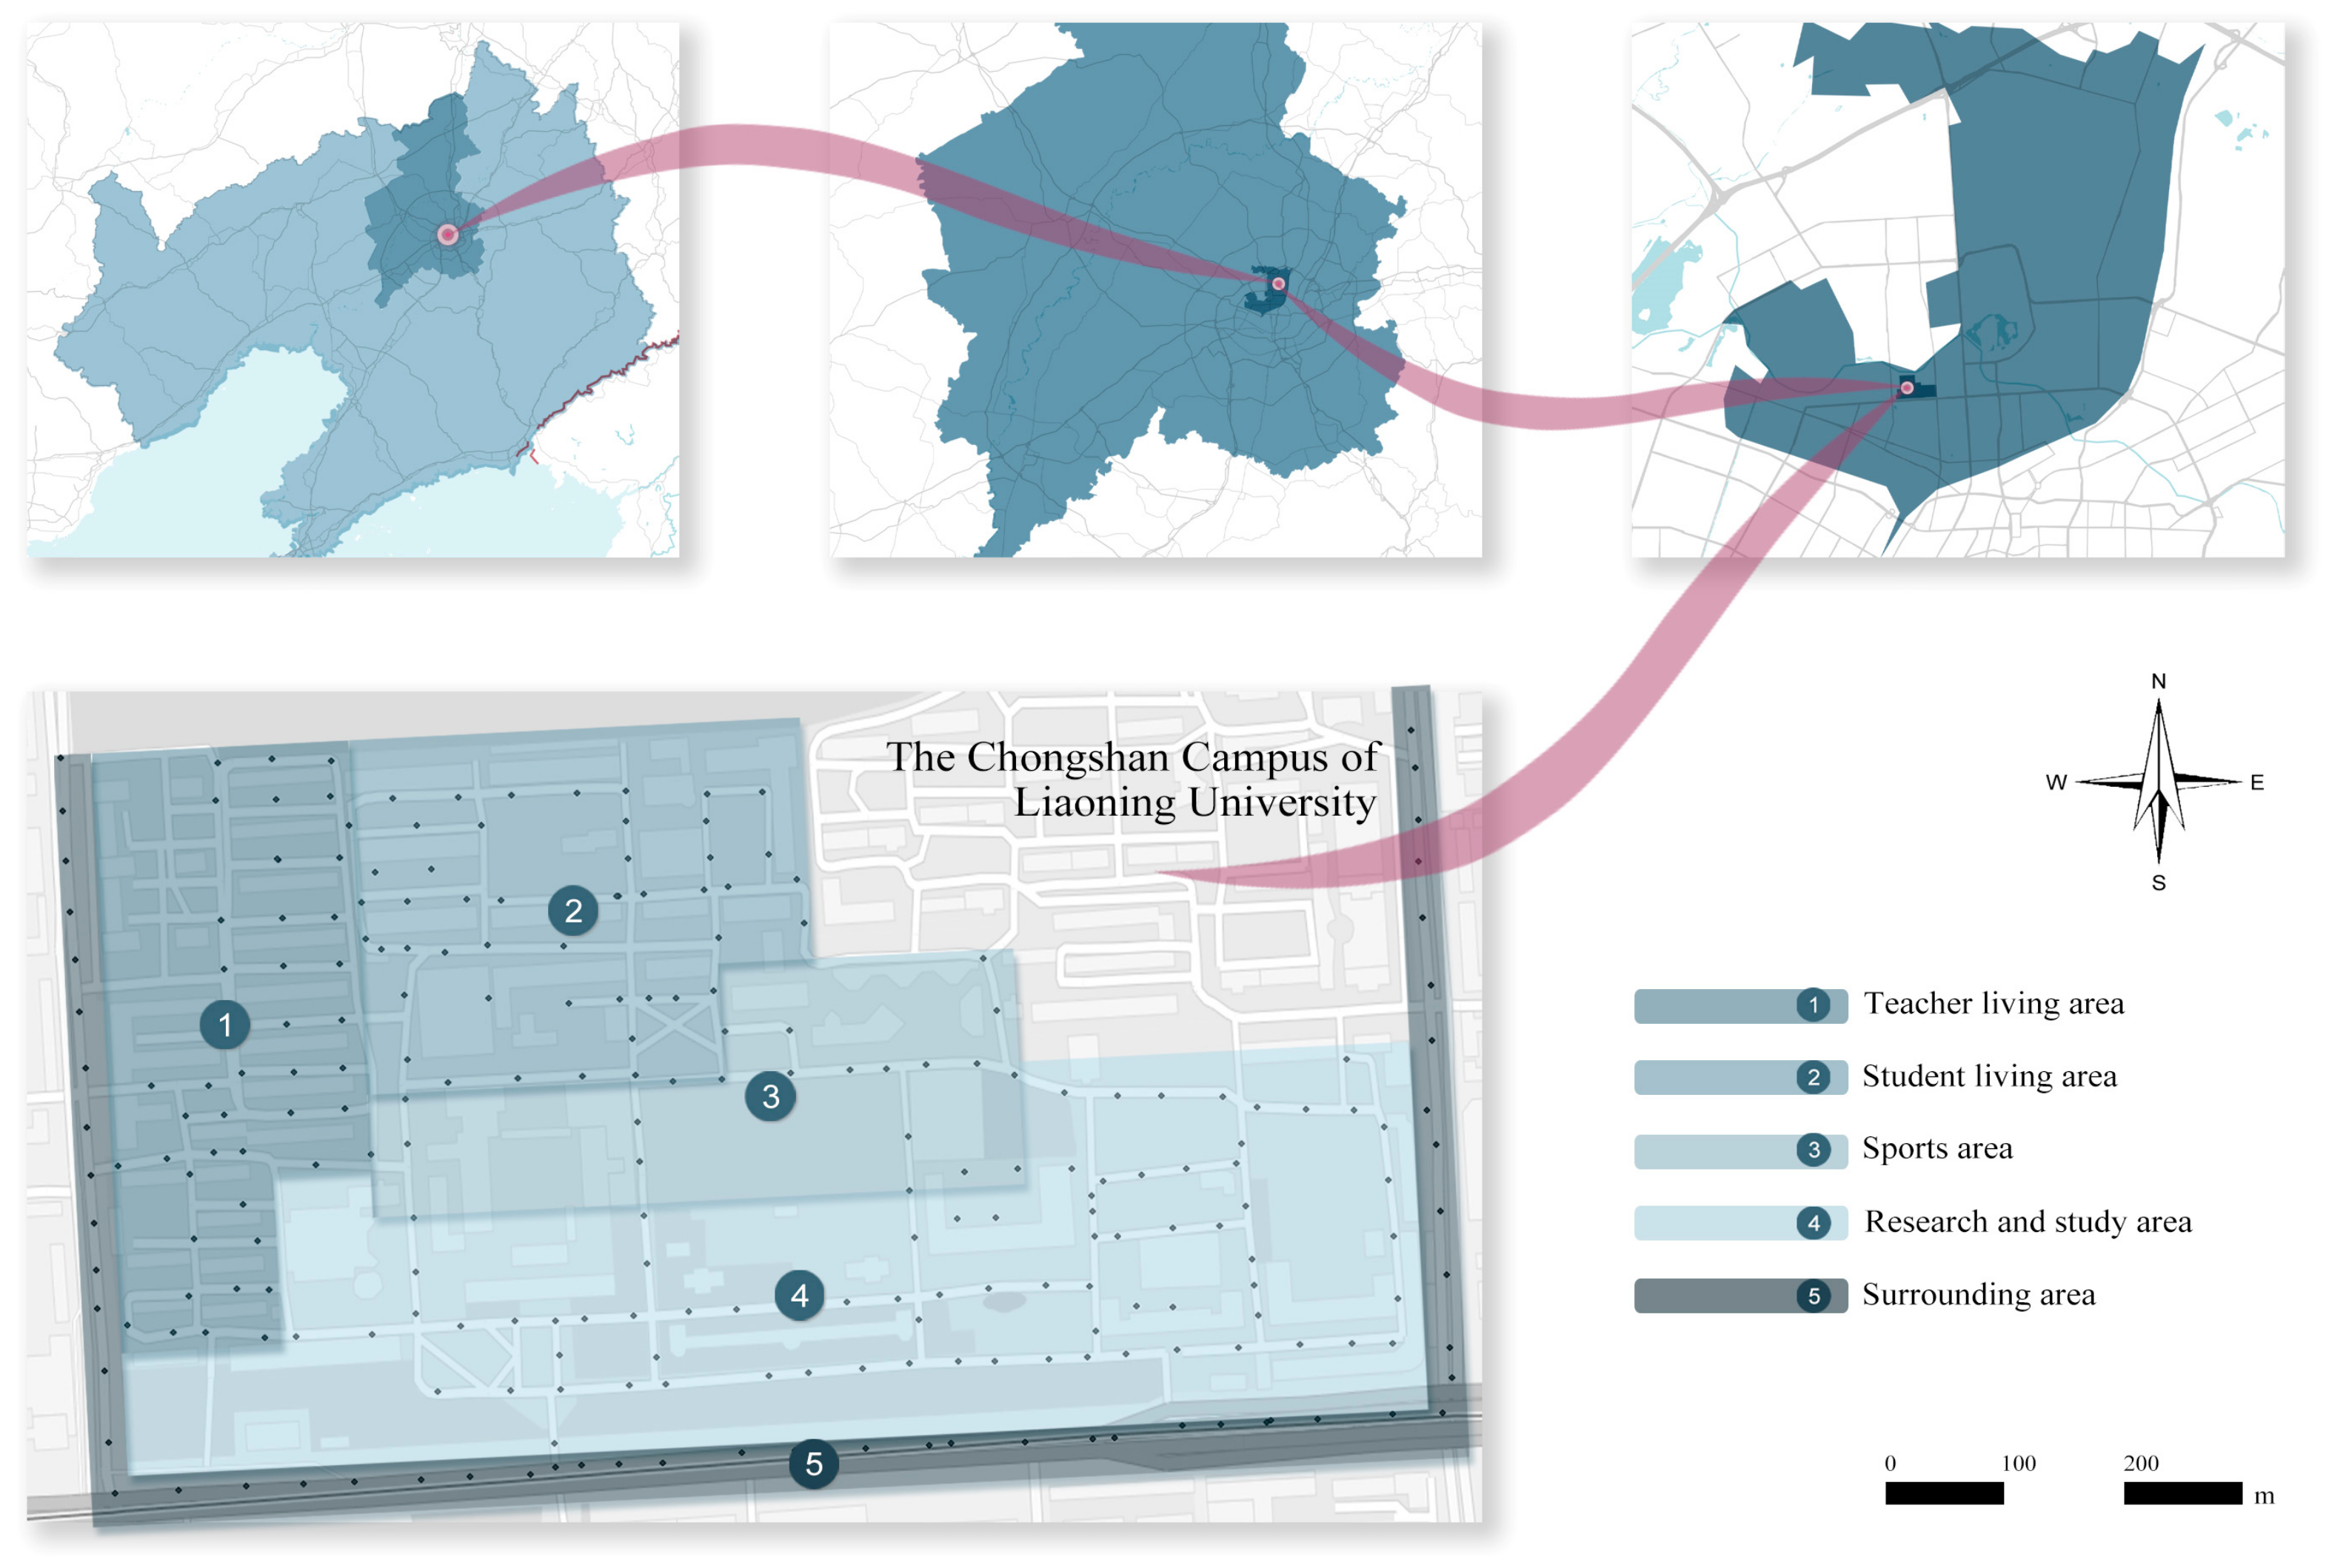
3.1. Study Site

Liaoning University is a public university that was established in 1948 (Figure 1). The focus of this study is the university’s Chongshan campus, which spans 477,000 square meters and stretches 1 km from east to west and 0.52 km from north to south. Divided into five primary sections, including research and learning, student living, sports, faculty living, and surrounding areas, the campus is bordered by the city’s main thoroughfare to the south and Yuhong Nujiangdong Park to the north. The city’s residential and commercial areas are situated to the east and west, respectively.

3.2. Baidu Street View Image Collection

The use of street view images to analyze urban streets and urban environmental quality is becoming more and more common in urban scientific research, and street view pictures correspond to the visual perception characteristics of pedestrians [15]. Street View platforms such as Baidu, Google, and AutoNavi often provide APIs that allow users to download Street View data.
To examine the relationship between spatial visual aesthetics and the physical features of the campus and its surroundings, this study utilized OpenStreetMap (OSM) to collect street network data in the research area, which were then input into ArcGIS. Using the random point generation function module, the study generated 245 sampling points at 50-m intervals and obtained the latitude and longitude coordinates of each point. To automatically collect street view images, a Python code program was written, with the initial pitch value set to 0°. The sampling season was selected as summer, considering the seasonal changes in street view images, and BSVIs were collected using the Baidu Street View Image API. This comprehensive approach allowed for a complete study of the perception dimension of spatial visual aesthetics and its relationship to the physical features of the campus and surrounding areas [67].

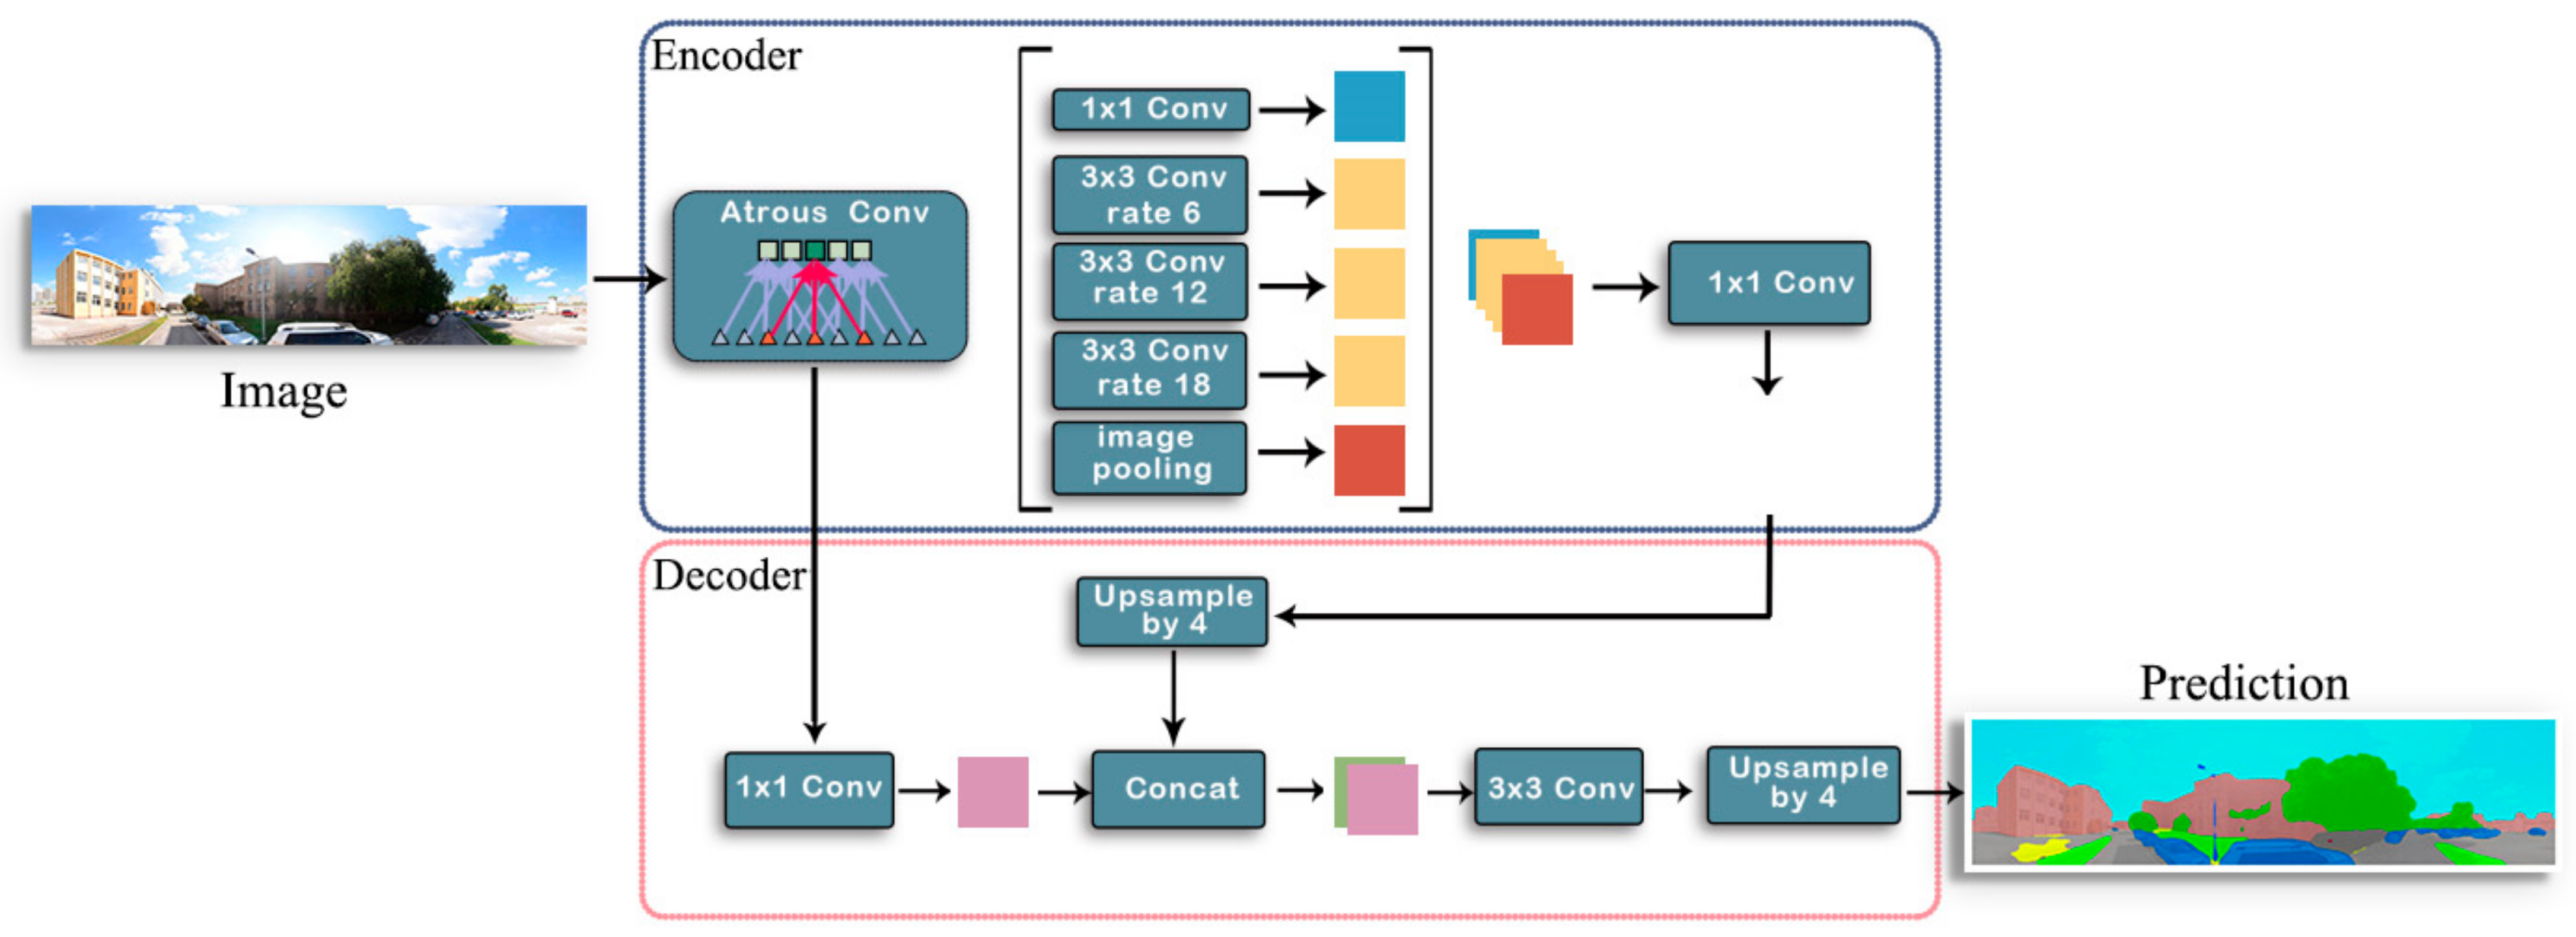
3.3. Street View Image Semantic Segmentation Based on Deep Learning

Semantic segmentation is a component of computer vision technology. Semantic segmentation algorithms based on convolutional neural networks include fully convolutional networks (FCNs), U-net, PSPnet, and the Deeplab series [68]. FCNs achieve pixel-level image prediction but lose much detailed information. U-net has slow training efficiency as the same features are trained many times, resulting in a waste of GPU resources [69]. DeeplabV3+ was presented by a Google research group based on a convolutional neural network system. It was allowed to capture information at multiple scales and extract denser feature maps. With an accuracy of 82.1%, it is able to recognize all forms of images. DeeplabV3+ supports both the analysis of street landscapes with high-resolution and micro-scale evaluations in urban areas [66,70,71,72,73]. It is known for its high accuracy in segmenting small street spaces and its efficiency in using smaller training sets. DeeplabV3+ solved the problem of missing detail information. DeeplabV3+ has been widely used by some researchers in studies on street view images and semantic segmentation [65,73]. Therefore, it was chosen for use in this study. The flow-chart of the DeeplabV3+ model is shown in Figure 2.
We selected and identified five important physical features. It must be noted that all physical features can be calculated by semantic segmentation. The formulae for calculating the five selected physical features are as follows:
G i = 1 n i = 1 n T 1 n + 1 n i = 1 n G n i 1 , 2 , , n ,
where n denotes the number of sample point images (which is 8 in this paper), T 1 n denotes the proportion of tree pixels, and G n denotes the proportion of grass pixels;
O i = 1 n i = 1 n S n i 1 , 2 , , n ,
where n denotes the number of sample point images (which is 8 in this paper), S n denotes the proportion of sky pixels, and the sum indicates the total number of sky pixels in each image;
E i = 1 n i = 1 n B 1 n + 1 n i = 1 n T 1 n + 1 n i = 1 n W n i 1 , 2 , , n ,
where n denotes the number of sample point images (which is 8 in this paper), B 1 n denotes the proportion of building pixels, T 1 n   denotes the proportion of tree pixels, and W n denotes the proportion of wall pixels;
V 1 i = 1 n i = 1 n C n + 1 n i = 1 n T 2 n + 1 n i = 1 n B 2 n + 1 n i = 1 n V 2 n 1 n i = 1 n R n ,
where n denotes the number of sample point images (which is 8 in this paper), C n denotes the proportion of car pixels, T 2 n denotes the proportion of truck pixels, B 2 n denotes the proportion of bus pixels, T 2 n denotes the proportion of truck pixels, V 2 n denotes the proportion of van pixels, and R n denotes the proportion of roads pixels; and finally,
P i = 1 n i = 1 n P n i 1 , 2 , , n ,
where n denotes the number of sample point images (which is 8 in this paper) and P n denotes the proportion of pedestrian pixels.

3.4. Spatial Perception Prediction

The spatial perception model is implemented based on methods such as Transfer Learning. The model obtains spatial quality ranking scores by taking an image pair as input and conducting pairwise comparisons of the images. In this study, the Place Pulse 2.0 (PP 2.0) dataset was used to predict spatial perception. The dataset was presented by the Massachusetts Institute of Technology and covers 56 urban street view images from 28 countries spread across 6 continents. The scores of visual aesthetic quality were obtained by using neural network architecture based on human-labeled comparisons. In addition, the perceptual scores were divided into five levels to predict the model. The final model prediction has an accuracy of 65%, a deviation of one level with 35.67% probability, a deviation of two levels with 3.97% probability, a deviation of three levels with 0.34% probability, and a deviation of four levels with 0% probability. Accurate prediction or deviation by one rank is above 95.6%. This shows that the results of predicting spatial perception are consistent with visual perception. The results are the same as in previous studies [62].

4. Results

4.1. Perception Features

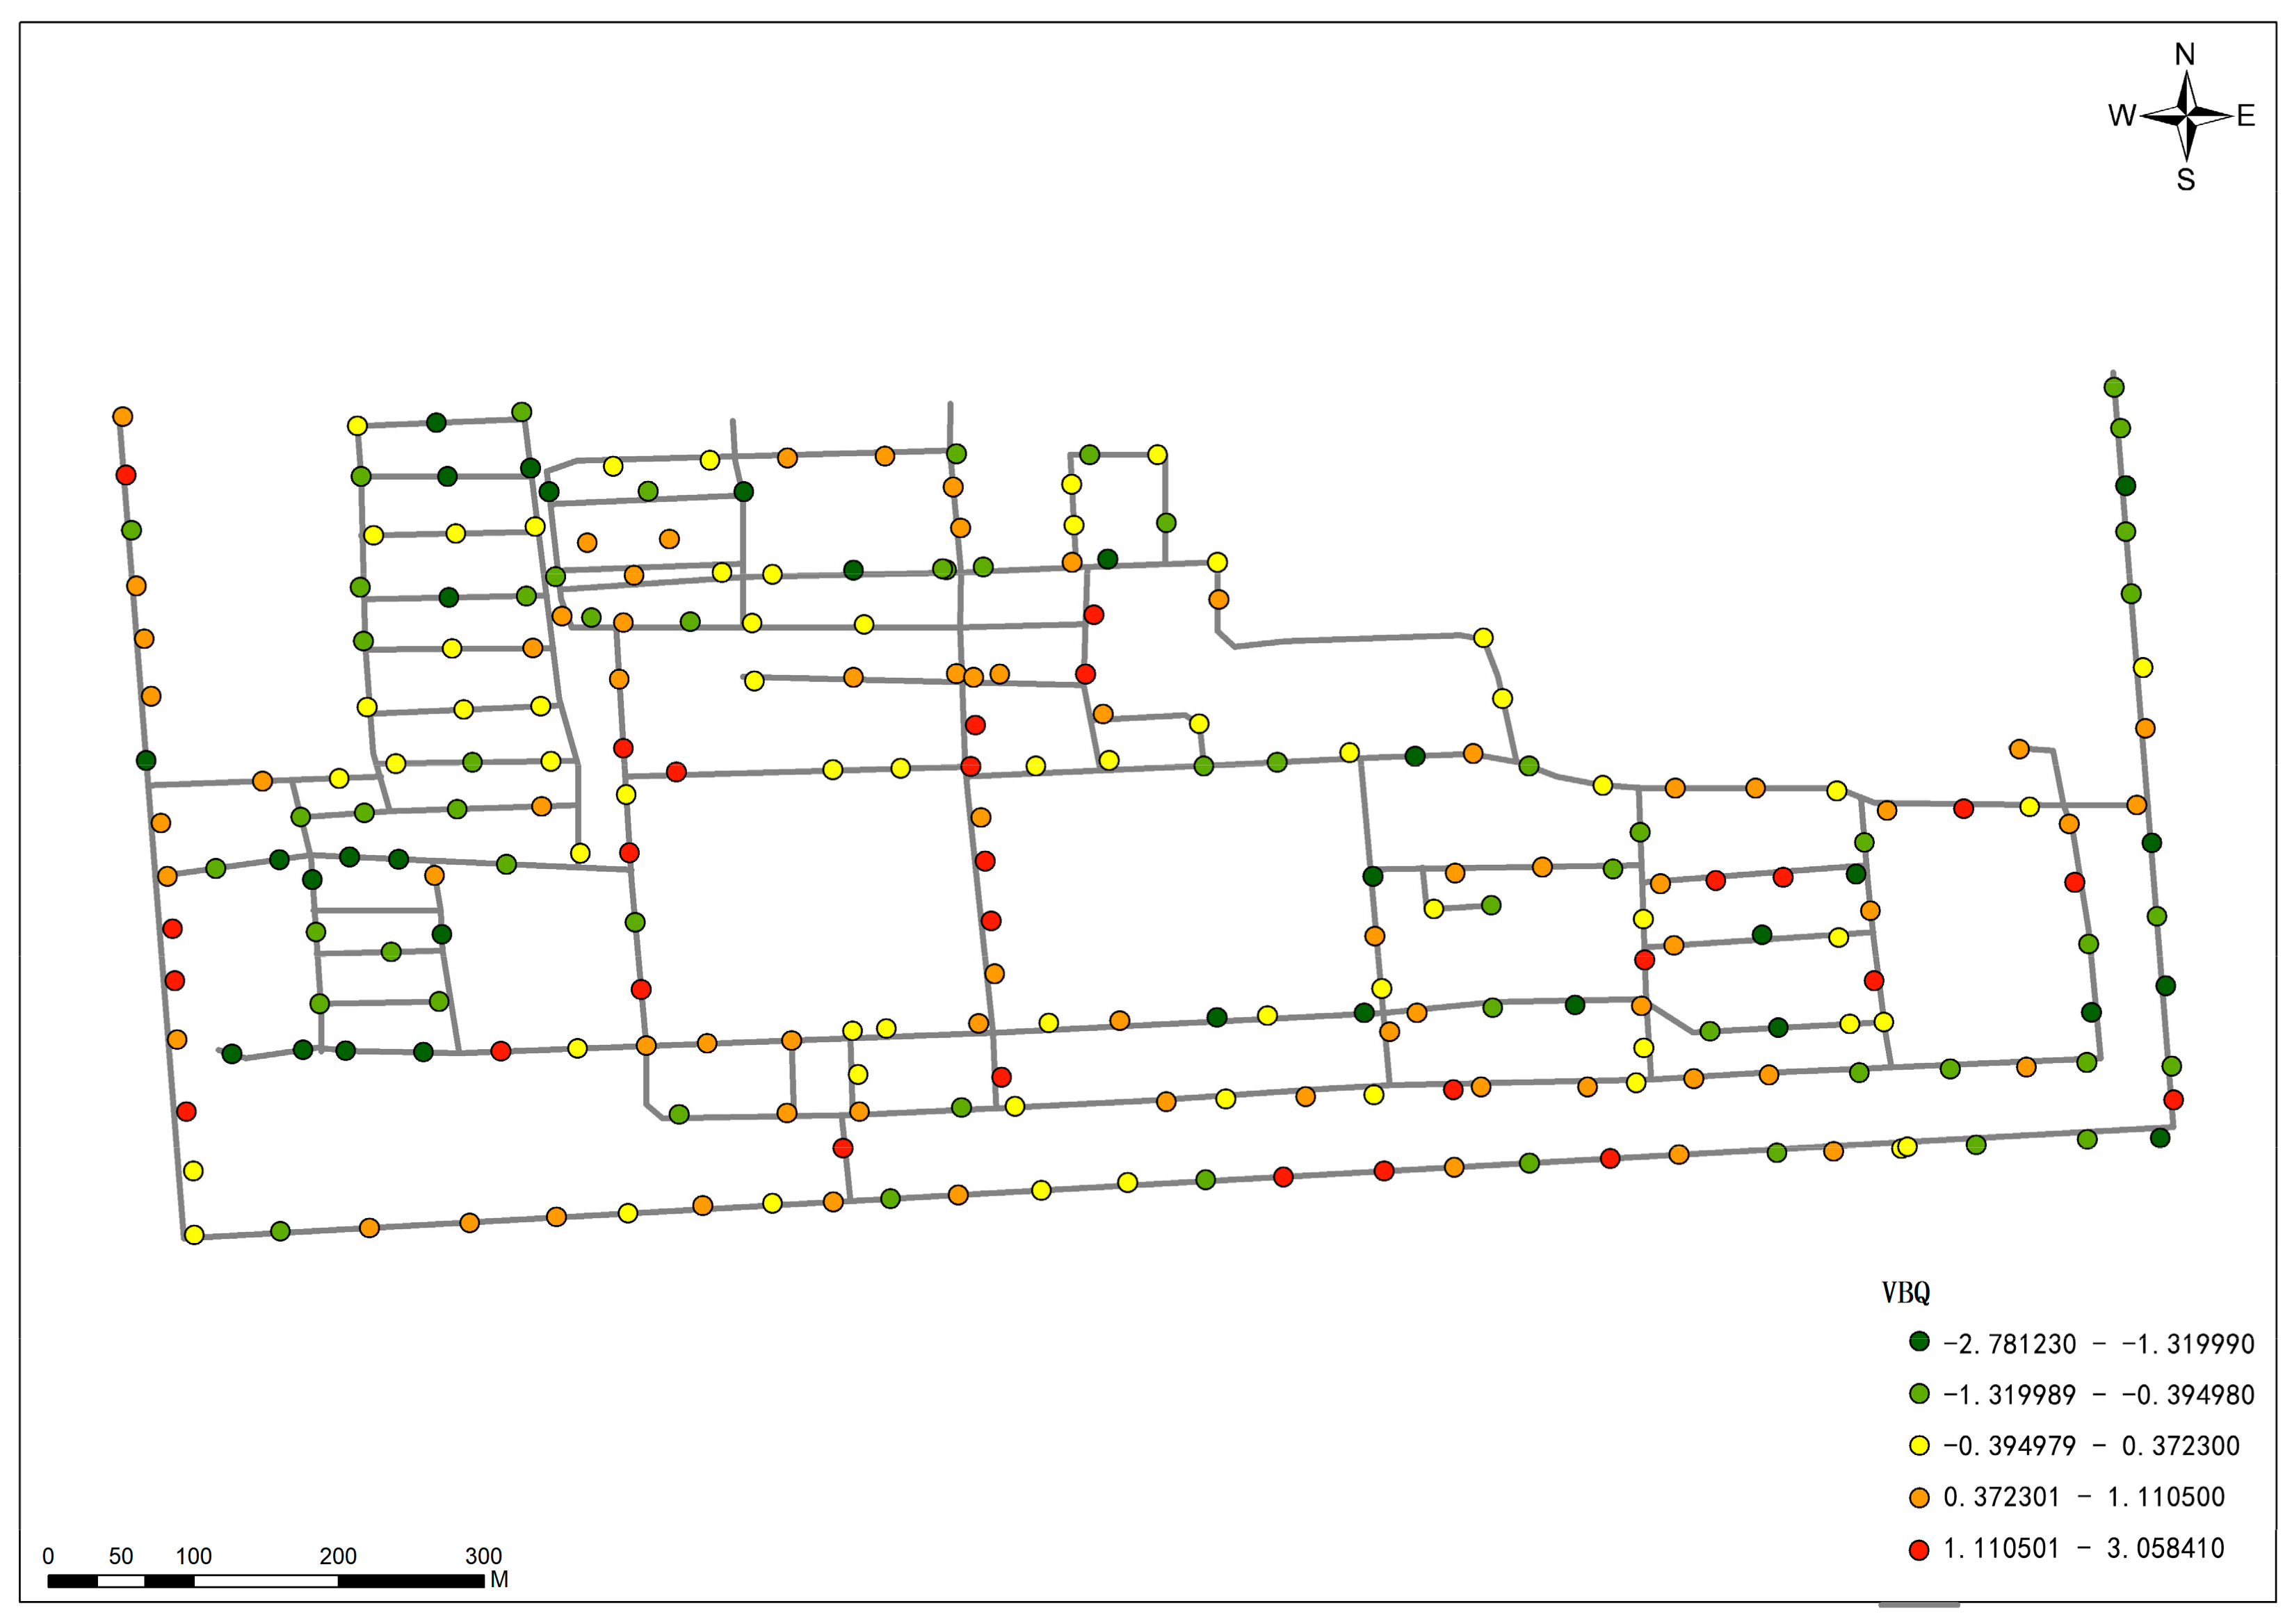
4.1.1. The Overall Analysis of VBQ

By sorting the visual beautiful qualities of 245 sample photos, the top 81 samples were classified as high-perception samples while the bottom 81 samples were classified as low-perception samples (Table 2). Based on the functional areas in the campus, the research areas were divided into five areas. From the mean values of VBQ of each area, it could be concluded that the overall VBQs of the five areas were ranked as follows: research and teaching area > student living area > sports areas > surrounding areas > teacher living area.
By comparing the VBQ for each area (Table 3) in the campus, it was found that in the research and teaching area, there were wide roads, diverse skylines, and lush plant landscapes that added unique design details to the space. In the student living area, the buildings constituted a large proportion of the space. Here also, the roads were clean, the traffic flow was relatively loose, and the road sections, which did not cause congestion, made an open space pattern. In the sports areas, the plants were monotonous and their distribution was unfair. The landscape view was blocked as a result of some fences and overgrown vegetation. In the surrounding area, the roads were wide. Due to some overpasses and height-limiting poles, the landscape view was blocked. The unharmonious relations between styles and colors of shopping signs reduced the spatial quality. In the teacher living area, there were large spacings between the trees and thus the trees did not provide shade; moreover, the old residential buildings had a negative influence on the visual perception of the surroundings.

4.1.2. The Analysis of VBQ in the Studied Areas

The experimental data analysis showed significant spatial heterogeneity in human perceptions of the campus space and surrounding area. Figure 3 shows the VBQ visualization results based on the perceptual feature.
(1)
In the research and study areas, the mean value of VBQ was 0.2495. The proportion of high perceptions was 44.3%. The proportion of medium perceptions was 34.1%. The proportion of low perceptions was 21.6%.
Along the streets, trees with large crowns had been planted to create shade. Large area of green spaces had colorful flowers for decoration (N09, N10, N19). The landscape had distinct layers and rich posture (Q01, Q17, 0601) and was filled with vitality (I19, 1503). A strong natural atmosphere was created. The proportion of urban-identified buildings was small on both sides of the streets. The street space was open and the line of sight was transparent (1105, 1304, 1504). Some node spaces were narrow, and buildings occupied a large proportion of the street area; thus, the streets were crowded (L05, 1601). Due to the lack of landscape elements, some node spaces were monotonous and boring (L04, L07, Q05).
(2)
In the student living area, the mean value of VBQ was 0.0870. The proportion of high perceptions was 37%. The proportion of medium perceptions was 34.8%. The proportion of low perceptions was 28.2%.
The wide and clean streets (0609, 0613, 1122) and the buildings along the streets (B07, C02, D05) created open street spaces with wide views. The red buildings formed a cultural atmosphere and had had a positive impact on the beauty of the street space (F04, F09). However, some roads were narrow. The buildings formed a closed space, leading to the sky visibility being low. The buildings and plants formed an oppressive spatial atmosphere (0902, E08, E09). Plant cultivation was sparse (F09, 0802, C03).
(3)
In the sports areas, the mean value of VBQ was 0.0730. The proportion of high perceptions was 25%. The proportion of mediums perception was 43.8%. The proportion of low perceptions was 31.2%.
The campus sports fields created open spaces (I14, I16) that had had a positive impact on the happiness and vitality of the public [43]. However, the extensive use of guardrails had separated the roads from the open spaces, resulting in the obstruction of sight (1102, 1103). The plant hierarchy was varied, and the species was singular (I10, 0505). The vehicles parked along some of the streets had led to a disordered spatial environment (I11, I08).
(4)
In the surrounding area, the mean value of VBQ was −0.0702. The proportion of high perceptions was 34%. The proportion of medium perceptions was 32.1%. The proportion of low perceptions was 33.9%.
Some overpasses that crossed above the street had resulted in an oppressive spatial perception (P18, P25, P26). There were numerous shop plaques of conflicting colors and styles along the street. The visual effect was confusing (P22, 0102, 1602). Although the streets were lined with neatly planted street trees, the fading leaves gave them no vitality, and created a dilapidated atmosphere (I02, 1603, 1610).
(5)
In the teacher living area, the mean value of VBQ was −0.7344. The proportion of high perceptions was 7.1%. The proportion of medium perceptions was 31%. The proportion of low perceptions was 66.7%.
The buildings in the old residential area were dense and in disrepair, and the color of the buildings was singular (E01, E03, J02). Garbage and poorly maintained buildings had led to the untidiness of the street space (A02, N02, H03). The roads were narrow and had led to a mixing of pedestrians and vehicles (N03, N05, 0302). In some areas, motor vehicles were parked on the both sides of streets, showing a sense of disorder in the spatial environment (F03, I04). The surrounding vegetation was poor (I06, N04, 0401). The distribution of cable facilities was optional in some streets (L02, M02, 0301).

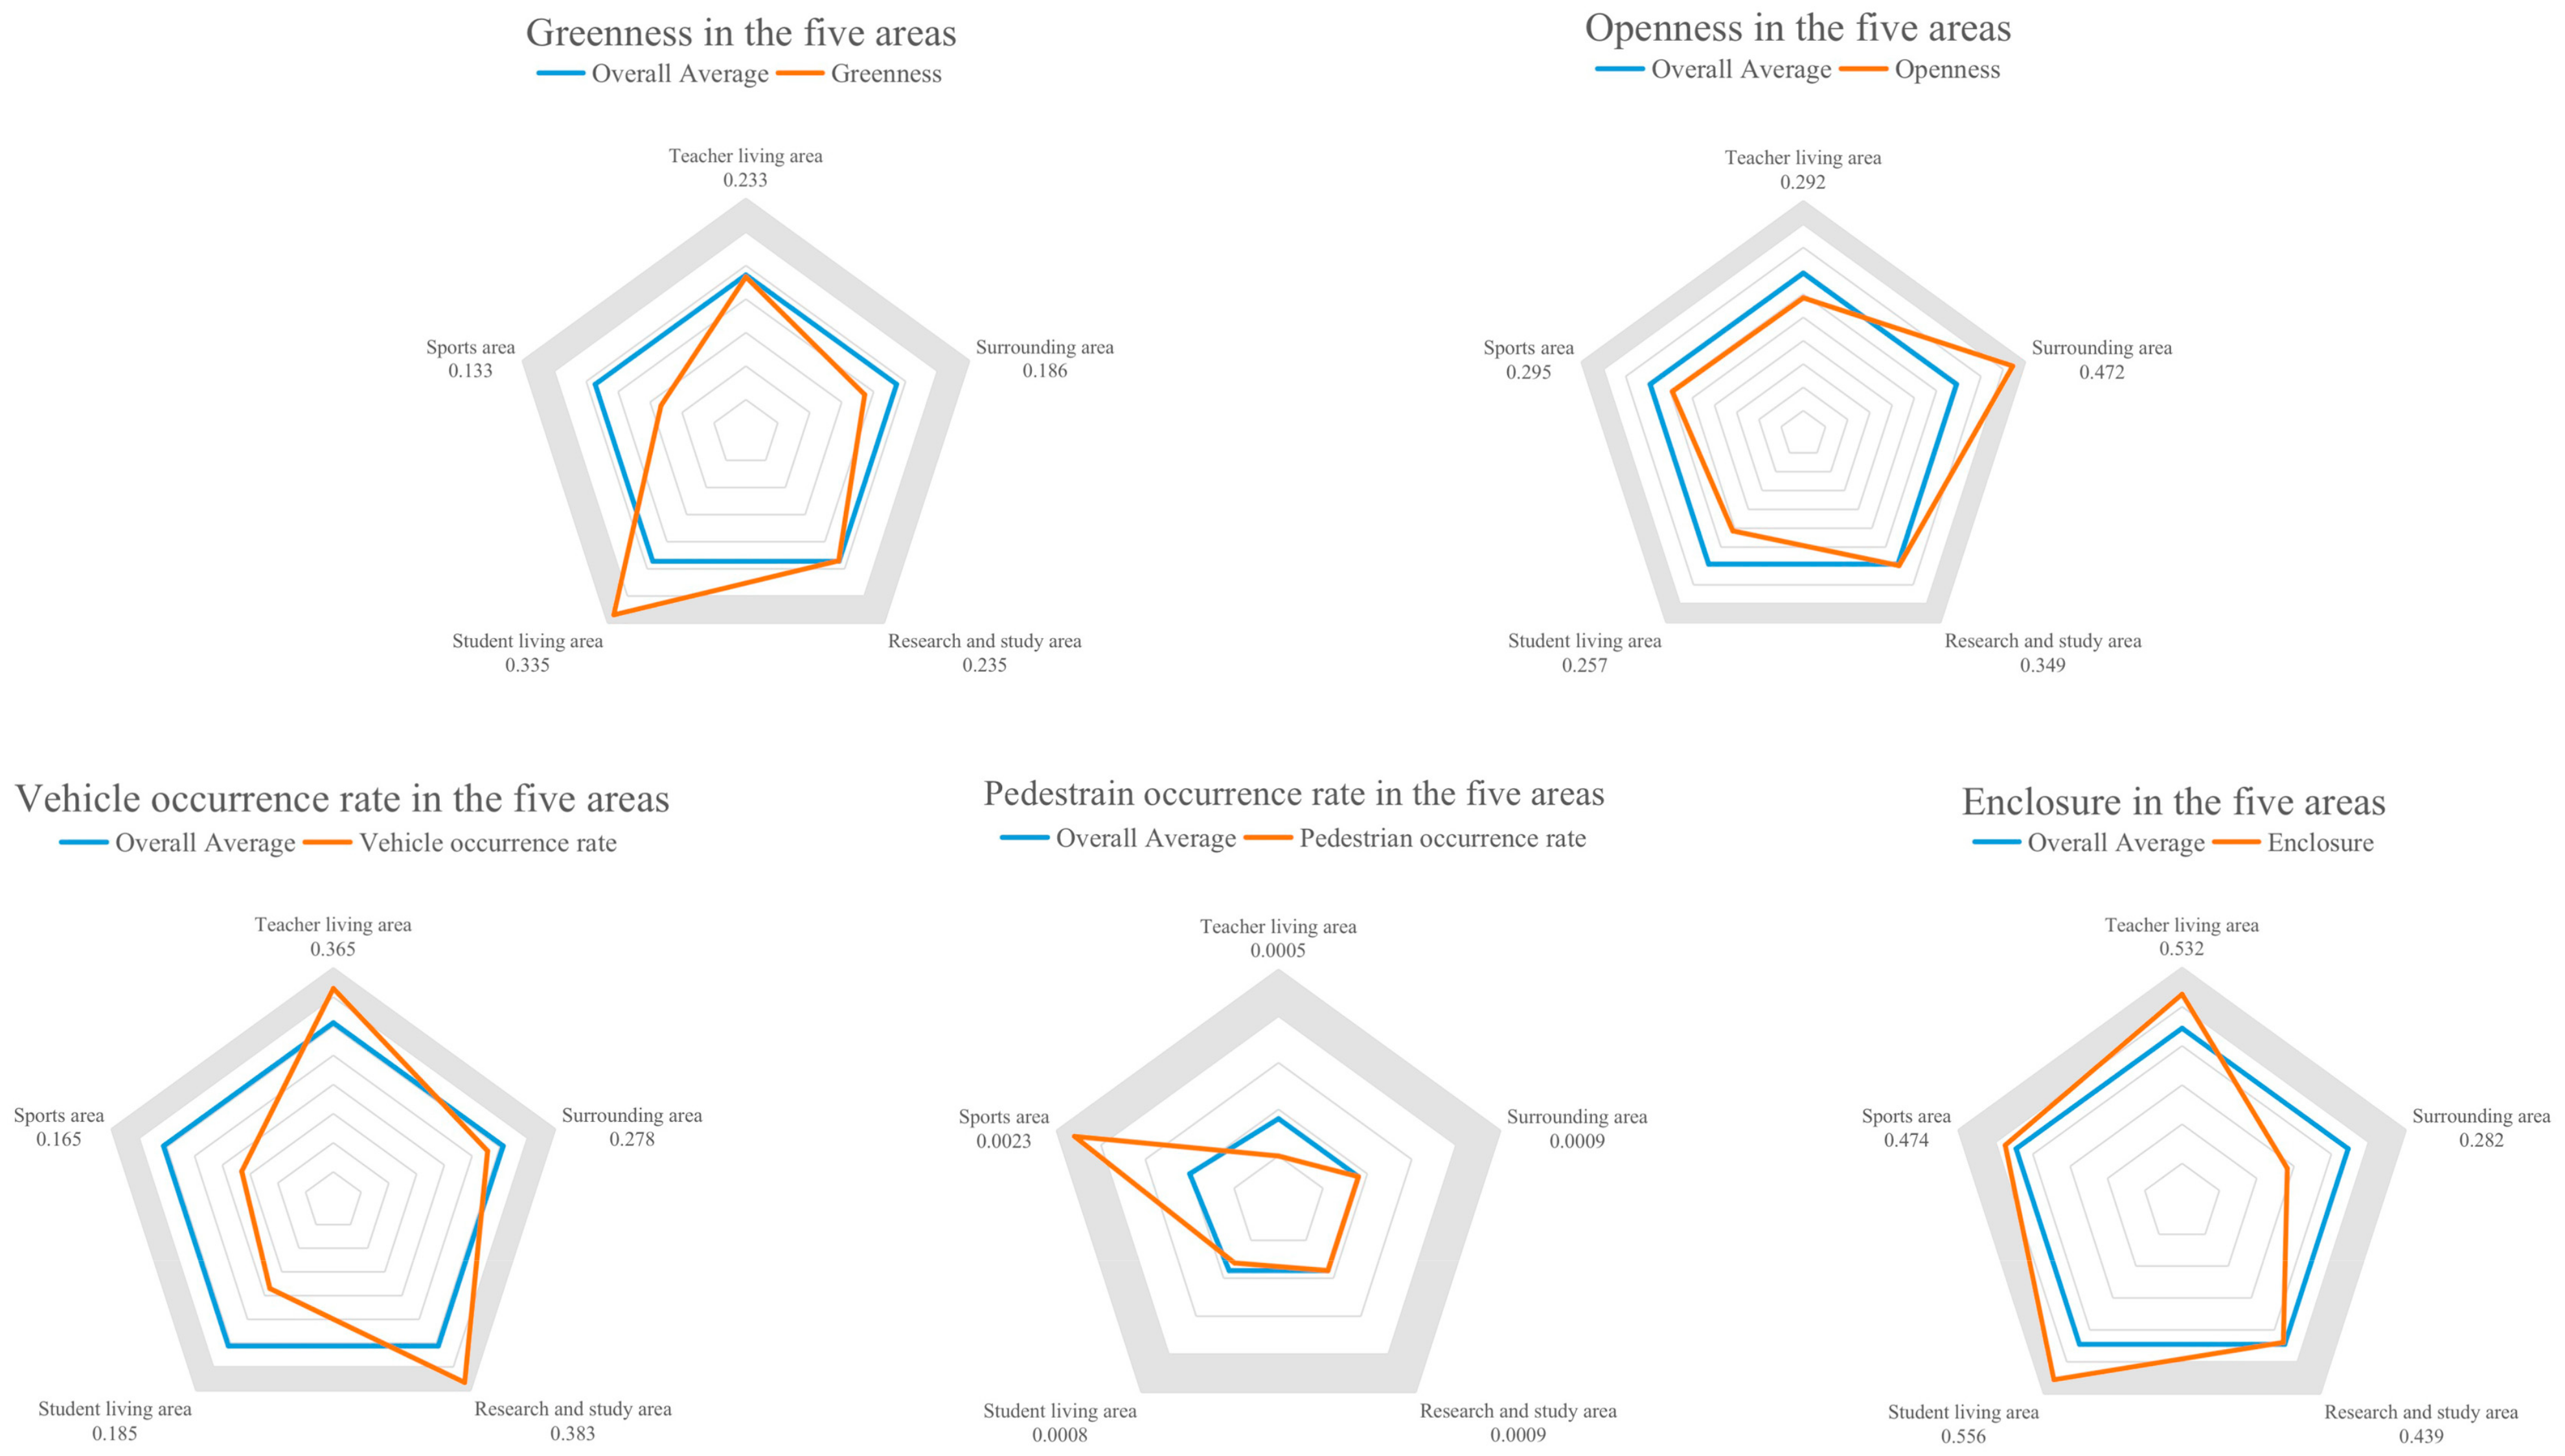
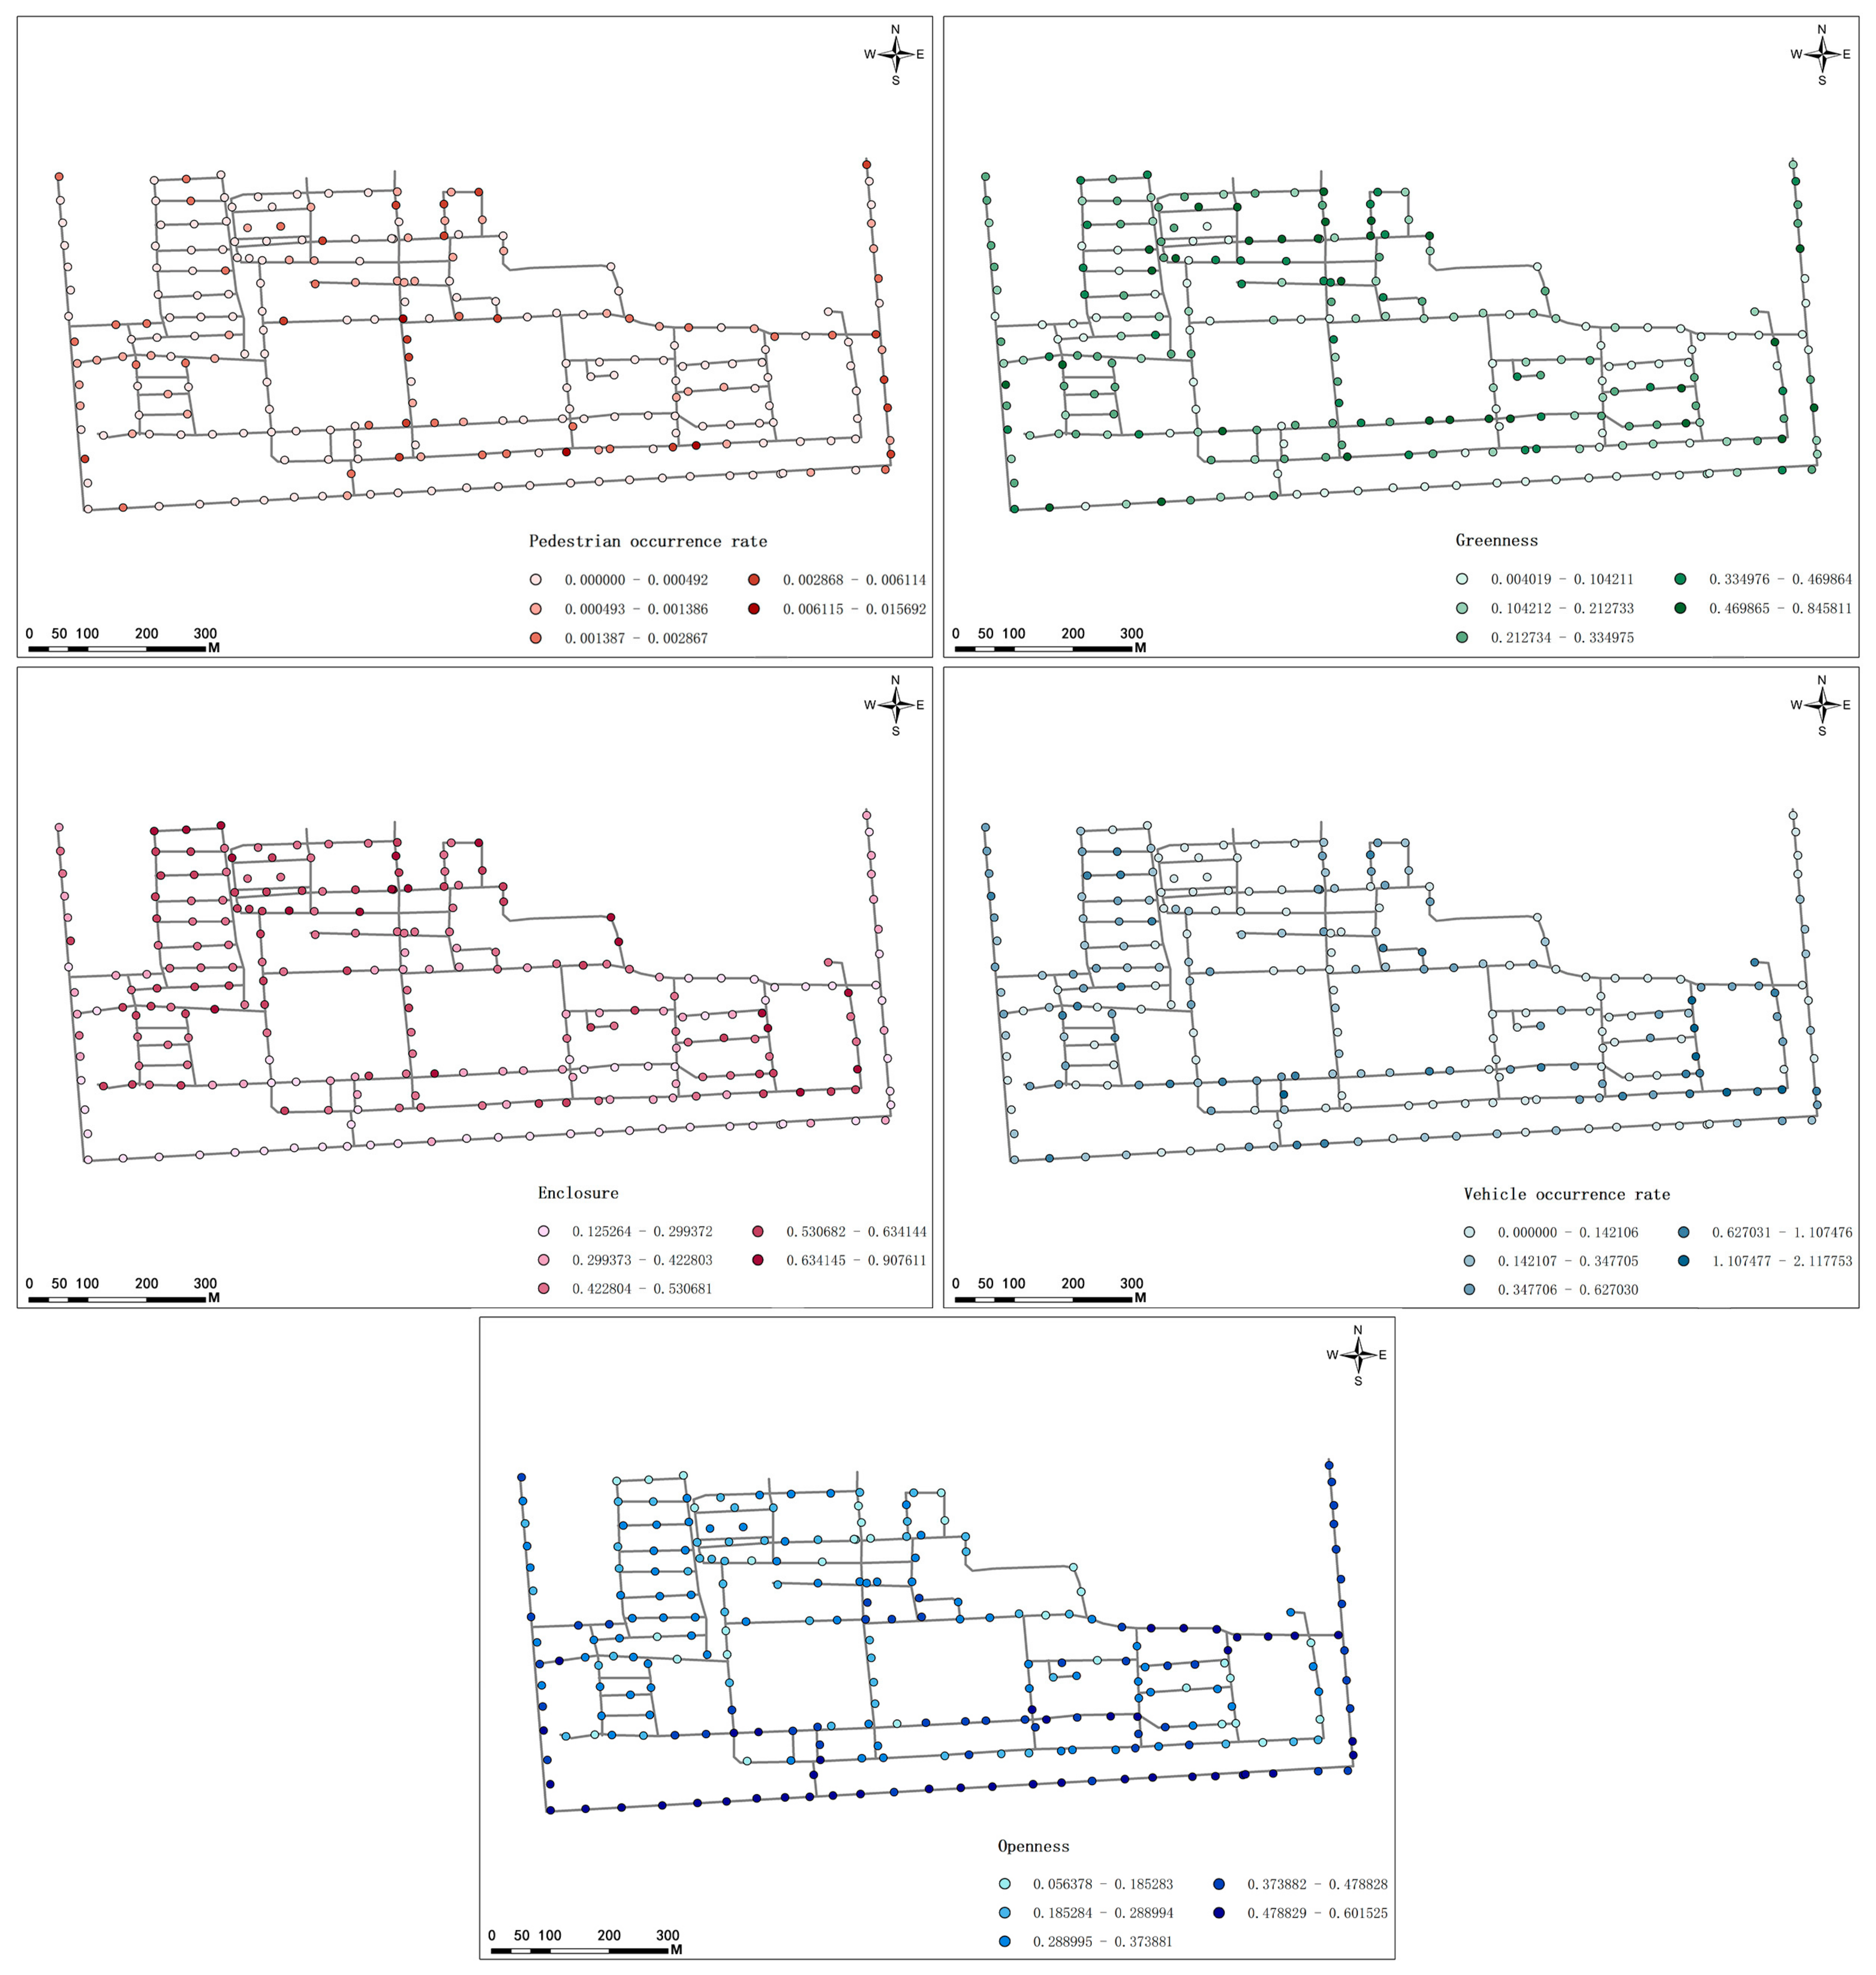
4.2. Physical Features Comparative Analysis of the Five Types Areas

The study used the DeeplabV3+ semantic segmentation network to semantically segment 245 street view images. Five physical features were calculated that represented street spatial quality: enclosure, openness, vehicle occurrence rate, pedestrian occurrence rate, and greenness. To further analyze the spatial distribution of these physical features, this study compared these five features in five areas. From the analysis of mean values, it could be concluded that the overall physical features ranked as follows (Table 4): enclosure (0.445) > openness (0.345) > vehicle occurrence rate (0.306) > greenness (0.236) > pedestrian occurrence rate (0.0009) (Figure 4). The study discussed that trees, the sky, and buildings occupied the largest proportion of human sight, as these landscape elements formed the main skeleton in the space.
The spatial distribution of the five aforementioned physical features is as follows (Figure 5).
Greenness is a psychological feature reflecting urban street greening quality. The highest greenness was primarily located in the student living area, where it had a mean value of 0.3346. Here, tall and lush street trees, shrubs, and greenery had formed a rich plant community. These effectively blocked noise and provided students with a quiet environment for living and learning. The lowest greenness was mainly distributed in the sports areas, where it had a mean value of 0.1328. There were large open spaces in the street interface. The greening along the road was not continuous, and the value of greening here was lowest.
The highest openness was primarily located in the surrounding area, where it had a mean value of 0.4719. Here, the wide roads and sky enhanced the openness in the street space, creating an open and beautiful street environment. The lowest openness was mainly distributed in the sports areas, where it had a mean value of 0.2570. Here, tall, dense trees and buildings obstructed the view of the landscape on both sides of the roads. In some samples, the trees on both sides of the roads were too luxuriant. Staggered building heights reduced the proportion of the sky and disturbed the skyline. Thus, the street visual quality was reduced in these areas.
The highest enclosure was located in the student living area, where it had a mean value of 0.5559. This value indicated that the street enclosure was made of trees and building facades of varying heights. The street space was dominated by green plants, and the visible area of the sky was limited. The next highest enclosure was located in the teacher living area, where it had a mean value of 0.5323. This value highlighted the high building density and large building sizes in this area. Here, there were narrow sidewalks and motorways. The lowest enclosure area was located in the surrounding area, where it had a mean value of 0.2819. This value indicated that the multi-lane roads occupied a large area of the street view, and that the building sizes were small on both sides, diluting the sense of space boundaries and giving people a feeling of openness.
Pedestrians and vehicles were the main movement factors on the campus. Therefore, the pedestrian occurrence rate and vehicle occurrence rate had had significant impacts on visual perception in the campus space. The usage of campus space could be reflected through these physical features. In the Chongshan campus of Liaoning University, the highest pedestrian occurrence rate was located in the sports areas, where it had a mean value of 0.0023. A large number of sports areas had attracted a large flow of people, leading to the area space becoming more dynamic. On the other hand, wide sidewalks and motorways had promoted traffic flow in this area. As the result, the lowest vehicle occurrence rate was located in this area, where it had a mean value of 0.1651. The teacher living area had the lowest pedestrian occurrence rate, with a mean value of 0.0005. This was due to the poor quality of the buildings and street surroundings here. The research and study area had the highest vehicle occurrence rate, with a mean value of 0.3830. Parking spaces were planned on both sides of the roads, and the street space was large. These factors allowed for more parking areas.

4.3. Correlation Analysis

Using SPSS25.0, the visual beautiful quality and the physical characteristics of the five aforementioned streets were analyzed, and the results are presented in Table 5. The results showed that visual beautiful quality was positively correlated with greenness and sky openness, with a significant correlation (p < 0.05). The higher the greenness was, the higher the visual beautiful quality of the street space tended to be. Sky openness was also positively correlated with visual beautiful quality, indicating that a larger sky openness value leads to a higher perceived visual beautiful quality for a given street space. On the other hand, visual beautiful quality was negatively correlated with interface closure, meaning that too many closed spatial buildings could increase the number of wall areas, which obstruct the line of sight and reduce sunlight exposure and air quality, leading to a lower visual aesthetic quality of the street space and reducing the public perception of beauty. The pedestrian occurrence rate and vehicle occurrence rate were not significantly correlated with visual aesthetic quality, showing significance levels that were greater than 0.05. These findings provide insights into the relationship between the physical features of buildings and the visual beautiful quality of built environments, which can inform decision-making in urban planning and design.

5. Discussion

5.1. VBQ

In the research and study area, the study confirmed that plants had had a significant impact on space quality. The trees in the area blocked out noise and provided a quiet learning environment. Other research based on perception suggests that plants are important factors affecting space quality. In the study, space quality increased with increases in the area covered by vegetation [10,75]. In the student living area, the road was the main landscape element, and had a significant impact on space quality. The cleanliness, quality, and scale of a road could effectively improve space quality in an area, and so, in road design, managers should pay attention to the maintenance of road paving. Studies have shown that a clean environment plays a vital role in improving human physical and mental health. In the sports areas in the study, pedestrians and vehicles were the main elements that influenced space quality. It was found that the disorganized arrangement of vehicles increased enclosure in the campus space, having a negative effect on visual quality. In the surrounding area, openness was the primary landscape element that had had a significant impact on space quality. The openness here reflected the perceived light intensity and perceived openness in the street, which in turn affected human visual perception. However, overpasses and power lines had played a negative impact on space quality in some samples of the surrounding areas. In the teacher living area, the study confirmed that the buildings had had a significant impact on space quality. The buildings were old, and the walls had formed enclosed spaces, resulting in low sky visibility, which affected the spatial visual experience.

5.2. The Relationship between Perceptual and Physical Features

This study analyzed the correlation between the perception features of visual beautiful quality and the physical features of street spaces using Liaoning University as a case study. The results showed that the physical features of streets had had a significant impact on the perception features of the visual beautiful quality of the street spaces.
The correlation between the perception features of visual beautiful quality and the five measured physical features reveals that green vision rate has a significant impact on visual aesthetic quality perception. This finding is consistent with previous studies by Dicle et al. [76,77,78]. The positive contributors to “visual beautiful quality” come from natural elements—a result that fits Olmsted’s philosophy of embedding ecosystems into urban infrastructure [79]. Dicle et al. (2003) noted that green areas strongly influence the perceptual evaluation of outdoor spaces [3,80,81]. Greenery is also considered a very important element in landscape design as it benefits the environment, aesthetics, recreation, and economy in urban communities [82], and as people tend to be more sensitive to “trees”, “grasses”, and “plants”. In addition, urban greening can make people feel happy and notice visually aesthetic qualities, having a positive impact on people’s moods and psychology [83,84,85,86].
Enclosure has a significant negative correlation with visual beautiful quality. The degree of this correlation is closely related to the density of surrounding buildings and trees, as confirmed by previous studies conducted by Ma et al. and Harvey [87,88]. The denser the buildings and trees in an area are, the higher the degree of closure of street space becomes, which in turn limits visual access and can negatively impact the aesthetic experience. Tall and complex buildings are more likely to produce a sense of closure, resulting in a relatively poor aesthetic experience for pedestrians.

5.3. Optimization Strategy

On the Chongshan campus of Liaoning University, in the teacher living area and the student living area, the buildings are dense and the streets are narrow, resulting in the depressing atmosphere of the streets; moreover, the buildings in the teachers’ living area are dilapidated. The streets are thinly greened, with large spacing between the trees on both sides, and sparse foliage, which make the area less attractive to the public. The visual beautiful quality of open spaces can be improved by creating visual extensions. The openness of interfaces contributes to the perception of the visual aesthetic qualities of open spaces, according to Tveit [89,90], and also improves public pleasure [91]. For instance, demolishing some old houses and widening streets can increase a region’s openness [83]. The timely repairing and renovating of the facades of old buildings can enhance the aesthetic beauty of old residential areas. In the university campus’ surrounding areas and sports areas, the green rate is low, a small number of street trees have been planted on both sides of the roads, and the plant species are singular. Greenery is the most effective factor in improving the quality of a street environment, and a larger green space is associated with better landscape aesthetics [64,92,93]. Increasing the proportion of greenery in campus planning, and emphasizing the structure and quality of greenery configuration, can improve the aesthetic pleasure of teachers and students. Planting lawns, shrubs, and other plants to increase plant diversity can enhance the natural feel and viewing experience of the campus’ streets, promoting the physical and mental health of the public [94]. For example, planting trees, flower beds, and other natural elements on both sides of the street can have a positive impact on people’s emotional states [95,96]. The large number of vehicles on the roads in the campus’ scientific research and teaching areas affects the orderliness of those street spaces, having a negative impact on the street spaces’ beauty. The reasonable planning of parking spaces in open spaces and the planting of rows of trees on both sides of the streets can improve the visual beautiful quality for the public.

5.4. Limitations

The limitations of the study are also worth discussing.
First of all, this study only quantified the perceptual features of visual beauty quality. Future research could consider and add other spatial perceptual features to comprehensively analyze spatial quality. Moreover, in the present study, street view images could only represent the visual elements of spatial perception. It is necessary to further analyze the operant influence mechanism by infusing it with physical features such as the landscape with identifiers, cultural features, cleanliness, and spatial attractiveness in the included university spaces.
Secondly, the latest technology was not applied in this study. Future research can use EEGs, eye movement tracking, and other techniques to measure physiological indicators and obtain the visual physiological indices of the public. By taking the physiological response of the public as the intermediate variable, future studies can analyze the relationship between the physiological perceptions of the public and space quality. Further, we can investigate the conduction mechanism.
Thirdly, street view image and semantic segmentation technology are effective to make accurate predictions for static landscape elements, but cannot fully represent instantaneously moving elements in the environment such as motor vehicles and pedestrians. In future studies, our data could be combined with on-site time-based research to improve the accuracy of research.

6. Conclusions

In this study, deep learning and street view imagery were used to quantify the physical features in the spaces of the Chongshan campus of Liaoning University and make spatial predictions of visual beautiful quality. The study showed that the physical features had significantly impacted the VBQ of human perception in the Chongshan campus space. The study indicated that physical features can objectively reflect the overall street space quality of Liaoning University.
In the five studied areas, the teacher living area had the highest VBQ. The study found that enclosure was the most important physical feature negatively affecting VBQ. On the other hand, greenness and openness had positively affected VBQ in the Chongshan Campus of Liaoning University. Greenness and enclosure were mainly concentrated in student living areas, while high openness was distributed primarily in the surrounding areas.
This study measured visual beauty quality in the campus’ spaces. It revealed the relationship between human perception and physical features. The study is helpful not only for finding the areas that need to optimize VBQ, but also for analyzing the reasons for low VBQ in a given area by analyzing physical features. The study can help to provide strategies and schemes for space quality improvement. Additionally, this paper has provided theoretical and technical information for improving campus street spaces and coordinating them with surrounding areas.

Author Contributions

Conceptualization, Y.M., Q.L., H.F. and X.J.; methodology, Y.M., Q.L. and X.J.; software, Y.M., Q.L. and D.Y.; validation, Y.M., H.F. and Q.L.; formal analysis, Y.M., H.F. and Q.L.; investigation, Y.M., Q.L., X.J., Y.Y., D.Y., M.G. and J.N.; resources, Y.M., D.Y., Y.Y. and S.W.; data curation, Y.M. and Q.L.; writing—original draft preparation, Y.M., Q.L. and X.J.; writing—review and editing, Y.M., Q.L., Y.Y. and D.Y.; visualization, Q.L., S.W., M.G. and J.N.; supervision, Y.M., H.F. and X.J.; project administration, Y.M., H.F. and X.J.; funding acquisition, Y.M. All authors have read and agreed to the published version of the manuscript.

Funding

This research was funded by the Project of Liaoning Provincial Department of Education’s grant Project No. lnqn202027.

Data Availability Statement

Interview transcripts and interpreted statements supporting this study’s findings and the smart contract codes are available from the corresponding author upon reasonable request.

Acknowledgments

We would like to thank the journal experts who edited this paper. We also appreciate the constructive suggestions and comments on the manuscript from the reviewers and editors.

Conflicts of Interest

The authors declare no conflict of interest.

References

  1. Deng, Q.M. Research on the Relevance of Intensive Colleges and Universities Campus Space Form and Space Quality. Ph.D. Thesis, South China University of Technology, Guangzhou, China, 2015. [Google Scholar]
  2. Chen, S. Research on Quality Improvement Design of the Campus in Cold Regions Based on the Swarm Intelligence. Ph.D. Thesis, Harbin Institute of Technology, Harbin, China, 2020. [Google Scholar]
  3. Eldarwish, I. Enhancing outdoor campus design by utilizing space syntax theory for social interaction locations. Ain Shams Eng. J. 2021, 13, 101524. [Google Scholar] [CrossRef]
  4. Abu-Ghazzeh, T. Communicating Behavioral Research to Campus Design. Environ. Behav. 1990, 31, 764–804. [Google Scholar] [CrossRef]
  5. Hillier, B. Space Is the Machine: A Configurational Theory of Architecture; Cambridge University Press: London, UK, 2007. [Google Scholar]
  6. Achyat, K. Campus Design in India: Experience of a Developing Nation; United States Agency for International Development: Manila, Philippines, 1969.
  7. Huang, Y. Post-Occupancy Evaluation and Design Elements Research of Campus Planning in Guangzhou Region of China. Ph.D. Thesis, South China University of Technology, Guangzhou, China, 2014. [Google Scholar]
  8. Tang, L.; Ding, W.W. Linking the Signs on Street Façades to the Characteristics of Street Space. Archit. J. 2015, 2, 18–22. [Google Scholar]
  9. Whyte, W. City: Rediscovering the Center, 1st ed.; University of Pennsylvania Press: New York, NY, USA, 1990. [Google Scholar]
  10. Lee, J.; Kim, D.; Park, J. A machine learning and computer vision study of the environmental characteristics of streetscapes that affect pedestrian satisfaction. Sustainability 2022, 14, 5730. [Google Scholar] [CrossRef]
  11. Wang, J.; Wei, L.; Gou, A. Numerical characteristics and spatial distribution of panoramic Street Green View index based on SegNet semantic segmentation in Savannah. Urban For. Urban Green. 2022, 69, 127488. [Google Scholar] [CrossRef]
  12. Aspinall, P.A.; Thompson, C.W.; Alves, S.; Sugiyama, T.; Brice, R.; Vickers, A. Preference and Relative Importance for Environmental Attributes of Neighbourhood Open Space in Older People. Environ. Plan. B Urban Anal. City Sci. 2010, 37, 1022–1039. [Google Scholar] [CrossRef]
  13. Jiang, H.B.; Song, M.K.; Xiao, Y. Research on Visual Landscape Comfort Evaluation of Waterfront Space: A Case Study of Huangpu River and Suzhou Creek in Shanghai. Landsc. Archit. 2022, 29, 122–129. [Google Scholar]
  14. Qiu, W.S.; Li, W.J.; Liu, X.; Huang, X.K. Subjectively Measured Streetscape Perceptions to Inform Urban Design Strategies for Shanghai. ISPRS Int. J. Geo-Inf. 2021, 10, 493. [Google Scholar] [CrossRef]
  15. Li, X.; Zhang, C.; Li, W.; Ricard, R.; Meng, Q.; Zhang, W. Assessing street-level urban greenery using Google Street View and a modified green view index. Urban For. Urban Green. 2015, 14, 675–685. [Google Scholar] [CrossRef]
  16. Cheng, L.; Chu, S.S.; Zong, W.W.; Li, S.Y.; Wu, J.; Li, M.C. Use of Tencent Street View Imagery for Visual Perception of Streets. ISPRS Int. J. Geo-Inf. 2017, 6, 265. [Google Scholar] [CrossRef]
  17. Yin, L. Street level urban design qualities for walkability: Combining 2D and 3D GIS measures. Computers. Environ. Urban Syst. 2017, 64, 288–296. [Google Scholar] [CrossRef]
  18. Ye, Y.; Zeng, W.; Shen, Q.M.; Zhang, X.H. The visual quality of streets: A human-centred continuous measurement based on machine learning algorithms and street view images. Environ. Plan. B Urban Anal. City Sci. 2019, 46, 1439–1457. [Google Scholar] [CrossRef]
  19. Xu, X.; Qiu, W.S.; Li, W.J.; Liu, X.; Zhang, Z.Y.; Li, X.J.; Luo, D. Associations between Street-View Perceptions and Housing Prices: Subjective vs. Objective Measures Using Computer Vision and Machine Learning Techniques. Remote Sens. 2022, 14, 891. [Google Scholar] [CrossRef]
  20. Nasar, J.L. Adult viewers’ Preferences in Residential Scenes A Study of the Relationship of Environment Attributes to Preference. Environ. Behav. 1983, 15, 589–614. [Google Scholar] [CrossRef]
  21. Hamidi, S.; Moazzeni, S. Examining the Relationship between Urban Design Qualities and Walking Behavior: Empirical Evidence from Dallas, TX. Sustainability 2019, 11, 2720. [Google Scholar] [CrossRef]
  22. Herrmann-Lunecke, M.G.; Mora, R.; Vejares, P. Perception of the built environment and walking in pericentral neighbourhoods in santiago, chile. Travel. Behav. Soc. 2021, 23, 192–206. [Google Scholar] [CrossRef]
  23. Qi, J.D.; Lin, E.S.W.; Tan, P.Y.; ManHo, R.C.; Sia, A.; Olszewska-Guizzo, A.; Zhang, X.D.; Waykool, W. Development and application of 3D spatial metrics using point clouds for landscape visual quality assessment. Landsc. Urban Plan. 2022, 228, 104585. [Google Scholar] [CrossRef]
  24. Zhou, H.; He, S.J.; Cai, Y.Y.; Wang, M.; Su, S.L. Social inequalities in neighborhood visual walkability: Using Street View imagery and deep learning technologies to facilitate healthy city planning. Sustain. Cities Soc. 2019, 50, 101605. [Google Scholar] [CrossRef]
  25. Zhao, Y.; Liu, J.H.; Zheng, Y.L. Preservation and renewal: A study on visual evaluation of urban historical and cultural street landscape in quanzhou. Sustainability 2022, 14, 8775. [Google Scholar] [CrossRef]
  26. Theil, P. A sequence-experience notation for architectural and urban spaces. Town Plan. Rev. 1961, 32, 33–52. [Google Scholar] [CrossRef]
  27. Banerjee, T.; Southworth, M. City sense and city design writings and projects of Kevin Lynch. Landsc. J. 1996, 15, 167–168. [Google Scholar]
  28. Lynch, K. The Image of the City; The MIT Press: Cambridge, MA, USA, 1960. [Google Scholar]
  29. Miao, C.C. Study on The Quality Measurement And Influence Mechanism Of Urban Street Based On Street View Data—Take The Central City Of Nanjing As An Example. Master’s Thesis, Southeast University, Nanjing, China, 2018. [Google Scholar]
  30. Zhang, J.; Hu, A. Analyzing green view index and green view index best path using Google street view and deep learning. J. Comput. Des. Eng. 2022, 9, 2010–2023. [Google Scholar] [CrossRef]
  31. Hao, X.H.; Long, Y. Street Greenery: A New Indicator for Evaluating Walkability. Shanghai Urban Plan. Rev. 2017, 1, 32–36, 49. [Google Scholar]
  32. Ye, Y.; Zhang, Z.X.; Zhang, X.H.; Zeng, W. A Large-scale and Efficient Analytical Approach Based on Street View Images and New Urban Analytical Tools. Urban Plan. Int. 2019, 34, 1673–9493. [Google Scholar]
  33. Kelly, C.M.; Wilson, J.S.; Baker, E.A.; Miller, D.K.; Schootman, M. Using Google Street View to audit the built environment: Inter-rater reliability results. Ann. Behav. Med. 2012, 45, S108–S112. [Google Scholar] [CrossRef] [PubMed]
  34. Aikoh, T.; Homma, R.; Abe, Y. Comparing conventional manual measurement of the green view index with modern automatic methods using google street view and semantic segmentation. Urban For. Urban Green. 2023, 80, 127845. [Google Scholar] [CrossRef]
  35. Tao, Y.; Wang, Y.; Wang, X.; Tian, G.; Zhang, S. Measuring the correlation between human activity density and streetscape perceptions: An analysis based on baidu street view images in Zhengzhou, China. Land 2022, 11, 400. [Google Scholar] [CrossRef]
  36. Rundle, A.G.; Bader, M.D.M.; Richards, C.A.; Neckerman, K.M.; Teitler, J.O. Using Google Street View to Audit Neighborhood Environments. Am. J. Prev. Med. 2011, 40, 94–100. [Google Scholar] [CrossRef] [PubMed]
  37. Zheng, Y. Research on Formation Pattern of Urban Image Based on Streetview Data: From the Perspective of Subjective Perception and Objective Environment Deviation. Ph.D. Thesis, Southeast University, Nanjing, China, 2021. [Google Scholar]
  38. Torii, A.; Havlena, M. From google street view to 3d city models. In Proceedings of the IEEE International Conference on Computer Vision, Kyoto, Japan, 29 September–2 October 2009. [Google Scholar]
  39. Anguelov, D.; Dulong, C.; Filip, D.; Frueh, C.; Lafon, S.; Lyon, R.; Ogale, A.; Vincent, L.; Weaver, J. Google street view: Capturing the world at street level. Computer 2010, 43, 32–38. [Google Scholar] [CrossRef]
  40. Verstockt, S.; Gerke, M.; Kerle, N. Geolocalization of Crowdsourced Images for 3-D Modeling of City Points of Interest. IEEE Geosci. Remote Sens. Lett. 2015, 12, 1670–1674. [Google Scholar] [CrossRef]
  41. Hara, K.; Azenkot, S.; Campbell, M.; Bennett, C.L.; Le, V.; Pannella, S.; Moore, R.; Minckler, K.; Ng, R.H.; Froehlich, J.E. Improving Public Transit Accessibility for Blind Riders by Crowdsourcing Bus Stop Landmark Locations with Google Street View. In Proceedings of the 15th International ACM SIGACCESS Conference on Computers and Accessibility, Washington, DC, USA, 21–23 October 2013. [Google Scholar]
  42. Olea, P.P.; Mateo-Tomás, P. Assessing species habitat using Google Street View: A case study of cliff-nesting vultures. PLoS ONE 2013, 8, e54582. [Google Scholar] [CrossRef] [PubMed]
  43. Rousselet, J.; Imbert, C.; Dekri, A.; Garcia, J.; Goussard, F.; Vincent, B.; Denux, O.; Robinet, C.; Dorkeld, F.; Roques, A.; et al. Assessing species distribution using Google Street View: A pilot study with the pine processionary moth. PLoS ONE 2013, 8, e74918. [Google Scholar] [CrossRef] [PubMed]
  44. Berland, A.; Lange, D.A. Lange Google Street View shows promise for virtual street tree surveys. Urban For. Urban Green. 2017, 21, 11–15. [Google Scholar] [CrossRef]
  45. Vanwolleghem, G.; Dyck, D.V.; Ducheyne, F.; Bourdeaudhuij, I.D.; Cardon, G. Assessing the environmental characteristics of cycling routes to school: A study on the reliability and validity of a Google Street View-based audit. Int. J. Health Geogr. 2014, 13, 19. [Google Scholar] [CrossRef] [PubMed]
  46. Li, X.; Zhang, C.; Li, W. Does the visibility of greenery increase perceived safety in urban areas? Evidence from the place pulse 1.0 dataset. ISPRS Int. J. Geo-Inf. 2015, 4, 1166–1183. [Google Scholar] [CrossRef]
  47. Oh, K. Visual threshold carrying capacity (VTCC) in urban landscape management: A case study of Seoul, Korea. Landsc. Urban Plan. 1998, 39, 283–294. [Google Scholar] [CrossRef]
  48. Nakamura, K. Experimental analysis of walkability evaluation using virtual reality application. Urban Anal. City Sci. 2021, 48, 2481–2496. [Google Scholar] [CrossRef]
  49. Zhang, F.; Zhou, B.; Liu, L.; Liua, Y.; Fung, H.H.; Lin, H.; Ratti, C. Measuring human perceptions of a large-scale urban region using machine learning. Landsc. Urban Plan. 2019, 180, 148–160. [Google Scholar] [CrossRef]
  50. He, Y.Y. Overview of image semantic segmentation based on deep learning. Chang. Inf. Commun. 2023, 36, 77–79. [Google Scholar]
  51. Deng, Z.; Chen, Y.; Pan, X.; Peng, Z.; Yang, J. Integrating GIS-based point of interest and community boundary datasets for urban building energy modeling. Energies 2021, 14, 1049. [Google Scholar] [CrossRef]
  52. Liu, M.; Jiang, Y.; He, J. Quantitative Evaluation on Street Vitality: A Case Study of Zhoujiadu Community in Shanghai. Sustainability 2021, 13, 3027. [Google Scholar] [CrossRef]
  53. Wu, W.S.; Niu, X.Y.; Li, M. Influence of built environment on street vitality: A case study of West Nanjing Road in Shanghai based on mobile location data. Sustainability 2021, 13, 1840. [Google Scholar] [CrossRef]
  54. Zhang, L.; Ye, Y.; Zeng, W.; Chiaradia, A. A systematic measurement of street quality through multi-sourced urban data: A human-oriented analysis. Int. J. Environ. Res. Public Health 2019, 16, 1782. [Google Scholar] [CrossRef] [PubMed]
  55. Zhang, L.M.; Zhang, R.X.; Yin, B. The impact of the built-up environment of streets on pedestrian activities in the historical area. Alex. Eng. J. 2020, 60, 285–300. [Google Scholar] [CrossRef]
  56. Wan, C.W.; Wang, R.H.; Sun, X.K. Evaluation of street safety perception in old city of Xuzhou based on streetscape images and semantic segmentation technology. Agric. Technol. 2022, 42, 125–130. [Google Scholar]
  57. Naik, N.; Philipoom, J.; Raskar, R.; Hidalgo, C. Streetscore—Predicting the perceived safety of one million streetscapes. In Proceedings of the 2014 IEEE Conference on Computer Vision and Pattern Recognition Workshops, Columbus, OH, USA, 11–15 June 2014. [Google Scholar]
  58. Middel, A.; Lukasczyk, J.; Zakrzewski, S.; Arnold, M.; Maciejewski, R. Urban form and composition of street canyons: A human-centric big data and deep learning approach. Landsc. Urban Plan. 2019, 183, 122–132. [Google Scholar] [CrossRef]
  59. Abhimanyu, D.; Nikhil, N.; Devi, P.; Ramesh, R.; Hidalgo, C.A. Deep Learning the City: Quantifying Urban Perception at a Global Scale. In Proceedings of the European Conference on Computer Vision, Amsterdam, The Netherlands, 11–14 October 2016; Volume 17, pp. 196–212. [Google Scholar]
  60. Larkin, A.; Gu, X.; Chen, L.Z.; Hystad, P. Predicting perceptions of the built environment using GIS, satellite and street view image approaches. Landsc. Urban Plan. 2021, 216, 104257. [Google Scholar] [CrossRef]
  61. Harvey, C.; Aultman-Hall, L.; Hurley, S.E.; Troy, A. Effects of skeletal streetscape design on perceived safety. Landsc. Urban Plan. 2015, 142, 18–28. [Google Scholar] [CrossRef]
  62. Naik, N.; Kominers, S.D.; Raskar, R.; Glaeser, E.L.; Hidalgo, C.A. Do People Shape Cities, or Do Cities Shape People? The Co-Evolution of Physical, Social, and Economic Change in Five Major U.S. Cities; National Bureau of Economic Research: Cambridge, MA, USA, 2015; p. 21620. [Google Scholar]
  63. Philip, S.; Philip, S.; Cesar, H. The Collaborative Image of The City: Mapping the Inequality of Urban Perception. PLoS ONE 2013, 8, e68400. [Google Scholar]
  64. Tveit, M.S. Indicators of visual scale as predictors of landscape preference; a comparison between groups. J. Environ. Manag. B 2009, 90, 2882–2888. [Google Scholar] [CrossRef]
  65. Sun, D.; Ji, X.; Gao, W.J.; Zhou, F.J.; Yu, Y.Q.; Meng, Y.M.; Yang, M.Q.; Lin, J.J.; Lyu, M. The Relation between Green Visual Index and Visual Comfort in Qingdao Coastal Streets. Buildings 2023, 13, 457. [Google Scholar] [CrossRef]
  66. Zhang, X.; Han, H.Y.; Qiao, L.; Zhuang, J.W.; Ren, Z.M.; Su, Y.; Xia, Y.Q. Emotional-Health-Oriented Urban Design: A Novel Collaborative Deep Learning Framework for Real-Time Landscape Assessment by Integrating Facial Expression Recognition and Pixel-Level Semantic Segmentation. Int. J. Environ. Res. Public Health 2022, 19, 13308. [Google Scholar] [CrossRef] [PubMed]
  67. Wang, L.; Han, X.; He, J.; Jun, T. Measuring residents’ perceptions of city streets to inform better street planning through deep learning and space syntax. ISPRS J. Photogramm. Remote Sens. 2022, 190, 215–230. [Google Scholar] [CrossRef]
  68. Long, J.; Shelhamer, E.; Darrell, T. Fully convolutional networks for semantic segmentation. In Proceedings of the IEEE Conference on Computer Visionand Pattern Recognition, Boston, MA, USA, 7–12 June 2015. [Google Scholar]
  69. Ronneberger, O.; Fischer, P.; Brox, T. U-net: Convolutional networks for biomedical image segmentation. In Proceedings of the International Conference on Medical image Computing and Computer-Assisted Intervention, Munich, Germany, 5–9 October 2015. [Google Scholar]
  70. Li, P.A. Study on Semantic Segmentation of Traffic Scene Images Based on Deep Neural Networks. Master’s Thesis, Beijing Jiaotong University, Beijing, China, 2020. [Google Scholar]
  71. Wu, C.; Peng, N.; Ma, X.; Li, S.; Rao, J. Assessing multiscale visual appearance characteristics of neighbourhoods using geographically weighted principal component analysis in Shenzhen, China. Comput. Environ. Urban Syst. 2020, 84, 101547. [Google Scholar] [CrossRef]
  72. Chen, Y.X.; Zhang, Q.L.; Deng, Z.; Fan, X.R.; Xu, Z.M.; Kang, X.D.; Pan, K.L.; Guo, Z.H. Research on Green View Index of Urban Roads Based on Street View Image Recognition: A Case Study of Changsha Downtown Areas. Sustainability 2022, 14, 16063. [Google Scholar] [CrossRef]
  73. Wang, R.; Lu, Y.; Zhang, J.; Liu, P.; Yao, Y.; Liu, Y. The relationship between visual enclosure for neighbourhood street walkability and elders’ mental health in China: Using street view images. J. Transp. Health 2019, 13, 90–102. [Google Scholar] [CrossRef]
  74. Chen, L.C.; Zhu, Y.; Papandreou, G.; Schroff, F.; Adam, H. Encoder-Decoder with atrous separable convolution for semantic image segmentation. In Computer Vision—ECCV 2018; Ferrari, V., Hebert, M., Sminchisescu, C., Weiss, Y., Eds.; Springer: New York, NY, USA, 2018; pp. 833–851. [Google Scholar]
  75. Yin, Y.T.; Thwaites, K.; Shao, Y.H. Balancing Street Functionality and Restorative Benefit: Developing an Expectation–Current Approach to Street Design. Sustainability 2022, 14, 5736. [Google Scholar] [CrossRef]
  76. Bedimo-Rung, A.L.; Mowen, A.J.; Cohen, D.A. The significance of parks to physical activity and public health: A conceptual model. Am. J. Prev. Med. 2005, 28, 159–168. [Google Scholar] [CrossRef]
  77. Gascon, M.; Cirach, M.; Martínez, D.; Dadvand, P.; Valentín, A.; Plasència, A.; Nieuwenhuijsen, M.J. Normalized difference vegetation index (NDVI) as a marker of surrounding greenness in epidemiological studies: The case of Barcelona city. Urban For. Urban Green. 2016, 19, 88–94. [Google Scholar] [CrossRef]
  78. Markevych, I.; Schoierer, J.; Hartig, T.; Chudnovsky, A.; Hystad, P.; Dzhambov, A.M.; Lupp, G. Exploring pathways linking greenspace to health: Theoretical and methodological guidance. Environ. Res. 2017, 158, 301–317. [Google Scholar] [CrossRef]
  79. McHarg, I.L. Design with Nuture; Wiley: Hoboken, NJ, USA, 1969. [Google Scholar]
  80. Rapoport, A. Culture, Space and Design; Locke Science Publishing: Chicago, IL, USA, 2005. [Google Scholar]
  81. Mustafa, F.A.; Danoon, M. Effect of Common Outdoor Spaces on Social Interaction. JUBES 2020, 28, 229–238. [Google Scholar]
  82. Li, F.; Wang, R.S.; Paulussen, J.; Liu, X.S. Comprehensive concept planning of urban greening based on ecological principles: A case study in Beijing, China. Landsc. Urban Plan 2005, 72, 325–336. [Google Scholar] [CrossRef]
  83. Dai, L.Y.; Zheng, C.L.; Dong, Z.K.; Yao, Y.; Wang, R.F.; Zhang, C.T.; Ren, S.L.; Zhan, J.Q.; Song, C.Q.; Guan, Q.F. Analyzing the correlation between visual space and residents’ psychology in Wuhan, China using street-view images and deep-learning technique. City Environ. Interact. 2021, 11, 100069. [Google Scholar] [CrossRef]
  84. Peter, A.; Panagiotis, M.; Richard, C.; Jenny, R. The urban brain: Analysing outdoor physical activity with mobile EEG. Br. J. Sport. Med. 2015, 49, 272–276. [Google Scholar]
  85. Wang, R.Y.; Helbich, M.; Yao, Y.; Zhang, J.B.; Liu, P.H.; Yuan, Y.; Liu, Y. Urban greenery and mental wellbeing in adults: Cross-sectional mediation analyses on multiple pathways across different greenery measures. Environ. Res. 2019, 176, 10535. [Google Scholar] [CrossRef] [PubMed]
  86. Herzele, A.V.; Vries, S.D. Linking green space to health: A comparative study of two urban neighbourhoods in Ghent, Belgium. Popul. Environ. 2012, 34, 171–193. [Google Scholar] [CrossRef]
  87. Ma, X.Y.; Ma, C.Y.; Wu, C.; Xi, Y.L.; Yang, R.F.; Peng, N.Y.Z.; Zhang, C.; Ren, F. Measuring human perceptions of streetscapes to better inform urban renewal: A perspective of scene semantic parsing. Cities 2021, 110, 103086. [Google Scholar] [CrossRef]
  88. Harvey, C. Measuring Streetscape Design for Livability Using Spatial Data and Methods. Master’s Thesis, The University of Vermont, Burlington, VT, USA, 2015. [Google Scholar]
  89. Wang, Y.J.; Zlatanova, S.S.; Yan, J.J.; Huang, Z.Q.; Cheng, Y.N. Exploring the relationship between spatial morphology characteristics and scenic beauty preference of landscape open space unit by using point cloud data. Urban Anal. City Sci. 2020, 48, 1840–1858. [Google Scholar] [CrossRef]
  90. Vries, S.D.; Verheij, A.V.; Groenewegen, P.P.; Spreeuwenberg, P.P. Natural environments-healthy environments? An exploratory analysis of the relationship between greenspace and health. Environ. Plan A 2003, 35, 1717–1731. [Google Scholar] [CrossRef]
  91. Ki, D.; Lee, S. Analyzing the effects of Green View Index of neighborhood streets on walking time using Google Street View and deep learning. Landsc. Urban Plan. 2021, 205, 103920. [Google Scholar] [CrossRef]
  92. Almanza, E.; Jerrett, M.; Dunton, G.; Seto, E.; Pentz, M.A. A study of community design, greenness, and physical activity in children using satellite, GPS and accelerometer data. Health Place 2012, 18, 46–54. [Google Scholar] [CrossRef] [PubMed]
  93. Mytton, O.T.; Townsend, N.; Rutter, H.; Foster, C. Green space and physical activity: An observational study using health survey for England data. Health Place 2012, 18, 1034–1041. [Google Scholar] [CrossRef] [PubMed]
  94. Nie, W.; Fan, L.; Wei, Y.N.; Hu, R.; Zhao, C.R.; Zhu, Z.Y. Study on Quantization of Street Space Based on Visual Sense- A Case of the Streets in the First Ring Road of Hefei. Urban. Archit. 2021, 18, 176–180. [Google Scholar]
  95. Lindal, P.J.; Hartig, T. Effects of urban street vegetation on judgments of restoration likelihood. Urban For. Urban Green. 2015, 14, 200–209. [Google Scholar] [CrossRef]
  96. Xu, L.; Meng, R.; Huang, S.; Chen, Z. Healing Oriented Street Design: Experimental Explorations via Virtual Reality. Urban Plan. Int. 2019, 34, 38–45. [Google Scholar] [CrossRef]
Figure 1. Study site and distribution of various types of areas.
Buildings 13 01332 g001
Figure 2. Network structure of the DeeplabV3+ model [74].
Buildings 13 01332 g002
Figure 3. Spatial distribution of VBQ.
Buildings 13 01332 g003
Figure 4. Physical features of various types of streets.
Buildings 13 01332 g004
Figure 5. Spatial distribution of physical features.
Buildings 13 01332 g005
Table 2. Sample distribution of VBQ.
Teacher Living AreaSurrounding AreaResearch and Study AreaStudent Living AreaSports Area
High perceptionF03, I02, L020102, 0104, 0105, 0106, 0107, 0109, 0110, 0111, 0112, 1606, 1612, P05, P07, P14, P15, P16, P18, I250506, 0603, 0604, 0707, 0708, 0709, 1103, 1105, 1303, 1403, 1501, 1502, 1503, I19, I20, I23, L05, L06, L07, L09, L10, L11, M04, N05, N07, N09, N11, N17, N20, Q02, Q03, Q06, Q08, Q10, Q11, Q12, Q14, Q15, Q18B06, B07, D04, D05, F09, G02, G03, G04, G05, 0502, 0503, 0701, 0702, 0703, 0704, 0804, 1001I07, I10, 0705, 0706
Medium perceptionA01, D01, D02, D03, F02, H01, H02, H03, I03, I04, I06, J04, 02010101, 0108,0113, 1607, 1611, P01, P03, P04, P06, P08, P10, P11, P12, P19, P21, P22, P230601, 0602, 1002, 1104, 1201, 1202, 1203, 1302, 1304, 1402, 1404, I18, I21, I22, I24, L04, L08, M06, N06, N08, N10, N12, N13, N15, N18, N23, Q05, Q07, Q09, Q13B04, B05, C03, E04, E05, E06, E10, E12, F05, F06, F07, G01, 0402, 0501, 0802, 0803, 0901I08, I09, I11, I12, I14, I14, I15, I16, 0504
low perceptionA02, A03, B01, B02, B03, E01, E02, E03, F01, I05, J01, J02, J03, K01, K02, K03, K04, L01, M01, M02, N01, N02, N03, N04, 0301, 03020103, 1601, 1602, 1603, 1604, 1605, 1608, 1609, 1610, P02, P09, P13, P17, P20, P24, P25, P26, I011301, 1401, 1504, 1505, I17, L03, L12, M03, M05, N14, N16, N19, N21, N22, O01, O04, O16, O17, O19B08, C01, C03, D06, E07, E08, E09, E11, F04, F05, 0401, 0801, 0902I13, I14, 0505, 1101, 1102
Table 3. Ranking order of the VBQ mean values of various types of areas.
Teacher Living AreaSurrounding AreaResearch and Study AreaStudent Living AreaSports Area
Mean value−0.73440.07020.24950.08700.0730
Standard deviation0.8850 1.0360 0.9165 0.8896 0.9710
Medium−0.78100.33170.32090.1892−0.0163
Table 4. The results of physical features for various types of areas.
Teacher
Living Area
Surrounding AreaResearch and Study AreaStudent
Living Area
Sports AreaOverall
Samples
Standard
Divoation
greenness0.23310.18600.23490.33460.13280.23600.1683
openness0.29170.47190.34840.25700.29540.34480.1272
Vehicle occurrence rate0.53230.28190.43950.55590.47370.44540.1522
Pedestrian occurrence rate0.36460.27840.38300.18530.16510.30580.3342
Enclosure0.00050.00090.00090.00080.00230.00090.0019
Table 5. Correlation analysis of the VBQ and the five physical features.
VBQ
GreennessPearson correlation0.170 **
Sig.0.008
245
OpennessPearson correlation0.230 **
Sig.0
245
Vehicle occurrence ratePearson correlation−0.085
Sig.0.186
245
Pedestrian occurrence ratePearson correlation0.124
Sig.0.053
245
EnclosurePearson correlation−0.256 **
Sig.0
245
** Correlation is significant at the 0.01 level.
Disclaimer/Publisher’s Note: The statements, opinions and data contained in all publications are solely those of the individual author(s) and contributor(s) and not of MDPI and/or the editor(s). MDPI and/or the editor(s) disclaim responsibility for any injury to people or property resulting from any ideas, methods, instructions or products referred to in the content.

