
On the Influence of Unexpected Earthquake Severity and Dampers Placement on Isolated Structures Subjected to Pounding Using the Modified Endurance Time Method

 , , , and
Abstract
:1. Introduction
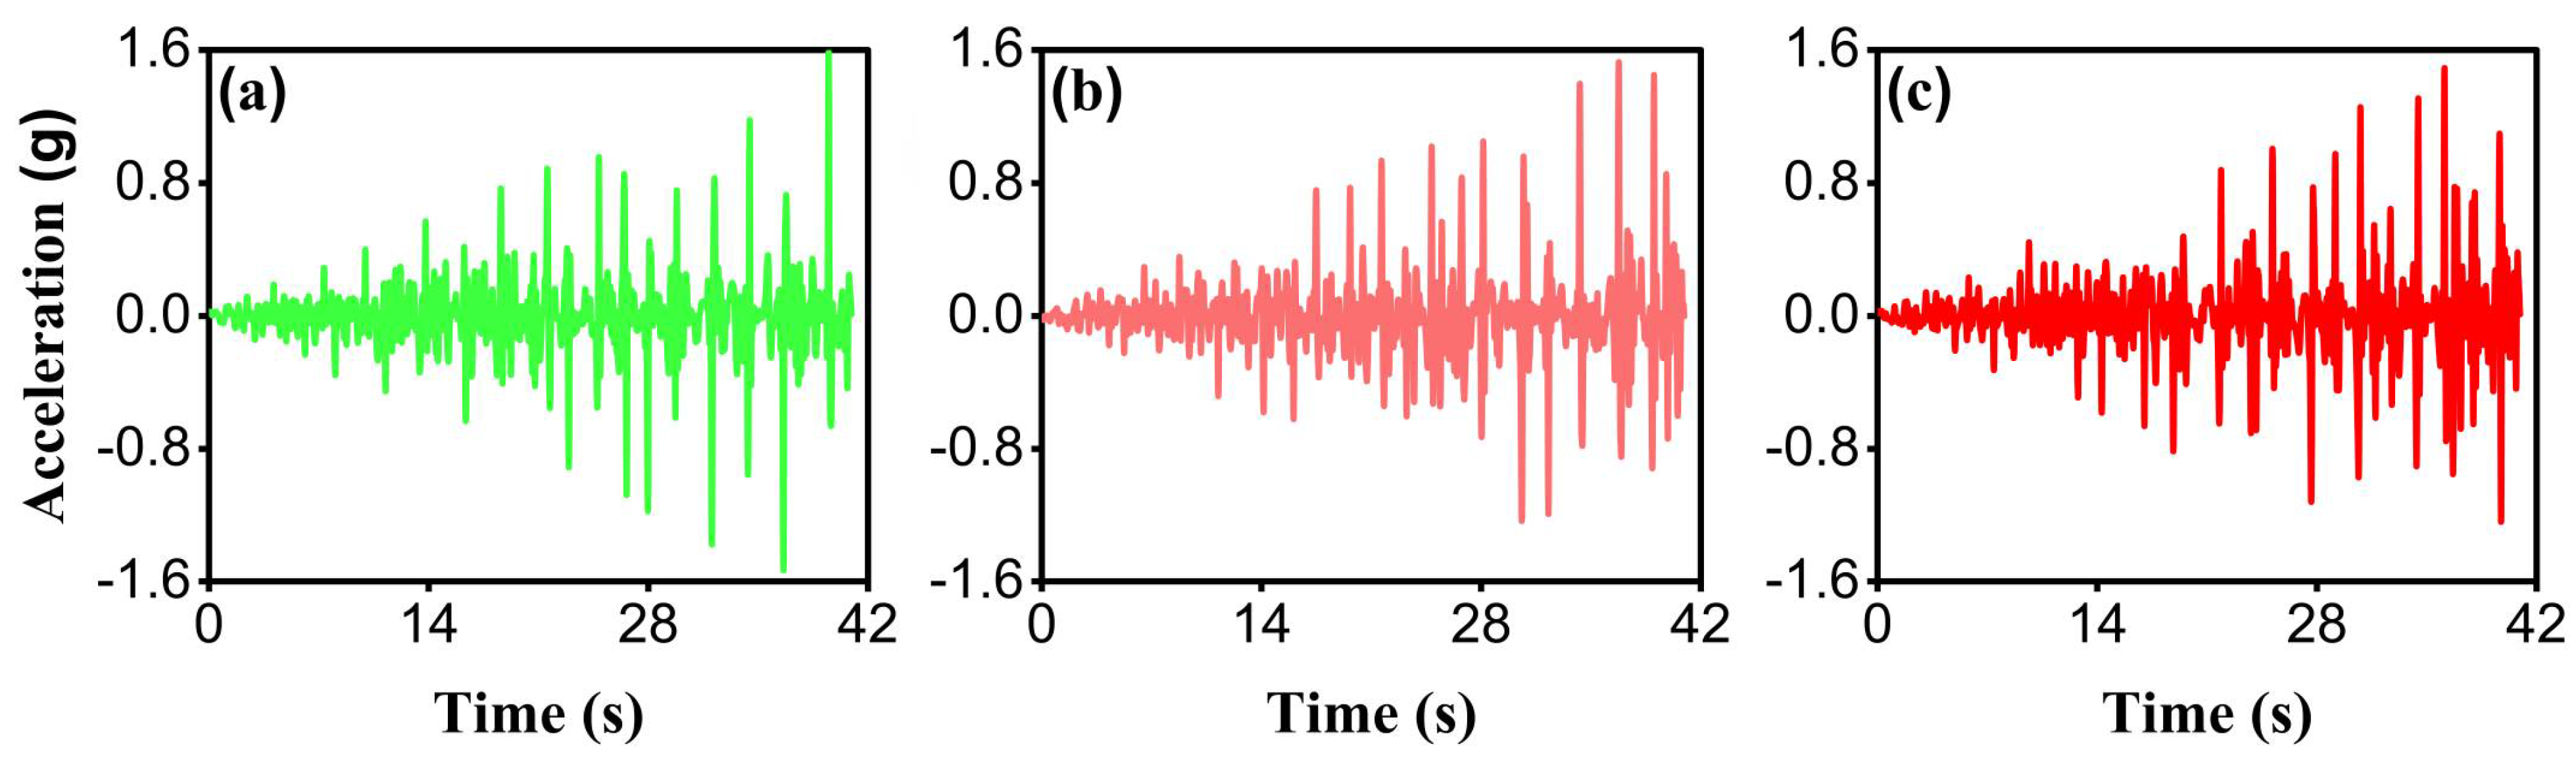
2. Modified Endurance Time Method
3. Numerical Models
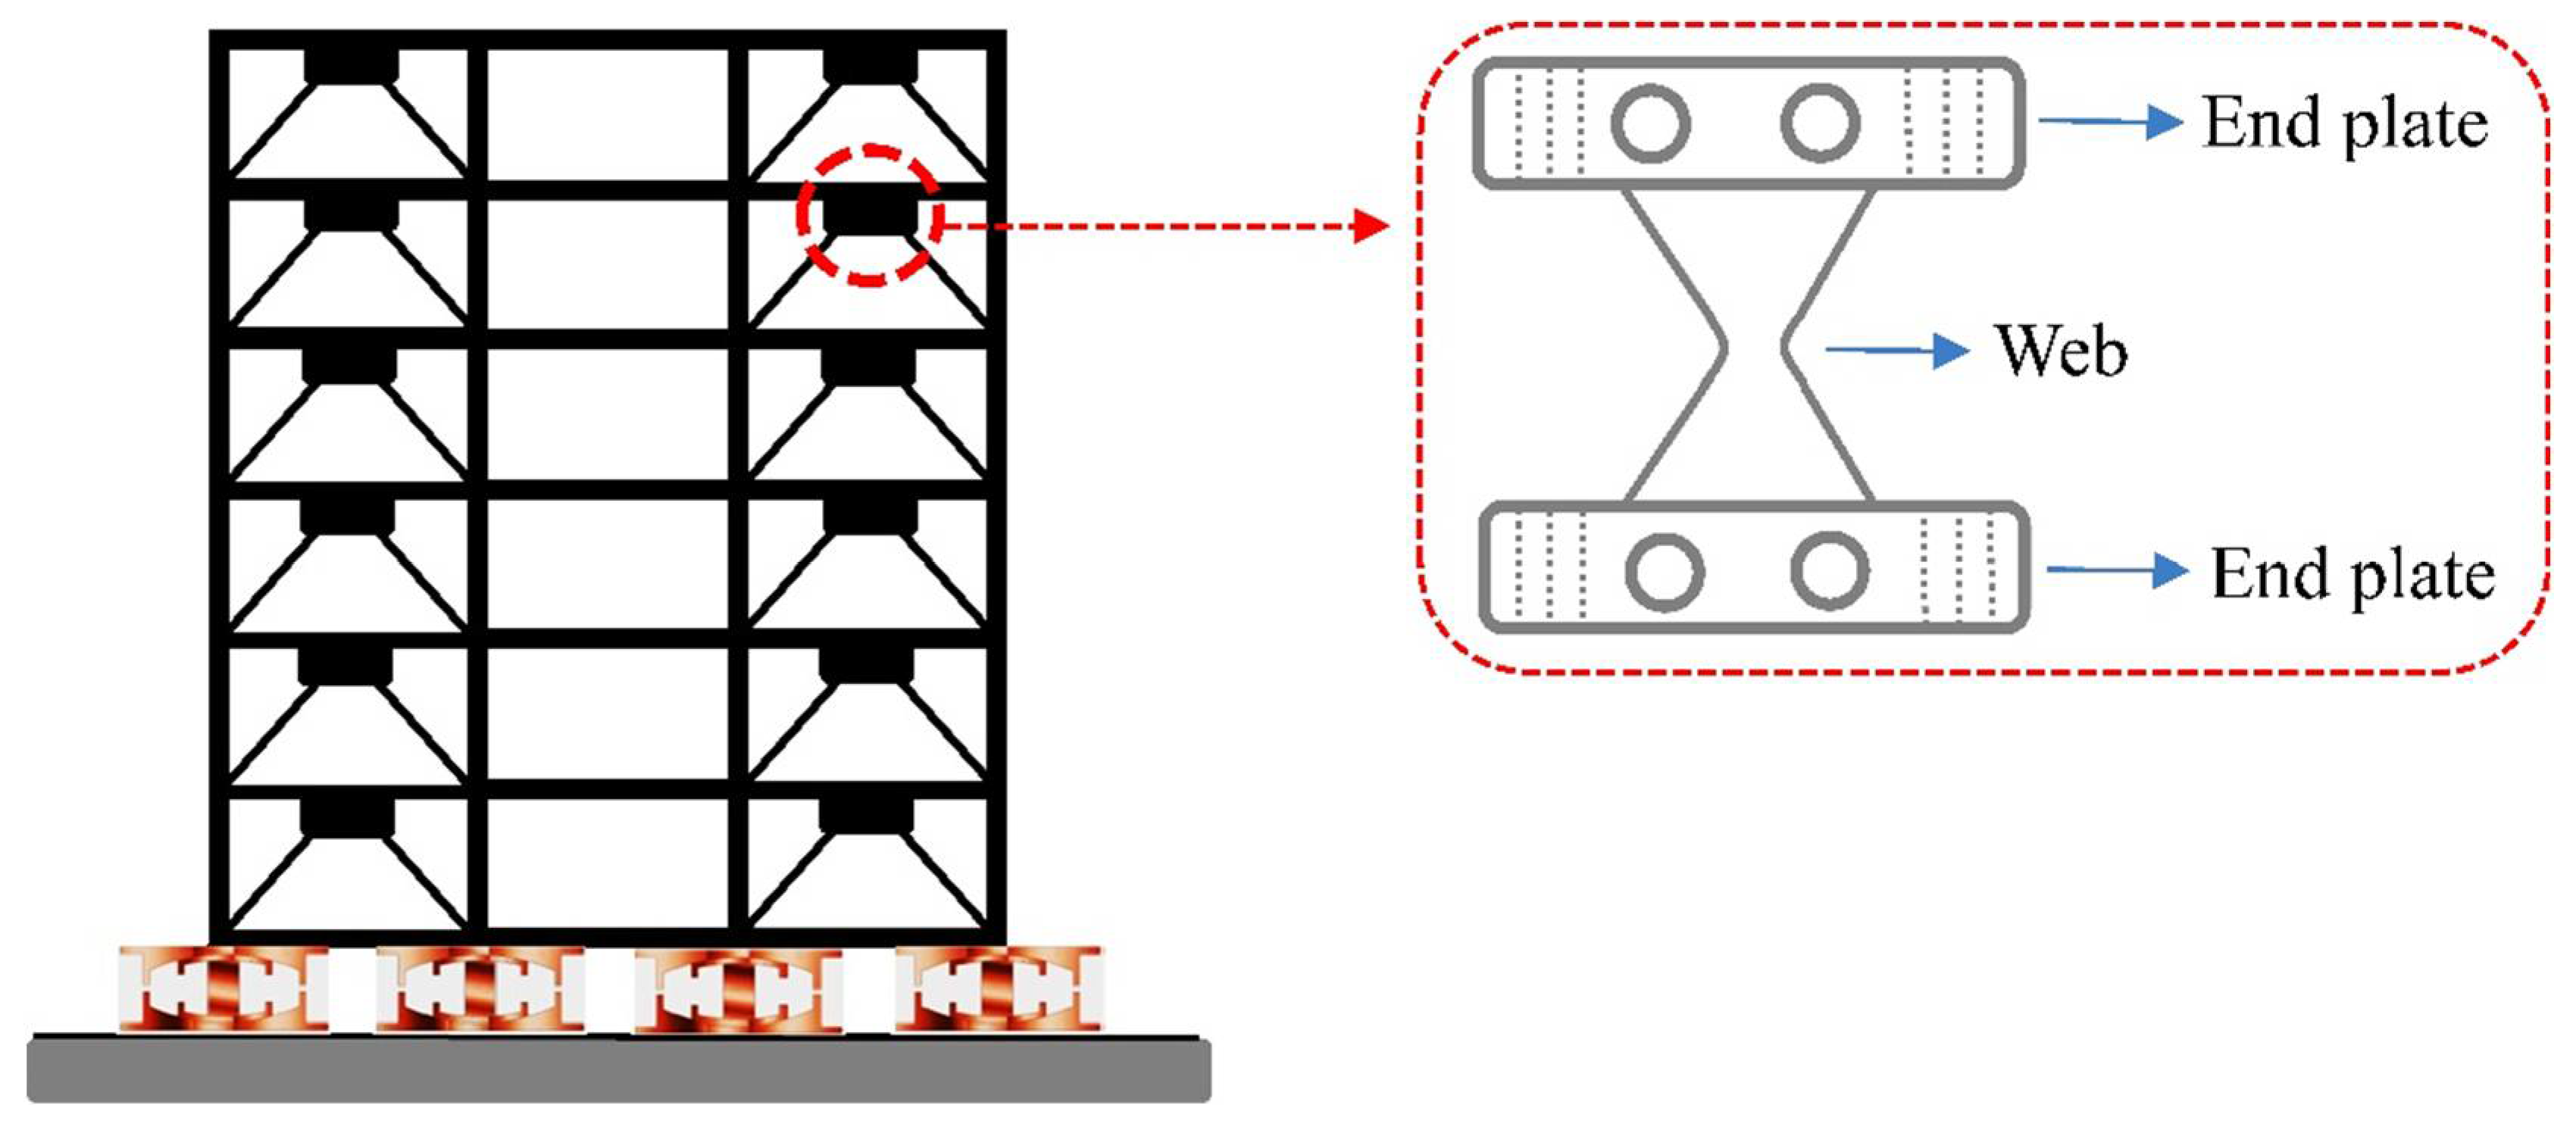
4. Design and Modeling of Passive Control Systems
4.1. TFPI
4.2. Adding Damping and Stiffness Device (ADAS)
4.3. Fluid Viscous Damper (FVD)
5. Results and Discussions
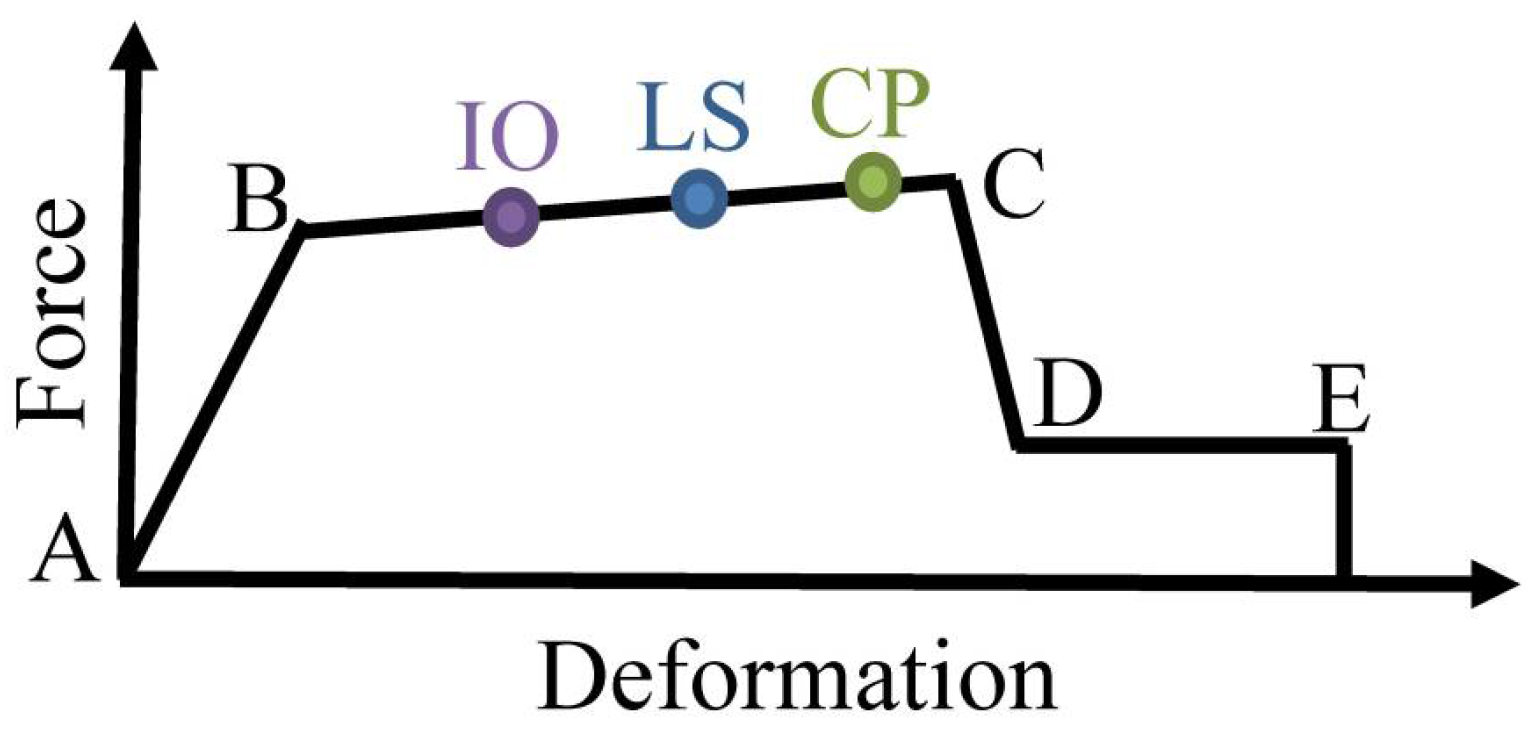
5.1. Derivation of ET Performance Curve
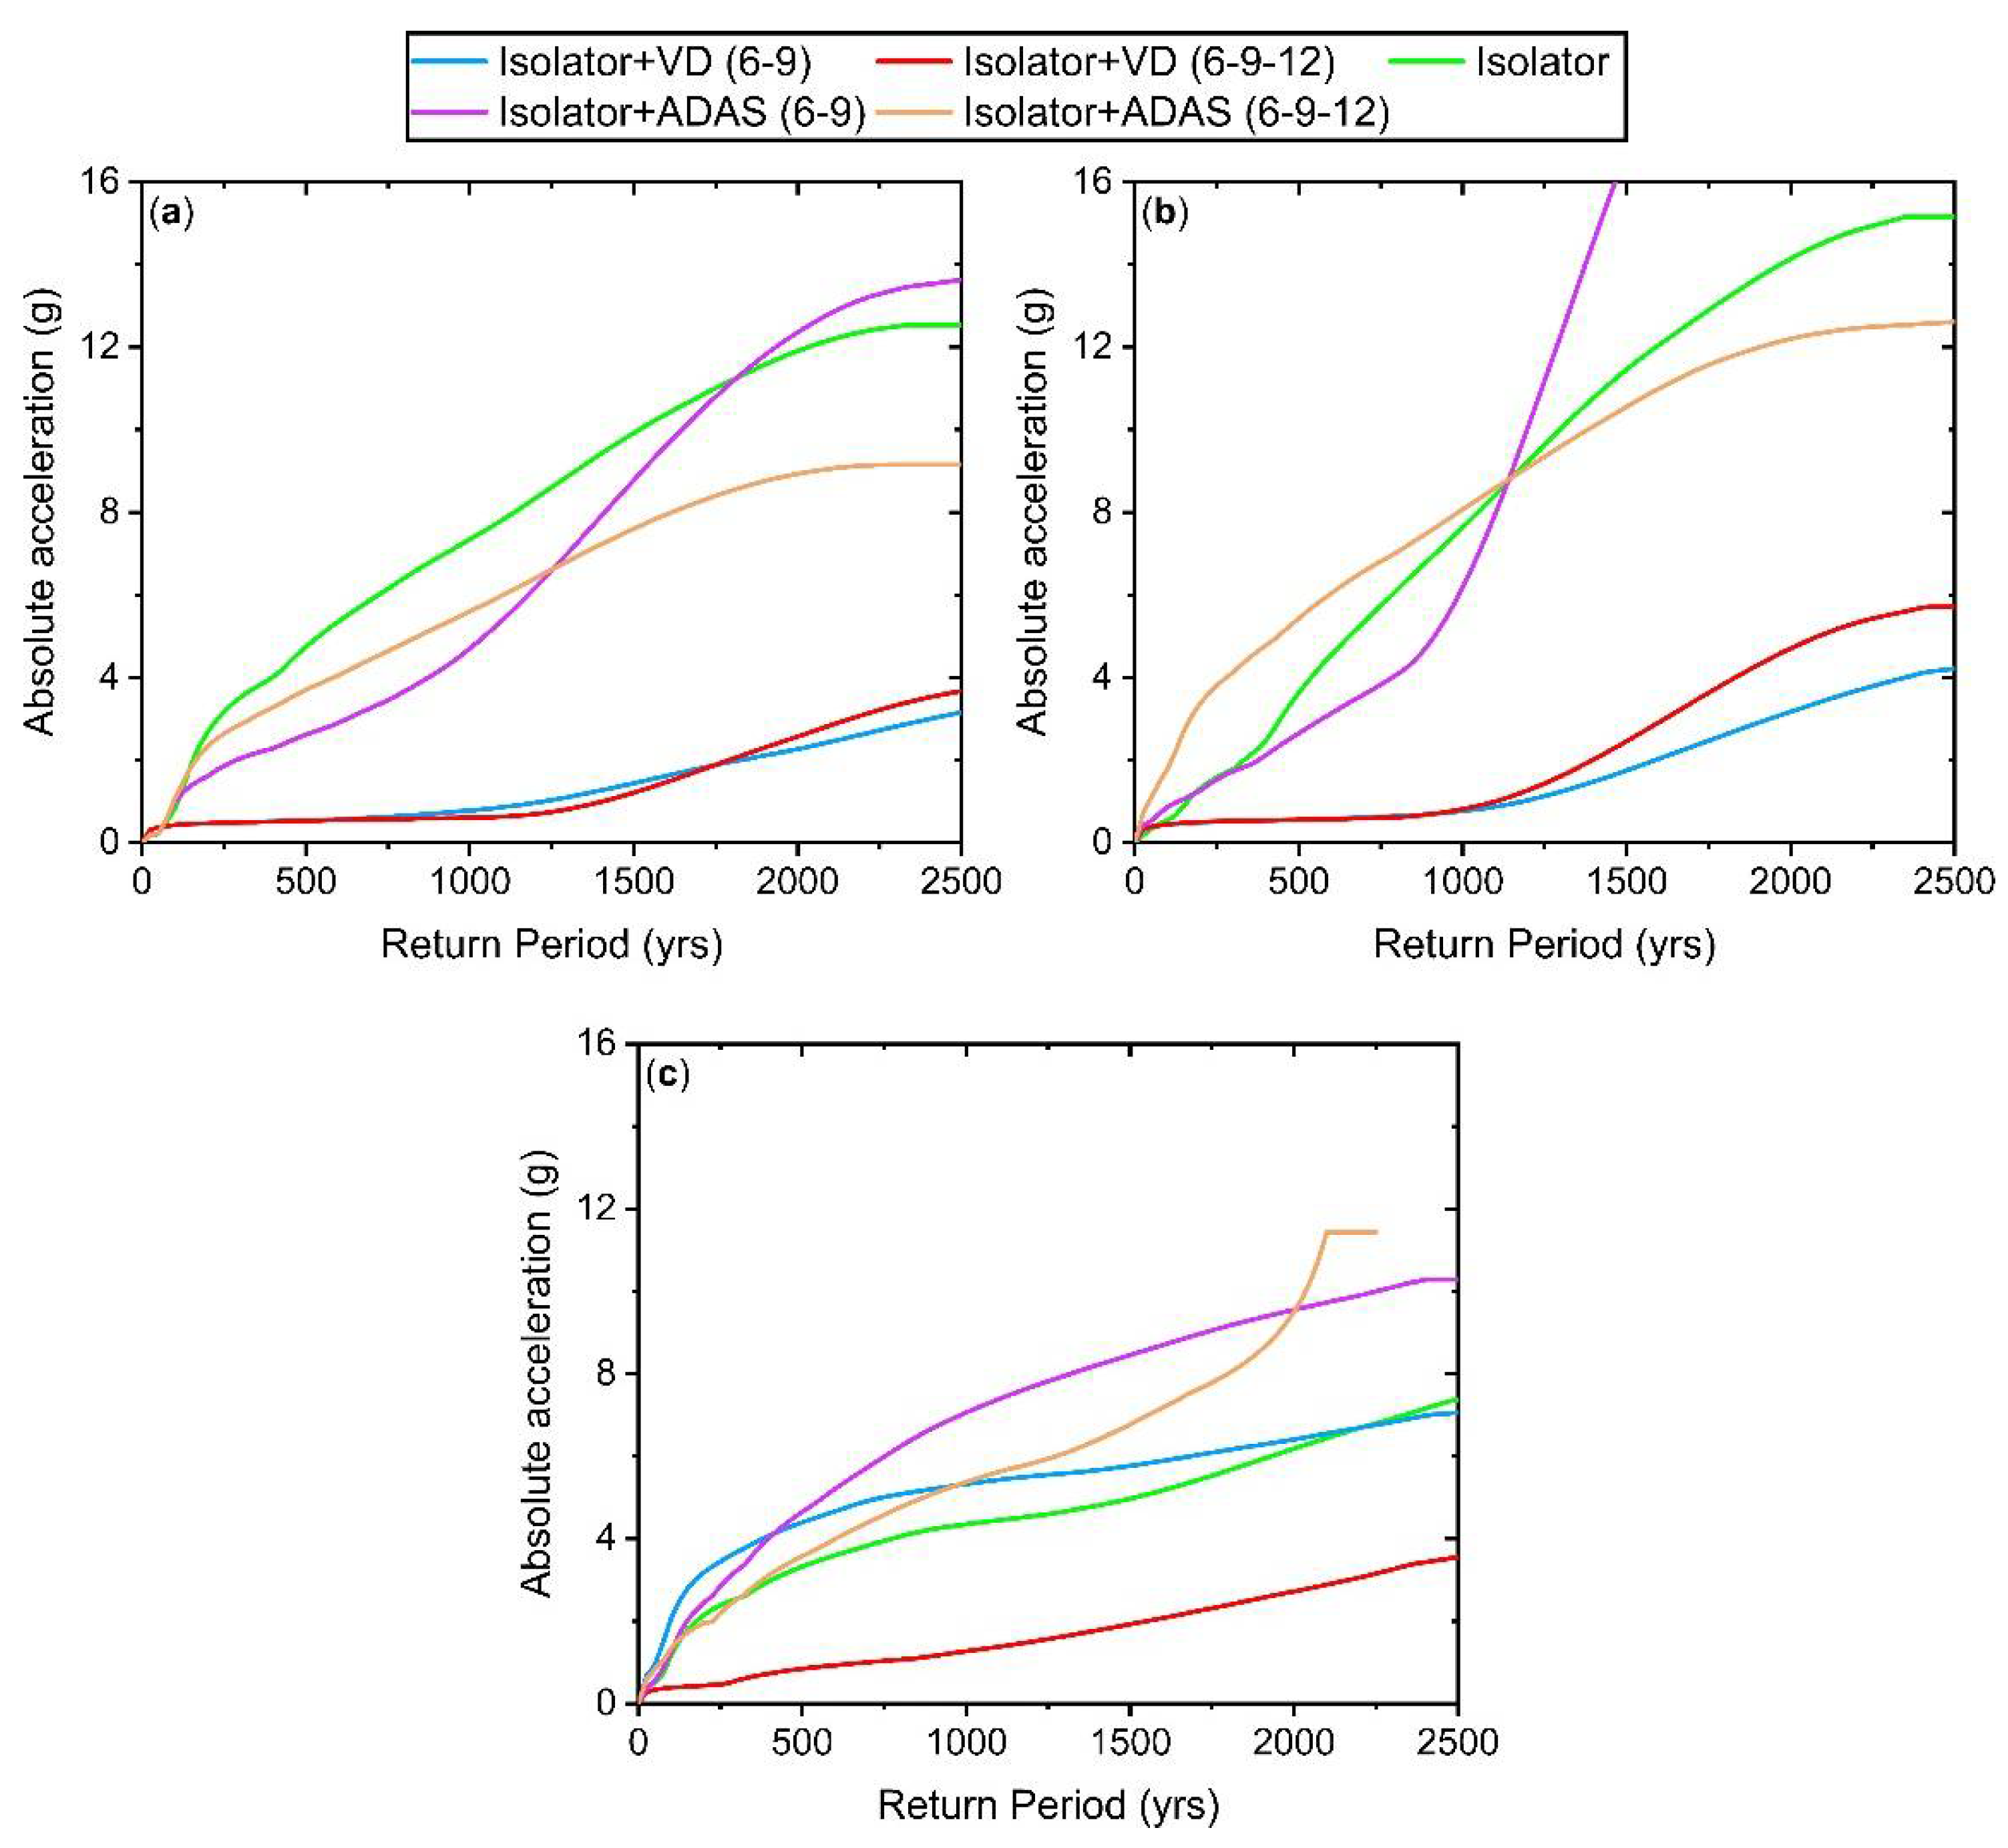
5.2. Scenario 1
5.3. Scenario 2
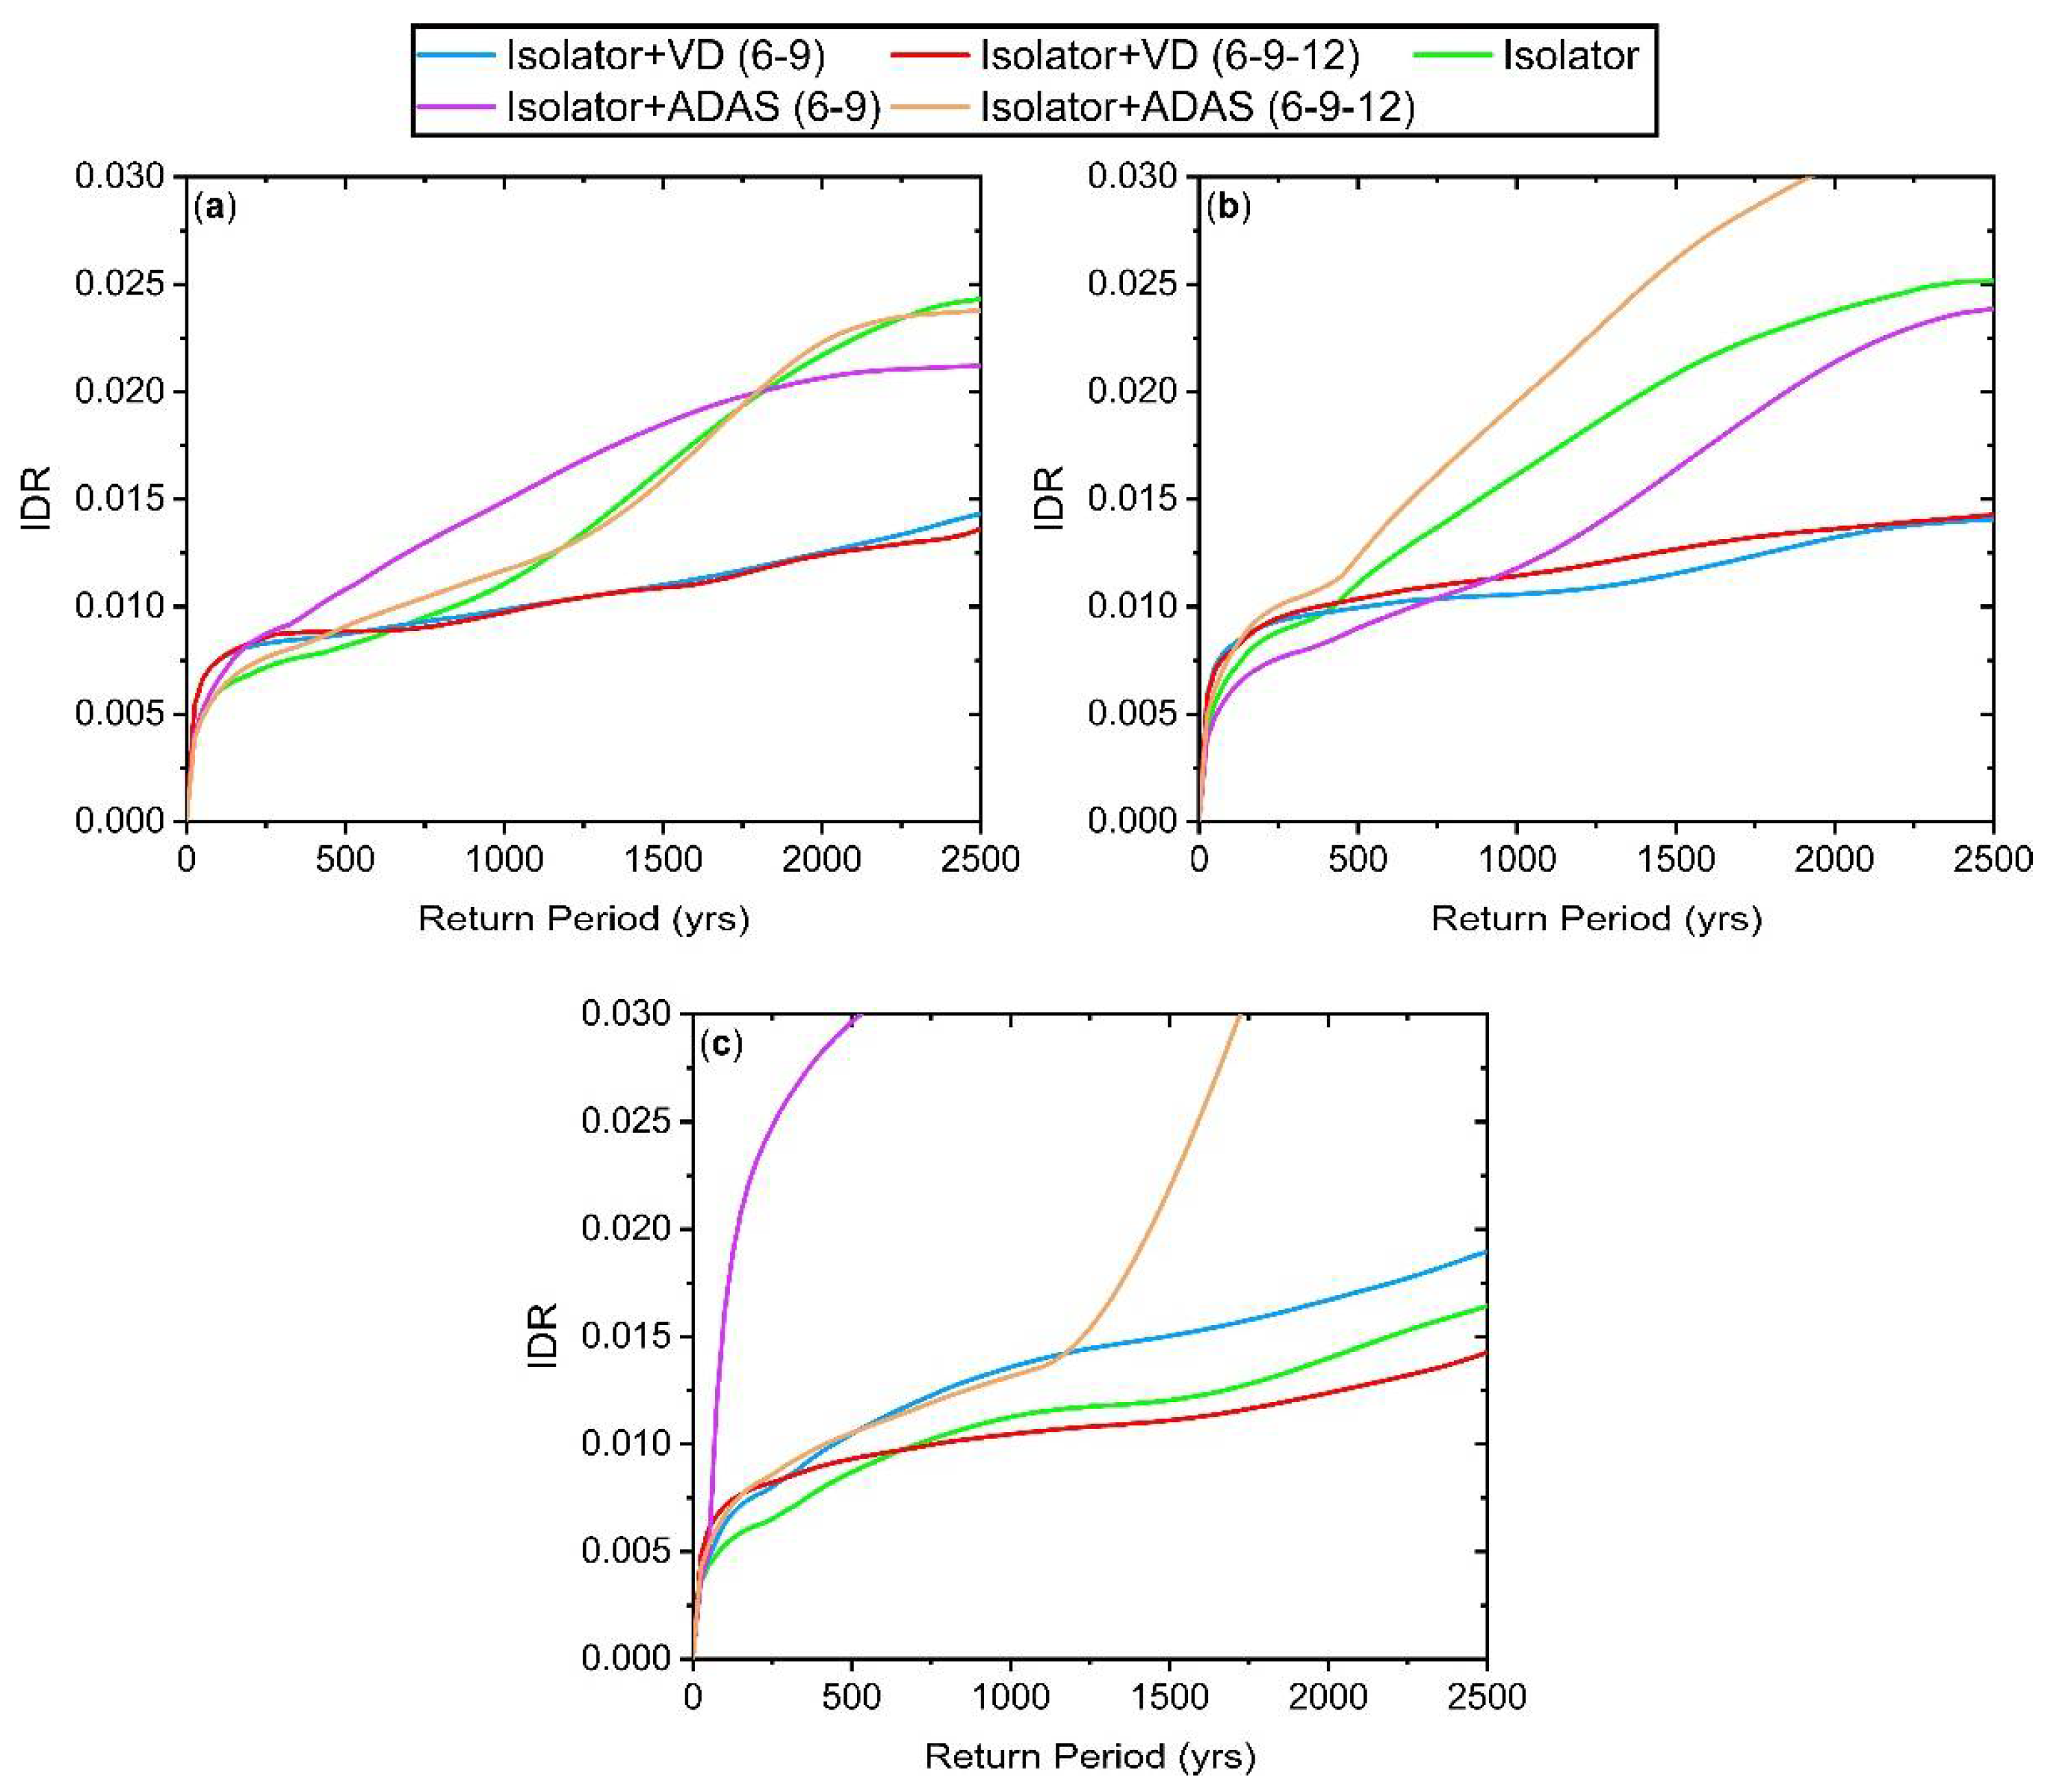
5.4. Scenario 3
5.5. Scenario 4
6. Summary and Conclusions
- There is a high collapse probability for the isolated structure with displacement capacity according to the BSE-1 hazard level under the BSE-2 hazard level. This is because of the pounding phenomena.
- The damage intensity of isolated structures due to impact with the adjacent isolated structure is higher than the impact with the moat wall.
- Decreasing the TD/TS can enhance the performance of isolated structural components under impact with the moat wall.
- Using the damper in the stories instead of the isolated level is more effective (about 1.62–11.6% under the BSE-2 hazard level) for improving the performance of the structural components under the impact with the moat wall. In contrast, using the damper at the isolated level is more effective (about 51.35–537% under the BSE-2 hazard level) for the impact of the adjacent isolated structures.
- The taller isolated structure can increase the failure of structural components of the adjacent shorter isolated structure under the impact between them.
- Adding the damper only to the shorter structure at the isolated level or in the stories increases the damage of the taller isolated structure under the impact between them, but adding the damper to both structures improves the performance of the structural components.
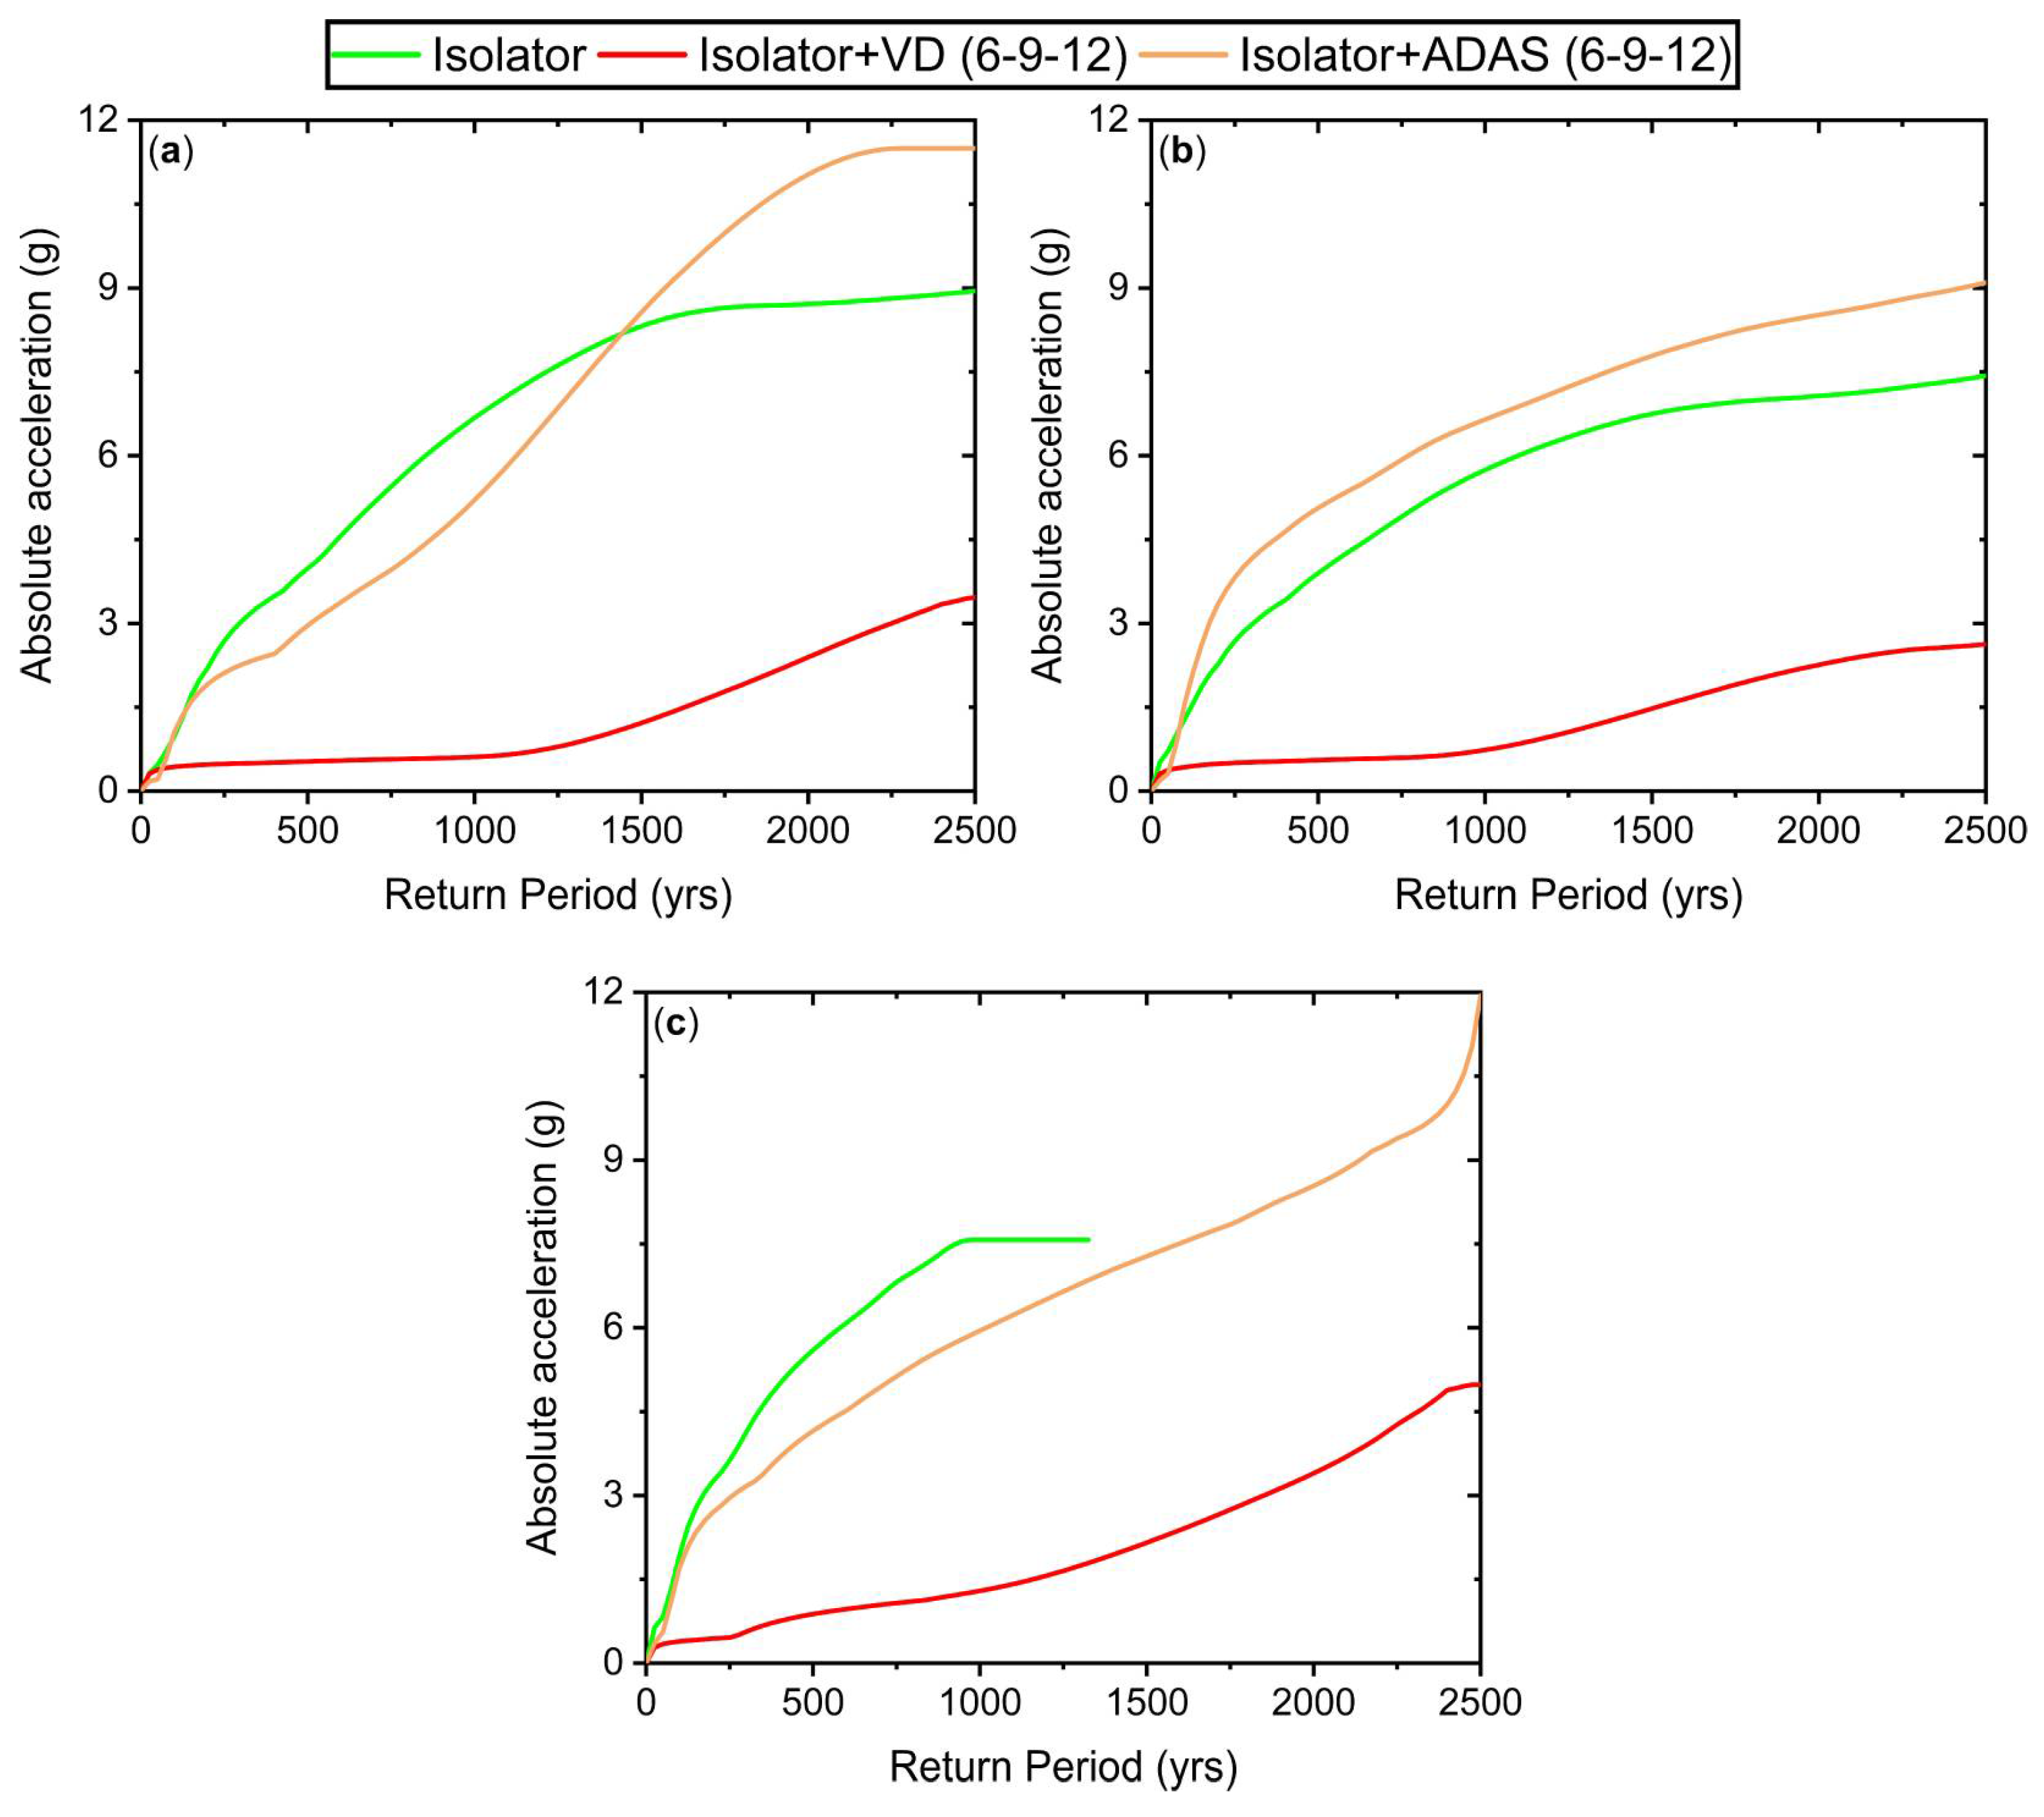
- Adding the damper to the isolated level is more effective than adding the damper to the stories (about 46–408% under the BSE-2 hazard level) in most scenarios for reducing the damage of the acceleration-sensitive nonstructural components under both types of impact mechanisms. Moreover, the positive effect of adding the damper to the isolated level was increased by enhancing the displacement capacity of the isolator in case of impact with the adjacent isolated structures.
Author Contributions
Funding
Data Availability Statement
Conflicts of Interest
References
- Pourmasoud, M.M.; Lim, J.B.P.; Hajirasouliha, I.; McCrum, D. Multi-directional base isolation system for coupled horizontal and vertical seismic excitations. J. Earthq. Eng. 2022, 26, 1145–1170. [Google Scholar] [CrossRef]
- Rakicevic, Z.; Bogdanovic, A.; Farsangi, E.N.; Sivandi-Pour, A. A hybrid seismic isolation system toward more resilient structures: Shaking table experiment and fragility analysis. J. Build. Eng. 2021, 38, 102194. [Google Scholar] [CrossRef]
- Farsangi, E.N.; Tasnimi, A.A.; Yang, T.; Takewaki, I.; Mohammadhasani, M. Seismic performance of base-isolated buildings under multi-directional earthquake excitations. Smart Struct. Syst. 2018, 22, 383–397. [Google Scholar]
- Vibhute, A.S.; Bharti, S.D.; Shrimali, M.K.; Datta, T.K. Performance evaluation of FPS and LRB isolated frames under main and aftershocks of an earthquake. Structures 2022, 44, 1532–1545. [Google Scholar] [CrossRef]
- Özuygur, A.R.; Farsangi, E.N. Influence of pulse-pike near-fault ground motions on the base-isolated buildings with LRB devices. Pract. Period. Struct. Des. Constr. 2021, 26, 04021027. [Google Scholar] [CrossRef]
- Asadi, P.; Nikfar, D.; Hajirasouliha, I. Life-cycle cost based design of bridge lead-rubber isolators in seismic regions. Structures 2020, 27, 383–395. [Google Scholar] [CrossRef]
- Komodromos, P.; Polycarpou, P.C.; Papaloizou, L.; Phocas, M.C. Response of seismically isolated buildings considering poundings. Earthq. Eng. Struct. Dyn. 2007, 36, 1605–1622. [Google Scholar] [CrossRef]
- Masroor, A.; Mosqueda, G. Experimental simulation of base-isolated buildings pounding against moat wall and effects on superstructure response. Earthq. Eng. Struct. Dyn. 2012, 41, 2093–2109. [Google Scholar] [CrossRef]
- Masroor, A.; Mosqueda, G. Assessing the Collapse Probability of Base-Isolated Buildings considering Pounding to Moat Walls using the FEMA P695 Methodology. Earthq. Spectra 2015, 31, 2069–2086. [Google Scholar] [CrossRef]
- ASCE/SEI 7-05; Minimum Design Loads for Buildings and Other Structures. American Society of Civil Engineers: Reston, VA, USA, 2006.
- Matsagar, V.A.; Jangid, R. Seismic response of base-isolated structures during impact with adjacent structures during impact with adjacent structures. Eng. Struct. 2003, 25, 1311–1323. [Google Scholar] [CrossRef]
- Pant, D.R.; Wijeyewickrema, A.C. Structural performance of a base-isolated reinforced concrete building subjected to seismic pounding. Earthq. Eng. Struct. Dyn. 2012, 41, 1709–1716. [Google Scholar] [CrossRef]
- Bao, Y.; Becker, T.C. Effect of design methodology on collapse of friction pendulum isolated moment-resisting and concentrically braced frames. J. Struct. Eng. 2018, 144, 04018203. [Google Scholar] [CrossRef]
- Bao, Y.; Becker, T.C. Inelastic response of base-isolated structures subjected to impact. Eng. Struct. 2018, 171, 86–93. [Google Scholar] [CrossRef]
- Movahhed, A.S.; Zardari, S.; Şadoğlu, E. Seismic performance of a building base-isolated by TFP susceptible to pound with a surrounding moat wall. Earthq. Struct. 2022, 23, 723–736. [Google Scholar]
- Rayegani, A.; Nouri, G. Seismic collapse probability and life cycle cost assessment of isolated structures subjected to pounding with smart hybrid isolation system using a modified fuzzy based controller. Structures 2022, 44, 30–41. [Google Scholar] [CrossRef]
- Rawlinson, T.A.; Marshall, J.D.; Ryan, K.L.; Zargar, H. Development and experimental evaluation of a passive gap damper device to prevent pounding in base-isolated structures. Earthq. Eng. Struct. Dyn. 2015, 44, 1661–1675. [Google Scholar] [CrossRef]
- Zargar, H.; Ryan, K.L.; Marshall, J.D. Feasibility study of a gap damper to control seismic isolator displacements in extreme earthquakes. Struct. Control Health Monit. 2013, 20, 1159–1175. [Google Scholar] [CrossRef]
- Zargar, H.; Ryan, K.L.; Rawlinson, T.A.; Marshall, J.D. Evaluation of a passive gap damper to control displacements in a shaking test of a seismically isolated three-story frame. Earthq. Eng. Struct. Dyn. 2017, 46, 51–71. [Google Scholar] [CrossRef]
- Matsagar, V.A.; Jangid, R.S. Viscoelastic damper connected to adjacent structures involving seismic isolation. J. Civ. Eng. Manag. 2005, 11, 309–322. [Google Scholar] [CrossRef]
- Shrimali, M.; Bharti, S.; Dumne, S. Seismic response analysis of coupled building involving MR damper and elastomeric base isolation. Ain Shams Eng. J. 2015, 6, 457–470. [Google Scholar] [CrossRef]
- Khatami, S.M.; Naderpour, H.; Mortezaei, A.; Sharbatdar, A.; Lasowicz, N.; Jankowski, R. The Effectiveness of Rubber Bumpers in Reducing the Effects of Earthquake-Induced Pounding between Base-Isolated Buildings. Appl. Sci. 2022, 12, 4971. [Google Scholar] [CrossRef]
- Zhou, Y.; Chen, P. Shaking table tests and numerical studies on the effect of viscous dampers on an isolated RC building by friction pendulum bearings. Soil Dyn. Earthq. Eng. 2017, 100, 330–344. [Google Scholar] [CrossRef]
- Chen, P.; Wu, X. Investigations on the Dynamic Response of Adjacent Buildings Connected by Viscous Dampers. Buildings 2022, 12, 1480. [Google Scholar] [CrossRef]
- ASCE/SEI 7-16; Minimum Design Loads and Associated Criteria for Buildings and Other Structures. American Society of Civil Engineers: Reston, VA, USA, 2017.
- ASCE/SEI 7-10; Minimum Design Loads for Buildings and Other Structures. American Society of Civil Engineers: Reston, VA, USA, 2010.
- Kitayama, S.; Constantinou, M.C. Collapse performance of seismically isolated buildings designed by the procedures of ASCE/SEI 7. Eng. Struct. 2018, 164, 243–258. [Google Scholar] [CrossRef]
- Beheshti, M.; Asadi, P. Lifetime performance assessment of ductile steel frame using fractional model of viscoelastic dampers considering uncertainty parameters. Mech. Based Des. Struct. Mach. 2022, 50, 3157–3179. [Google Scholar] [CrossRef]
- Asadpour, G.; Asadi, P.; Hajirasouliha, I. Analysis of bilinear hysteretic structures with nonlinear fluid viscous dampers using modified stochastic linearization technique. Eng. Struct. 2022, 251, 113555. [Google Scholar] [CrossRef]
- Estekanchi, H.; Vafai, A.; Sadeghazar, M. Endurance time method for seismic analysis and design of structures. Sci. Iran. 2004, 11, 341–370. [Google Scholar]
- Tavakolinia, M.; Basim, M.C. Performance-based optimum tuning of tuned mass dampers on steel moment frames for seismic applications using the endurance time method. Earthq. Eng. Struct. Dyn. 2021, 50, 3646–3669. [Google Scholar] [CrossRef]
- Estekanchi, H.; Riahi, H.; Vafai, A. Application of endurance time method in seismic assessment of steel frames. Eng. Struct. 2011, 33, 2535–2546. [Google Scholar] [CrossRef]
- Nozari, A.; Estekanchi, H. Optimization of endurance time acceleration functions for seismic assessment of structures. Int. J. Optim. Civ. Eng. 2011, 1, 257–277. [Google Scholar]
- Mashayekhi, M.; Estekanchi, H. Significance of Effective Number of Cycles in Endurance Time Analysis. Asian J. Civ. Eng. (Build. Hous.) 2012, 13, 647–657. [Google Scholar]
- Mashayekhi, M.; Estekanchi, H.E. Investigation of Strong-Motion Duration Consistency in Endurance Time Excitation Functions. Sci. Iran. 2013, 20, 1085–1093. [Google Scholar]
- Mashayekhi, M.; Estekanchi, H.E.; Vafai, A.; Mirfarhadi, S.A. Simulation of cumulative absolute velocity consistent endurance time excitations. J. Earthq. Eng. 2021, 25, 892–917. [Google Scholar] [CrossRef]
- Vaiana, N.; Capuano, R.; Rosati, L. Evaluation of path-dependent work and internal energy change for hysteretic mechanical systems. Mech. Syst. Signal Process. 2023, 186, 109862. [Google Scholar] [CrossRef]
- Mashayekhi, M.; Estekanchi, H.E.; Vafai, H.; Mirfarhadi, S.A. Development of hysteretic energy compatible endurance time excitations and its application. Eng. Struct. 2018, 177, 753–769. [Google Scholar] [CrossRef]
- FEMA P-695; Quantification of Building Seismic Performance Factors. FEMA: Washington, DC, USA, 2009.
- Movahhed, A.S.; Shirkhani, A.; Zardari, S.; Mashayekhi, M.; Farsangi, E.N.; Majdi, A. Modified endurance time method for seismic performance assessment of base-isolated structures. J. Build. Eng. 2023, 67, 105955. [Google Scholar] [CrossRef]
- ANSI/AISC 360-16; Specification for Structural Steel Buildings. American Institute of Steel Construction: Chicago, IL, USA, 2016.
- ANSI/AISC 341-16; Seismic Provisions for Structural Steel Buildings. American Institute of Steel Construction: Chicago, IL, USA, 2016.
- ASCE/SEI 41-17; Seismic Evaluation and Retrofit of Existing Buildings. American Society of Civil Engineers: Reston, VA, USA, 2017.
- SAP2000; Integrated Solution for Structural Analysis and Design. Computers and Structures Inc.: Berkeley, CA, USA, 2009.
- Movahhed, A.S.; Shirkhani, A.; Zardari, S.; Farsangi, E.N.; Pour, A.K. Effective range of base isolation design parameters to improve structural performance under far and near-fault earthquakes. Adv. Struct. Eng. 2023, 26, 52–71. [Google Scholar] [CrossRef]
- Hughes, P.J.; Mosqueda, G. Evaluation of uniaxial contact models for moat wall pounding simulations. Earthq. Eng. Struct. Dyn. 2020, 49, 1197–1215. [Google Scholar] [CrossRef]
- Fenz, D.M.; Constantinou, M.C. Spherical sliding isolation bearings with adaptive behavior: Theory. Earthq. Eng. Struct. Dyn. 2008, 37, 163–183. [Google Scholar] [CrossRef]
- Fenz, D.M.; Constantinou, M.C. Spherical sliding isolation bearings with adaptive behavior: Experimental verification. Earthq. Eng. Struct. Dyn. 2008, 37, 185–205. [Google Scholar] [CrossRef]
- Fenz, D.M.; Constantinou, M.C. Modeling triple friction pendulum bearings for response-history analysis. Earthq. Spectra 2008, 24, 1011–1028. [Google Scholar] [CrossRef]
- Constantinou, M.; Kalpakidis, I.; Filiatrault, A.; Lay, R.E. LRFD-Based Analysis and Design Procedures for Bridge Bearings and Seismic Isolators; Technical Report No. MCEER-11-0004; State University of New York at Buffalo: Buffalo, NY, USA, 2011. [Google Scholar]
- Xia, C.; Hanson, R.D. Influence of ADAS element parameters on building seismic response. J. Struct. Eng. 1992, 118, 1903–1918. [Google Scholar] [CrossRef]
- Tehranizadeh, M. Passive energy dissipation device for typical steel frame building in Iran. Eng. Struct. 2001, 21, 643–655. [Google Scholar] [CrossRef]
- Bayat, M.; Abdollahzade, G. Analysis of the steel braced frames equipped with ADAS devices under the far field records. Lat. Am. J. Solids Struct. 2011, 8, 163–181. [Google Scholar] [CrossRef]
- Whittaker, A.S.; Bertero, V.V.; Alonso, L.J.; Thompson, C.L. Earthquake Simulator Testing of Steel Plate Added Damping and Stiffness Elements; Report No. UCB/EERC-89/02; Earthquake Engineering Research Center, University of California: Berkeley, CA, USA, 1989. [Google Scholar]
- Providakis, C. Effect of supplemental damping on LRB and FPS seismic isolators under near-fault ground motions. Soil Dyn. Earthq. Eng. 2009, 29, 80–90. [Google Scholar] [CrossRef]
- Vaiana, N.; Sessa, S.; Marmo, F.; Rosati, L. Nonlinear dynamic analysis of hysteretic mechanical systems by combining a novel rate-independent model and an explicit time integration method. Nonlinear Dyn. 2019, 98, 2879–2901. [Google Scholar] [CrossRef]
- Mirzaee, A.; Estekanchi, H.; Vafai, A. Improved methodology for endurance time analysis: From time to seismic hazard return period. Sci. Iran. 2012, 19, 1180–1187. [Google Scholar] [CrossRef]
- Hazus 4.2; Hazus Earthquake Model Technical Manual. Federal Emergency Management Agency: Washington, DC, USA, 2020.


| Floor Level | Column | Beam | ||||
|---|---|---|---|---|---|---|
| 12 | W16×50 | |||||
| 11 | W12×35 | W18×50 | ||||
| 10 | W12×58 | W18×55 | ||||
| 9 | W12×72 | W18×65 | W18×50 | |||
| 8 | W12×72 | W12×35 | W18×71 | W18×50 | ||
| 7 | W12×87 | W12×45 | W18×76 | W18×60 | ||
| 6 | W12×96 | W12×58 | W18×86 | W18×65 | W16×50 | |
| 5 | W12×106 | W12×72 | W12×35 | W18×86 | W18×71 | W16×50 |
| 4 | W12×120 | W12×79 | W12×45 | W18×86 | W18×76 | W16×50 |
| 3 | W12×136 | W12×96 | W12×65 | W18×86 | W18×76 | W16×57 |
| 2 | W12×136 | W12×106 | W12×65 | W18×86 | W18×76 | W16×57 |
| 1 | W12×152 | W12×120 | W12×79 | W18×86 | W18×76 | W16×57 |
| 0 (Isolated level) | W12×170 | W12×136 | W12×79 | W21×201 | W21×201 | W21×201 |
| Frame | TD (s) | (cm) | (cm) | (cm) | (cm) | |||
|---|---|---|---|---|---|---|---|---|
| 6 | 3.3 | 22.8 | 0.03 | 0.018 | 224 | 41 | 36 | 5 |
| 9 | 3.3 | 22.5 | 0.032 | 0.01 | 224 | 41 | 36 | 5 |
| 12 | 4.4 | 22.6 | 0.023 | 0.01 | 396 | 64 | 51 | 10 |
| Story | ||||||
|---|---|---|---|---|---|---|
| 12 | 131 | 108.5 | ||||
| 11 | 175 | 123.2 | ||||
| 10 | 219 | 154 | ||||
| 9 | 219 | 87 | 154 | 61.6 | ||
| 8 | 262 | 87 | 184.8 | 61.6 | ||
| 7 | 700 | 131 | 208.2 | 92.4 | ||
| 6 | 787 | 131 | 234.3 | 92.4 | 62.8 | |
| 5 | 831 | 175 | 91 | 247.3 | 123.2 | 62.8 |
| 4 | 918 | 437 | 91 | 273.3 | 130.2 | 83.7 |
| 3 | 962 | 481 | 122 | 286.3 | 143.2 | 83.7 |
| 2 | 1093 | 525 | 152 | 325.5 | 156.2 | 104.6 |
| 1 | 1312 | 656 | 182 | 390.5 | 195.2 | 125.5 |
Disclaimer/Publisher’s Note: The statements, opinions and data contained in all publications are solely those of the individual author(s) and contributor(s) and not of MDPI and/or the editor(s). MDPI and/or the editor(s) disclaim responsibility for any injury to people or property resulting from any ideas, methods, instructions or products referred to in the content. |
© 2023 by the authors. Licensee MDPI, Basel, Switzerland. This article is an open access article distributed under the terms and conditions of the Creative Commons Attribution (CC BY) license (https://creativecommons.org/licenses/by/4.0/).
Share and Cite
Majdi, A.; Sadeghi-Movahhed, A.; Mashayekhi, M.; Zardari, S.; Benjeddou, O.; De Domenico, D. On the Influence of Unexpected Earthquake Severity and Dampers Placement on Isolated Structures Subjected to Pounding Using the Modified Endurance Time Method. Buildings 2023, 13, 1278. https://doi.org/10.3390/buildings13051278
Majdi A, Sadeghi-Movahhed A, Mashayekhi M, Zardari S, Benjeddou O, De Domenico D. On the Influence of Unexpected Earthquake Severity and Dampers Placement on Isolated Structures Subjected to Pounding Using the Modified Endurance Time Method. Buildings. 2023; 13(5):1278. https://doi.org/10.3390/buildings13051278
Chicago/Turabian StyleMajdi, Ali, Ataallah Sadeghi-Movahhed, Mohammadreza Mashayekhi, Saeid Zardari, Omrane Benjeddou, and Dario De Domenico. 2023. "On the Influence of Unexpected Earthquake Severity and Dampers Placement on Isolated Structures Subjected to Pounding Using the Modified Endurance Time Method" Buildings 13, no. 5: 1278. https://doi.org/10.3390/buildings13051278