Article

Simulation Study on Airflow Organization and Environment in Reconstructed Fangcang Shelter Hospital Based on CFD

1
College of Energy and Mechanical Engineering, Shanghai University of Electric Power, Shanghai 200090, China
2
State Grid Zhejiang Integrated Energy Service Company, Hangzhou 310000, China
*
Authors to whom correspondence should be addressed.
Buildings 2023, 13(5), 1269; https://doi.org/10.3390/buildings13051269
Submission received: 19 April 2023 / Revised: 8 May 2023 / Accepted: 9 May 2023 / Published: 12 May 2023
(This article belongs to the Topic Advanced Ventilation in and beyond the COVID-19 Pandemic)

Abstract

:
With frequent outbreaks of COVID-19, the rapid and effective construction of large-space buildings into Fangcang shelter hospitals has gradually become one of the effective means to control the epidemic. Reasonable design of the ventilation system of the Fangcang shelter hospital can optimize the indoor airflow organization, so that the internal environment can meet the comfort of patients and at the same time can effectively discharge pollutants, which is particularly important for the establishment of the Fangcang shelter hospital. In this paper, through the reconstruction of a large-space gymnasium, CFD software is used to simulate the living environment and pollutant emission efficiency of the reconstructed Fangcang shelter hospital in summer under different air supply temperatures, air supply heights and exhaust air volume parameters. The results show that when the air supply parameters are set to an air supply height of 4.5 m, an air supply temperature of 18 °C, and an exhaust air volume of a single bed of 150 m3/h, the thermal comfort can reach level I, and the ventilation efficiency for pollutants can reach 69.6%. In addition, the ventilation efficiency is 70.1% and 70.3% when the exhaust air volume of a single bed is continuously increased to 200 and 250 m3/h, which can no longer effectively improve the pollutant emission and will cause an uncomfortable blowing feeling to patients.

1. Introduction

The outbreak of COVID-19 has had a direct and devastating impact on the global economy [1] and has posed an unprecedented challenge to the medical system around the world [2]. At the beginning of 2022, COVID-19 broke out repeatedly in various places, and Shanghai became the city with the largest population infection scale. In order to effectively control the epidemic, the Shanghai Epidemic Prevention and Control Headquarters dispatched the national emergency medical rescue team and medical teams from all over the country to Shanghai and organized the establishment of a shelter hospital [3]. The purpose of establishing the Fangcang shelter hospital was to centralize the management of patients and prevent the spread of disease [4]. Secondly, it is necessary to avoid some patients with basic diseases being isolated at home alone, lacking medication and professional medical facilities, thereby increasing the severity of virus infection [5]. The Fangcang shelter hospital is a new type of public health project, which provides medical treatment, disease monitoring, food and social activities for patients with infectious diseases. It was first proposed and implemented by China in February 2020 [6]. Due to the long-term existence and multiple variations of COVID-19, its infectivity has been greatly enhanced, the number of infected people has grown extremely fast, and the demand for Fangcang shelter hospitals has risen significantly, which has also led to the improvement and updating of the design guidelines of shelter hospitals, so as to achieve the standardization and rationalization of the design of shelter hospitals [7]. Therefore, in order to meet the growing isolation needs of infected people, the exhibition hall, gymnasium and other large spaces have become the reconstruction objects of the Fangcang shelter hospital. COVID-19 is mainly transmitted through the respiratory tract, so it is necessary to focus on the control of infectious sources and maintain high indoor air quality. Therefore, the transformation of the ventilation system in the Fangcang shelter hospital is an extremely important part of the construction of the Fangcang shelter hospital [8].
Shanghai is located in the eastern coastal area of China and has a subtropical monsoon climate. The precipitation in Shanghai from May to September is about 60% of the whole year, especially from July to August: it is a summer drought. The climate is humid and hot, so the requirements for the ventilation system are particularly strict. As the outbreak of the epidemic in Shanghai occurred in March, when the weather is relatively cool, so it is only necessary to meet the indoor environment requirements through mechanical ventilation and natural air supplement temporarily. However, with the increase in time, the arrival of the plum rain season and summer drought weather, the air-conditioning fresh air system must be used to ensure the comfort of indoor personnel. As for the design of the ventilation system, the Fangcang shelter of the Shanghai World Expo Hall was rebuilt in the form of a cloth bag air duct, and the temperature in the lower area is almost not stratified, and the distribution is relatively uniform [9,10]. The tuyere of the Beijing Capital Gymnasium combines slot tuyere and shutter tuyere, and uses valves to switch tuyeres, so as to meet various wind speed requirements [11]. In the Tokyo Metropolitan Gymnasium, Japan, the air conditioning is divided into three areas to refine the air conditioning, which can meet the needs of the spectators and the competition site at the same time. At the same time, the side-air supply mode is used to supply air to the auditorium area, so that the temperature distribution of the auditorium is uniform [11].
CFD technology is currently widely used in mechanical engineering, energy, and environmental fields. In the field of mechanical engineering, CFD technology can be used to simulate the flow of fluids through blades, pumps, fans, and other mechanical components, improving their performance and efficiency. Nan Wang et al. [12] applied effective artificial intelligence algorithms to centrifugal pumps, and analyzed and optimized them through CFD to improve their performance. In the field of energy, CFD technology can be used to simulate the flow of fluids and energy conversion processes in gas turbines, turbines, generators, and other energy conversion devices. Yeop Kim et al. [13] designed a transcritical cycle radial inflow turbine for geothermal power generation systems and evaluated the performance of the designed turbine using CFD to obtain design parameters to improve turbine efficiency. In the environmental field, CFD technology can be used to simulate the motion and distribution of fluids and pollutants in air, water, soil, and ocean environments. Bay Ezgi et al. [14] used CFD technology to evaluate the natural ventilation strategy of historical buildings in hot and humid climates. GonKim et al. [15] and Fathollahzadeh MH et al. [16] used CFD technology to study the airflow organization under the floor air supply of large-space buildings, and obtained the optimal parameter scheme through the analysis of the temperature field and velocity field. Ascione Fabrizio et al. [17] used CFD to simulate the campus of the University of Camposo in Italy, and studied the operation mode of the air-conditioning system in the safety classroom of the teaching building for disease infection and transmission. Zhao et al. [18] used CFD to simulate the diffusion of oral droplets carrying respiratory infectious viruses under different ventilation times, and obtained that most of the droplets can be discharged under sufficient indoor ventilation, thus effectively maintaining a relatively healthy indoor air environment. It is pointed out that fresh air should be used as much as possible and the air exchange rate should be increased if conditions permit. Li et al. [19] took a gymnasium project in Harbin as an example, and simulated the environment through CFD. The results showed that the project feasibility of transforming the existing gymnasium into a Fangcang shelter hospital provided a certain degree of theoretical support for the Fangcang shelter hospital transformation project.
The research on airflow organization in Fangcang shelter hospitals is targeted, and personnel comfort and pollutant control should be considered at the same time. At present, some scholars have designed and studied the ventilation system of the Fangcang shelter hospital, including the research on the comfortable environment of personnel, as well as the research on pollutant emission. Pradip Aryal et al. [20] analyzed the impact of a partition wall on thermal comfort during air-conditioning operations in large-space buildings through CFD simulation. Xia et al. [21] concluded by comparing the ventilation forms and airflow organization of different gyms that setting an exhaust under the hospital bed while supplying fresh air at the upper part can effectively avoid the intrusion and threat of viruses. Wang et al. [22,23] conducted a simulation study in the sickbed area of the Wuhan Dahuashan Fangcang Shelter Hospital. The phenomenon of thermal stratification and poor ventilation increased the risk of infection due to the accumulation of pollutants exhaled by patients, and baffles were used to solve the air seepage velocity near the make-up air inlet. Following China’s successful experience in building Fangcang shelter hospitals, other countries began to establish Fangcang shelter hospitals and carry out research. For example, the 627th field hospital in the United States transformed from the activity center, the Garvitz field hospital transformed from the conference center, and the Spanish Madrid shelter hospital transformed from the convention center [24,25,26]. Machida et al. [27] found in the simulation test that the diffusion of tuberculosis bacteria after using the radiation air-conditioning system will be much less than that of the convection air-conditioning system. In addition, increasing the distance between beds and heightening the isolation wall can effectively prevent cross-infection [28]. Liu et al. [29] found that the indoor temperature and humidity will affect the indoor propagation of droplets with different particle sizes, and the droplets are greatly affected by turbulence, and the unstable airflow will accelerate the virus transmission.
According to the existing studies, reasonable renovation of makeshift hospitals can cope with the spread of the novel coronavirus in a timely manner, but the application of CFD simulation of different ventilation design schemes on the comfort of personnel in the internal environment of makeshift hospitals and the common impact of air flow organization and pollutant transmission are still insufficient. The original ventilation design mainly aims to maintain good thermal comfort and indoor air quality for the occupants, or only consider reasonable air distribution and pollutant emission. Advanced ventilation strategies should be further developed to reduce the risk of infection, combined with thermal comfort considerations [30,31]. As the COVID-19 epidemic is urgent and spreading rapidly, medical resources are in short supply, and patients with mild illnesses are in the majority. Most of the Fangcang shelter hospitals have abandoned the traditional “three areas and two channels” [32], namely: clean area, semi-polluted area, polluted area, patient channel and medical channel. The interior of the reconstructed Fangcang shelter hospital is planned as a pollution area as a whole, so it is only necessary to consider the overall negative pressure formed in the Fangcang shelter to avoid the internal airflow overflow.
Based on the above background, this paper simulated the living environment quality and pollutant emission in the Fangcang shelter hospital under different ventilation parameter schemes under hot summer conditions through CFD software, and obtains appropriate parameters to allow the Fangcang shelter hospital interior to reach a comfortable living condition. Taking the gymnasium of a university in Shanghai as an example, the second floor of the gymnasium was transformed into a temporary Fangcang shelter hospital, and the air-conditioning system used the method of bag air supply. In order to better deal with the epidemic situation that may occur in the future, combined with the case of small- and medium-sized venues rebuilding Fangcang shelter hospitals, how to better design and plan the ventilation system in consideration of the local climate was studied, and the impact of air supply parameters on the distribution of pollutants and viruses through simulation was analyzed. Finally, the appropriate ventilation system design and air supply parameters were presented. The method used in this paper has an important reference significance for the future actual construction design.
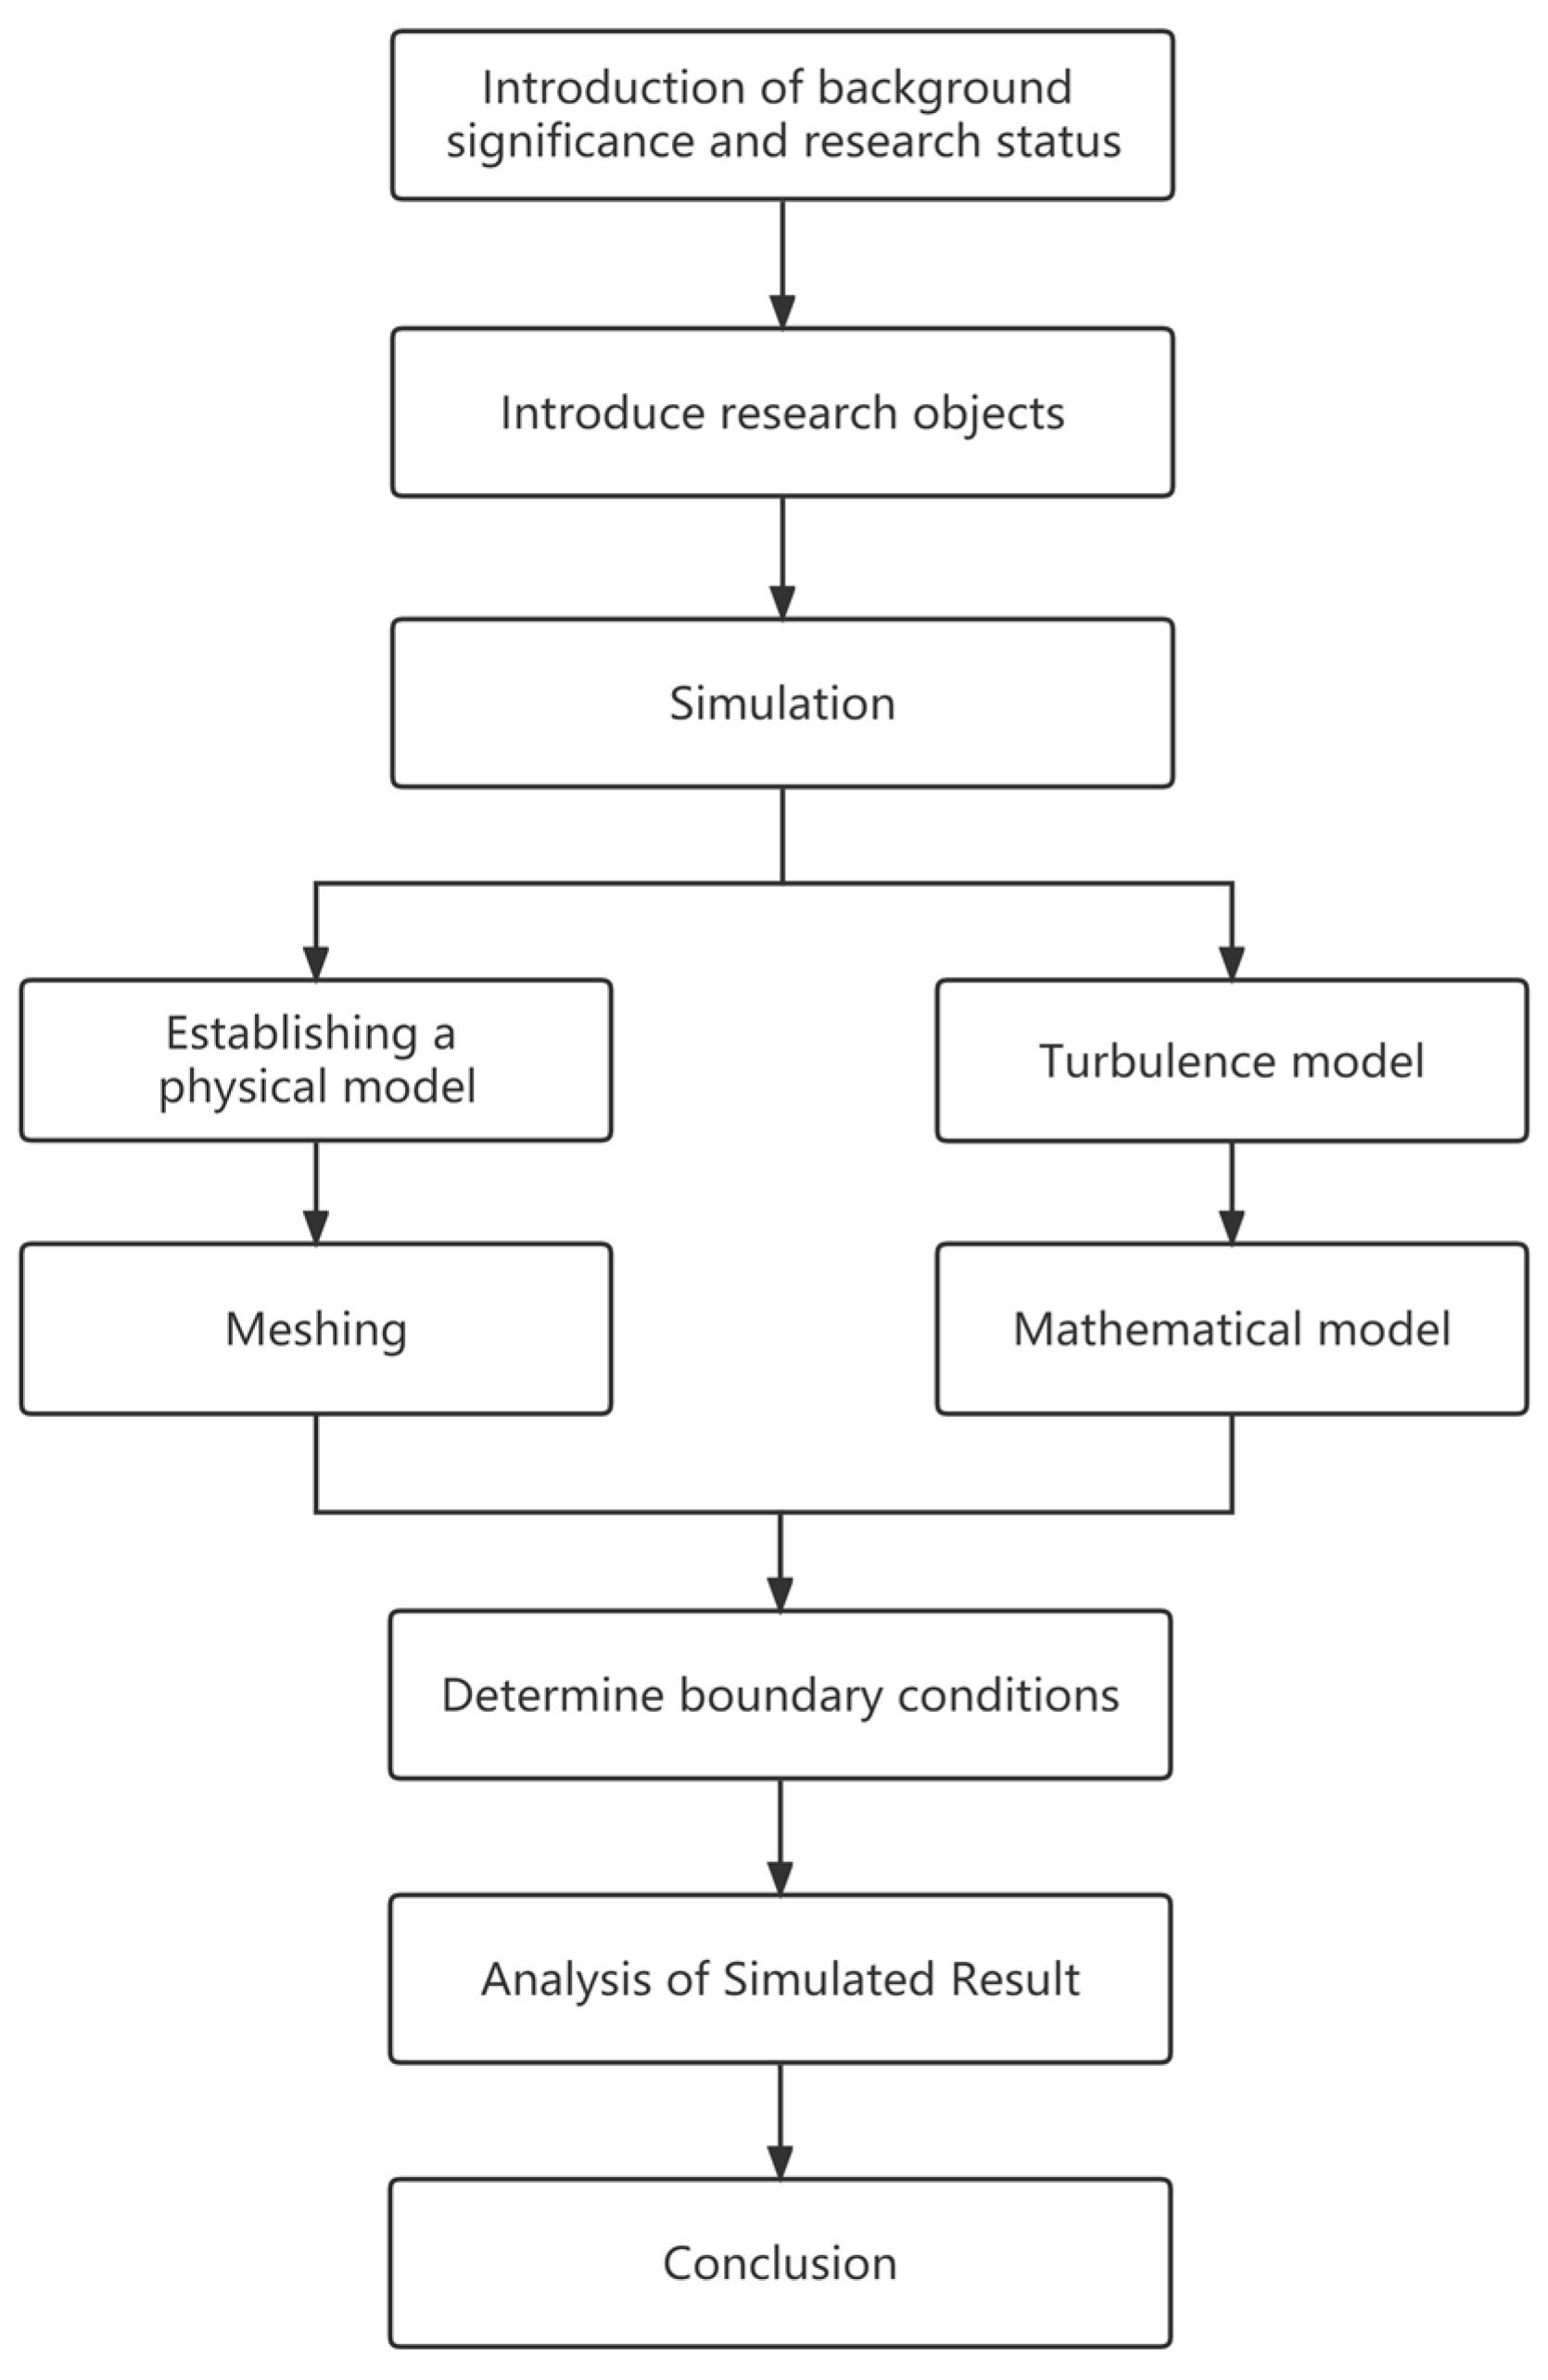
The second chapter of this article introduces the research object of the renovation, the third chapter establishes a simulation model, the fourth chapter focuses on analyzing the numerical simulation results, and finally conclusions are drawn in the fifth chapter. The flowchart of the study is shown in Figure 1.
The main contributions of this article are as follows:
(1) In emergency situations, the traditional three-zone and two-channel renovation of the gymnasium into a shelter hospital is not considered.
(2) Comprehensively consider the impact of different parameters on airflow organization and pollutant emissions.
(3) In the case of reasonable airflow organization, it is also necessary to meet the comfort level of personnel.

2. Research Object Description

2.1. Ventilation System and Hospital Bed Layout

Under the objective condition of an extremely short construction period, what kind of fast, effective and reliable ventilation scheme should be adopted to dilute the polluted air in the area where the personnel are located and meet the requirements for the comfort of the personnel.
According to the requirements of functional departments, users and relevant specifications, the reconstruction of Fangcang shelter hospitals should achieve the following objectives:
(1) The transformed Fangcang shelter hospital can ensure the health of medical staff, staff and patients, and prevent the spread of viruses in the contaminated area to the surrounding environment; (2) as the time for transformation is very short, the transformation of ventilation and air conditioning should be based on the current situation, and the equipment and materials to be transformed should be existing; (3) the Fangcang shelter hospital can quickly and simply restore its original functions after use [3].
Before the transformation of the university gymnasium in Shanghai, natural ventilation was used, with smoke exhaust windows on both sides, and a central air-conditioning top-air supply was used in several small rooms on the west side. As the school is located in a coastal city, the wind is strong all year round and the ventilation effect is good. In the design specifications of the ventilation system in infectious disease wards, it is usually recommended to use a fresh air system with an upper supply and lower return air [33]. The original ventilation system failed to create an effective negative pressure in the gymnasium, and the airflow organization was unreasonable in the discharge of pollutants, which may cause cross-infection among personnel. Additionally, due to the high temperature in summer, the comfort of personnel is poor, so a new ventilation system needs to be established.
Under the special circumstances of demanding time and materials, the cloth bag air duct system that is easy to install and disassemble is adopted. This refers to a flexible air distribution system that is mainly woven by special fiber materials. It mainly adopts the air outlet mode of fiber penetration and an orifice jet, which can provide a uniform linear air supply. The cloth bag air duct air supply system has the following advantages: (1) Reduce the load on the roof. (2) Simple installation and short construction period. (3) High comfort. (4) Easy to clean. (5) Anti condensation. (6) The system has low-cost and high-cost performance.
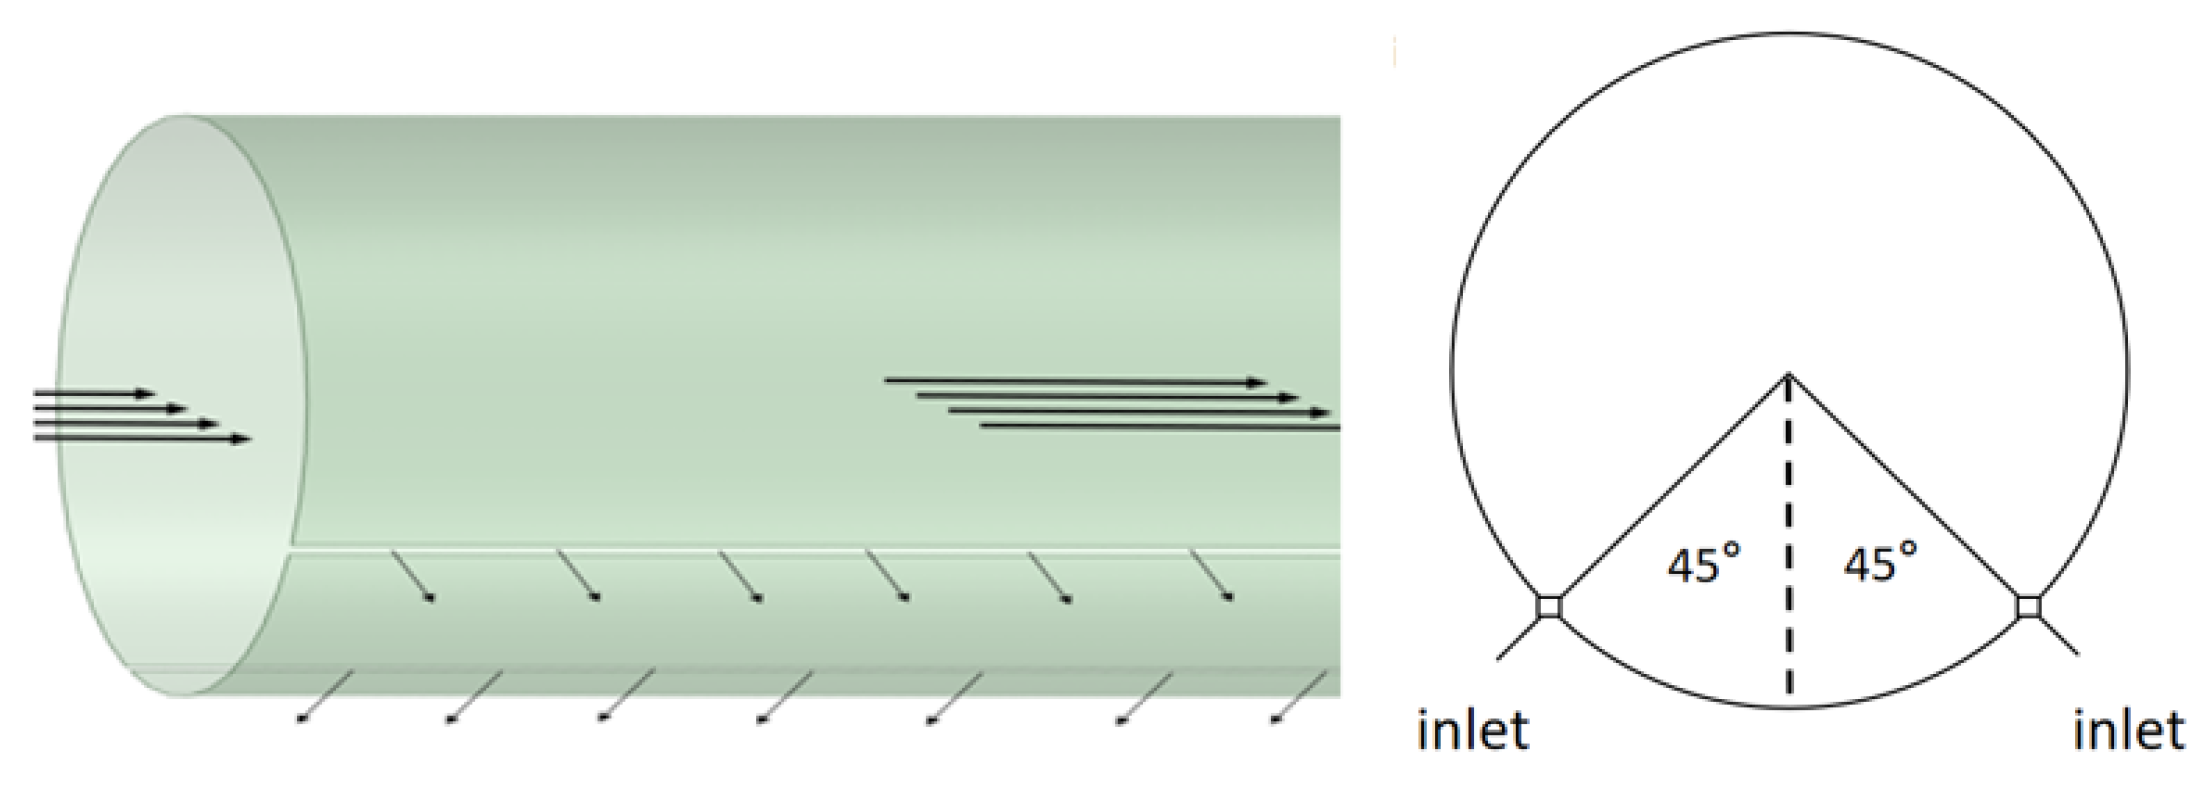
To sum up, it is proposed to use the cloth bag air duct system in the reconstruction. The west air supply system will be modified and extended into 5 longitudinal metal air ducts passing through the top center of the second floor of the gymnasium. The strips on both sides of the air ducts will supply air at a downward angle of 45°, which will be used as the fresh air inlet. Exhaust outlets will be set at the bottom of both sides, and mechanical fans will be used for auxiliary ventilation. According to the design guidelines in China for emergency medical buildings, the air outlet in the pollution area should be set as close to the pollution source as possible. Except that the patient receiving area uses the original system in a large space for ventilation, the height of the lower edge of the indoor air outlet of the new air exhaust system from the ground should not be higher than 2 m. The air exhaust volume in the patient receiving area is calculated as 150 m3/h per bed, and the air outlet is installed with an efficient filter. As the gymnasium is a lightly polluted area, the restricted area and clean area are designed outside the Fangcang shelter hospital. It is only necessary to maintain negative pressure in the shelter as a whole, to prevent polluted air in the Fangcang shelter hospital from leaking into the restricted area and clean area. Therefore, the interior layout of the entire gymnasium reconstruction shelter does not consider the traditional three-zone and two-channel renovation.
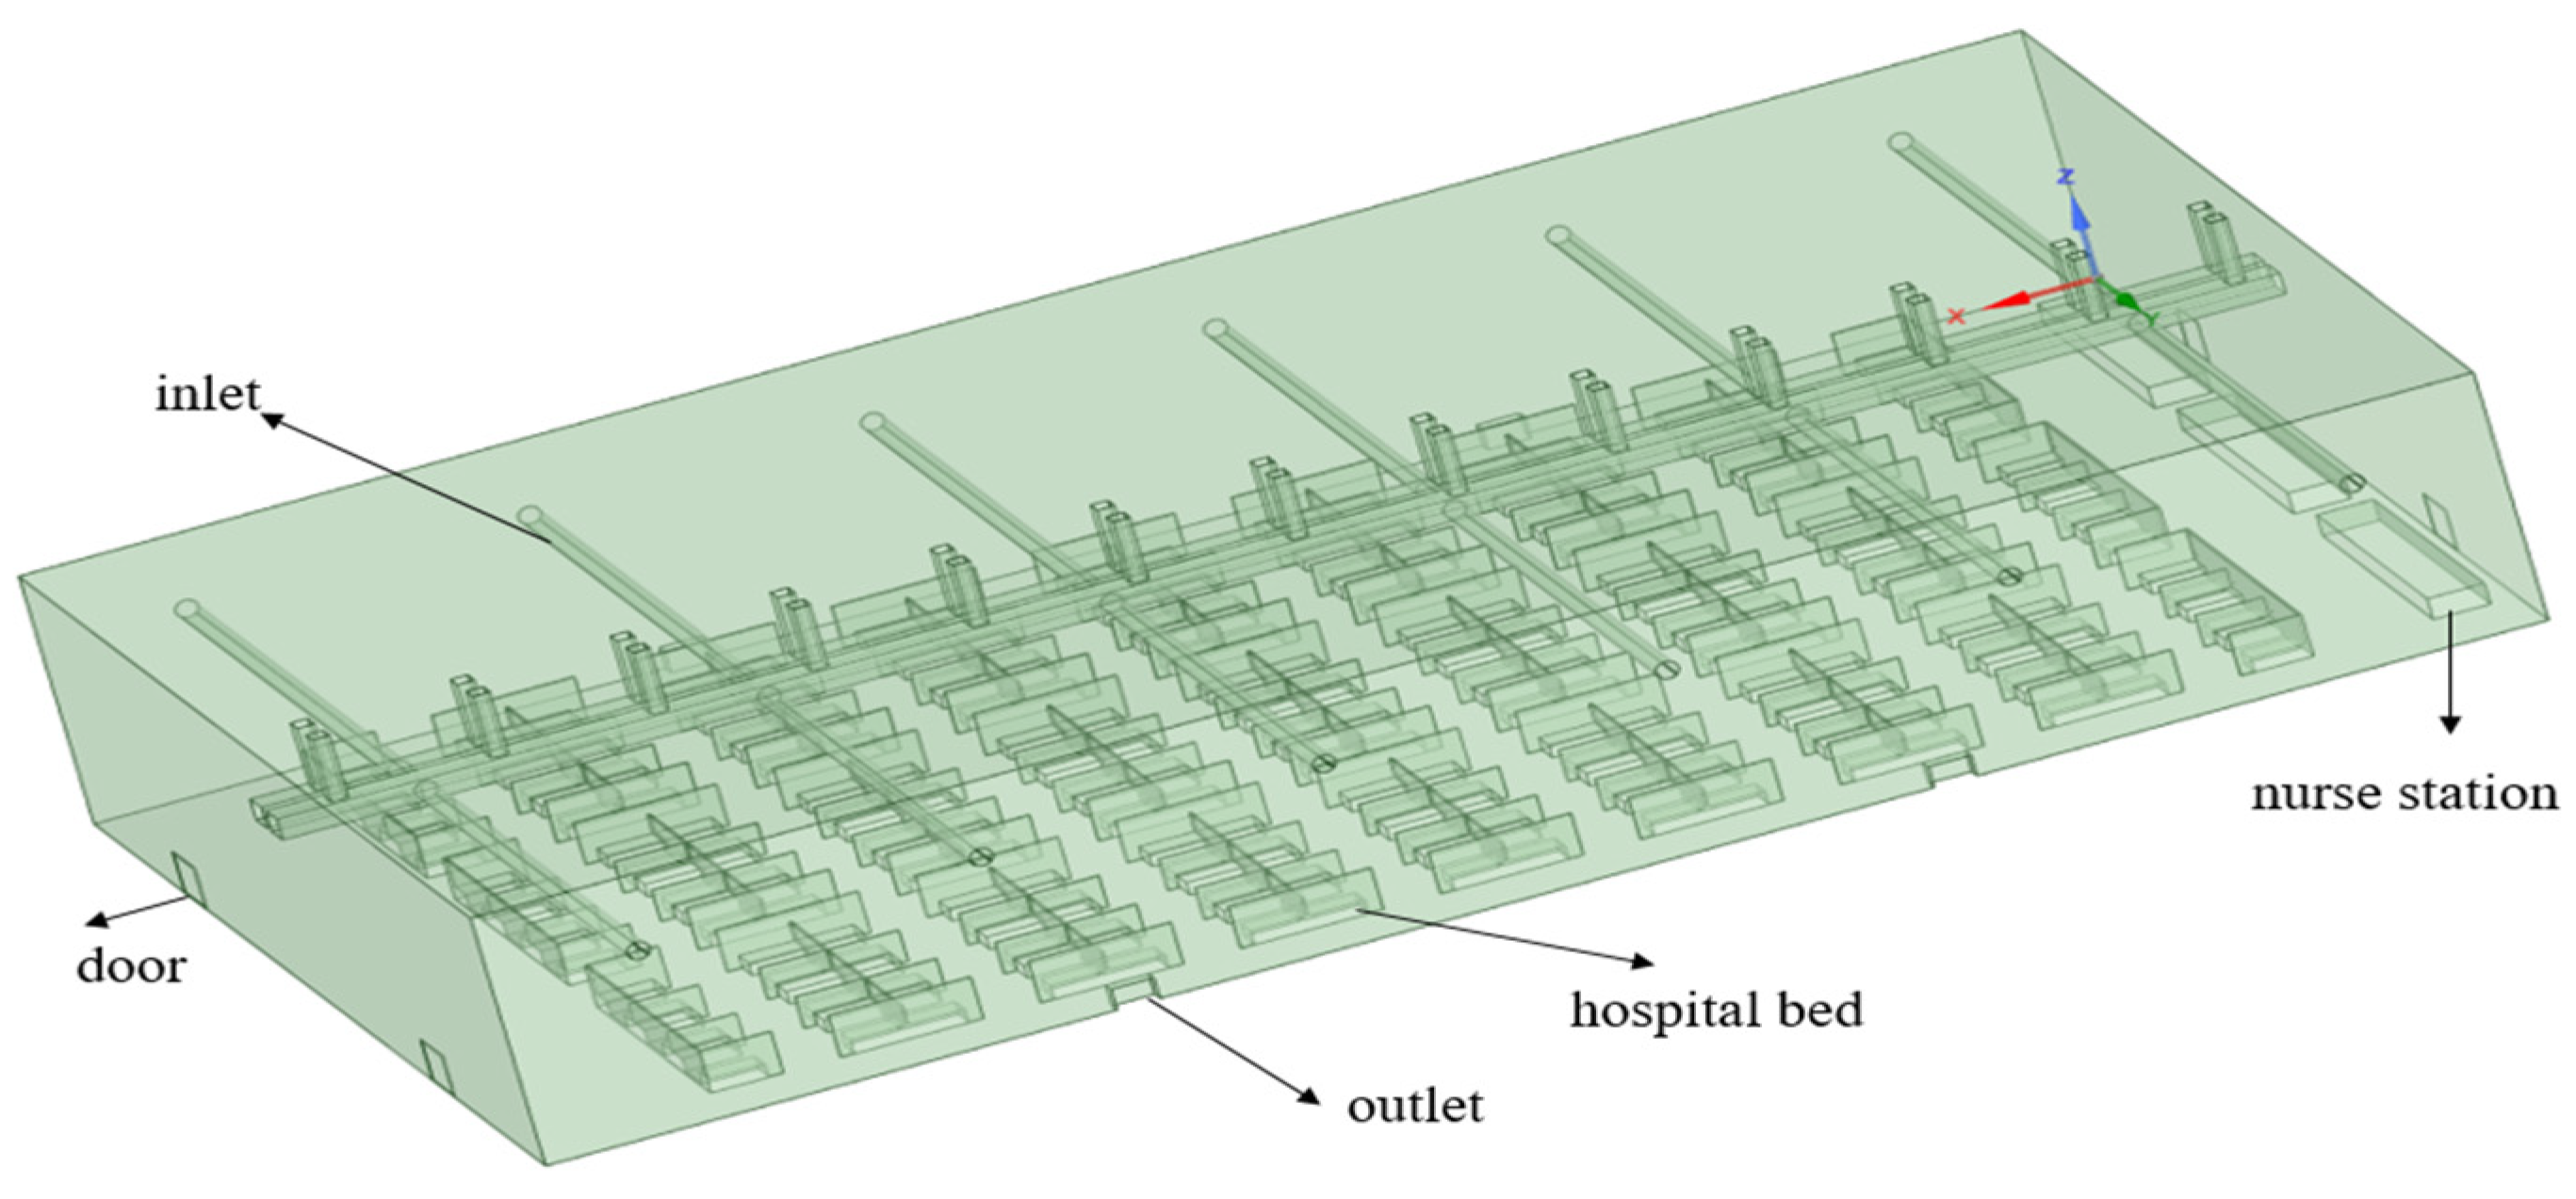
The second floor space of the gymnasium with a size of 70.1 m × 40.8 m × 10 m is divided into a hospital bed area, a nurse station and a passage area. Referring to the Fangcang shelter hospital recently renovated by the Shanghai New International Expo Center, the hospital beds are divided into 3 sections, each corresponding to 1 nurse station, each bed area has 12 × 8 beds, and a passageway of 2.5 m is left between the bed areas. Each ward is separated by a partition, and the height of the outer partition is 2 m. The site is 2860.08 m2 in total, with 288 beds and a per capita living area of 9.5 m2. The size of the single bed adopts the size of a temporary single bed of 1.95 m × 0.9 m × 0.6 m, and the nurse station occupies an area of 10 m × 2 m.

2.2. Physical Model

Using Space Claim software, a model based on the 1:1 scale of the proposed Fangcang shelter hospital on the second floor of the sports hall was established, as shown in Figure 2.
The bag air duct is installed by lifting, and a row of air inlets is arranged on both sides of the duct in a 45° downward direction, equivalent to two 15 mm wide slits. The bag air duct supply system model is shown in Figure 3.
The dimensions of each part of the model are shown in Table 1.
Because the simulated gymnasium has a large geometric space, many air supplies and exhaust outlets, and the sizes of the air supply and exhaust outlets are smaller than that of the entire gymnasium, the difference between the maximum and minimum geometric dimensions is huge, which would inevitably lead to the establishment of too-dense mesh during simulation. Too-dense mesh often leads to difficulty in fast implementation of the calculation, and even difficulty in the convergence of results. Therefore, in combination with the structural symmetry of the exhibition hall, the east–west center is the axis of symmetry, and half of the space is taken as the simulation object. This can not only ensure the accuracy and reliability of the simulation experiment, but also allow the whole simulation process to become efficient and fast.
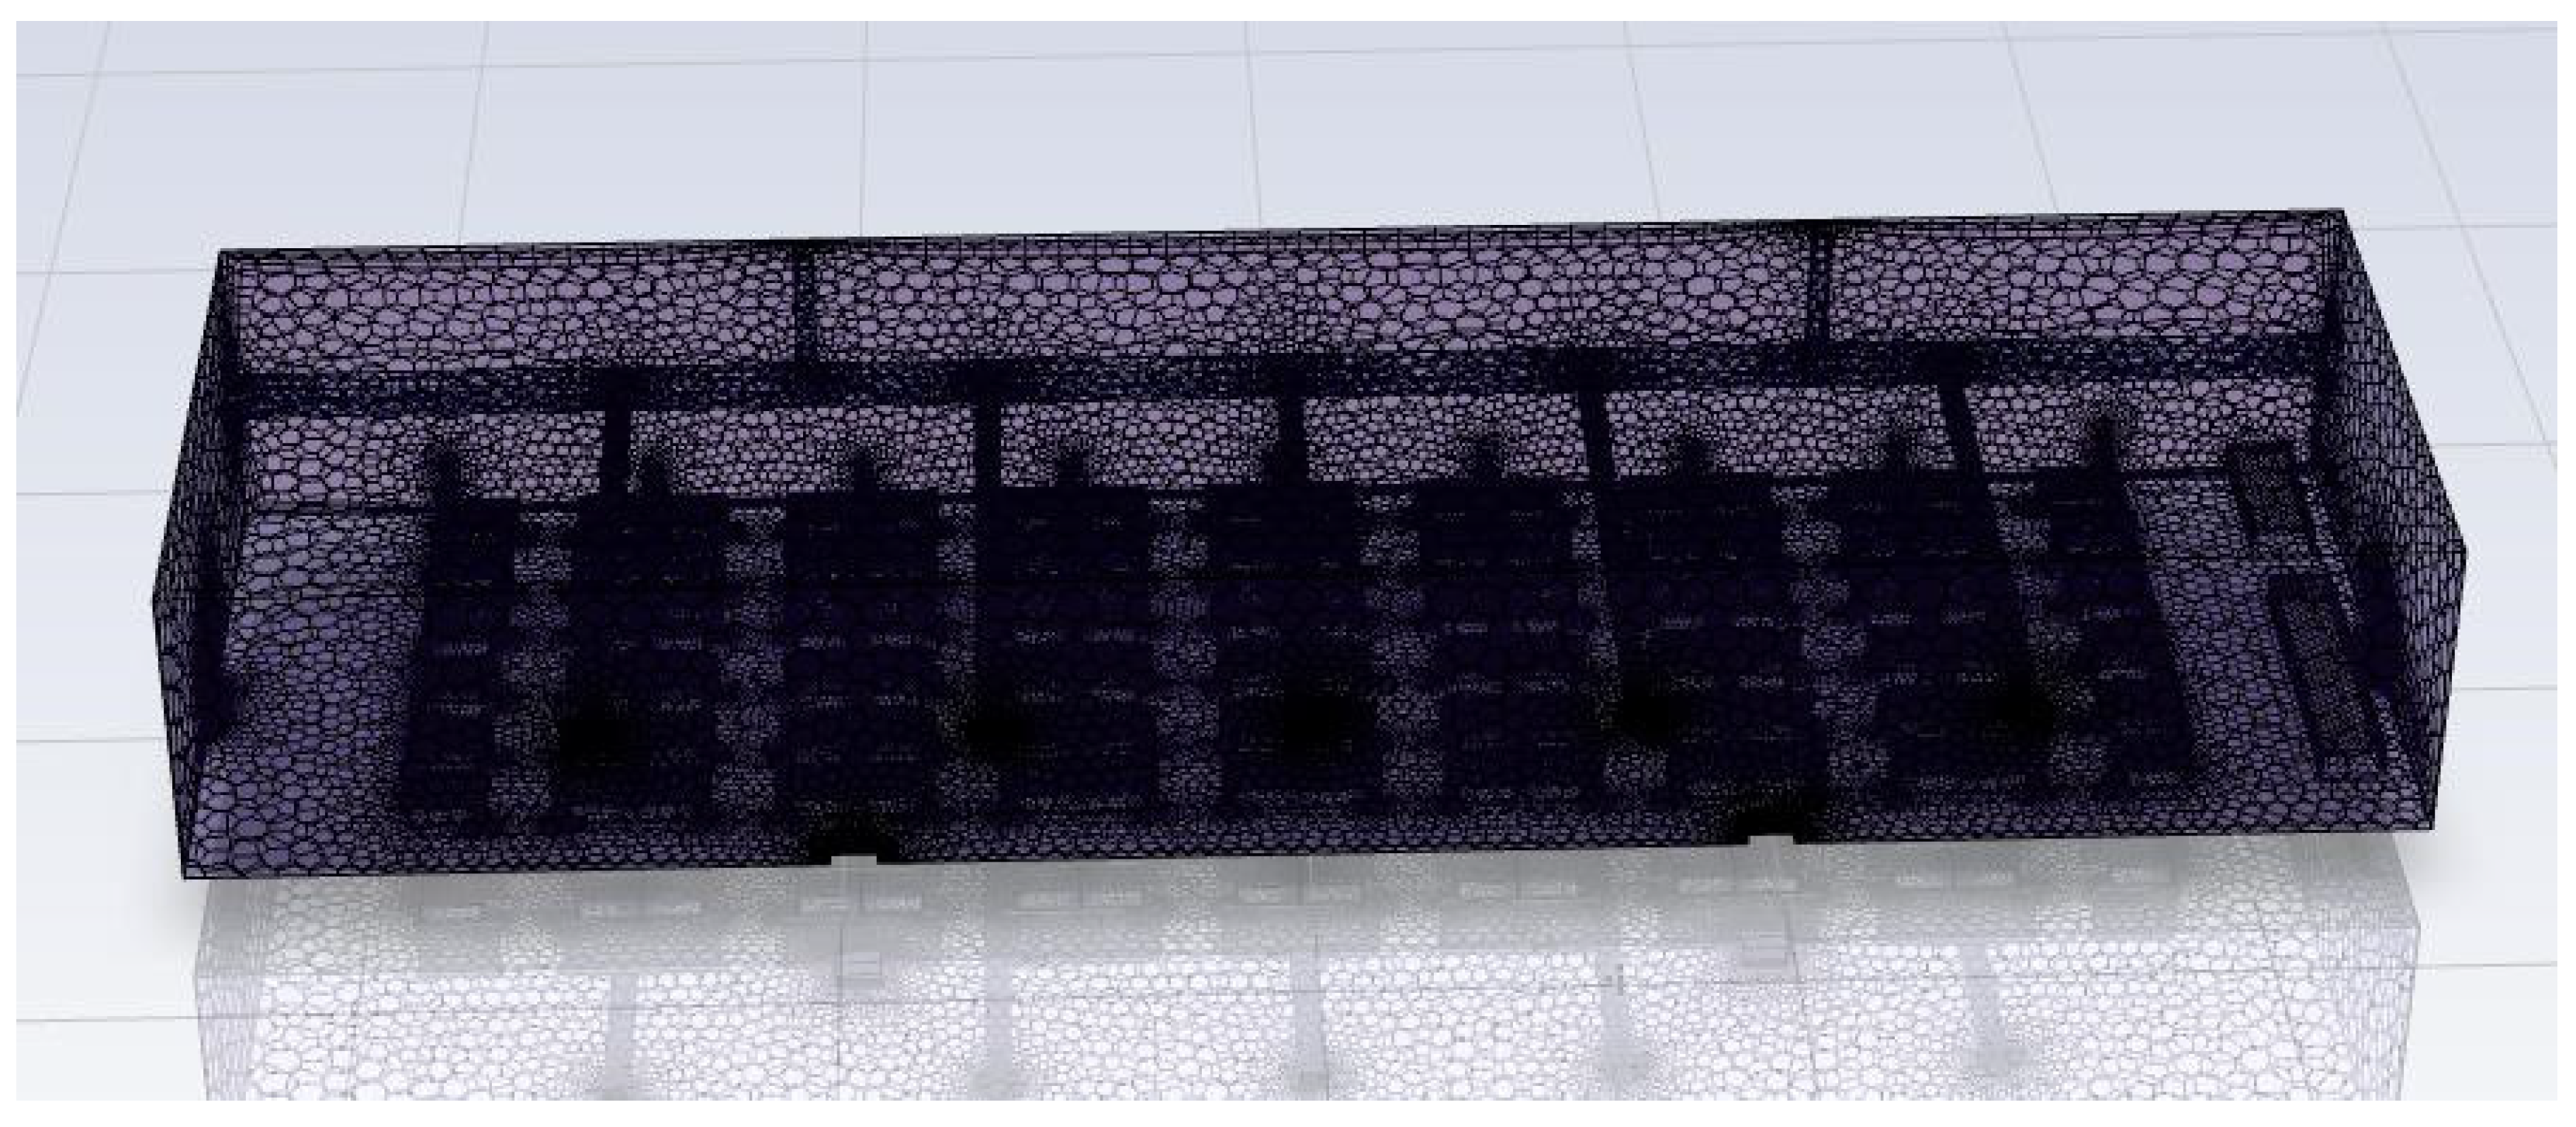
2.3. Meshing

Importing the physical model into Meshing for mesh generation, the Poly Hexcore volume mesh-generation method was used. The Poly Hexcore volume mesh-generation method based on mosaic technology can ensure the hexahedron mesh and the polyhedron mesh realize the common node connection, and compared with the traditional hexahedron mesh generation, it does not need any additional manual mesh settings. It can not only ensure the complete automation of the work, but also increase the number of hexahedrons in the mesh, thus improving the efficiency and accuracy of the solution. The air inlet, air outlet, door seam and bed are partially densified, and the rest are thinned. Finally, the mesh was obtained as shown in Figure 4.
In order to exclude the influence of the number of meshes on the calculation results, it is necessary to perform independence verification on the meshes. The average temperature of the horizontal plane at heights of 1.65 m (Plane 1) and 0.65 m (Plane 2) above the ground under the same scheme was calculated. Table 2 shows the calculation results for different meshes.
From the table, it can be seen that there is a certain gap in the data results when the number of meshes is 2.84 million and 3.03 million, respectively; when the number of meshes is 3.04 million and 3.26 million, the data results are similar. Therefore, 3.04 million meshes were selected for numerical simulation.

3. Simulation Model

3.1. Turbulence Model

Three methods are mostly used to solve turbulence problems by numerical simulation: direct numerical simulation (DNS), large eddy simulation (LES) and Reynolds time average equation method (RANS) [34]. For fully developed turbulence, there are many turbulence models. The standard k-ε Model (hereinafter referred to as the k-ε model) is based on the Reynolds time average method. It is the most widely used turbulent flow calculation mathematical model in the double-equation mathematical model, and it is also a model that has been proved successful in practice [35,36]. Since 1974, many people have applied the k-ε model to simulate indoor airflow [37,38,39], and existing research has also proved that the k-ε turbulence model is more suitable for solving the indoor ventilation airflow organization problem [40,41,42]. The k-ε turbulence model includes the standard k-ε model, the RNG k-ε models and the Realizable k-ε model [34].
The standard k-ε model is an empirical model that can be used to predict the propagation velocity of free shear flow, wake flow calculation, mixing layer calculation and wall bound flow. Because a low Reynolds number, compressibility and shear flow propagation are considered, the model has greater accuracy and reliability in simulating free shear flow [43].
Considering the airflow characteristics in such a large space as a gymnasium, the standard k-ε as the model of numerical simulation, the continuity equation, energy and momentum equation, the k-ε equation and eddy viscosity coefficient are the control equations, which simulate and analyze the temperature field and velocity field in the proposed temporary Fangcang shelter hospital [44].

3.2. Mathematical Model

Steady flow, ideal gas, establish mathematical model [40]:
(1) Mass conservation equation
The mass conservation equation, also known as the continuity equation, refers to that the increase in fluid mass in the micro element is equal to the net mass flowing into the micro element. The differential form of the mass conservation equation in the rectangular coordinate system is as follows:
ρ t + ( ρ u ) x + ( ρ v ) y + ( ρ w ) z = 0
where, ρ —fluid density (kg/m3); u , v , w —velocity components of velocity vector U in the x , y , z directions of the three coordinates (m/s); t —time (s).
(2) Momentum conservation equation
The momentum conservation equation refers to that the increase in fluid momentum in the micro element is equal to the sum of various forces acting on the micro element. The momentum conservation equation in the steady-state process is generally expressed in the rectangular coordinate system as follows:
ρ F x ρ x + x ( μ u x ) + y ( μ u y ) + z ( μ u z ) + x [ μ 3 ( u x + v y + w z ) ] = 0 ρ F y ρ y + x ( μ v x ) + y ( μ v y ) + z ( μ v z ) + y [ μ 3 ( u x + v y + w z ) ] = 0 ρ F z ρ z + x ( μ w x ) + y ( μ w y ) + z ( μ w z ) + x [ μ 3 ( u x + v y + w z ) ] = 0
where, μ —hydrodynamic viscosity coefficient ( Pa · s ); F —force acting on fluid element on control surface ( kg · m / s ).
(3) Energy conservation equation
The energy conservation equation refers to that the increase in thermodynamic energy in the micro element is equal to the net heat flow entering the micro element plus the work done by the volume force and surface force on the micro element. The steady-state energy conservation equation is expressed as follows in the rectangular coordinate system:
x ( λ t x ) + y ( λ t y ) + z ( λ t z ) + s T = 0
where, λ —thermal conductivity ( W / ( m · ° C ) ); t—temperature ( ° C ); s T —heat generated by internal heat source ( W / m 3 ).
(4) Turbulence equation
According to the previous analysis, the subject adopts the standard k-ε double-equation model:
t ( ρ k ) + x i [ ρ k u i ] = x i [ ( μ + u t σ k ) k x j ] + G k + G b + ρ
t ( ρ ε ) + x i [ ρ ε u i ] = x j [ ( μ + u t σ ε ) ε x j ] + G 1 ε ε k ( G k + G 3 ε G b ) + G 2 ε ρ ε 2 k
where, k —turbulent pulsation kinetic energy ( J ); ε —Turbulence fluctuation kinetic energy dissipation rate (%); u t —turbulence velocity (m/s); σ k ,   σ ε k equation and ε Turbulence coefficient of the equation, taken as 1.0 and 1.3 respectively; G k , G b —turbulent kinetic energy generation term caused by average velocity gradient and buoyancy ( J ); G 1 ε , G 2 ε , G 3 ε —The empirical coefficients are 1.44, 1.92 and 1.44 respectively.
(5) Component transport equation
In order to meet the conditions for simulating pollutant diffusion, it is necessary to introduce the component transport equation:
( ρ u C s ) x + ( ρ v C s ) y + ( ρ w C s ) z = x ( D s ( ρ C s ) x ) + y ( D s ( ρ C s ) y ) + z ( D s ( ρ C s ) z )
where, C s —volume concentration of component s ( ppm ); D s —diffusion coefficient of component s.

3.3. Boundary Conditions

First, the inlet and exhaust volume should be determined. The area of the air outlet is 6 m2, and the area of the air inlet is 5.76 m2. According to the air exhaust volume of 150 m3/h for each bed in the patient admission area, 288 beds and 3 nurse stations are equivalent to 300 beds, and the air exhaust volume can be 45,000 m3/h. Due to the use of all fresh air systems and the requirement of stable negative pressure in the indoor environment, ref. [45] shows that the negative pressure can be formed when the inlet air volume of the better-sealed large-space building is 60~90% of the exhaust air volume. Therefore, the inlet air volume is 80% of the exhaust air volume, and the inlet air volume is 36,000 m3/h. The air velocity at the exhaust air outlet is 2.1 m/s and the air velocity at the inlet air outlet is 1.74 m/s calculated by Equation (7).
Air supply velocity formula:
v = V 3600 × A
where, v —air supply velocity ( m / s ); V —air supply volume ( m 3 / h ); A —air supply area ( m 2 ).
According to the above equations, the air velocity at the exhaust outlet is 2.1 m/s and the air velocity at the air inlet is 1.74 m/s under 150 m3/h exhaust air volume of a single bed; the air velocity at the air outlet and the air inlet of a single bed is 2.8 m/s and 2.3 m/s, respectively, under 200 m3/h of exhaust air volume; the air velocity at the air outlet is 3.5 m/s and the air velocity at the air inlet is 2.9 m/s under the 250 m3/h air exhaust volume of a single bed. Next, the boundary condition setting was carried out, with the 75 W heat dissipation of adult men at 25 °C as the standard, the heat dissipation of personnel is equivalent to the constant heat flow boundary condition of 7.8 W/m2 of the hospital bed and the outdoor air temperature is 35 °C, as shown in Table 3.
The main influencing factors of indoor airflow organization are air supply speed, air supply height, air supply angle, air supply temperature and other factors. The study in [46] shows that air supply speed and air supply temperature difference have strong influence, while air supply height, air supply angle and air supply outlet specifications have weak influence.
In this paper, considering the air flow organization and pollutant emission, single bed exhaust air volume (air supply speed) and air supply temperature difference are selected as the main influencing factors. Considering the influence of thermal stratification on pollutant emission, air supply height is selected as the secondary influencing factor. Finally, the variable parameters are set as follows: the hoisting height is 4, 4.5, and 5 m, the air supply temperature is 16, 18, and 20 °C, and the exhaust air volume of a single bed is 150, 200, and 250 m3/h. The optimal parameters are discussed and optimized by the control variable method.

4. Results and Discussion

4.1. Analysis of the Influence of the Lifting Height of the Air Inlet

In this part, the control variable method is adopted to compare the influence of different parameters. Firstly, the influence of the air supply temperature and air supply volume of single bed were analyzed. The air supply temperature was set as 18 °C and the air supply volume of single bed as 150 m3/h (that is, the exhaust speed is 2.1 m/s, and the air inlet speed is 1.74 m/s). These two parameters remain unchanged. The three schemes for lifting heights of 4, 4.5 and 5 m are simulated as shown in Table 4.
Figure 5, Figure 6 and Figure 7 show the simulation diagram of velocity distribution at the section of 1.65 m at the personnel activity height of Schemes 1 to 3.
It can be seen from the above figures that the wind speed inside the whole Fangcang shelter hospital is mostly between 0.07 and 0.4 in Scheme 1, 2 and 3 at the height of 1.65 m. As the indoor wind speed reaches 0.3 m/s in summer, it will affect people’s comfort and give people a sense of blowing. For Scheme 1, the wind speed in several places in the patient’s area reaches more than 0.3 m/s, causing the patient an uncomfortable feeling of blowing. For Scheme 3, the wind speed in many areas of the patient area is too low, and the fresh air cannot reach the patient area effectively, which makes the air circulation worse and is harmful to the patient’s health. Therefore, the speed distribution of Scheme 2 is the most uniform and reasonable according to the data analysis.
Figure 8, Figure 9 and Figure 10 show the simulation diagram of temperature distribution at the section of 0.65 m at the rest height of the personnel in Scheme 1 to 3.
Since the air supply outlet of the bag air supply duct is 45° from the openings on both sides, when the air supply height of Scheme 1 is 4 m, the fresh air distribution is uneven, and the temperature directly below the whole air supply inlet is significantly higher than that of other places. In addition, due to the existence of baffles, cold air accumulation occurs at the 45° angle on both sides of the air inlet, and the uneven temperature distribution environment is adverse to the health of patients. In Scheme 3, the minimum temperature of the patient area is 25.4 °C, the maximum temperature is 29.1 °C and the average temperature is 27.4 °C. The local maximum temperature is mostly found in the corner of the aisle wall, which affects the daily work of medical staff and the local high temperature is easy to cause the accumulation of pollutants. In Scheme 2, the minimum temperature in the patient area is 25.1 °C, the maximum temperature is 27.7 °C, and the average temperature is 26.1 °C. The overall indoor temperature distribution is uniform.
To sum up, Scheme 1 will give patients a greater sense of blowing when the personnel’s activity height is 1.65 m, and will cause uneven temperature distribution in the patient’s area as a whole when the personnel’s rest height is 0.65 m, and cold air will gather in the area where the air outlet blows directly. For Scheme 3, the wind speed in many parts of the patient’s area is too low when the height of personnel activity is 1.65 m, which is not conducive to air circulation. In addition, when the patient’s rest height is 0.65 m, local high temperature is generated in the corner of the aisle wall, which is not conducive to the health of patients and medical staff. Therefore, Scheme 2 is obtained, which is more appropriate when the hoisting height is 4.5 m.

4.2. Analysis of the Influence of Air Supply Temperature on Airflow Organization

4.2.1. Evaluation Index of Thermal Comfort

(1) Predicted mean thermal comfort (PMV)
Professor Fanger of Denmark and his colleagues obtained the PMV thermal comfort model on the basis of experimental research data and conclusions [47]. The model integrates six factors that affect human thermal comfort, namely human metabolic rate, clothing thermal resistance, air-dry bulb humidity, average ambient radiation temperature, wind speed and air humidity. The PMV index is the most comprehensive thermal environment evaluation index at present. The specific calculation method is shown in Formula (8).
P M V = ( 0.303 e 0.036 M + 0.028 ) { ( M W ) 3.05 × 10 3 [ 5733 6.99 ( M W ) P a ]   0.42 [ ( M W ) 58.15 ] 1.7 × 10 5 M ( 5867 P a )   0.0014 M ( 34 t a ) 3.9610 8 [ ( t c l + 273 ) 4 ( t r ¯ + 273 ) 4 ] f c l h c ( t c l t a )
where, M —human energy metabolic rate, W / m 2 ; W —mechanical work done by human body, W / m 2 ; t a —air temperature around human body, ° C ; P a —partial pressure of water vapor in the air around the human body, Pa ; f c l —dressing area coefficient; t c l —clothing surface temperature, ° C ; t r ¯ —average radiation temperature, ° C .
The PMV values corresponding to the seven thermal sensations are shown in Table 5 below:
(2) Predicted percent dissatisfaction (PPD)
Predicted percent dissatisfaction is an evaluation indicator of dissatisfaction with the indoor environment, which refers to the ratio between the percentage of people dissatisfied with the thermal environment and the predicted average voting. The calculation formula is as follows:
P P D = 100 95 exp { [ 0.03353 ( P M V ) 4 + 0.2179 ( P M V ) 2 ] }
In the international standard ISO7730: 2005 [48], the regulations of indoor thermal environment standard on PMV-PPD index are proposed:
0.5 P M V 0.5 ,   P P D 10 %
Due to the economic factors of developing countries, the specified value can be expanded to:
0.75 P M V 0.75 ,   P P D 20 %
The thermal comfort levels are classified [48,49] and the classification results are shown in Table 6.

4.2.2. Simulation under Different Air Supply Temperature Parameters

After the lifting height is determined to be 4.5 m, the air supply volume of single bed continues to be set at 150 m3/h, and the air distribution of three plans is simulated as shown in Table 7 when the air supply temperature is 16, 18 and 20 °C.
Figure 11, Figure 12 and Figure 13 show the simulation diagram of temperature distribution at the section of 1.65 m at the personnel activity height of Schemes 4–6.
The temperature distributions at the height of 1.65 m are presented directly in the above figures. As we can see in Figure 11, when the air supply temperature is set at 16 °C in Scheme 4, the minimum ambient temperature in the hospital bed area is 23.7 °C, the maximum temperature is 27 °C and the average temperature is 25.1 °C. When the air supply temperature is set as 18 °C in Scheme 5 as displayed in Figure 12, the minimum ambient temperature in the hospital bed area is 24.4 °C, the maximum temperature is 27.4 °C and the average temperature is 25.6 °C. In Scheme 6, when the air supply temperature is set at 20 °C, the minimum temperature of the hospital bed area is 25.3 °C, the maximum temperature is 28.1 °C, and the average temperature is 26.3 °C. The average temperatures of the three Schemes are obtained through simulation, and the optimal temperature parameters are determined through thermal comfort calculation and analysis.

4.2.3. Calculation and Analysis of Thermal Comfort under Proposed Air Supply Conditions

According to the temperature under each working condition simulated above, when the air supply speed is 1.74 m/s, the wind speed at the section of 1.65 m at the activity height is 0.25 m/s, and the air humidity is 50%. The average metabolic rate is taken as 75 W/m2 when walking and sitting. The typical thermal resistance of clothing is taken as 0.6 clo in summer, the standard atmospheric pressure is taken, and the wall temperature and human body temperature have little difference. The thermal comfort index at each air supply temperature was analyzed and compared, as shown in Table 8.
According to the analysis, when the air supply temperature is 16 or 18 °C, the comfort index of Class I is reached. Since the air supply temperature of the refrigeration air conditioner under full-load operation is 16 °C, 18 °C is selected on the premise of meeting thermal comfort to avoid increasing energy consumption when the air conditioner has been operating under full load. Therefore, it can be concluded that Scheme 5 is selected as the optimal air supply scheme.

4.3. Influence of Exhaust Air Volume on Pollutant Emission and Airflow Organization

4.3.1. Discharge Efficiency

The discharge efficiency is a steady index, which represents the ability of air supply to remove pollutants. The main factors affecting the pollutants’ discharge efficiency are the air distribution form, the location of pollution sources and emission characteristics. The calculation formula of pollutants’ discharge efficiency is as follows:
ε = C e C s C ¯ C s
where, ε —effluent discharge efficiency; C e —pollutant concentration at exhaust outlet (ppm); C s —pollutant concentration of air supply (ppm); C ¯ —indoor average pollutant concentration (ppm).

4.3.2. Influence of Exhaust Air Volume on Pollutant Concentration

The normal respiratory rate of the human body is about 0.2~0.3 m/s. In combination with the probability of the patient coughing (1.5~28.8 m/s) and sneezing (25~40 m/s) [50], the average respiratory rate of the patient is set to 1.5 m/s, and the emission source of human exhaled pollution is simplified to 50 mm × 50 mm equivalent velocity air vent. Radiation heat transfer is not considered in the simulation process, and the influence of infiltration wind is ignored. The human-exhaled pollutants are simplified as a CO2 model, and the volume fraction is set as 1. The physical parameters of CO2 at 25 °C are shown in Table 9 below.
According to the design guideline of a large-space building reconstruction Fangcang shelter hospital of China, the exhaust air volume of a single bed is 150 m3/h. There are 300 beds, so the total exhaust air volume is 45,000 m3/h with the exhaust air volume of 2.1 m/s. In order to ensure the principle of negative pressure, the intake air volume is 80% of the exhaust air volume, which is 36,000 m3/h and the intake air volume is 1.74 m/s.
Based on the single bed exhaust volume of 150 m3/h according to the design guideline, in order to study the impact of larger design exhaust volume on pollutant emission and airflow organization, the single bed exhaust volume was increased to 200 and 250 m3/h for simulation, and the influence of three different exhaust volume parameter schemes on pollutant concentration and air flow organization were analyzed, as shown in Table 10.
Figure 14, Figure 15, Figure 16, Figure 17, Figure 18 and Figure 19 show the simulation diagrams of pollutant distribution at the section with a personnel activity height of 1.65 m for Schemes 7–9 and the simulation diagram of pollutant distribution at the exhaust outlet. Because medical staff and patients are in a non-resting state most of the time, only the pollutant concentration distribution at the 1.65 m section of the personnel activity is studied.
It can be seen from Figure 14 that the average pollutant concentration in the indoor area of Scheme 7 is 1.24 × 10⁻³, and when the pollutant volume fraction is 1, it is equivalent to an 806-time dilution of the pollutant. It can be seen from Figure 16 and Figure 18 that the average pollutant concentration in the indoor area is 1.18 under Scheme 8 × 10⁻³, equivalent to an 847-time dilution of the pollutants. In Scheme 9, the average pollutant concentration in the sickbed area is 1.11 × 10⁻³, equivalent to a 901-time dilution of pollutants. The discharge ventilation efficiency can be calculated by combining the data obtained from Figure 14, Figure 15, Figure 16, Figure 17, Figure 18 and Figure 19 with Formula (12), and the results are shown in Table 11.
Figure 20 shows the discharge ventilation efficiency changing with exhaust air volume.
It can be seen that when the exhaust air volume is 150 m3/h, the air environment in the whole area of the Fangcang shelter hospital has been significantly improved, the average pollutant concentration has been diluted about 806 times, and the ventilation efficiency is 69.9%. When the exhaust air volume increases from 150 m3/h to 200 m3/h, the ventilation efficiency increases by 0.5%. From 200 m3/h to 300 m3/h, the ventilation efficiency has been improved by 0.2%, but the ventilation efficiency has not been effectively improved, so it is concluded that there is no need to continue to increase the design of exhaust air volume under the original design standard.

4.3.3. Impact of Exhaust Air Volume on Indoor Velocity

The above simulation results show that increasing the exhaust air volume on the basis of 150 m3/h of single bed exhaust air volume has little impact on pollutant concentration dilution and ventilation efficiency. After studying the emission of pollutants, it is also necessary to consider the impact of airflow organization on the comfort of personnel, continue to simulate the velocity fields under the parameters of the above three schemes, and obtain the velocity distribution Figure 21, Figure 22 and Figure 23 of the three plans at the height of 1.65 m section.
Figure 21 shows the velocity distribution at the height of the 1.65 m section when the exhaust air volume is 150 m3/h in Scheme 7, and the indoor wind speed is mostly 0.07~0.3 m/s. For the long-term activity area of personnel, the human body has no obvious sense of blowing, and the comfort is high. From Figure 22 and Figure 23, we can see that when the exhaust air volume of Scheme 8 is 200 m3/h and that of Scheme 9 is 250 m3/h, the wind speed in several places in the room reaches above 0.3 m/s, which gives people an uncomfortable feeling of blowing. At the same time, combined with the previous analysis of temperature field and ventilation efficiency, when the emission is 150 m3/h, the comfort level I index has been met and the ventilation efficiency reaches 69%. Continuing to increase the exhaust air volume cannot effectively improve the ventilation efficiency, but it also causes an uncomfortable blowing feeling for patients, and increases the load of the mechanical exhaust fan, resulting in resource waste. Therefore, it is more reasonable to select 150 m3/h as the exhaust air volume of a single bed in Scheme 7.
Figure 23 is a vector diagram of the vertical plane of the Fangcang shelter hospital in Scheme 7.
From Figure 24a, it can be seen that the airflow direction meets the requirements of the upper air supply and lower air exhaust, and the airflow organization is reasonable. From Figure 24b, it can be seen that pollutants can be effectively discharged through mechanical exhaust vents under reasonable airflow organization

5. Conclusions

In this paper, Spaceclaim software is used to establish the model of the Fangcang shelter hospital and CFD software is used to simulate the internal airflow organization with different parameters. In order to improve the rationality of airflow organization in the Fangcang shelter hospital and ensure its internal environment meets human comfort while effectively discharging pollutants, the effects of different air supply heights, air supply temperatures and exhaust air volumes on the internal environment were studied. Through the above discussion, the following conclusions were obtained:
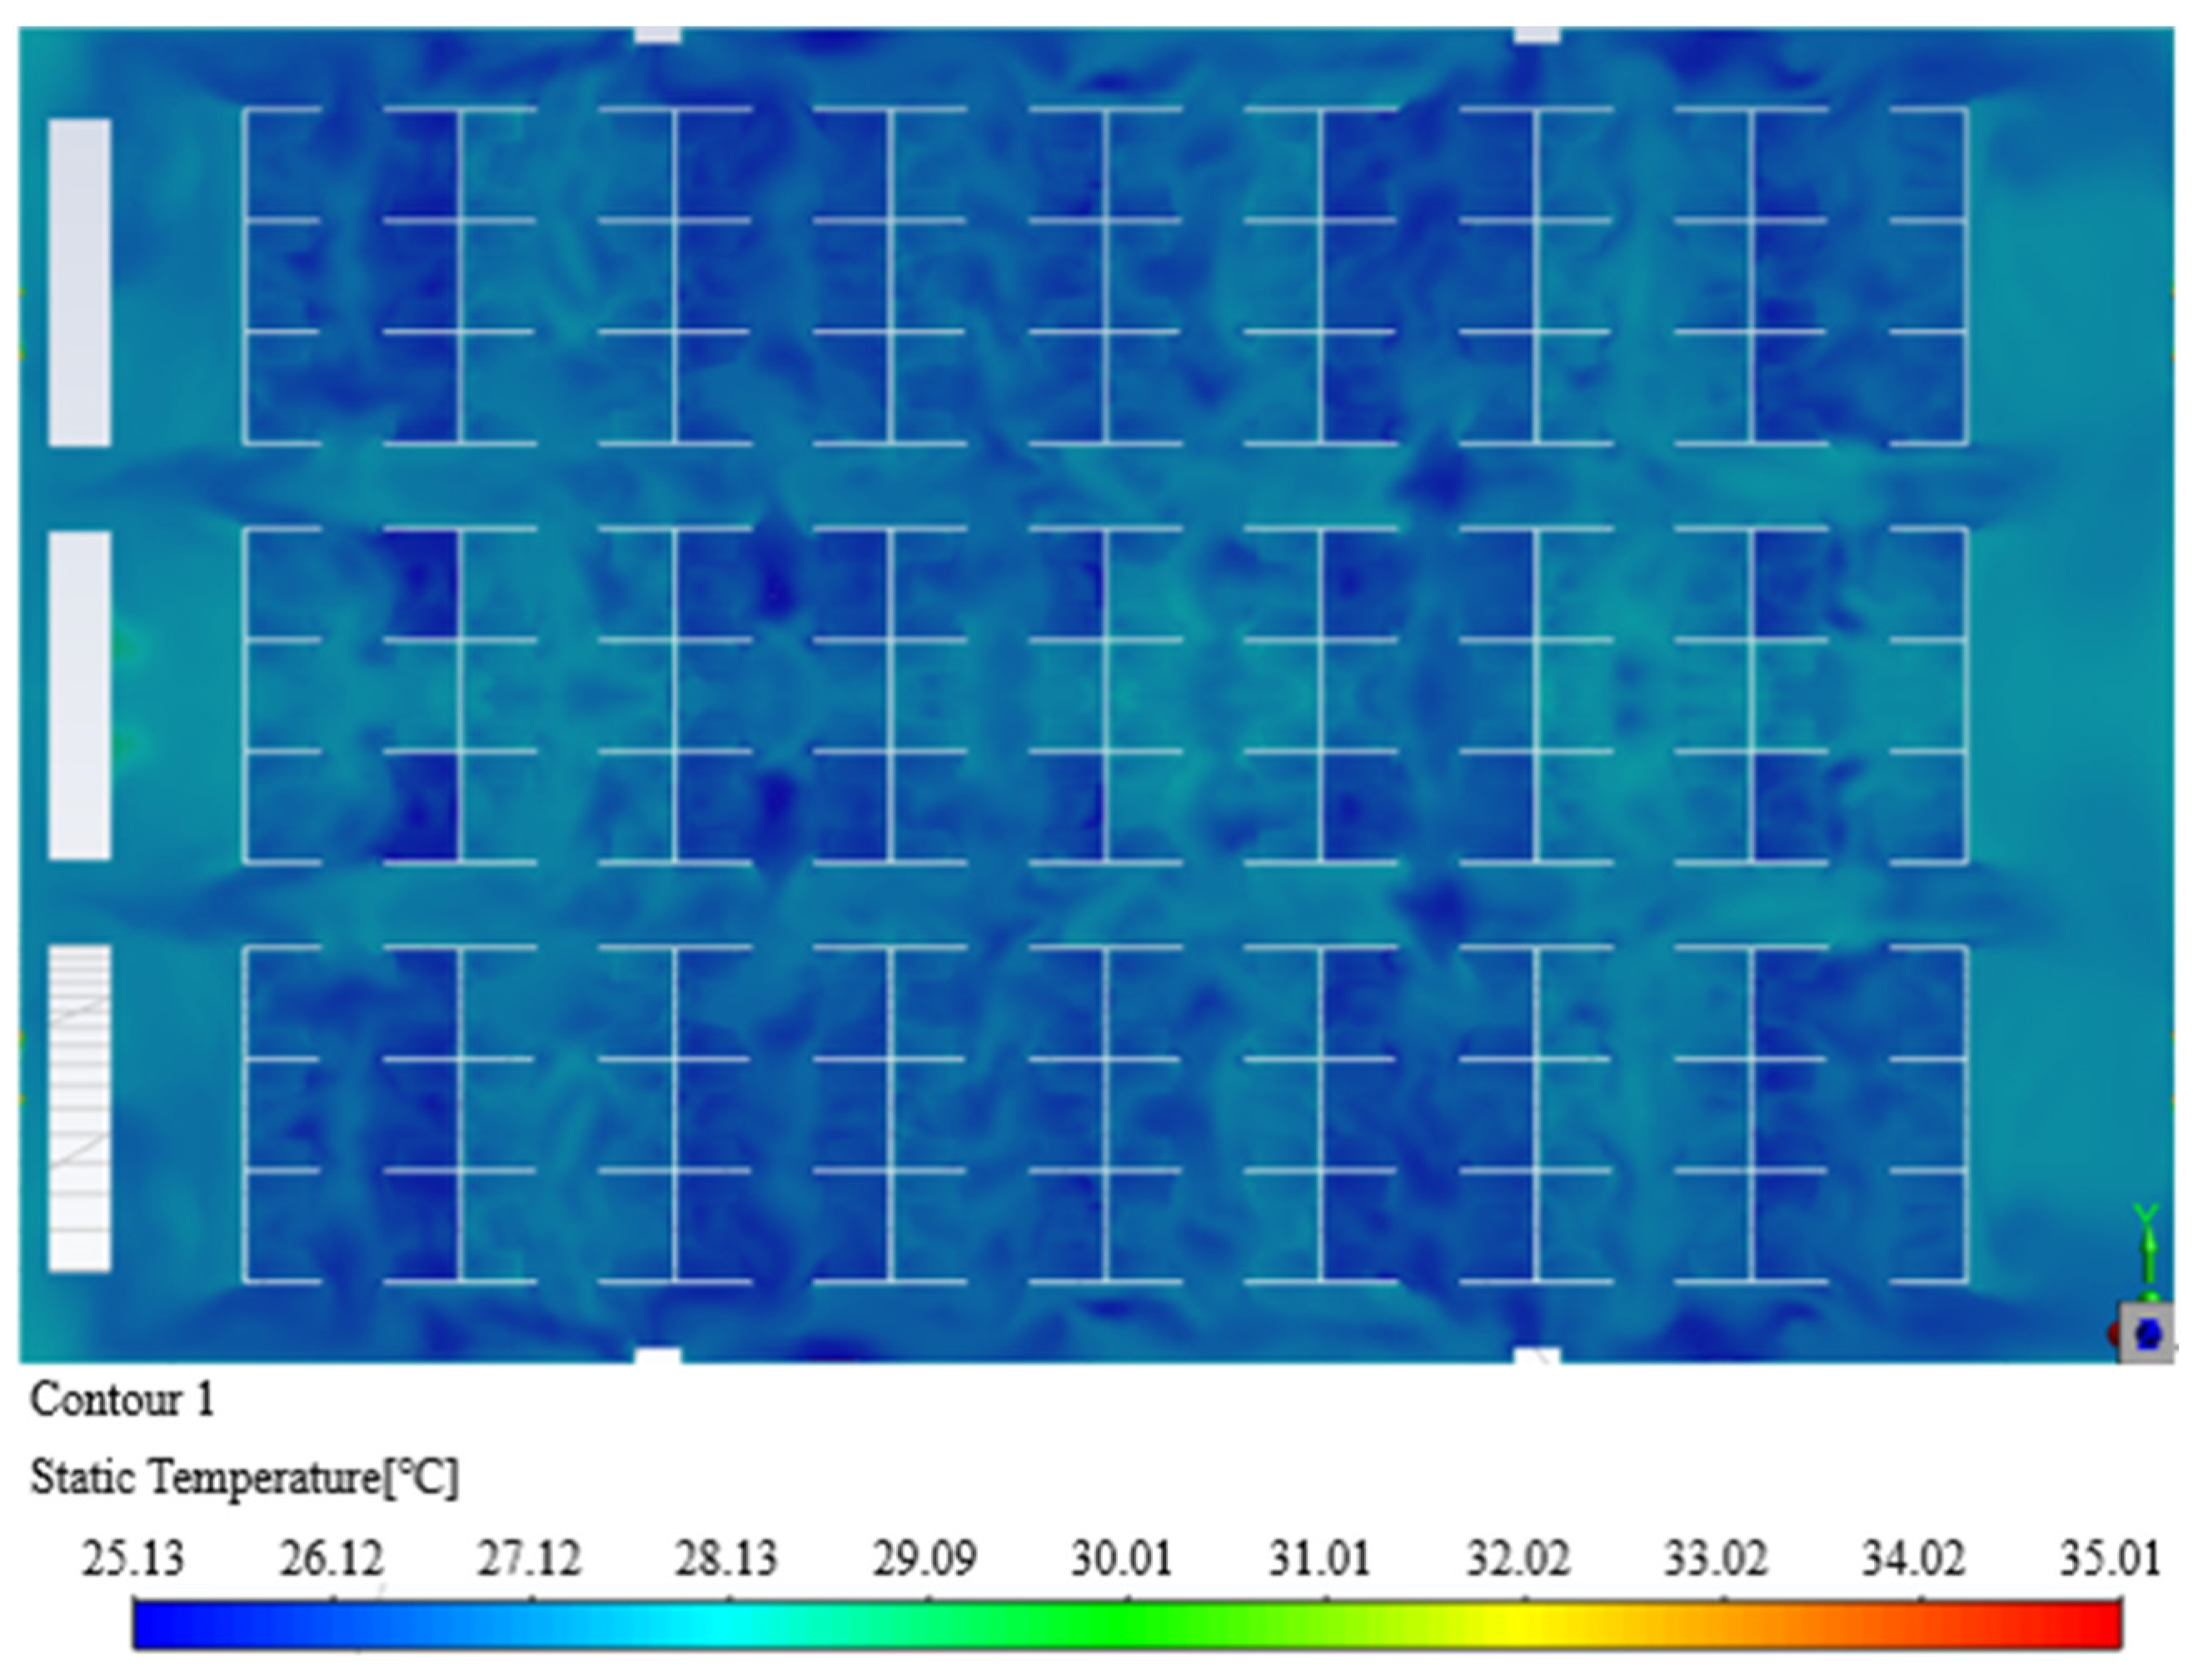
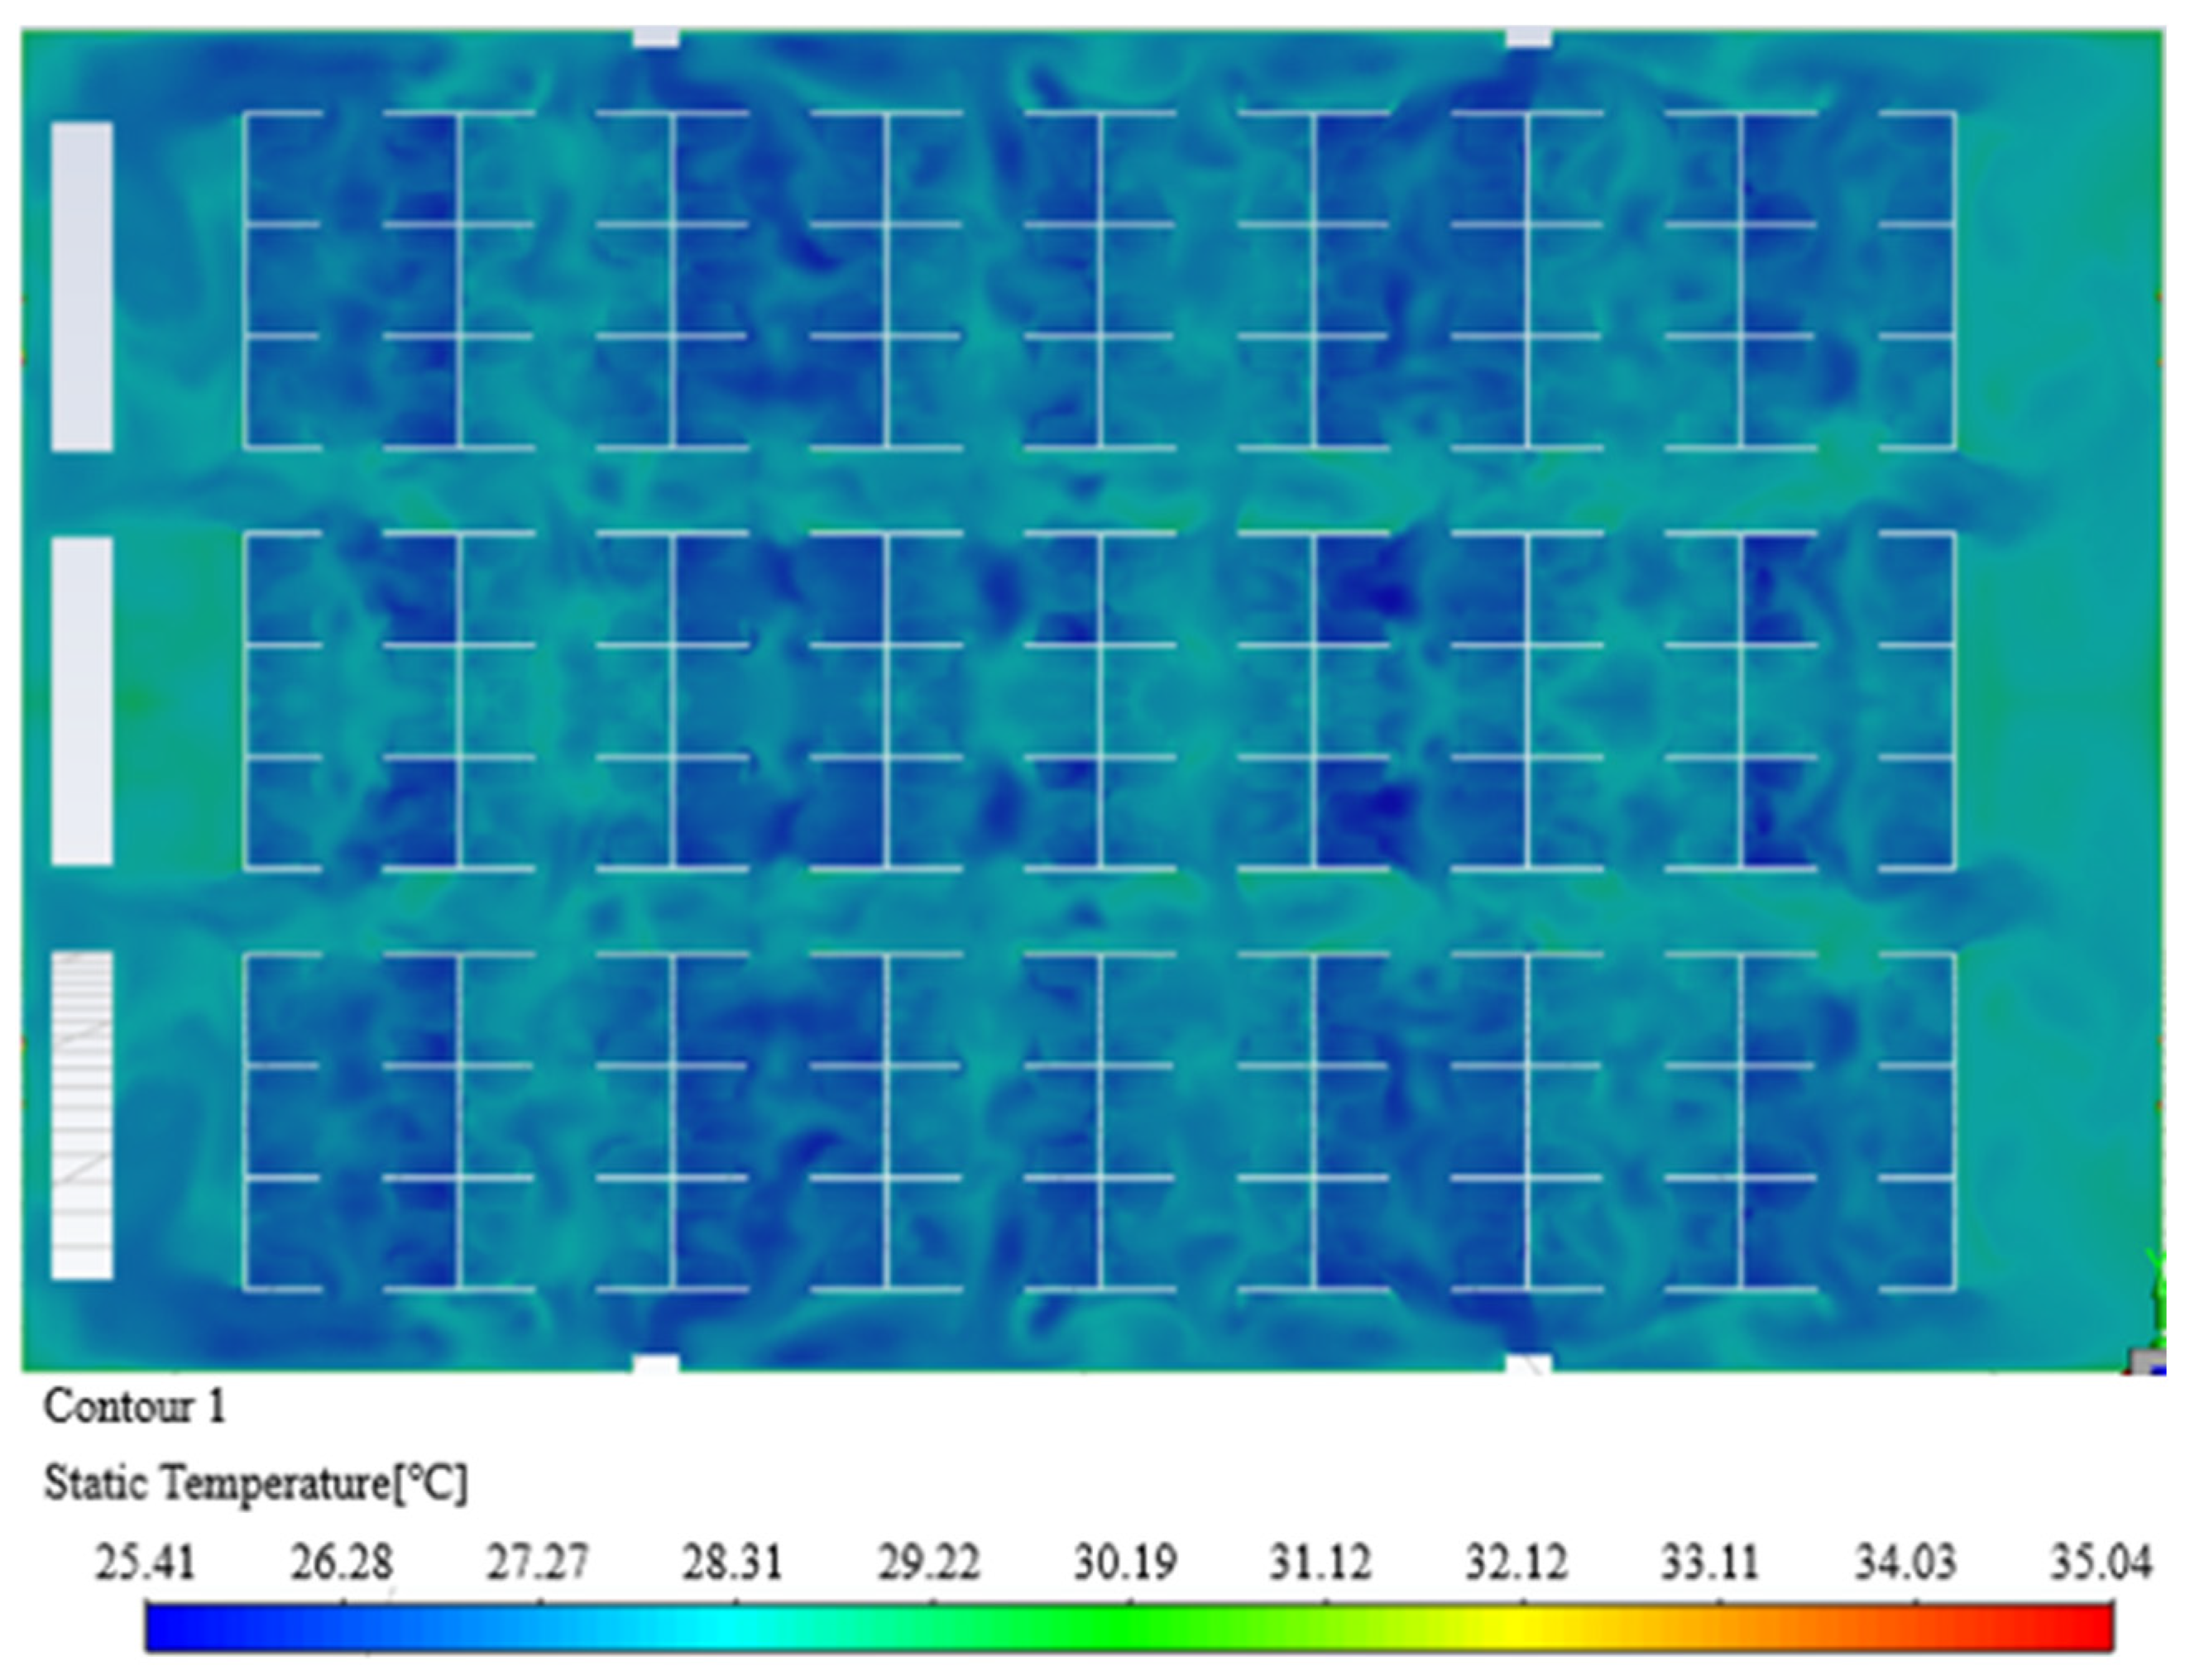
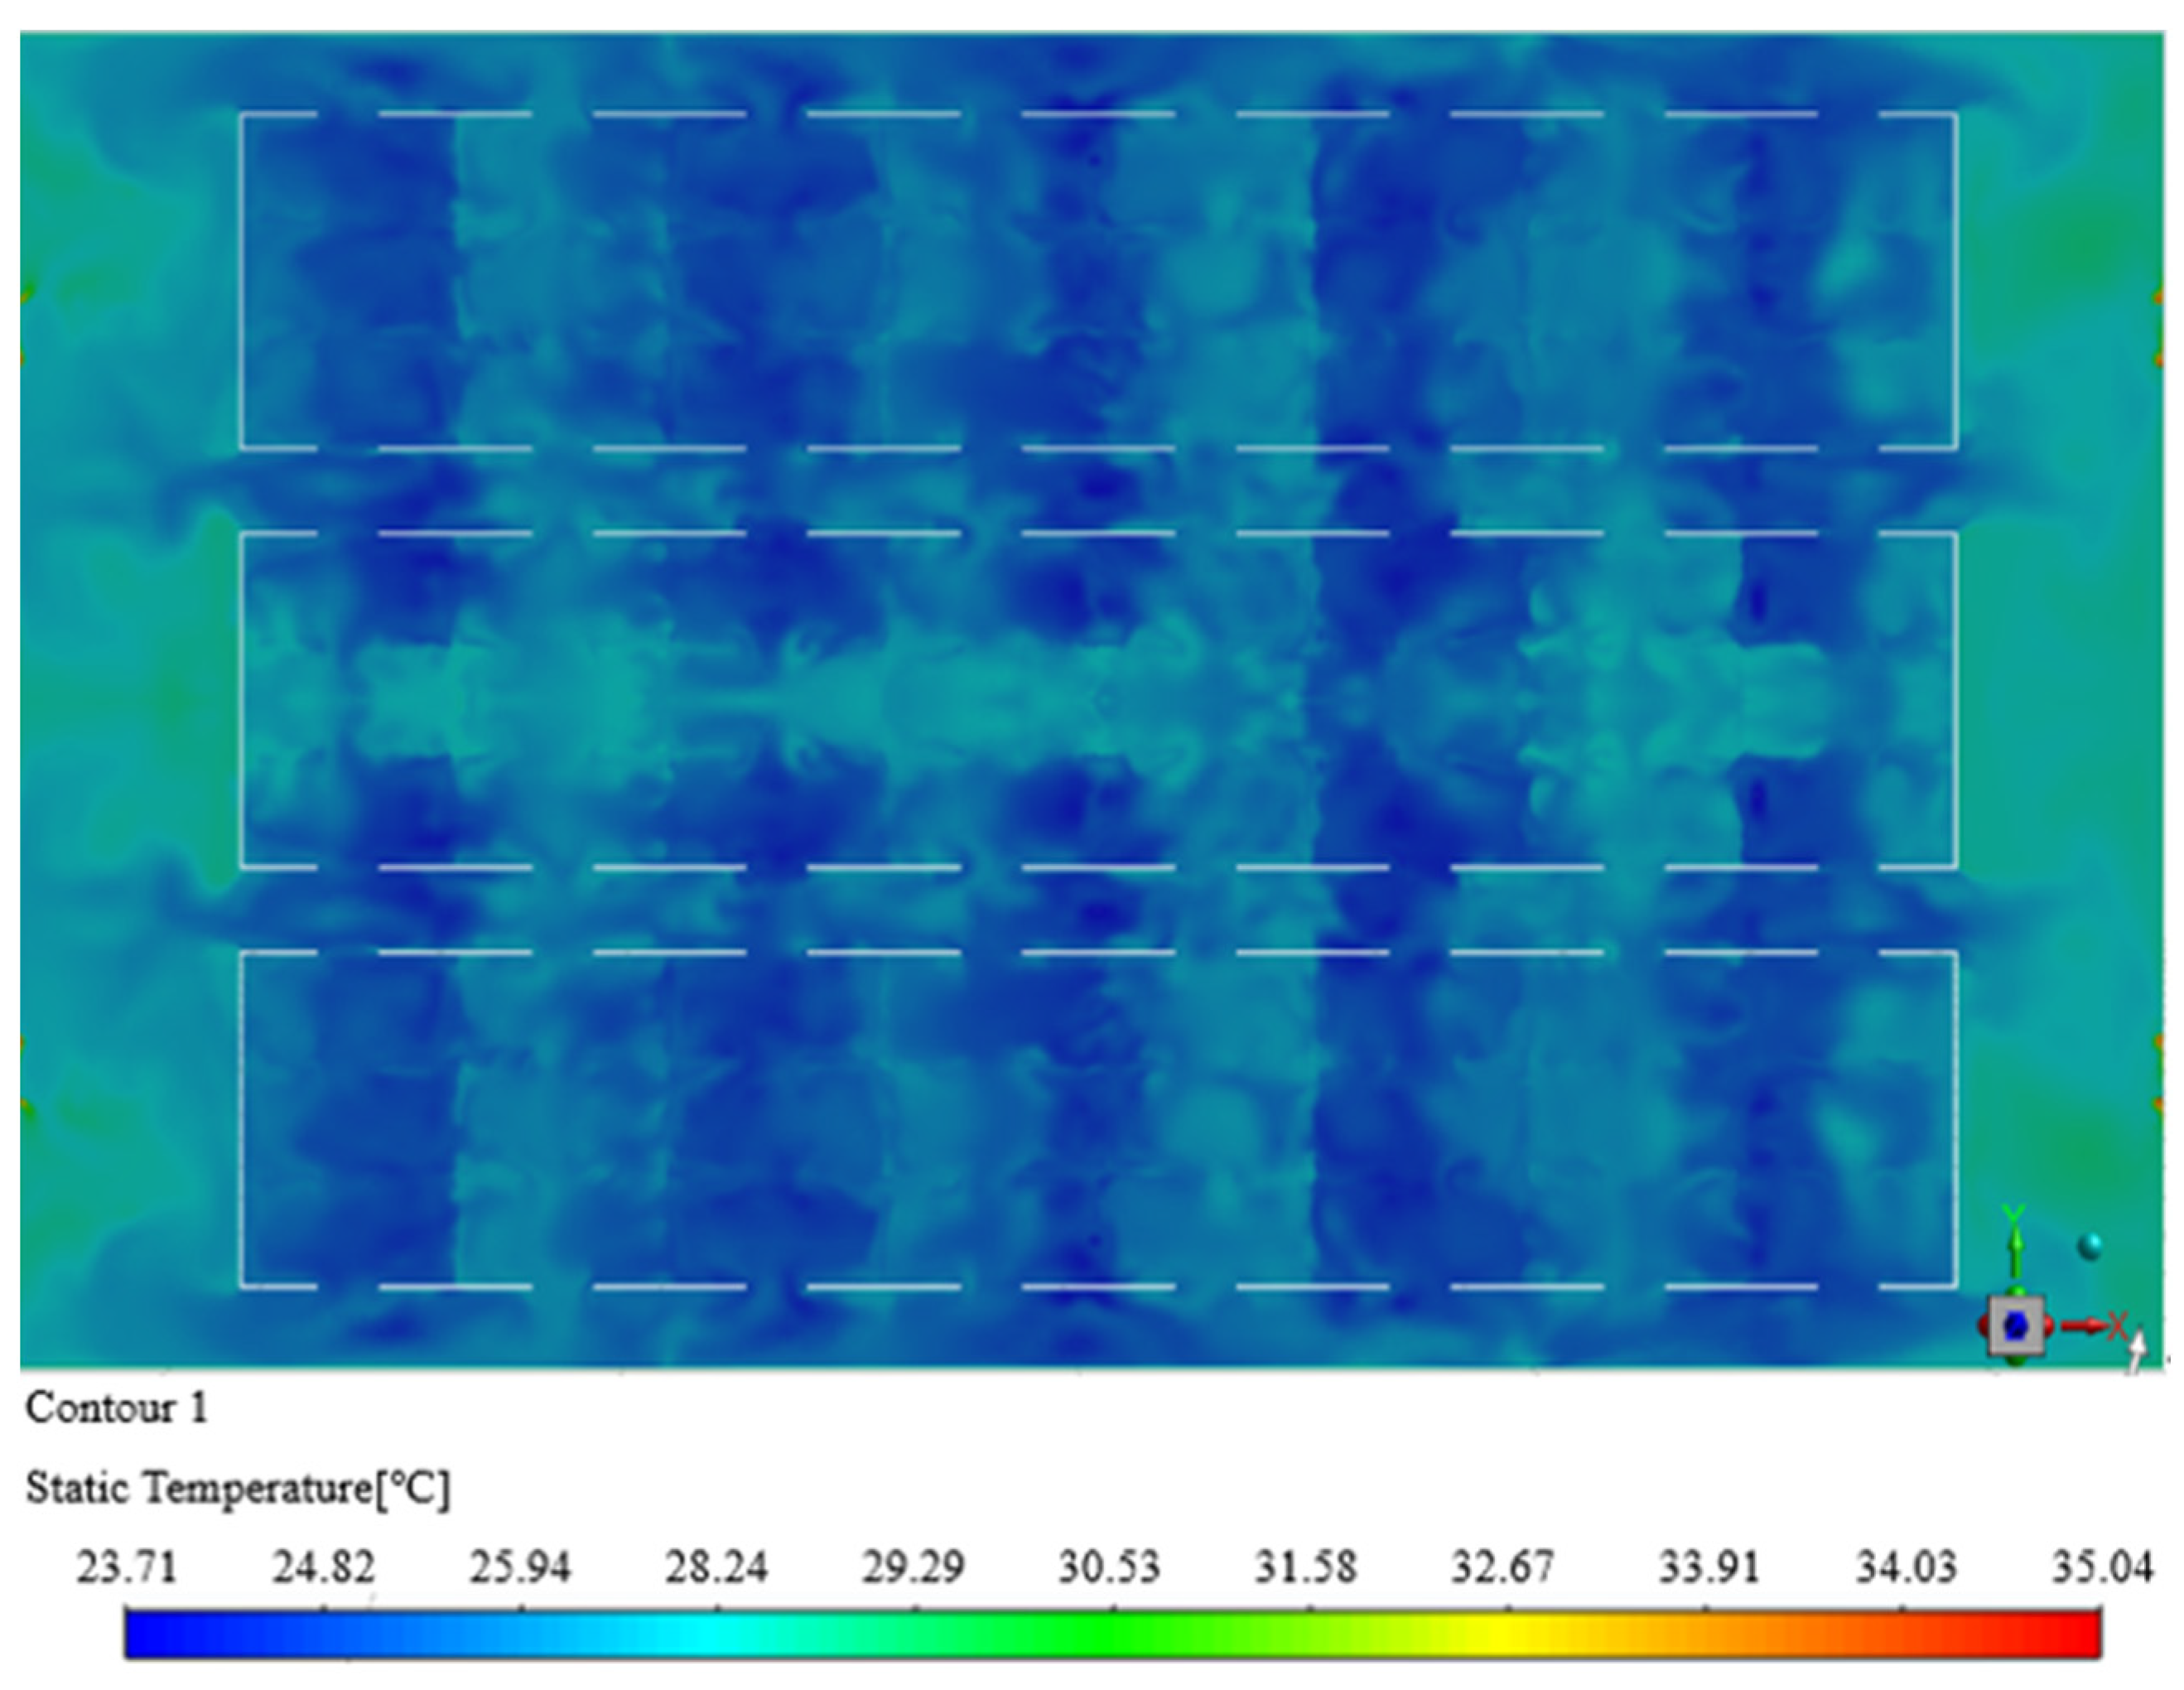
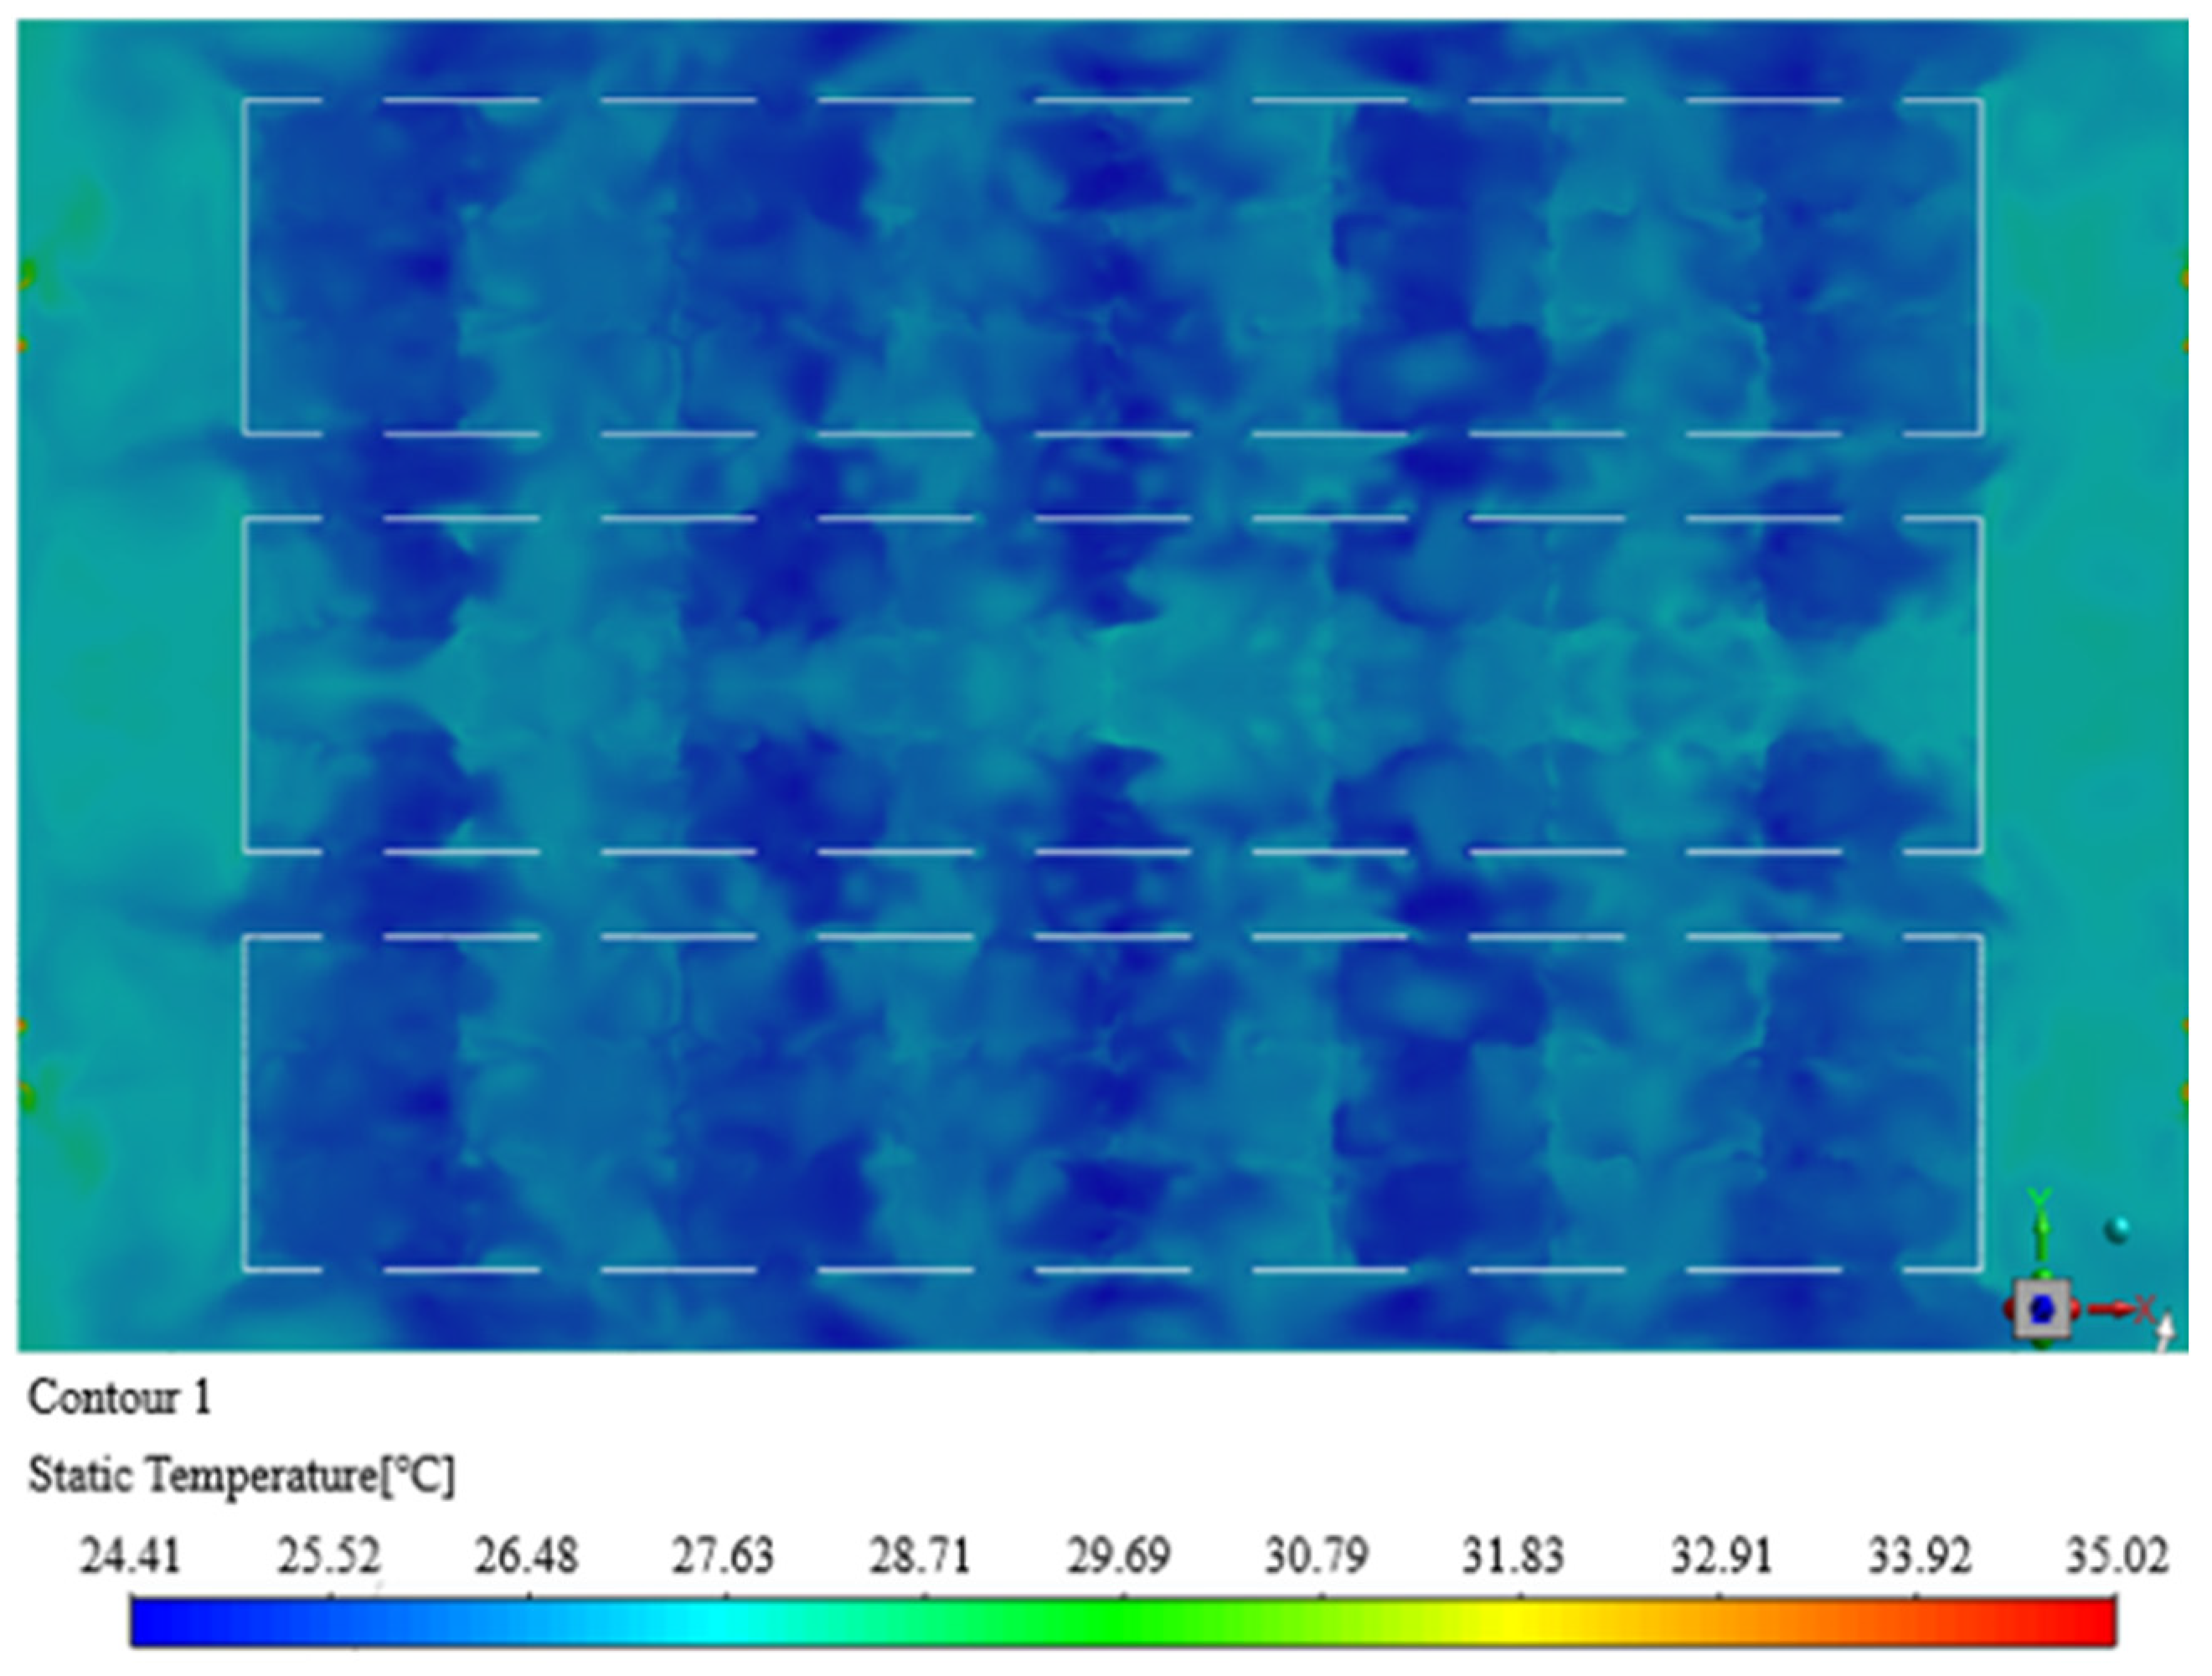
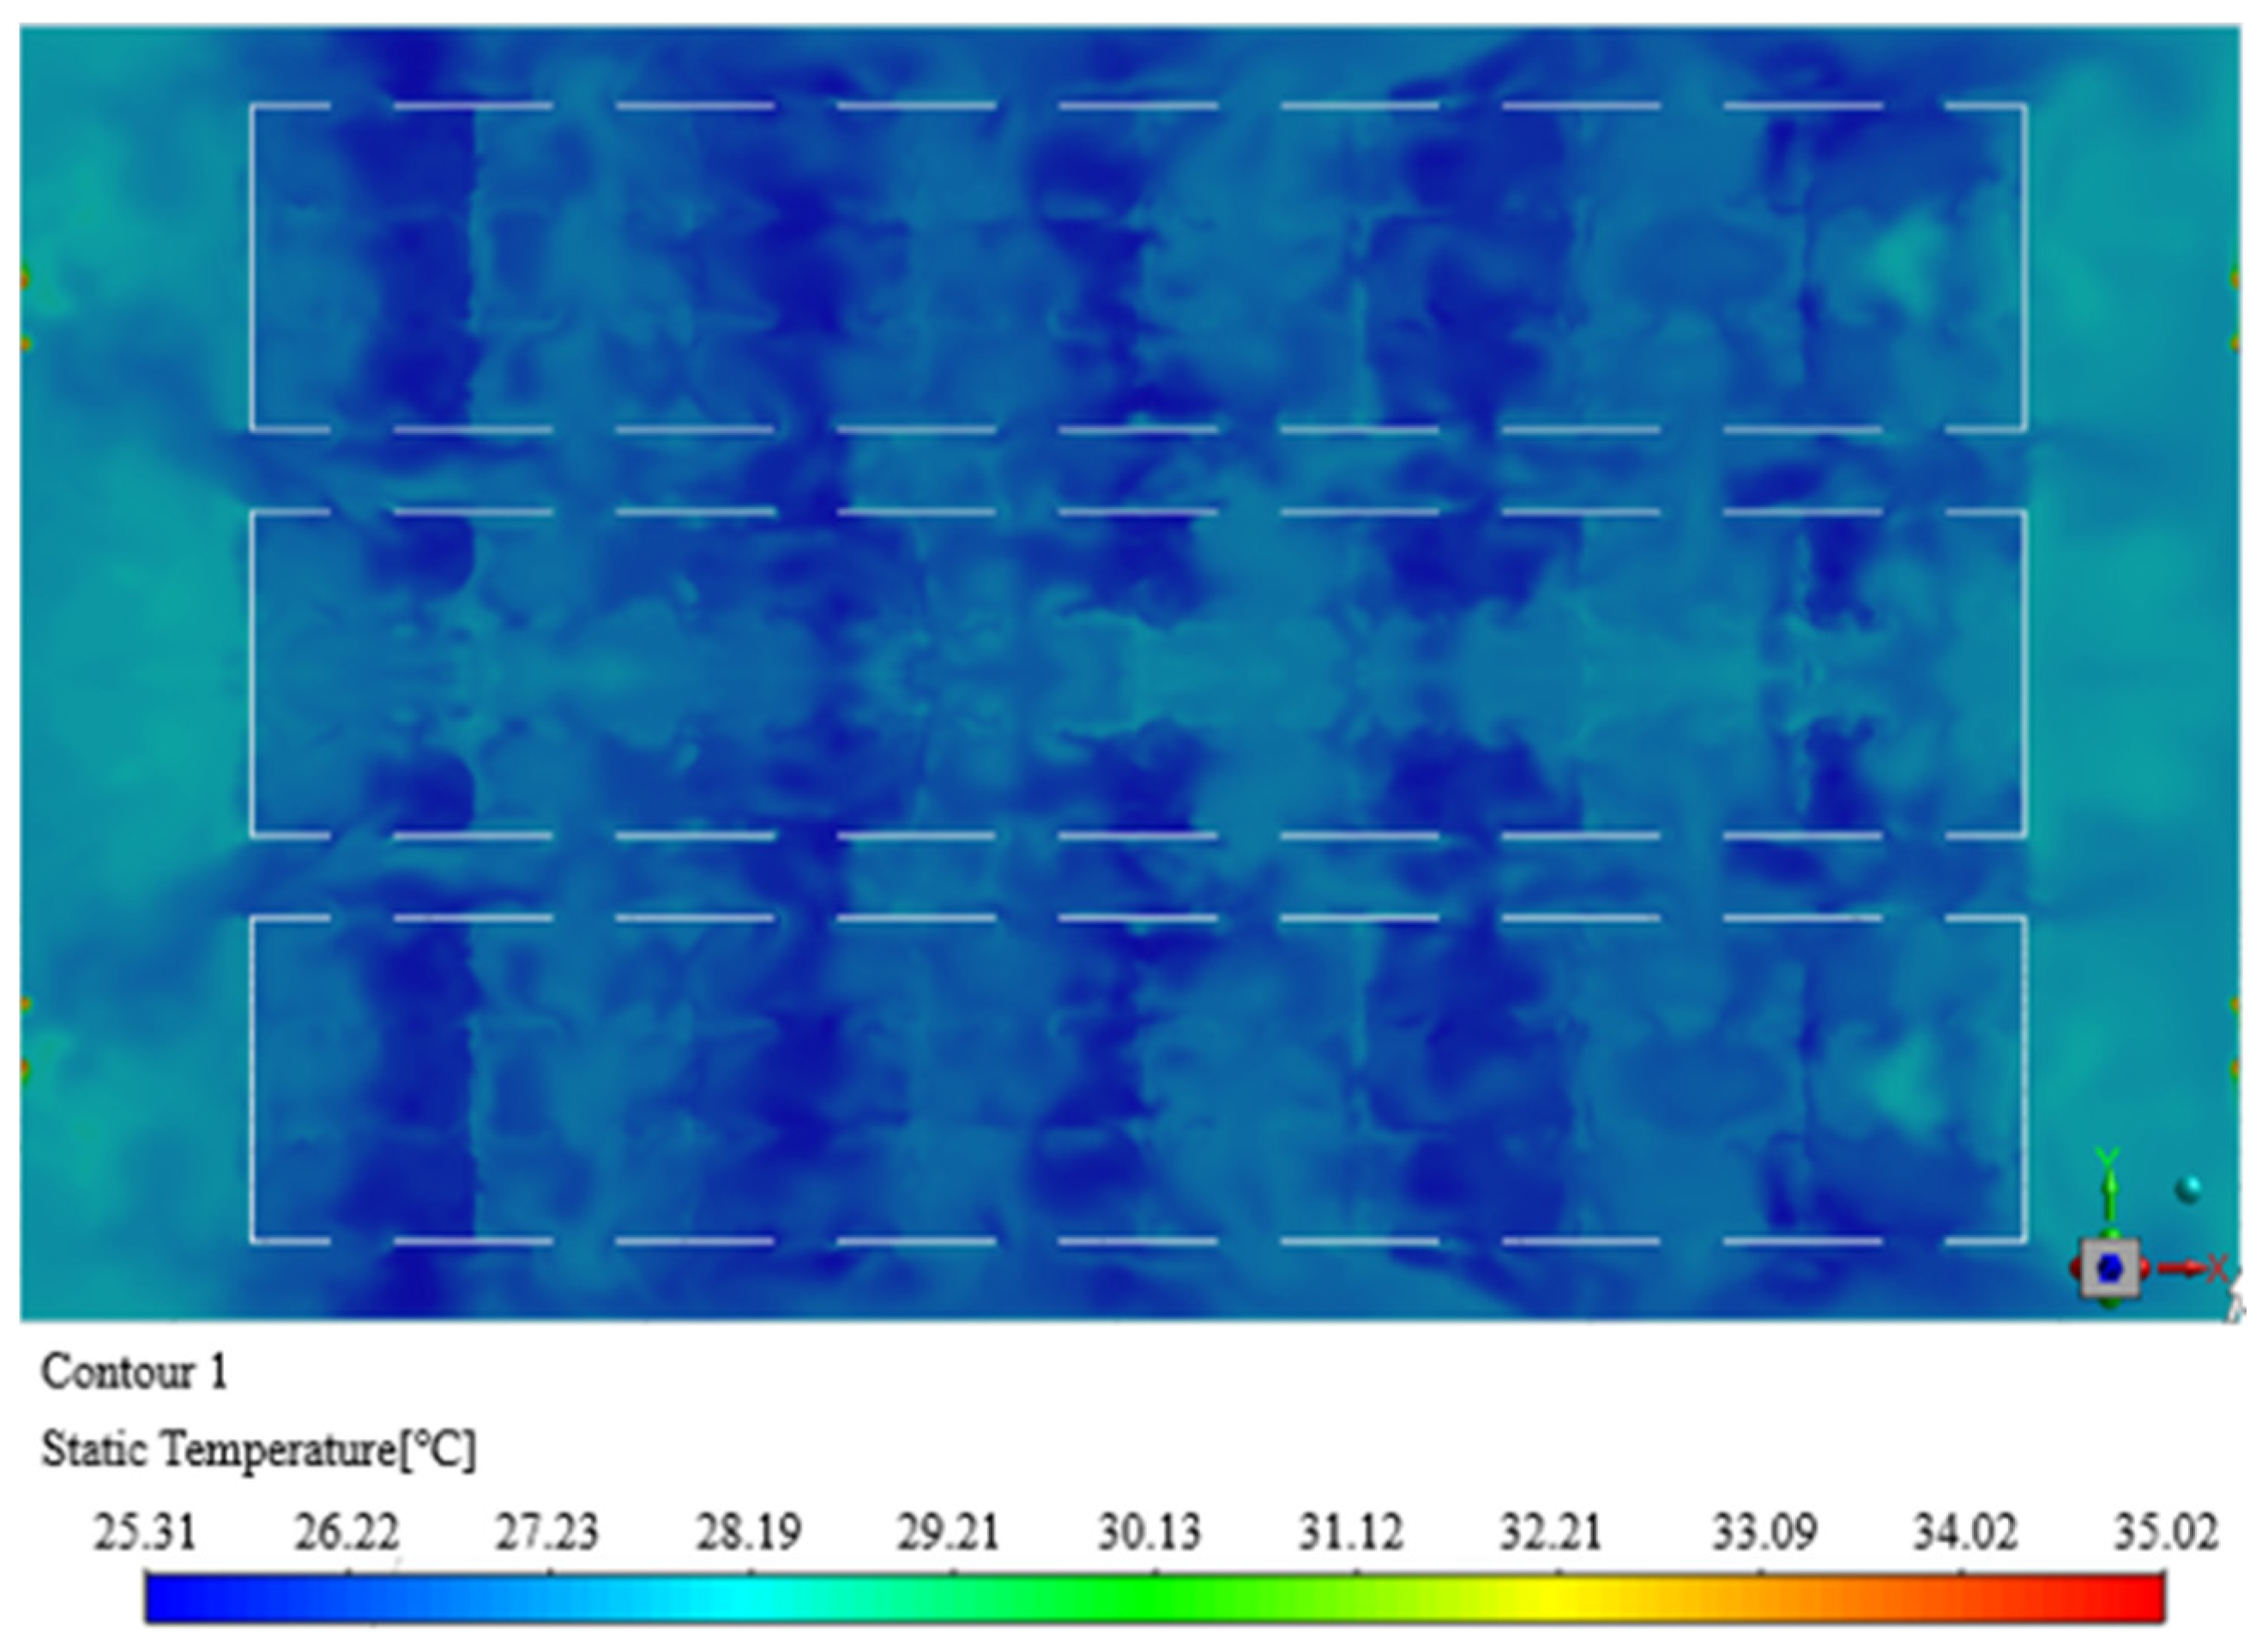
(1) When studying the air supply mode of the Fangcang shelter hospital, the control variables were used to simulate and analyze the parameter plan set considering environmental factors to determine the appropriate air supply parameters. The simulation results showed that when the air supply height is 4.5 m, the air supply temperature is 18 °C, the exhaust air volume of a single bed is 150 m3/h and the equivalent air supply speed is 1.74 m/s. The air temperature distribution in the space was relatively uniform and the airflow maintained directional flow. At the same time, the comfort level reached Level I at the personnel activity height of 1.65 m. The average wind speed of 0.25 m/s would not cause an uncomfortable blowing feeling to the human body and ensures the comfort of patients in the Fangcang shelter hospital.
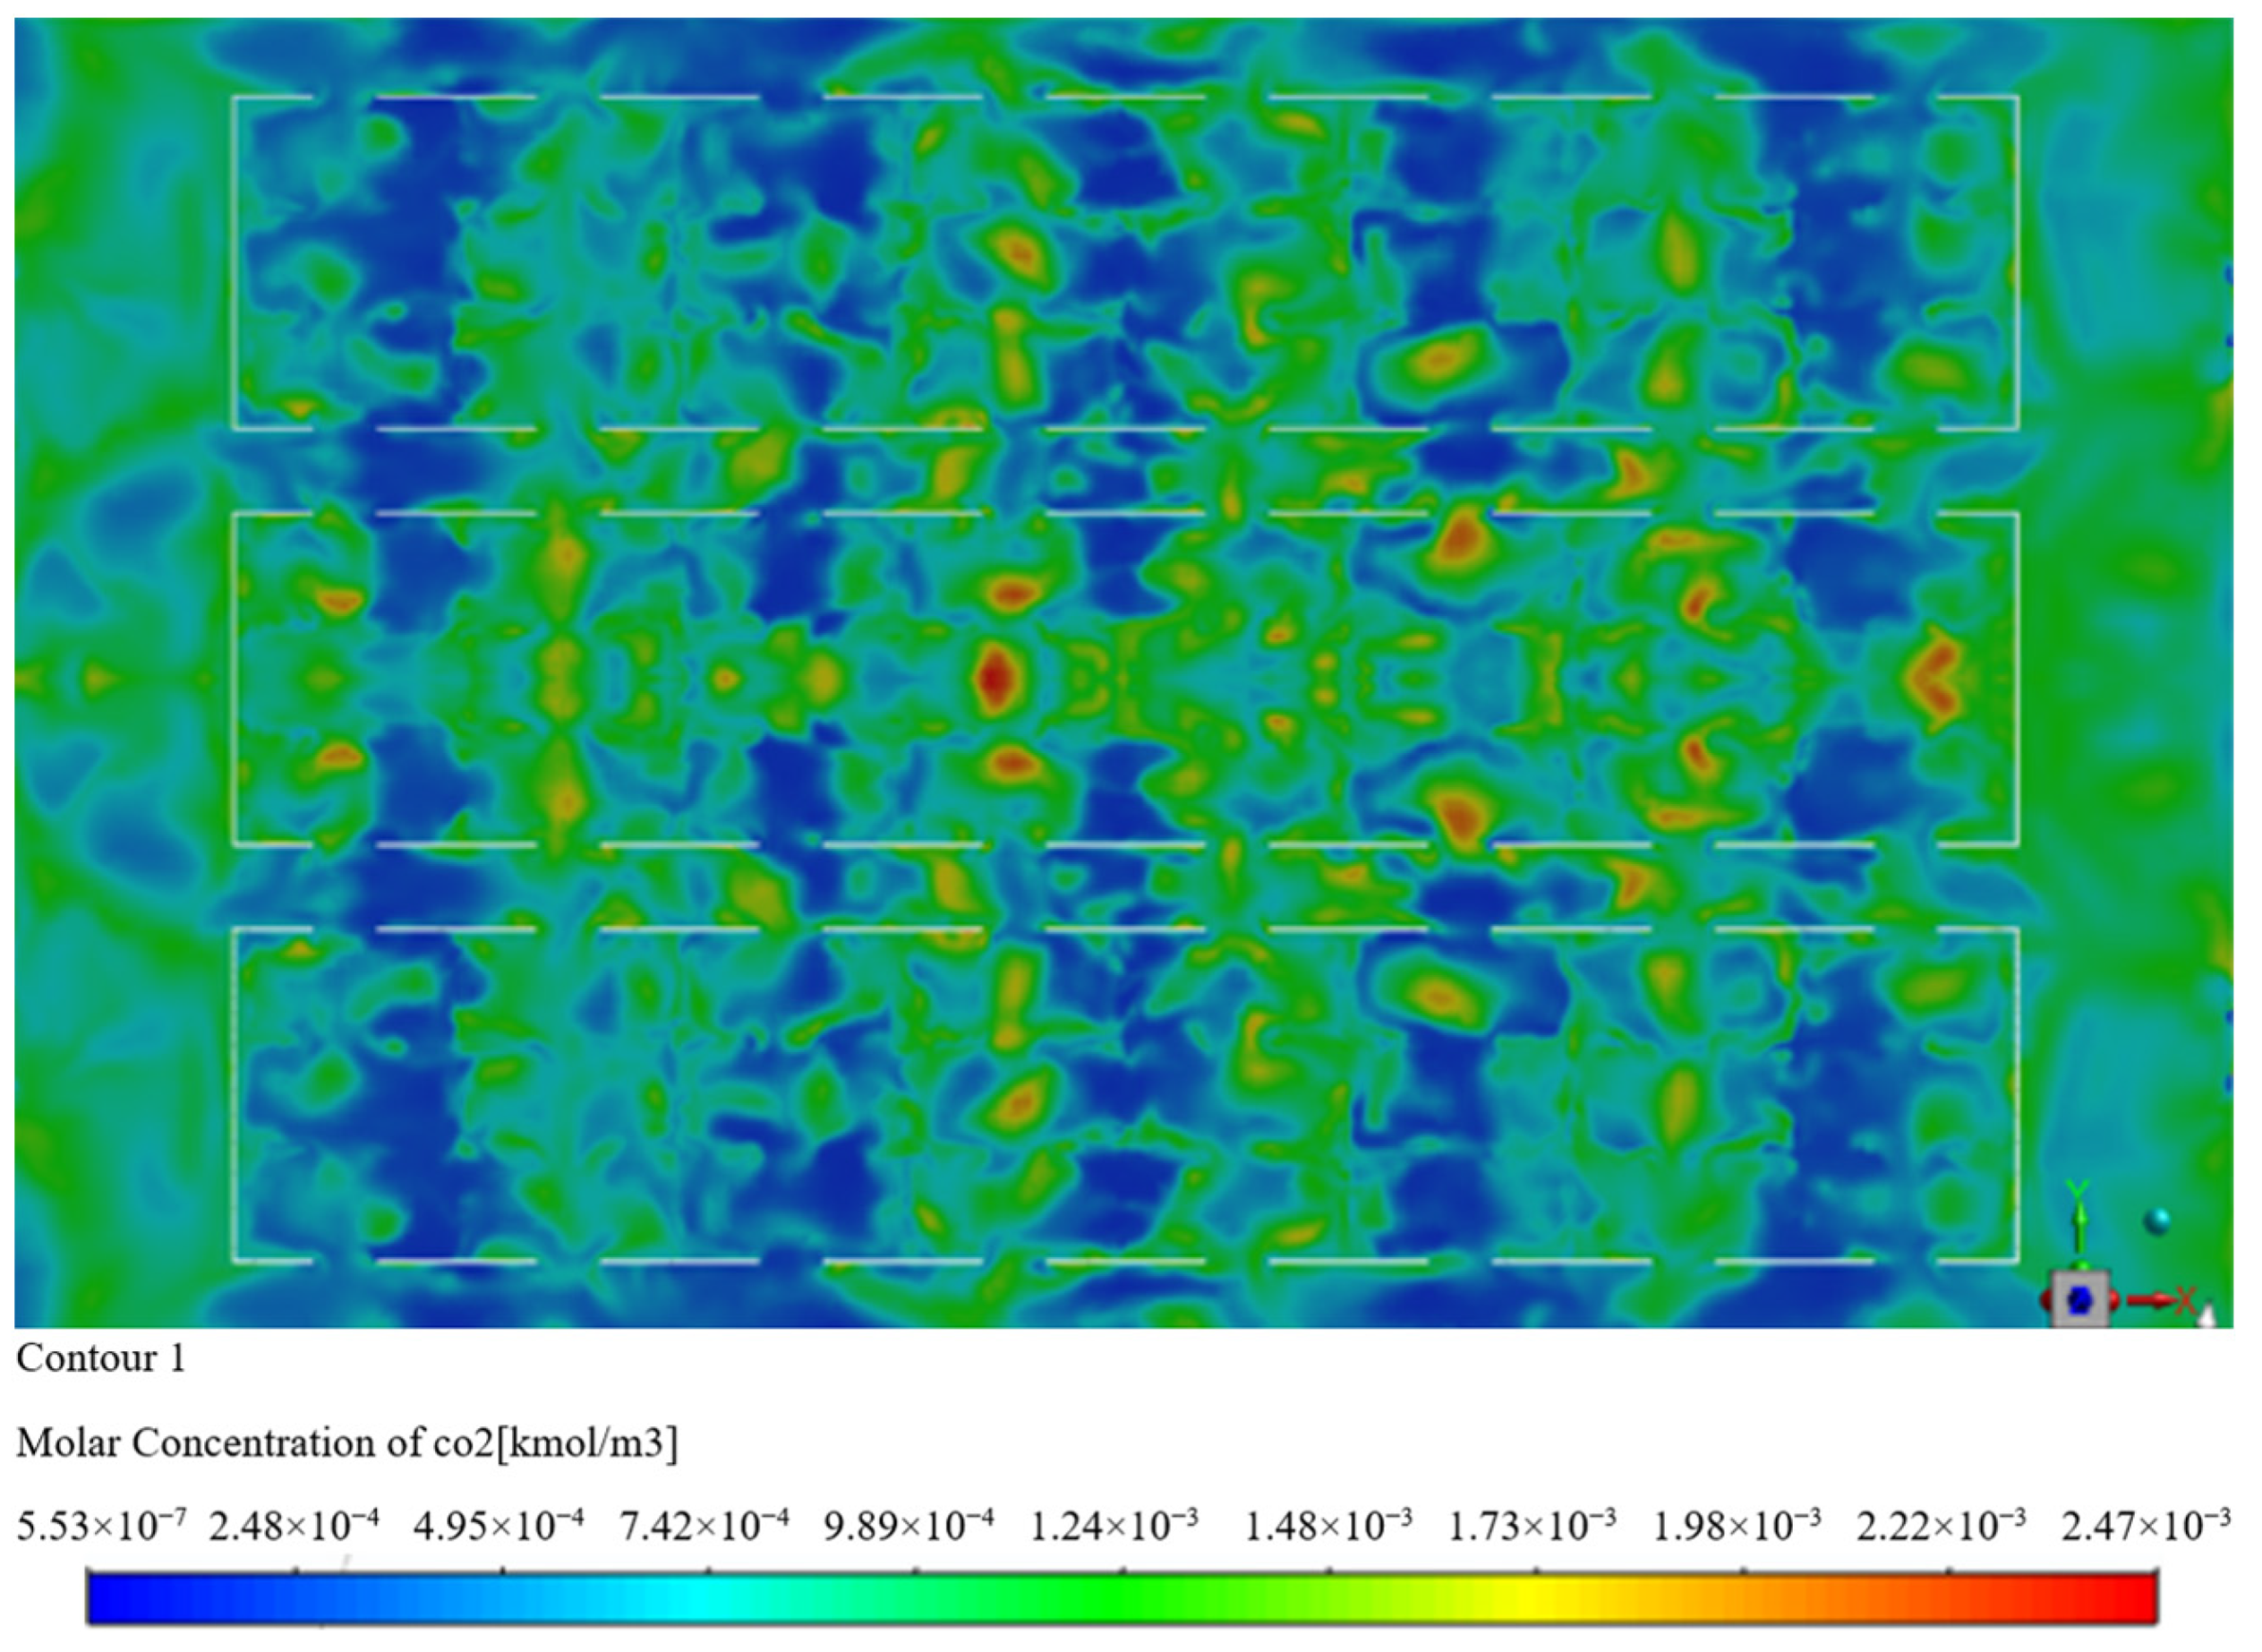
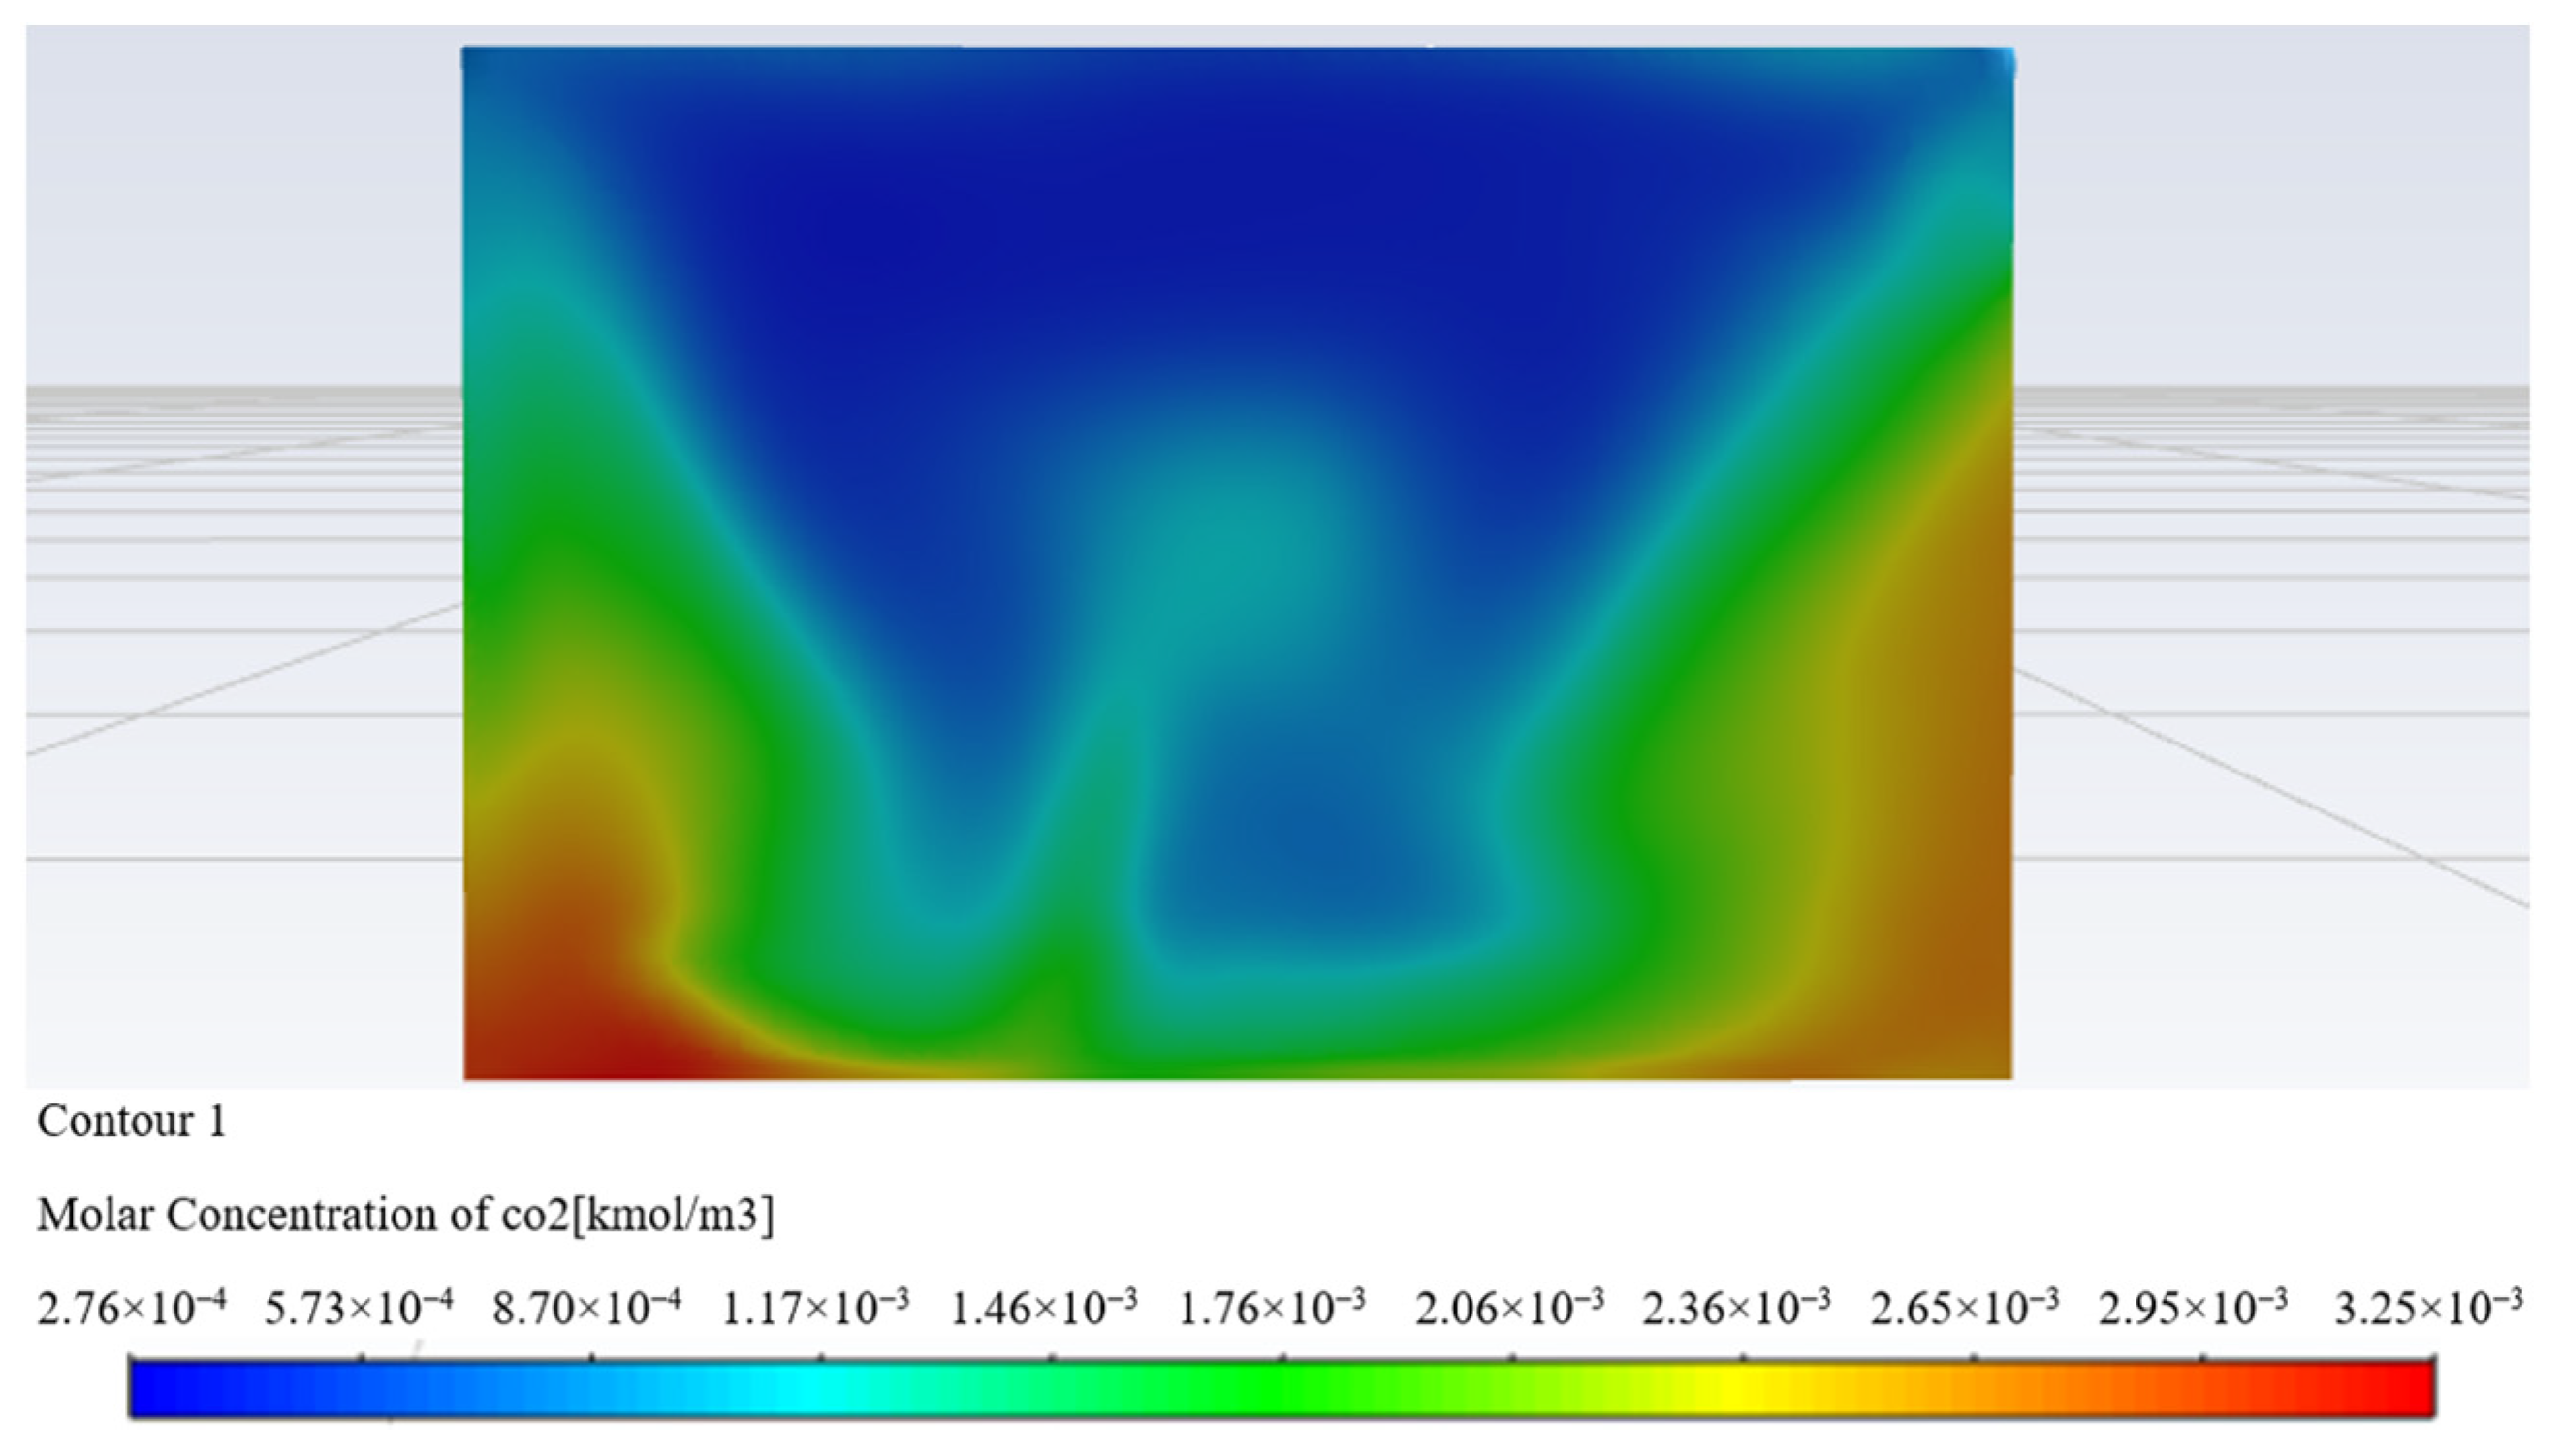
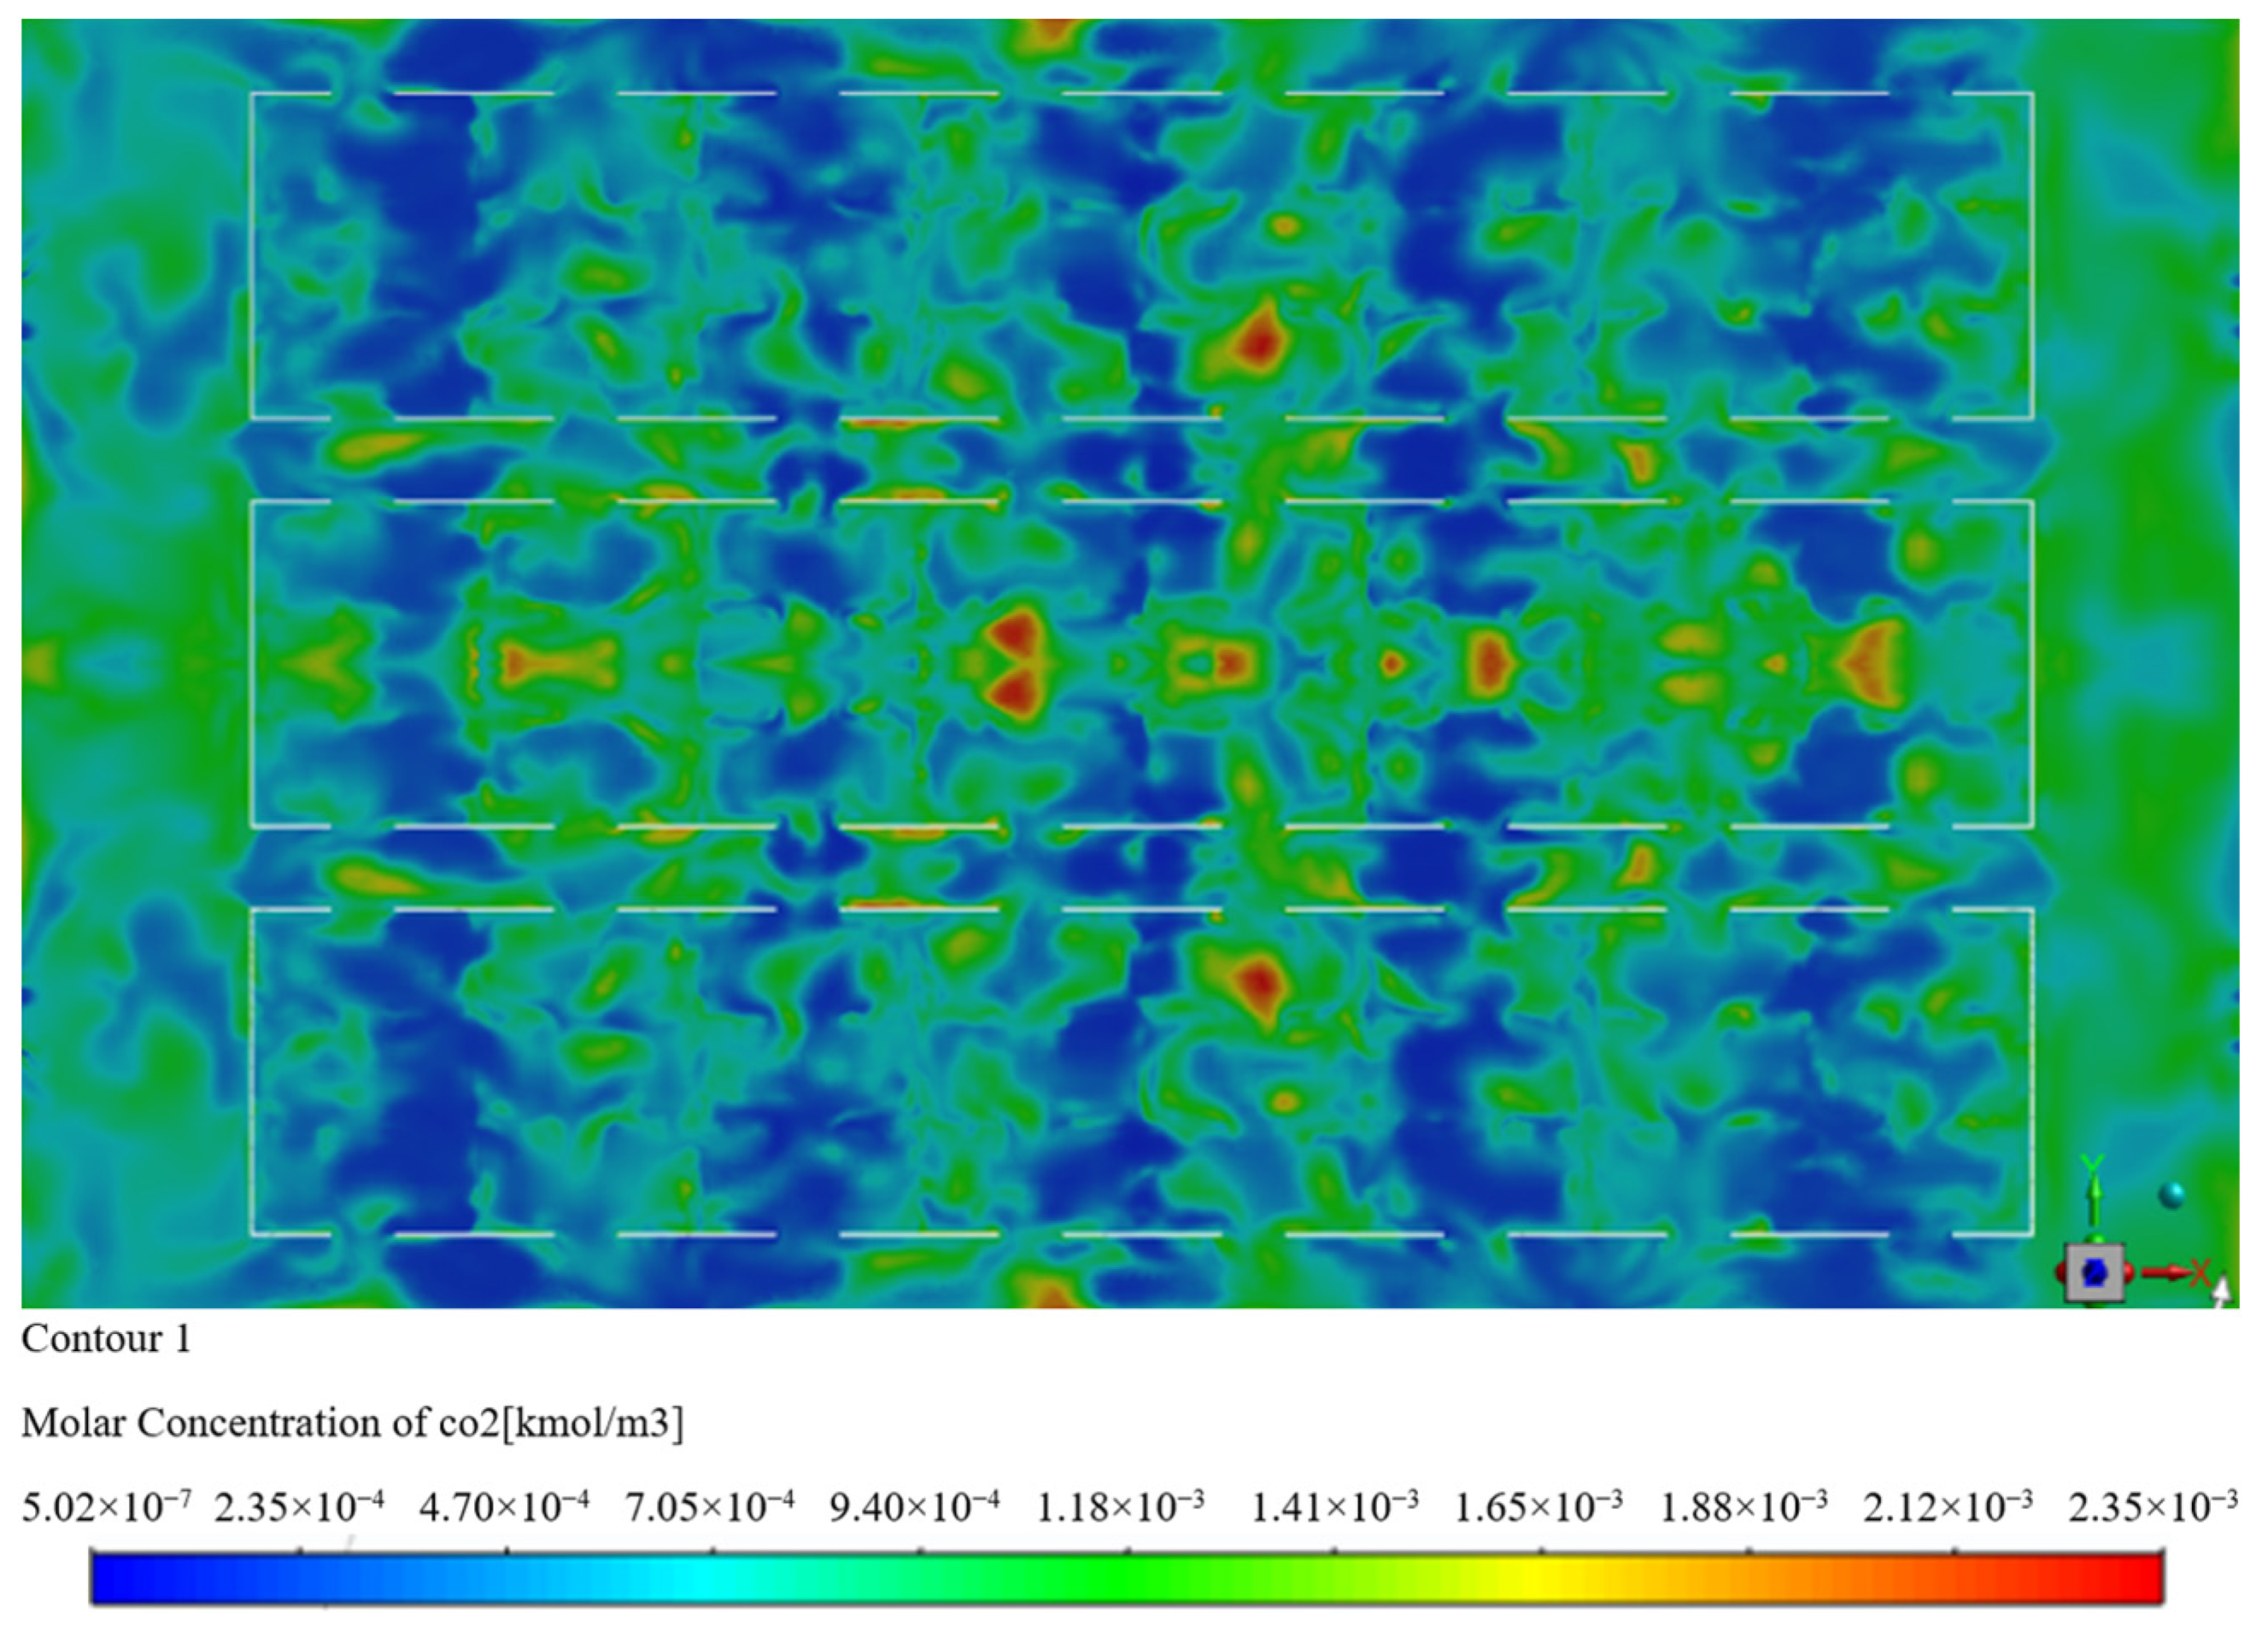
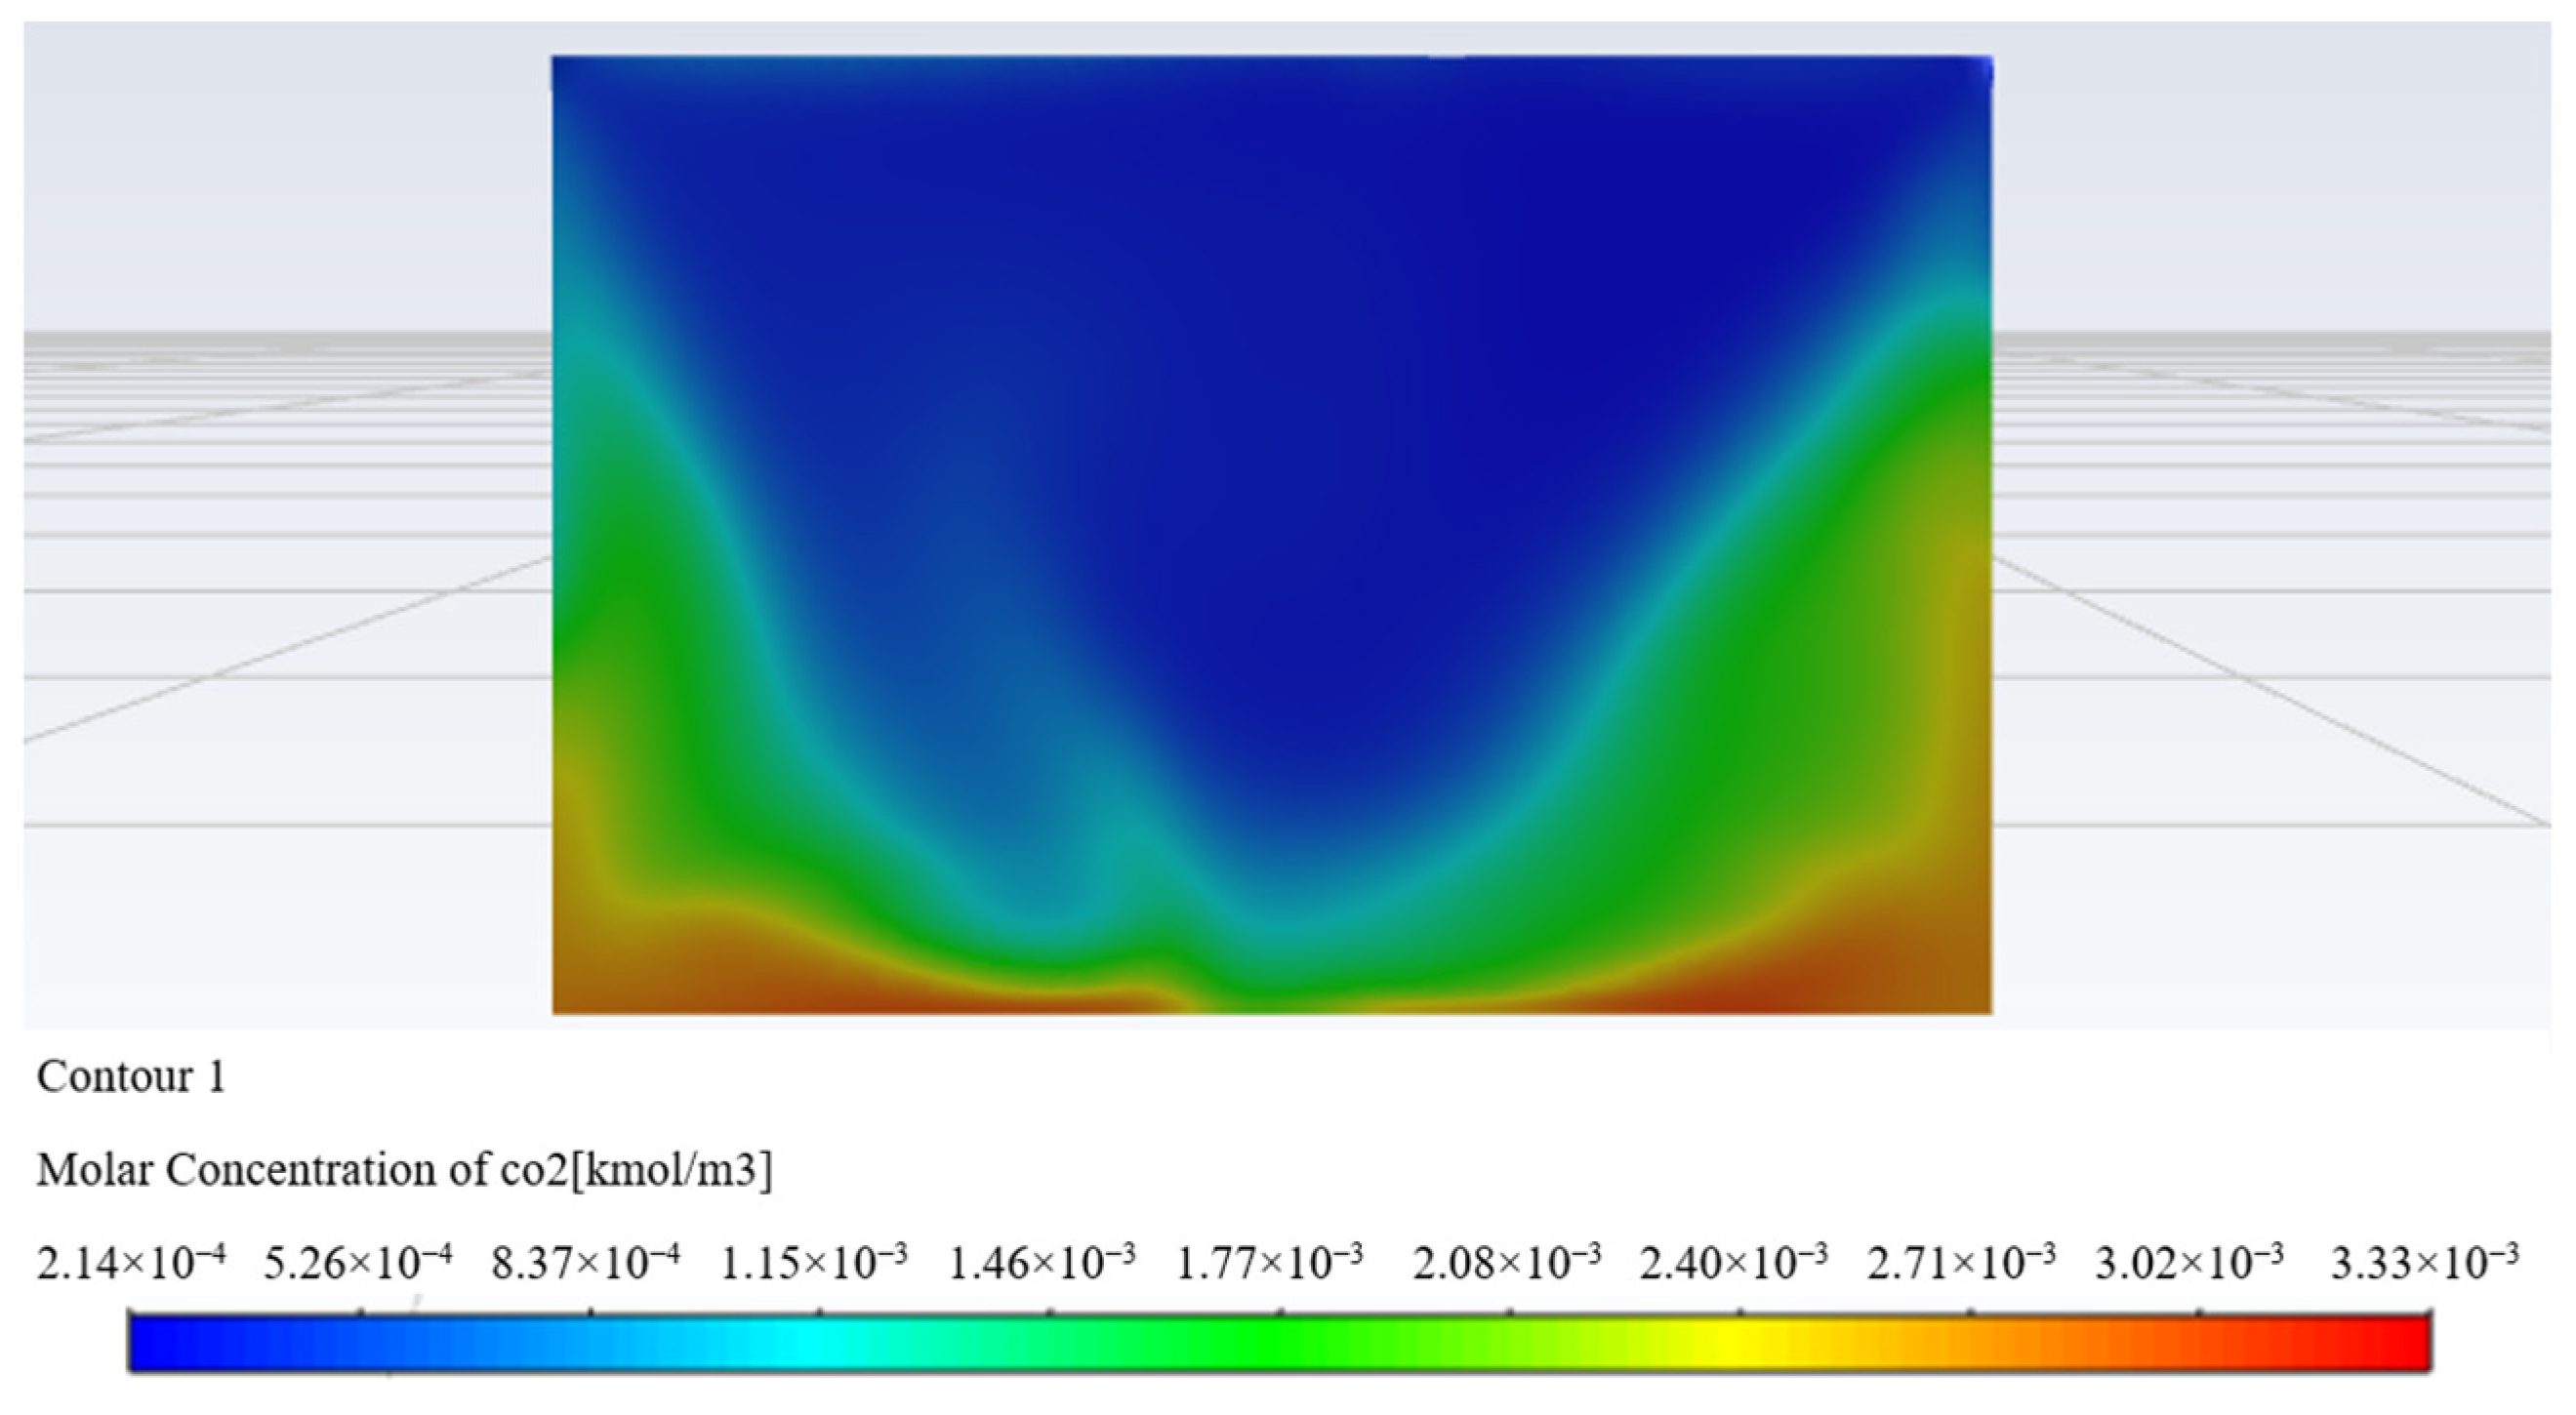
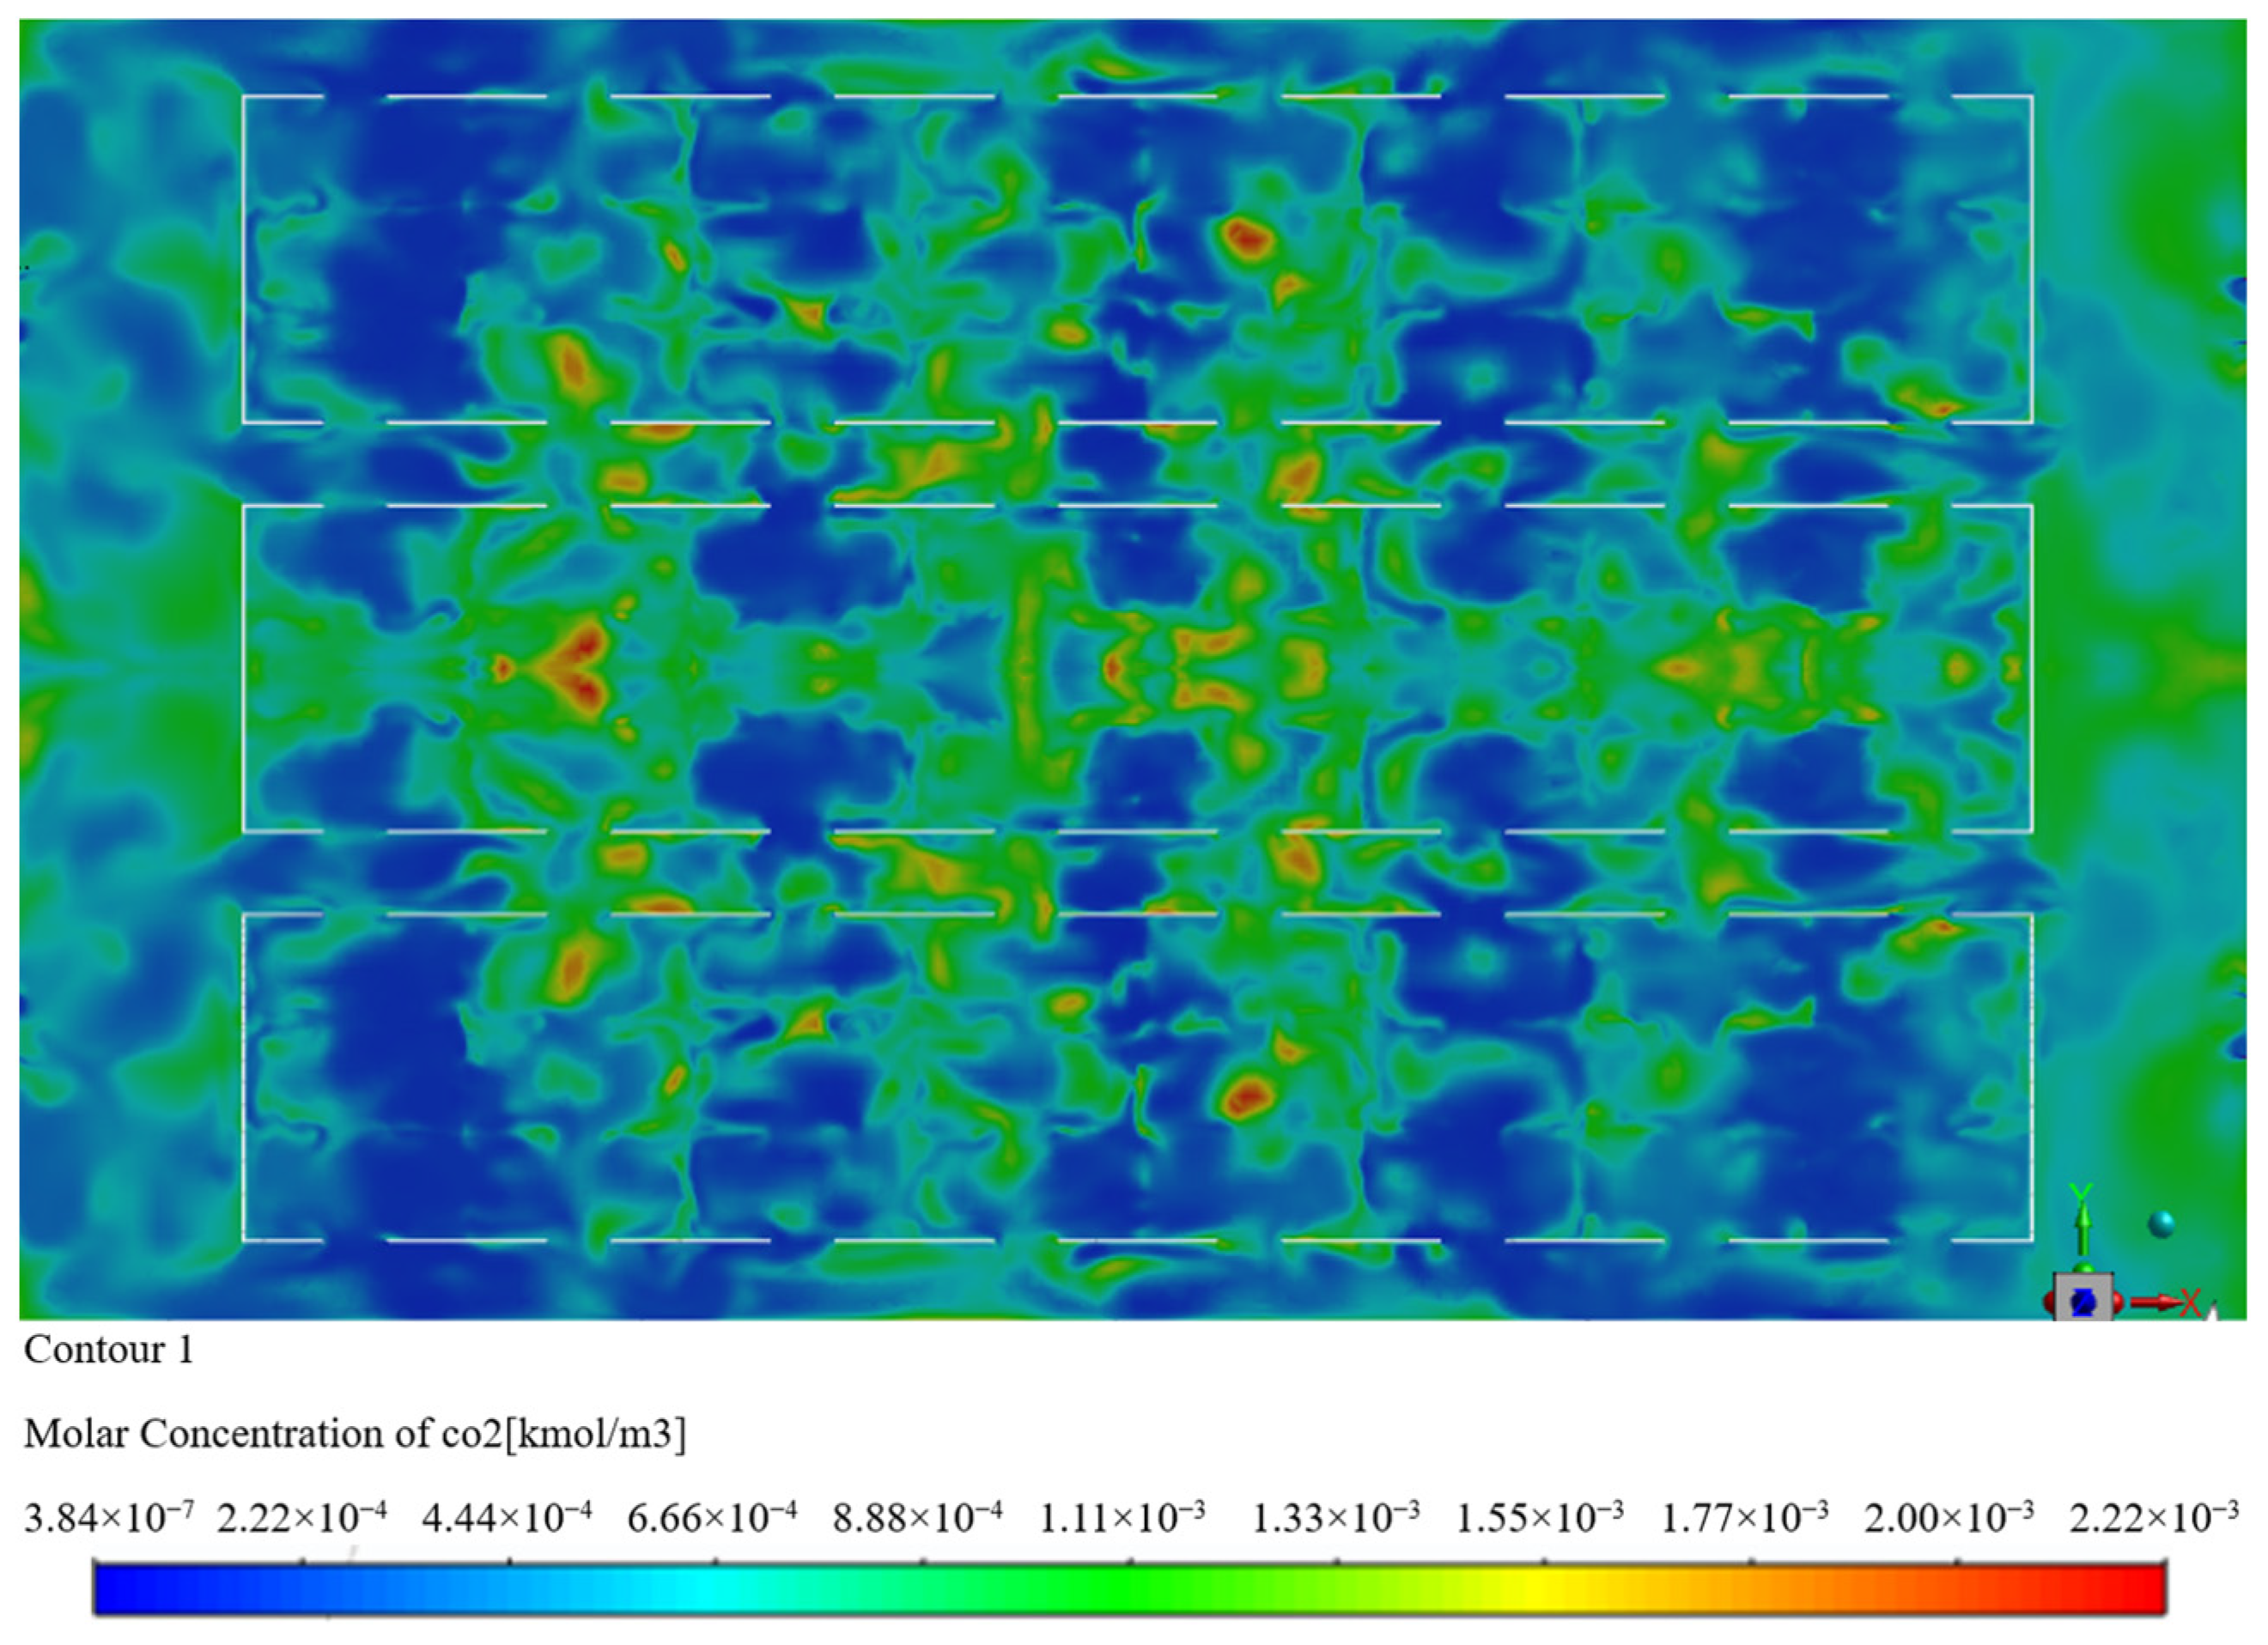
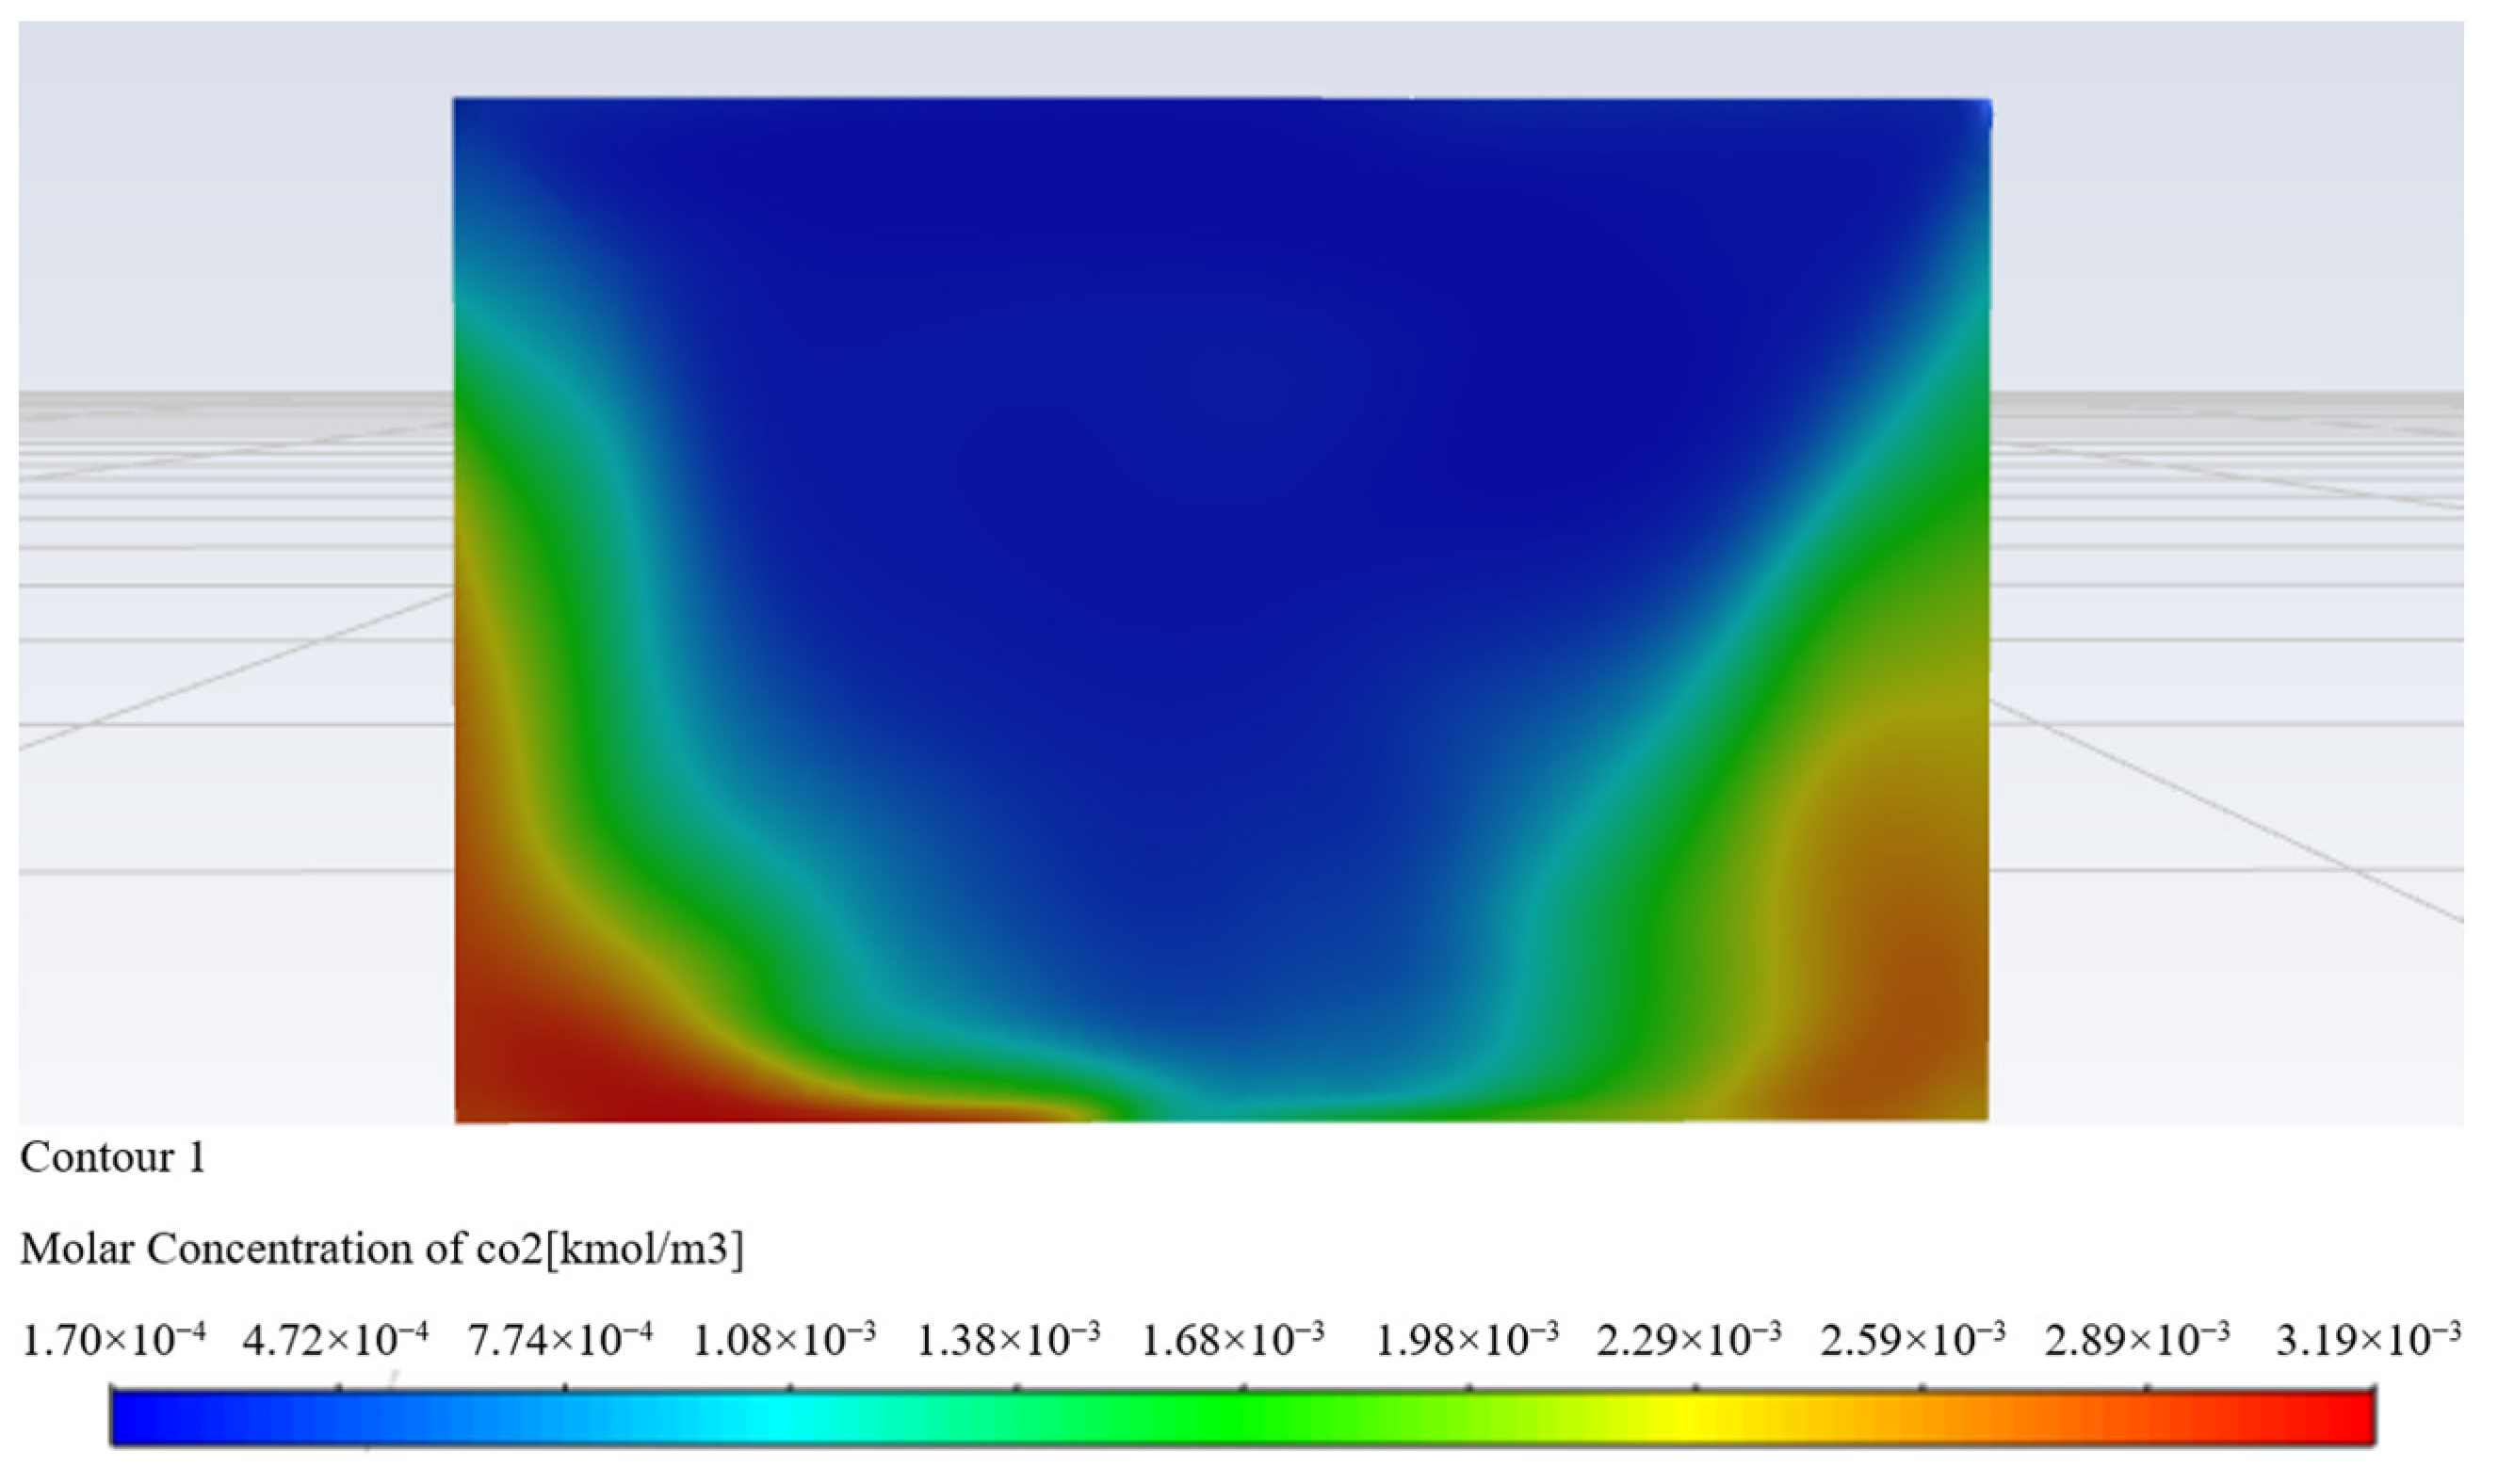
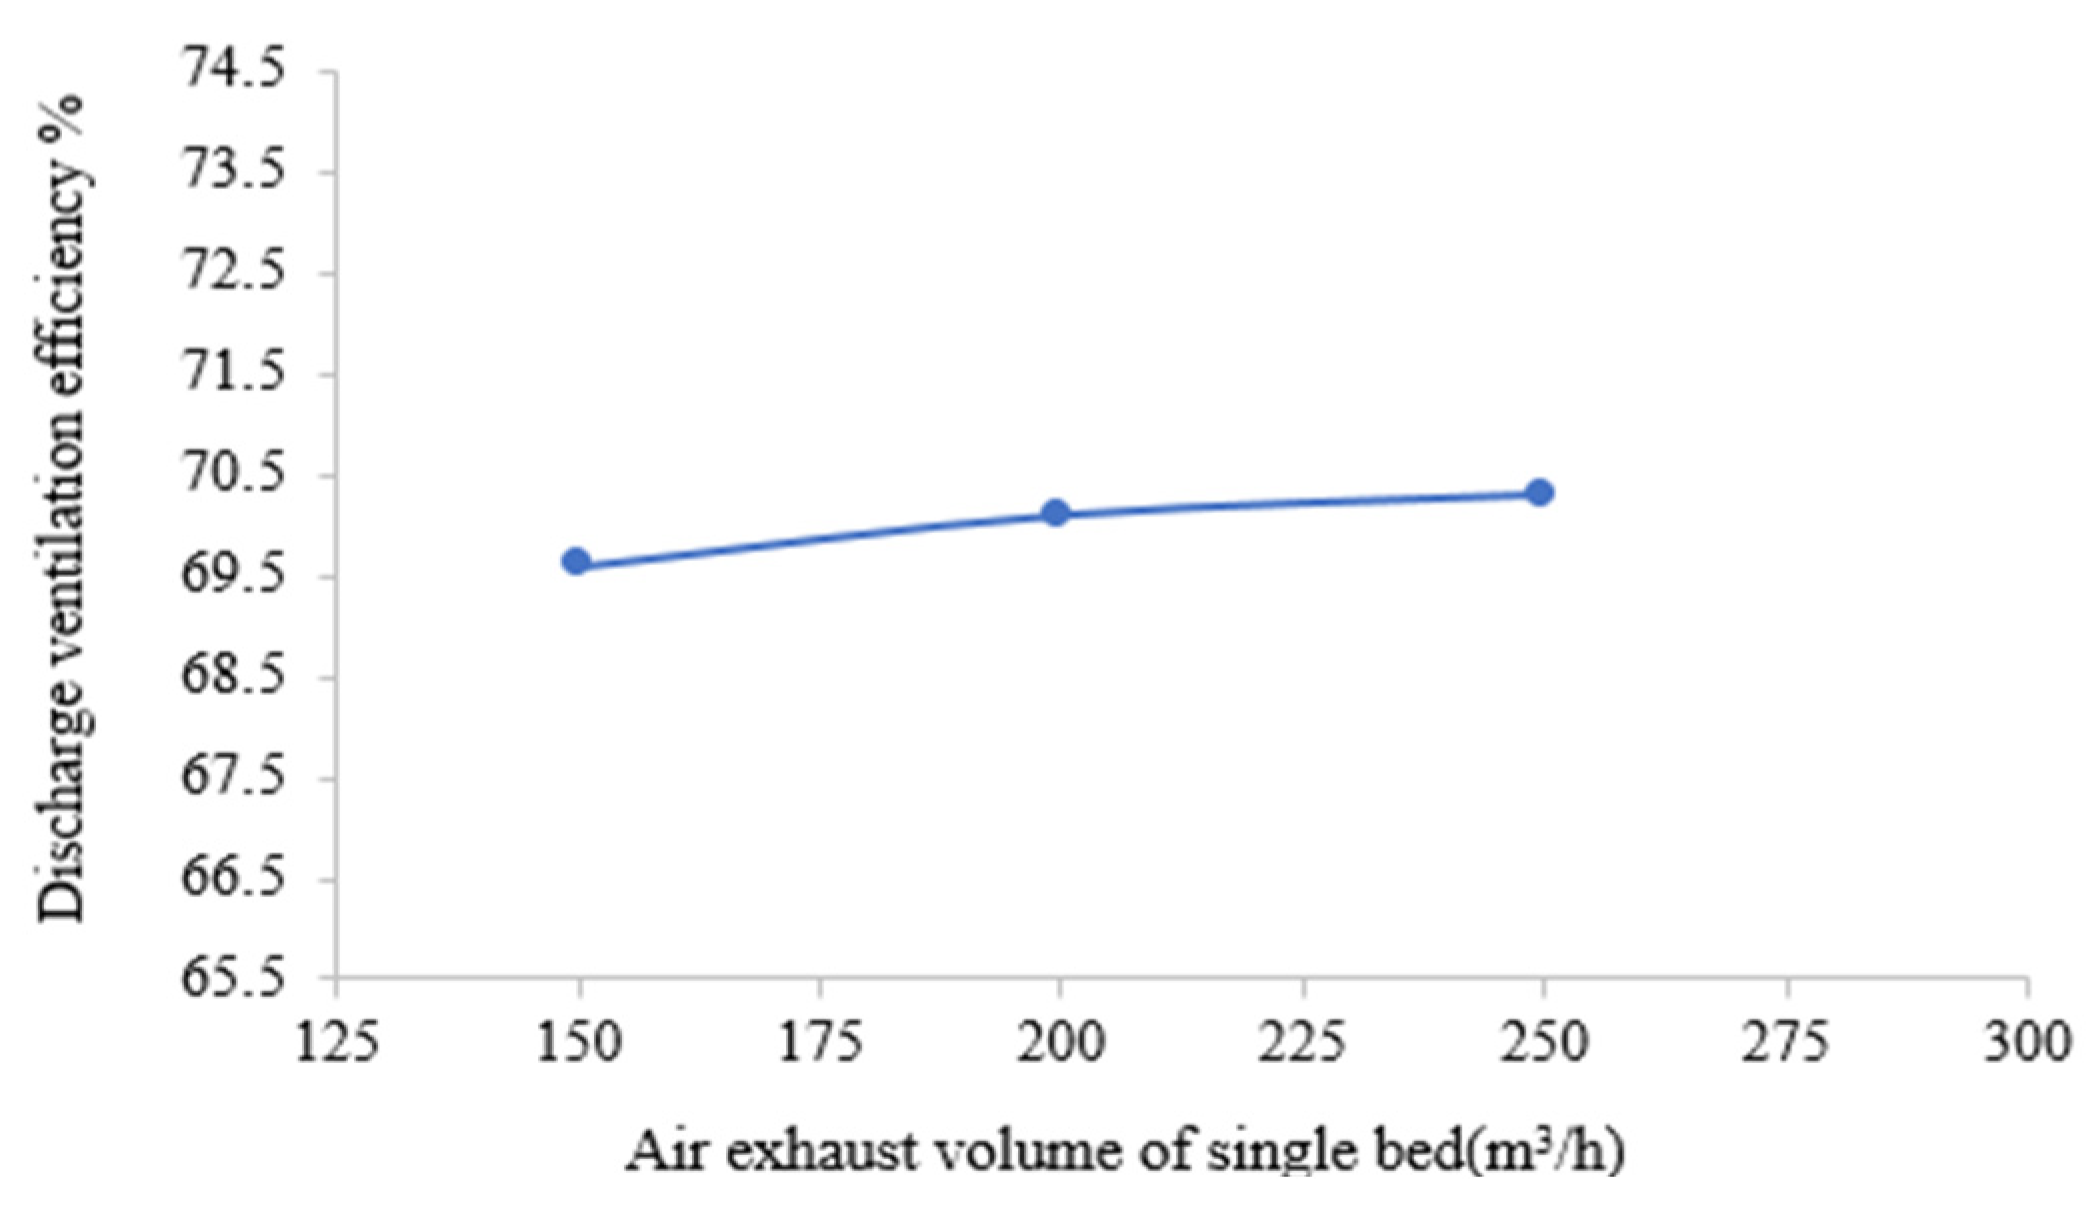
(2) The exhaust efficiency represents the efficiency index of pollutants discharged. This paper simulated the problem of pollutant emission efficiency by increasing the exhaust air volume. Through the analysis of simulation results, it was concluded that the dilution degree of pollutants grew with the increase in exhaust air volume, but the growth rate was slowed down with the increase in exhaust air volume. When the exhaust air volume is increased from 150 m3/h to 200 m3/h, the ventilation efficiency is increased by 0.5%. The ventilation efficiency increased by 0.2% from 200 m3/h to 250 m3/h, which means that with the increase in exhaust air volume, the discharge of pollutants cannot be effectively increased. In addition, the increase in exhaust air volume would produce a strong sense of blowing when the wind speed was greater than 0.3 m/s for the height of personnel activities. In the case of comprehensive consideration of pollutants’ discharge efficiency and airflow organization, the single bed exhaust air volume of 150 m3/h is optimal, which can effectively avoid the impact of a blowing feeling on patient comfort and ensure the ventilation efficiency reaches 69.6%.
In summary, the bag air duct system with the layout height of 4.5 m, exhaust air volume of 150 m3/h, and the air supply temperature of 18 °C is optimal for adoption in the Fangcang shelter hospital, and which can meet the special environmental requirements of the reconstructed Fangcang shelter hospital to jointly meet patient comfort and pollutant emissions. The simulation method and analysis provide a reasonable parameter scheme design of airflow organization and pollutant control in the Fangcang shelter hospital, a special building.

Author Contributions

Conceptualization, Y.Y. and Q.L.; methodology, H.Y.; software, H.Y. and Z.D.; validation, Y.Y., H.Y. and Q.L.; formal analysis, H.Y. and Z.D.; investigation, Y.Y. and H.Y.; resources, Y.Y. and H.Y.; data curation, H.Y.; writing—original draft preparation, H.Y.; writing—review and editing, H.Y. and L.Z.; visualization, Y.Y. and H.Y.; supervision, Y.Y. and Q.L.; project administration, Y.Y., H.Y. and L.Z.; funding acquisition, Y.Y. All authors have read and agreed to the published version of the manuscript.

Funding

This research received no external funding.

Data Availability Statement

Not applicable.

Acknowledgments

Special thanks to everyone who provided help.

Conflicts of Interest

The authors declare no conflict of interest.

References

  1. Goodell, J.W. COVID-19 and finance: Agendas for future research. Financ. Res. Lett. 2020, 35, 101512. [Google Scholar] [CrossRef] [PubMed]
  2. Nicola, M.; Alsafi, Z.; Sohrabi, C.; Kerwan, A.; Al-Jabir, A.; Iosifidis, C.; Agha, M.; Agha, R. The socio-economic implications of the coronavirus pandemic (COVID-19): A review. Int. J. Surg. 2020, 78, 185–193. [Google Scholar] [CrossRef]
  3. Shang, L.; Xu, J.; Cao, B. Fangcang shelter hospitals in COVID-19 pandemic: The practice and its significance. Clin. Microbiol. Infect. 2020, 26, 976–978. [Google Scholar] [CrossRef]
  4. Li, Q.; Guan, X.; Wu, P.; Wang, X.; Zhou, L.; Tong, Y.; Ren, R.; Leung, K.S.M.; Lau, E.H.Y.; Wong, J.Y.; et al. Early Transmission Dynamics in Wuhan, China, of Novel Coronavirus–Infected Pneumonia. N. Engl. J. Med. 2020, 382, 1199–1207. [Google Scholar] [CrossRef] [PubMed]
  5. Lescure, F.-X.; Bouadma, L.; Nguyen, D.; Parisey, M.; Wicky, P.-H.; Behillil, S.; Gaymard, A.; Bouscambert-Duchamp, M.; Donati, F.; Le Hingrat, Q.; et al. Clinical and virological data of the first cases of COVID-19 in Europe: A case series. Lancet Infect. Dis. 2020, 20, 697–706. [Google Scholar] [CrossRef] [PubMed]
  6. Chen, S.; Zhang, Z.; Yang, J.; Wang, J.; Zhai, X.; Bärnighausen, T.; Wang, C. Fangcang shelter hospitals: A novel concept for responding to public health emergencies. Lancet 2020, 395, 1305–1314. [Google Scholar] [CrossRef]
  7. Ji, H.; Huang, L.; Li, H.; Zhang, J.; Jing, Q.; Deng, J.-Y. A Comparative Study on Technical Standards for the Design of Emergency Medical Facilities in China in the Context of COVID-19. Buildings 2022, 12, 1502. [Google Scholar] [CrossRef]
  8. Adamu, Z.A.; Price, A. The Design and Simulation of Natural Personalised Ventilation (NPV) System for Multi-Bed Hospital Wards. Buildings 2015, 5, 381–404. [Google Scholar] [CrossRef]
  9. Lam, J.C.; Chan, A.L. CFD analysis and energy simulation of a gymnasium. Build. Environ. 2001, 36, 351–358. [Google Scholar] [CrossRef]
  10. Du, X.; Li, J. Indoor PM2.5 concentration test and analysis in Winter Olympics ‘Ice Cube’ curling venue. Energy Build. 2022, 258, 111837. [Google Scholar] [CrossRef]
  11. Reg Monteyne, HVAC Design Solutions for Multi—Purpose Arenas—New roles for sports arenas adding demands, expectations. ASHRAE J. 1995, 37, 35–43.
  12. Wang, C.-N.; Yang, F.-C.; Nguyen, V.T.T.; Vo, N.T.M. CFD Analysis and Optimum Design for a Centrifugal Pump Using an Effectively Artificial Intelligent Algorithm. Micromachines 2022, 13, 1208. [Google Scholar] [CrossRef]
  13. Kim, D.-Y.; Kim, Y.-T. Preliminary design and performance analysis of a radial inflow turbine for organic Rankine cycles. Appl. Therm. Eng. 2017, 120, 549–559. [Google Scholar] [CrossRef]
  14. Bay, E.; Martinez-Molina, A.; Dupont, W.A. Assessment of natural ventilation strategies in historical buildings in a hot and humid climate using energy and CFD simulations. J. Build. Eng. 2022, 51, 104287. [Google Scholar] [CrossRef]
  15. Kim, G.; Schaefer, L.; Lim, T.S.; Kim, J.T. Thermal comfort prediction of an underfloor air distribution system in a large indoor environment. Energy Build. 2013, 64, 323–331. [Google Scholar] [CrossRef]
  16. Fathollahzadeh, M.H.; Heidarinejad, G.; Pasdarshahri, H. Prediction of thermal comfort, IAQ, and energy consumption in a dense occupancy environment with the under floor air distribution system. Build. Environ. 2015, 90, 96–104. [Google Scholar] [CrossRef]
  17. Ascione, F.; De Masi, R.F.; Mastellone, M.; Vanoli, G.P. The design of safe classrooms of educational buildings for facing contagions and transmission of diseases: A novel approach combining audits, calibrated energy models, building performance (BPS) and computational fluid dynamic (CFD) simulations. Energy Build. 2020, 230, 110533. [Google Scholar] [CrossRef]
  18. Zhao, B.; Li, X.; Yan, Q. A simplified system for indoor airflow simulation. Build. Environ. 2003, 38, 543–552. [Google Scholar] [CrossRef]
  19. Xiangling, L.; Lingling, L.; Haiming, H. Feasibility Analysis of Transforming Existing Gymnasium into Makeshift Hospital Based on CFD Wind Environment Simulation: Taking a Gymnasium in Harbin as an Example. Contemp. Archit. 2021, 23, 22–25. [Google Scholar]
  20. Aryal, P.; Leephakpreeda, T. Effects of Partition on Thermal Comfort, Indoor Air Quality, Energy Consumption, and Perception in Air-Conditioned Buildings. J. Sol. Energy Eng. 2016, 138, 051005. [Google Scholar] [CrossRef]
  21. Wang, W.; Kimoto, S.; Kato, N.; Thuong, N.T.; Matsui, Y.; Yoneda, M. Assessment of air purification effect in sheltering houses equipped with ventilation systems after air pollution incidents. Build. Environ. 2020, 172, 106701. [Google Scholar] [CrossRef]
  22. Qian, H.; Li, Y.; Nielsen, P.V.; Hyldgaard, C.E.; Wong, T.W.; Chwang, A.T.Y. Dispersion of exhaled droplet nuclei in a two-bed hospital ward with three different ventilation systems. Indoor Air 2006, 16, 111–128. [Google Scholar] [CrossRef] [PubMed]
  23. Wang, D.R.; Hao, S.; Xu, X.G.; Liu, J.; Dong, J.K.; Wang, C.X. Environmental Simulation Study on Ward Area of Hall A of Dahuashan Shelter Hospital. HVAC 2020, 50, 60–65. [Google Scholar]
  24. Bryner, J. Photos: Coronavirus Field Hospitals across the US [EB] Livesci-Ence. Available online: https://www.livescience.com/coronavirus-field-hospitals-photos.html (accessed on 28 December 2021).
  25. Xuefeng, J. Spain learns from China’s experience, and many convention and exhibition centers become “fangcang shelter hospitals”. China Conv. Exhib. 2020, 463, 22. [Google Scholar]
  26. Jingdong, W.; Jie, L. The Shelter Hospital in St. Petersburg, Russia Will Be Put into Use Soon. Available online: http://news.cctv.com/2020/04/22/ARTiumPJcSP5EEAiTj2FiSo6200422 (accessed on 28 December 2021).
  27. Yoshitaka, T. Infection management in the sick building-National Chengyu Medical Center Hospital. Med. Welf. Constr. 2006, 150, 10–11. [Google Scholar]
  28. Machida, K.; Tanabe, S.; Hori, K. 4 Study on reduction of infection risk based on radiation air conditioning in bed room. In Proceedings of the Architectural Institute of Japan 2013 Conference Academic Lecture Abstracts Hokkaido, Kyoto, Japan, 25–29 August 2013; pp. 747–748. [Google Scholar]
  29. Liu, L.; Wei, J.; Li, Y.; Ooi, A. Evaporation and dispersion of respiratory droplets from coughing. Indoor Air 2016, 27, 179–190. [Google Scholar] [CrossRef] [PubMed]
  30. Xu, C.; Liu, L. Personalized ventilation: One possible solution for airborne infection control in highly occupied space? Indoor Built Environ. 2018, 27, 873–876. [Google Scholar] [CrossRef]
  31. Xu, C.; Nielsen, P.V.; Liu, L.; Jensen, R.L.; Gong, G. Impacts of airflow interactions with thermal boundary layer on performance of personalized ventilation. Build. Environ. 2018, 135, 31–41. [Google Scholar] [CrossRef]
  32. Fang, D.; Pan, S.; Li, Z.; Yuan, T.; Jiang, B.; Gan, D.; Sheng, B.; Han, J.; Wang, T.; Liu, Z. Large-scale public venues as medical emergency sites in disasters: Lessons from COVID-19 and the use of Fangcang shelter hospitals in Wuhan, China. BMJ Glob. Heal. 2020, 5, e002815. [Google Scholar] [CrossRef]
  33. Wang, K.; Ho, K.-F.; Leung, L.Y.-T.; Chow, K.-M.; Cheung, Y.-Y.; Tsang, D.; Lai, R.W.-M.; Xu, R.H.; Yeoh, E.-K.; Hung, C.-T. Risk of air and surface contamination of SARS-CoV-2 in isolation wards and its relationship with patient and environmental characteristics. Ecotoxicol. Environ. Saf. 2022, 241, 113740. [Google Scholar] [CrossRef]
  34. Hussain, S.; Oosthuizen, P.H. Validation of numerical modeling of conditions in an atrium space with a hybrid ventilation system. Build. Environ. 2012, 52, 152–161. [Google Scholar] [CrossRef]
  35. Myers, A.K.; Pahwa, A.; Shultis, J. Simulation based evaluation of control of residential air conditioners. Electr. Power Syst. Res. 1990, 19, 37–46. [Google Scholar] [CrossRef]
  36. Murakami, S.; Kato, H.; Nskagawa. Numerical Prediction of Horizontal Nonisothermal 3-D Jet in Room Based on the k−ε Model. ASHRAE Trans 1997, 1, 10–14. [Google Scholar]
  37. Launder, B.E.; Spalding, D.B. The numerical computation of turbulent flows. Comput. Methods Appl. Mech. Eng. 1974, 3, 269–289. [Google Scholar] [CrossRef]
  38. Nielsen, P.V. Flow in Air Conditioned Rooms; Technical University of Denmark: Copenhagen, Denmark, 1976. [Google Scholar]
  39. Gosman, A.D.; Nielsen, P.V.; Restivo, A. The flow properties in rooms with small ventilation openings. J. Fluids Eng. 1980, 102, 3216–3223. [Google Scholar] [CrossRef]
  40. Sakamoto, Y.; Matsuo, Y. Numerical predictions of three-dimensional flow in a ventilated room using turbulence models. Appl. Math. Model. 1980, 4, 67–72. [Google Scholar] [CrossRef]
  41. Chen, Q. Comparison of different k−ε models for indoor air flow computation. Numer. Heat Transf. Fundam. 1995, 28, 353–369. [Google Scholar] [CrossRef]
  42. Rouaud, O.; Havet, M. Computation of the airflow in a pilot scale clean room using K-ε turbulence models. Int. J. Refrig. 2002, 25, 351–361. [Google Scholar] [CrossRef]
  43. Blocken, B.; Stathopoulos, T.; Carmeliet, J. CFD simulation of the atmospheric boundary layer: Wall function problems. Atmos. Environ. 2007, 41, 238. [Google Scholar] [CrossRef]
  44. Yang, Y.; Gu, M.; Chen, S.; Jin, X. New inflow boundary conditions for modelling the neutral equilibrium atmospheric boundary layer in computational wind engineering. J. Wind. Eng. Ind. Aerodyn. 2009, 97, 88–95. [Google Scholar] [CrossRef]
  45. Weng, C.-L.; Kau, L.-J. Planning and Design of a Full-Outer-Air-Intake Natural Air-Conditioning System for Medical Negative Pressure Isolation Wards. J. Health Eng. 2021, 2021, 8872167. [Google Scholar] [CrossRef] [PubMed]
  46. Wang, Y.; Wong, K.K.; Du, H.; Qing, J.; Tu, J. Design configuration for a higher efficiency air conditioning system in large space building. Energy Build. 2014, 72, 167–176. [Google Scholar] [CrossRef]
  47. Humphreys, M.A.; Hancock, M. Do people like to feel ‘neutral’?: Exploring the Variation of the Desired Thermal Sensation on the ASHRAE Scale. Energy Build. 2007, 39, 867–874. [Google Scholar] [CrossRef]
  48. ISO7730-2005; Ergonomics of the Thermal Environment-Analytical Determination and Interpretation of Thermal Comfort Using Calculation of the PMV and PPD Indices and Local Thermal Comfort Criteria. ISO: Geneva, Switzerland, 2005.
  49. Esteves, D.; Silva, J.; Rodrigues, N.; Martins, L.; Teixeira, J.; Teixeira, S. Simulation of PMV and PPD Thermal Comfort Using Energy Plus. In Computational Science and Its Applications—ICCSA 2019; Springer: Cham, Switzerland, 2019; pp. 52–65. [Google Scholar]
  50. Papineni, R.S.; Rosenthal, F.S. The Size Distribution of Droplets in the Exhaled Breath of Healthy Human Subjects. J. Aerosol Med. 1997, 10, 105–116. [Google Scholar] [CrossRef]
Figure 1. Research flowchart.
Buildings 13 01269 g001
Figure 2. Physical model of Fangcang shelter hospital.
Buildings 13 01269 g002
Figure 3. The air supply system model of the cloth bag air duct.
Buildings 13 01269 g003
Figure 4. Mesh of Fangcang shelter hospital.
Buildings 13 01269 g004
Figure 5. Velocity distribution at the height of 1.65 m section in Scheme 1.
Buildings 13 01269 g005
Figure 6. Velocity distribution at the height of 1.65 m section in Scheme 2.
Buildings 13 01269 g006
Figure 7. Velocity distribution at the height of 1.65 m section in Scheme 3.
Buildings 13 01269 g007
Figure 8. Temperature distribution at the height of 0.65 m section in Scheme 1.
Buildings 13 01269 g008
Figure 9. Temperature distribution at the height of 0.65 m section in Scheme 2.
Buildings 13 01269 g009
Figure 10. Temperature distribution at the height of 0.65 m section in Scheme 3.
Buildings 13 01269 g010
Figure 11. Temperature distribution at the height of 1.65 m section in Scheme 4.
Buildings 13 01269 g011
Figure 12. Temperature distribution at the height of 1.65 m section in Scheme 5.
Buildings 13 01269 g012
Figure 13. Temperature distribution at the height of 1.65 m section in Scheme 6.
Buildings 13 01269 g013
Figure 14. Mass fraction of pollutants at the height of 1.65 m section in Scheme 7.
Buildings 13 01269 g014
Figure 15. Mass fraction of pollutants at the outlet in Scheme 7.
Buildings 13 01269 g015
Figure 16. Mass fraction of pollutants at the height of 1.65 m section in Scheme 8.
Buildings 13 01269 g016
Figure 17. Mass fraction of pollutants at the outlet in Scheme 8.
Buildings 13 01269 g017
Figure 18. Mass fraction of pollutants at the height of 1.65 m section in Scheme 9.
Buildings 13 01269 g018
Figure 19. Mass fraction of pollutants at the outlet in Scheme 9.
Buildings 13 01269 g019
Figure 20. Diagram of discharge ventilation efficiency of three schemes changing with air exhaust volume of single bed.
Buildings 13 01269 g020
Figure 21. Velocity distribution at the height of 1.65 m section in Scheme 7.
Buildings 13 01269 g021
Figure 22. Velocity distribution at the height of 1.65 m section in Scheme 8.
Buildings 13 01269 g022
Figure 23. Velocity distribution at the height of 1.65 m section in Scheme 9.
Buildings 13 01269 g023
Figure 24. Vertical plane vector diagram in Scheme 7.
Buildings 13 01269 g024
Table 1. Model parameters.
ModelModel Size (m)
Hospital bed area70.1(L) × 40.8(W) × 10(H)
Hospital bed1.95(L) × 0.9(W) × 0.6(H)
Outer baffle2(H) × 0.1(W)
Nurse station10(L) × 2(W) × 1(H)
Cloth bag air duct0.8(D) × 19.2(L)
Inlet0.015(W) × 19.2(L)
Outlet1.5(L) × 0.6(W) × 1(H)
Door gap0.05(W)
(L: length; W: width; H: height).
Table 2. Mesh independence verification table.
Number of Meshes (Million)Average Temperature of Plane 1 (°C)Relative ErrorAverage Temperature of Plane 2 (°C)Relative Error
2.8425.55-26.04-
3.0425.640.35%26.120.31%
3.2625.660.08%26.130.04%
Table 3. Boundary condition parameters.
BoundaryTypeParameters
Enclosure wallWallConvection Heat Transfer, t = 35   ° C
Door gapPressure inlet t = 35   ° C
DoorWallConvection Heat Transfer, t = 35   ° C
BaffleWallHeat insulation
Floor, ceilingWallConvection Heat Transfer, t = 35   ° C
BedWallConstant heat flux, q = 7.8   W / m 2
Exhaust air outletVelocity inlet v = 2.1   m / s
Supply air inletVelocity inlet v = 1.74   m / s
Table 4. Air supply plan under different lifting heights.
Schemes Lifting Height h (m)Supply Air Temperature t (°C)Air Supply Volume of Single Bed (m3/h)
1418150
24.5
35
Table 5. PMV indexing table.
Hot FeelingHotWarmSlightly WarmModerateSlightly CoolCoolCold
PMV+3+2+10−1−2−3
Table 6. Indoor comfort level classification.
LevelPPDPMV
Grade I≤10%−0.5 ≤ PMV ≤ +0.5
Grade II10% < PPD ≤ 27%0.5 < |PMV| ≤ 1
Grade III>27%|PMV| > 1
Table 7. Air supply plan under different air supply temperature.
SchemeSupply Air Temperature (°C)Air Supply Volume of Single Bed (m3/h)Lifting Height h (m)
416150 4.5
518
620
Table 8. Calculation of thermal comfort index at each air supply temperature.
Average Wind Speed (m/s)Supply Air Temperature (°C)Average Temperature (°C)PMVPPD (%)
0.251625.10.3878.12
1825.60.4859.83
2026.30.62312.98
Table 9. Physical parameters of CO2.
Material NameAttributeUnitValue
CO2Density kg / m 3 1.764
Specific heat at constant pressure J / ( kg · ° C ) 852
Thermal conductivity W / ( m · ° C ) 0.01642
Kinematic viscosity kg / ( m · s ) 8.5062 × 10⁻⁶
Table 10. Air supply plan under different exhaust air volume.
SchemeAir Supply Volume of Single Bed (m3/h)Supply Air Temperature t (°C) Lifting Height h (m)
7150184.5
8200
9300
Table 11. Discharge efficiency.
Scheme Air Exhaust Volume of Single Bed (m3/h)Dilution MultipleDischarge Ventilation Efficiency
7150 80669.6%
8200 84770.1%
9300 90170.3%
Disclaimer/Publisher’s Note: The statements, opinions and data contained in all publications are solely those of the individual author(s) and contributor(s) and not of MDPI and/or the editor(s). MDPI and/or the editor(s) disclaim responsibility for any injury to people or property resulting from any ideas, methods, instructions or products referred to in the content.

