Article

3-D Numerical Simulation of Seismic Response of the Induced Joint of a Subway Station

School of Civil Engineering, Chang’an University, Xi’an 710064, China
*
Author to whom correspondence should be addressed.
Buildings 2023, 13(5), 1244; https://doi.org/10.3390/buildings13051244
Submission received: 30 March 2023 / Revised: 27 April 2023 / Accepted: 6 May 2023 / Published: 9 May 2023

Abstract

:
In recent times, induced joints have been set along the length of subway stations in order to avoid disordered cracking of the main structures occurring due to temperature stress, concrete shrinkage, creep, or uneven foundation settlement. At present, the use of induced joints in subway station structures is mainly based on engineering experience. The seismic response of induced joints has not yet been well explained, much less mastered. In this study, a 3-D numerical model of a subway station incorporating certain sorts of induced joints is established systematically. Then, the seismic response of those induced joints applied in different positions and various forms has been studied under different seismic waves by varying the spectral characteristics and peak acceleration values of the waves. The results show that the horizontal relative sliding displacement of the structures on both sides of an induced joint increases gradually from bottom to top along the structure of the subway station. While the vertical sliding displacements that occur along the section width are larger at both ends of the induced joints than in the middle. What is more, with an increase in seismic intensity, the horizontal relative sliding displacement becomes larger, while the vertical displacement becomes even smaller. In addition, the relative sliding displacement can be reduced by increasing the residual longitudinal reinforcement ratio of the induced joint. Furthermore, it is discovered that the setting of key grooves at the bottom plate of the induced joint section has a certain effect on controlling the horizontal relative sliding displacement, as well as a significant effect on preventing the vertical relative dislocation of the structures on both sides of the induced joint.

1. Introduction

At present, the longitudinal length of subway stations constructed in China is relatively large, usually reaching 120–300 m. In order to avoid disordered cracking of the subway station structure caused by temperature stress, concrete shrinkage, creep, or uneven settlement of the foundation, induced joints are usually set along the longitudinal direction of the subway station structure, as shown in Figure 1. The amount of longitudinal reinforcement used at the induced joint of the subway station structure is 30–40% of the normal section, and concrete is poured in stages, forming a weak link in crack concentration distribution. Under the action of an earthquake, the induced joints of the subway station structure in loess stratum may be damaged initially, which then leads to the overall damage of the structure. In addition, the presence of the induced joint can easily cause excessive horizontal relative sliding, vertical relative movement, and bending of the track structure, which endangers the safety of running trains. When considering the spatial effects of seismic damage in transfer subway stations with complex shapes, the seismic damage to the induced joints and structures can be more severe, resulting in significant economic, life, and property losses, which are difficult to repair after an earthquake.
In recent years, a lot of research has been conducted on the seismic performance of underground structures and the response of different foundations and structures under earthquake action through theoretical analysis [1,2,3], experiment [4,5,6], and numerical simulation [7,8,9]. Some studies took the subway structure as the main research object and obtained results that provided a rich theoretical basis and practical experience for the improvement of earthquake resistance in subway construction. In terms of theoretical studies, Jeng and Lu [10] proposed a theoretical method to analyze the vibration of an underground circular tunnel with jointed linings subjected to seismic waves. This method treats the surrounding medium as a linear elastic medium, but the results obtained by this method can better reflect the vibration distribution law and provide a reference basis for related problem experiments and numerical simulation research. Based on the theory of dynamic interaction between soil and structure, Lin et al. [11] proposed a new model for the seismic response of underground structures for scattering and diffraction analysis and verified the accuracy and efficiency of this method through numerical examples. Carlos et al. [12] proposed an improved simple calculation method for seismic internal forces of shallow-buried rectangular underground structures. The results indicated that this method could predict structural internal forces more accurately than the existing simplified methods. Mehdi et al. [13] carried out a theoretical study on the seismic response of an elastic homogeneous ground surface in the presence of unlined horseshoe-shaped underground cavities subjected to obliquely propagating incident SH-waves by using the time-domain half-plane boundary element method. Zhao et al. [14] developed the response spectrum method (RSM) for the seismic analysis of underground structures, including seismic soil-structure interaction (SSI), and established an SSI analysis model composed of the underground structures and their adjacent soil. The research shows that this method has high accuracy and can meet engineering requirements. However, there are few theoretical studies on the seismic response of subway station structures, and the abovementioned analysis methods cannot accurately predict the seismic response and failure characteristics of subway underground structures, let alone structures with induced joints.
In terms of experimentation, the main research method is shaking table tests. For instance, Iwatate et al. [15] used a shaking table test to study the destruction process of subway underground structures in the Kobe earthquake. The results showed that the collapse of the Dakai Station structure was caused by the inability of the horizontal lateral stiffness of the central column to resist seismic shear loads. By taking the buried open-cut subway tunnel in San Francisco Bay as the research object, Chou et al. [16] carried out a centrifugal shaking table test to study the influence of actual site conditions of loose sand and gravel backfill in the offshore bay on structural seismic response. Cilingir et al. [17] used aluminum alloy and loose dry sand to make model structures and foundations, respectively, conducted centrifugal shaking table tests of circular and square tunnels, and revealed the dynamic internal force response of tunnel structures. Baziar et al. [18] studied rectangular underground structures in sand through centrifugal shaking table tests and analyzed the influence of underground structures on the ground acceleration response. Ulgen et al. [19] conducted a series of dynamic centrifuge tests on a box-shaped flexible underground structure and obtained the responses of soil and buried structure models under harmonic motions with different accelerations and frequencies. Dashti et al. [20] evaluated the seismic effects of high-rise buildings on adjacent shallow-buried underground structures through a series of centrifugal shaking table tests. Masoud et al. [21] conducted a series of shaking table tests to study the influence of a circular subway tunnel on ground motion amplification patterns. Quan et al. [22] carried out a large-scale shaking table test of the subway station in loess regions, revealed the seismic response law of the subway station under the action of earthquakes, and listed the weak parts of subway station structures. Then, through numerical simulation analysis of the seismic response of subway stations in loess regions, the horizontal displacement, peak acceleration, contact soil pressure, and structural damage distribution of the system were studied. In addition, shaking table test studies of subway underground structures in soft clay, slightly inclined sites, and liquefiable sites have fully revealed the interaction mode of soil and underground structures under seismic load [23,24,25,26,27]. Shaking table tests and centrifugal shaking table tests show great advantages in studying seismic response characteristics of underground structures, and can intuitively obtain characteristics such as failure modes, weak nodes, and displacement changes. However, these tests cost too much, and a single experiment cannot comprehensively conduct a full variable parameter analysis. In addition, the existing experimental studies are all based on the overall model, and the experimental studies on the seismic response of induced joints in subway underground structures are rarely reported.
Due to the disadvantages of the high cost of shaking table tests and the inability to carry out multiple working condition analyses at the same time, numerical simulation has become an effective and economical method to study the dynamic response of the structure. The main numerical methods applied to underground structural seismic response are the finite element method and the improved finite element method. The main difficulties in simulation are the input of seismic motion, boundary processing, and the accurate establishment of the model. Through nonlinear finite element simulation, Parra et al. [28] analyzed the seismic response of the Dakai subway station under the action of an earthquake by numerical simulation and compared it with actual earthquake damage. In view of the important influence of soil–structure interaction on the seismic resistance of structural systems, some scholars have tried to use numerical methods to study the dynamic interaction of subway station–soil–adjacent high-rise building systems and analyze the influence of subway stations on the seismic response characteristics of adjacent structures [29,30]. As the site characteristics and soil stratum also greatly affect the seismic response of underground structures, relevant studies pay more and more attention to the influence of soil properties. For example, Conti et al. [31] and Abate et al. [32] carried out a numerical analysis based on a centrifugal shaking table test of a tunnel structure in a sandy soil foundation. The study showed that the acceleration response of numerical simulation was consistent with that of a model test, but there were certain differences in the dynamic internal forces of the structure. Keykhosropour et al. [33] conducted a numerical simulation study on the seismic response characteristics of deep-buried underground flexible structures in sandy soil and analyzed the effects of internal friction Angle, cohesion, and structural stiffness on the development of seismic earth pressure and wall deformation. Yoo et al. [34] developed a dynamic numerical analysis model based on PLAXIS2D and conducted a series of dynamic numerical analyses for deep underground structures under various earthquake conditions. Sun et al. [35] carried out numerical simulations to study the critical difference in the seismic performances of three- and four-sided box culverts. In this study, a variety of burial depths, flexibility ratios, and foundation widths of the culverts were considered. The findings of this work shed light on the critical role of the bottom slab in the seismic responses of box culverts. Wang et al. [36] established a numerical model of the composite structure of a subway station combined with a flyover under earthquake action through the finite element method and analyzed the dynamic response of the subway station and bridge pier and pile under earthquake action. Alejandro et al. [37] proposed a numerical method based on the indirect boundary element method (IBEM) to calculate the seismic amplification in the weak parts of floating and underground tunnels. The above extensive research results fully demonstrate that the finite element and improved finite element methods can accurately and effectively simulate the seismic response of underground structures in complex geological environments. Therefore, it is feasible to study the seismic response of induced joints in subway stations through finite element numerical simulation.
Induced joints have been widely used in subway stations in many large and medium-sized cities in China, but the seismic design method of the inducted joints has not been given in the current specifications. There is still a lack of research on the seismic resistance of subway station structures with induced joints, especially on the horizontal relative sliding effect of the structure at the induced joints, and the force transfer effect of remaining longitudinal reinforcement has not been reported. In view of this, in the present study, based on the overall dynamic time-history analysis method, a 3-D non-linear finite element model of the seismic response of a typical subway station in loess soil with induced joints is established, and its reliability is verified. The seismic response characteristics of induced joints in subway stations under the action of seismic waves with different spectral contents and different peak accelerations are studied. In addition, the influence of different factors on the seismic response of induced joints of subway stations is analyzed by variable parameters. This research can reveal the basic law of seismic response of induced joints in subway stations and the influencing factors, which will be of great significance for controlling the deformation of induced joints in subway stations under earthquake action and can provide an important reference for the seismic design of induced joints in subway stations.

2. Shaking Table Test and Numerical Simulation Method

In the preliminary research [22], large-scale shaking table tests were carried out to obtain the seismic response law of subway stations in loess regions under earthquake action. In this paper, the numerical simulation method is used to carry out a follow-up study in order to obtain the seismic response of induced joints. The prerequisite of an accurate numerical simulation is to verify the accuracy of numerical methods. Therefore, in this section, the accuracy of the numerical method is verified by comparing the results of model tests under the same working conditions as the shaking table tests.

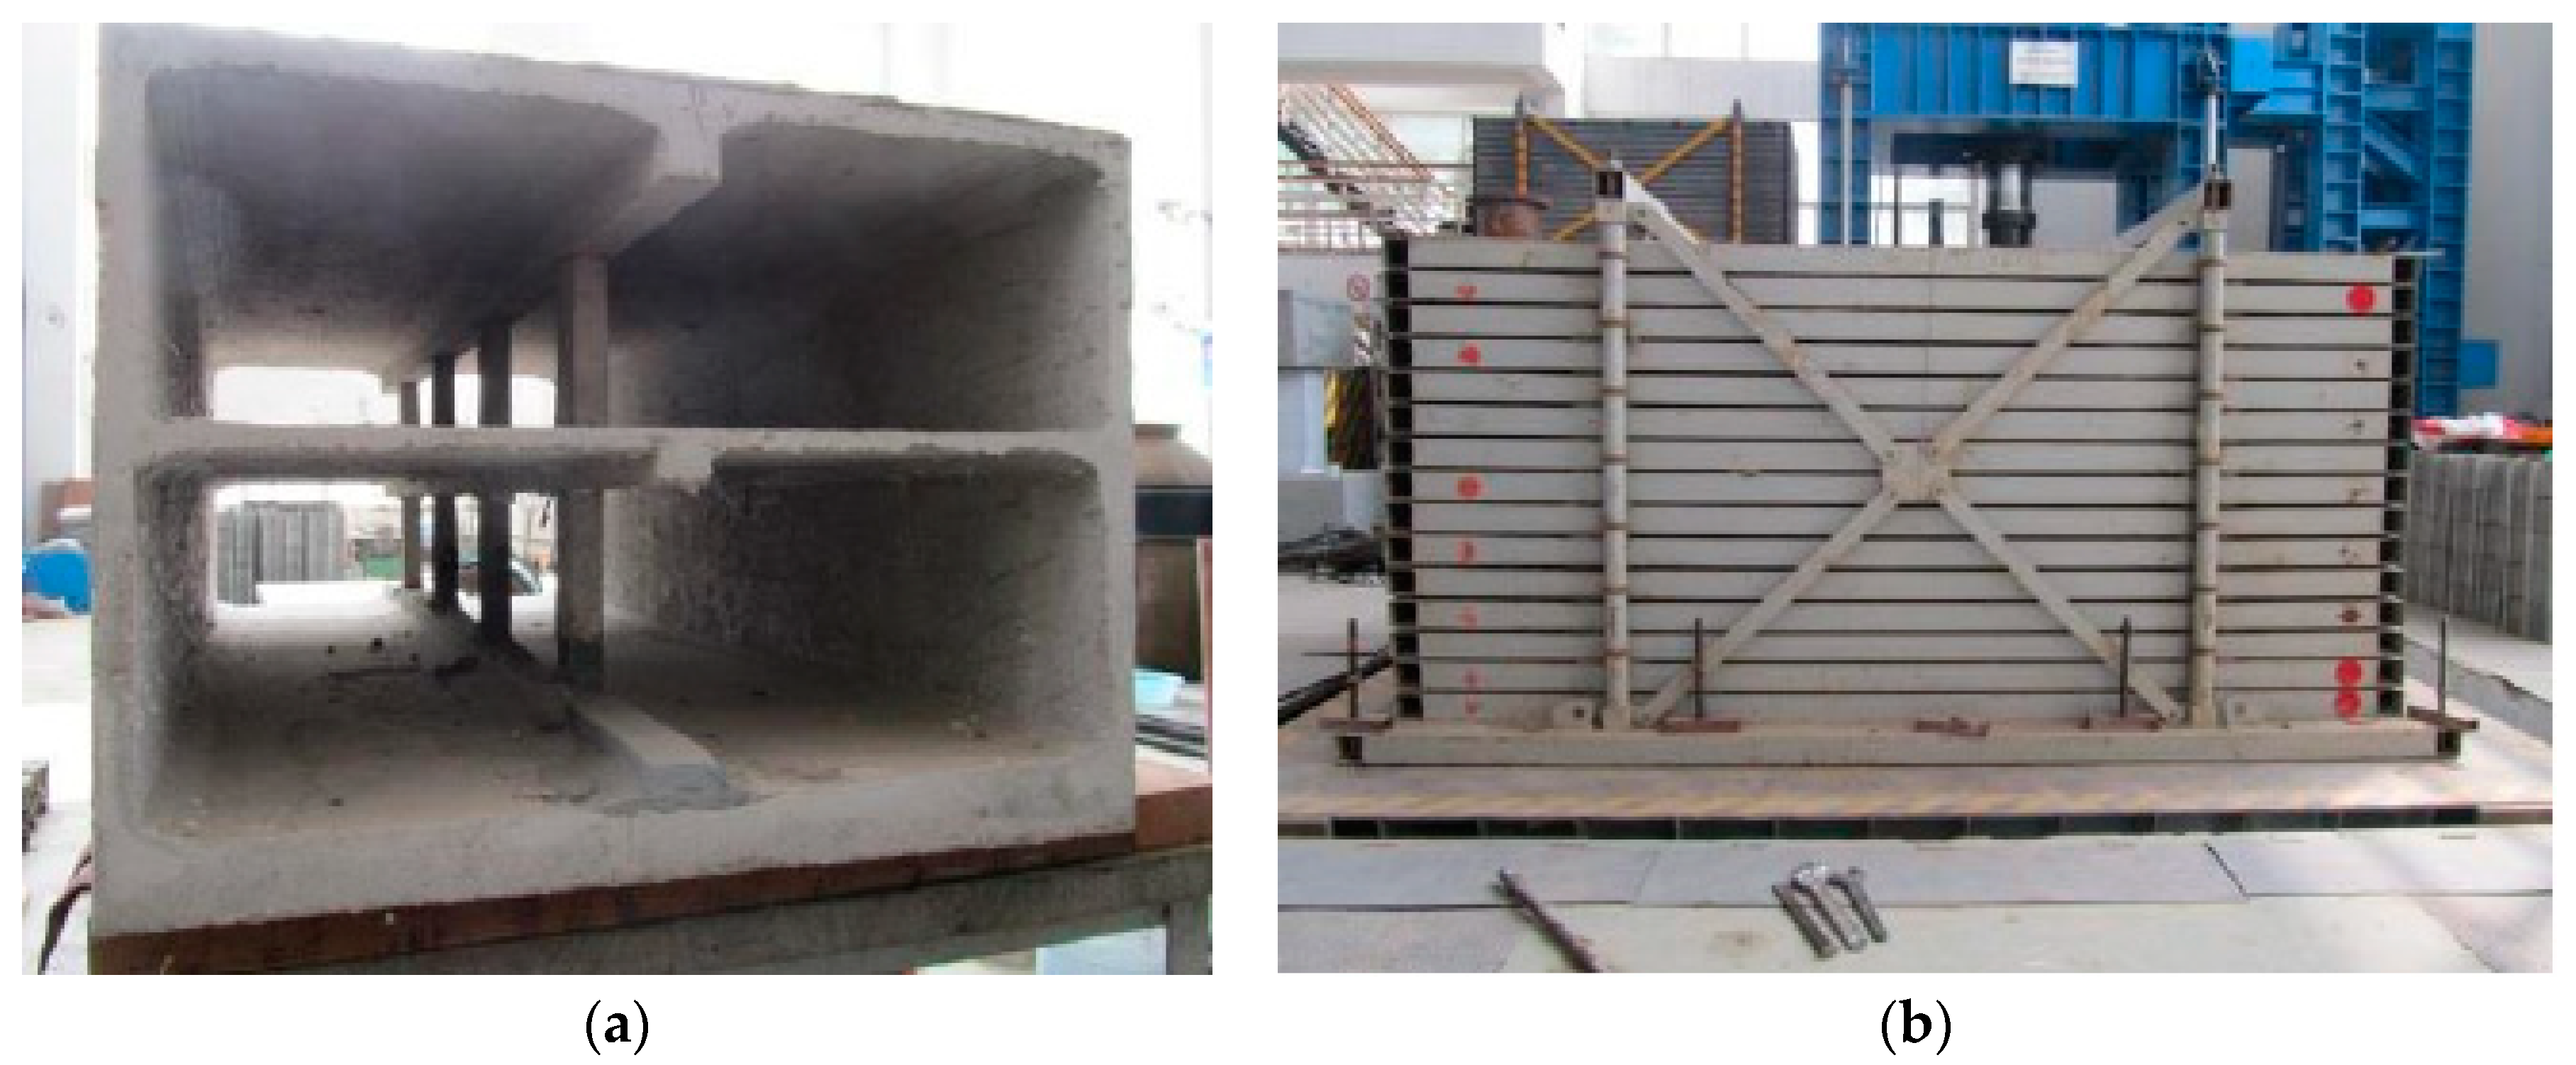
2.1. Information Related to Previous Shaking Table Test

In the shaking table test, the under-artificial quality model was adopted for the similarity model based on the structure of the subway station. Length, elastic modulus, and acceleration were selected as the basic physical quantities for the similarity design. The size of the table was 3.36 m × 4.86 m (vibration direction). The size of the model box was 3.7 m (vibration direction) × 2.2 m (longitudinal direction) × 1.7 m (vertical direction). The length similarity ratio was λl = 1/30, and the similarity ratio of the modulus of elasticity was λE = 1/5.
In the preliminary shaking table test, particulate concrete with similar mechanical properties to ordinary concrete was used to simulate ordinary concrete. The compressive strength of the particulate concrete cube was 8.11 MPa, and the elastic modulus was 6602 MPa, which met the requirements of the similarity relationship between the model materials and prototype structural materials. The steel reinforcement of the prototype concrete structure was simulated by galvanized steel wire. The model structure is shown in Figure 2. In the shaking table test, the model foundation soil was taken from the foundation pit of Feitian Road Station of Xi’an Metro Line 4, located 6–8 m below the ground surface.
The model soil box used for the shaking table test was a laminated shear model soil box, as shown in Figure 2b. When making the model foundation, layers of soil samples were loaded into the model soil box, and the water content and density were controlled according to the natural water content and density of the soil in the prototype site. The surface of the lower soil body was roughened before each layer of loess was added.

2.2. Numerical Simulation of the Shaking Table Test

Based on the shaking table test in the previous study, a three-dimensional numerical model of the seismic response of a subway station was established using ABAQUS (version number 6.14) finite element software. The model structure size was determined according to the geometric similarity ratio and was 3.5 m (vibration direction) × 2.0 m (longitudinal direction) × 1.4 m (vertical direction). In order to ensure the calculation accuracy as well as reduce the calculation time cost, the numerical model was calculated along the longitudinal half structure under symmetric boundary conditions. The numerical calculation model is shown in Figure 3. The number and location of monitoring points in the model remain the same as in the shaking table test. The equivalent linear model was used to simulate the non-linear dynamic characteristics of loess. The stratified and transitive parameters of the loess foundation are shown in Table 1, where the values of each parameter are measured in the laboratory, consistent with the previous study [22]. In the preliminary shaking table test, the structure of a subway station was made of particulate concrete model material after repeated debugging. Through the mechanical properties test, it was found that the CDP model is reasonable to use in simulating the dynamic damage evolution process of structural particulate concrete, and its model parameters are shown in Table 2. The ideal elastoplastic model was used to simulate the mechanical deformation characteristics of galvanized steel wire in the structure. The full integration unit C3D8 was used for the model structure, the reduced integration unit C3D8R was used for the model foundation, and the 3-D truss unit T3D2 was used for the model reinforcement. The bond between steel bars and concrete was simulated by embedding steel bars into the concrete using the Embedded command. The soil grid was divided according to the principle of gradually sparse from near to far, and the induced cracks and the adjacent grids were properly encrypted. Songpan, Taft, and Xi’an artificial waves were selected as input seismic waves.

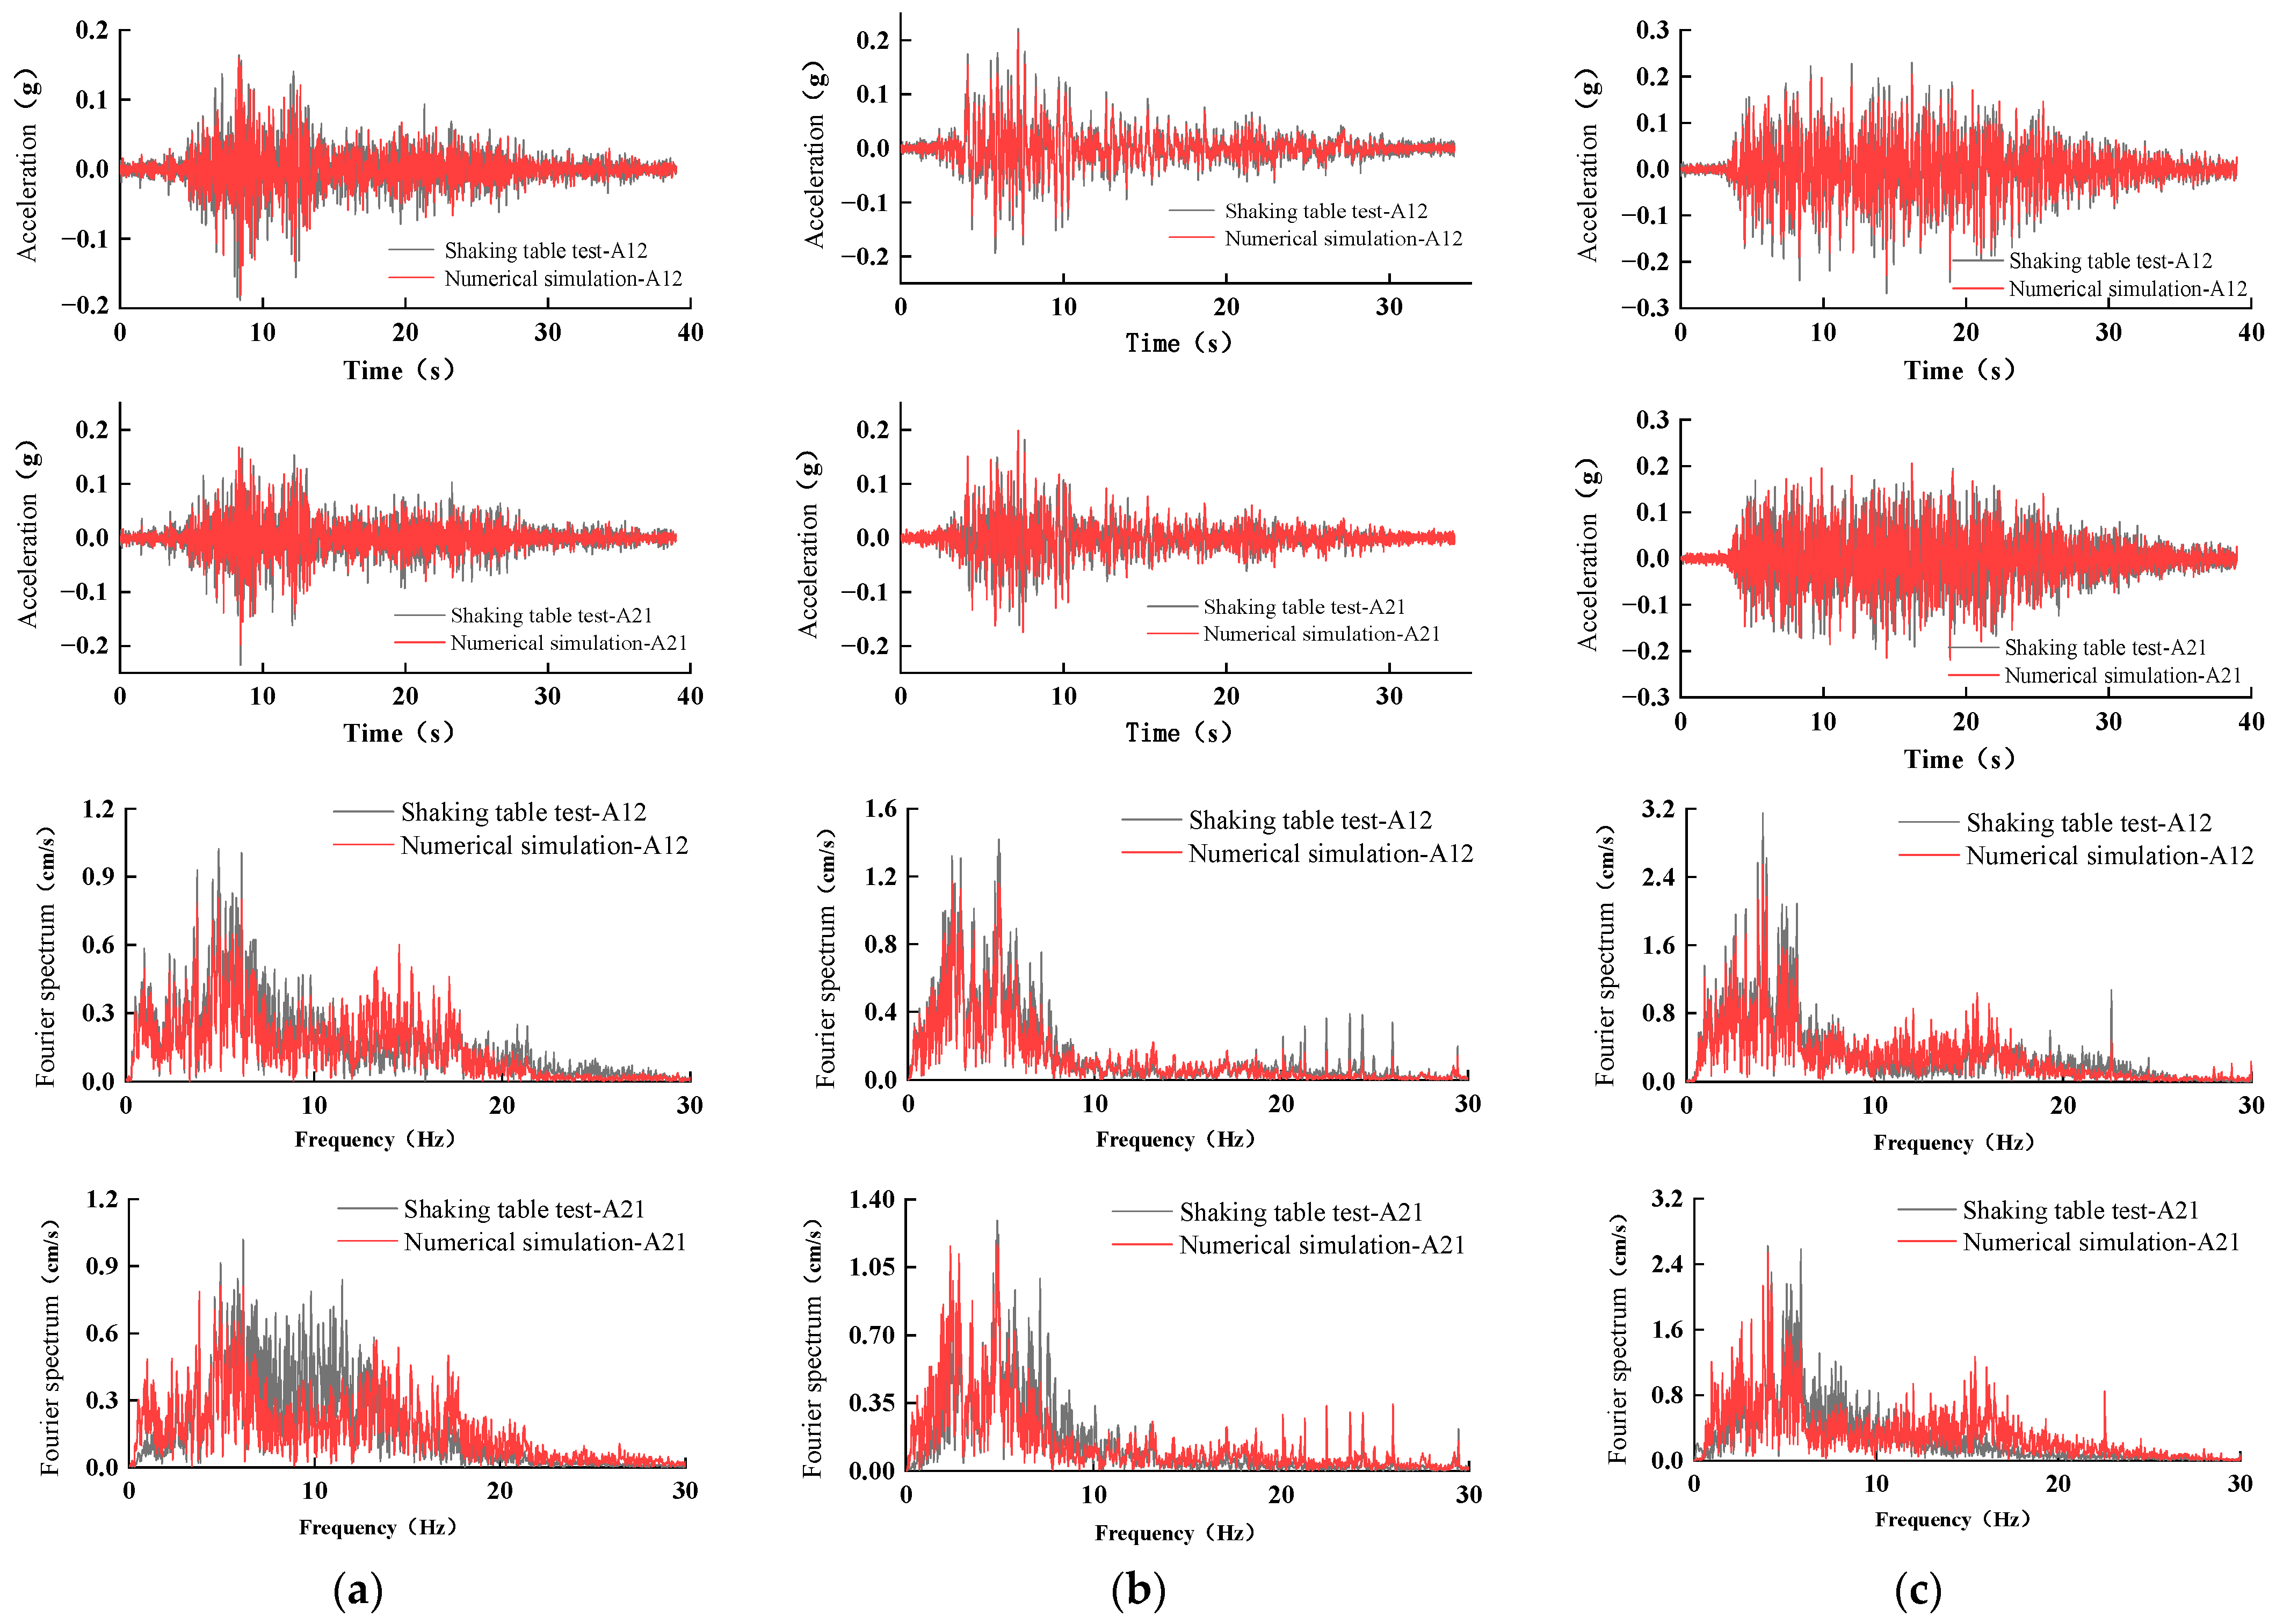
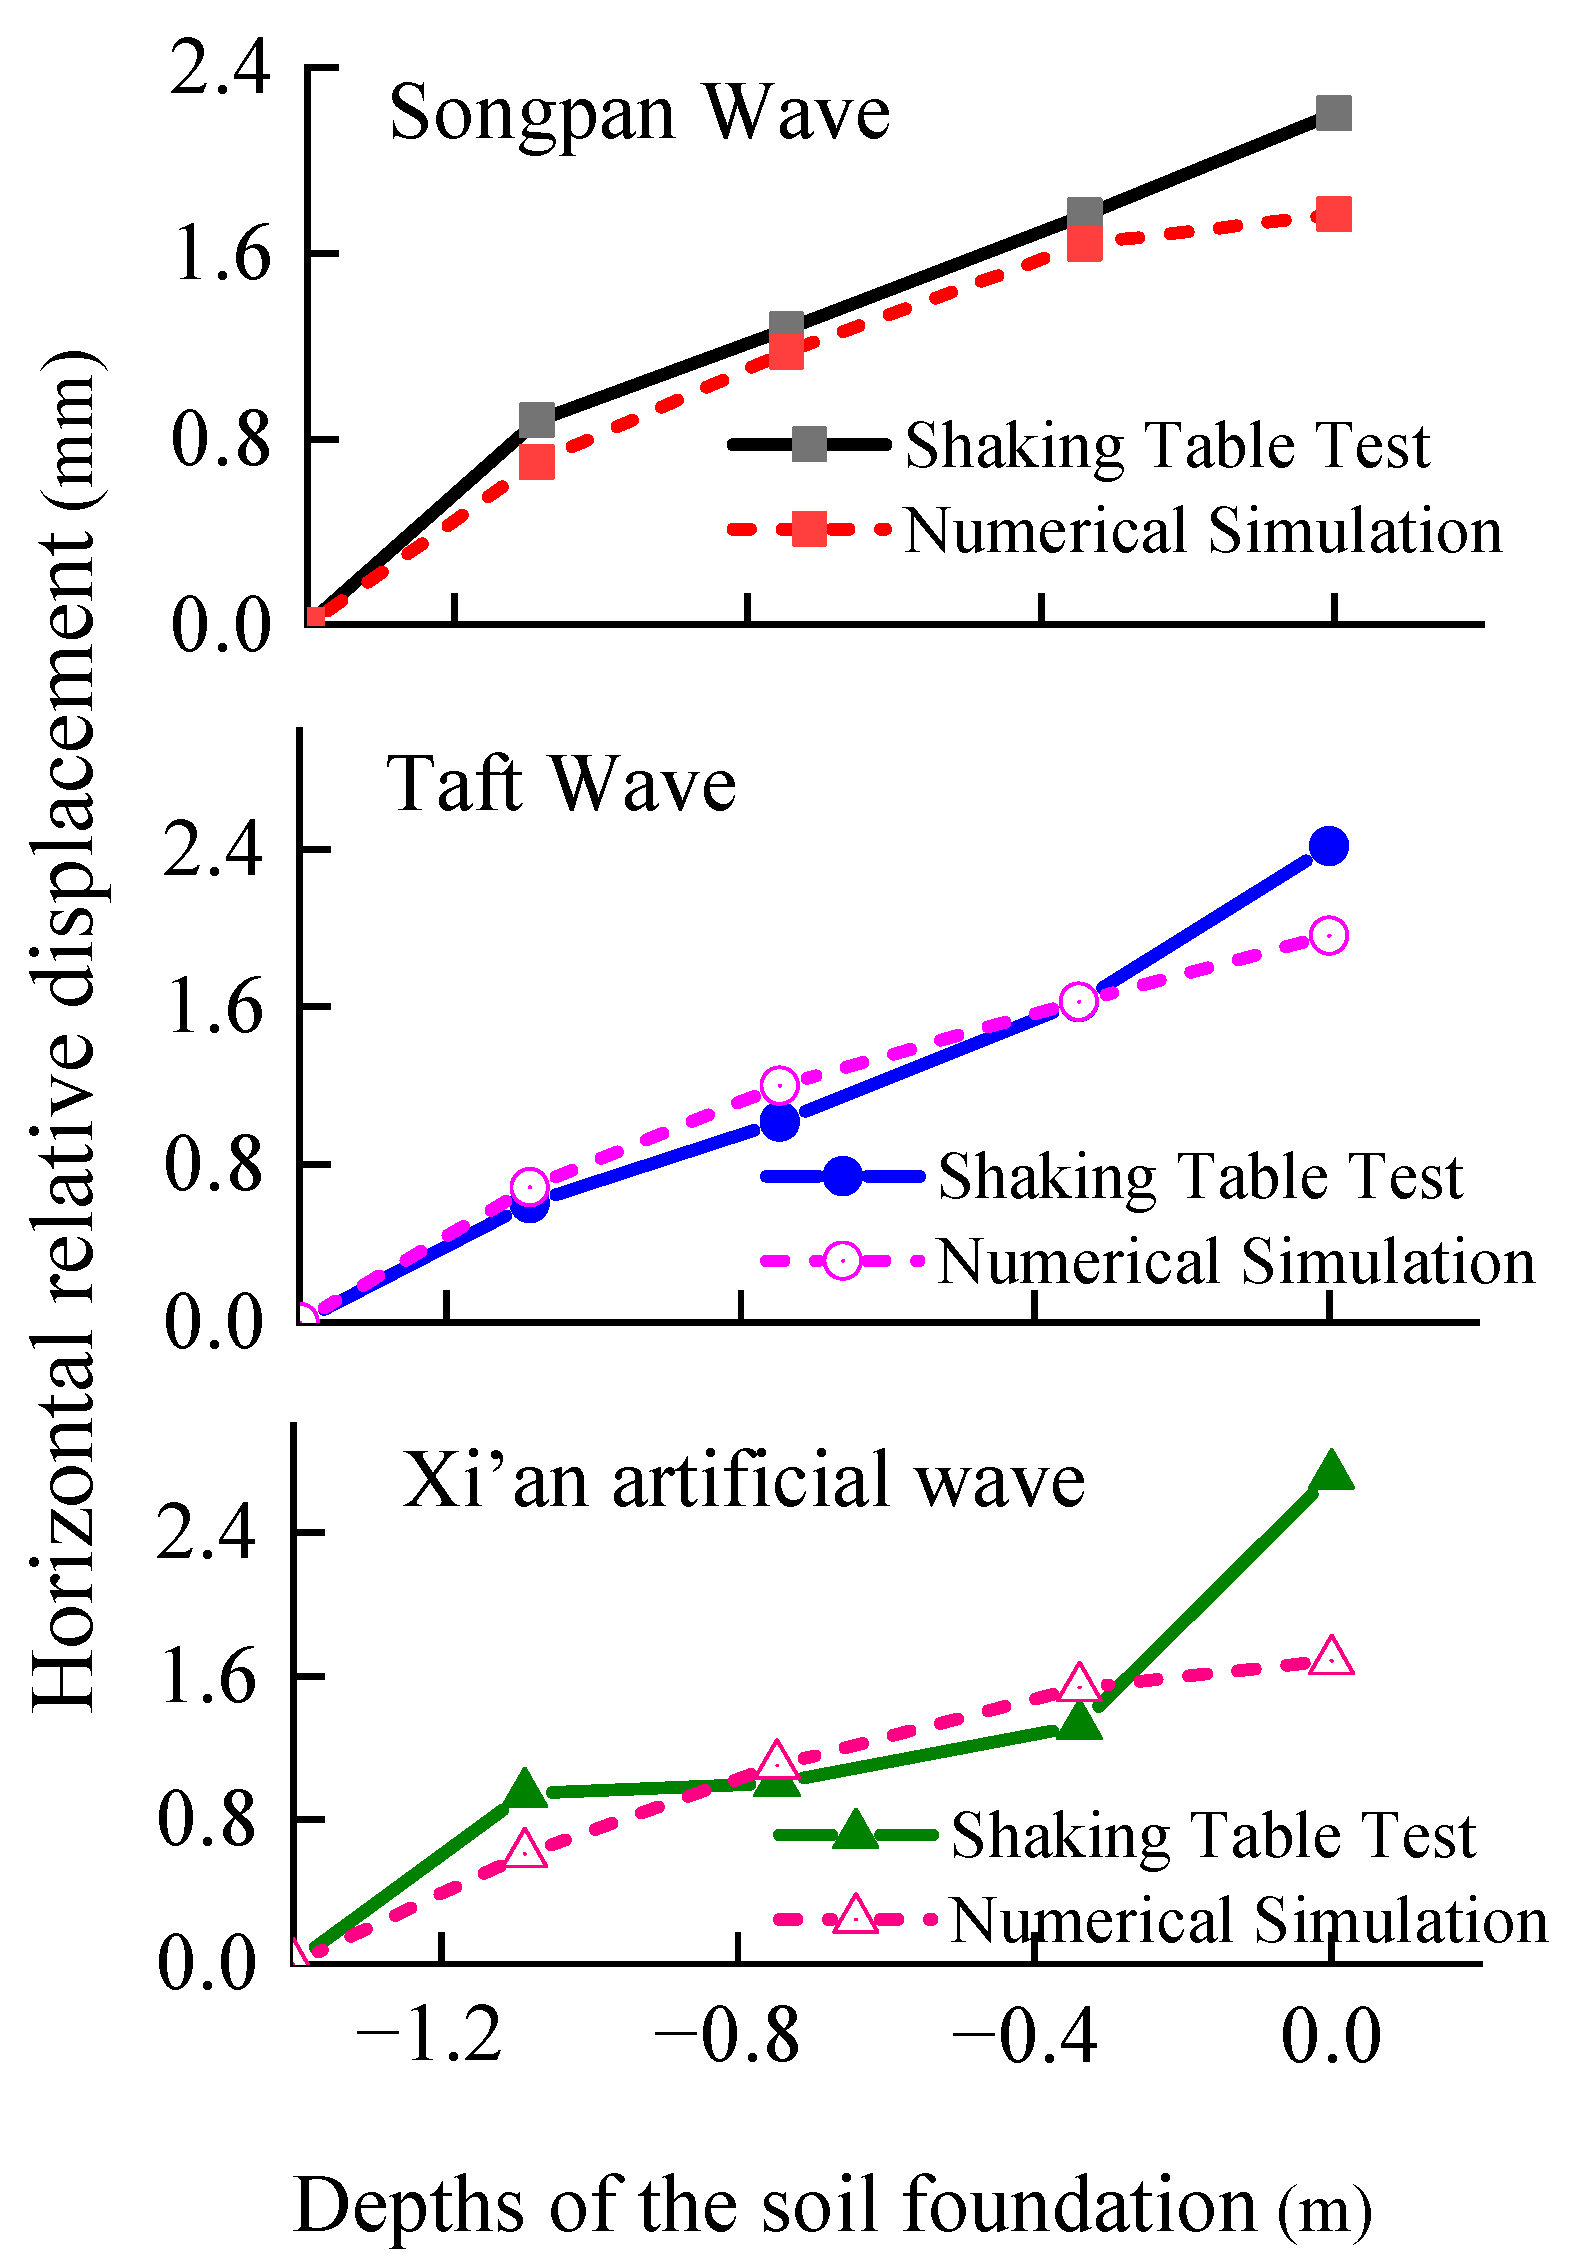
2.3. Acceleration Response Comparison

Under the action of three kinds of seismic waves, the acceleration time history curves and corresponding Fourier spectra of two measuring points in the shaking table test and numerical simulation were compared as shown in Figure 4. The two measuring points were A12 on the model foundation and A21 on the model structure, respectively.
It can be seen from the figure that the acceleration response time history curve waveform, peak acceleration, Fourier transform spectra composition characteristics, basic frequency, and corresponding Fourier amplitude at each measuring point in the shaking table test and numerical simulation are largely the same. A slight difference exists between the Fourier transform spectra of the acceleration response at each measuring point in the shaking table test and numerical simulation in the range of 5–20 Hz, but the difference gradually disappears with the increase in burial depth of the measuring point. When Songpan waves, Taft waves, and Xi’an artificial waves with a peak acceleration of 0.2 g are respectively input, the horizontal relative displacement of the foundation at different depths is calculated through the shaking table test and numerical simulation, as shown in Figure 5. As can be seen, the horizontal relative displacement distributions of the model foundation in the shaking table test and numerical simulation are consistent, and both increase with the decrease in soil depth. Under the three seismic wave conditions, except for the surface measurement point, the calculated results of other measurement points are very close, and the maximum error of the two methods is about 16%. Hence, the numerical analysis method and the three-dimensional numerical model established in this paper can well simulate the seismic response characteristics of the whole system during the dynamic interaction between a loess soil site and a subway station, and have good reliability. Thus, it can be inferred that the numerical method is also accurate and feasible for use in carrying out a study of the three-dimensional seismic response of the induced joints of subway stations under loess site conditions.

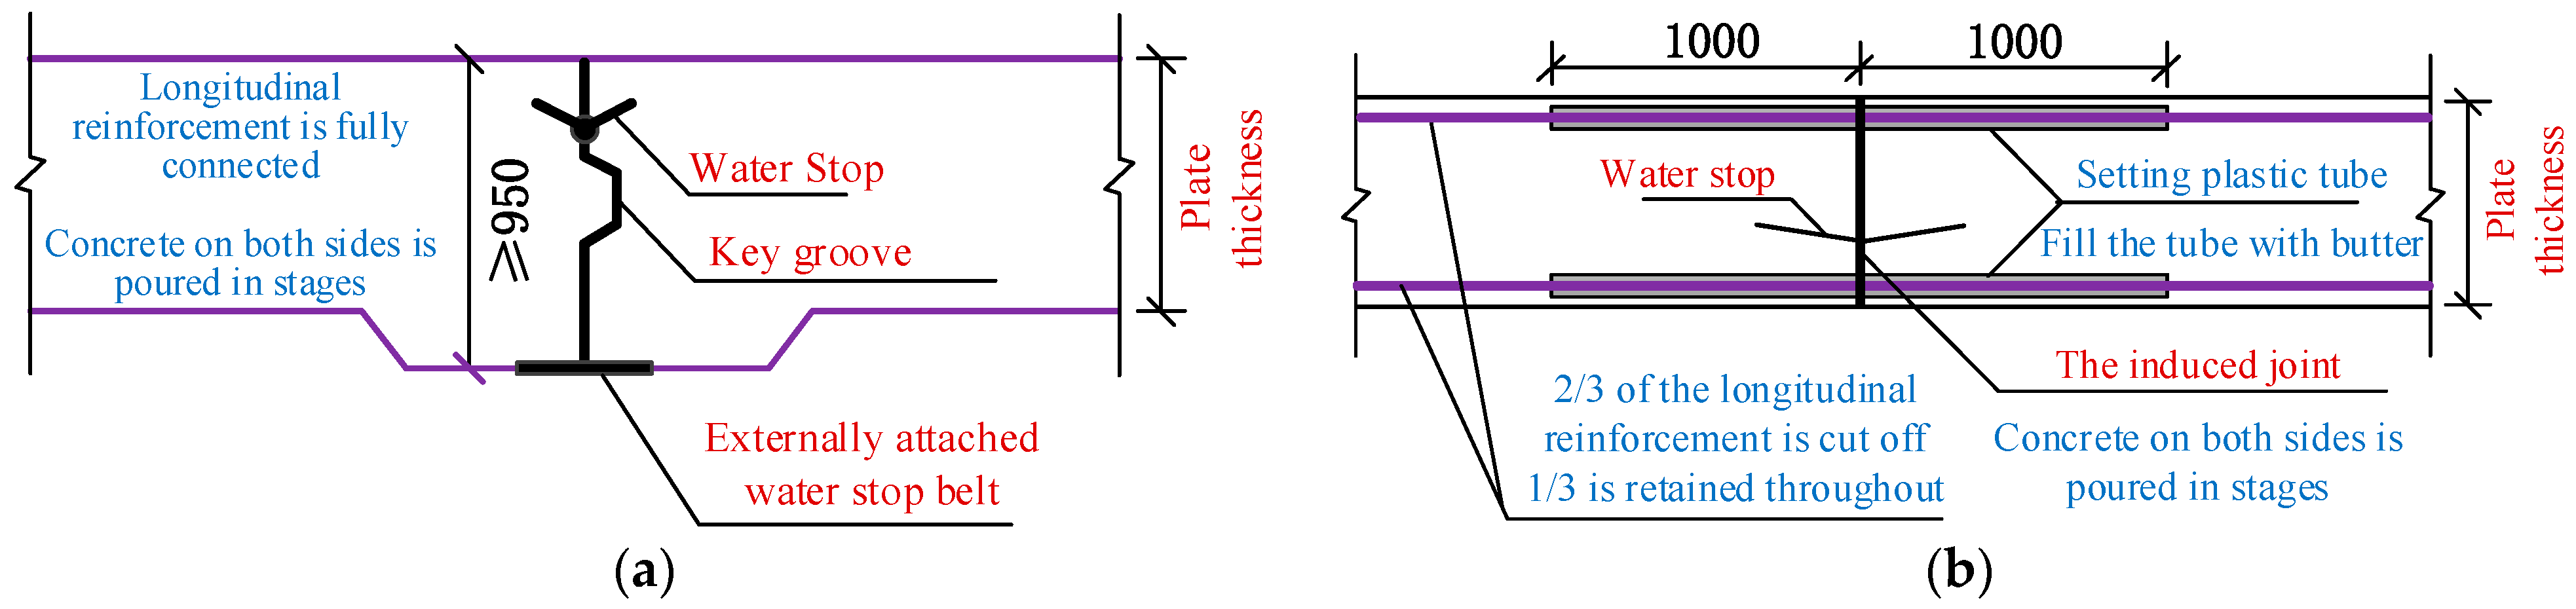
3. Numerical Model of the Induced Joint of the Subway Station Structure

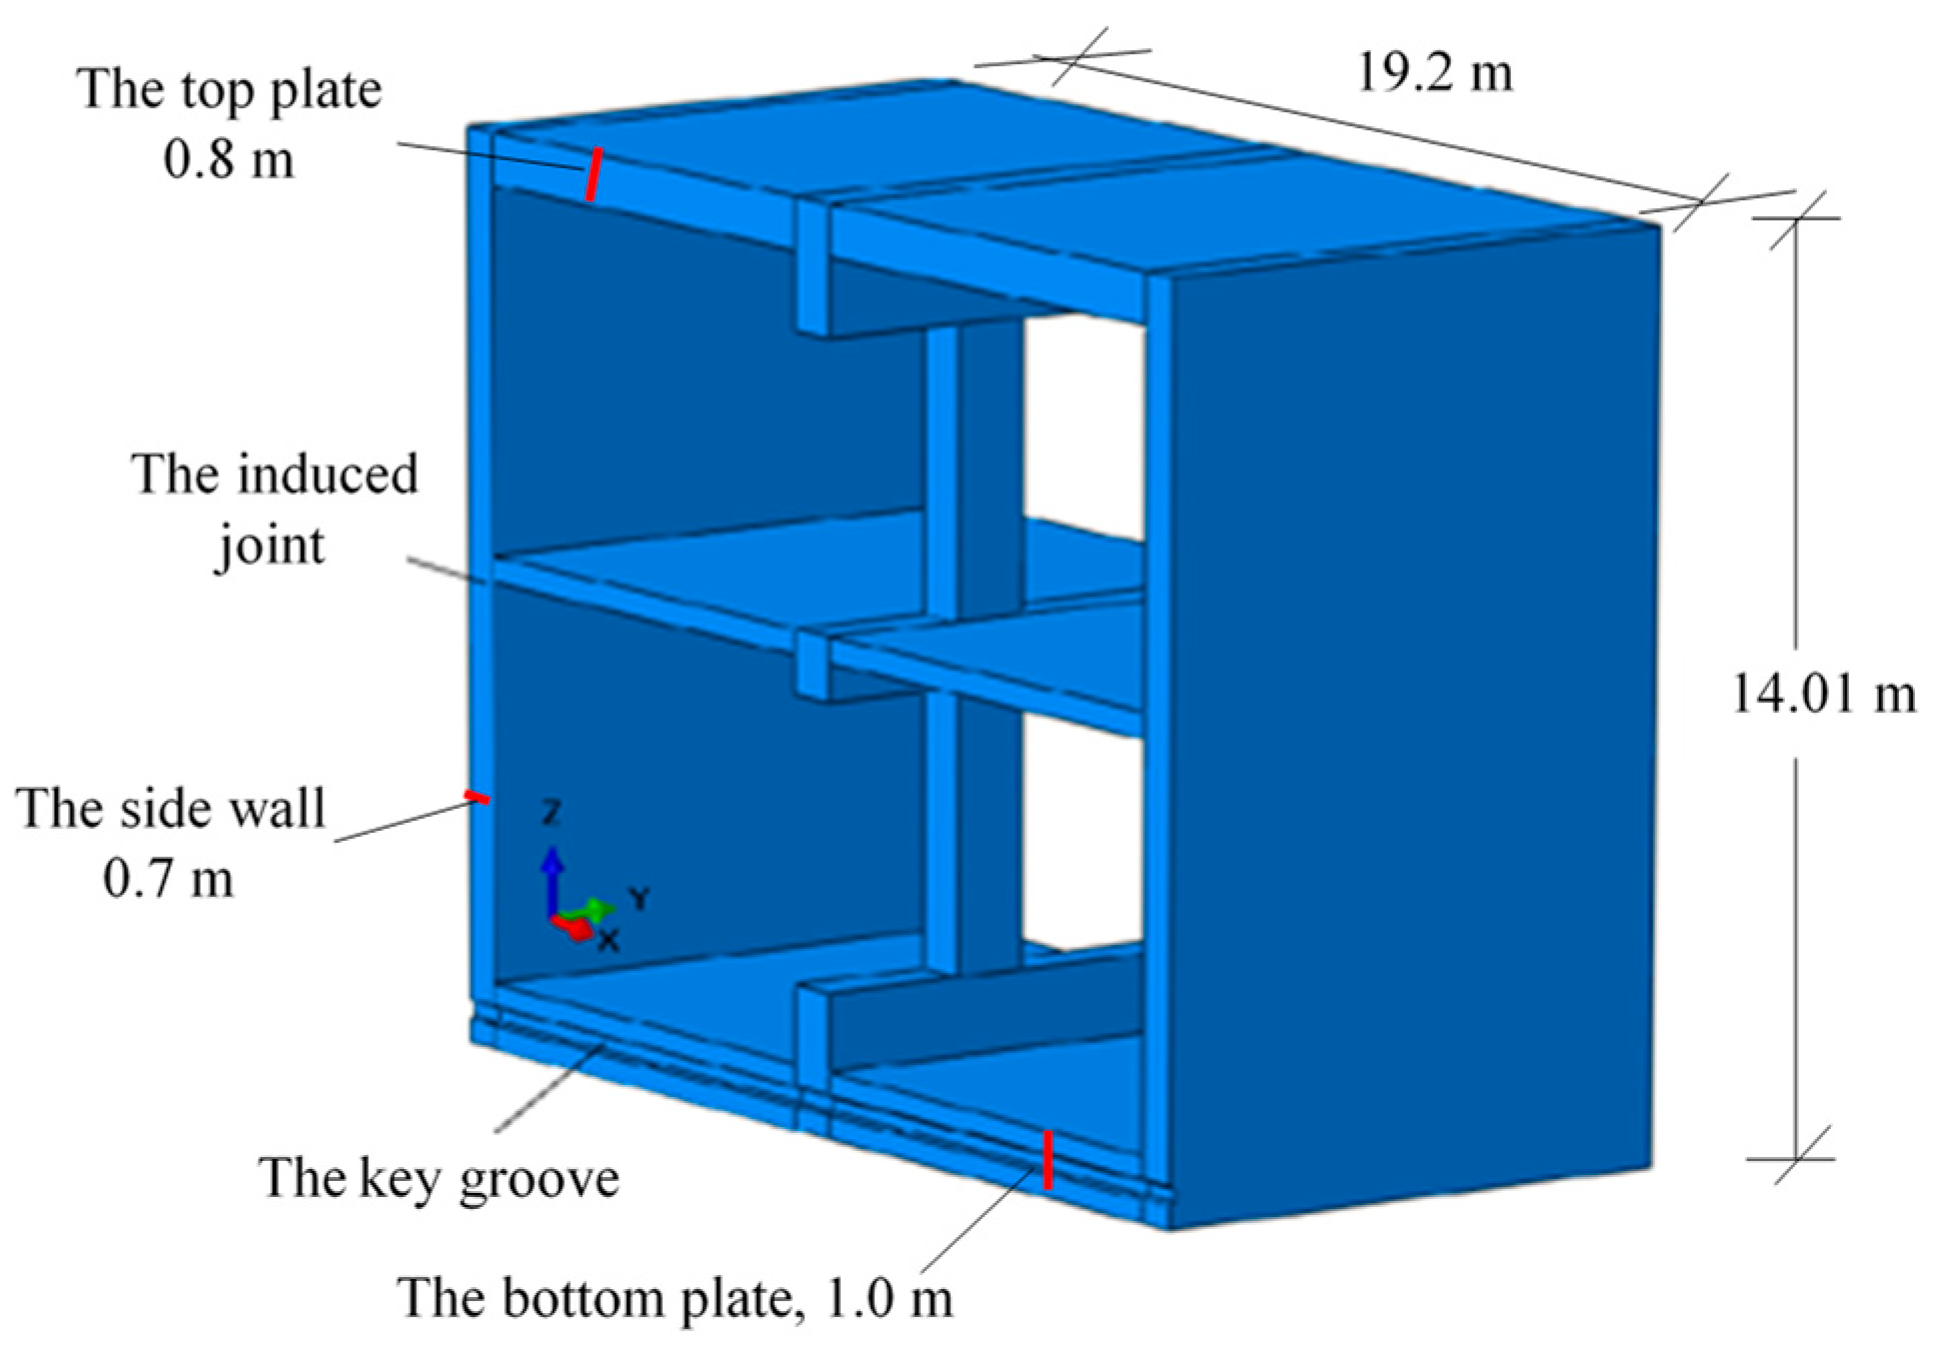
3.1. Model Design and Boundary Setting

This paper takes Feitian Road station of Xi’an Metro Line 4 as the research object. The station is a two-story double-span box section structure, as shown in Figure 6. The model structure section is designed to match the size of the actual structure, with a longitudinal length of 21 m between two adjacent induced joints of the station. The induced joint of the model structure is located at one-third of the distance between columns, where two-thirds of the longitudinal reinforcement is removed and one-third is retained throughout the entire length of the subway station. Key grooves are set at the induced joint of the bottom plate to enhance the engagement of the structures on both sides. According to the Code for Seismic Design of Urban Rail Transit Structures [38], during dynamic time history analysis, the distance between the artificial boundary on the side of the model foundation and the underground structure during dynamic time history analysis shall not be less than three times the horizontal effective width of the underground structure. In addition, the artificial boundary on the bottom should be taken to the design seismic action datum plane and the distance from the structure shall not be less than three times the vertical effective height of the underground structure. Accordingly, considering the requirements of the specification and the calculation time cost, the foundation width of this model is set as 134.4 m and the depth is 70 m, while the longitudinal length is consistent with the model structure.
Du and Zhao. [39] established the stress type viscoelastic artificial boundary based on the linear elastic constitution of an infinite medium, which has high accuracy for finite element analysis. Therefore, in this paper, the stress type viscoelastic artificial boundary (viscoelastic artificial boundary for short) is selected in the numerical simulation. The spring stiffness parameters Ki and damper parameters Ci (i = 1, 2, 3) on viscoelastic artificial boundary nodes are:
K 1 = K 2 = 1 1 + a G R i = 1 I A i
K 3 = 1 1 + a λ + 2 G R i = 1 I A i
C 1 = C 2 = b ρ C s i = 1 I A i , C 3 = b ρ C p i = 1 I A i
where R is the distance from the geometric center of the near-field area to the soil boundary where the artificial boundary point is located; G is the shear modulus of the medium; λ is the medium lame constant; ρ is the medium density;  C p = λ + 2 G ρ  and  C s = G P  are P wave velocity and S wave velocity, respectively. The dimensionless parameter a represents the ratio of plane waves to scattered waves, and dimensionless parameter b represents the relationship between physical wave velocity and apparent wave velocity. The values of parameters a and b can be obtained through numerical experiments, and will be taken as a = 0.8, b = 1.1 in the present work based on experience [40].  A i  is the area represented by the nodes on the artificial boundary. The equivalent seismic load is input through the bottom boundary node of the model.

3.2. Material Parameters and Seismic Wave Setting

In this paper, the nonlinear dynamic characteristics of loess are simulated using the equivalent linear model proposed by Du and Zhao [40]. The equivalent linear model is applicable to a wide range and is more accurate in the seismic response analysis of horizontally layered sites. The loess site composition and mechanical parameters of Feitian Road station are shown in Table 3. The CDP model is used to simulate the dynamic damage evolution process of the concrete of the station structure. The model parameters are shown in Table 4. Considering the differences in the structural quality on both sides of the induced joint in the subway station, the density ratio of the structures on both sides of the induced joint is set as 1:3. The ideal elastic–plastic model is used to simulate the stress and deformation characteristics of the reinforcement in the station structure. The elastic modulus of the reinforcement is taken as 2 × 10¹¹ Pa, Poisson’s ratio is taken as 0.3, and the yield limit is taken as 2.1 × 10⁸ Pa. In order to ensure the calculation accuracy and reduce the calculation time cost, the model structure is set as the full integral element C3D8, the model foundation is set as the reduced integral element C3D8R, and the model reinforcement is set as the three-dimensional truss element T3D2.
In order to study the seismic response of subway stations with induced joints on a loess region under the action of seismic waves with different spectral characteristics, Songpan waves, Taft waves, and Xi’an artificial waves are selected as input seismic waves in this paper. The peak accelerations of the original seismic waves are adjusted to 0.1 g, 0.2 g, 0.4 g, and 0.6 g, respectively, and then input into the numerical model to study the seismic response law of the induced joints of the subway station under the action of different peak acceleration seismic waves. The design of the numerical simulation conditions in this paper is shown in Table 5.

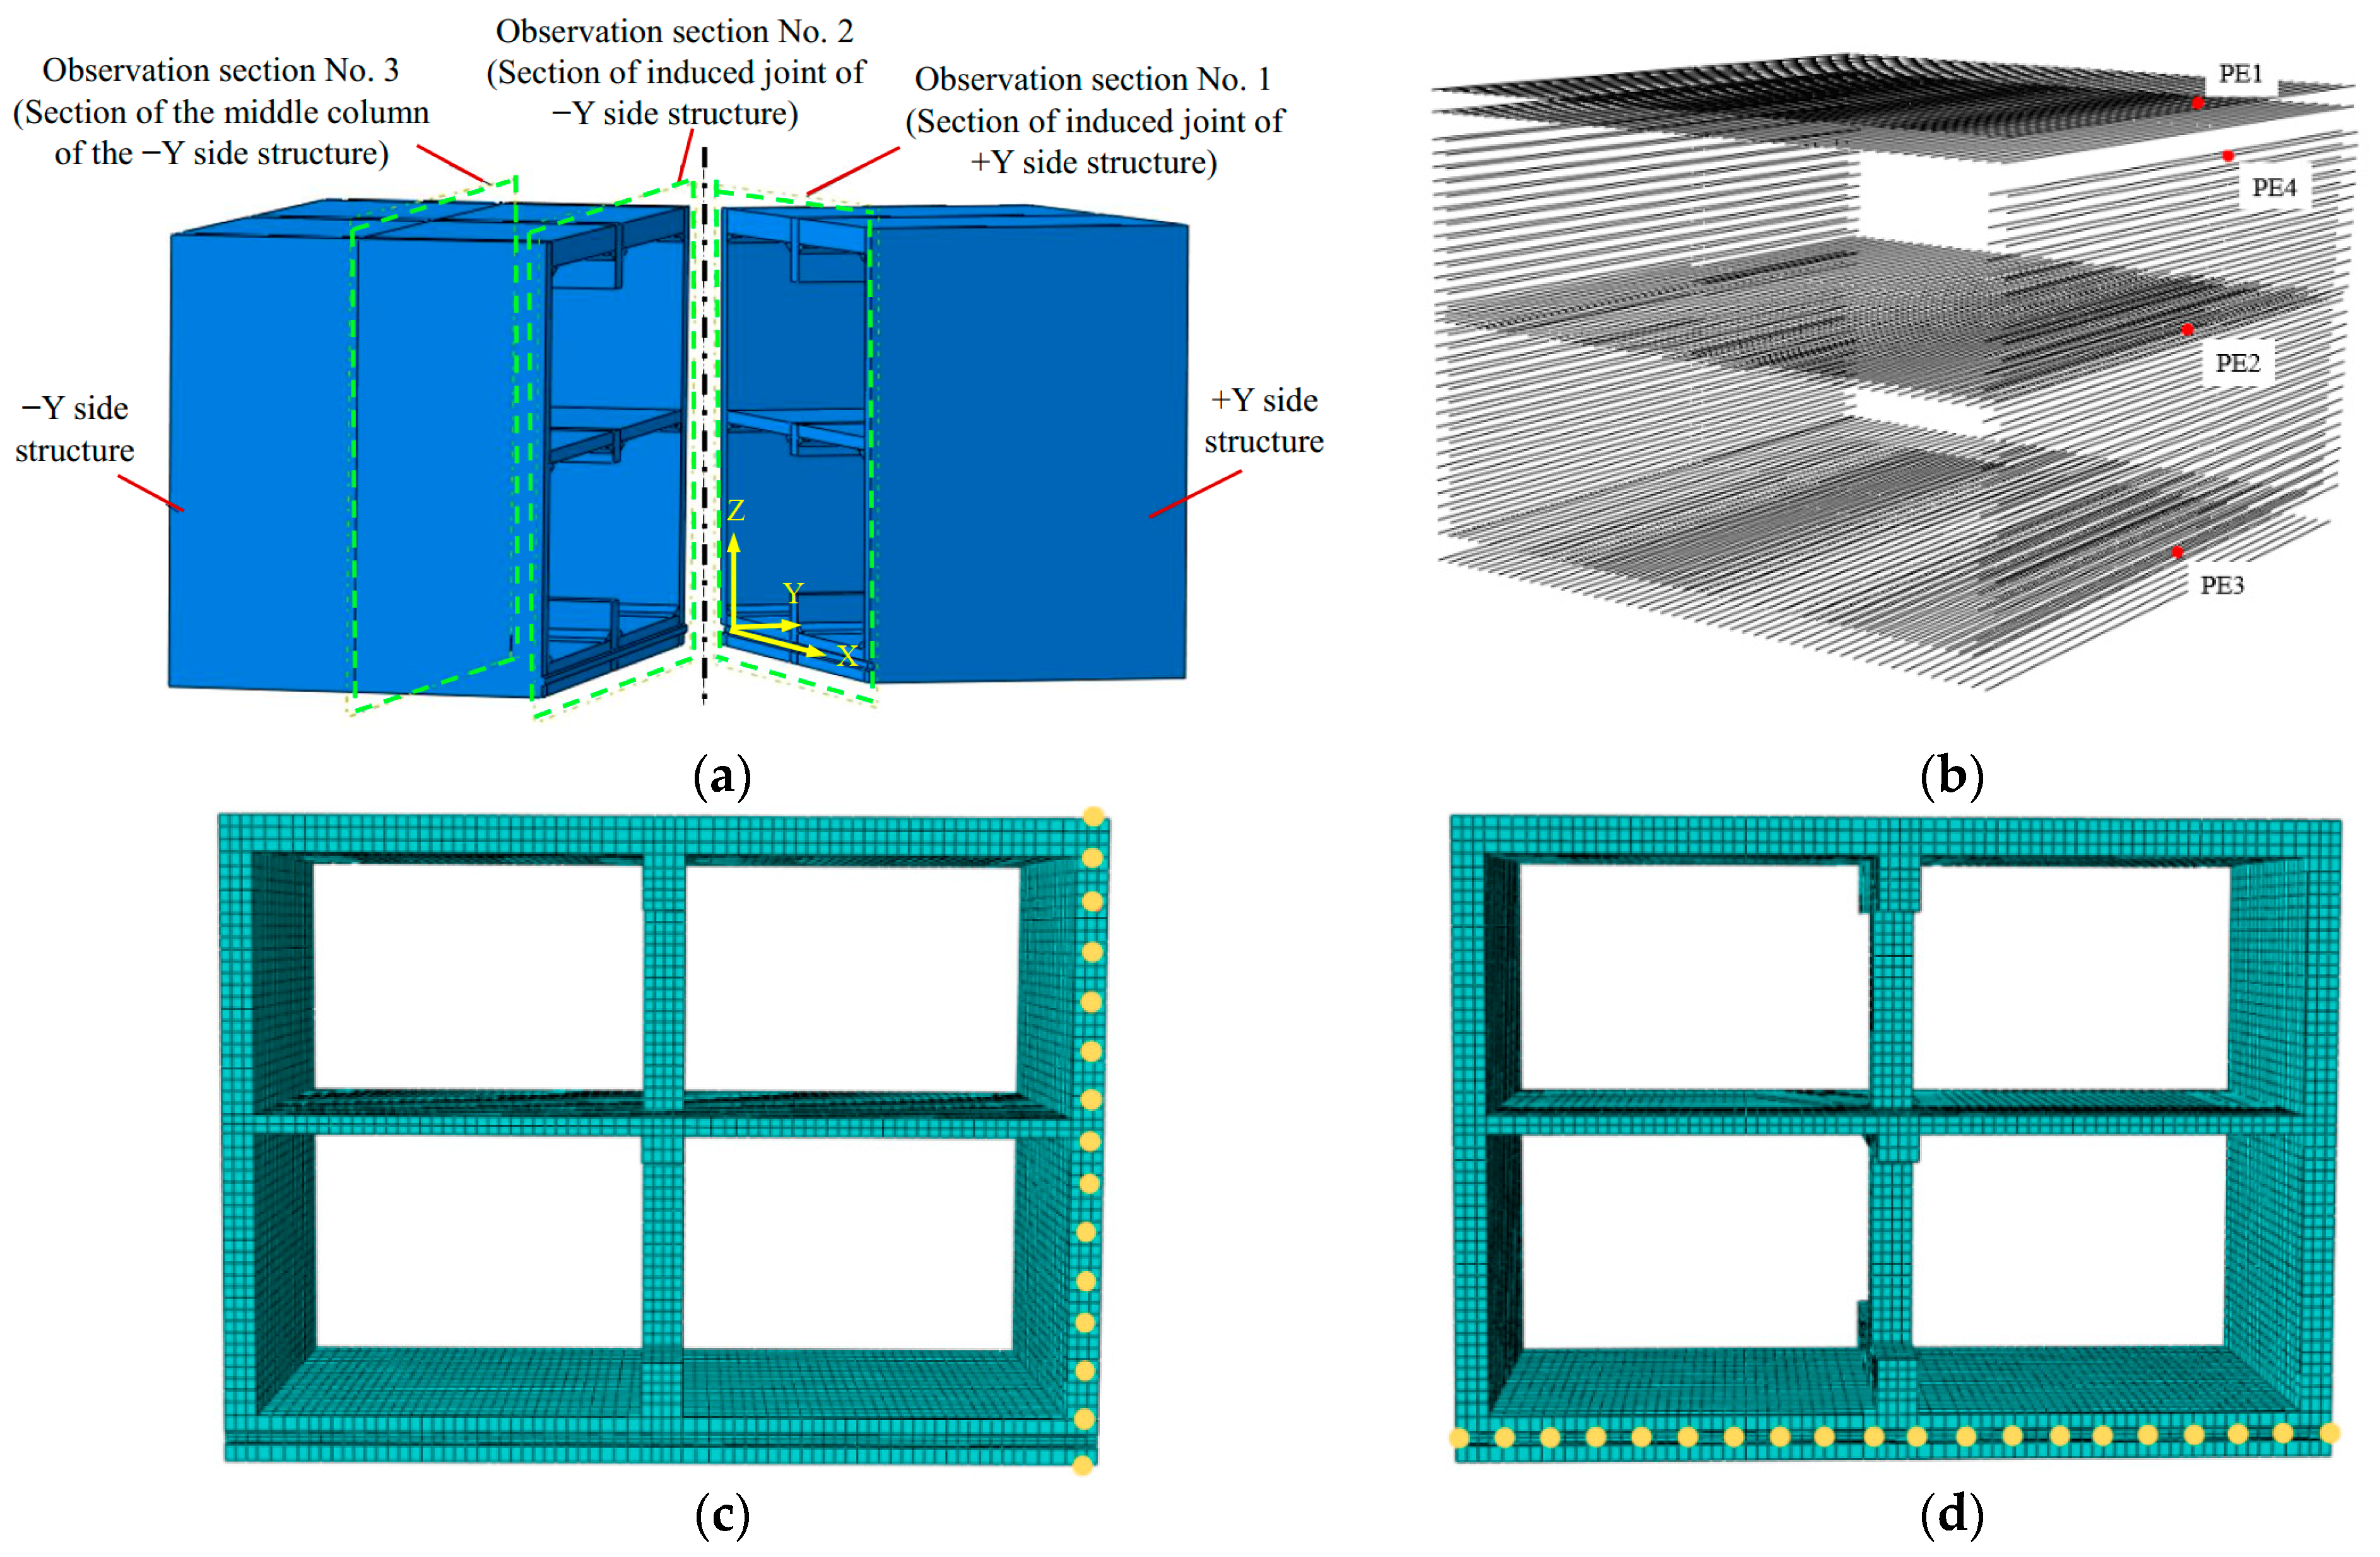
3.3. Location of Observation Section and Test Point

In the model structure, the X and Y axes are the width direction and longitudinal direction of the model, respectively, while the Z axis is the vertical direction. The origin of the coordinate system is located in the section where the induced joint is located, as shown in Figure 7a. Taking the section of the induced joint as the boundary, the structure located in the positive direction of the Y-axis is called the +Y side structure, and the negative direction of the Y-axis is called the −Y side structure. The section of the induced joint of the +Y side structure is set as observation section No. 1 and the −Y side structure is set as observation section No. 2. The purpose of setting these two observation sections is to obtain the vertical dislocation values on both sides of the induced joint. The section of the middle column of the −Y side structure is set as observation section No. 3. Monitoring points PE1–PE4 for plastic strain are set in the remaining longitudinal reinforcements at the top plate, middle plate, bottom plate, and side wall of the induced joint section of the structure, respectively, as shown in Figure 7b. Horizontal displacement measuring points are arranged at different heights in the side walls of observation sections No. 1, 2, and 3, as shown in Figure 7c. Vertical displacement measuring points are arranged at different widths in the bottom plates of sections No. 1 and 2, as shown in Figure 7d.

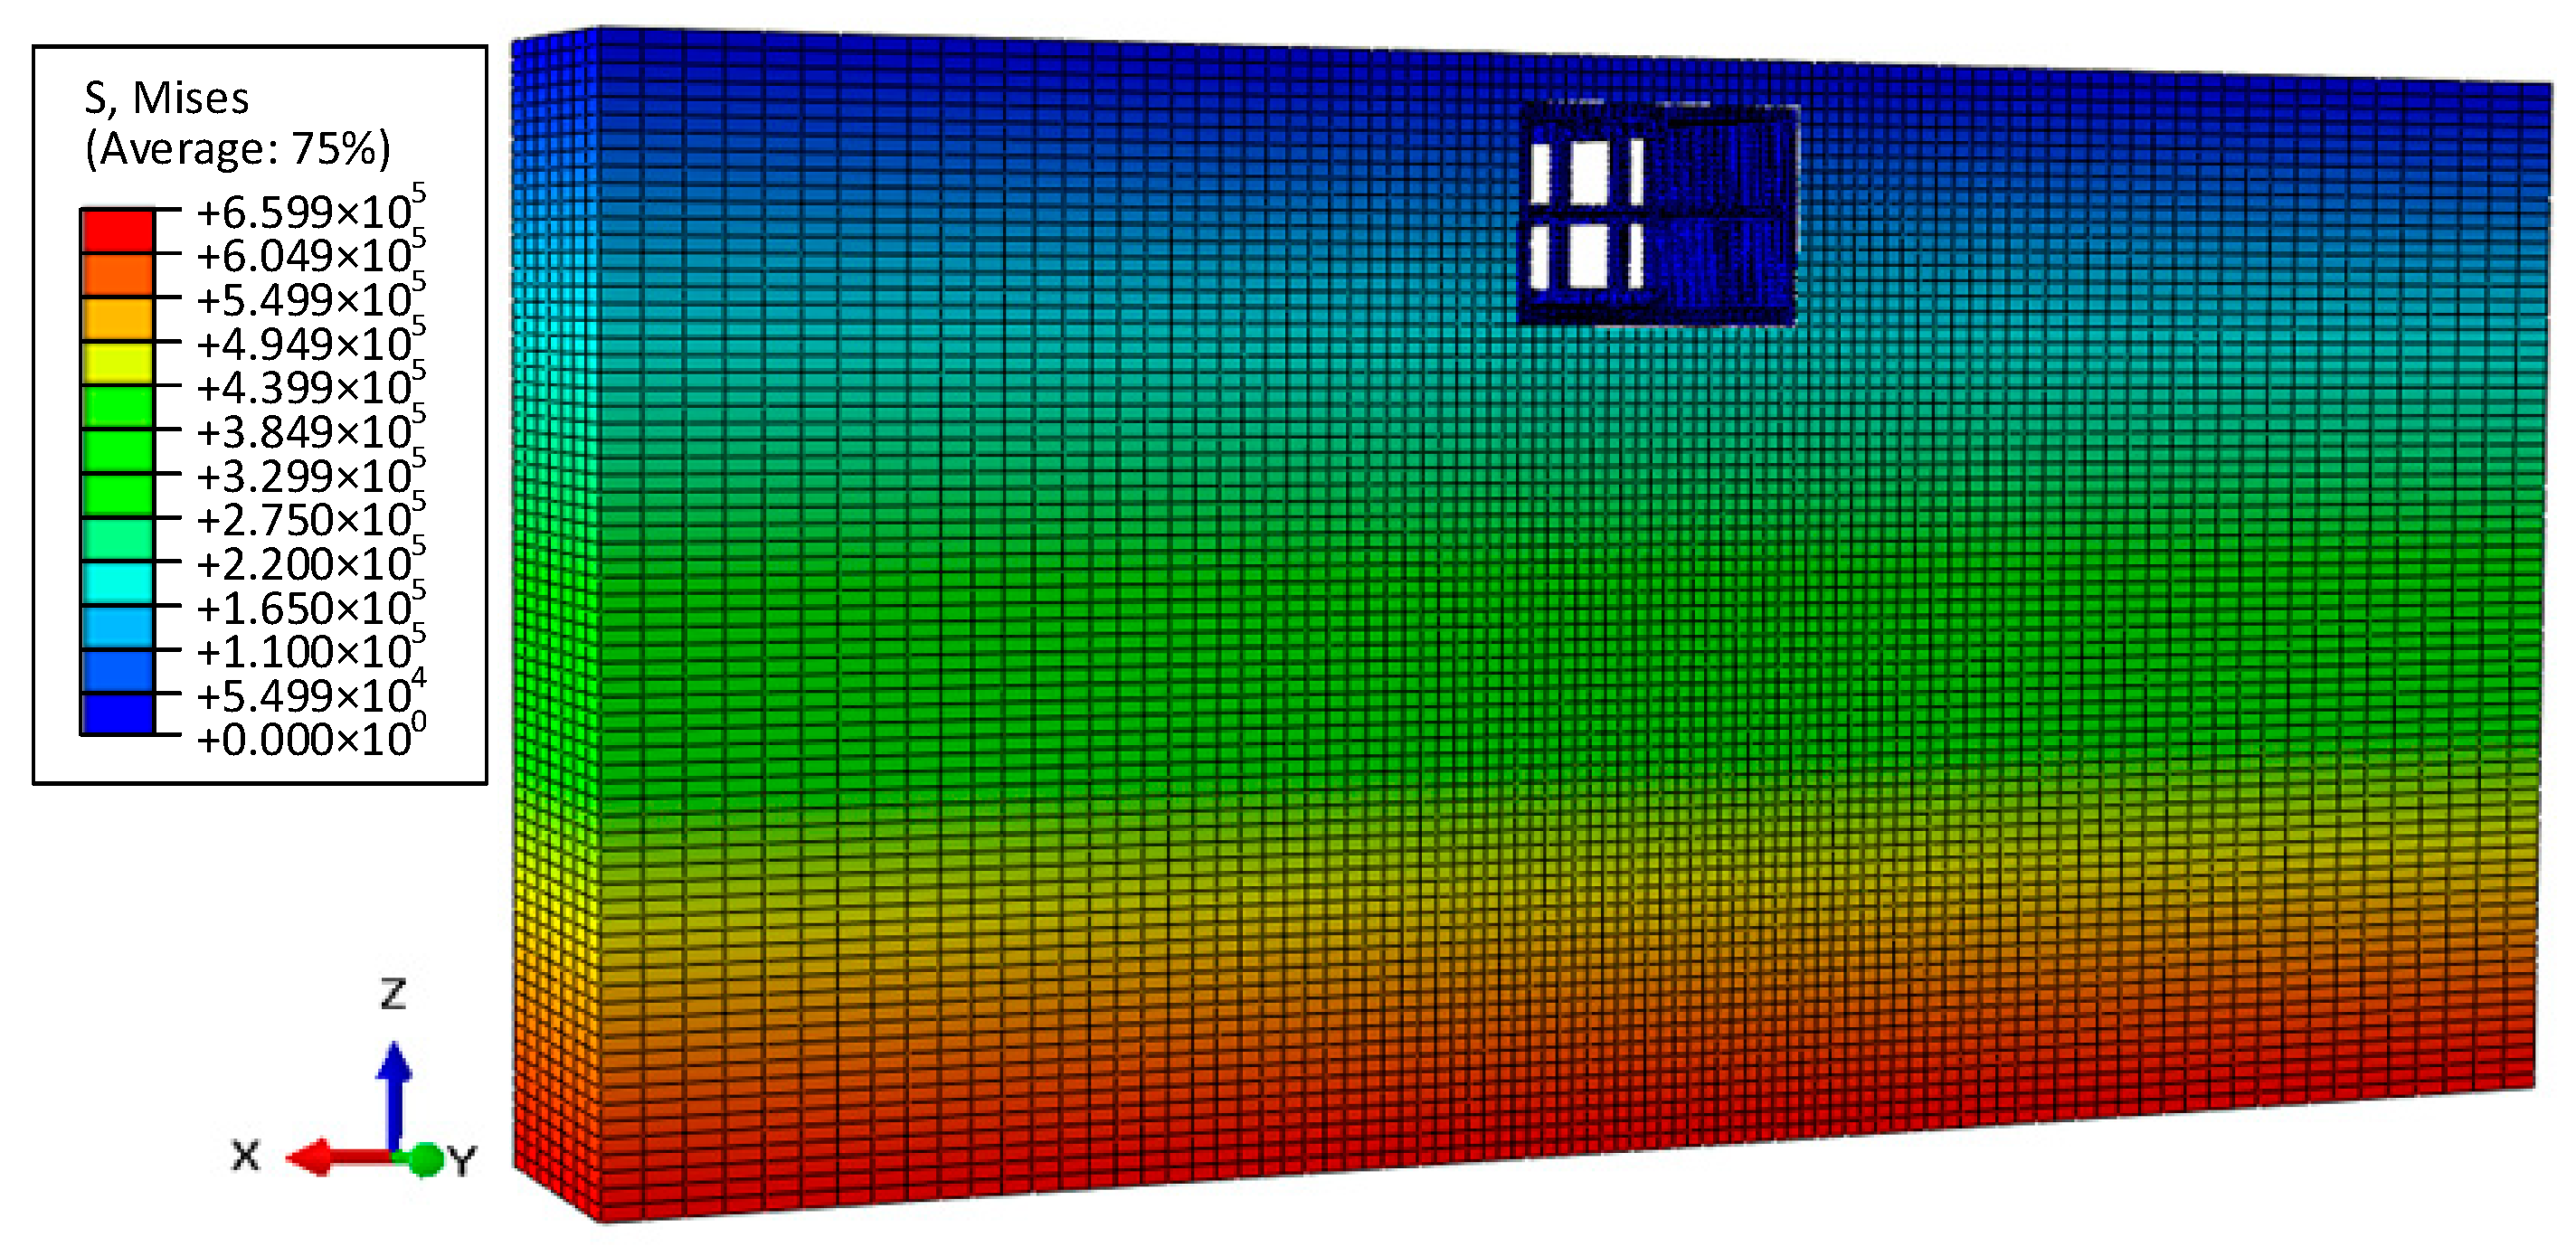
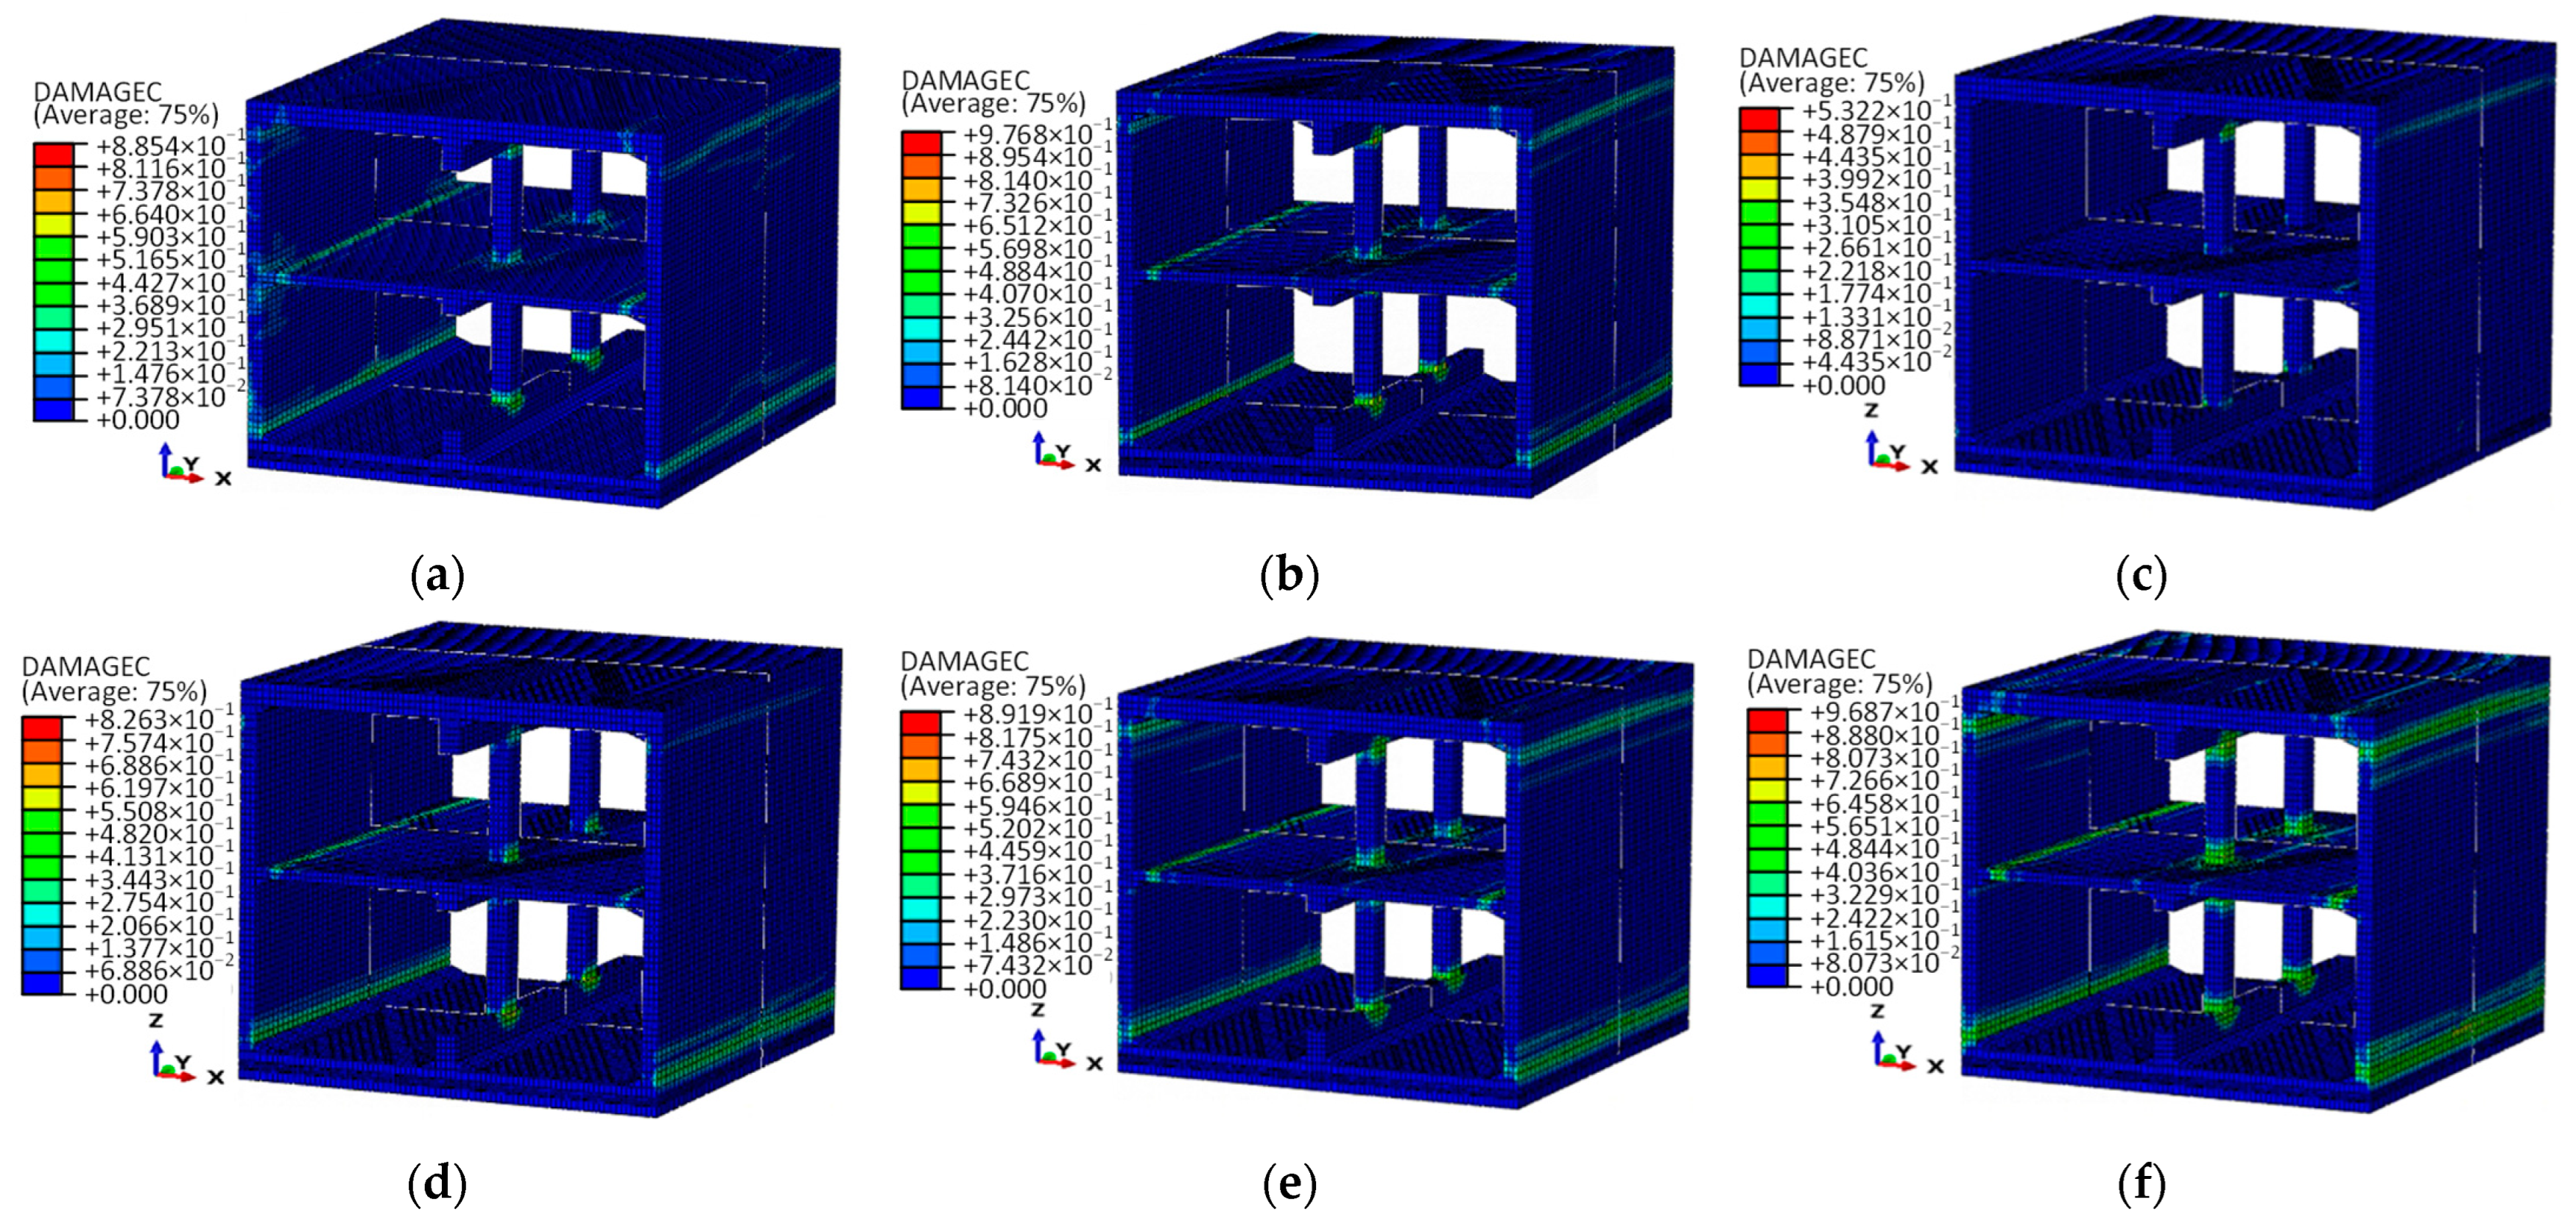
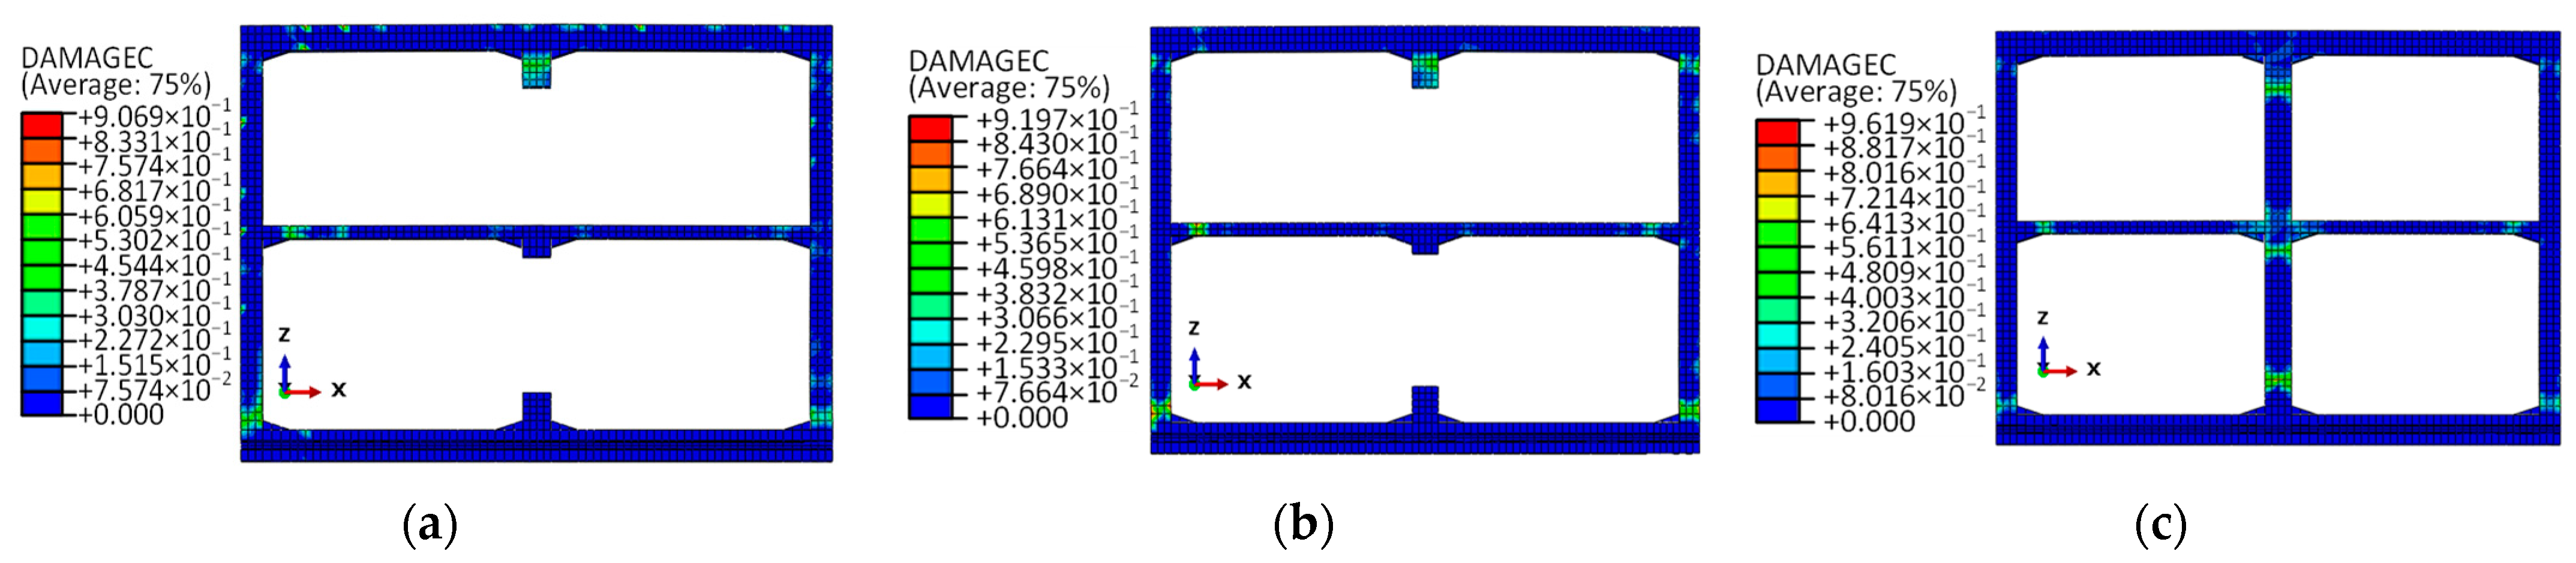
3.4. Dynamic Damage of the Subway Station Structure

Under different seismic wave types with the same peak acceleration, namely B1, B2, and B4 conditions, the compression damage cloud diagrams of the final state of the subway station structure are shown in Figure 8a,b,d. It can be seen from the figures that under the action of seismic waves with different frequency spectrum characteristics, the distribution positions of structural compression damage are largely the same, and obvious compression damage occurs at the connection of the top plate, middle plate, bottom plate, and side wall as well as at the end of the column. However, there are some differences in the degree of structural compression damage in the three working conditions. Under the action of a Xi’an artificial wave, the degree of structural compression damage is the largest, followed by a Songpan wave, with a Taft wave being the smallest.
Under the conditions of B3, B4, B5, and B6, the compressive damage of the subway station structure in the final state is shown in Figure 8c–f. As can be seen from the figure, the distribution locations of compression damage of subway station structures under Taft waves with different peak accelerations are largely the same, and obvious compression damage areas appear at the end of the middle column and the joints of the roof, middle plate, bottom plate, and side wall. When the peak acceleration is small, compression failure appears at the top of the middle column appears first. With an increase in peak acceleration, compression failure also appears at the bottom of the middle column, and the failure at the top is more serious. When the peak acceleration is large, the failure area at the top and bottom of the middle column expands rapidly and the column gradually loses its bearing capacity. The redistribution of the internal forces of the structure leads to significant failure at the top and bottom of the side wall, which bears a large bending moment. The above analysis shows that the failure mode of the model structure is manifested as the redistribution of internal forces caused by the failure of the middle column and the collapse of the bending moment at the connection between the side wall and the plate member, which leads to the failure of the structure.
Cloud diagrams of structural compression damage at different observation sections under the B2 working condition are shown in Figure 9a–c. From the figure, it can be seen that the structures at different observation sections all suffer compression damage at the connection between the side wall and plate components. However, compared with the central column section, the damage area at the connection between the side wall and the plate component of the induced joint section is larger and the damage is more serious. In addition, the middle part of the roof and the side wall also have local damage, indicating that the induced joint section is more prone to local damage. Similar characteristics can be seen under the B1 and B4 working conditions.

4. Seismic Response of the Induced Joint in the Subway Station Structure

4.1. Influence of Seismic Waves with Different Spectral Characteristics

4.1.1. Strain of Remaining Longitudinal Reinforcement at Induced Joint

The plastic strain time history curve of the remaining longitudinal reinforcement at measuring points PE1, PE2, PE3, and PE4 at the induced joint under working conditions, B1, B2, and B4 is shown in Figure 10.
It can be seen that, under the action of seismic waves with different spectral characteristics, the plastic deformation accumulation process of the remaining longitudinal reinforcement at each measuring point of the induced joint section is different. Under the action of Songpan waves, the remaining longitudinal reinforcements at the top plate and side wall of the induced joint section first undergo plastic deformation, followed by the remaining longitudinal reinforcements at the middle plate, while the remaining longitudinal reinforcements at the bottom plate never enter the plastic stage. The plastic deformation development of the remaining longitudinal reinforcement at each measuring point of the induced joint section is mainly concentrated in the duration of strong earthquake action, and the time history curve is steep. Under the action of Xi’an artificial waves, plastic deformation occurs sequentially in the remaining longitudinal reinforcements at the top plate, side wall, bottom plate, and middle plate of the induced joint section. The plastic deformation develops throughout the whole process of seismic action, and the time-history curve shows a continuously increasing feature, with a significant cumulative effect of plastic strain. However, under the action of Taft waves, no plastic deformation occurs in the remaining longitudinal reinforcements at all members of the induced joint section.
The maximum plastic strain of the remaining longitudinal reinforcement at each measuring point of the induced joint under the three working conditions is shown in Table 6. It can be seen from the table that the maximum plastic strain of the remaining longitudinal reinforcement at the top plate of the induced joint section is the highest, followed by the side wall, and is relatively small at the middle plate and the bottom plate. Under the action of seismic waves with different spectral characteristics, except for individual measuring points, the maximum plastic strain of the remaining longitudinal reinforcement in the induced joint section shows obvious differences—that is, its value is the highest under the action of Xi’an artificial waves, followed by the action of Songpan waves, and is a minimum under the action of Taft waves.

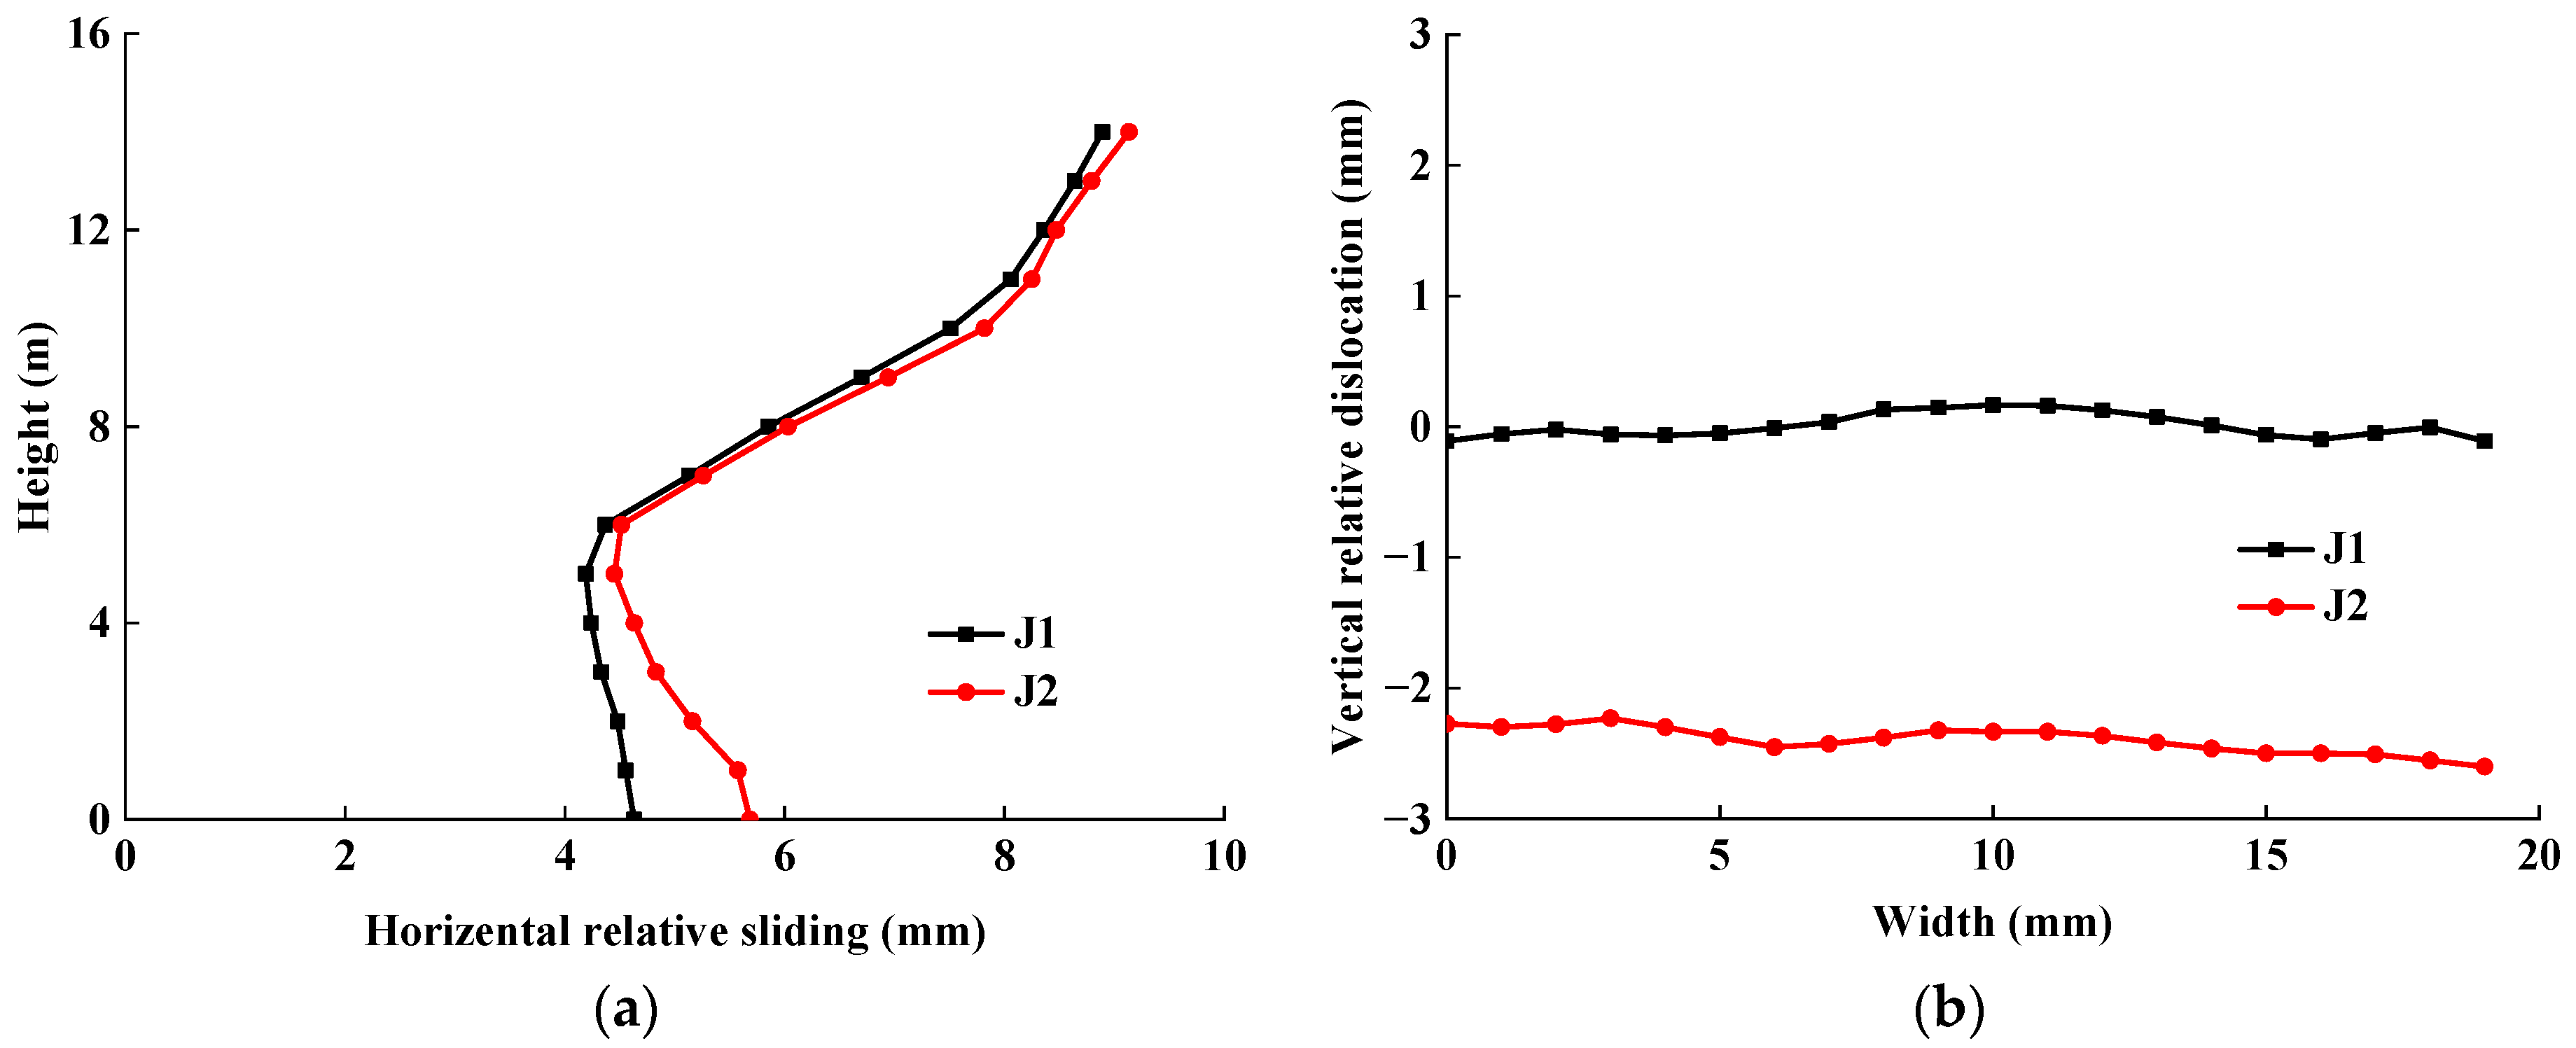
4.1.2. Horizontal Relative Sliding of Structure on Both Sides of Induced Joint

Horizontal displacement measuring points are arranged at different heights on the side walls of observation sections No. 1, No. 2, and No. 3, and the horizontal relative displacements of different measuring points of each observation section are calculated based on the bottom measuring point. The horizontal relative displacement of measuring points at each observation section under B1, B2, and B4 conditions is shown in Figure 11. It can be seen from the figure that the horizontal relative displacement of the side wall of each observation section gradually increases from bottom to top. At the same height, the horizontal relative displacement of the side wall of the induced joint section on the +Y side is larger than that on the −Y side, and that of the side wall of the column section on the −Y side is the smallest. This indicates that the section of the induced joint has a larger seismic response and is more likely to be damaged by large horizontal relative displacement, and is the weak surface of the subway station structure. By comparing the curves at observation Section No. 1 under the three working conditions, it can be seen that the horizontal relative displacement of the induced joint section is larger under the action of Songpan waves and Xi’an artificial waves, and the smallest under the action of Taft waves. Under the action of Songpan waves, there is a sudden change in the slope of the horizontal relative displacement curve at the height of the middle plate, which indicates that the displacement angles between the bottom floor and the top floor of the subway station structure are larger. However, under the action of Xi’an artificial waves and Taft waves, there is little difference in displacement angle between the bottom floor and the top floor of the subway station structure.
In order to ensure the safety of subway operation, it is necessary to focus on the horizontal relative sliding of the structures on both sides of the induced joint under earthquake action, which can be represented by the peak value of the time history curve of the horizontal displacement difference of the measuring point at the same height in the side wall of observation sections No. 1 and No. 2. The horizontal relative sliding of the structures on both sides of the induced joint under the working conditions B1, B2, and B4 are shown in Figure 12. It can be seen that the horizontal relative sliding gradually increases along the subway station structure from bottom to top. Due to a higher number of low-frequency components in Songpan and Xi’an artificial waves, the seismic response of the loess–subway station structure system is more intense under the corresponding conditions. Thus, the horizontal relative sliding of structures on both sides of the induced joint is relatively large under the action of Songpan and Xi’an artificial waves, while that under the action of Taft waves is relatively small.

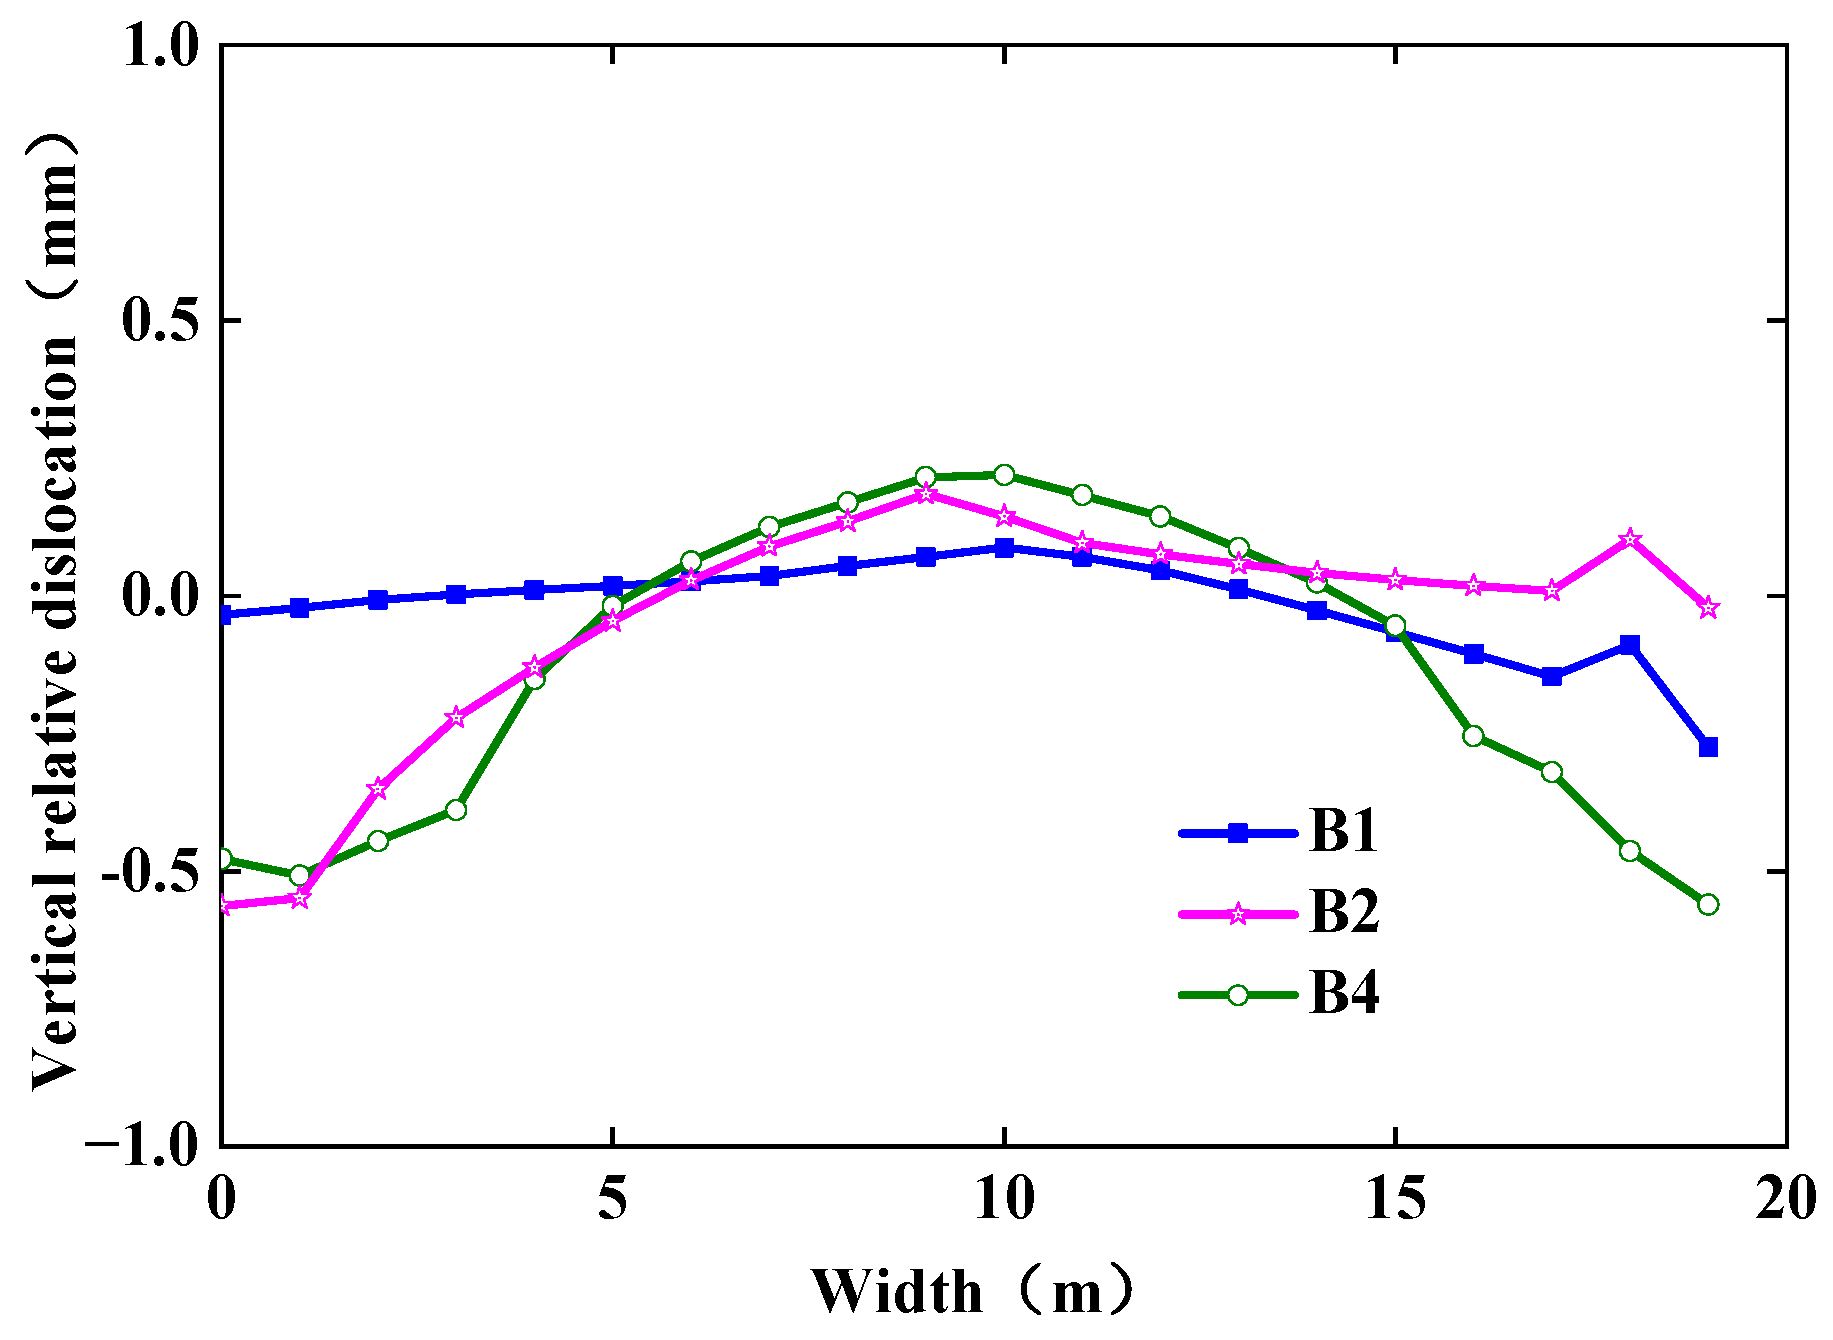
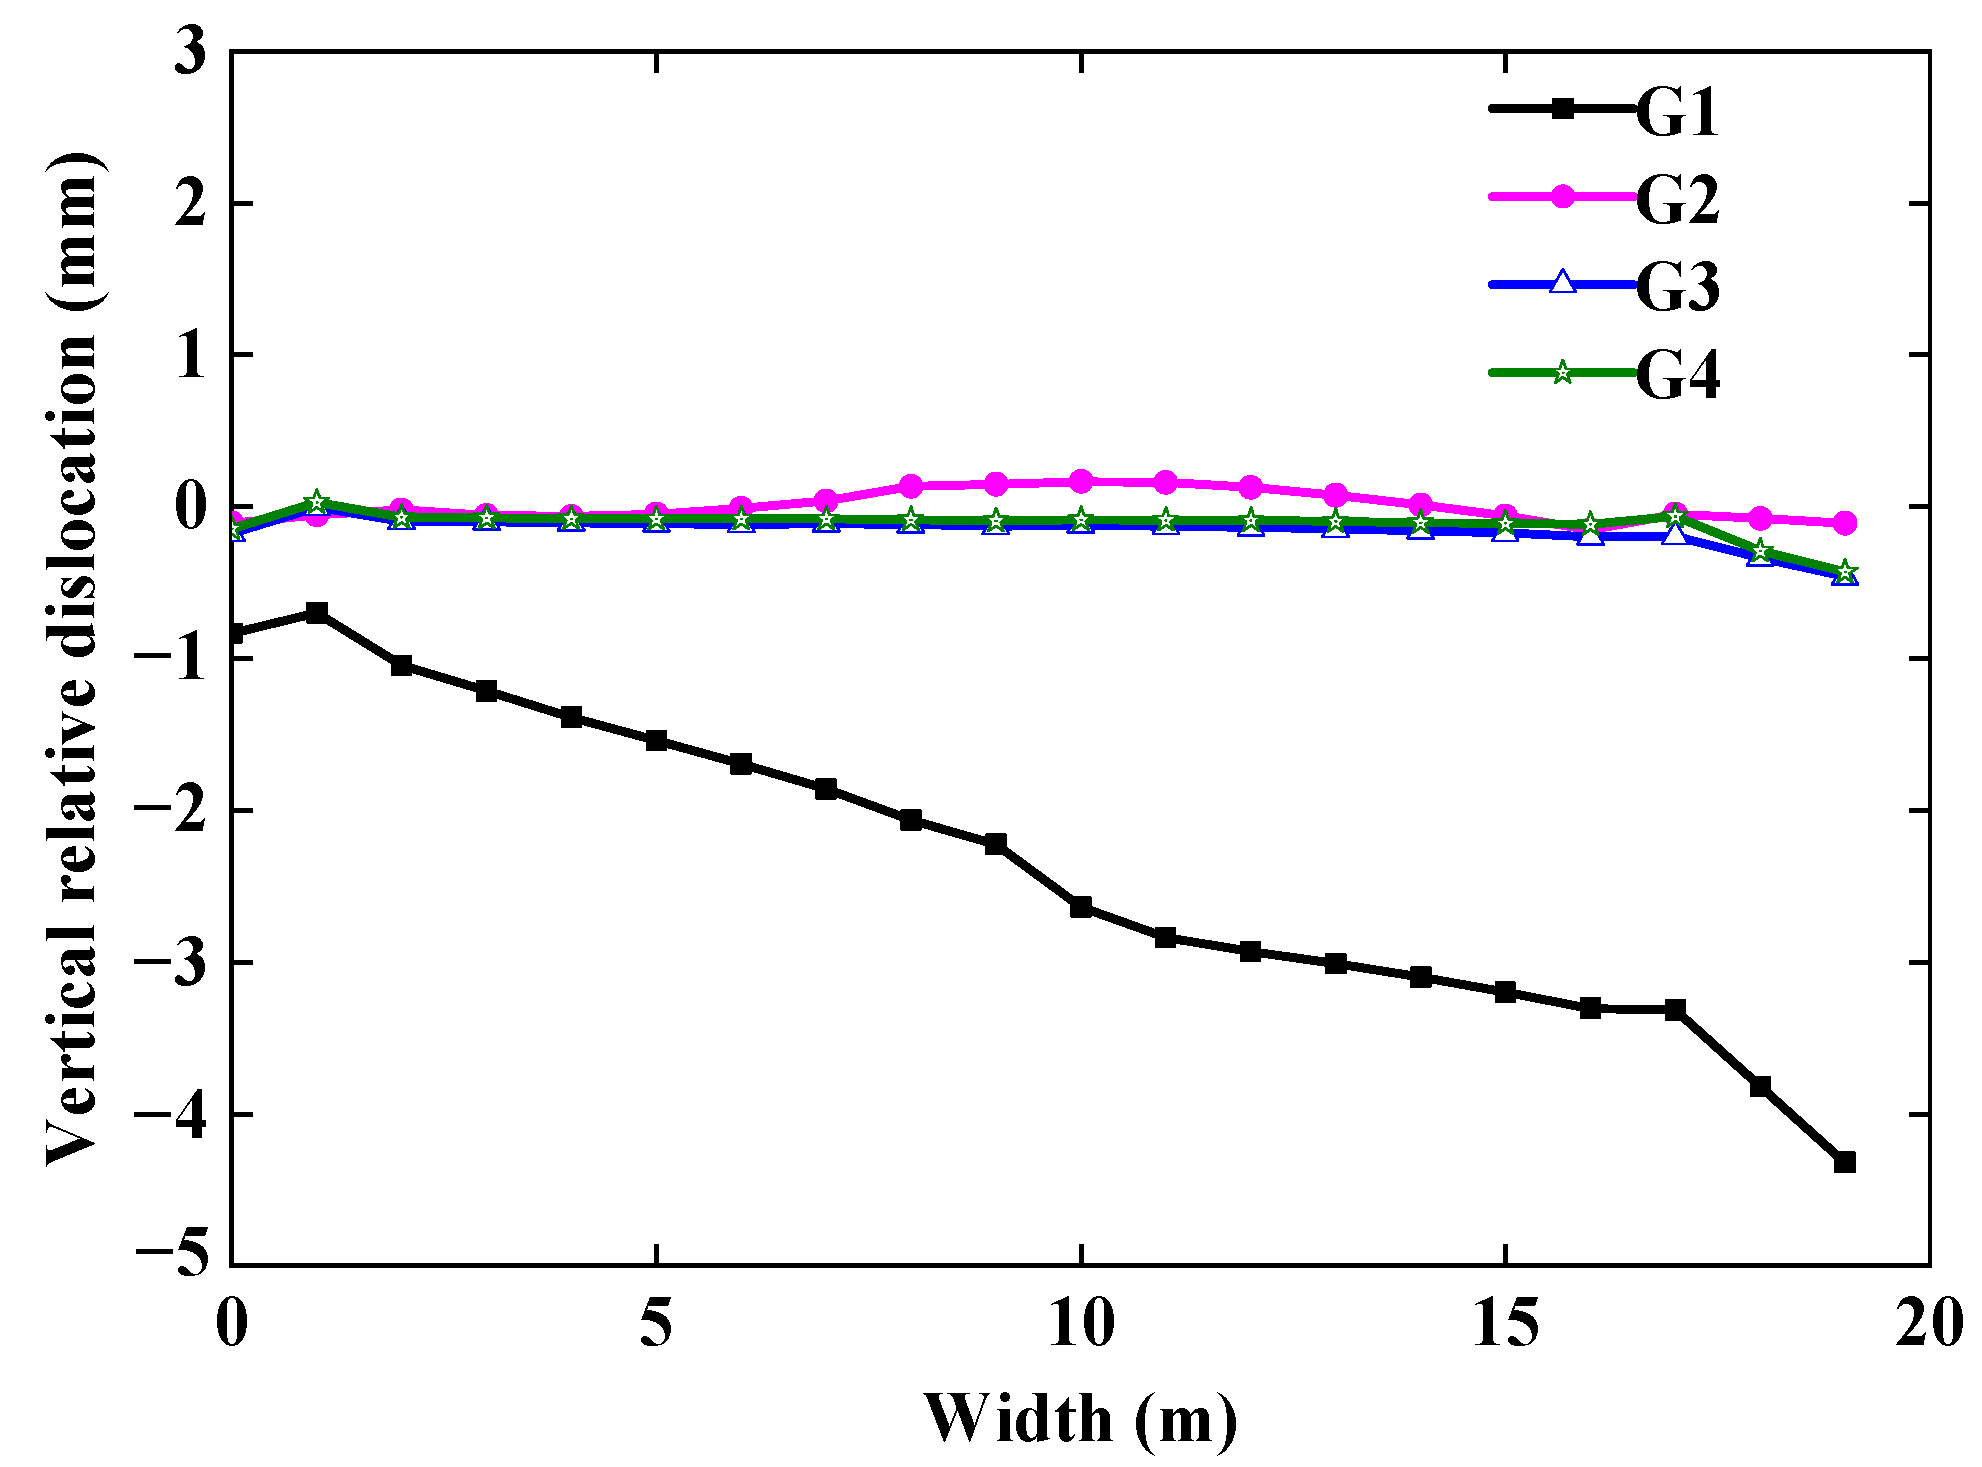
4.1.3. Vertical Relative Dislocation of Structures on Both Sides of Induced Joint

The vertical relative dislocation of the structures on both sides of the induced joint under earthquake action can be represented by the peak value of the vertical displacement difference time history curve of the measuring points at the same width on the bottom plates of observation sections No. 1 and No. 2. The calculated results under working conditions B1, B2, and B4 are shown in Figure 13. It can be seen that the vertical relative dislocations of the structures on both sides of the induced joint along the width direction of the section of the subway station show a general rule that the dislocations at the two ends are larger and that at the middle is smaller. This is mainly due to the concentrated action of the mass of the walls on both sides of the structure on both ends of the floor. However, in general, the value of vertical dislocation is very small. In particular, the calculation results under Songpan waves and Xi’an artificial waves are less than 1 mm.

4.2. Influence of Seismic Waves with Different Peak Acceleration

4.2.1. Strain of Remaining Longitudinal Reinforcement at Induced Joint

The plastic strain time-history curves of the remaining longitudinal reinforcement at measuring points PE1–PE4 at the induced joint under working conditions, B5 and B6, are shown in Figure 14. When the peak acceleration of the input seismic wave is greater than 0.2 g, the plastic deformation of the remaining longitudinal reinforcement at the top plate and side wall of the induced joint section occurs first, followed by that at the middle plate, while the remaining longitudinal reinforcement at the bottom plate has very little plastic deformation. Comparing the results of PE1 and PE2 under two working conditions, it is found that under the action of seismic waves with different peak accelerations, the plastic deformation accumulation process of longitudinal reinforcement at each measuring point of the induced joint section is the same, and the plastic deformation is mainly concentrated in the duration of strong earthquake action, and the time-history curve is steep. According to the maximum plastic strain of remaining longitudinal reinforcement at each measuring point of the induced joint under different working conditions, when the peak acceleration of the input seismic wave is less than or equal to 0.2 g, no plastic deformation occurs in the remaining longitudinal reinforcement. When the peak acceleration of the input seismic wave is greater than 0.2 g, the value of maximum plastic strain increases rapidly with an increase in input seismic peak acceleration.

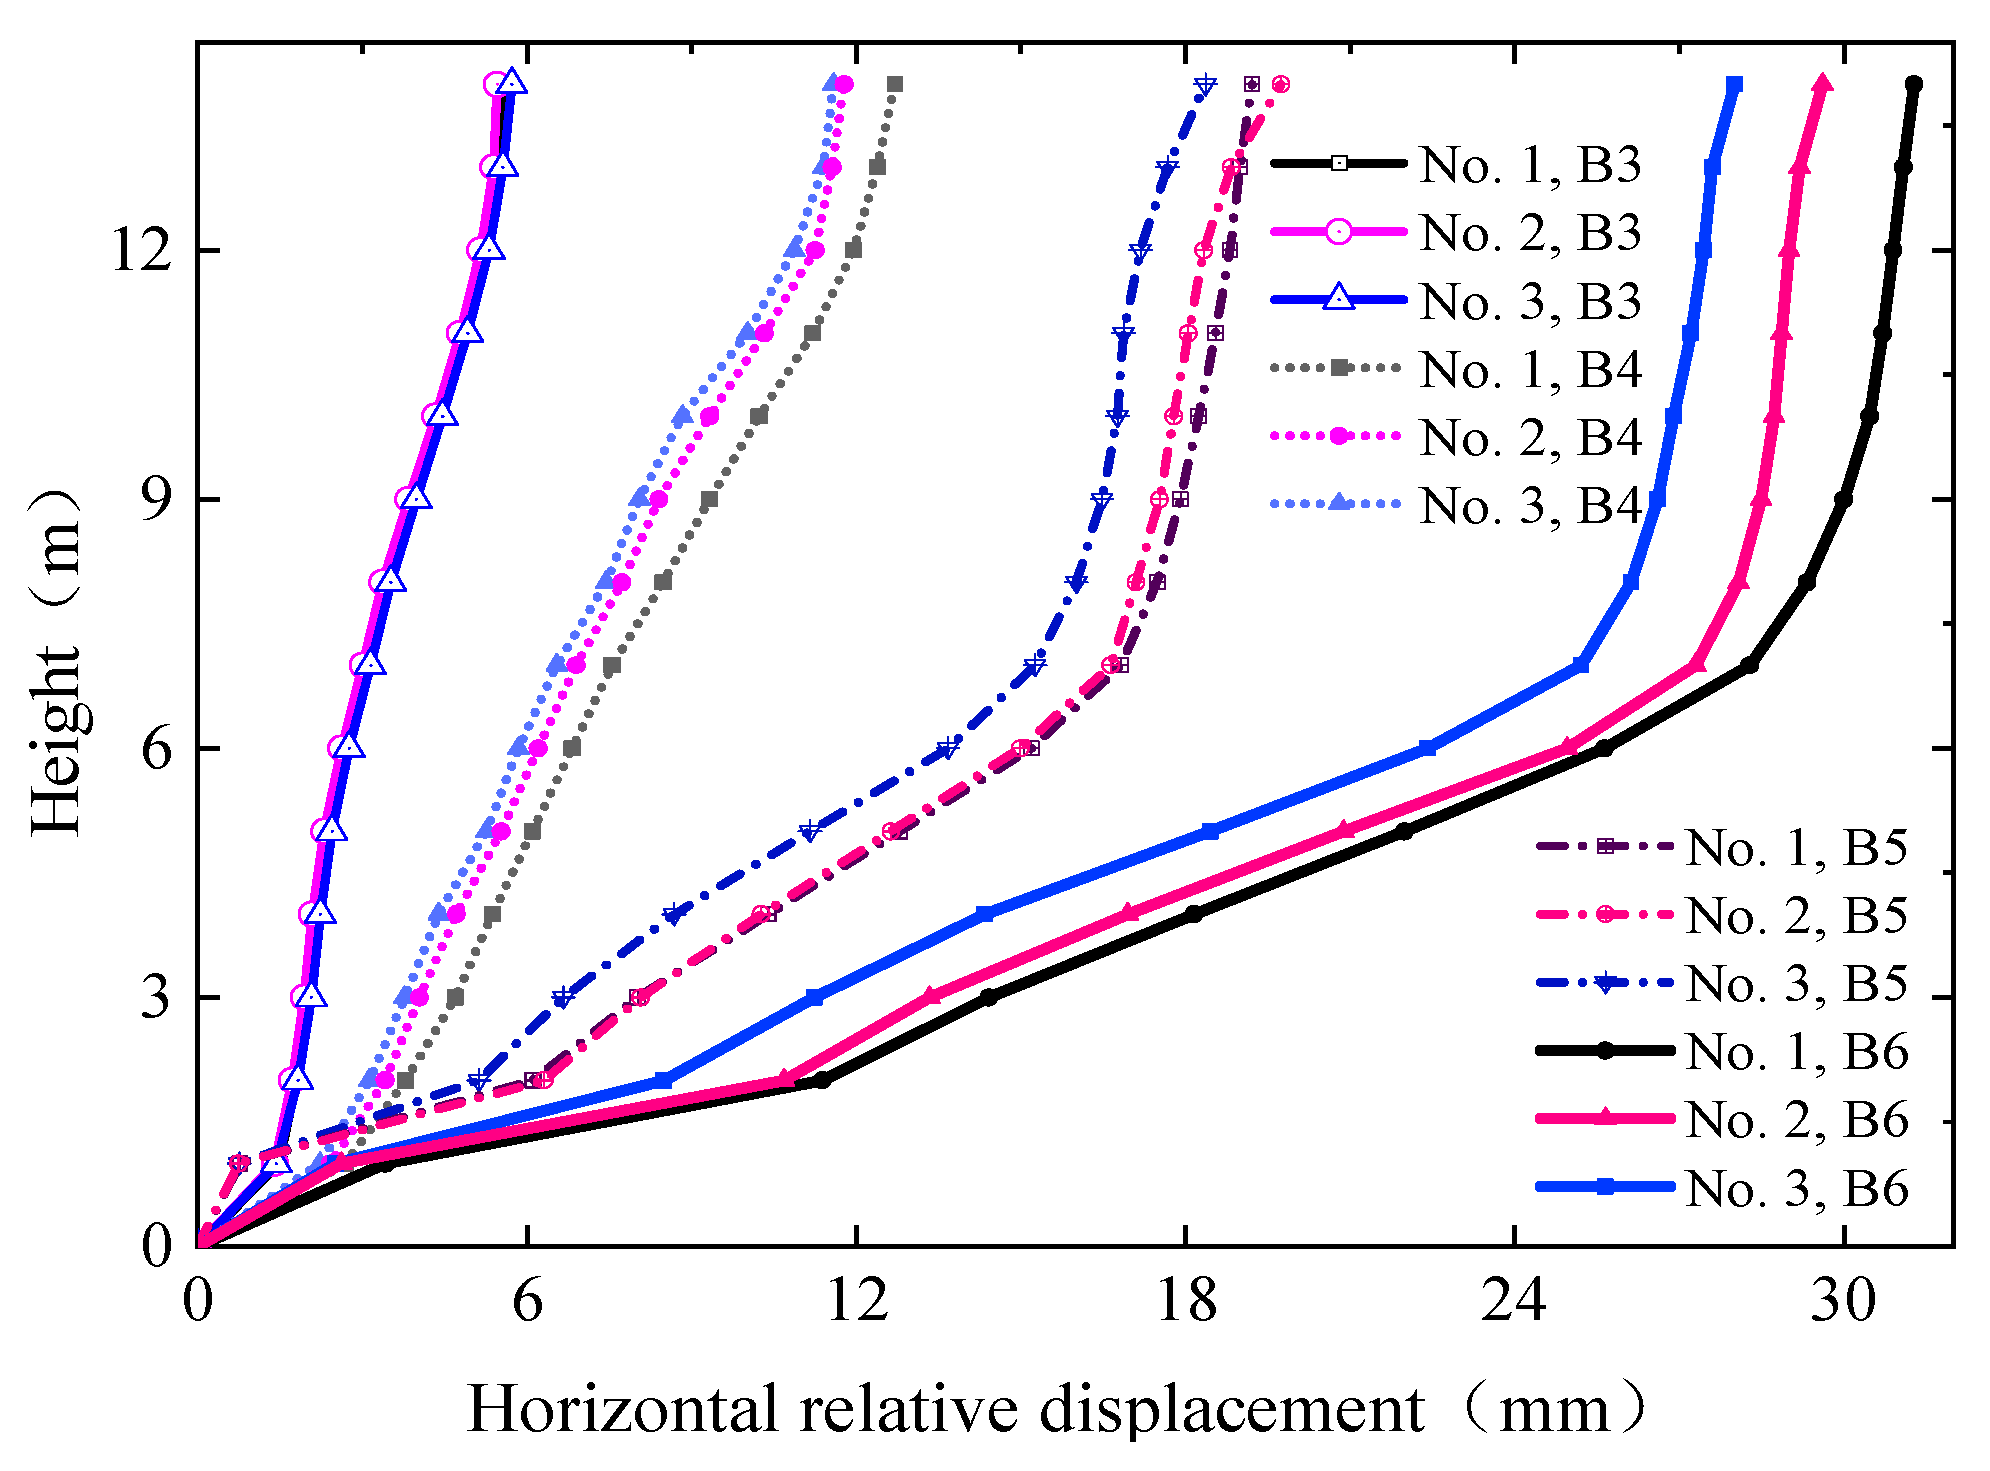
4.2.2. Horizontal Relative Sliding of Structures on Both Sides of Induced Joint

The horizontal relative displacements of different measuring points in each observation section are calculated based on the bottom measuring point. The horizontal relative displacements of each observation point under the B3, B4, B5, and B6 working conditions are shown in Figure 15.
With an increase in peak acceleration of the input seismic wave, the horizontal relative displacement differences at different observation sections at the same height gradually increase. When the peak acceleration of the input seismic wave is less than or equal to 0.2 g, the horizontal relative displacement of the side wall changes largely linearly along the height, indicating that there is little difference in the displacement angle between the bottom floor and the top floor of the subway station structure. When the peak acceleration is greater than 0.2 g, the slope of the horizontal relative displacement curve of the side wall has a sudden change at the height of the mid-plate, indicating that the displacement angles between the bottom and the top floors of the subway station structure are significantly different, and the displacement angles between the bottom floors are significantly larger than that of the top floors.

4.3. Influence of Remaining Longitudinal Reinforcement

At present, the empirical practice of induced joint is to make one-third of the longitudinal reinforcement pass through and the rest of the reinforcement cut-off, but there is no corresponding theoretical basis for this practice. In order to study the influence of the remaining longitudinal reinforcement ratio on the seismic response of the induced joint of the subway station structure, the remaining longitudinal reinforcement ratio is taken as the parameter for design conditions G1, G2, G3, and G4, and the corresponding remaining longitudinal reinforcement ratio for four conditions is 0, 1/3, 2/3, and 1, respectively. The seismic waves are all set as Songpan waves with 0.4 g peak acceleration.

4.3.1. Strain Analysis of Remaining Longitudinal Reinforcement at Induced Joint

The plastic strain time-history curves of the remaining longitudinal reinforcement at PE1–PE4 measuring points at the induced joint under the G2, G3, and G4 working conditions are shown in Figure 16. With an increase in the reinforcement ratio of the remaining longitudinal reinforcement at the induced joints, the plastic deformation accumulation process of the remaining longitudinal reinforcement at each measuring point during strong earthquake action gradually slows. The value of maximum plastic strain decreases gradually with an increase in the reinforcement ratio at the induced joint. When the reinforcement ratio increases from 1/3 to 2/3, the maximum plastic strain of the remaining longitudinal reinforcement at the induced joint section decreases the most, except for at individual measuring points.

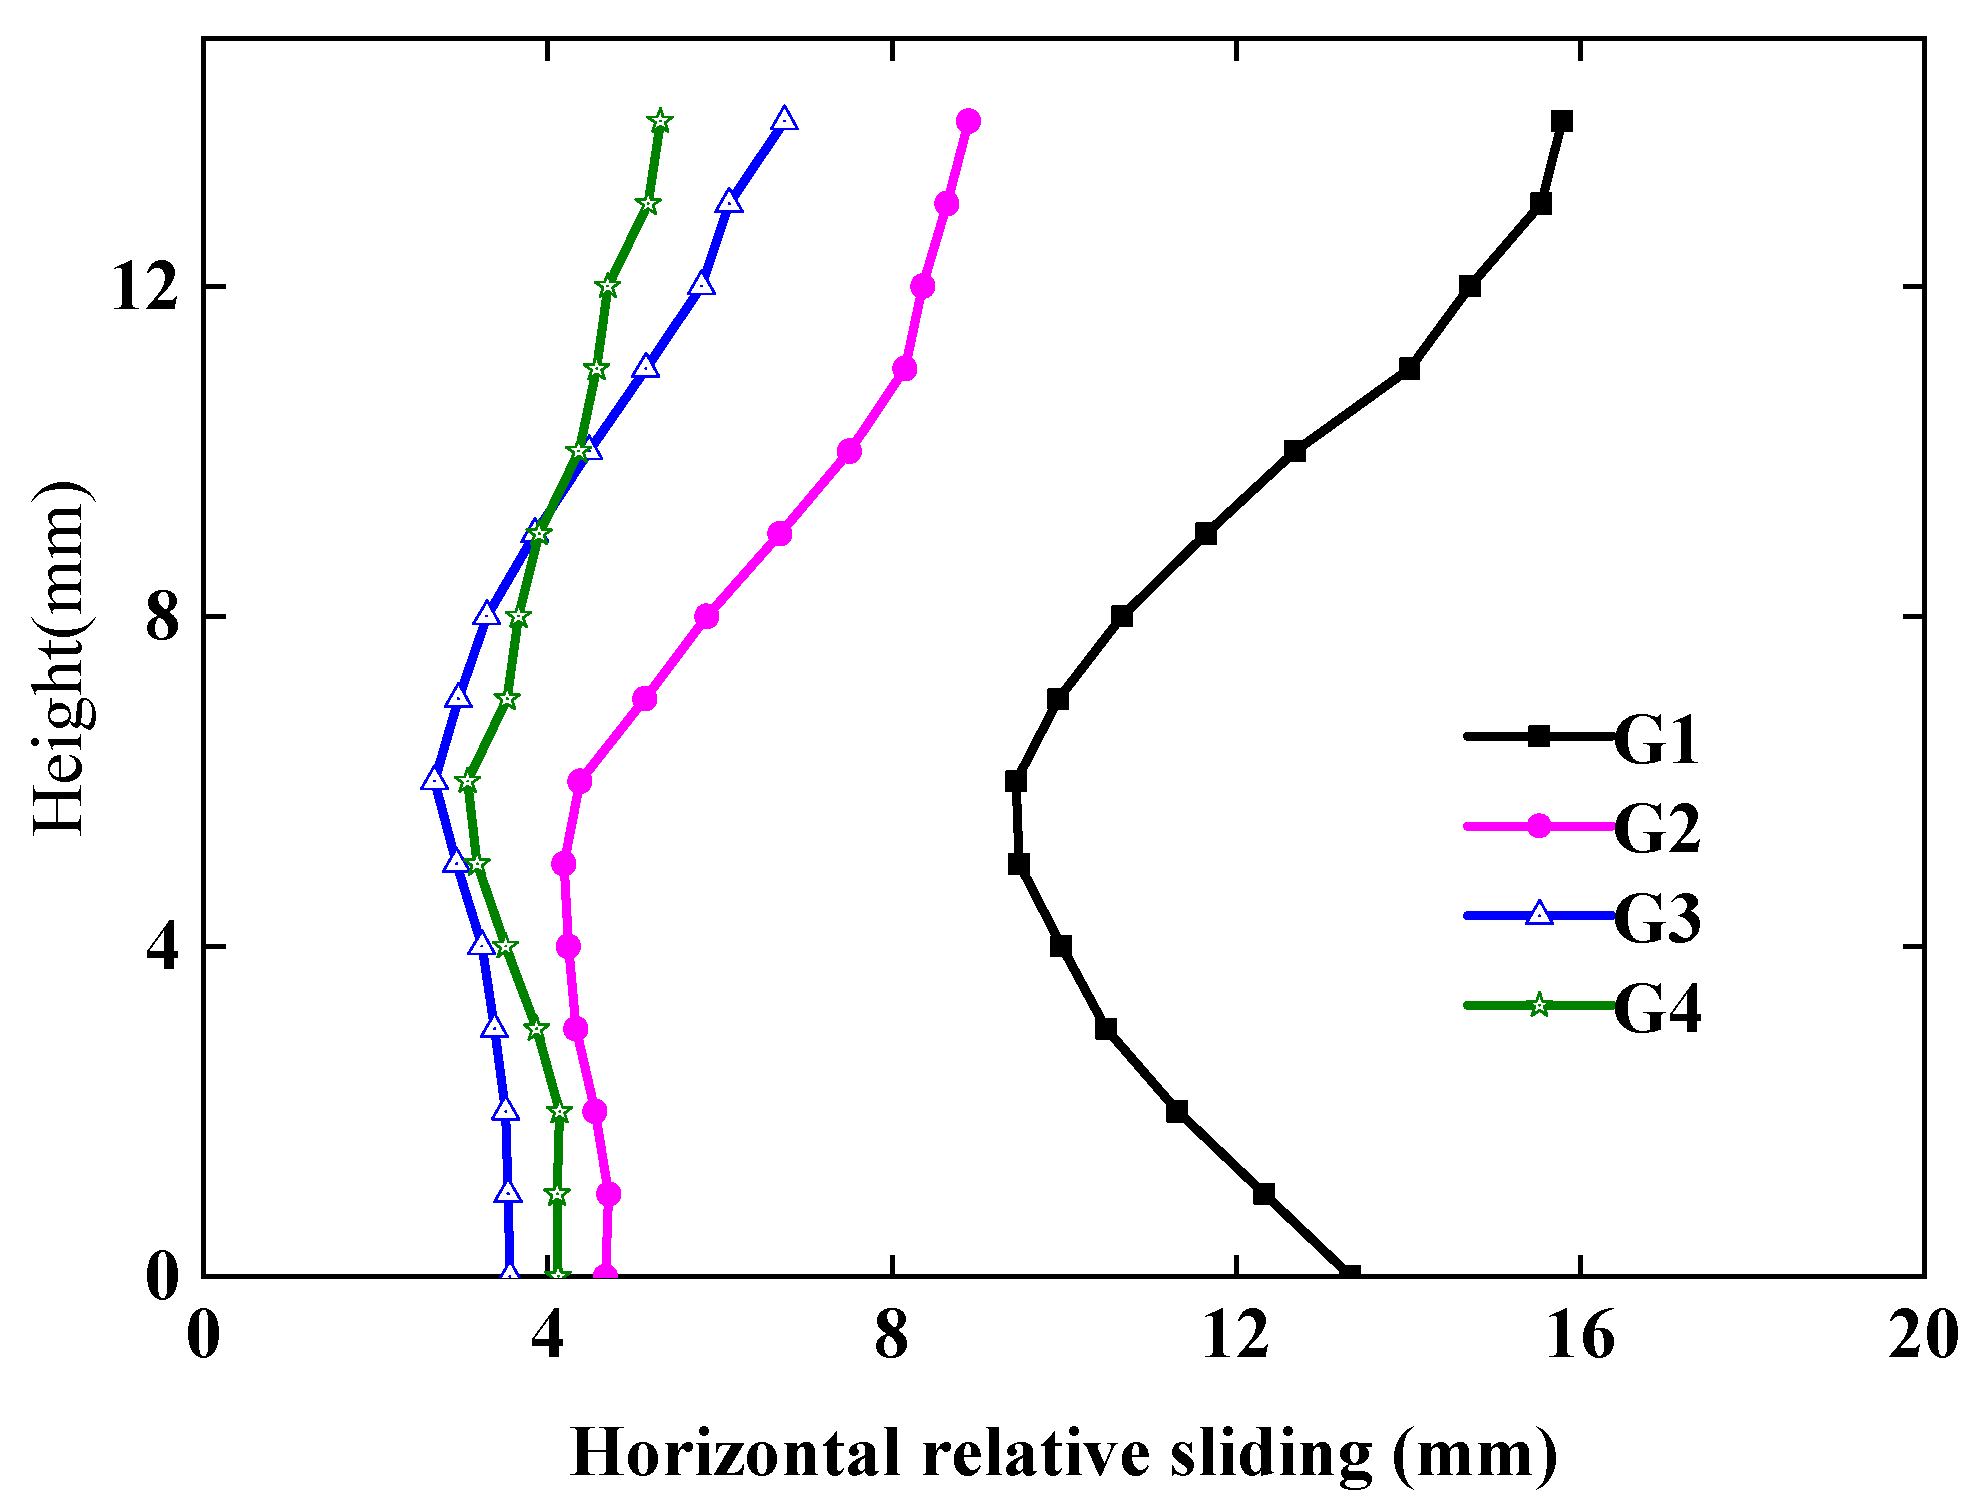
4.3.2. Horizontal Relative Sliding of Structures on Both Sides of Induced Joint

The horizontal relative sliding of structures on both sides of the induced joint under the G1, G2, G3, and G4 working conditions is shown in Figure 17.
It can be seen from the figure that under G1 working condition, the horizontal relative sliding of the structures on both sides of the induced joint at the bottom layer gradually decreases from bottom to top along the subway station structure, while the change law of the horizontal relative sliding of the top layer is opposite to that of the bottom layer. The horizontal relative sliding is visibly larger at places with a large concentrated mass of the bottom plate and top plate. Under G2, G3, and G4 working conditions, the bottom layer shows an overall swing. The top layer of the structure on both sides of the induced joint is subject to relative torsional deformation along the longitudinal direction. With an increase in the remaining longitudinal reinforcement ratio at the induced joint, the horizontal relative sliding of the side wall gradually decreases. The overall horizontal relative sliding under the G1 working condition is the largest and reaches 13.33 mm at the bottom plate. This is because all the longitudinal reinforcement at the induced joint is cut off, and the effect of resisting the horizontal relative sliding of the structures on both sides only by the friction between concrete interfaces is limited.

4.3.3. Vertical Relative Dislocation of Structures on Both Sides of Induced Joint

The vertical relative dislocation of structures on both sides of the induced joint under the G1, G2, G3, and G4 working conditions is shown in Figure 18. It can be seen that the calculated values under the G2, G3, and G4 working conditions are very close, and the maximum value is less than 1 mm. However, under the G1 working condition, the vertical relative dislocation is visibly greater than that under other conditions, and gradually increases from left to right along the width direction of the section of the subway station, with a maximum value of 4.2 mm. This is due to the absence of through longitudinal reinforcement at the induced joint and poor structural connectivity on both sides. Although key grooves are set at the induced joint of the bottom plate, the structure on both sides may have longitudinal relative displacement or rotation under earthquake action, which may cause the key grooves to detach or damage, causing serious vertical relative dislocation of the structures on both sides of the induced joint section.

4.4. Influence of the Key Groove

In order to study the influence of the bottom plate key groove on the seismic response of the induced joint, the G2 working condition is selected for comparison. The bottom plate key groove of the induced joint section under the G2 working condition is removed and marked as the J2 working condition. The plastic strain time-history curves of the remaining longitudinal reinforcement at the PE1–PE4 measuring points at the induced joint under the J2 working condition are shown in Figure 19.
Compared with Figure 16, it is found that the plastic deformation of the longitudinal reinforcement remaining at each measuring point is larger during the whole vibration time when no key groove is set at the bottom plate of the induced joint section. Under the J2 working condition, the maximum plastic strain of remaining longitudinal reinforcement at each measuring point of induced joint section points PE1–PE4 is 13,341, 3416, 294, and 9751, respectively. Obviously, the maximum plastic strain under the working condition of not setting the bottom plate key groove is greater than that of the corresponding measuring point under the working condition of setting the bottom plate key groove. The reason is that the lack of a key groove at the bottom plate of the induced joint section will reduce the connectivity of the structures on both sides, and the remaining longitudinal reinforcement will bear greater shear force under the coupling effect of gravity and seismic force.
To better analyze the change in horizontal relative displacement, the horizontal relative sliding of structures on both sides of the induced joint under the G2 and J2 working conditions is compared, as shown in Figure 20a. The horizontal relative sliding under the J2 working condition is only a little greater than that under the J1 working condition, and the maximum difference between the two is only 1.05 mm. This indicates that the key groove set on the bottom plate has a certain effect on controlling the horizontal relative sliding of the structures on both sides of the induced joint on the bottom layer. The vertical relative dislocation of the structures on both sides of the induced joint under the two working conditions is shown in Figure 20b. It is found that the vertical relative dislocation under the J1 working condition is significantly smaller than that under the J2 working condition. The vertical relative dislocation of each measuring point under the J1 working condition is less than 1 mm, while the vertical relative dislocation of each measuring point under the J2 working condition is more than 2 mm, with a maximum value of 2.7 mm. This shows that the key groove on the bottom plate has a significant effect on controlling the vertical relative dislocation of the structures on both sides of the induced joint.

5. Conclusions and Suggestions

In this paper, the seismic response of induced joints in subway stations on loess sites under the action of seismic waves is studied by numerical simulation. The horizontal relative sliding and vertical relative dislocation of the structures on both sides of the induced joints of the subway station structure under different working conditions, and the strain response of the remaining longitudinal reinforcement at the induced joint, are mainly analyzed. The specific conclusions are as follows:
(1)
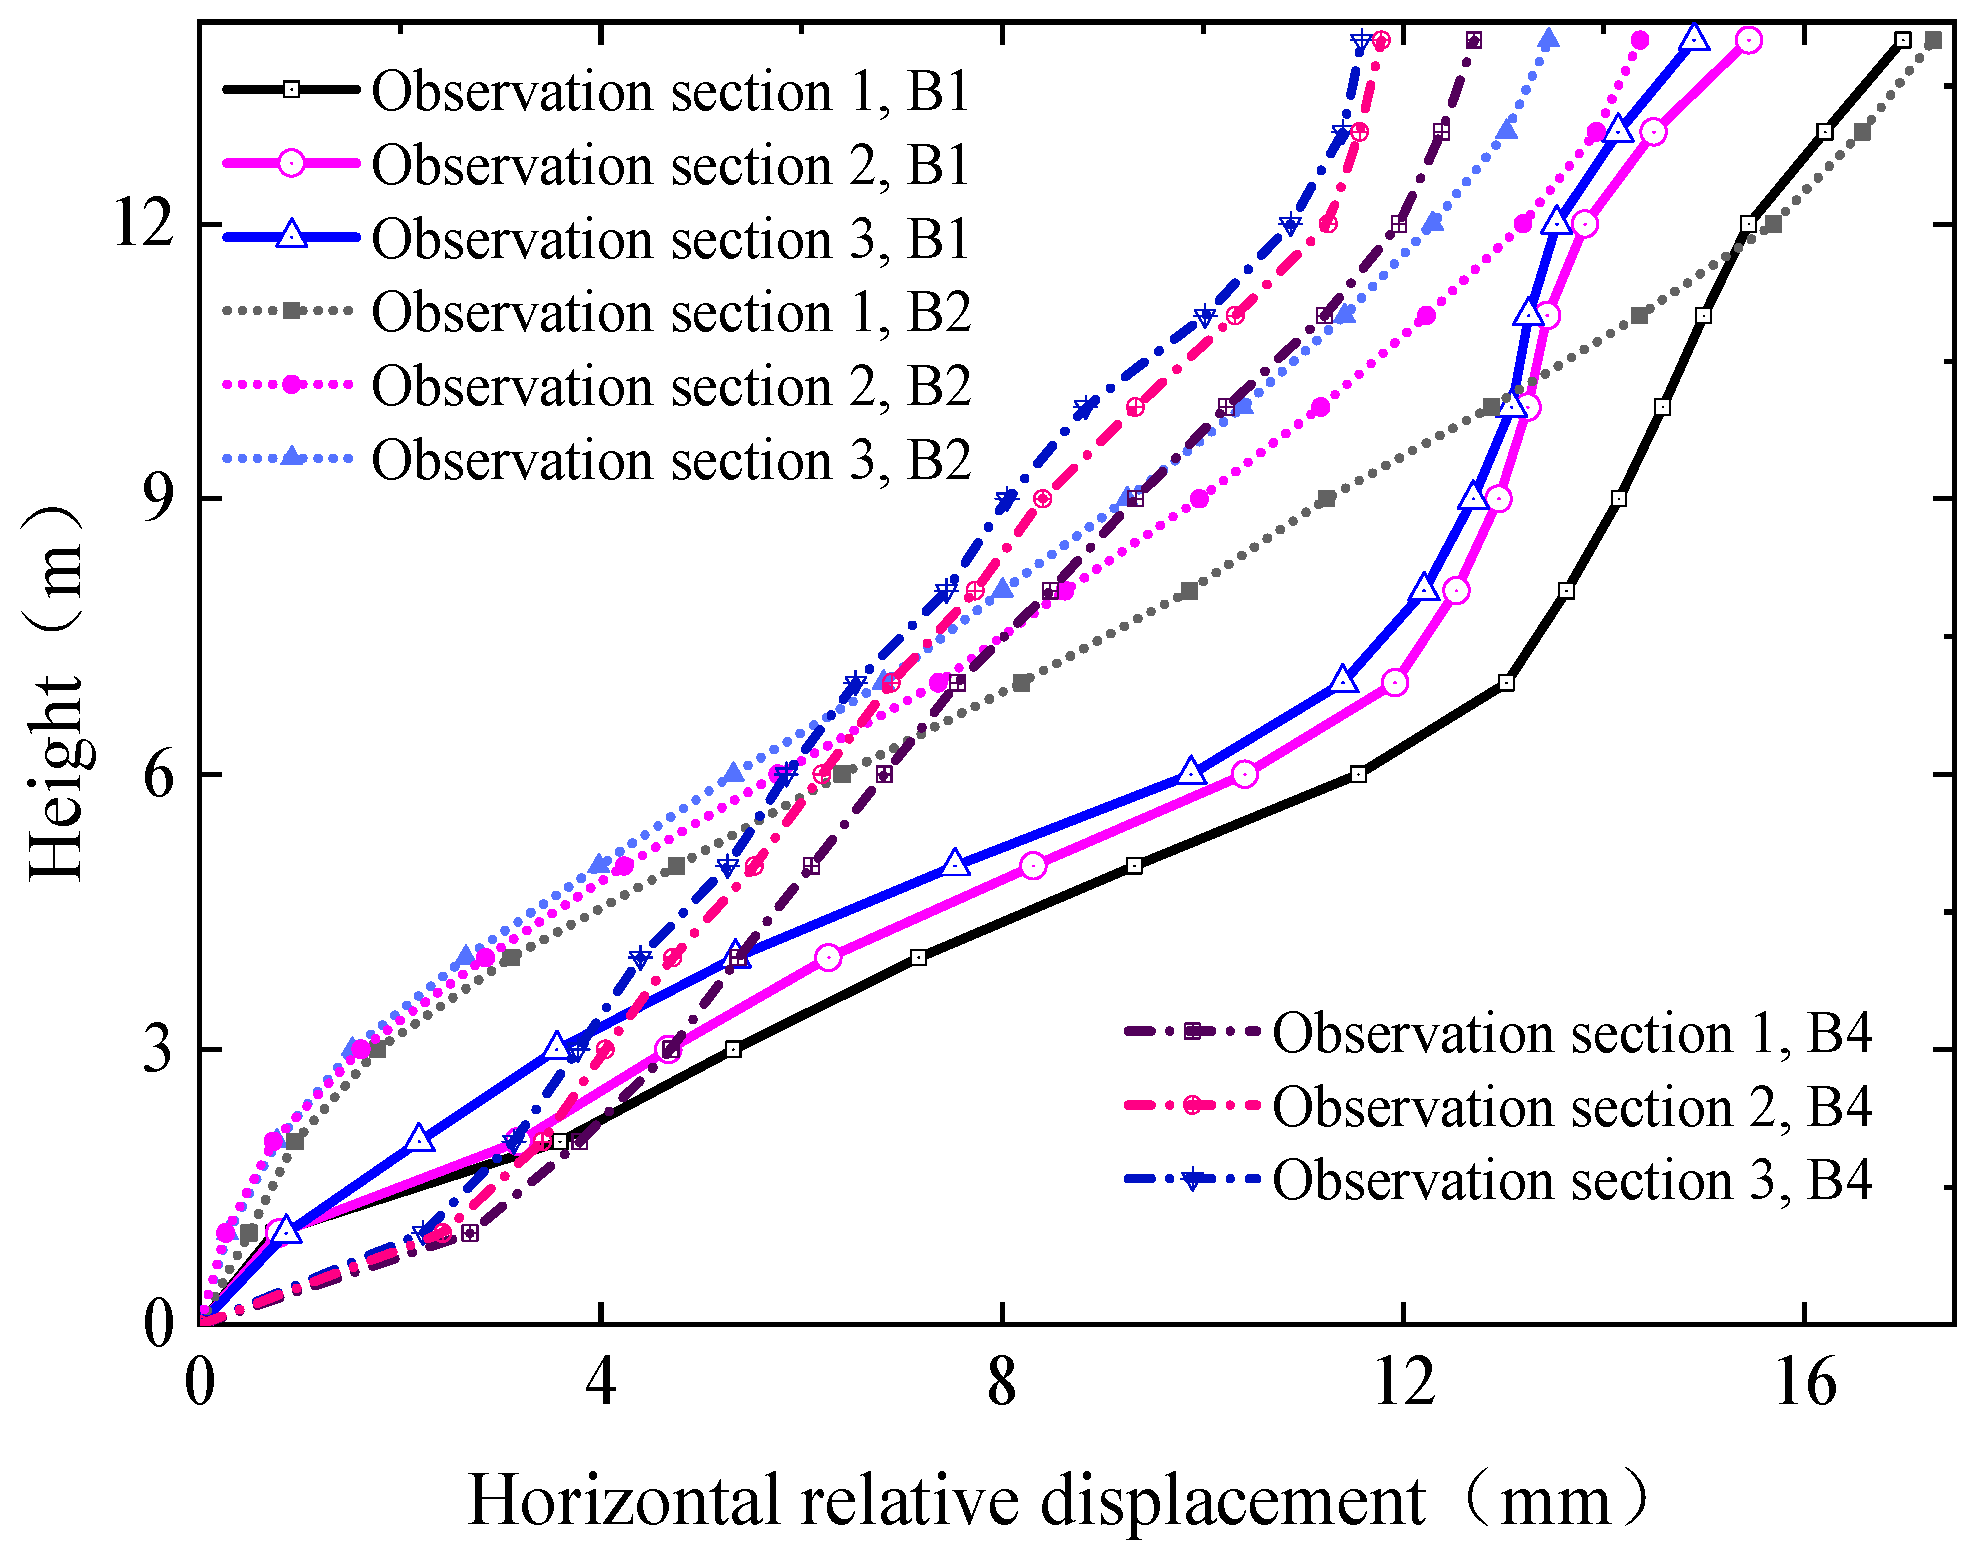
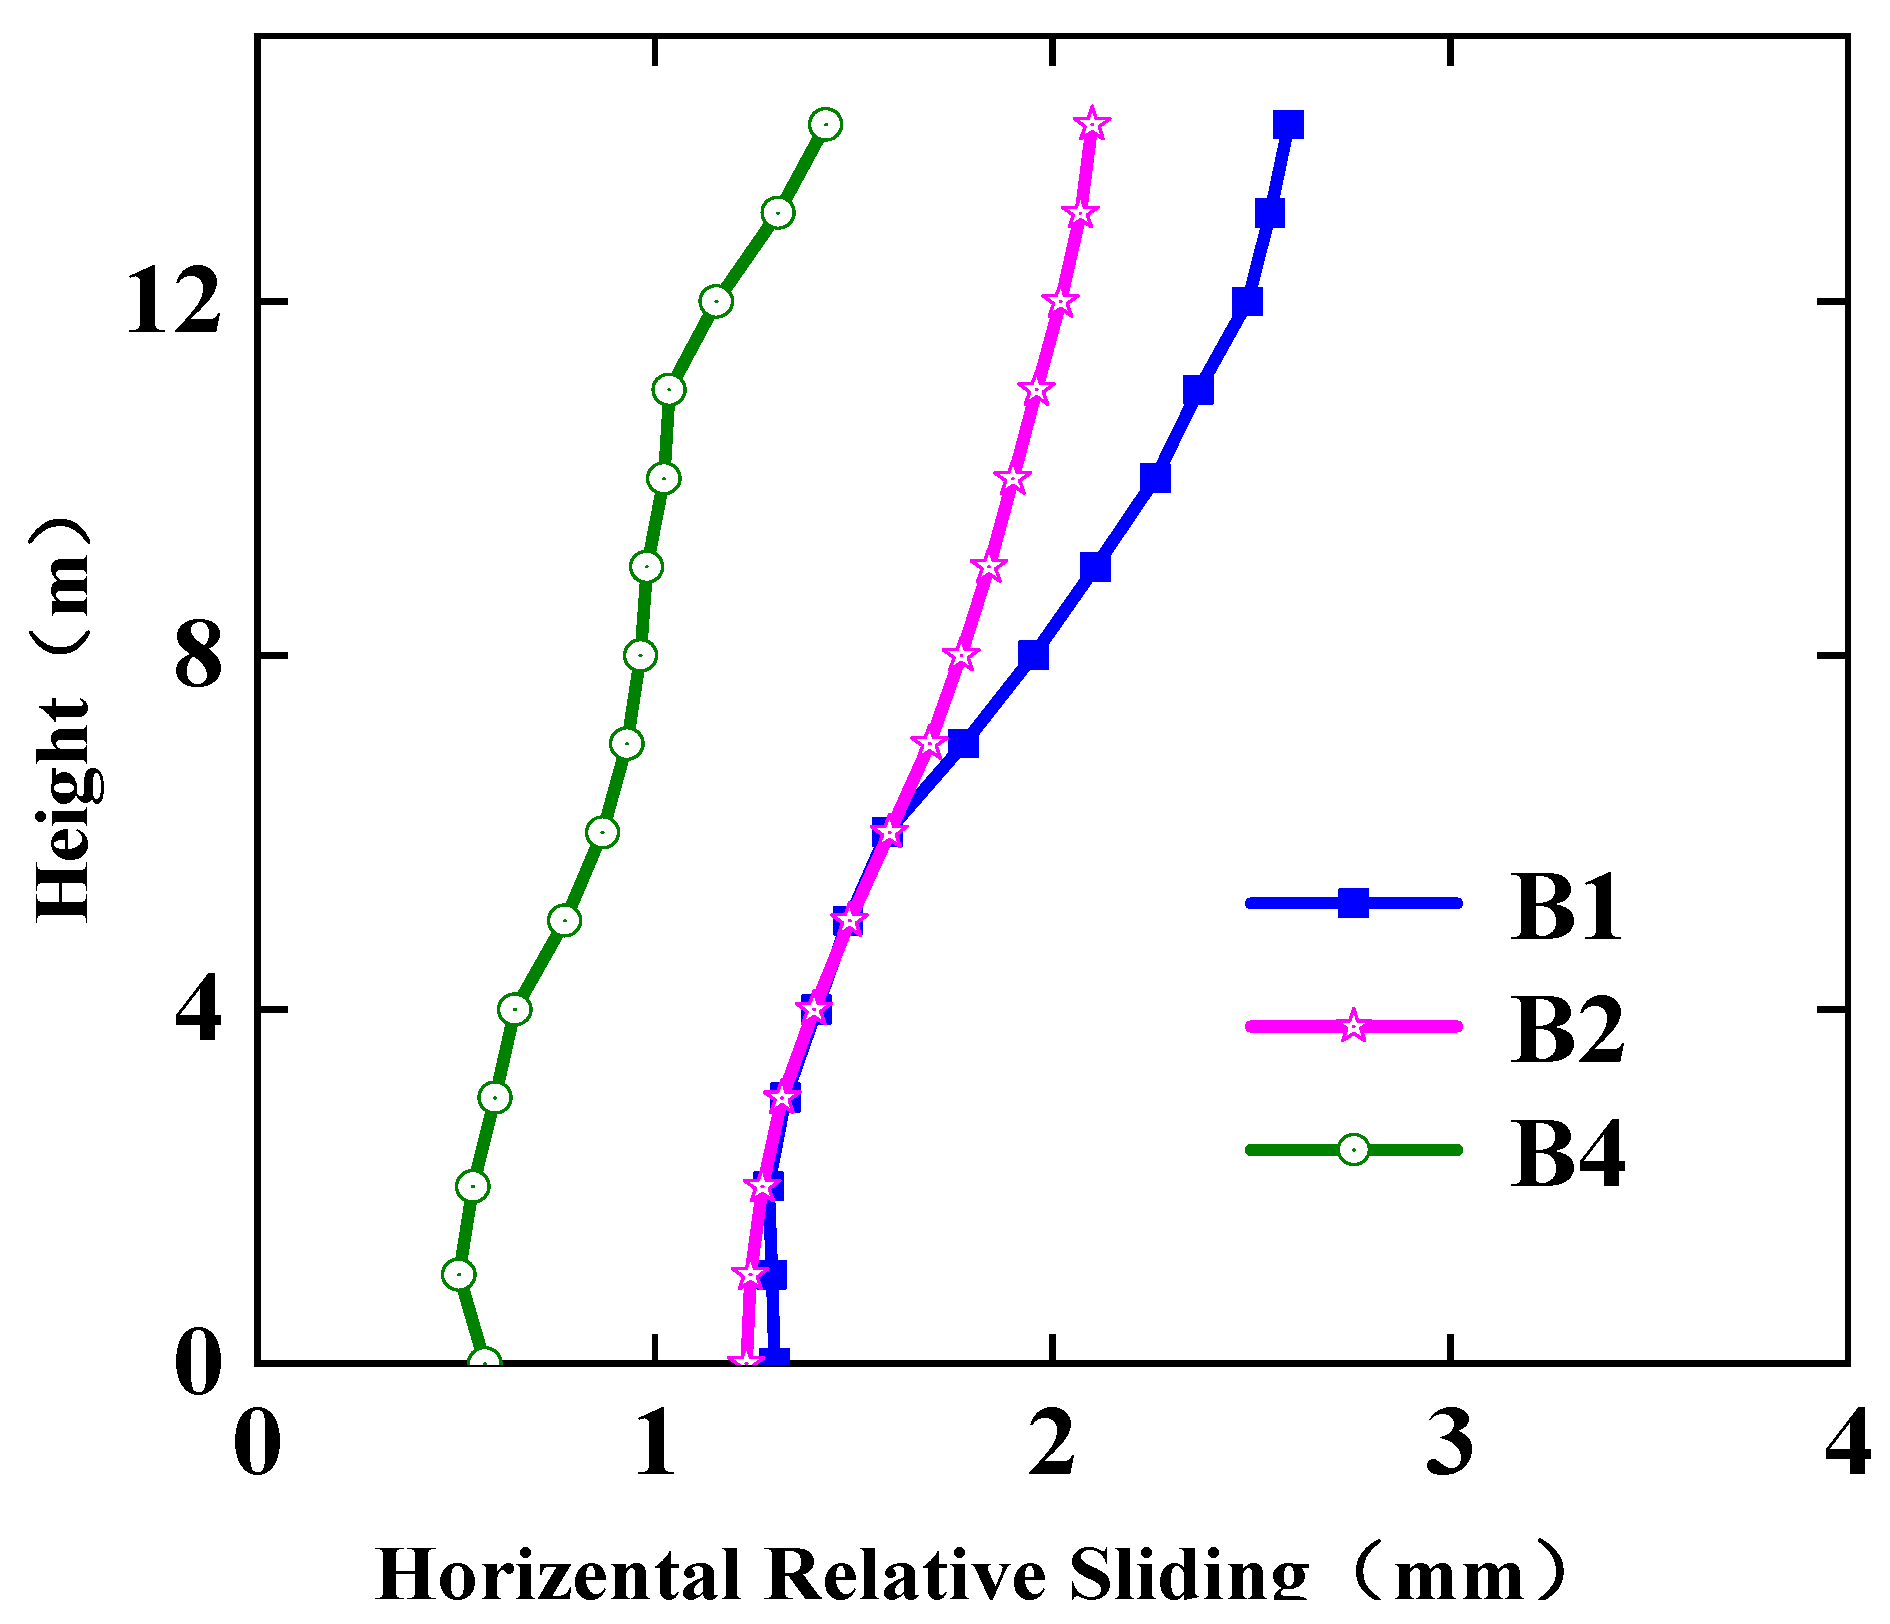
The structure at the induced joint section is more likely to be damaged due to large horizontal relative displacement and is the weak section of the subway station structure. The horizontal relative sliding of the structures on both sides of the induced joint gradually increases from bottom to top along the subway station structure. With an increase in earthquake intensity, the horizontal relative sliding of the structures on both sides of the induced joint becomes larger, and the horizontal relative sliding of the top structure at the section of the induced joint of the subway station is more obvious.
(2)
The horizontal relative sliding and vertical relative misalignment of the structures on both sides of the induced joint can be reduced by increasing the reinforcement ratio of the remaining longitudinal reinforcement in the induced joint.
(3)
The vertical relative dislocation of structures on both sides of the induced joint along the width direction of the subway station section is generally larger at both ends and smaller in the middle. With an increase in earthquake intensity, the vertical relative dislocation is smaller.
(4)
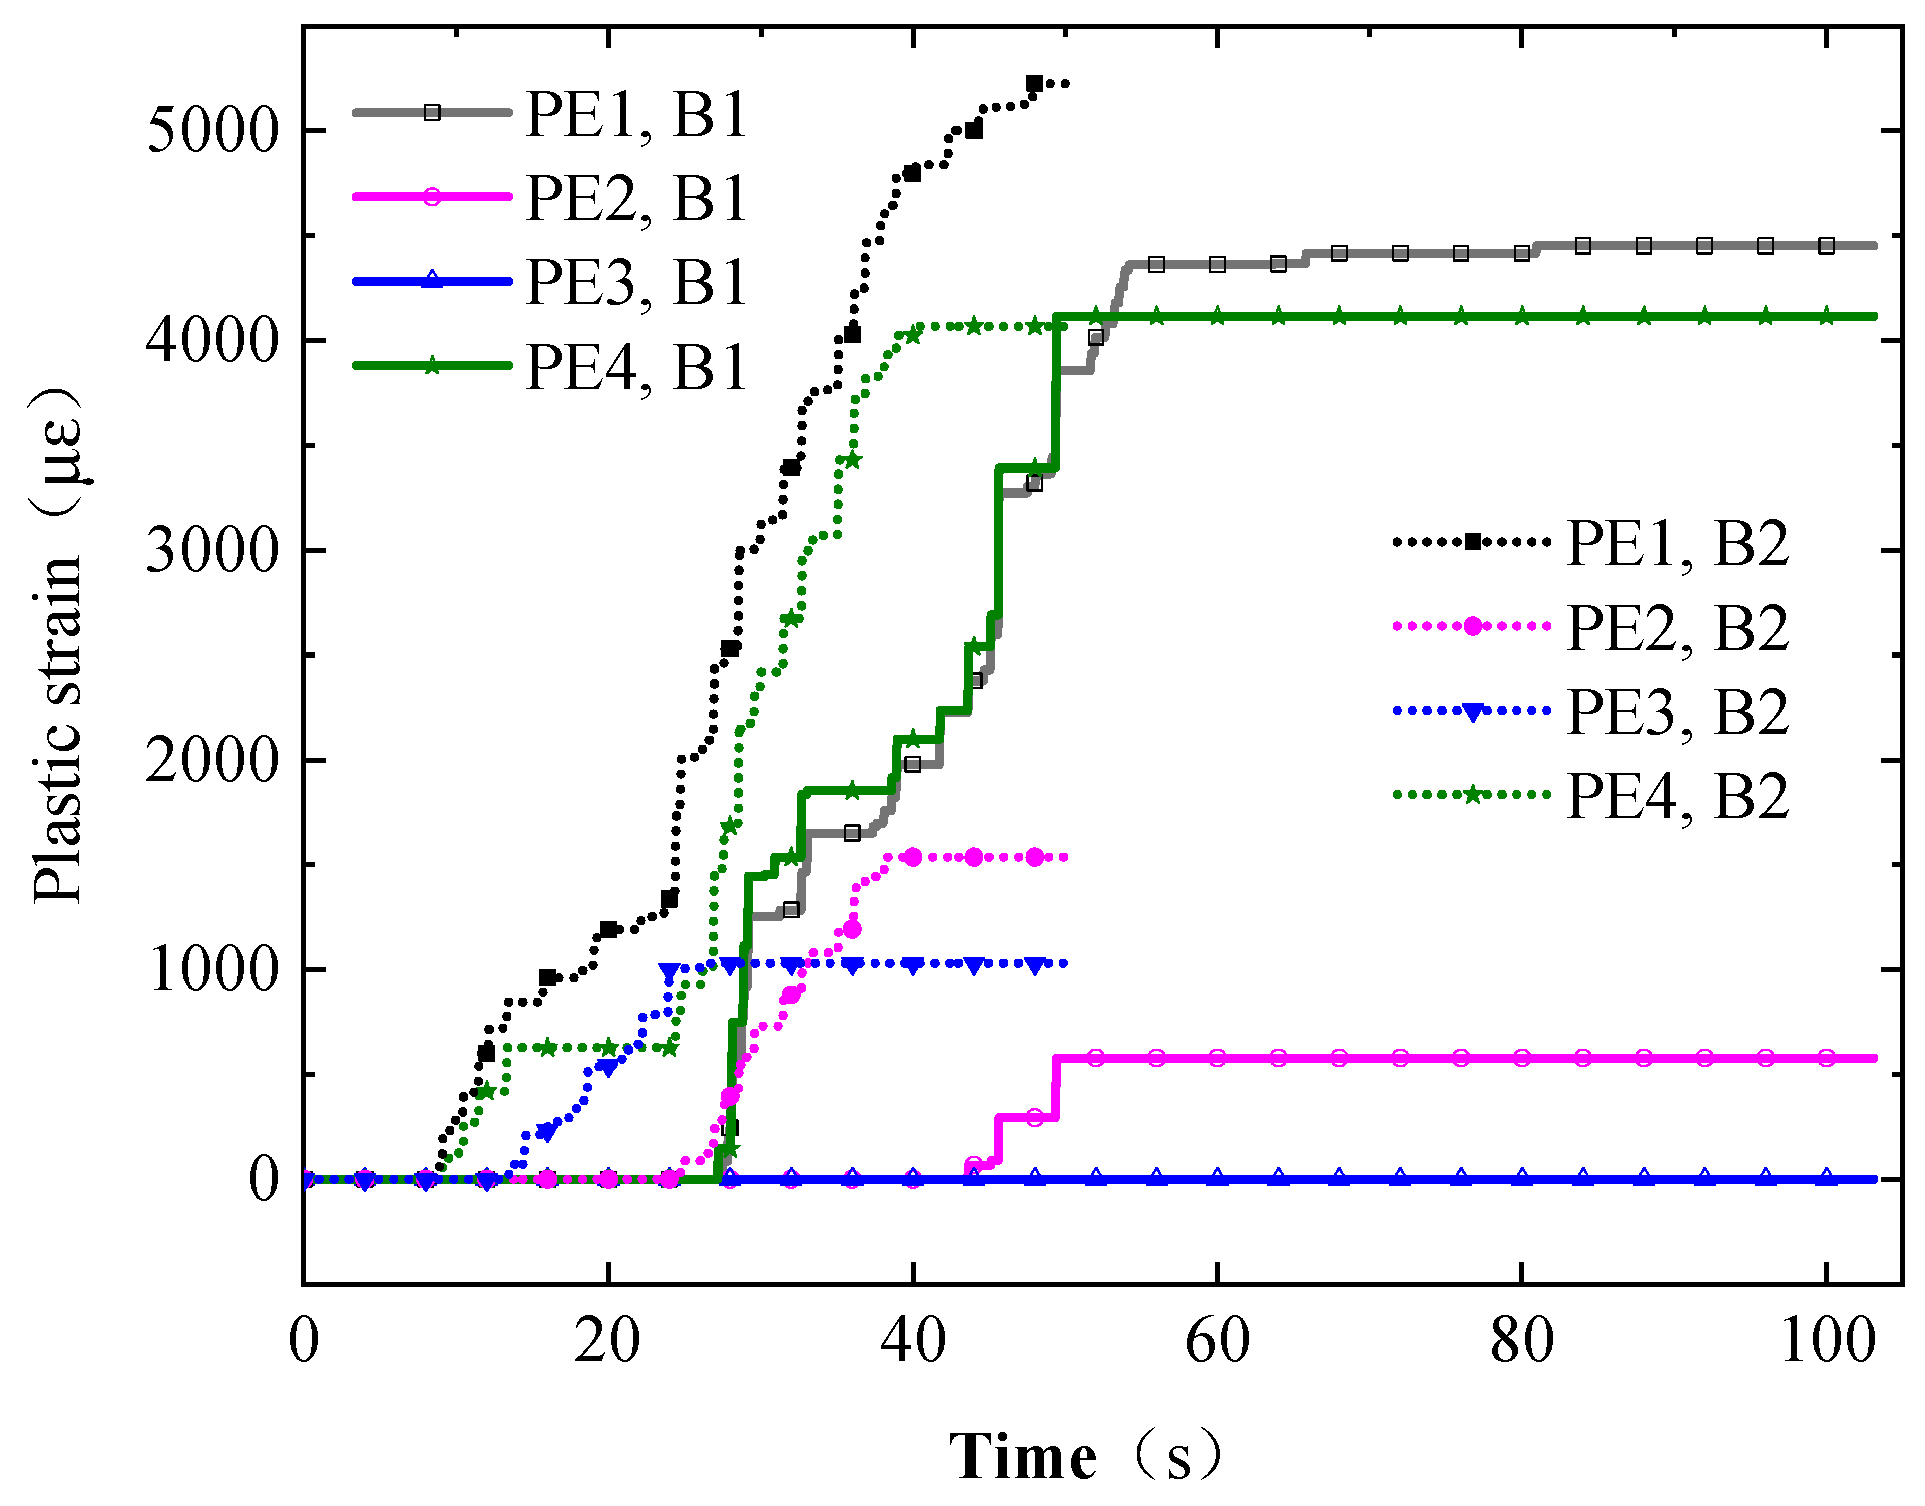
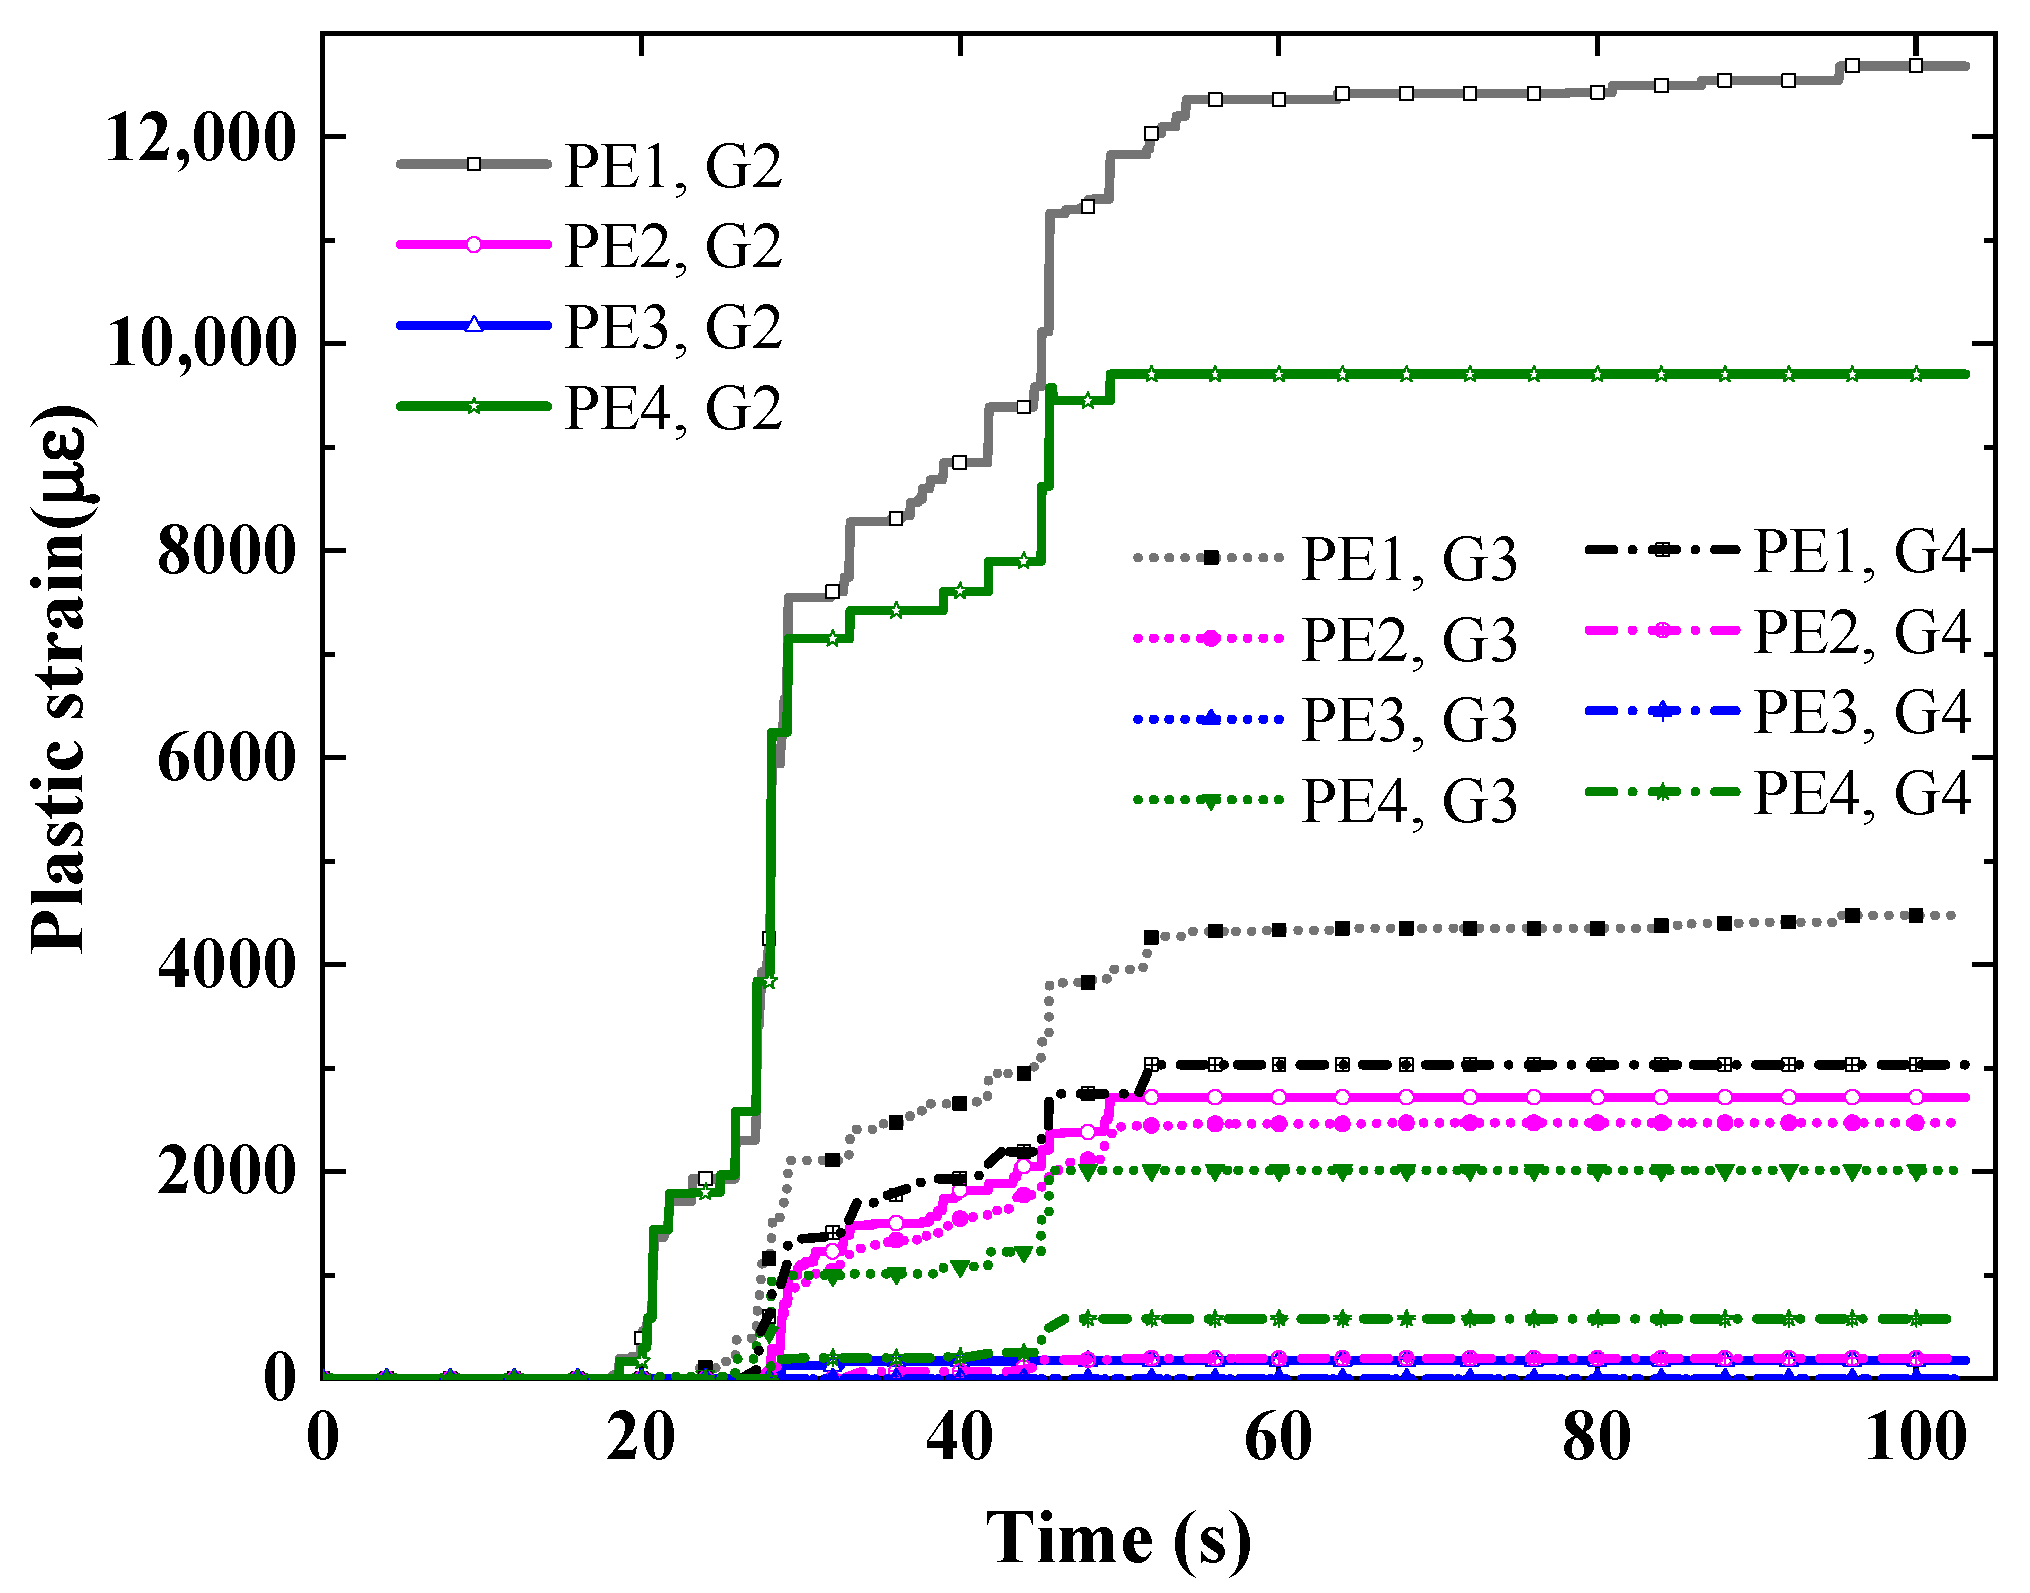
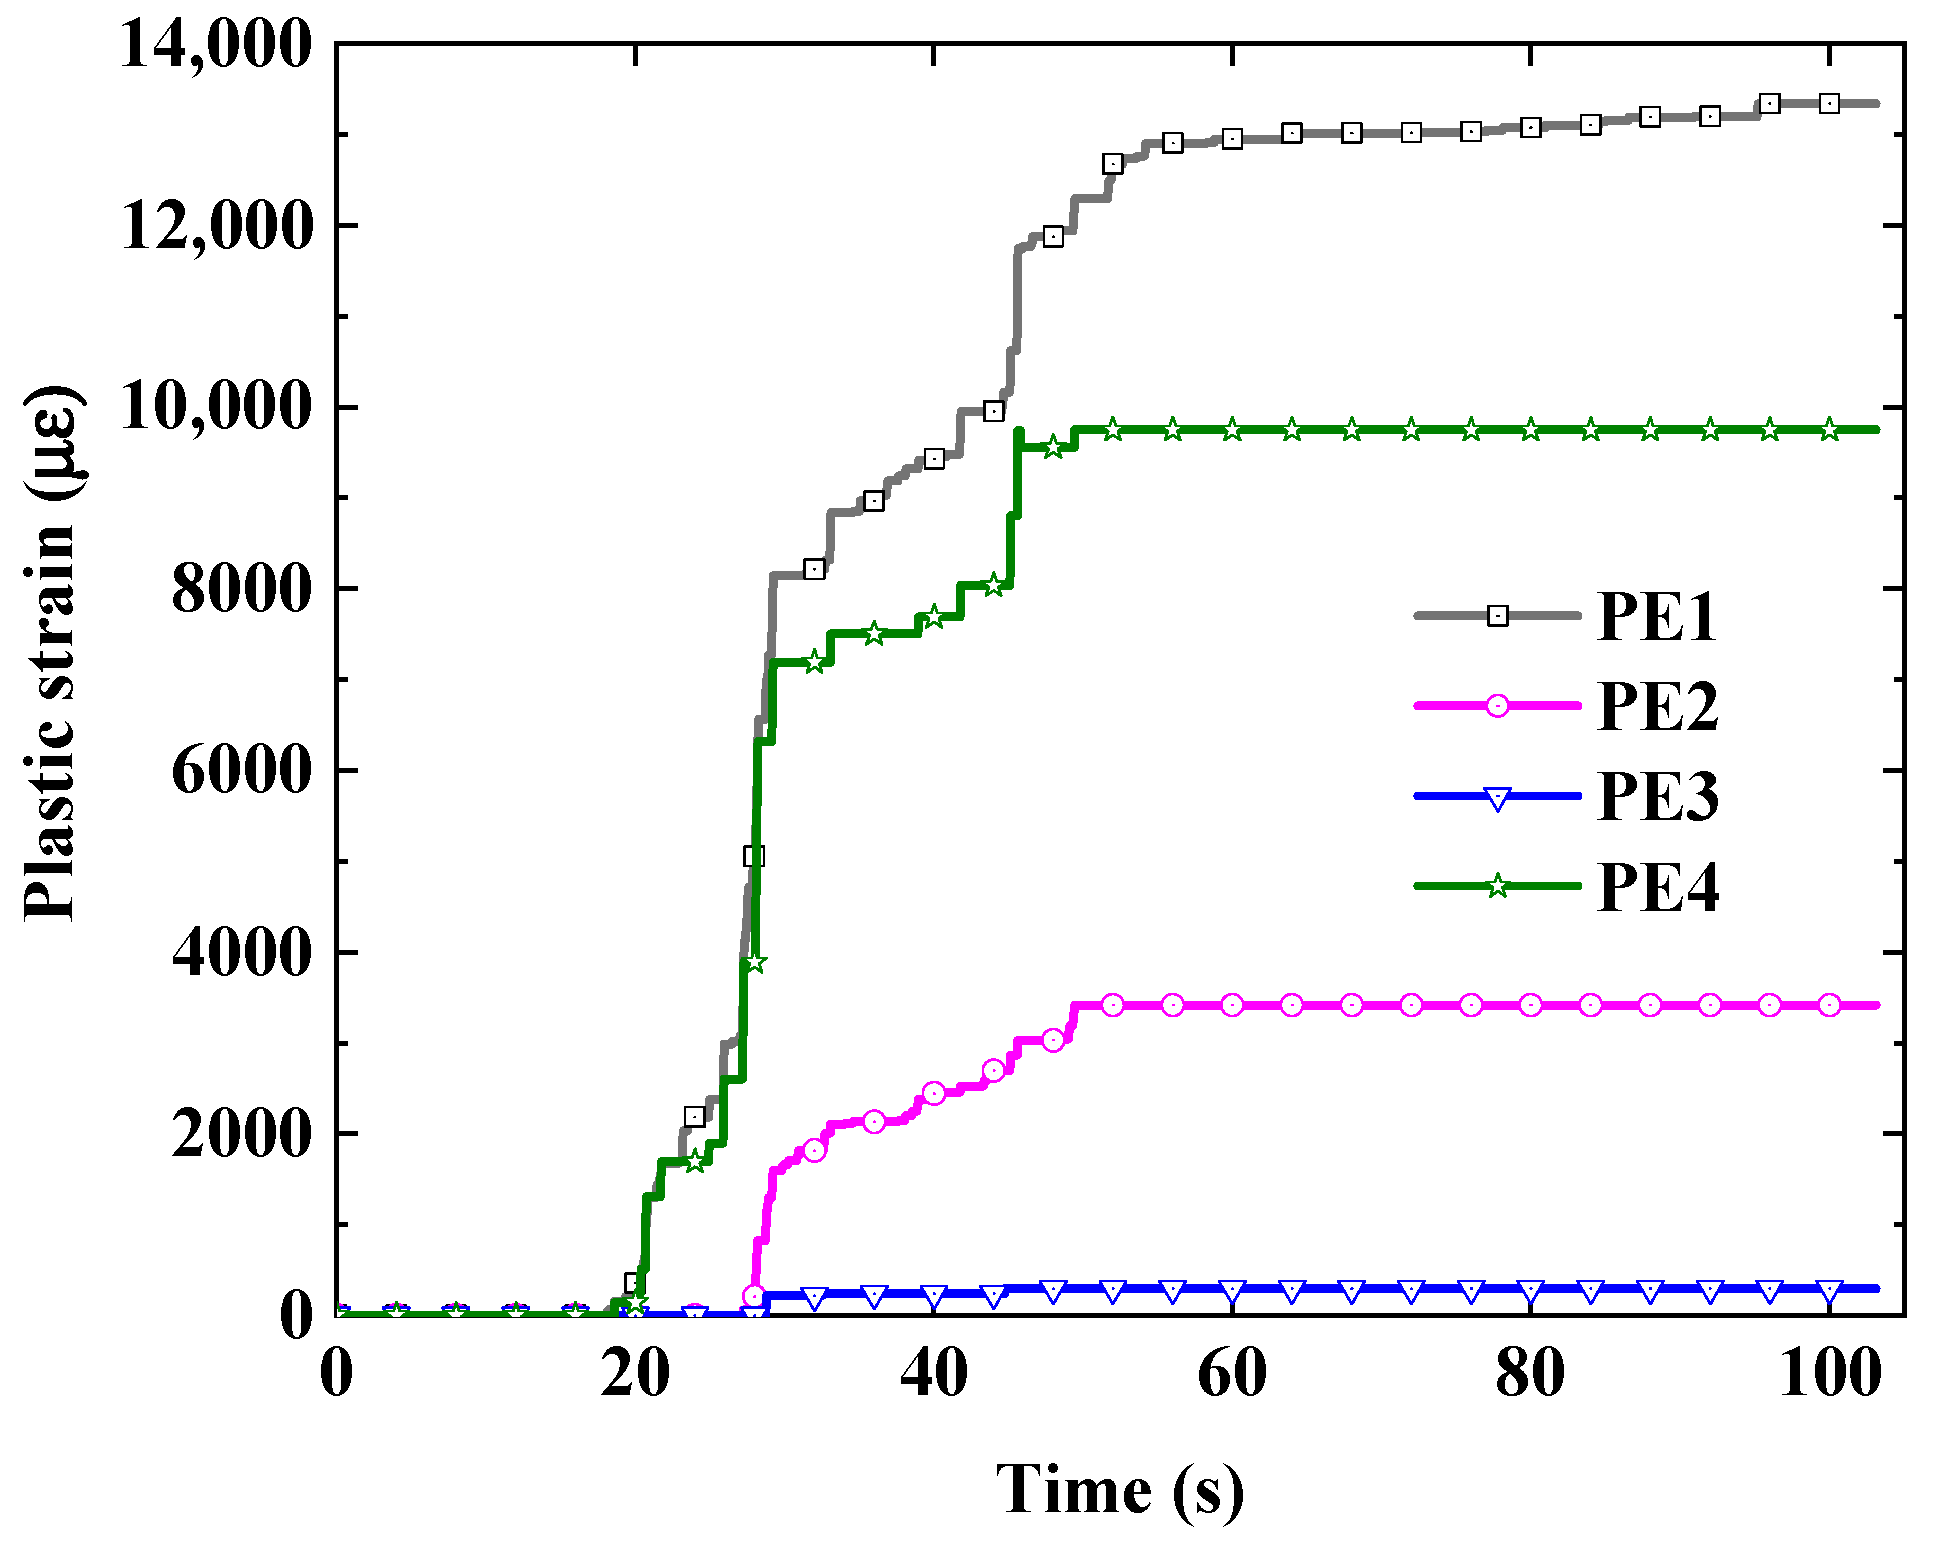
Under the action of Songpan and Taft waves, the plastic deformation of the remaining longitudinal reinforcement at the induced joint is mainly concentrated in the duration of strong earthquake action. However, under the action of Xi’an artificial waves, the plastic deformation of the remaining longitudinal reinforcement at the induced joint runs through the whole process of earthquake action, and the cumulative effect of plastic strain is significant. With an increase in earthquake intensity, the plastic deformation of the remaining longitudinal reinforcement at the induced joint increases.
(5)
The key groove on the bottom plate has little effect on the horizontal relative sliding of the structures on both sides of the induced joint at the bottom layer but has a significant effect on controlling the vertical relative dislocation of the structures on both sides of the induced joint.
In this present study, the seismic response of induced joints in subway station structures is revealed and some meaningful conclusions are obtained. However, most of the research results are qualitative and lack a more accurate quantitative analysis. It is suggested to further use incremental dynamic analysis (IDA) for quantitative analysis to draw more accurate conclusions to provide a scientific basis for controlling and reducing excessive deformation and the failure of induced joints.

Author Contributions

D.Q.: Methodology, Conceptualization, Data curation, Validation; S.C.: Reviewing, Funding acquisition, Supervision, Writing; Y.W.: Methodology, Writing, Data analysis; Z.F.: Data analysis; Y.B.; Supervision, Reviewing. All authors have read and agreed to the published version of the manuscript.

Funding

This research was funded by the National Natural Science Foundation of China (grant number 41902277), the Natural Science Basic Research Plan in Shaanxi Province, (grant number 2023-YBGY-085), and Fundamental Research Funds for the Central Universities of China (grant number 300102282201).

Data Availability Statement

The data used to support the findings of this study are included in the article.

Conflicts of Interest

The authors declare no conflict of interest.

References

  1. Hashash, Y.M.A.; Hook, J.J.; Schmidt, B.; Yao, J.I. Seismic design and analysis of underground structures. Tunn. Undergr. Space Technol. Inc. Trenchless Technol. Res. 2001, 16, 247–293. [Google Scholar] [CrossRef]
  2. Smerzini, C.; Avilés, J.; Sánchezlogesma, F.J.; Paolucci, R. Analytical solutions for the seismic response of underground structures under SH wave propagation. Aip Conf. Am. Inst. Phys. 2008, 1020, 674–683. [Google Scholar]
  3. Naggar, H.E.; Hinchberger, S.D.; Naggar, M. Simplified analysis of seismic in-plane stresses in composite and jointed tunnel linings. Soil Dyn. Earthq. Eng. 2008, 28, 1063–1077. [Google Scholar] [CrossRef]
  4. Kazemeini, M.J.; Haghshenas, E.; Kamalian, M. Experimental evaluation of seismic site response over and nearby underground cavities (study of subway tunnel in city of Karaj, Iran). Iran. J. Sci. Technol. Trans. Civ. Eng. 2015, 39, 319–322. [Google Scholar]
  5. Dadfar, B.; Naggar, M.E.; Nastev, M. Experimental and analytical study of seismic site response of discontinuous permafrost. Can. Geotech. J. 2016, 53, 1363–1375. [Google Scholar] [CrossRef]
  6. Hushmand, A.; Dashti, S.; Davis, C.; McCartney, J.S.; Hushmand, B. A centrifuge study of the influence of site response, relative stiffness, and kinematic constraints on the seismic performance of buried reservoir structures. Soil Dyn. Earthq. Eng. 2016, 88, 427–438. [Google Scholar] [CrossRef]
  7. Amorosi, A.; Boldini, R.; Elia, R. Parametric study on seismic ground response by finite element modelling. Comput. Geotech. 2010, 37, 515–528. [Google Scholar] [CrossRef]
  8. Ichimura, T.; Tanaka, S.; Hori, M.; Yamamoto, Y.; Dobashi, H.; Osada, M.; Ohbo, N.; Yamada, T. Full three-dimensional seismic response analysis of underground structures with large complex cross sections and two-step analysis method for reducing the computational costs. J. Earthq. Tsunami 2016, 10, 1640016. [Google Scholar] [CrossRef]
  9. Schanze, E.; Schanze, E.; Gomez, M.; Lopez, A. Numerical study of the seismic response of an instrumented building with underground stories. Appl. Sci. 2021, 11, 3190. [Google Scholar] [CrossRef]
  10. Jeng, D.S.; Lu, J.F. Vibration analysis of a circular tunnel with jointed liners embedded in an elastic medium subjected to seismic waves. J. Vib. Acoust. Trans. ASME 2009, 131, 021005. [Google Scholar] [CrossRef]
  11. Lin, G.; Lu, S.; Liu, J. Transmitting boundary for transient analysis of wave propagation in layered media formulated based on acceleration unit-impulse response. Soil Dyn. Earthq. Eng. 2016, 90, 494–509. [Google Scholar] [CrossRef]
  12. Carlos, G.M.; Jesus, G.G.; Claudio, O.M. Enhanced simplified method for pseudostatic analysis of seismic internal forces in rectangular underground structures. J. Geotech. Geoenviron. Eng. 2021, 147, 04021090. [Google Scholar]
  13. Mehdi, P.; Saeed, M.H.; Amirabbas, F. Seismic response of the ground surface including underground horseshoe-shaped cavity. Transp. Infrastruct. Geotechnol. 2021, 9, 338–355. [Google Scholar]
  14. Zhao, M.; Gao, Z.D.; Du, X.L.; Wang, J.J.; Zhong, Z.L. Response spectrum method for seismic soil-structure interaction analysis of underground structure. Bull. Earthq. Eng. 2019, 17, 5339–5363. [Google Scholar] [CrossRef]
  15. Iwatate, T.; Kobayashi, Y.; Kusu, H.; Rin, K. Investigation and shaking table tests of subway structures of the Hyogoken-Nanbu earthquake. In Proceedings of the 12th World Conference on Earthquake Engineering, Auckland, New Zealand, 30 January–4 February 2000; New Zealand Society for Earthquake Engineering: Wellington, New Zealand, 2000. [Google Scholar]
  16. Chou, J.C.; Kutter, B.L.; Travasarou, T.; Chacko, J.M. Centrifuge modeling of seismically induced uplift for the BART Transbay Tube. J. Geotech. Geoenviron. Eng. ASCE 2011, 137, 754–765. [Google Scholar] [CrossRef]
  17. Cilingir, U.; Madabhushi, S.P.G. A model study on the effects of input motion on the seismic behaviour of tunnels. Soil Dyn. Earthq. Eng. 2011, 31, 452–462. [Google Scholar] [CrossRef]
  18. Baziar, M.H.; Moghadam, M.R.; Kim, D.S.; Choo, Y.W. Effect of underground tunnel on the ground surface accelerationl. Tunn. Undergr. Space Technol. 2014, 44, 10–22. [Google Scholar] [CrossRef]
  19. Ulgen, D.; Saglam, S.; Ozkan, M.Y. Dynamic response of a flexible rectangular underground structure in sand: Centrifuge modeling. Bull. Earthq. Eng. 2015, 13, 2547–2566. [Google Scholar] [CrossRef]
  20. Dashti, S.; Hashash, Y.M.A.; Gillis, K.; Musgrove, M.; Walker, M. Development of dynamic centrifuge models of underground structures near tall buildings. Soil Dyn. Earthq. Eng. 2016, 86, 89–105. [Google Scholar] [CrossRef]
  21. Masoud, R.M.; Mohammad, H.B. Seismic ground motion amplification pattern induced by a subway tunnel: Shaking table testing and numerical simulation. Soil Dyn. Earthq. Eng. 2016, 83, 81–97. [Google Scholar]
  22. Quan, D.Z.; Chai, S.B.; Chen, S.; Wang, Y.H. Experimental study on seismic response of subway station built in loess. Lat. Am. J. Solids Struct. 2020, 17, e282. [Google Scholar] [CrossRef]
  23. Moss, R.; Crosariol, V.A. Scale model shake table testing of an underground tunnel cross section in soft clay. Earthq. Spectra 2013, 29, 1413–1440. [Google Scholar] [CrossRef]
  24. Tabatabaiefar, H.R. Development of synthetic soil mixture for experimental shaking table tests on building frames resting on soft soils. Geomech. Geoengin. 2016, 12, 28–35. [Google Scholar] [CrossRef]
  25. Zhuang, H.Y.; Wang, X.; Miao, Y.; Yao, E.; Chen, S.; Ruan, B.; Chen, G.X. Seismic responses of a subway station and tunnel in a slightly inclined liquefiable ground through shaking table test. Soil Dyn. Earthq. Eng. 2019, 116, 371–385. [Google Scholar]
  26. Adampira, M.; Derakhshandi, M.; Ghalandarzadeh, A. Experimental study on seismic response characteristics of liquefiable soil layers. J. Earthq. Eng. 2021, 25, 1287–1315. [Google Scholar] [CrossRef]
  27. Wang, J.N.; Yang, J.; Zhuang, H.Y.; Ma, G.W.; Sun, Y.J. Seismic responses of a large unequal-span underground subway station in liquefiable soil using shaking table test. J. Earthq. Eng. 2022, 26, 8446–8467. [Google Scholar] [CrossRef]
  28. Parra, M.G.J.; Bobet, A.; Ramirez, J.A. Evaluation of soil-structure interaction and structural collapse in Daikai subway station during Kobe earthquake. ACI Struct. J. Am. Concr. Inst. 2006, 103, 113–122. [Google Scholar]
  29. Abate, G.; Massimino, M.R.; Maugeri, M.; Muir Wood, D. Numerical modelling of a shaking table test for soil-foundation-superstructure interaction by means of a soil constitutive model implemented in a FEM code. Geotech. Geol. Eng. 2010, 28, 37–59. [Google Scholar] [CrossRef]
  30. Long, H.; Chen, G.X.; Zhuang, H.Y. Analysis of seismic response influence of high rise building nearby subway station in soft site. Appl. Mech. Mater. 2012, 166–169, 2105–2111. [Google Scholar] [CrossRef]
  31. Conti, R.; Viggiani, G.M.; Perugini, F. Numerical modelling of centrifuge dynamic tests of circular tunnels in dry sand. Acta Geotech. 2014, 9, 597–612. [Google Scholar] [CrossRef]
  32. Abate, G.; Massimino, M.; Maugeri, M. Numerical modelling of centrifuge tests on tunnel–soil systems. Bull. Earthq. Eng. 2015, 13, 1927–1951. [Google Scholar] [CrossRef]
  33. Keykhosropour, L.; Lemnitzer, A. Seismic response behavior of deep flexible underground structures in sand-insights from an experimental-numerical investigation. Bull. Earthq. Eng. 2022, 20, 5205–5231. [Google Scholar] [CrossRef]
  34. Yoo, M.; Kwon, S.Y.; Hong, S. Dynamic response evaluation of deep underground structures based on numerical simulation. Geomech. Eng. 2022, 29, 269–279. [Google Scholar]
  35. Sun, Q.Q.; Peng, D.; Dias, D. Seismic performances of three- and four-sided box culverts: A comparative study. Geomech. Eng. 2020, 22, 49–63. [Google Scholar]
  36. Wang, Q.; Geng, P.; Guo, X.Y.; Wang, X.; Li, P.; Zhao, B. Case study on the seismic response of a subway station combined with a flyover. Undergr. Space 2021, 6, 665–677. [Google Scholar] [CrossRef]
  37. Alejandro, R.C.; Victor, M.C.; Fabian, I.P. Seismic response of underground and floating tunnels. Pure Appl. Geophsics 2022, 179, 973–992. [Google Scholar]
  38. GB 50909-2014; Code for Seismic Design of Urban Rail Transit Structures. China Planning Publishing House: Beijing, China, 2014.
  39. Du, X.L.; Zhao, M.; Wang, J.T. Artificial stress boundary conditions for near field wave simulation. J. Mech. 2006, 1, 49–56. [Google Scholar]
  40. Du, X.L.; Zhao, M. Seismic response analysis method of arch dam based on viscoelastic boundary. J. Water Conserv. 2006, 9, 1063–1069. [Google Scholar]
Figure 1. Schematic diagram of induced joint structure: (a) Induced joint structure of the floor; (b) Induced seam structure of the roof.
Buildings 13 01244 g001
Figure 2. Model structure and model soil box: (a) Model structure; (b) laminated shear model soil box.
Buildings 13 01244 g002
Figure 3. Numerical model of shaking table test for a subway station in Loess soil.
Buildings 13 01244 g003
Figure 4. Comparison diagram of model foundation acceleration and Fourier spectrum: (a) Songpan wave; (b) Taft wave; (c) Xi’an artificial wave.
Buildings 13 01244 g004
Figure 5. Comparison of horizontal relative displacement of model foundation.
Buildings 13 01244 g005
Figure 6. Schematic diagram of the numerical model of the subway station structure.
Buildings 13 01244 g006
Figure 7. Seismic response measurement points of model structure: (a) Model structure; (b) laminated shear model soil box; (c) Position of horizontal displacement measuring point; (d) position of vertical displacement measuring point.
Buildings 13 01244 g007
Figure 8. Pressure damage cloud diagram of the structure under different working conditions: (a) Working condition B1; (b) Working condition B2; (c) Working condition B3; (d) Working conditio B4; (e) Working condition B5; (f) Working condition B6.
Buildings 13 01244 g008
Figure 9. Pressure damage cloud diagram of different observation sections under the B2 working condition: (a) Observation section No. 1; (b) Observation section No. 2; (c) Observation section No. 3.
Buildings 13 01244 g009
Figure 10. Plastic strain time-history curve of residual reinforcement in the induced joint under different working conditions.
Buildings 13 01244 g010
Figure 11. Horizontal relative displacement of structural side wall under B1, B2 and B4 working conditions.
Buildings 13 01244 g011
Figure 12. Horizontal relative sliding of structures on both sides of the induced joint under B1, B2 and B4 working conditions.
Buildings 13 01244 g012
Figure 13. Vertical relative dislocation of structures on both sides of the induced joint under B1, B2 and B4 working conditions.
Buildings 13 01244 g013
Figure 14. Plastic strain time history curve of residual reinforcement in the induced joint under B5 and B6 working conditions.
Buildings 13 01244 g014
Figure 15. Horizontal relative displacement of structural side wall under B3, B4, B5 and B6 working conditions.
Buildings 13 01244 g015
Figure 16. Plastic strain time history curve of residual reinforcement in the induced joint under G2, G3 and G4 working conditions.
Buildings 13 01244 g016
Figure 17. Horizontal relative sliding of structures on both sides of the induced joint under G1, G2, G3, and G4 working conditions.
Buildings 13 01244 g017
Figure 18. Vertical relative dislocation of structures on both sides of the induced joint under G1, G2, G3, and G4 working conditions.
Buildings 13 01244 g018
Figure 19. Plastic strain time history curve of residual reinforcement.
Buildings 13 01244 g019
Figure 20. Displacement on both sides of the induced joint under different working conditions: (a) Horizontal relative sliding; (b) Vertical relative dislocation.
Buildings 13 01244 g020
Table 1. Soil stratification and basic physical parameters.
LayerThickness h (m)Density ρ (g/cm3)Poisson’s RatioGmax (MPa)
10.151.670.316.8
2~60.251.670.316.8
Table 2. Parameters of concrete damage plastic model of the finite element model.
Model ParameterValuesModel ParameterValues
Density (kg/m3)2500Dilatancy angle Ψ (°)30
Elastic modulus E (MPa)0.66 × 10⁴Viscosity coefficient µ0.0005
Poisson’s ratio υ0.2Invariant stress ratio Kc0.6667
Ultimate compressive stress5.39Damping ratio ξ0.1
Table 3. Soil layer and mechanical parameters of the loess region.
LayerThickness (m)Density (g/cm3)Poisson’s
Ratio
Shear Wave
Velocity (m/s)
Gmax (MPa)γγ (103)λmaxβ
New loess0~619600.2620543.62.0600.1000.2720
New loess6~1320100.2624148.73.7720.0580.2420
ancient soil13~1715400.2627182.32.2580.1370.3963
ancient loess17~2416700.2929897.52.3640.1560.5951
ancient soil24~3617600.29317123.52.8720.1090.4829
ancient loess36~4420600.3033963.93.7640.1300.2428
ancient soil44~5620000.2938395.01.5310.1750.4751
ancient loess56~6419700.3143495.02.3090.1350.4318
ancient loess64~7019800.3146692.62.0000.1500.5401
Table 4. Parameters of concrete damage plastic model.
Model ParameterValuesModel ParameterValues
Density (kg/m3)2500Dilatancy angle Ψ (°)36
Elastic modulus E (MPa)3.25 × 10⁴Viscosity coefficient µ0.0005
Poisson’s ratio υ0.2Invariant stress ratio Kc0.6667
Ultimate compressive stress26.8Damping ratio ξ0.1
Table 5. The working condition of the input seismic waves.
Working ConditionSeismic WavePeak AccelerationsWorking ConditionSeismic WavePeak Accelerations
B1Songpan wave0.2 gB4Taft Wave0.2 g
B2Xi’an artificial wave0.2 gB5Taft Wave0.4 g
B3Taft Wave0.1 gB6Taft Wave0.6 g
Table 6. The maximum plastic strain of longitudinal reinforcement remaining in the induced joint under different working conditions.
Working ConditionsMaximum Plastic Strain (με)
PE1PE2PE3PE4
B1445057804116
B25226153610304068
B40000
Disclaimer/Publisher’s Note: The statements, opinions and data contained in all publications are solely those of the individual author(s) and contributor(s) and not of MDPI and/or the editor(s). MDPI and/or the editor(s) disclaim responsibility for any injury to people or property resulting from any ideas, methods, instructions or products referred to in the content.

