Article

Hygrothermal Properties Analysis of Bamboo Building Envelope with Different Insulation Systems in Five Climate Zones

1
Research Institute of Wood Industry, Institute of Ecological Conservation and Restoration, Chinese Academy of Forestry, Key Laboratory of Wood Science and Technology, National Forestry and Grassland Administration, Beijing 100091, China
2
Department of Bio-Materials, International Centre for Bamboo and Rattan, Key Laboratory of Bamboo and Rattan Science & Technology, National Forestry and Grassland Administration, Beijing 100102, China
*
Author to whom correspondence should be addressed.
Buildings 2023, 13(5), 1214; https://doi.org/10.3390/buildings13051214
Submission received: 17 March 2023 / Revised: 24 April 2023 / Accepted: 25 April 2023 / Published: 4 May 2023

Abstract

:
Laminated bamboo lumber (BLL) and bamboo scrimber (BS) are potential environmentally friendly building materials, considering that they are hygroscopic materials and that their hygrothermal performance is closely related to the occupants’ comfort, their building durability, and building energy consumption. This study carried out material property tests on bamboo-based materials (BLL and BS) and analyzed hygrothermal performance simulations on bamboo exterior wall constructions in five major climatic zones using WUFI. Results show that BS had a greater heat storage capacity than BLL. However, BLL showed a relatively higher moisture sorption capacity, and BLL was more easily permeated by vapor than BS. The water content (WC) of 12 walls of BLL and BS was below 20%. BLL and BS met the requirements of the envelope, and the WC of BS was lower than that of BLL. Based on the results, the walls designed in this study are suitable for the corresponding climate zones. In the cold and severe climate zones especially, the external insulation system walls performed better than the internal insulation system. The external insulation system was recommended for these two climate zones. The design and simulation results of walls made of two types of bamboo-based materials provide a scientific basis for the application of the material.

1. Introduction

The hygrothermal properties of building envelope materials are closely related to building energy consumption [1,2], material durability [3], and occupants’ comfort [4,5,6]. Specifically, the wet process of the envelope can raise the building’s thermal load. The transfer of water vapor may result in condensation inside the walls, freeze–thaw erosion, and mold growth. These factors will lead to the failure of insulation materials, the loss of structural strength, and poor indoor environmental quality.
In recent decades, scholars have performed systematic research on the envelope structure. The researchers have focused primarily on the temperature and humidity distribution state of the material interface [7]. On this basis, the coupling transfer mechanism of heat and moisture, and the air, was investigated [8,9,10]. The scientific problem has evolved from the basic presentation of monitoring data to the development of complicated numeric theoretical models. Various hygrothermal simulation programs emerged alongside the maturation of theoretical frameworks [11,12,13]. Hygrothermal simulation programs were frequently combined with a stochastic approach [14,15] or machine learning [16,17,18,19] to simulate and predict the envelope’s long-term condition and function. The hygrothermal simulation software, especially Wärme Und Feuchte Instationär (WUFI), was used to evaluate the suitability and hygrothermal properties of new materials. Its validity has been proven and it is widely used for many materials [20]. WUFI simulation was developed by Fraunhofer Institute in Building Physics (IBP) to simulate hygrothermal behavior. WUFI® series software mainly includes WUFI® Pro, WUFI® 2D, and WUFI® Plus. WUFI® Pro performs one-dimensional hygrothermal calculations of water content in individual layers to analyze critical conditions in moisture-sensitive materials (e.g., moisture in wood or corrosion) [21,22,23].
Based on hygrothermal simulation software and field measurements, the hygrothermal performances of walls made from materials such as cross-laminated timber (CLT) [24,25,26,27,28], light-weight timber frame [29], and concrete [30] in different climate zones were studied to meet the demands for housing comfort, durability, and energy efficiency. Since weather conditions have a significant impact on the hygrothermal properties of the building, it is essential to design the envelope in light of the local environment. The energy demand associated with increased heating and cooling loads can be reduced by improving the building envelope design [31]. Sumin’s team assessed the performance of CLT walls in different climates in Korea using a combination of simulation tools (WUFI Pro, Energy, and Design Builder) and field measurements. The moisture damage risk and mold growth risk of CLT walls were analyzed, and the study determined that composite walls with external insulation systems should be used in Seoul and that different insulation materials should be used according to the actual situation in different hygrothermal environmental regions [24,25,26]. Lewis et al. found that CLT panels dry rapidly at 70% relative humidity in dry or non-heavy rainfall climates; however, the addition of WRB is required in more humid climates and climates with more rainfall [25]. Marcus et al. reached similar conclusions when they investigated the design and construction of CLT buildings in subtropical and tropical climates in Australia. The location of insulation, the selection of WRBs, and stormwater management measures need to be designed according to the climate [26]. The addition of date palms to concrete greatly delays temperature variations and mitigates relative humidity variations, and reduces cooling energy. This suggests that date palm concrete is appropriate for humid and semi-arid climates [30].
Concrete remains the most used building material worldwide. However, as a resourceful and renewable material, the study of bamboo applications in construction has garnered the attention of scholars. Bamboo has excellent mechanical properties, a fast growth rate, large biomass, and wide dispersion [32]. In China alone, the bamboo forest area reached 7.0197 million hectares in 2021, and the output value of the bamboo industry reached 321,798 billion yuan [33]. Raw bamboo is made into various bamboo engineering materials to meet people’s needs, with BS and BLL performing better on the market [34]. Compared with raw bamboo represented by FB, BLL and BS improve homogeneity and broaden the material properties spectrum [35]. In addition to its high density and bamboo utilization ratio (over 80%), BS has many benefits including processing convenience, good mechanical performance, and great dimensional stability [36,37]. BLL is fabricated from bamboo sheets with a consistent width and thickness, and different final products can be obtained by varying the method of blank formation [38]. It is crucial to consider mechanical, heat transfer, and hygrothermal properties when using bamboo-based materials in construction. In China, the mechanical properties of new bamboo structural systems have been studied, demonstrating that the mechanical properties of bamboo-based materials are comparable to or superior to those of wood and timber elements [39]. In terms of heat transfer from bamboo building elements, a comparison is made between bamboo and lightweight timber framed walls. It has been shown that the thermal resistance of bamboo walls is slightly less than that of wood walls [40]. Scholars also have studied the hygrothermal properties of BLL and BS to assess their suitability as building materials. BLL and BS had better transport properties and heat storage while having worse transport properties and moisture storage compared with related timber products [41]. A dynamic test in Guangzhou, a typical city in the hot-humid climate region of China, showed that the moisture absorption and desorption rate of BS were lower than reference hardwood [42]. When designing bamboo and wood structure frame walls for Shanghai and Beijing, Zhai et al. discovered that the W4 wall with BLL applied to sheathing panels and internal wall panels provided the greatest results [43]. Huang’s team studied the hygrothermal-performance-oriented bamboo building envelope, aiming to give crucial backing for its application under different climatic conditions. However, these studies focus on comparing bamboo with wood for building envelopes in three aspects (material, building component, and enclosed space unit) to demonstrate the feasibility of ‘substitute timber with bamboo’ for hygrothermal performance. Currently, the team has designed bamboo and wood walls suited for hot and humid climates, but findings for other climates are pending [44,45].
The purpose of this study is to evaluate the suitability of BLL and BS in envelope structures and to design internal and external insulation systems for walls. In addition, the study aims to explore the climatic response capabilities of these 12 types of walls in the five major climate zones in China. In this study, the basic physical properties of BLL and BS, including bulk density, porosity, specific heat, and so on, were systematically tested. WUFI® Pro was used to simulate the dynamic moisture and heat transfer processes of 12 different types of walls; 12 walls were designed according to existing standards and the literature. Measurements for condensation and mold growth risk, as well as the water content of each interface, were performed based on the simulation results. This further reveals the influence of its component unit layers on the heat and moisture transfer of the wall. In addition, the results guide regional wall design and evaluate the sustainability and climate responsiveness of bamboo-based materials as building wall components.

2. Methodology

This section analyzes the properties of BLL and BS needed for hygrothermal simulation through laboratory tests. The specimens of BLL and BS were both provided by a bamboo company in China. Phyllostachys edulis is the raw bamboo used to produce BLL and BS. Hygrothermal analysis using the WUFI simulation program and analysis of water content and mold growth risk were performed over a five-year period (43,800 h).

2.1. Laboratory Tests

The physical parameters of the materials used as model monitoring points are divided into three categories: basic parameters, thermal physical parameters, and hygric physical parameters. The material’s ability to store and transfer moisture and heat affects the hygrothermal performance of the envelope. The material’s physical parameters used in different HAM models vary, depending on the model’s application domain and simplifying presumptions [46]. WUFI Pro requires the input of basic parameters such as bulk density and porosity of the material, thermal physical parameters such as specific heat capacity and thermal conductivity, and hygric physical parameters including the water vapor diffusion resistance coefficient [47]. In this study, the relevant physical property parameters of BLL and BS were tested according to the applicable standards. The parameters of the remaining materials were obtained from the WUFI database.

2.1.1. Bulk Density and Porosity

The oven-dry density ρ 0 (kg/m3) was determined according to GBT 15780-1995 [48]. The determination of bulk density was performed by a distilled water replacement method. An amount of 0.425 mm bamboo powder was prepared, 10 mL empty pycnometer was dried and weighed, and then the samples were added to the empty pycnometer, about 1/3 of its volume, dried in the oven at 103 ± 2 °C for 8 h, weighed again; after this, the oven-dry powder weight   M d (kg) was obtained, then distilled water was added to the pycnometer, completely immersed in the samples, and heated by water bath at 80 °C for 4–8 h to exclude the air bubbles in the samples. After the sample was utterly settled and no more bubbles were generated, it was cooled and before distilled water was added to a 10 mL scale before it was weighed M 1 (kg) again. The pycnometer was emptied and dried, distilled water was filled to a 10 mL scale and the sample was weighed M 2 (kg).
The bulk density ρ w (kg/m3) is calculated by Equation (1):
ρ w = M d ρ M d + M 2 M 1
where ρ w is the bulk density (kg/m3),   M d is the oven-dry powder mass (kg), M 1 is the mass of primary treatment (kg), M 2 is the mass of secondary treatment (kg), and ρ is the density of water (kg/m3).
The porosity is calculated by Equation (2):
η = 1 ρ 0 ρ w
where η is the porosity.

2.1.2. Thermal Conductivity

The thermal conductivity test was performed using the guarded hot plate method (EN12664) [49]. The specimen of 300 mm × 300 mm × 8 mm was dried to a constant mass, the specimen was placed between the heating unit and the cooling unit, and thermocouples were arranged at the surface between the heating and the cooling unit and the specimen. Fluctuations or changes in the temperatures of the heating unit surface during the test period did not exceed 0.3% of the temperature difference between the heating and cooling units, and the heat flow change was controlled to within 2%. The thermal conductivity λ (W/(m∙K)) was calculated by Equation (3):
λ = ϕ d A T 1 T 2
where d is the average specimen thickness (m), A is the metering area (m2), ϕ is the average power supplied to the metering section of the heating unit (W), T1 is the average specimen hot side temperature (K), and T2 is the average specimen cold side temperature (K).

2.1.3. Specific Heat Capacity

The specific heat capacity of the specimen was determined using the JPB-2 specific heat apparatus and the mixing method. Bamboo powder with a particle size of 0.425 mm and a higher temperature was weighed and added to water with a known mass and lower temperature. The mixture was then allowed to reach a state of thermal equilibrium and tested. During this process, the heat absorbed by the water and the container indirectly reflected the heat released by the specimen. Relevant calculations were performed to obtain the specific heat capacity of the specimen.

2.1.4. Water Vapor Resistance Factor

The water vapor transmission test referred to the standard ISO 12572: 2016 (E) [50] and ASTM E96/E96M-16 [51]. The wet and dry cup methods were used to control the relative humidity of the air on both sides of the samples. First, the 100 mm × 100 mm × 8 mm samples were dried to an oven-dry state and encapsulated in a closed container with a saturated salt solution inside to regulate the relative humidity inside the container. Then, the encapsulated samples and the container were placed inside another larger container, and the same saturated salt solution was used to regulate the relative humidity inside the container. The test pieces and their sealed containers were weighed at regular intervals, and the experiment was stopped when the total weight change was linear and weighed more than seven times in a row.
The water vapor resistance factor was calculated according to Equations (4)–(6):
μ = δ a δ
where μ is the water vapor resistance factor, δ is the water vapor permeability (kg/(m·s·Pa)), δ a is the water vapor permeability of air with respect to partial vapor pressure.
δ = G d A Δ P a
where G   is the slope of the regression line between mass and time, excluding the earlier, non-linear stage of the test, d is the thickness (m), A is the area of samples (m2), and P a is the water vapor pressure difference across samples (Pa).
δ a = 0.083 P 0 R v T P T 273.15 1.81
where, p 0   is the standard barometric pressure = 1013 (hPa), p   is the average barometric pressure (hPa), T   is the thermodynamic temperature (K), and R v is the gas constant for water vapor = 462 (Nm/(kg·K)).

2.1.5. Isothermal Sorption Curve

The testing procedures for measuring equilibrium moisture content are based on ISO 12571:2000 (E) [52] and ASTM C1498-04a [53]. The test specimens were placed in an oven and dried to an oven-dry state at a temperature of 103 ± 2 °C, and their weights were measured and recorded. The drying containers were then set up with a saturated salt solution to create different relative humidity environments. The relationship between relative humidity and the corresponding saturated salt solution is shown in Table 1. The prepared specimens were placed in the drying containers with the lowest relative humidity until they reached equilibrium, and their weights were measured and recorded. The determination of equilibrium was based on the criterion that the weight of the specimens was measured every 24 h, and when the rate of weight change was less than one-thousandth over three consecutive measurements, the specimens were considered to have reached equilibrium. The specimens were then placed in drying containers with increasing relative humidity, and the weight of the specimens was recorded at each equilibrium state.
The mass ratio moisture content was calculated from Equation (7):
u = m w m d m d
where u is the mass ratio moisture content (%); m w is the weight of the specimen under different relative humidity (kg); and m d is the weight of the oven-dry specimens (kg).

2.2. Hygrothermal Simulation

This study used WUFI Pro 5.3 to analyze the hygrothermal performance of the exterior wall. Considering the typical climate effects such as wind-driven rain, solar radiation, capillary transmission, and so on, the WUFI Pro fully realizes the theoretical calculation of the non-stationary hygrothermal performance of building components under real climate conditions [54]. Other programs and traditional methods, such as the Glaser Method, do not consider these effects and are thus limited to only evaluating winter condensation effects. However, the WUFI Pro model has limitations in accurately simulating the thermal performance of the exterior wall. Specifically, the model treats the exterior wall as a continuous layer and does not account for heat losses through joints [21,55]. Moreover, during the simulation process, the ideal state is assumed. However, due to the variability of materials and construction quality, there may be differences between actual application and simulation. Nonetheless, this software can evaluate the hygrothermal performance of exterior wall structures composed of two new types of materials, predicting and assessing their applicability.

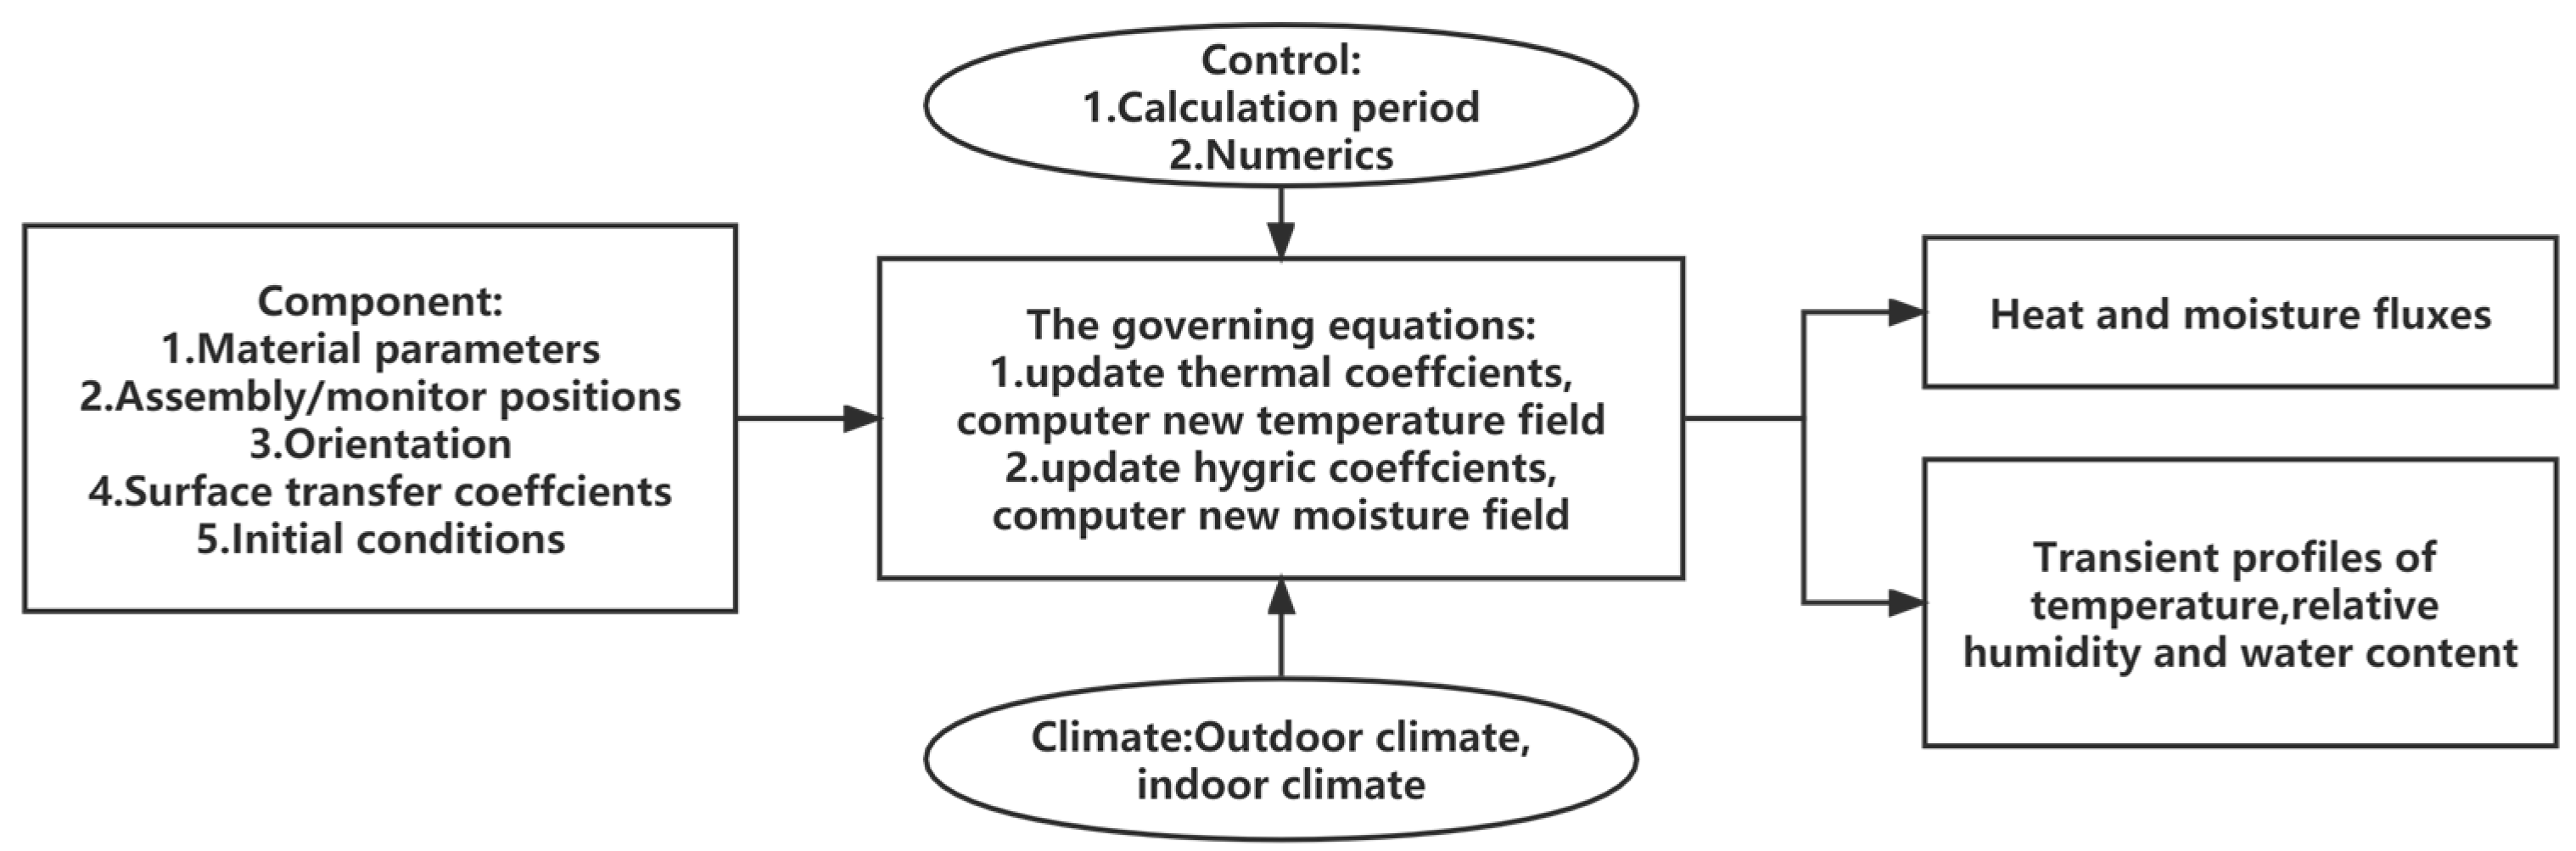
2.2.1. WUFI Hygrothermal Theory Model Overview

The calculation process of simulation is demonstrated in Figure 1. The necessary input data include detailed information about the examined building components, such as the assembly of the wall layer and orientation. It is also important to provide accurate initial conditions, material parameters, and climatic conditions to ensure the simulation accurately reflects real conditions. These input data are crucial for generating reliable results and making informed decisions related to building design and energy efficiency.
The governing equations for heat and moisture transport are given in Equations (8) and (9), respectively [56]:
H ϑ ϑ t = x λ ϑ x + h v x δ a μ p x
ρ w u ϕ ϕ t = x ρ w D w u ϕ ϕ x + x δ a μ p x
where H is the enthalpy of moist building material (J/m3); ϑ and ϕ are the temperature (°C) and RH (−); λ refers to the thermal conductivity of materials (W/(m·K)); h v is the evaporation enthalpy of water (J/kg); μ is the water vapor resistance factor (−); p is the water vapor partial pressure (Pa); ρ w is the density of water (kg/m3); u is the water content (m3/m3); and D w is the liquid transport coefficient (m2/s).
The program uses Fick’s law to model the movement of water vapor, Darcy’s law to model liquid transport, and Fourier’s law to model the transfer of heat. The moisture balance includes the gradients in relative humidity and vapor pressure; the heat energy balance includes heat conduction between the building materials and the specific heat of evaporation of the inflowing wet air.
WUFI® utilizes the finite volume technique for spatial discretization of transport equations; this allows for the accurate calculation of heat and moisture fluxes at each point in the domain, which are then used to iteratively solve the governing equations for the next time step [57]. This fully implicit scheme is used for time discretization, which ensures that the transient behavior of the system is accurately captured. The solver computes temperature and relative humidity profiles by iteratively solving the heat and mass balance equations until convergence is achieved.

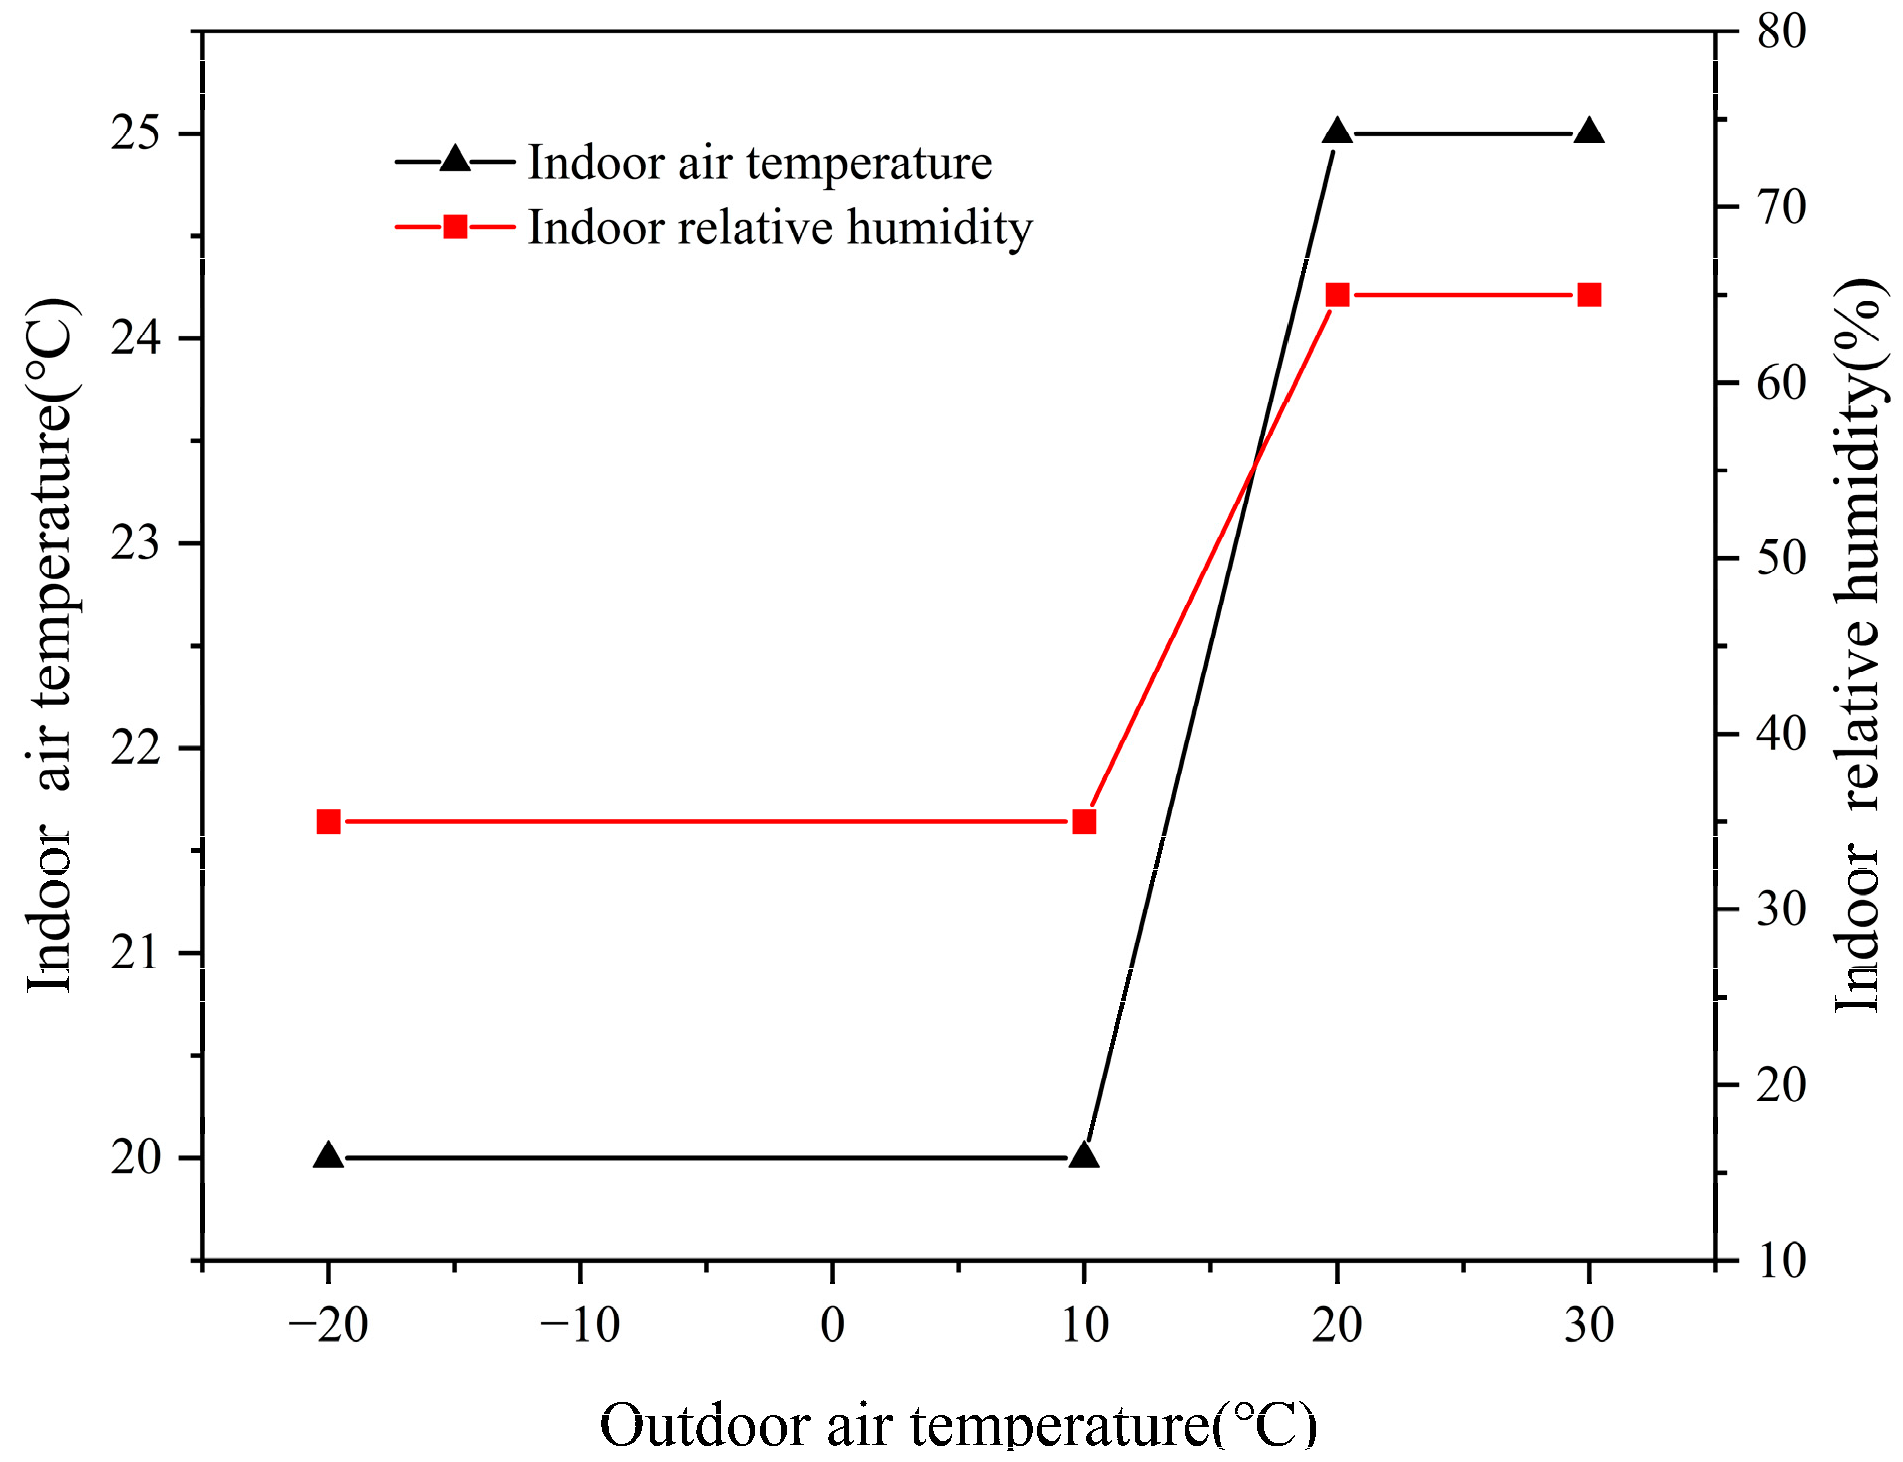
2.2.2. Hygrothermal Simulation Conditions

This study used WUFI Pro 5.3 to analyze hygrothermal performance, which requires settings for wall construction, initial conditions, indoor and outdoor climate, etc. Some of the settings are shown in Table 2.
The initial temperature and humidity state of the exterior building components should be determined by considering the storage conditions of the components and the climatic conditions during construction, as well as the human comfort temperature range specified by ANSI/ASHRAE standard 55-2010 [58]. In this study, the initial temperature was set at 23 °C, and the initial moisture content was set to the moisture content at a relative humidity of 80%. Because bamboo is very sensitive to changes in environmental humidity, a higher humidity value was set in the simulation to ensure accuracy.
The heat transfer coefficients and resistances describe the exchange of heat between a surface and the surroundings. This heat transport is affected by several different transport mechanisms [56]:
  • heat conduction through the air adjacent to the surface;
  • convective transport by air flows;
  • emission of long-wave radiation.
In building physics, the heat transfer coefficient is influenced by various factors such as temperature and the surface characteristics of the wall, as well as depending on the local conditions. However, for simplicity, it is often assumed to be a constant value. WUFI simplifies this coefficient and provides selectable typical values. For this study, the exterior heat transfer coefficient was set at 17 W/m2K and the interior heat transfer coefficient was set at 8 W/m2K. It is important to note that the simplification of the heat transfer coefficient may not accurately capture the true complexities of the system. However, by using typical values provided by WUFI, this simplification can still provide valuable insights and predictions for the building’s thermal performance.
In the simulation process of WUFI Pro, the indoor temperature and humidity conditions were determined by the outdoor air temperature, as shown in Figure 2, according to EN 15026/WTA6-2 [59]. Because the meteorological data of typical cities in the five major climate zones of China were not available in the database, this study selected cities that meet the corresponding conditions in the North American meteorological database according to the Chinese standard GBT50176-2016 [60], and the principles of these city selections and the temperature and relative humidity of these cities are shown in Table 3 and Table 4.
The steps were as follows.
  • The average temperature of the coldest and hottest months in North American cities was calculated.
  • A preliminary selection of North American cities was determined based on the standard’s major indicators for each climate zone.
  • According to the secondary indicators for each climate zone in the standard, the number of days with average daily temperatures within a specific temperature range was counted.
  • Cities in North America that met both indicators were chosen to represent Chinese cities.

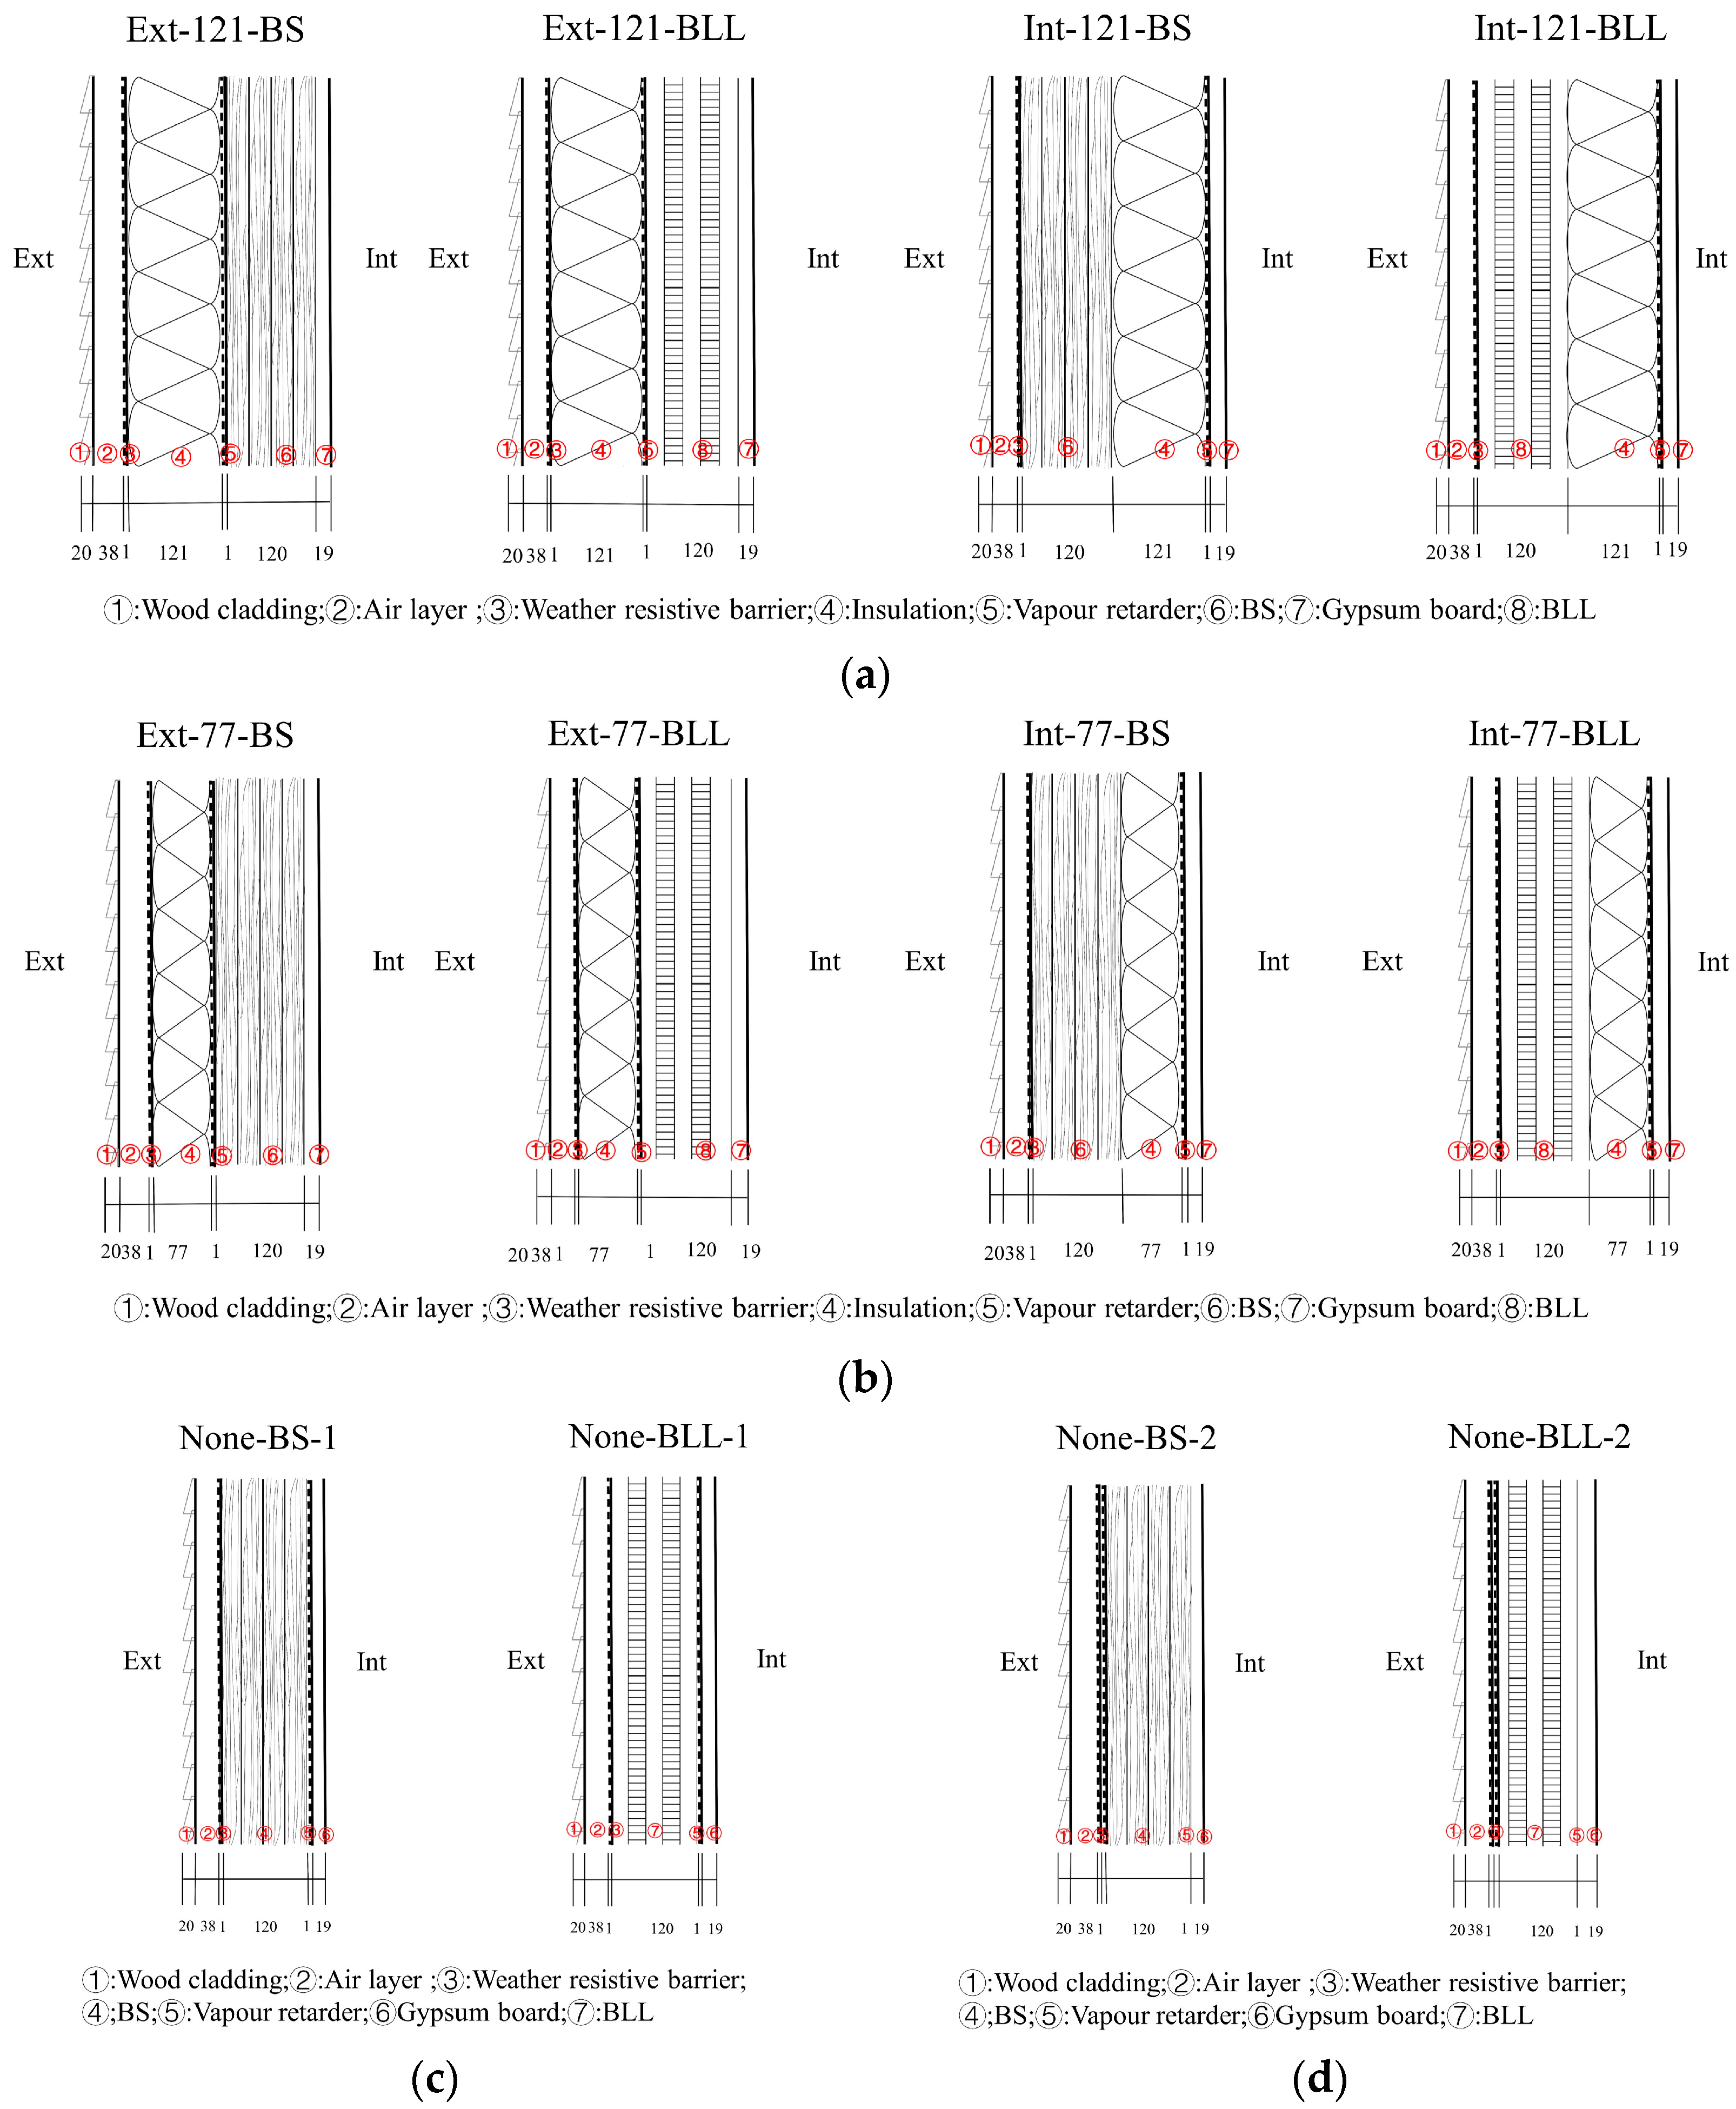
2.2.3. Configuration of the Wall Assembly

Building envelopes are constructed from multi-layered assemblies, where each layer should perform its roles, such as managing the movement of rainwater, air, vapor, and heat. In this study, the following aspects were considered in the wall design.
  • The western red cedar (Thuja Plicata) was used as cladding to resist the erosive effect of rain and snow melt on the wall elements.
  • The air layer was between the cladding and the weather-resistive barrier (WRB). The main contribution of the air layer is to improve the heat transfer performance of the building. In addition, the pressure balance caused by the air passage helps to stop the infiltration of external rainwater [44].
  • The WRB with a high vapor resistance can prevent air convection and moisture ingress in the form of air infiltration. It also can prevent driving rain into the insulation layer and the BLL and BS structure [28].
  • Expanded polystyrene (EPS) was selected as the insulation because it is lightweight, low-cost, and has good thermal resistance [28].
  • Considering the prevention of mold formation on the indoor surface, it was necessary to install a vapor-retarder layer [29].
  • Gypsum board has the advantages of constructability, sound insulation, and fire resistance, making it useful for interior panels in this study [61].
This study aims to propose hygrothermal performance walls suitable for five major climate zones in China. Wall details of BLL and BS frame structures were constructed. Figure 3 shows the configuration of each wall layer.
We designed the wall based on the U-value limits corresponding to the five climate zones in Table 4, and determined the thickness of the insulation based on the characteristics of each climate zone. A thickness of 121 mm is recommended for insulation in severe cold regions, while 77 mm is recommended for insulation in cold regions. No insulation is needed for the remaining three climatic zones. For walls with insulation, the placement of the insulation should also be considered. All walls should be numbered to differentiate them from one another, as shown in Figure 3.
The hygrothermal parameters for each construction of the wall are shown in Table 5 [62]. The data for BLL and BS were obtained from the laboratory tests in Section 2.1, and data for the remaining materials were selected from the WUFI database.

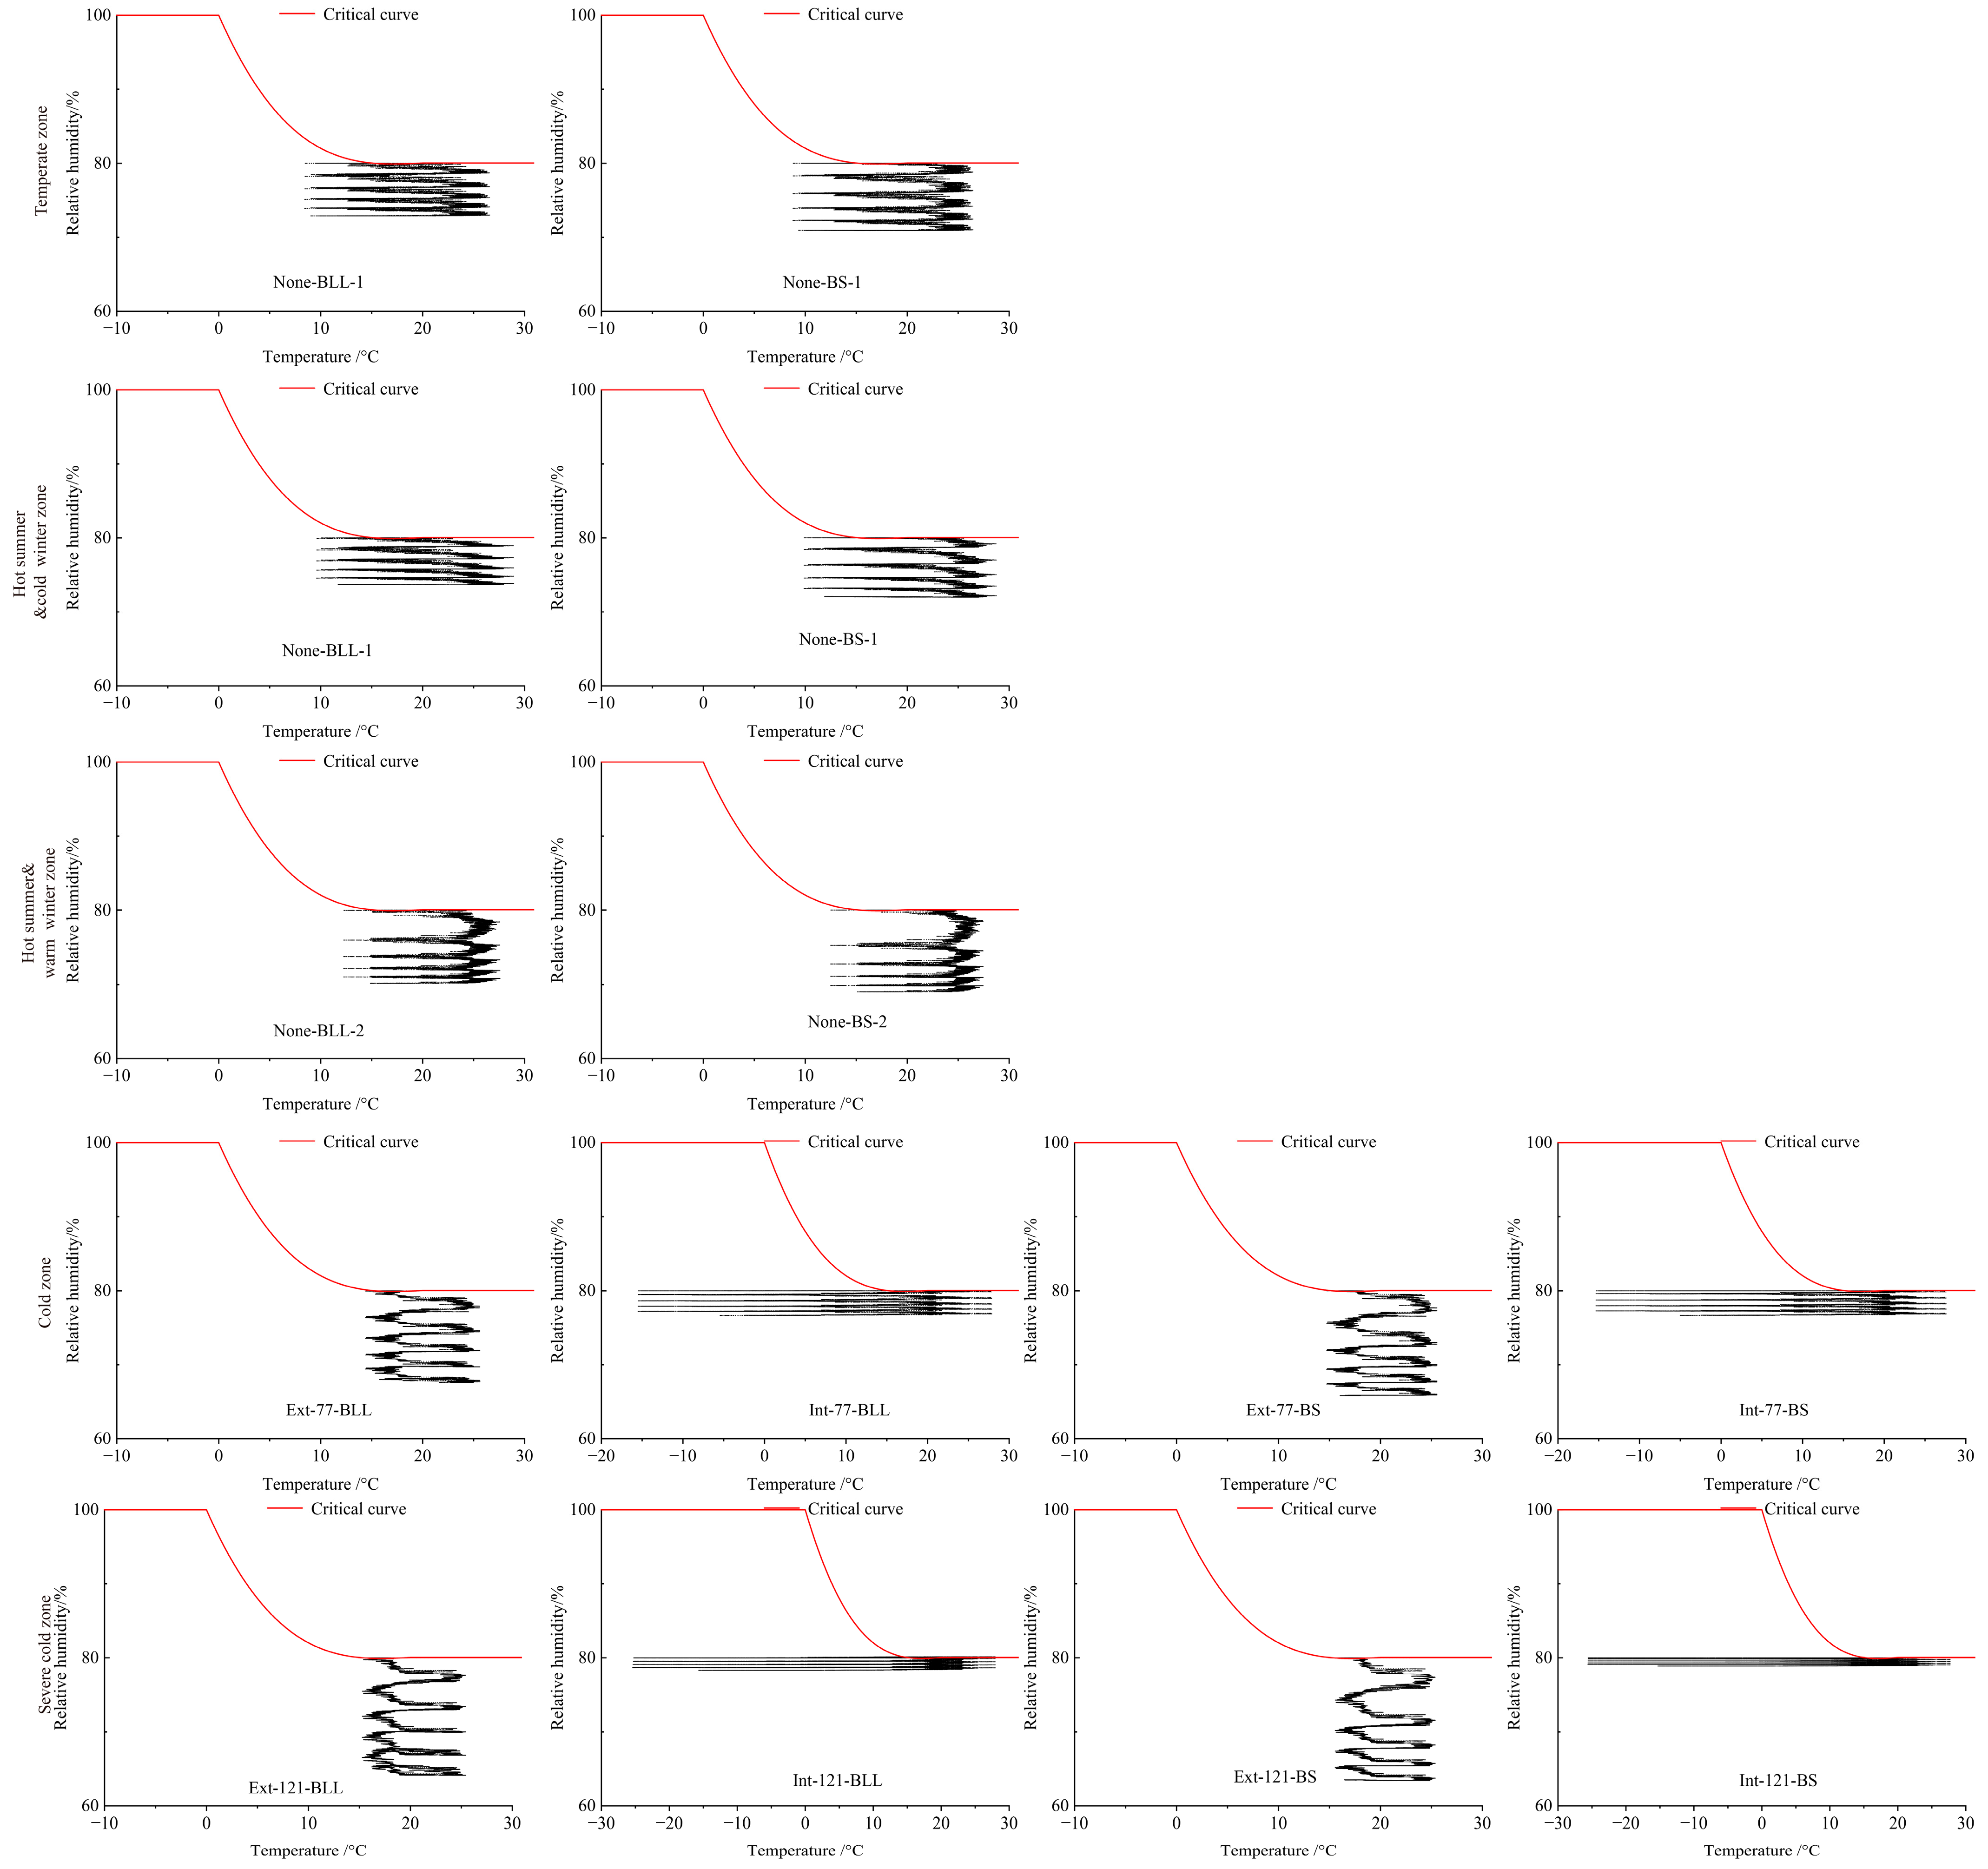
2.2.4. Risk of Mold Growth

Based on temperature and relative humidity, the risk of mold growth was assessed. The Lowest Isopleth for Mold Growth (LIM) curve is a critical curve that indicates the minimum RH at which the mold can germinate at each temperature. Table 6 shows the risk criteria for mold growth based on the LIM curve. In this study, temperature and relative humidity were recorded hourly and compared to the LIM curve to assess mold growth risk. This study calculated the number of points above the LIM curve, i.e., the number of hours with mold risk as a percentage of the total simulation time (43,800 h), which was used to more visually describe the probability of mold risk.

3. Results and Discussion

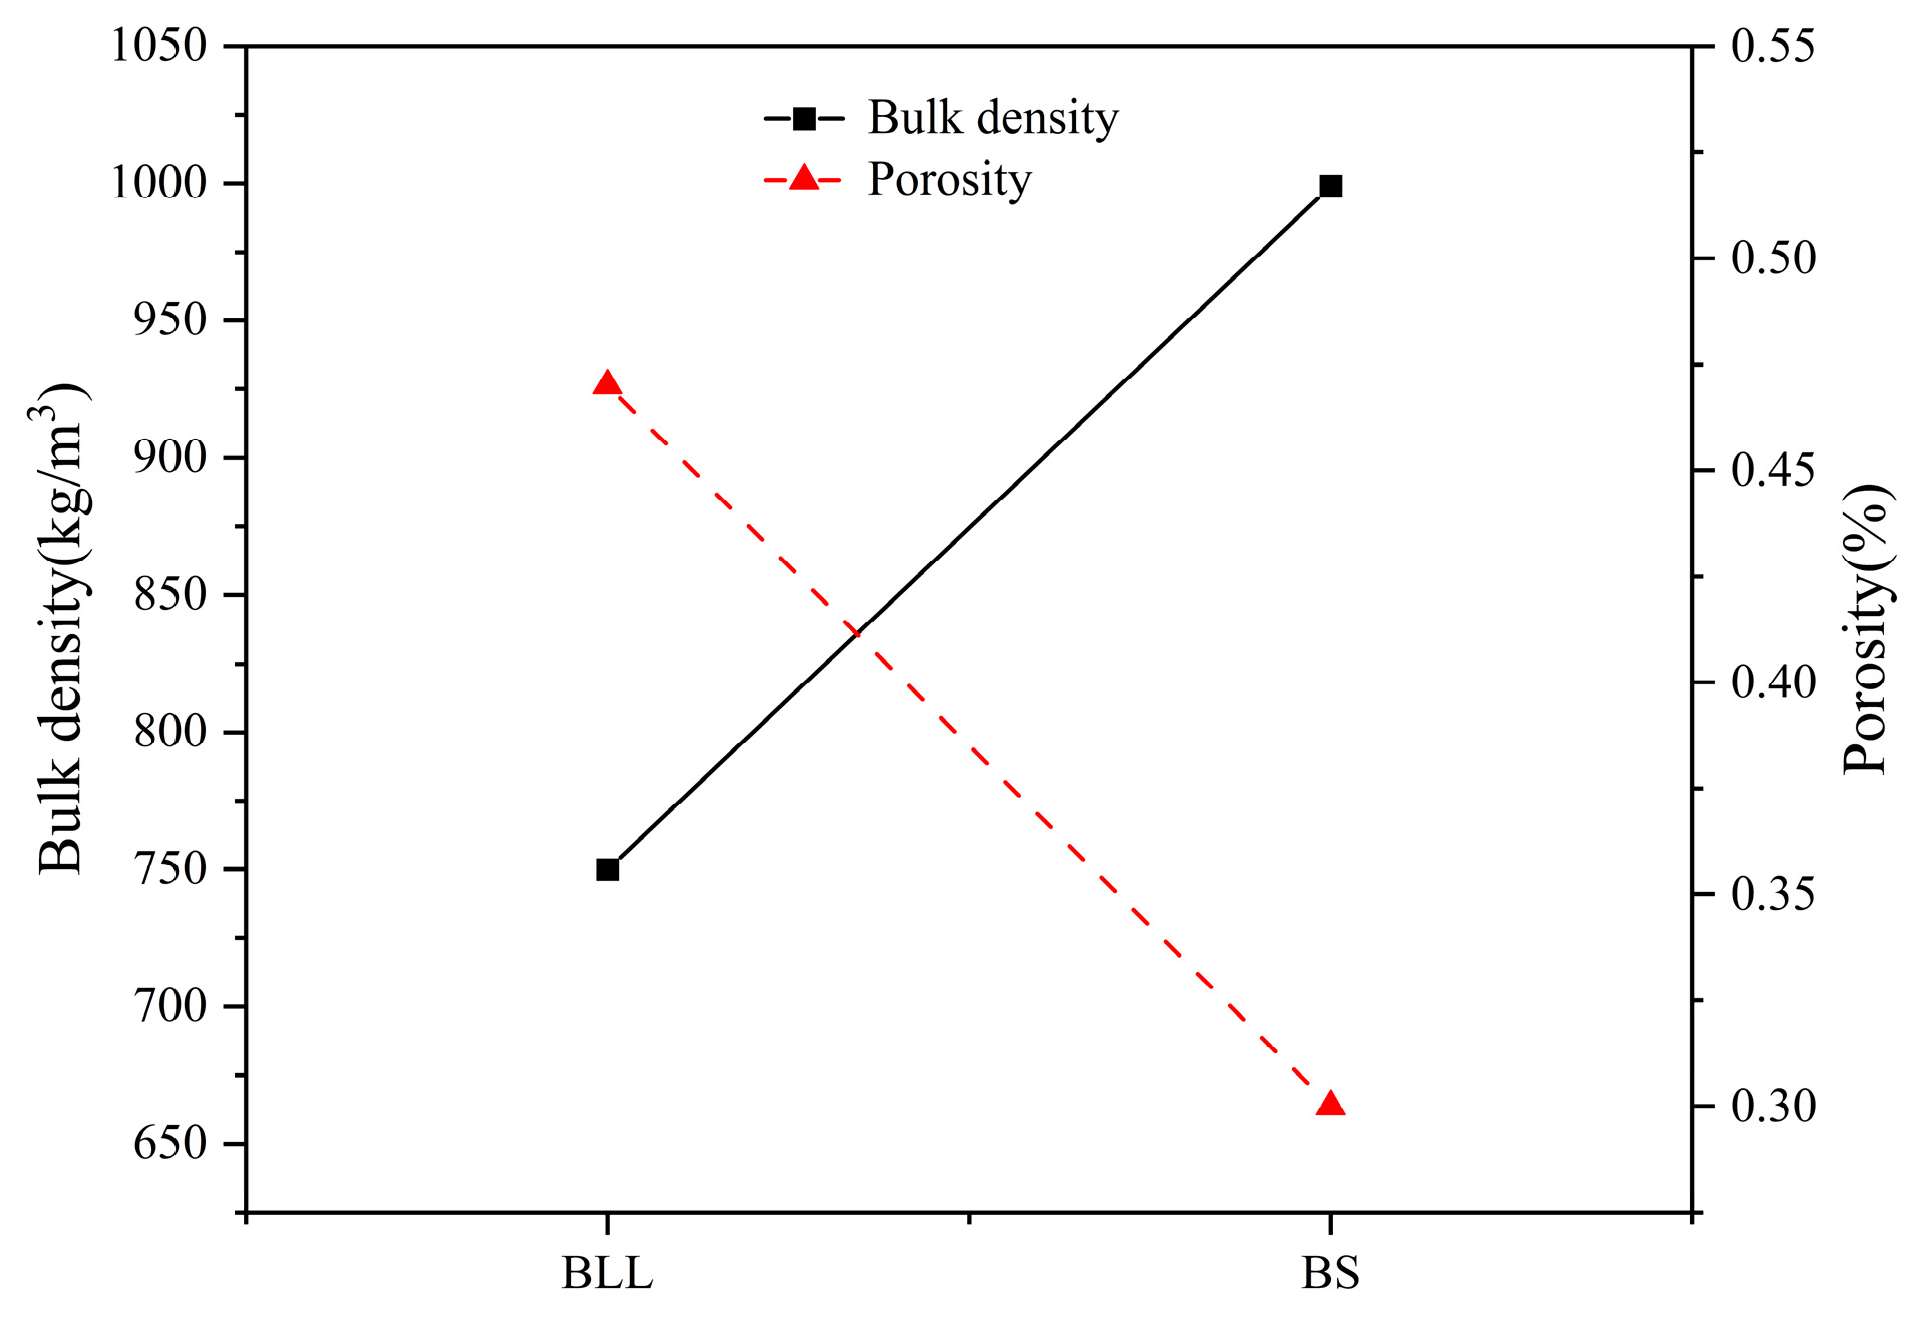
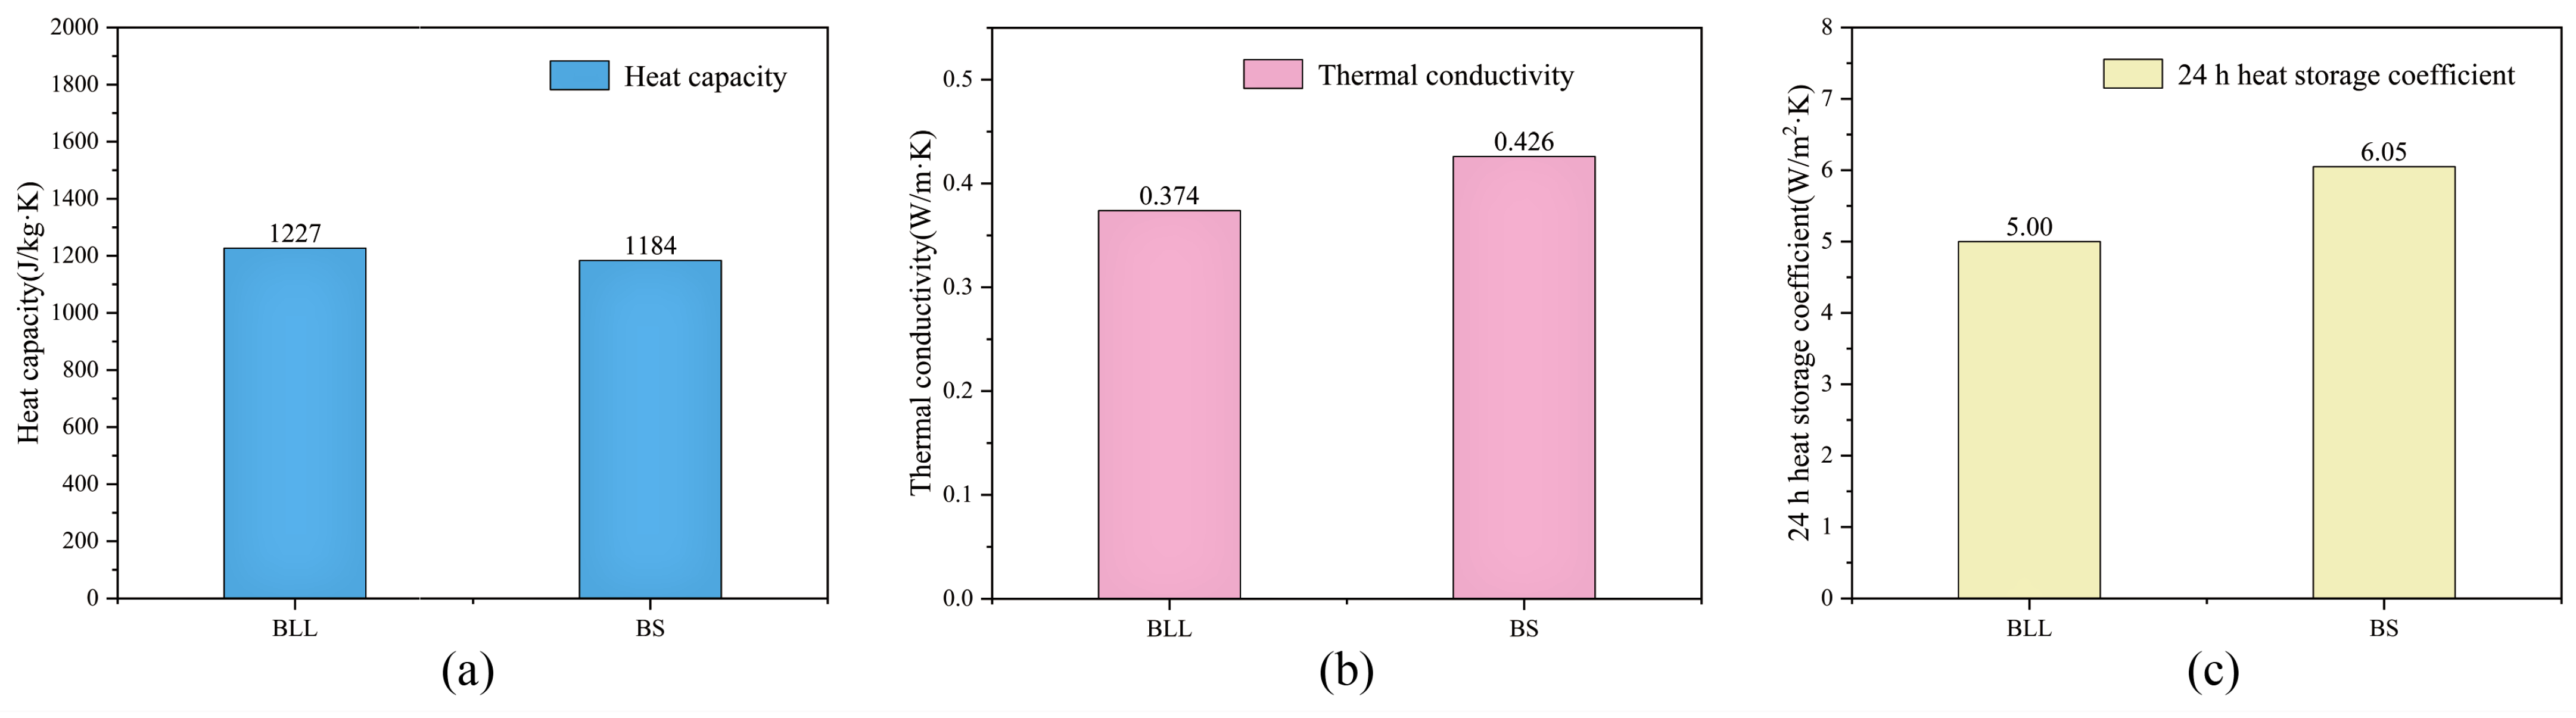
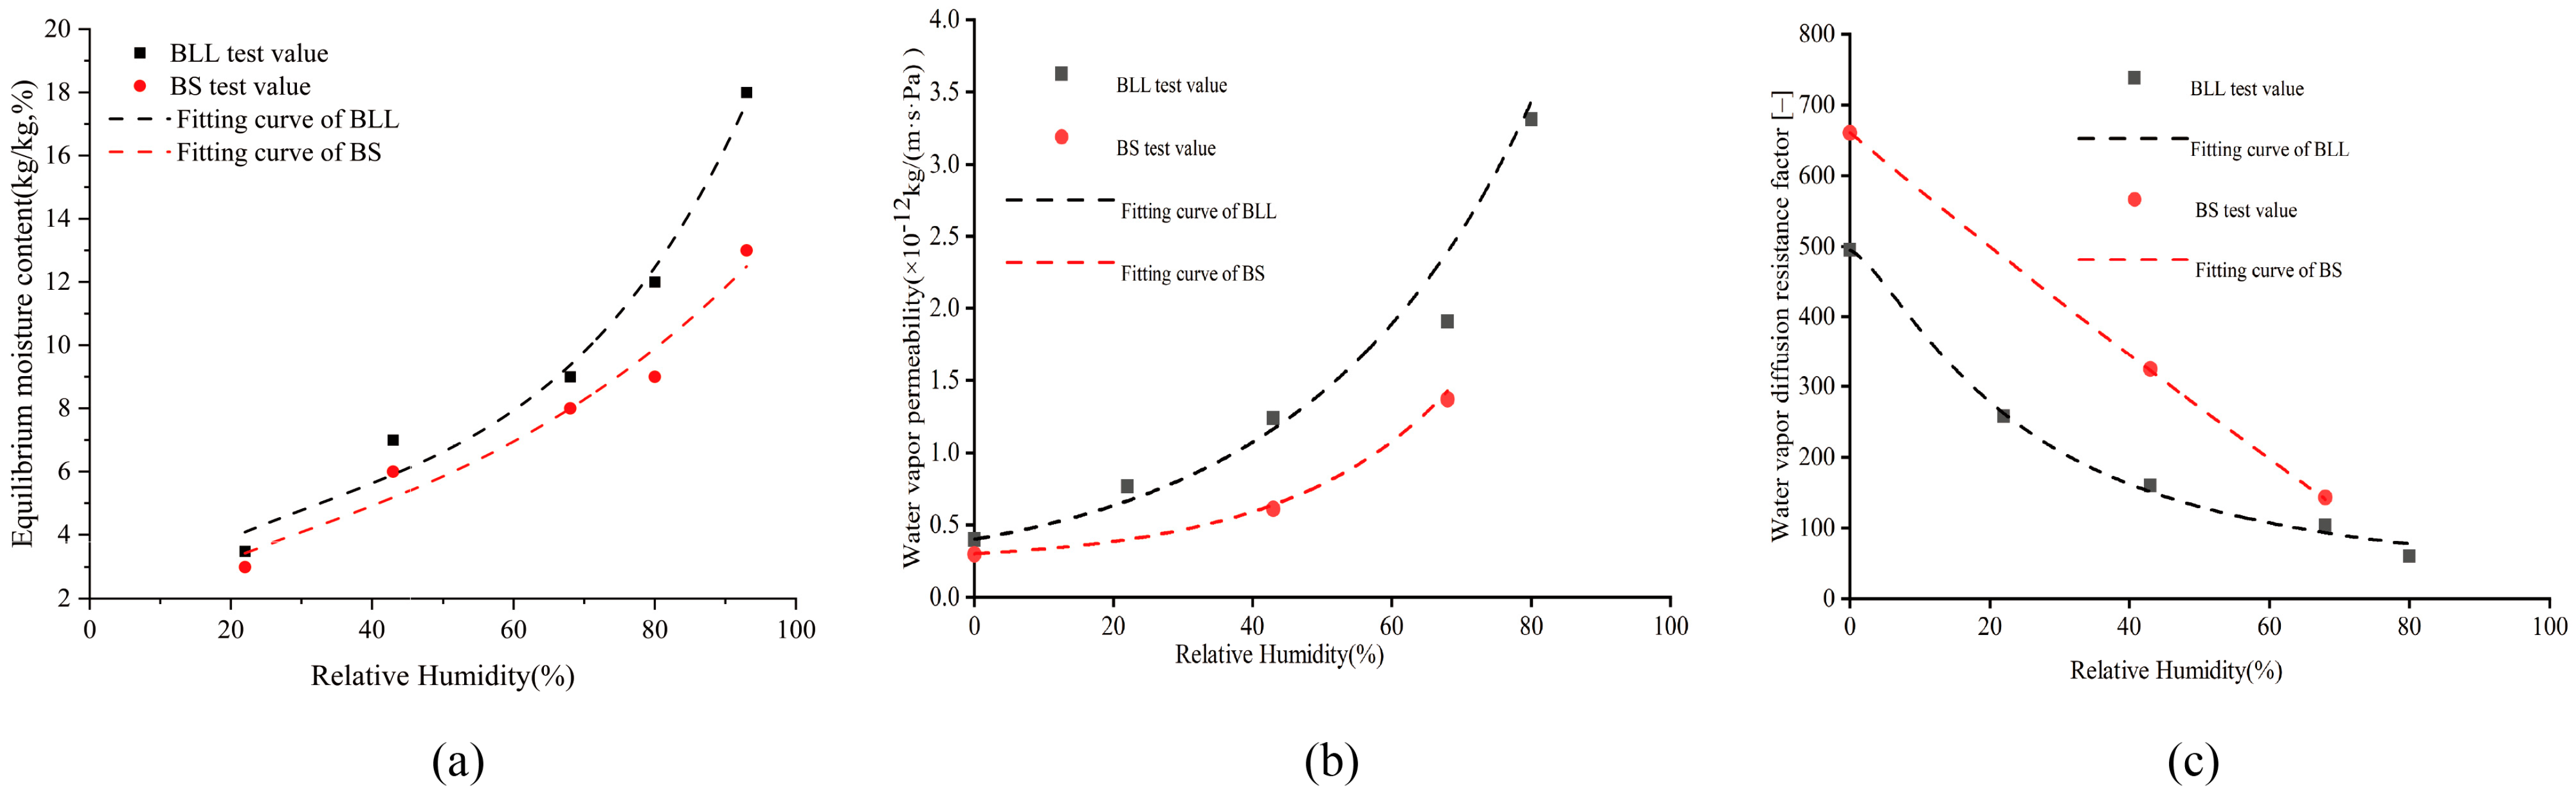
3.1. The Hygrothermal Properties of BLL and BS

As shown in Figure 4, the bulk density of BS is higher than that of BLL, while the porosity is the opposite. This is because the bonding pressure in the production process of BS is higher than that of BLL, resulting in a more compact compression of BS. In general, porosity and bulk density are inversely proportional.
As shown in Figure 5, BS and BLL have similar specific heat capacity, but BS has a higher thermal conductivity than BLL. The 24 h thermal storage coefficient S 24 h [W/m2K], which characterizes the heat storage and heat transfer properties of BLL and BS, is calculated from their specific heat capacity, thermal conductivity, and bulk density. The results indicate that BS has a greater heat storage capacity than BLL.
As shown in Figure 6, the isothermal sorption curve of BLL and BS exhibit similar trends, with BLL showing relatively higher moisture sorption capacity. At the same level of relative humidity, BLL can absorb more water, resulting in a higher equilibrium moisture content. BLL has a higher vapor permeability coefficient and lower water vapor diffusion resistance coefficient under various relative humidity conditions compared to BS, indicating that BLL is more easily permeated by vapor than BS.
The fiber bundles of reconstituted bamboo are arranged neatly, with high regularity and high porosity during the process of forming along the grain. The adhesive can be uniformly adsorbed on the surface of bamboo bundles during the dipping process. After curing, the adhesive forms a uniform film layer on the surface of the bamboo bundle, which can seal more hydrophilic groups, and the cured adhesive has excellent water resistance, its porosity is small, and water molecules are difficult to penetrate. By applying pressure to the fiber bundle, BS becomes denser, and the presence of adhesive also reduces the micropores in BS.

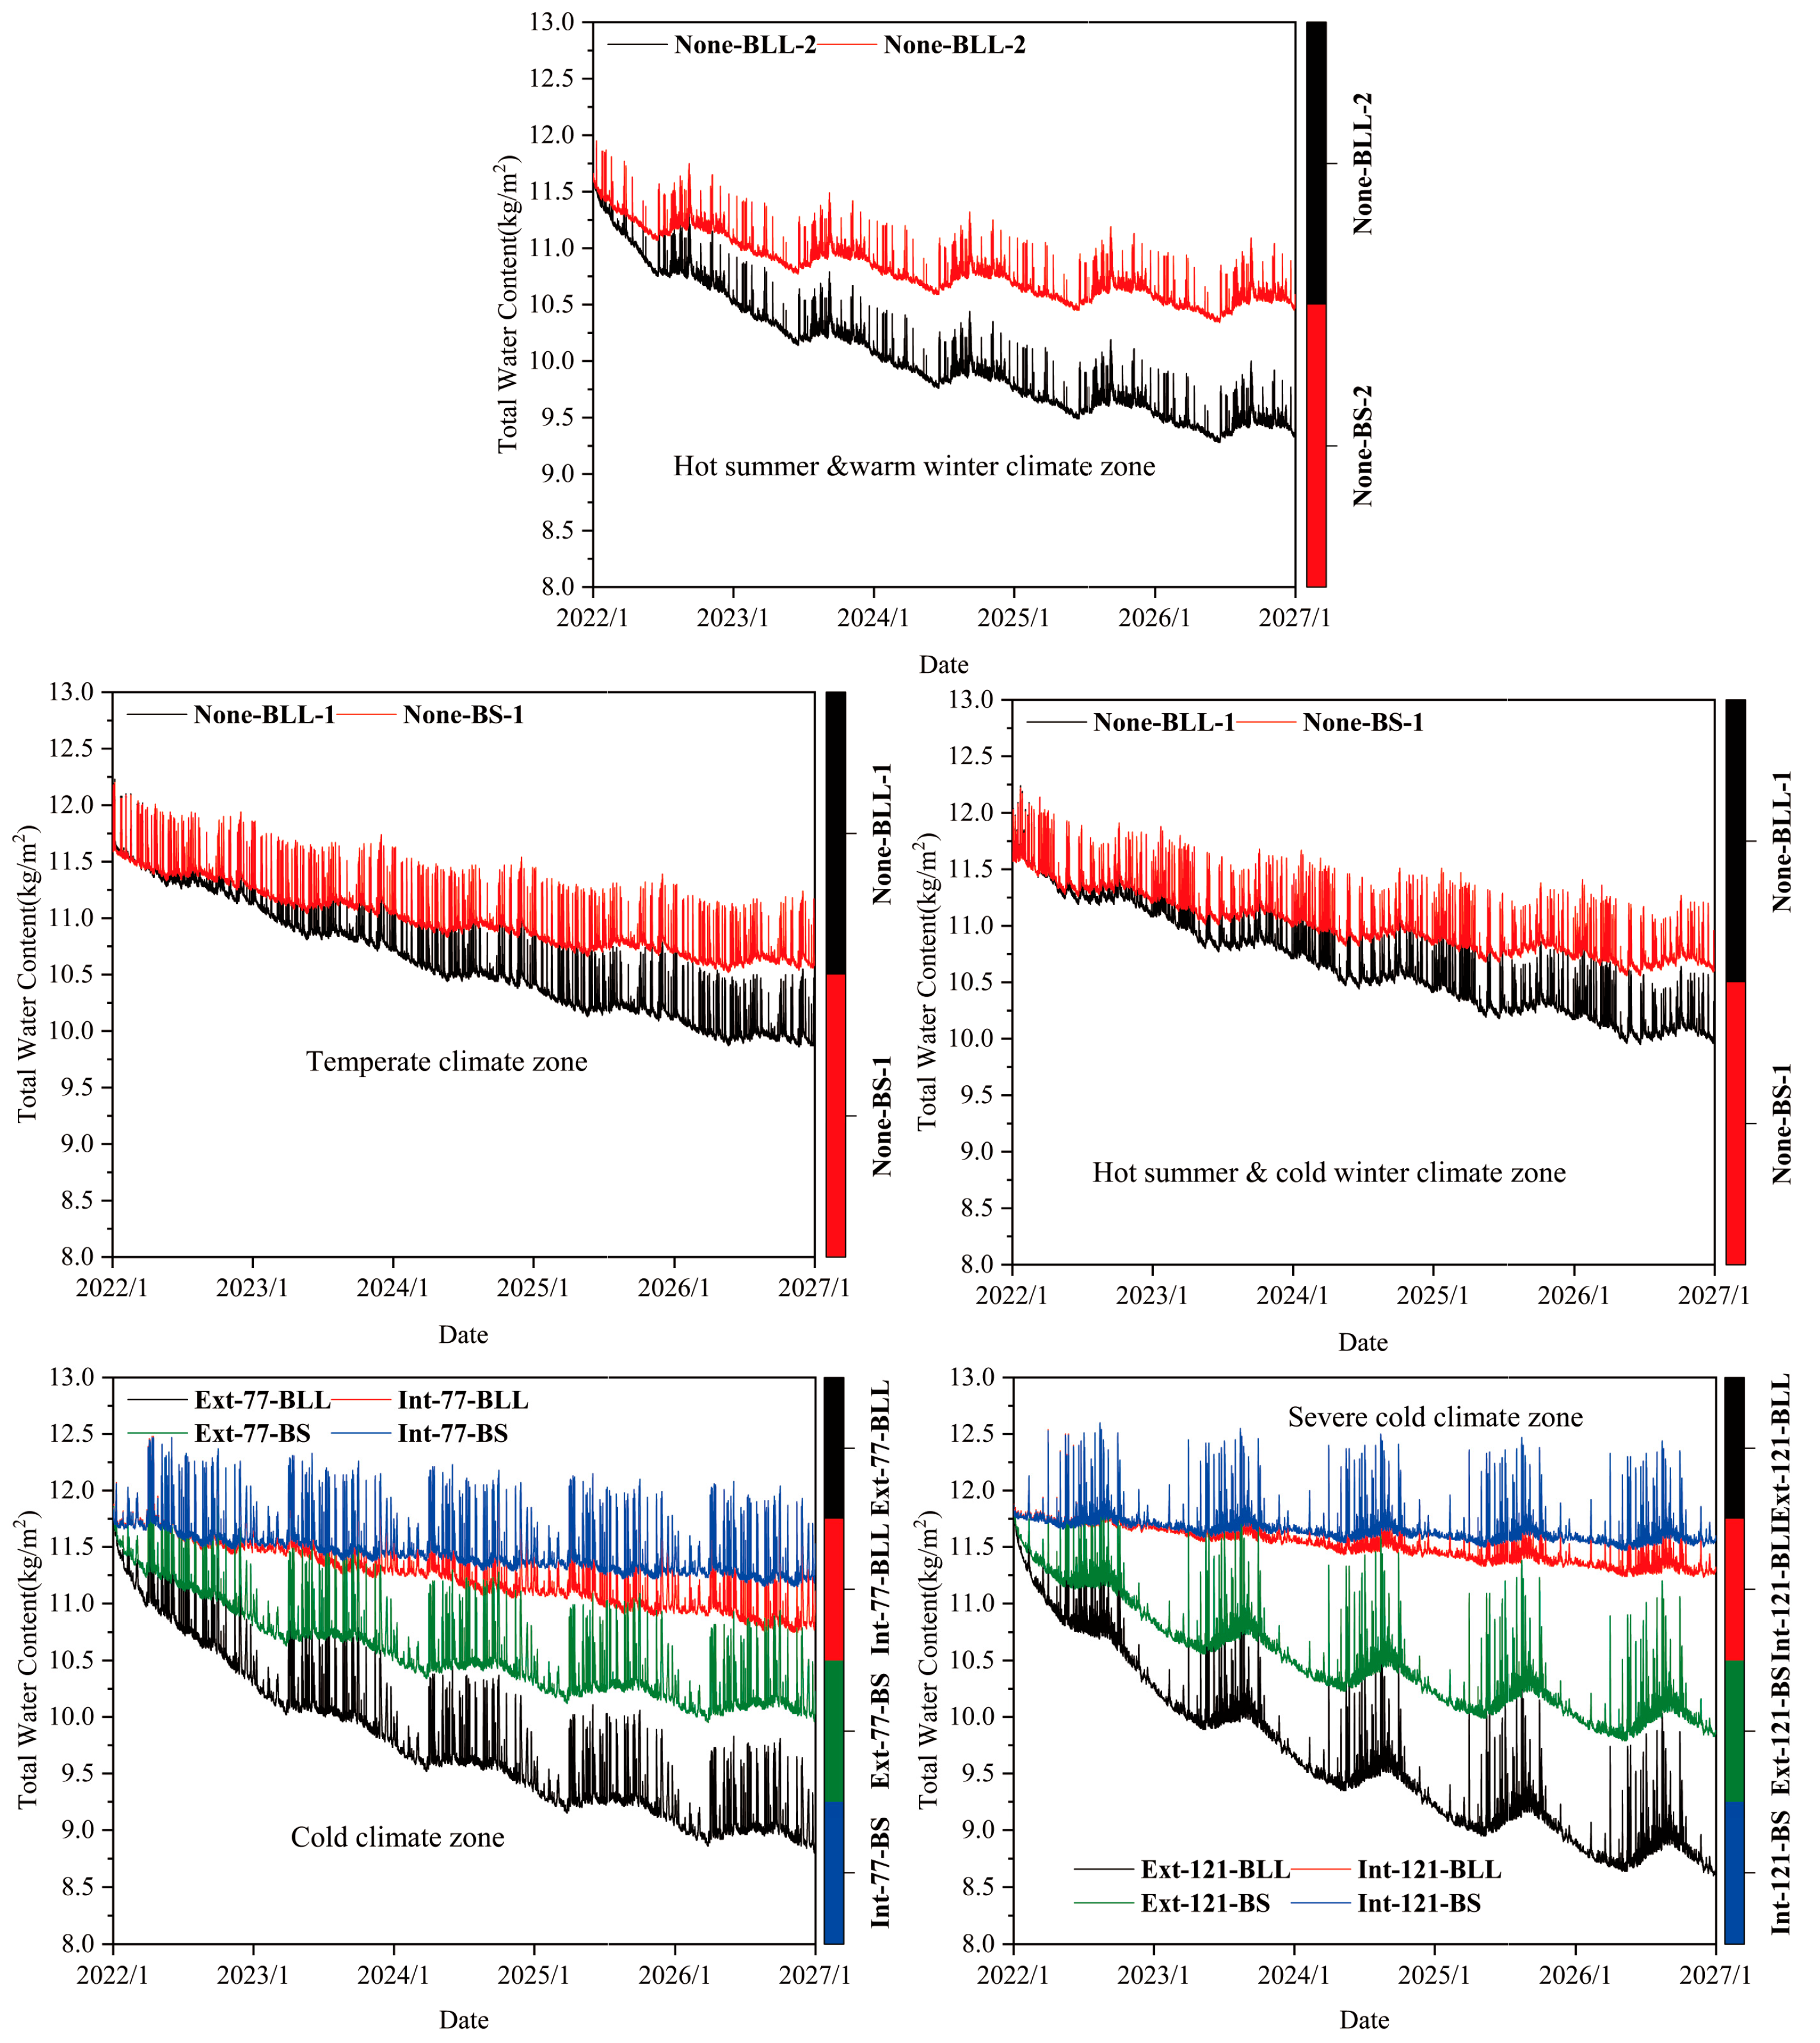
3.2. Total Water Content (TWC) of the Wall System

The ability of a wall system to dry itself under natural conditions is a critical factor in preventing the risk of moisture damage, which can be determined by the TWC analysis of the wall system. TWC is an indicator of long-term moisture stability. When TWC shows a downward trend or tends to stabilize with time, we can consider the drying ability of the wall to be better, that there is no water accumulation inside the wall, and that a dynamic stable state is reached. In contrast, when TWC rises with time, it means that the drying capacity of the wall is poor, moisture may accumulate for a long time, and the wall may have moisture problems in the future, which may lead to the destruction of the wall structure.
In this study, the long-term moisture risk of 12 walls in five climate zones was assessed in WUFI for a five-year time period. The durability and sustainability of walls can be better evaluated by considering the potential for long-term moisture problems in walls rather than only analyzing short-term or period-specific moisture damage risks. Figure 7 shows the TWCs of 12 walls in five climate zones; all walls tended to be stable or show a decreasing trend yearly. This indicates that all walls have a good self-drying ability, avoiding the risk of moisture damage.

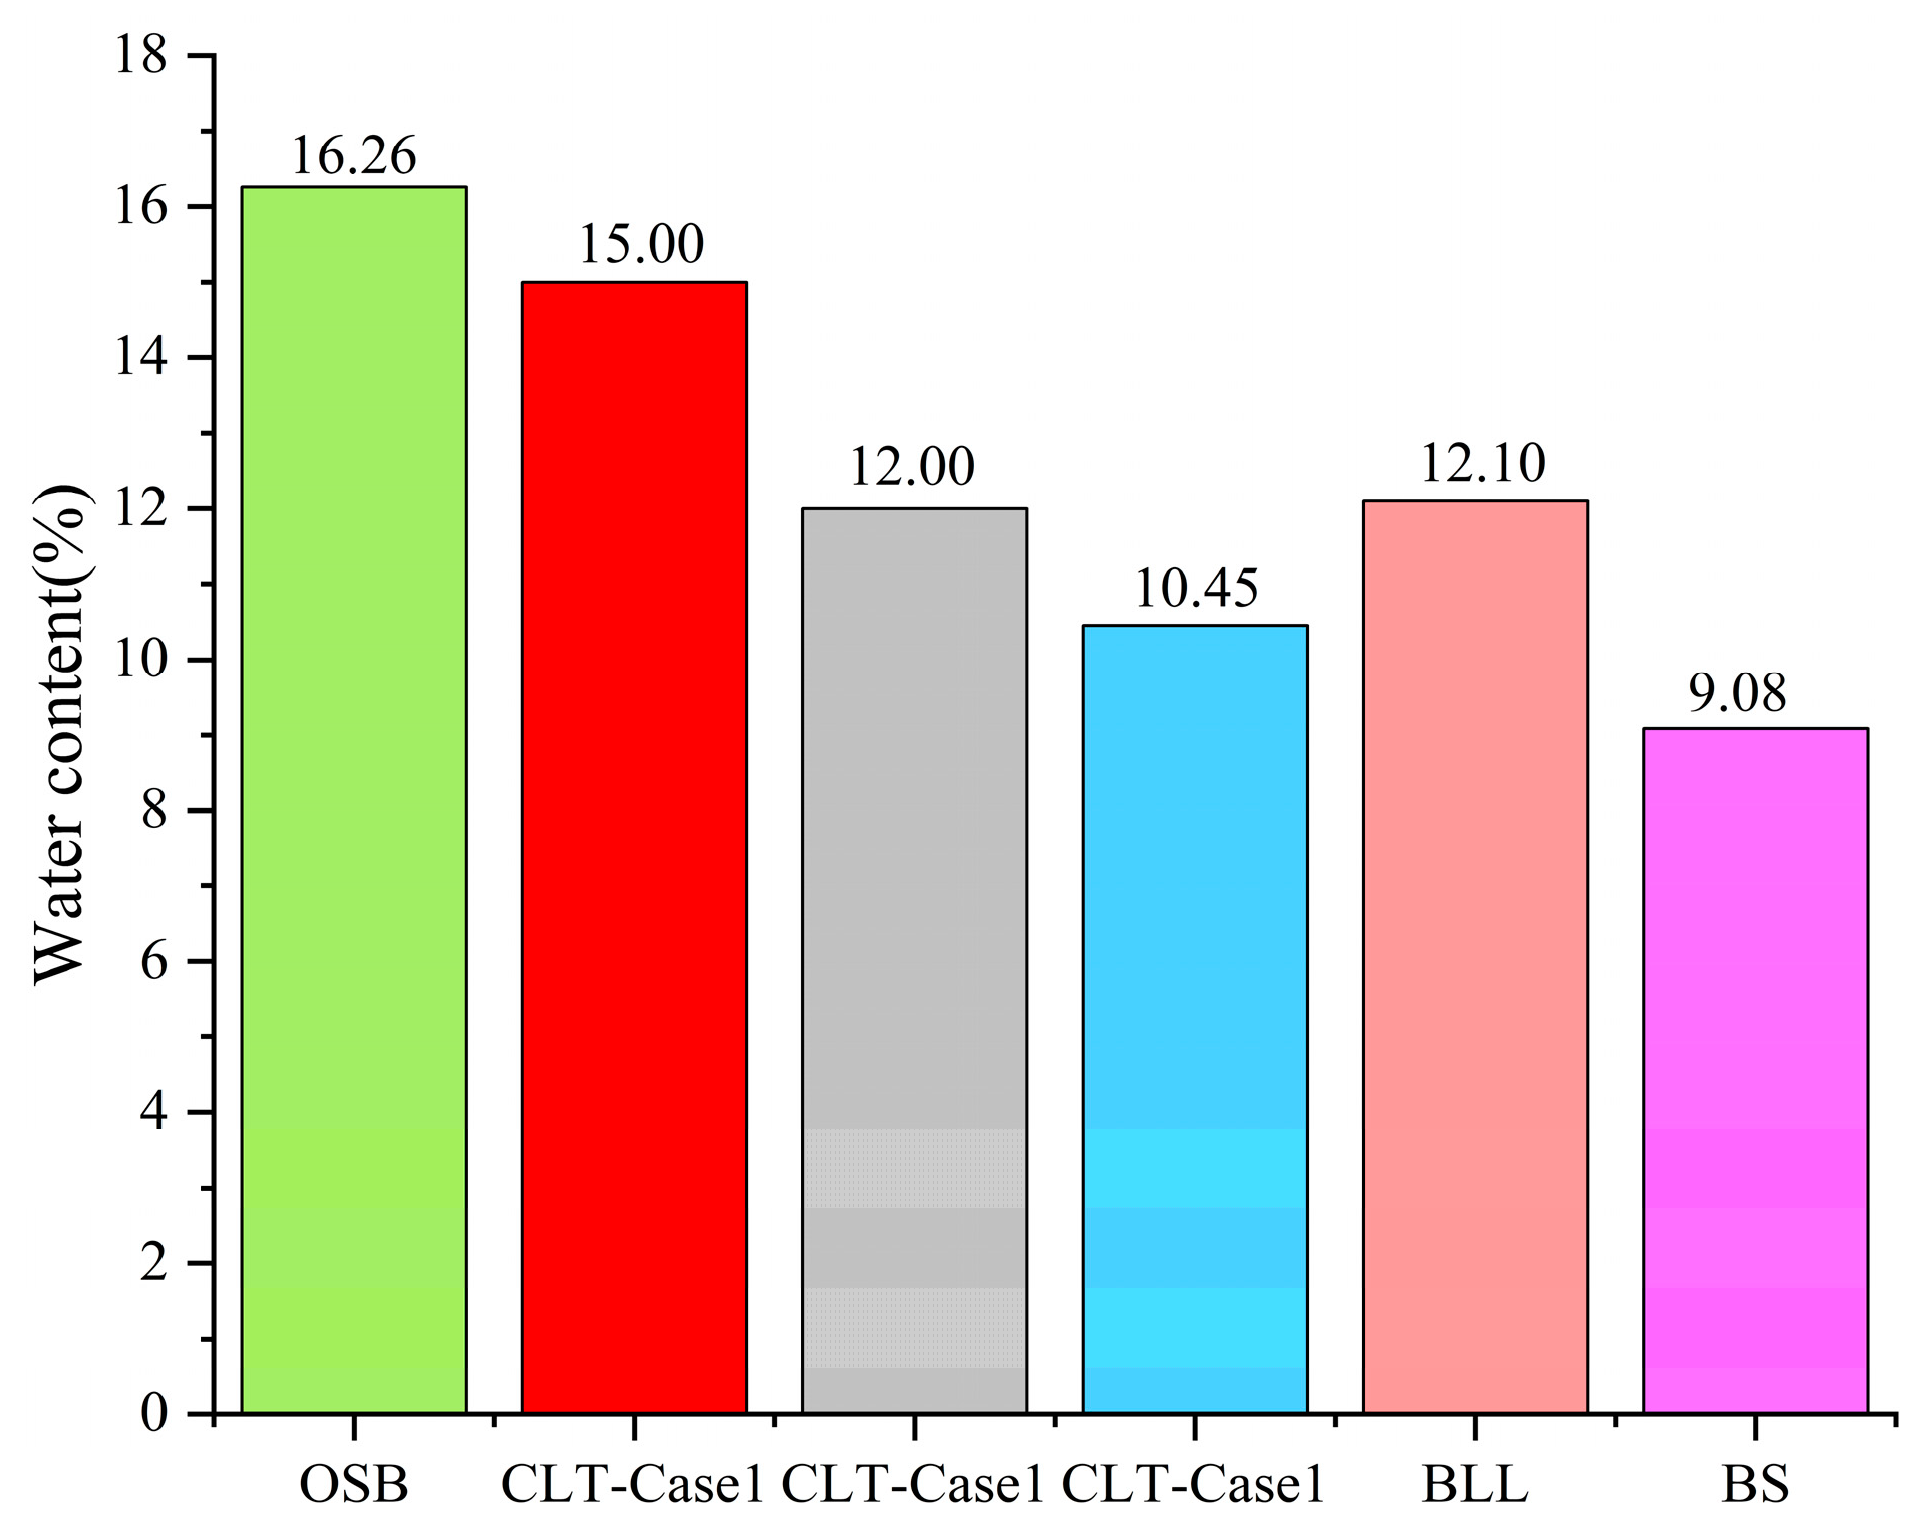
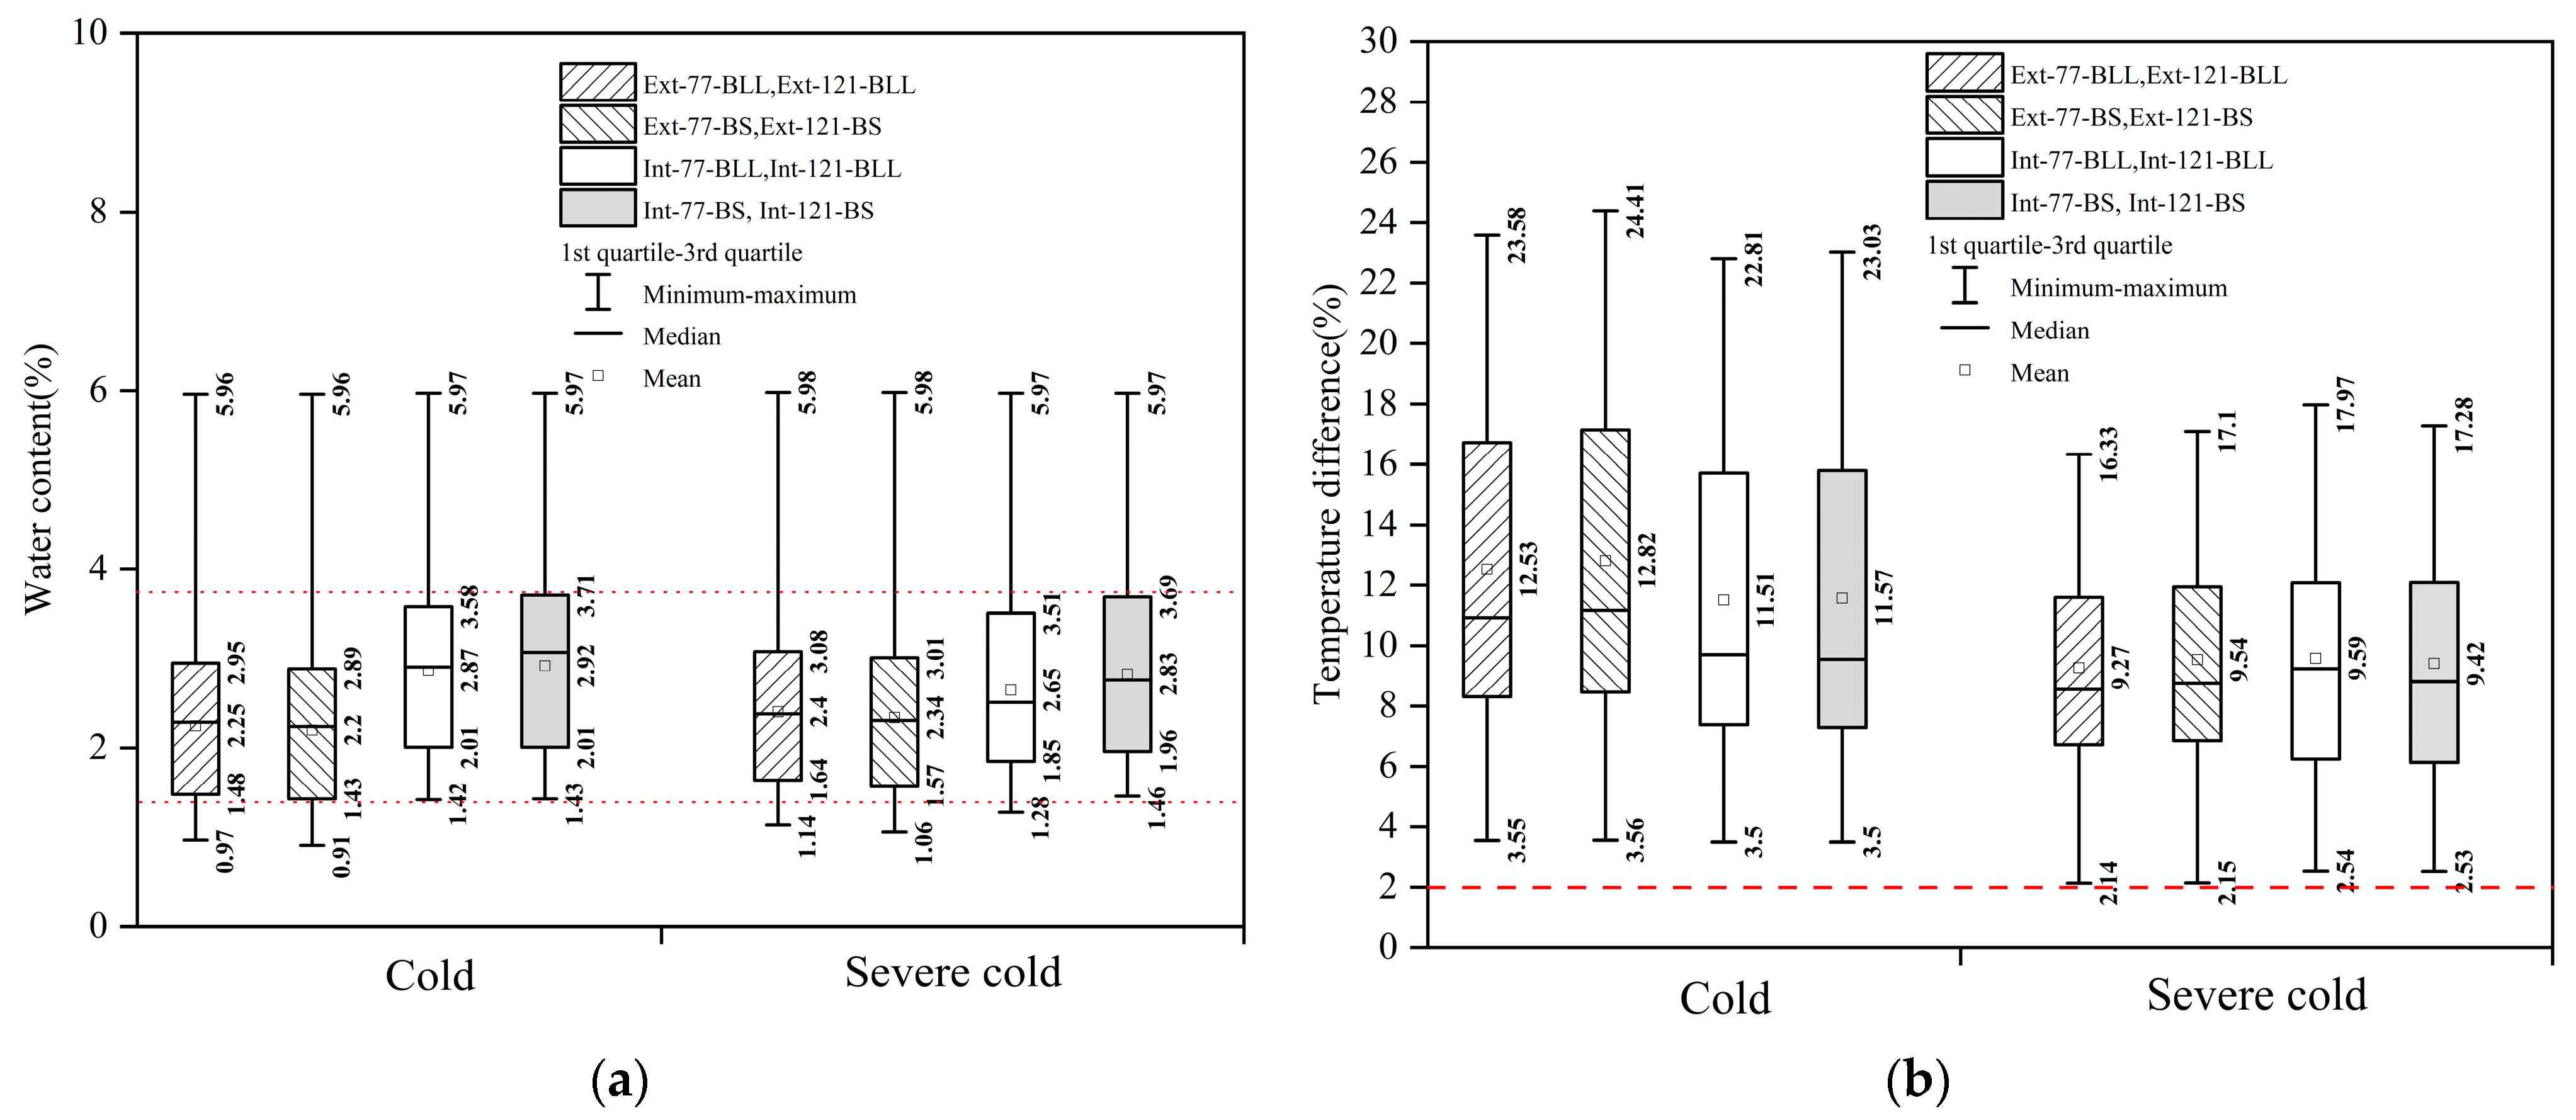
3.3. Water Content (WC) for each BLL and BS of the Wall

Figure 8 shows the WC of BLL and BS, which is the structure of BLL and BS walls for five years and one year in the five zones. It can be concluded that the BLL and BS of walls have moisture stability because the remaining walls show a downward trend or a steady trend without exceeding WC 20%, which is the standard of the ASHRAE Handbook 2005 Fundamentals Ch. 24. When other factors are held constant, the WC of BLL is always found to be higher than that of BS in the five climate zones. The reason is the same as in Section 3.1. Although BLL performs marginally worse than BS in terms of WC, its WC is within the standard range. In addition, the greater the fluctuation in the WC of the BLL, the better the absorption and discharge of water, which indicates that the BLL exerts a humidity control effect. Thus, BLL and BS can be used for building envelopes in China.
The WCs of the walls behaved similarly in the temperate climate zone and the hot summer and cold winter climate zone, and similarly in the cold climate zone and the severe cold climate zone.
In the temperate climate zone, wall None-BLL-1 of BLL had a maximum WC of 12.00%, and the minimum WC of wall None-BLL-1 of BLL was 10.07%. Wall None-BS-1 of BS had a maximum WC of 9.00%, and the minimum WC of wall None-BS-1 of BS was 8.17%. In the hot summer and cold winter climate zone, wall None-BLL-1 of BLL had a maximum WC of 12.00%, and the minimum WC of wall None-BLL-1 of BLL was 10.27%. Wall None-BS-1 of BS had a maximum WC of 9.00%, and the minimum WC of wall None-BS-1 of BS was 8.27%. Based on the results of the one-year simulation, the WCs had a similar pattern in both climate zones. During the period from June to September (summer), the WCs of BLL and BS showed an upward trend, and the rest of the months showed a downward trend.
In the hot summer and warm winter climate zone, wall None-BLL-2 of BLL had a maximum WC of 12.00%, and the minimum WC of wall None-BLL-2 of BLL was 9.52%. Wall None-BS-2 of BS had a maximum WC of 9.00%, and the minimum WC of wall None-BS-2 of BS was 8.08%. During the period from June to December, the WCs of BLL and BS showed a downward trend, and the rest of the months maintained a flat change. In the process of the wall design, contrary to in the temperate and hot summer and cold winter climate zones, the vapor retarder of the wall in the hot summer and warm winter climate zone was placed on the outdoor side, because the vapor retarder needs to be placed on the side with higher temperature, otherwise it will lead to the rise of water in the structure and damage the structure.
In the cold and severe cold climate zones, the WCs of the external insulation system of BLL and BS showed a more dramatic decline compared with the internal insulation system. In the cold climate zone, the WC of wall Ext-77-BLL of BLL decreased by about 3.04%, and the WC of wall Ext-77-BS of BS decreased by about 1.30%. In the severe cold climate zone, the WC of wall Ext-121-BLL of BLL decreased by about 3.37%, and the WC of wall Ext-121-BS of BS decreased by about 1.49%. The WCs of the internal insulation system of BLL and BS were higher than the external insulation system, wall Int-77-BLL of BLL had a maximum WC of 12.05%, and wall Int-77-BS of BS had a maximum WC of 9.05% in the cold climate zone. Wall Int-121-BLL of BLL had a maximum WC of 12.10% and wall Int-121-BS of BS had a maximum WC of 9.08% in the severe cold climate zone. During the period from June to September (summer), the WCs of the external insulation system of BLL and BS showed an upward trend, and the rest of the months showed a downward trend. However, the WCs of the internal insulation system of BLL and BS maintained a flat change throughout the year. Results indicate that the BLL and BS walls using an external insulation system have a better long-term drying capacity than the internal insulation system.
Figure 9 shows the comparison of the WC of BLL and BS with other cases of the wood material interface. Lee [29] observed that the OSB was highly susceptible to moisture, with a WC of around 16.26%. Lepage [63] analyzed the WC of CLT layers using WUFI and found that the WC of CLT layers in the Ottawa region was 12%. McClung [64] conducted a study on the hygrothermal performance of five different types of CLT walls and found that the wall WC was 15%. In this study, the maximum WC of the BLL structure was 12.10%, while that of the BS structure was 9.08%. Both of these bamboo structures displayed good moisture resistance, with BS structures demonstrating superior moisture resistance.
In the cold and severe cold climate zones, the moisture flowing through the wall was mainly water vapor that ran from indoors to outdoors, and better results could have been achieved by placing the insulation on the exterior. In contrast, the direction of moisture transfer in hot and humid climate zones was outdoor to indoor. In addition, heavy rain loads led to liquid water accumulation on the exterior of the building; therefore, it is recommended to lay a vapor retarder on the outside to help weaken the influence of the external humidity environment.

3.4. Hygrothermal Performance of the Insulation

The WC of the insulation was analyzed separately; as the WC of the insulation rises, the thermal performance of the material decreases. The insulation’s thermal conductivity rises as a result of the moisture in the pores, leading to the worsening of the building’s energy performance. Figure 10 shows two box plots which display the maximum and minimum values, as well as the mean and quartiles of the data. This information can be used to compare different groups or determine trends and patterns. Based on the figure, the quartile ranges of the water content and temperature difference of the insulation interface of the wall Ext-121-BLL (Ext-77-BLL), and wall Ext-121-BS (Ext-77-BS), were similar in both climate zones. The same pattern can be observed for Int-121-BLL (Int-77-BLL), wall Int-121-BS (Ext -77-BS). This suggests that the two new types of bamboo materials have similar effects on insulation performance, or that their impact on insulation performance is negligible. Figure 10(a) shows the WCs in the insulation of the four walls in the two climate zones. The box range of the WC of the insulation is concentrated between 1.43 and 3.71%, with an average value of less than 3% and a maximum value of 5.98%. Given the lower annual temperature and relative humidity in both climate zones, the yearly partial pressure of water vapor in the outdoor air appeared to have little effect on the interior of the walls, meaning that the WCs of the insulation were within the acceptable range and did not influence the insulation’s performance.
The accumulation of moisture in the components of the wall system depends to a large extent on the temperature profiles of the different constituents, as this is the primary determinant of the local relative humidity and therefore a necessary condition for the occurrence of interstitial condensation within the wall system [65]. There was air inside the wall or air penetration through the wall. When the temperature inside the wall reached or fell below the dew point temperature of the air, the water vapor in the air precipitated to form condensation water. Figure 10(b) shows that the difference between the ambient temperature and dew point temperature of each moment of the insulation interface in the four walls was greater than 0 °C, even above 2 °C, indicating that there is no risk of condensation at each insulation interface.

3.5. Lowest Isopleth for Mold Growth (LIM) of the Wall System

The most critical factors for mold and microbe growth are the humidity (or moisture content) and temperature conditions at the material surface as well as the exposure time and the type of material [66]. The mold growth assessment method is described in detail in Section 2.2.4. Figure 11 shows the temperature and relative humidity (RH) distribution of the BLL and BS interfaces of 12 walls in different climatic zones, as well as their relationship with the critical curve. Only a small amount of RH exceeded the critical value. To present the information on the graph more clearly, the statistical data of the scatter plot are listed in Table 7 and Table 8. Table 7 and Table 8 show the mold growth time for each wall and the risk ratio of mold growth after five years (43,800 h).
In the temperate climate zone, the risk ratio of wall None-BLL-1 of BLL was 0.80%, and the risk ratio of wall None-BS-1 of BS was 3.11%. In the hot summer and cold winter climate zone, the risk ratio of wall None-BLL-1 of BLL was 1.24%, and the risk ratio of wall None-BS-1 of BS was 3.40%. In the hot summer and warm winter climate zones, the risk ratio of wall None-BLL-2 of BLL was 0.69%, and the risk ratio of wall None-BS-2 of BS was 1.26%. Results show that the four walls had a low risk ratio in the three climate zones. In the cold and severe cold climate zone, wall Int-121-BLL and Int-77-BLL had a maximum risk ratio of 5.86%, and the risk ratio of the rest of the walls was less than 4.00%, which confirms that the eight walls have a low long-term risk of mold growth in the remaining climate zones.
In general, the walls in the hot summer and warm winter climate zones easily performed more poorly, because the climate zone has heavy heat and moisture load, abundant rainfall, and is prone to heavy rain. Due to the difficult climate, the requirements for wall construction are greater, and measures such as adding ventilation facilities to the structure need to be taken into account during wall design to accelerate the drying rate. Instead of insulation, a vapor retarder should be installed on the outside of the wall in this climate zone. Exterior insulation is more likely to be affected by humidity since it is located on the outdoor side, where moisture can easily accumulate. The risk of BLL and BS mold growth is aggravated by the fact that the moisture absorption of EPS is negligible and the moisture is not quickly discharged after passing to the interior side.

4. Conclusions

The current scientific literature has not reported on the hygrothermal evaluation of BLL and BS for building envelopes applicable to the five climate zones in China. The lack of research on the hygrothermal properties of bamboo buildings is an important reason why engineered bamboo materials have not been promoted for use in buildings on a large scale. The purpose of this study was to evaluate the hygrothermal performance of two bamboo-based materials (BLL and BS) when applied to envelope systems, and results may inform climate-specific designs to minimize mold risks. BLL and BS were systematically tested for their hygrothermal properties by the applicable architectural standards, which supported the calculation of WUFI®. Twelve walls of BLL and BS were designed to simulate hygrothermal behavior using WUFI®. Based on the simulation results, the TWC and WC of the walls, the risks of condensation and mold were analyzed
The main conclusions of the present analysis are as follows:
  • Comparing the hygrothermal properties of BS and BLL, results show that BS has a greater heat-storage capacity than BLL. However, BLL shows a relatively higher moisture-sorption capacity, and BLL is more easily permeated by vapor than BS.
  • Through the analysis of the hygrothermal performance of insulation, results indicate that the WCs of each insulation in the five climate zones are not enough to affect the insulation performance, and there is no condensation risk in each insulation interface.
  • After analyzing the WC of BLL and BS, the WCs of the 12 walls of BLL and BS were below 20%, showing that BLL and BS can be used in envelopes, and that the WC of BS is lower than that of BLL.
  • Based on the results, the walls designed in this study are suitable for the corresponding climate zones; especially in the cold and severe climate zones, the external insulation system walls perform better than the internal insulation system walls, and the external insulation system is recommended for these two climate zones.
The design and simulation results of walls made of two types of bamboo-based materials provide a scientific basis for the application of the material, so that BLL and BS may be incorporated into Chinese bamboo structural design codes in the future so that they can gain a large number of engineering applications. The economy of the bamboo production area can only be improved if bamboo materials are applied to construction projects on a large scale.
From the findings of this study, the following aspects can be considered for further research:
  • In this study, the properties of BLL and BS were obtained through experimental measurements, but the construction performance was carried out by simulations. Looking further ahead, tests on building components and laboratory houses should be added to verify the simulation results to improve the reliability of the results of this study.
  • This study’s walls were designed by existing standards; however, there may be potential for improvement in terms of design and construction. Future work should aim to undertake a more in-depth analysis of the wall construction design in a way that simplifies the design without compromising construction performance.

Author Contributions

Conceptualization, X.W., B.F. and H.L.; methodology, X.W.; software, H.L.; validation, X.W.; formal analysis, X.W.; investigation, X.W.; resources, X.W.; data curation, H.L. and X.W.; writing—original draft preparation, H.L., Z.Z. and S.Y.; writing—review and editing, X.W., B.F. and H.L.; supervision, X.W.; funding acquisition, X.W. All authors have read and agreed to the published version of the manuscript.

Funding

This research was funded by the Fundamental Research Funds for the Central Non-profit Research Institution of CAF, Grant No. CAFYBB2019SZ012.

Informed Consent Statement

Not applicable.

Data Availability Statement

The data used to support the findings of this study are available from the authors upon request.

Conflicts of Interest

The authors declare no conflict of interest.

References

  1. Antonyova, A.; Korjenic, A.; Antony, P.; Korjenic, S.; Pavlusova, E.; Pavlus, M.; Bednar, T. Hygrothermal properties of building envelopes: Reliability of the effectiveness of energy saving. Energy Build. 2013, 57, 187–192. [Google Scholar] [CrossRef]
  2. Awad, H.; Guel, M.; Zaman, H.; Yu, H.; Al-Hussein, M. Evaluation of the thermal and structural performance of potential energy efficient wall systems for mid-rise wood-frame buildings. Energy Build. 2014, 82, 416–427. [Google Scholar] [CrossRef]
  3. Taffese, W.Z.; Sistonen, E. Neural network based hygrothermal prediction for deterioration risk analysis of surface-protected concrete facade element. Constr. Buildi. Mater. 2016, 113, 34–48. [Google Scholar] [CrossRef]
  4. He, X.; Zhang, H.; Qiu, L.; Mao, Z.; Shi, C. Hygrothermal performance of temperature-humidity controlling materials with different compositions. Energy Build. 2021, 236, 110792. [Google Scholar] [CrossRef]
  5. Simonson, C.J.; Salonvaara, M.; Ojanen, T. The effect of structures on indoor humidity—Possibility to improve comfort and perceived air quality. Indoor Air 2002, 12, 243–251. [Google Scholar] [CrossRef]
  6. Bui, R.; Labat, M.; Lorente, S. Impact of the occupancy scenario on the hygrothermal performance of a room. Build. Environ. 2019, 160, 106178. [Google Scholar] [CrossRef]
  7. Kalamees, T.; Vinha, J. Hygrothermal calculations and laboratory tests on timber-framed wall structures. Build. Environ. 2003, 38, 689–697. [Google Scholar] [CrossRef]
  8. Liu, X.; Chen, G.; Chen, Y. Modeling of the Transient Heat, Air and Moisture Transfer in Building Walls. J. Hunan Univ. Nat. Sci. Ed. 2016, 43, 152–156. [Google Scholar] [CrossRef]
  9. Steeman, H.J.; Van Belleghem, M.; Janssens, A.; De Paepe, M. Coupled simulation of heat and moisture transport in air and porous materials for the assessment of moisture related damage. Build. Environ. 2009, 44, 2176–2184. [Google Scholar] [CrossRef]
  10. Qin, M.; Belarbi, R.; Ait-Mokhtar, A.; Nilson, L.-O. Coupled heat and moisture transfer in multi-layer building materials. Constr. Buildi. Mater. 2009, 23, 967–975. [Google Scholar] [CrossRef]
  11. Pihelo, P.; Kalamees, T. The effect of thermal transmittance of building envelope and material selection of wind barrier on moisture safety of timber frame exterior wall. J. Build.Eng. 2016, 6, 29–38. [Google Scholar] [CrossRef]
  12. Busser, T.; Pailha, M.; Piot, A.; Woloszyn, M. Simultaneous hygrothermal performance assessment of an air volume and surrounding highly hygroscopic walls. Build. Environ. 2019, 148, 677–688. [Google Scholar] [CrossRef]
  13. Park, J.H.; Kim, Y.U.; Jeon, J.; Yun, B.Y.; Kang, Y.; Kim, S. Analysis of biochar-mortar composite as a humidity control material to improve the building energy and hygrothermal performance. Sci. Total Environ. 2021, 775, 145552. [Google Scholar] [CrossRef]
  14. Wang, L.; Ge, H. Hygrothermal performance of cross-laminated timber wall assemblies: A stochastic approach. Build. Environ. 2016, 97, 11–25. [Google Scholar] [CrossRef]
  15. Sulaiman, H.; Olsina, F. Comfort reliability evaluation of building designs by stochastic hygrothermal simulation. Renew. Sust. Energ. Rev. 2014, 40, 171–184. [Google Scholar] [CrossRef]
  16. Tijskens, A.; Roels, S.; Janssen, H. Neural networks for metamodelling the hygrothermal behaviour of building components. Build. Environ. 2019, 162, 106282. [Google Scholar] [CrossRef]
  17. Tijskens, A.; Janssen, H.; Roels, S. The impact of a reduced training subspace on the prediction accuracy of neural networks for hygrothermal predictions. J.Build. Perform. Simu. 2021, 14, 20–37. [Google Scholar] [CrossRef]
  18. Tijskens, A.; Roels, S.; Janssen, H. Hygrothermal assessment of timber frame walls using a convolutional neural network. Build. Environ. 2021, 193, 107652. [Google Scholar] [CrossRef]
  19. Wang, X.; Li, H.; Zhu, Y.; Peng, X.; Wan, Z.; Xu, H.; Nyberg, R.G.; Song, W.W.; Fei, B. Using Machine Learning Method to Discover Hygrothermal Transfer Patterns from the Outside of the Wall to Interior Bamboo and Wood Composite Sheathing. Buildings 2022, 12, 898. [Google Scholar] [CrossRef]
  20. Radon, J.; Was, K.; Flaga-Maryanczyk, A.; Schnotale, J. Experimental and theoretical study on hygrothermal long-term performance of outer assemblies in lightweight passive house. J. Build. Phys. 2018, 41, 299–320. [Google Scholar] [CrossRef]
  21. Pelaz, B.; Blanco, J.M.; Cuadrado, J.; Egiluz, Z.; Buruaga, A. Analysis of the influence of wood cladding on the thermal behavior of building facades; characterization through simulation by using different tools and comparative testing validation. Energy Build. 2017, 141, 349–360. [Google Scholar] [CrossRef]
  22. Reich, B.Z.; Ge, H.; Wang, J. Effect of vapor diffusion port on the hygrothermal performance of wood-frame walls. J. Build.Eng. 2021, 39, 102280. [Google Scholar] [CrossRef]
  23. Hamdaoui, M.-A.; Benzaama, M.-H.; El Mendili, Y.; Chateigner, D. A review on physical and data-driven modeling of buildings hygrothermal behavior: Models, approaches and simulation tools. Energy Build. 2021, 251, 111343. [Google Scholar] [CrossRef]
  24. Chang, S.J.; Wi, S.; Kang, S.G.; Kim, S. Moisture risk assessment of cross-laminated timber walls: Perspectives on climate conditions and water vapor resistance performance of building materials. Build. Env. 2020, 168, 106502. [Google Scholar] [CrossRef]
  25. Cho, H.M.; Wi, S.; Chang, S.J.; Kim, S. Hygrothermal properties analysis of cross-laminated timber wall with internal and external insulation systems. J. Clean. Prod. 2019, 231, 1353–1363. [Google Scholar] [CrossRef]
  26. Chang, S.J.; Yoo, J.; Wi, S.; Kim, S. Numerical analysis on the hygrothermal behavior of building envelope according to CLT wall assembly considering the hygrothermal-environmental zone in Korea. Environ. Res. 2020, 191, 110198. [Google Scholar] [CrossRef]
  27. Setter, L.; Smoorenburg, E.; Wijesuriya, S.; Tabares-Velasco, P.C. Energy and hygrothermal performance of cross laminated timber single-family homes subjected to constant and variable electric rates. J. Build. Eng. 2019, 25, 100784. [Google Scholar] [CrossRef]
  28. Strang, M.; Leardini, P.; Brambilla, A.; Gasparri, E. Mass Timber Envelopes in Passivhaus Buildings: Designing for Moisture Safety in Hot and Humid Australian Climates. Buildings 2021, 11, 478. [Google Scholar] [CrossRef]
  29. Lee, J.; Wi, S.; Chang, S.J.; Choi, J.; Kim, S. Prediction evaluating of moisture problems in light -weight wood structure: Perspectives on regional climates and building materials. Build. Environ. 2020, 168, 106521. [Google Scholar] [CrossRef]
  30. Belloum, R.; Agoudjil, B.; Chennouf, N.; Boudenne, A. Hygrothermal performance assessment of a bio-based building made with date palm concrete walls. Build. Environ. 2022, 223, 109467. [Google Scholar] [CrossRef]
  31. Zhao, M.; Kuenzel, H.M.; Antretter, F. Parameters influencing the energy performance of residential buildings in different Chinese climate zones. Energy Build. 2015, 96, 64–75. [Google Scholar] [CrossRef]
  32. Lian, C.; Liu, R.; Zhang, S.; Yuan, J.; Luo, J.; Yang, F.; Fei, B. Ultrastructure of parenchyma cell wall in bamboo (Phyllostachys edulis) culms. Cellulose 2020, 27, 7321–7329. [Google Scholar] [CrossRef]
  33. Kumar, D.; Mandal, A. Review on manufacturing and fundamental aspects of laminated bamboo products for structural applications. Constr. Buildi. Mater. 2022, 348, 128691. [Google Scholar] [CrossRef]
  34. Huang, Z.; Kuenzel, H.; Krus, M.; Zhang, W. Three-dimensional tests on hygric properties of laminated bamboo and bamboo scrimber. J. Build. Eng. 2022, 56, 104712. [Google Scholar] [CrossRef]
  35. Huang, Z.; Sun, Y.; Musso, F. Experimental study on bamboo hygrothermal properties and the impact of bamboo-based panel process. Constr. Buildi. Mater. 2017, 155, 1112–1125. [Google Scholar] [CrossRef]
  36. Chen, J.; Guagliano, M.; Shi, M.; Jiang, X.; Zhou, H. A comprehensive overview of bamboo scrimber and its new development in China. Eur. J. Wood. Wood. Prod. 2021, 79, 363–379. [Google Scholar] [CrossRef]
  37. Huang, Y.; Ji, Y.; Yu, W. Development of bamboo scrimber: A literature review. J. Wood Sci. 2019, 65, 25. [Google Scholar] [CrossRef]
  38. Li, H.; Zhang, Q.; Wu, G.; Xiong, X.; Li, Y. A review on development of laminated bamboo lumber. J. For. Eng. 2016, 1, 10–16. [Google Scholar] [CrossRef]
  39. Kumar, A.; Vlach, T.; Laiblova, L.; Hrouda, M.; Kasal, B.; Tywoniak, J.; Hajek, P. Engineered bamboo scrimber: Influence of density on the mechanical and water absorption properties. Constr. Buildi. Mater. 2016, 127, 815–827. [Google Scholar] [CrossRef]
  40. Wang, J.S.; Demartino, C.; Xiao, Y.; Li, Y.Y. Thermal insulation performance of bamboo- and wood-based shear walls in light-frame buildings. Energy Build. 2018, 168, 167–179. [Google Scholar] [CrossRef]
  41. Huang, Z.; Sun, Y.; Musso, F. Assessment of bamboo application in building envelope by comparison with reference timber. Constr. Buildi. Mater. 2017, 156, 844–860. [Google Scholar] [CrossRef]
  42. Huang, Z.; Sun, Y.; Musso, F. Assessment on bamboo scrimber as a substitute for timber in building envelope in tropical and humid subtropical climate zones—Part 2 performance in building envelope. In Proceedings of the IOP Conference Series: Materials Science and Engineering, Lyon, France, 21–23 September 2017; p. 012007. [Google Scholar]
  43. Zhai, Z.; Wang, X.; Lv, H.; Chen, M.; Fei, B. Hygrothermal simulation on exterior wall of bamboo and wood structure. China For. Prod. Ind. 2018, 45, 8–13+18. [Google Scholar] [CrossRef]
  44. Huang, Z.; Sun, Y.; Musso, F. Hygrothermal performance optimization on bamboo building envelope in Hot-Humid climate region. Constr. Build. Mater. 2019, 202, 223–245. [Google Scholar] [CrossRef]
  45. Huang, Z.; Sun, Y. Hygrothermal performance comparison study on bamboo and timber construction in Asia-Pacific bamboo areas. Constr. Build. Mater. 2021, 271, 121602. [Google Scholar] [CrossRef]
  46. Feng, C. Study on the Test Methods for the Hygric Properties of Porous Building Materials. Ph.D. Thesis, South China University of Technology, Guangzhou, China, 2014. [Google Scholar]
  47. Kang, Y.; Chang, S.J.; Kim, S. Hygrothermal behavior evaluation of walls improving heat and moisture performance on gypsum boards by adding porous materials. Energy Build. 2018, 165, 431–439. [Google Scholar] [CrossRef]
  48. CNS GB/T 15780-1995; Testing Methods for Physical and Mechanical Properties of Bamboos. China Architecture & Building Press: Beijing, China, 1996.
  49. EN 12664; Thermal Performance of Building Materials and Products—Determination of Thermal Resistance by Means of Guarded Hot Plate and Heat Flow Meter Methods-Dry and Moist Products of Medium and Low Thermal Resistance. European Committee for Standardization: Brussels, Belgium, 2001.
  50. ISO 12572:2016(E); Hygrothermal Performance of Building Materials and Products—Determination of Water Vapour Transmission Properties—Cup method. International Organization for Standardization (ISO): Geneva, Switzerland, 2016.
  51. ASTM E96/E96M; Standard Test Methods for Water Vapor Transmission of Materials. ASTM International: West Conshohocken, PA, USA, 2016.
  52. ISO 12571:2000(E); Hygrothermal Performance of Building Materials and Products—Determination of Hygroscopic Sorption Properties. International Organization for Standardization (ISO): Geneva, Switzerland, 2000.
  53. ASTM C1498-04a; Standard Test Method for Hygroscopic Sorption Isotherms of Building Materials. ASTM International: West Conshohocken, PA, USA, 2016.
  54. Park, J.H.; Kang, Y.; Lee, J.; Chang, S.J.; Wi, S.; Kim, S. Development of wood-lime boards as building materials improving thermal and moisture performance based on hygrothermal behavior evaluation. Constr. Buildi. Mater. 2019, 204, 576–585. [Google Scholar] [CrossRef]
  55. Mundt-Petersen, S.O.H.; Harderup, L.-E. Validation of a One-Dimensional Transient Heat and Moisture Calculation Tool under Real Conditions; ASHRAE: Peachtree Corners, Georgia, 2013; pp. 1–12. [Google Scholar]
  56. Künzel, H.M. Simultaneous Heat and Moisture Transport in Building Components; Fraunhofer IRB Verlag: Stuttgart, Germany, 1995; pp. 1–65. [Google Scholar]
  57. Ibrahim, M.; Sayegh, H.; Bianco, L.; Wurtz, E. Hygrothermal performance of novel internal and external super-insulating systems: In-situ experimental study and 1D/2D numerical modeling. Appl. Therm. Eng. 2019, 150, 1306–1327. [Google Scholar] [CrossRef]
  58. ANSI/ASHRAE Standard 55-2010; Thermal Environmental Conditions for Human Occupancy. American Society of Heating, Refrigerating and Air-Conditioning Engineers: Atlanta, GA, USA, 2011.
  59. IOS13788:2012; Hygrothermal Performance of Building Components and Building Elements -Internal Surface Temperature to Avoid Critical Surface Humidity and Interstitial Condensation—Calculation Methods. International Organization for Standardization (ISO): Geneva, Switzerland, 2012.
  60. CNS GB/T50176-2016; Thermal Design Code for Civil Building. China Architecture & Building Press: Beijing, China, 2016.
  61. Park, J.H.; Kang, Y.; Lee, J.; Wi, S.; Chang, J.D.; Kim, S. Analysis of walls of functional gypsum board added with porous material and phase change material to improve hygrothermal performance. Energy Build. 2019, 183, 803–816. [Google Scholar] [CrossRef]
  62. Zhai, Z. Study on Exterior Wall Design and Hygrothermal Performance of Bamboo and Wood Structure. Ph.D. Thesis, Chinese Academy of Forestry, Beijing, China, 2017. [Google Scholar]
  63. Lepage, R.T.M. Moisture Response of Wall Assemblies of Cross-Laminated Timber Construction in Cold Canadian Climates; University of Waterloo: Waterloo, ON, Canada, 2012. [Google Scholar]
  64. McClung, R.; Ge, H.; Straube, J.; Wang, J. Hygrothermal performance of cross-laminated timber wall assemblies with built-in moisture: Field measurements and simulations. Build. Environ. 2014, 71, 95–110. [Google Scholar] [CrossRef]
  65. Chang, S.J.; Kim, S. Hygrothermal Performance of Exterior wall Structures Using a Heat, Air and Moisture Modeling. Energy Procedia 2015, 78, 3434–3439. [Google Scholar] [CrossRef]
  66. Vereecken, E.; Roels, S. Review of mould prediction models and their influence on mould risk evaluation. Build. Environ. 2012, 51, 296–310. [Google Scholar] [CrossRef]
Figure 1. Simulation process of WUFI simulation.
Buildings 13 01214 g001
Figure 2. Variation of indoor climate conditions with outdoor air temperature.
Buildings 13 01214 g002
Figure 3. Configuration of wall layer. (a) Severe cold climate zone; (b) Cold climate zone; (c) Hot summer and cold winter, and temperate climate zone; (d) Hot summer and warm winter climate zone.
Buildings 13 01214 g003
Figure 4. Bulk density and porosity of BS and BLL.
Buildings 13 01214 g004
Figure 5. The thermal properties of BS and BLL. (a) Specific heat capacity; (b) Thermal conductivity; (c) 24 h thermal storage coefficient.
Buildings 13 01214 g005
Figure 6. The hygric properties of BS and BLL. (a) Isothermal sorption curve; (b) Water vapour permeability; (c) Water vapour resistance factor.
Buildings 13 01214 g006
Figure 7. TWC of all walls in five climate zones.
Buildings 13 01214 g007
Figure 8. WC of all walls in five climate zones for five years and one year.
Buildings 13 01214 g008
Figure 9. Comparison of WC of BLL and BS with other cases of the wood material interface.
Buildings 13 01214 g009
Figure 10. Hygrothermal performance of the insulation of the four walls in the cold and severe cold climate zones. (a) Water content; (b) Temperature difference.
Buildings 13 01214 g010
Figure 11. Evaluation of the mold growth risk.
Buildings 13 01214 g011
Table 1. Salt solution and its corresponding relative humidity.
SoluteTemperature (°C)Humidity Control (%)Actual Humidity (%)
Potassium acetate2522.51 ± 0.3222
Potash2543.16 ± 0.3944
Potassium iodide2568.86 ± 0.2467
Potassium bromide2580.89 ± 0.2180
Saltpeter2593.58 ± 0.5593
Table 2. Hygrothermal simulation conditions.
ParametersSimulation Conditions
Analysis period5 years (From 1 January 2022, to 1 January 2027)
Initial relative humidity [RH%]80%
The initial temperature of the component23 °C
Heat transfer coefficientsExterior heat transfer coefficient: 17 W/m2K
Interior heat transfer coefficient: 8 W/m2K, Sd-value: 0.1 m
Ground short-wave reflectivity: 0.2 (standard value)
Adhering fraction of rain: 0.7
(depending on the inclination of the component).
U-value0.25 W/m2K (Ext-121-BLL, Int-121-BLL)
0.35 W/m2K (Ext-77-BS, Int-77-BS)
1.04 W/m2K (None-BLL-1, None-BLL-2)
1.09 W/m2K (None-BS-1, None-BS-2)
Indoor climateIn accordance with EN 15026/WTA6-2
Analysis orientationThe orientation was set to the south
Table 3. Exterior wall design requirements and conditions in five climate zones of China.
Climate ConditionDesign Condition
(Number)Climate Zone in ChinaMain IndicatorsSecondary IndicatorsU Value Regulatory Requirement
[W/m2 K]
North American Cities
(Chinese Cities)
1TemperateAverage temperature in the coldest month: 0–13 °C; average temperature in the hottest month: 18–25 °CDays of daily average
temperature ≤5 °C: 0–90
≤1.00Lexington, KY, USA
(Kunming)
2Hot summer and
warm winter
Average temperature in the coldest month ≥10 °C; average temperature in the hottest month: 25–29 °CDays of daily average temperature ≥25 °C: 100–200≤1.50Tampa, FL, USA
(Guangzhou)
3Hot summer and
cold winter
Average temperature in the coldest month: 0–10 °C;
average temperature in the hottest month: 25–30 °C
Days of daily average
temperature ≤5 °C: 0–90;
days of daily average temperature ≥25 °C: 40–110
≤1.00Atlanta, GA, USA
(Shanghai)
4Cold Average temperature in the coldest month: −10–0 °CDays of daily average
temperature ≤5 °C: 90–145
≤0.35Minneapolis, MN, USA
(Beijing)
5Severe cold Average temperature in the coldest month: ≤10 °CDays of daily average
temperature ≤5 °C: ≥145
≤0.25International Falls, MN, USA
(Harbin)
Table 4. Weather data of five North American cities.
North
American Cities
Temperature (°C)Relative Humidity (%)Counter
Radiation Sum (kWh/m2a)
Normal
Rain Sum (mm/a)
Mean ValueMax.Min.Mean ValueMax.Min.
Lexington, KY, USA13.633.3−16.173.21002129021299.1
Tampa, FL, USA22.836.7−5.672.1100153199.91138.2
Atlanta, GA, USA17.140.6−11.168100152981.51208.4
Minneapolis, MN, USA8.536.7−27.867.6100152672.7573.3
International Falls, MN, USA4.634.4−40.665.8100172507.9716.8
Table 5. Composition and hygrothermal properties of the wall.
MaterialBulk Density
(kg/m3)
Porosity
(m3/m3)
Specific Heat Capacity
(J/kg·K)
Thermal Conductivity
(W/m·K)
Diffusion Resistance
Factor (−)
Thickness
(mm)
Wood cladding3500.8018800.084196320
Air layer1.30.99910000.230.3838
Weather-resistive barrier1300.00123002.301001
EPS300.9515000.0450121/77
Vapor retarder1300.00123002.30100,0001
BLL7500.4712270.374496120
BS9990.3011840.426661120
Gypsum board8500.658500.208.319
Table 6. Mold growth risk criteria are based on the Lowest Isopleth for Mold (LIM) curves. Reprinted/adapted with permission from Ref. [54]. 20 April 2019, Ji Hun Park, Yujin Kang, Jongki Lee, Seong Jin Chang, Seunghwan Wi, Sumin Kim.
Conditions of Temperature (°C)Critical Relative Humidity (%)
0 ≤ T ≤ 20−0.00267 T3 + 0.160 T2 − 3.13 T + 100.0
20 < T ≤ 5080
T > 50, T < 0No growth is assumed
Table 7. Hours of exceeding critical RH for temperate, hot summer and cold winter, and hot summer and warm winter climate zones.
Climate ZoneWalls
None-BLL-1None -BS-1None-BLL-2None-BS-2
Hours
(h)
Risk Ratio
(%)
Hours
(h)
Risk Ratio (%)Hours
(h)
Risk Ratio (%)Hours
(h)
Risk Ratio (%)
Temperate3500.8013633.11----
Hot summer and cold winter5411.2414913.40----
Hot summer and warm winter----3020.695531.26
Table 8. Hours of exceeding critical RH for cold and severe cold climate zones.
Climate
Zone
Walls
Ext-77-BLLInt-77-BLLExt-77-BSInt-77-BSExt-121-BLLInt-121-BLLExt-121-BSInt-121-BS
Hours
(h)
Risk Ratio
(%)
Hours
(h)
Risk Ratio
(%)
Hours
(h)
Risk Ratio
(%)
Hours
(h)
Risk Ratio
(%)
Hours
(h)
Risk Ratio
(%)
Hours
(h)
Risk Ratio
(%)
Hours
(h)
Risk Ratio
(%)
Hours
(h)
Risk Ratio
(%)
Cold6611.5125675.8615973.655461.25--------
Severe cold--------7341.6825675.8613573.105461.25
Disclaimer/Publisher’s Note: The statements, opinions and data contained in all publications are solely those of the individual author(s) and contributor(s) and not of MDPI and/or the editor(s). MDPI and/or the editor(s) disclaim responsibility for any injury to people or property resulting from any ideas, methods, instructions or products referred to in the content.

