Article

Evaluation of Adhesive Properties of Different Mineral Compositions in Asphalt Mixtures with Experimental and Molecular Dynamics Analyses

1
Institute of Highway Engineering, RWTH Aachen University, Mies-van-der-Rohe-Str. 1, 52074 Aachen, Germany
2
School of Transportation Science and Engineeing, Harbin Institute of Technology, Harbin 150090, China
3
Institute for Urban and Pavement Engineering, TU Dresden, Georg-Schumann-Straße 7, 01187 Dresden, Germany
4
Federal Highway Research Institute (BASt), Brüderstr. 53, 51427 Bergisch Gladbach, Germany
5
School of Civil Engineering and Transportation, South China University of Technology, Guangzhou 510641, China
6
Guangdong Provincial Key Laboratory of Modern Civil Engineering Technology, Guangzhou 510641, China
*
Authors to whom correspondence should be addressed.
Buildings 2023, 13(5), 1207; https://doi.org/10.3390/buildings13051207
Submission received: 11 April 2023 / Revised: 25 April 2023 / Accepted: 29 April 2023 / Published: 2 May 2023
(This article belongs to the Section Building Materials, and Repair & Renovation)

Abstract

:
The adhesion between bitumen and mineral composition plays a vital role for the performance of asphalt mixtures. This study compares the adhesion of limestone, dolomite, and granodiorite to bitumen and evaluates the effects of different mineral components on adhesion. Three kinds of aggregates were tested through rolling-bottle tests. Afterwards, the respective fillers were integrated into asphalt mastic in a 1.6:1 mass ratio with bitumen and were subjected to frequency scan tests separately. A modified Luis Ibrarra-A model, K. Ziegel-B model, and K-B-G model were used to evaluate the bitumen–filler interactions based on the rheology of the asphalt mastic. In addition, the interface behavior between eight mineral components from these fillers/aggregates and bitumen were investigated by molecular dynamics (MD) simulations. The work of the adhesion and molecule concentration profiles were obtained from MD simulations. The results showed that the limestone and dolomite had better interfacial adhesion to the bitumen than the granodiorite. The calcium oxide and titanium oxide had the highest potential adsorption effect on the bitumen. Moreover, the high calcium oxide content contributed to better bitumen adhesion with the limestone and dolomite than with the granodiorite, which was further confirmed by additional molecule concentration profile analysis. This research contributes to the in-depth understanding of the effect of different chemical properties on the performance of asphalt mastic and the selection of suitable mineral components to improve the bitumen–filler/aggregate interface and asphalt mixture performance in general.

1. Introduction

Asphalt mixtures consist of bitumen, coarse aggregates, fine aggregates, fillers, and air voids. The performance of asphalt mixtures is not only influenced by the properties of these individual materials but also relates to the interaction between them [1]. The interfacial interaction between bitumen and aggregate/filler directly affects the performance of the asphalt mixture.
Adhesion tests between bitumen and aggregates, including static immersion tests, boiling water tests, and rolling-bottle tests that are applied in Germany, can quantitatively evaluate the adhesion between bitumen and aggregates [2,3,4,5]. These tests involve the creation of interface failure by artificially setting up a water environment.
However, there exists no uniform evaluation standard for interfacial adhesion between bitumen and filler material. Numerous studies have shown that although mineral fillers account for a small volume of asphalt mixtures, the surface area of the mineral fillers accounts for more than 90% of the total specific surface area of the mineral aggregate in asphalt mixtures [6]. Therefore, the interfacial interaction between mineral fillers and bitumen plays a vital role for the performance of asphalt mixtures.
At present, research on the interaction between mineral filler and bitumen is still in its initial stages. However, researchers have reached a consensus that the interaction between bitumen and fillers is a complex physical and chemical process [7]. Since the existing test methods cannot directly characterize the adhesion interface between bitumen and filler, most of the early studies have been limited to investigations into the effect of a filler’s physical properties on the performance of an asphalt mastic and asphalt mixture. With the development of testing techniques, the primary methods for studying the bitumen–filler interface have been surface free energy methods, micro/nano-characterization techniques, as well as dynamic mechanical analysis [8,9,10]. Physical and chemical processes acting on the surface are mainly used for the testing of the surface energy to calculate the adhesion work. Although the adhesion work obtained by this method can accurately characterize the bond state between bitumen and mineral filler, the estimated adhesion work differs significantly from the actual asphalt mastic properties due to certain voids in the fillers.
Thanks to modern material testing techniques, the surface morphology of filler and bitumen can be directly observed by scanning electron microscopy and atomic force microscopy [11]. Guo et al. investigated the effect of filler and bitumen grade surface conditions on the interfacial bonding effect using atomic force microscopy [12]. Ying et al. looked at the change in the binder strength before and after aging using microscopic atomic force microscopy and macroscopic bonding performance tests [13]. Zhao et al. used a rigid, conical quartz indenter to study the indenter’s adhesion to bitumen at different indentation depths. These studies have contributed significantly to the understanding of the bitumen–filler interface [14]. In addition, the method of using the rheological data of asphalt mastic to evaluate the interfacial interaction between bitumen and filler has also been widely studied with sample equipment [15,16]. Guo et al. used a dynamic shear rheometer (DSR) to measure different mineral properties and proposed the K-B-G index to evaluate the strength of interactions based on the complex modulus. Liu et al. compared the variation in three filler–bitumen adhesion properties with temperature change using ΔG, K-B-G, L-A-δ, and K-B-δ indices [17,18]. Mrinali studied the rheology of waste-ceramic-powder–bitumen mastic, which did not make use of limestone, by applying the DSR and the 2S2P1D model [19]. All these studies have shown that the interaction between filler and asphalt can be plausibly demonstrated with the help of rheological properties.
The experimental method characterizes the interfacial interaction between bitumen and filler at the macroscopic and fine scales. However, further investigation on the bitumen–filler interfacial interaction process at the nanoscale appears to be inadequate. To bridge the gap between macroscopic properties and microscopic molecular behavior, molecular dynamics (MD) have been widely used to study asphalt mastics in recent years [20,2122]. MD simulation aims to investigate the structure and performance of a molecular system by computing the motion of the constituent atoms, following classical mechanics. Currently, MD is considered as an effective tool for studying the interfacial interaction between bitumen and fillers [23]. Fan et al. used MD to establish the interface between fillers of different mineral compositions and bitumen. They found that aggregates with higher nepheline, chlorite, pyroxene, and olivine minerals were more likely to exhibit better moisture damage resistance [24]. Cui et al. evaluated the regeneration effect of rejuvenators on bitumen with different levels of deterioration. The results showed that the rejuvenator could effectively improve the rutting and water damage resistance of bitumen [25]. Fini et al. investigated the preferential surface adsorption of bio-based rejuvenators on silica substrates by modeling the MD of different rejuvenators [26]. Guo et al. used Fourier transform infrared spectrometry, 1H-nuclear magnetic resonance, gel permeation chromatography, and elemental analysis to establish a bitumen fraction model based on the real component model of bitumen. The enrichment of bitumen components on the surface of different aggregates was also studied by building a four-component model for bitumen [27,28].
In conclusion, the aforementioned studies lack an investigation into the effect of chemical composition on bitumen adhesion. It makes sense to combine the microscopic MD method with macroscopic tests for multiscale studies. The object of this study was to investigate the effect of the chemical compositions of different aggregates/fillers on the adhesion properties of bitumen at the macroscopic and microscopic molecular scales. To achieve this, rolling-bottle tests of three kinds of aggregates, the rheological properties of the asphalt mastic, and MD modeling of the interfaces between different oxides and bitumen were developed. In addition, the interfacial interaction indices Luis Ibrarra-A, K. Ziegel-B, and K-B-G parameters were investigated considering the specific surface area correction. Figure 1 shows the research flowchart of this study.

2. Materials and Tests

2.1. Materials

B50/70 bitumen from Nynas Corporation was used as the binder in the experiment by the authors [28]. The penetration of bitumen is 52 (0.1 mm) at 25 °C. The softening point of the bitumen is 51.4 °C.
Limestone, dolomite, and granodiorite were selected as the varying mineral aggregates and fillers in this study. Limestone aggregate and filler are commonly used in laboratory studies. The dolomite and granodiorite aggregates and fillers were obtained from local producers in Germany. The fillers were accumulated by crushing the aggregates. Table 1 shows the physical properties of the fillers [29]. The specific surface area is the filler’s total surface area per unit of mass, which was obtained by the Brunauer–Emmett–Teller (BET) test. The pore volume equates to the filler’s air volume per unit of mass. The average pore size is the average pore diameter of the fillers. Table 2 shows their oxide compositions obtained through X-ray fluorescence (XRF) testing using the PAN Analytical PW4400 spectrometer [29].
To mimic SMA 11S, which is the most commonly used asphalt mixture in Germany, the binder–filler mass ratio was decided as 1:1.6. This ratio was deduced from the middle value according to the German code (Forschungsgesellschaft für Straßen und Verkehrswesen [FGSV], 2007) [30]. Due to the different densities of the three kinds of fillers and the same bitumen, the ratio translated into the volumetric base was 0.3704, 0.3596, and 0.3687, respectively. The virgin bitumen and three kinds of fillers were blended in mixers at a temperature of 150 °C and a speed of 60 r/min for 15 min.

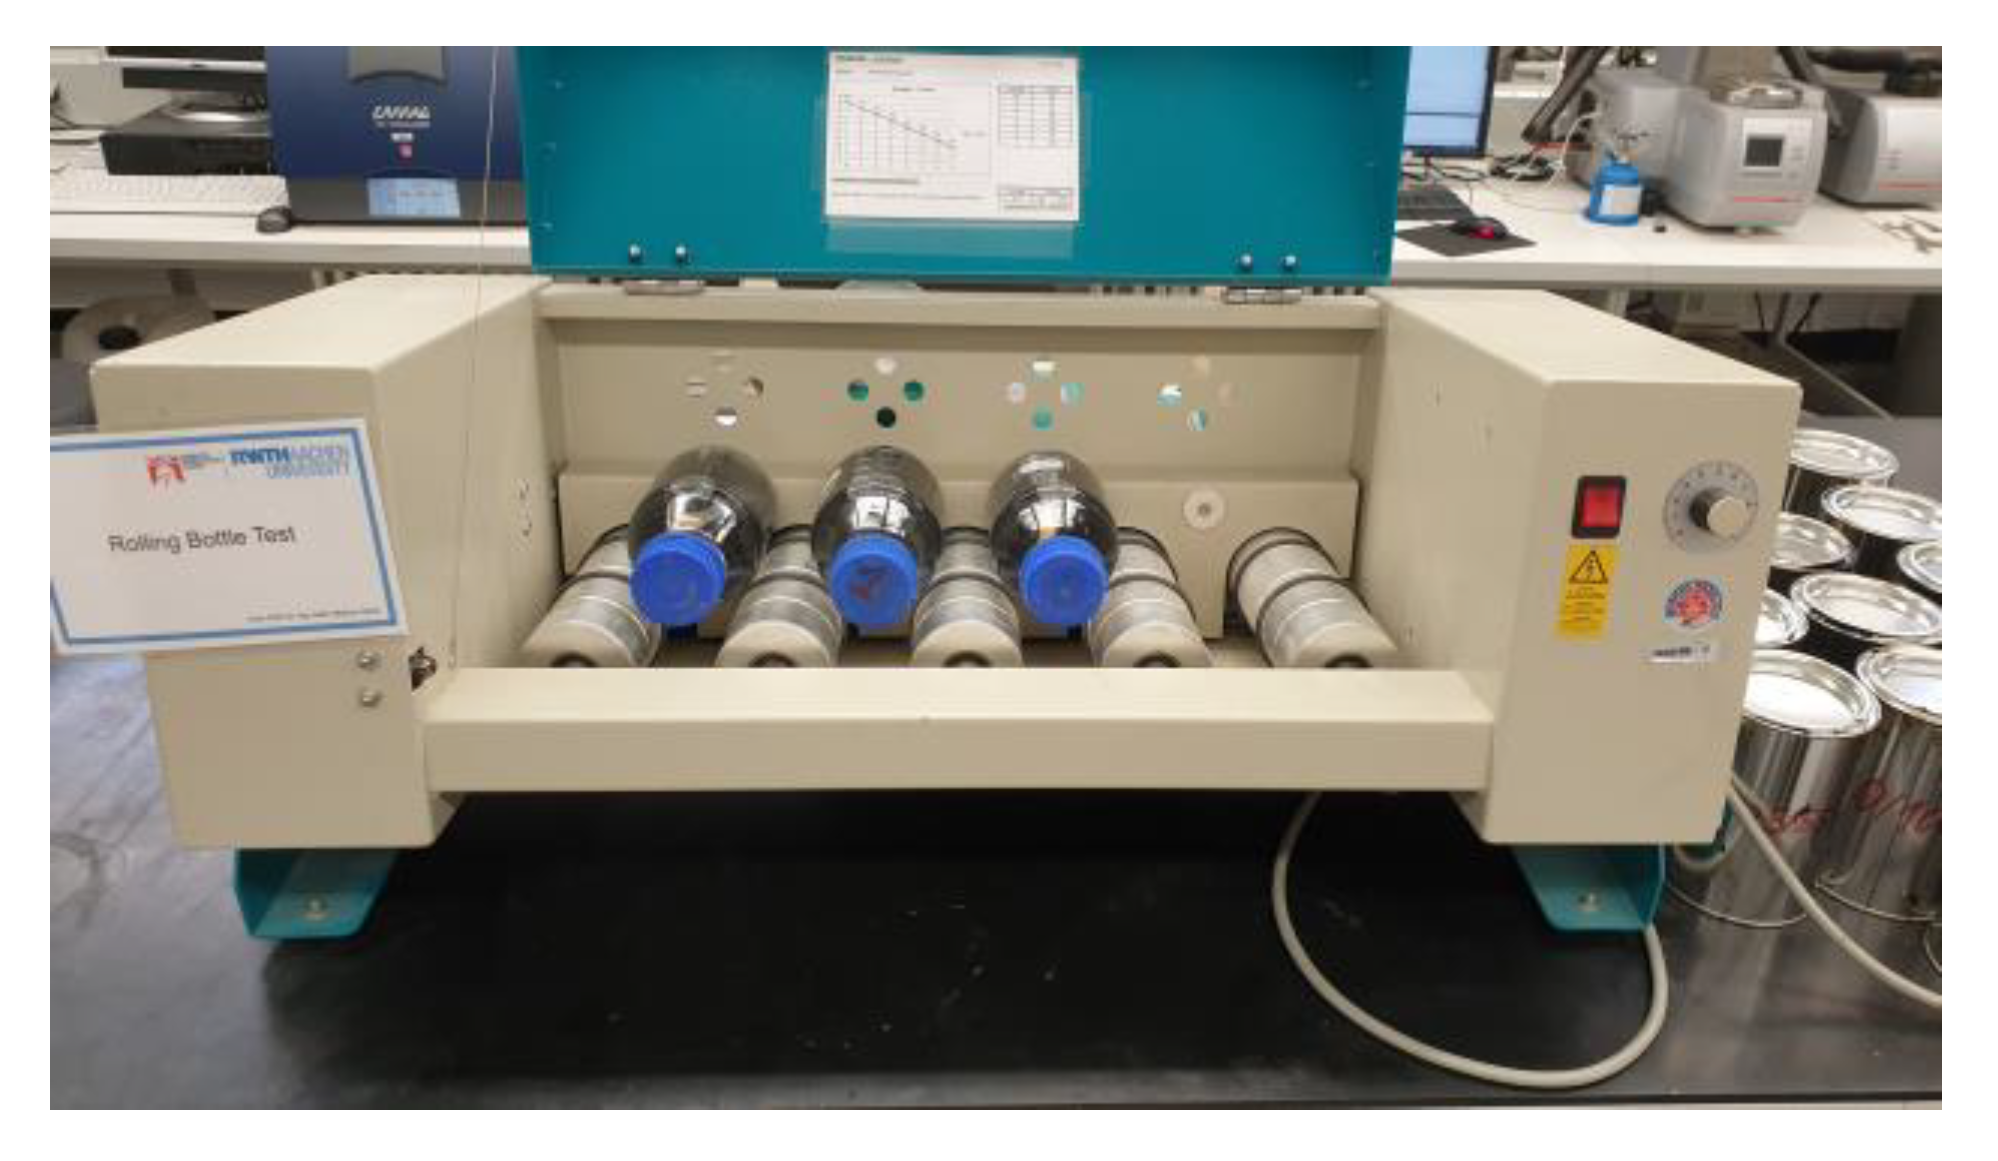
2.2. Rolling-Bottle Test

In Germany, methods for the evaluation of adhesion between asphalt and aggregate have been widely developed and validated. In this study, a rolling-bottle test was conducted on 3 kinds of aggregates and 50/70 bitumen according to the German standard EN 12697-11 [31].
For this research, limestone, dolomite, and granodiorite were selected. A total of 510 g of cleaned and dried aggregates with a particle size of 8 to 11 mm were mixed with 16 g of bitumen. The fully coated aggregates were cooled to room temperature and then added to a glass bottle along with a glass rod and deionized water. The rotational speed was set to 60 rpm, and the bottles were put in the machine at a temperature of 15 to 25 °C. After 6 h, the process was stopped, and the percentage of covered aggregates was estimated, afterwards, the aggregates and water were filled back into the bottle and the test was continued. After a further 18 h (24 h in total), the test was finished, and the results were estimated again. The percentage of covered aggregates was estimated by two independent persons for each time step. All estimates were rounded to the nearest 5%. Figure 2 shows the rolling-bottle machine and samples.

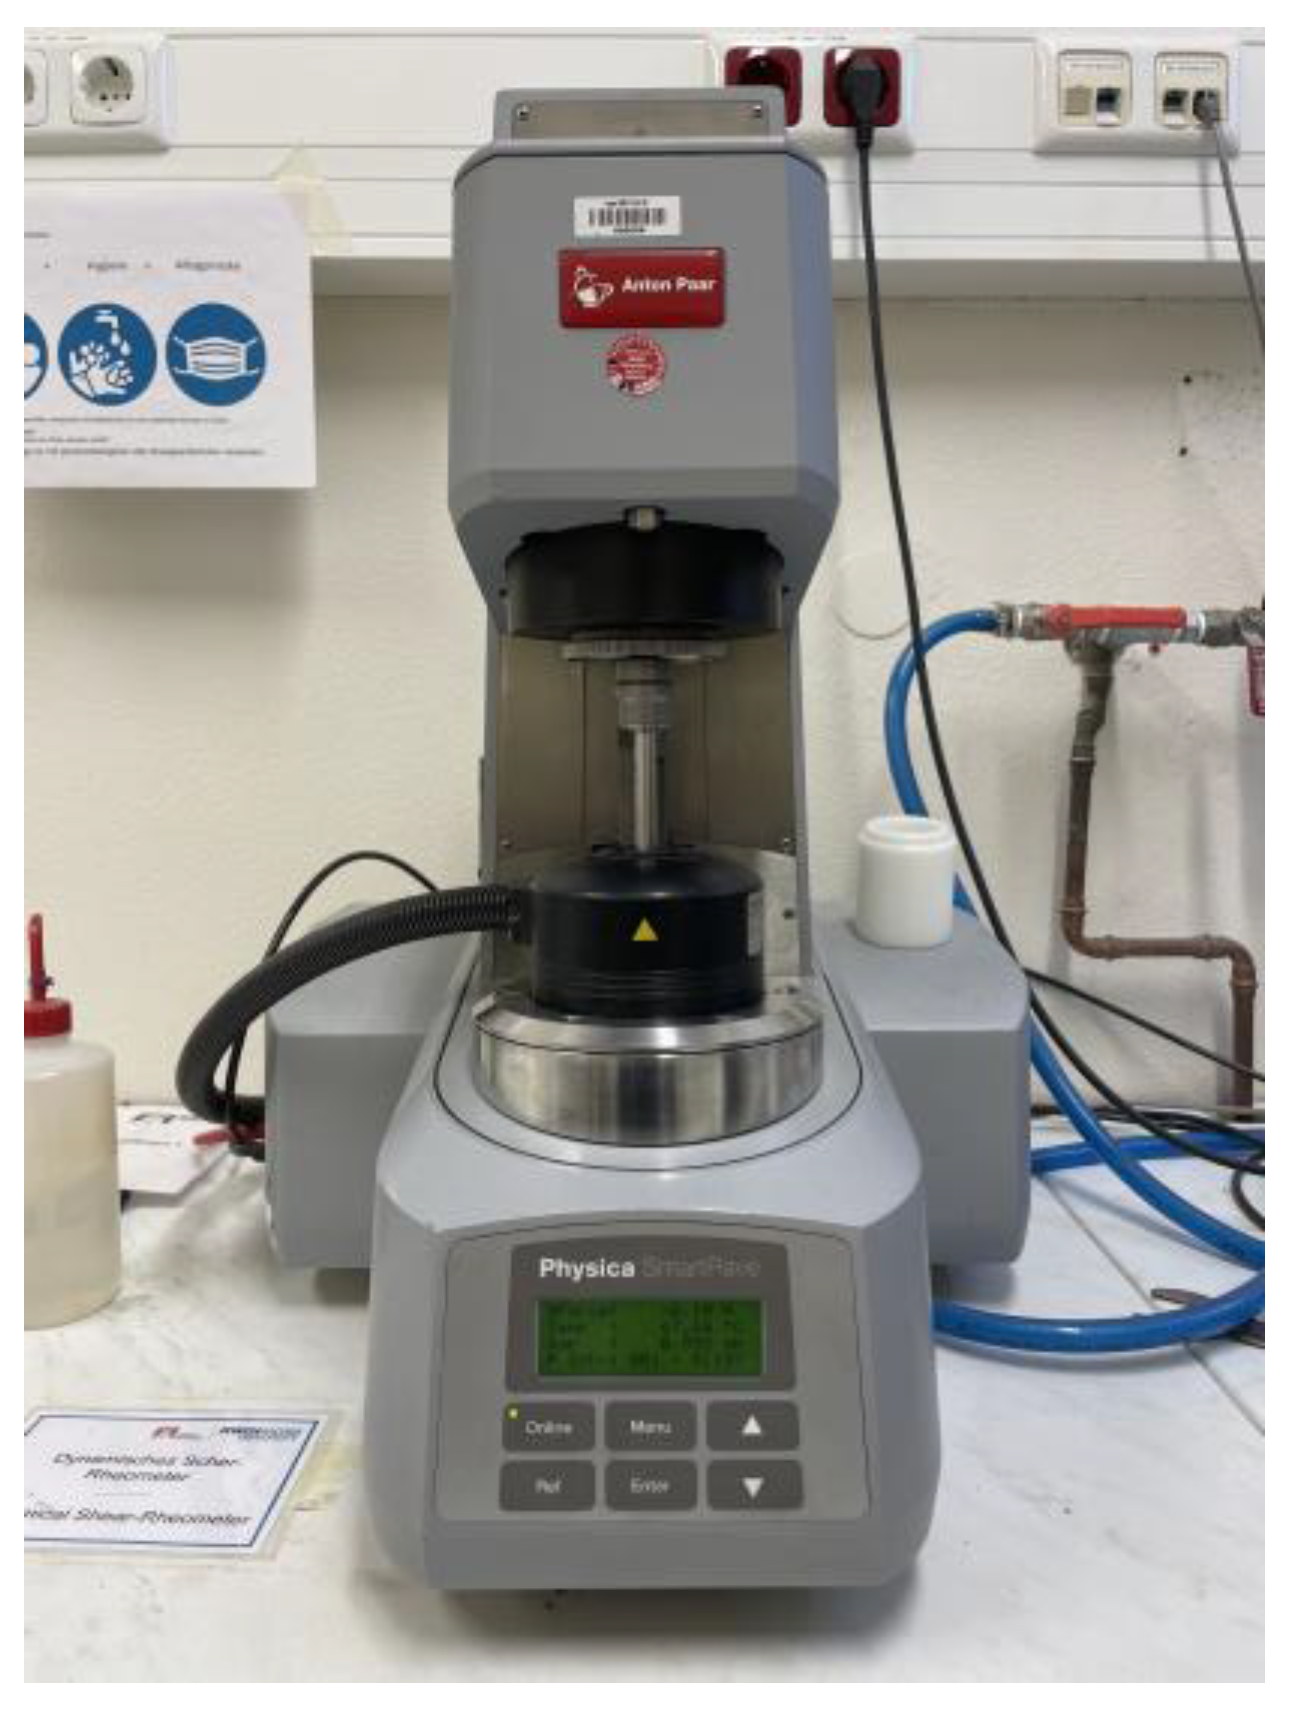
2.3. Frequency Sweep Test

To determine the linear viscoelastic (LVE) limit, strain sweep tests for the virgin bitumen and four kinds of asphalt mastics were performed at −10 °C, 0 °C, 10 °C, 30 °C, 50 °C, 60 °C, and 70 °C under frequencies ranging from 0.0159 to 47.7 Hz and a shear strain ranging from 0.02% to 1.5%. The limit of LVE was set at 95% of the initial value. The following frequency sweep tests were strictly performed with this limit of LVE. Figure 3 shows the DSR device used in this study.
Due to the extensive range of temperature measurements, the frequency sweep test of each asphalt mastic and virgin bitumen had to be divided into two sections to meet the optimal test interval of the instrument. The first part used the 8 mm diameter parallel plate with a 2 mm thickness to perform the test under the angular strain ranging from 0.4% to 0.8% in a temperature range from −10 °C to 30 °C. The second part used the 25 mm diameter parallel plate with a 1 mm thickness to perform the test under an angular strain ranging from 0.75% to 1.5% in a temperature range from 30 °C to 70 °C.

3. Bitumen–Filler Interaction Model

The addition of mineral fillers is a crucial reason for the change in the rheological properties of asphalt mastic. The interaction between the mineral fillers and the bitumen interface causes a change in the macroscopic properties of asphalt mastic from a microscopic standpoint [32]. Due to the simplicity of operation, the indirect evaluation of the bitumen–filler interface interaction based on rheology has become a popular method for evaluating the interface interaction.
Bitumen is a viscoelastic material that exhibits hysteresis in response to loads [33]. The phase angle δ and complex modulus G* are commonly used to express the degree of hysteresis. The chemical properties of the mineral fillers significantly affect the rheological properties of asphalt mastic, changing the phase angle δ and complex modulus G*. Therefore, the adhesion of bitumen to mineral fillers can be indirectly evaluated by analyzing the phase angle δ and complex modulus G*.
The mechanical response of a completely elastic material is generated almost simultaneously with loading, and the phase angle δ is 0; however, the phase angle δ of downright viscous material is π/2. The complex modulus G* is the ratio calculated from a dynamic oscillation measurement by dividing the absolute value of the peak-to-peak shear stress by the absolute value of the peak-to-peak shear strain. In this study, three kinds of bitumen–filler interaction parameters based on phase angle δ and complex modulus G* were chosen to evaluate the adhesion between the bitumen and mineral filler.

3.1. Luis Ibrarra-A Model

The Luis Ibrarra-A model was designed to assess the interface energy loss of the composite materials. In this model, tan δ reflects the mechanical loss of the composite interface. Further, the mechanical loss of the composite interface can characterize the interaction between the bitumen and mineral filler. Virgin bitumen was considered as the matrix phase, the mineral filler was regarded as the reinforcing phase, and the mechanical loss occurred at the bitumen–filler interface during application. The parameter A was calculated by Equation (1) [15]. The smaller the value of parameter A, the better the adhesion between the bitumen and mineral filler.
A = tan δ c 1 φ tan δ m 1
where A is Luis Ibrarra-A, i.e., the interfacial interaction parameter between the filler and bitumen; δc is the phase angle of the asphalt mastic (rad); δm is the phase angle of virgin bitumen (rad); and φ is the volume fraction of the filler in the asphalt mastic.

3.2. K. Ziegel-B Model

The K. Ziegel-B model is created by calculating the phase angles δ of virgin bitumen and asphalt mastic after adding the mineral filler. Ziegel argues that the effective bitumen volume fraction needs to be adjusted for the actual volume fraction during the dispersion of the mineral filler in the bitumen, as the mineral filler adsorbs a certain amount of bitumen to form a structural bitumen layer [18]. This correction considers the complicated physical and chemical interactions between bitumen and mineral filler. Equation (2) was used to calculate parameter B. The greater the parameter B value, the stronger the interaction between the mineral filler and bitumen.
B = tan δ m / tan δ c 1 / φ
where B is K. Ziegel-B, i.e., the interfacial interaction parameter between filler and bitumen; δc is the phase angle of the asphalt mastic (rad); δm is the phase angle of the virgin bitumen (rad); and φ is the volume fraction of the filler in the asphalt mastic.

3.3. K-B-G Model

Guo et al. proposed an indirect interface interaction evaluation based on the classical LVE theory model and the modified Palierne emulsion model. The initial calculation is shown in Equation (3). This model is calculated using the complex modulus G* of the virgin bitumen and the asphalt mastic after adding the mineral filler.
G * ω = G m * ω 1 + 1.5 φ · K B G 1 φ · K B G
where G*(ω) is the complex modulus of the asphalt mastic (Pa); Gm*(ω) is the complex modulus of the virgin bitumen (Pa); φ is the volume fraction of the filler; and the K-B-G parameter is the interaction parameter of the bitumen and filler.
The K-B-G parameter is also a correction for the volume fraction of the filler. When the volume fraction of the filler in asphalt mastic is φ, the actual effective volume fraction of the filler is changed due to the interaction between bitumen and filler to form a structural bitumen layer on the surface of the filler. Equation (3) is further simplified to obtain Equation (4) [34].
C = G c * G m * 1 1.5 + G c * G m * · φ
where C is the interfacial interaction parameter between the filler and bitumen; Gc* is the complex modulus of the asphalt mastic; Gm* is the complex modulus of the virgin bitumen; and φ is the volume fraction of the filler. A more considerable C value indicates a more significant bitumen–filler interaction, i.e., the larger the K-B-G parameter, the better the adhesion between the bitumen and mineral filler.

3.4. Modified Interaction Model

The three bitumen–filler interaction models are all based on rheology. The bitumen–filler interactions are not only affected by the chemical properties of the fillers but also affected by the morphology of the filler’s surface. The influence of the filler surface morphology on the interaction with bitumen has been confirmed by numerous studies [35,3637]. Mineral fillers with a higher specific surface area have a much larger contact area with bitumen than those with a smaller specific surface area. Even if the chemical composition is less adherent to the bitumen, the larger contact area results in better interaction. Since this study focused on the effect of the chemical properties of the fillers on the adhesion, the impact of the surface properties needed to be excluded in the evaluation process. The results of the three models mentioned above were modified through the specific surface area per unit volume.
The Luis Ibrarra-A model results were multiplied by the specific surface area, and the K. Ziegle-B and K-B-G parameter models were divided by the specific surface area. The modified Luis Ibrarra-A, K. Ziegle-B, and K-B-G parameter models are shown in Equations (5)–(7).
A = tan δ c 1 φ tan δ m 1 · S
B = tan δ m / tan δ c 1 / φ · S
C = G c * G m * 1 1.5 + G c * G m * · φ · S
where A is Luis Ibrarra-A, B is K. Ziegel-B, and C is the K-B-G parameter, i.e., the interfacial interaction parameters between the filler and bitumen; and S is the specific surface area of the filler.

4. Bitumen–Mineral Composition MD Modeling

4.1. Molecular Model of Bitumen

In the molecular simulation process, a representative molecular model is first developed, and then a representative force field is selected to describe the interactions between these molecules. Afterwards, the model is geometrically optimized to achieve energy minimization. Further, kinetic equilibrium is performed to simulate the actual material conditions. Finally, the energy, molecular trajectories, velocities, etc., of the model system are collected to obtain the results.
Bitumen, a by-product of the petroleum refining process, is a complex hydrocarbon composed of various organic compounds [38]. Due to its highly complex composition, it is difficult to comprehensively analyze and quantify its specific chemical composition with the existing research tools. However, previous studies have shown that using an average molecular model of bitumen based on experimental data for MD analysis instead of actual bitumen material is an effective tool [39]. In early studies, nuclear magnetic resonance was used to analyze bitumen components separated by alkane precipitation. The asphaltene, naphthene aromatic, and saturate from the results were used to model the molecular dynamics, which is the three-component model currently used by many other researchers [40,41]. In addition, the ASTM standard D4124-09 categorizes virgin bitumen as being composed of asphaltene, aromatic, resin, and saturate. Guo et al. proposed the four-component model based on Fourier transform infrared spectrometer and 1H-nuclear magnetic resonance tests [27,42]. The 12-component bitumen model proposed and verified by Greenfield et al. has also been widely used for MD due to its reliability and universality [43].
In this study, the 12-component bitumen model proposed by Greenfield et al. was used to present the virgin bitumen. To construct the bitumen model in the Materials Studio software, an AAA-1 virgin bitumen model was chosen. Figure 4 illustrates the AAA-1 in the 12-component model of the virgin bitumen. Table 3 shows the properties of each component. The size of the confined bitumen model was 37.7 Å × 37.7 Å × 37.7 Å.
After the virgin bitumen model was built, a further geometry optimization of 500 ps was performed. A periodic boundary condition with a cut-off radius of 15.5 Å was set under the COMPASS force field. The optimized bitumen model was warmed up at 450 K using the NVT ensemble to simulate the bitumen mixing and construction process. Then, the NPT ensemble was used to simulate the normal use of pavement at a simulated temperature of 293.15 K and a pressure of 1 atm. The simulation time was 300 ps for both processes. The stabilized model of virgin bitumen is shown in Figure 5.
To further validate the reliability of the model, solubility was chosen to compare the experimental values with the simulated values. Solubility is a critical indicator to evaluate the degree of the interaction between molecules in a liquid. It can be calculated in a molecular model by the square root of the cohesion energy density, as shown in Equation (8).
Δ = CED = E V
where δ is the solubility of the bitumen model; CED is the cohesive energy density; ∆E is the cohesive energy; and V is the volume.
Table 4 compares the simulated values with the results of the three-molecule model from another study. The error amounted to 2.8–3.4%. It can therefore be stated that the model was reliable.

4.2. Molecular Modeling of Mineral Fillers

In this study, limestone, dolomite, and granodiorite were selected for comparison. Since the three kinds of fillers were composed mainly of eight oxides, the MD simulations were carried out using these eight oxide models and the virgin bitumen model. Since SiO2 was primarily present in the quartz crystals in the fillers, the quartz model was used to replace the SiO2 in the molecular models [29]. The remaining seven types of metal oxides were modeled using the metal oxide model. After the cleave surface and supercell progress, the height of the filler model in the z-direction was ensured to be 20 Å, and the lengths in the x and y directions were about 37.7 Å for a better combination.

4.3. Molecular Modeling of Mastic Interface

The bitumen–filler interface model was built by adding the virgin bitumen model to the filler component model. To break the periodicity of the bitumen in direct contact with the periodic filler component model, a 70 Å vacuum layer was created above the bitumen model. The established interface model is shown in Figure 6.
Before the structure of the models was able to reach the minimum energy state, the built interface models did not present an accurate interface model. Therefore, further geometric optimization was needed to achieve energy minimization. The mineral portions of the interface models were fixed before the energy minimization and MD simulation. The optimized system was then used in dynamics simulations for 300 ps under an NVT ensemble at 293 K. During the dynamics simulations, the COMPASS force field described the interactions between the atoms. The first 100 ps of the simulation brought the system to a balanced state. The latter 200 ps of the equilibrium state was used to collect the data. During the MD simulations, the trajectories of the molecules were noted every 5000 steps.

5. Results and Discussion

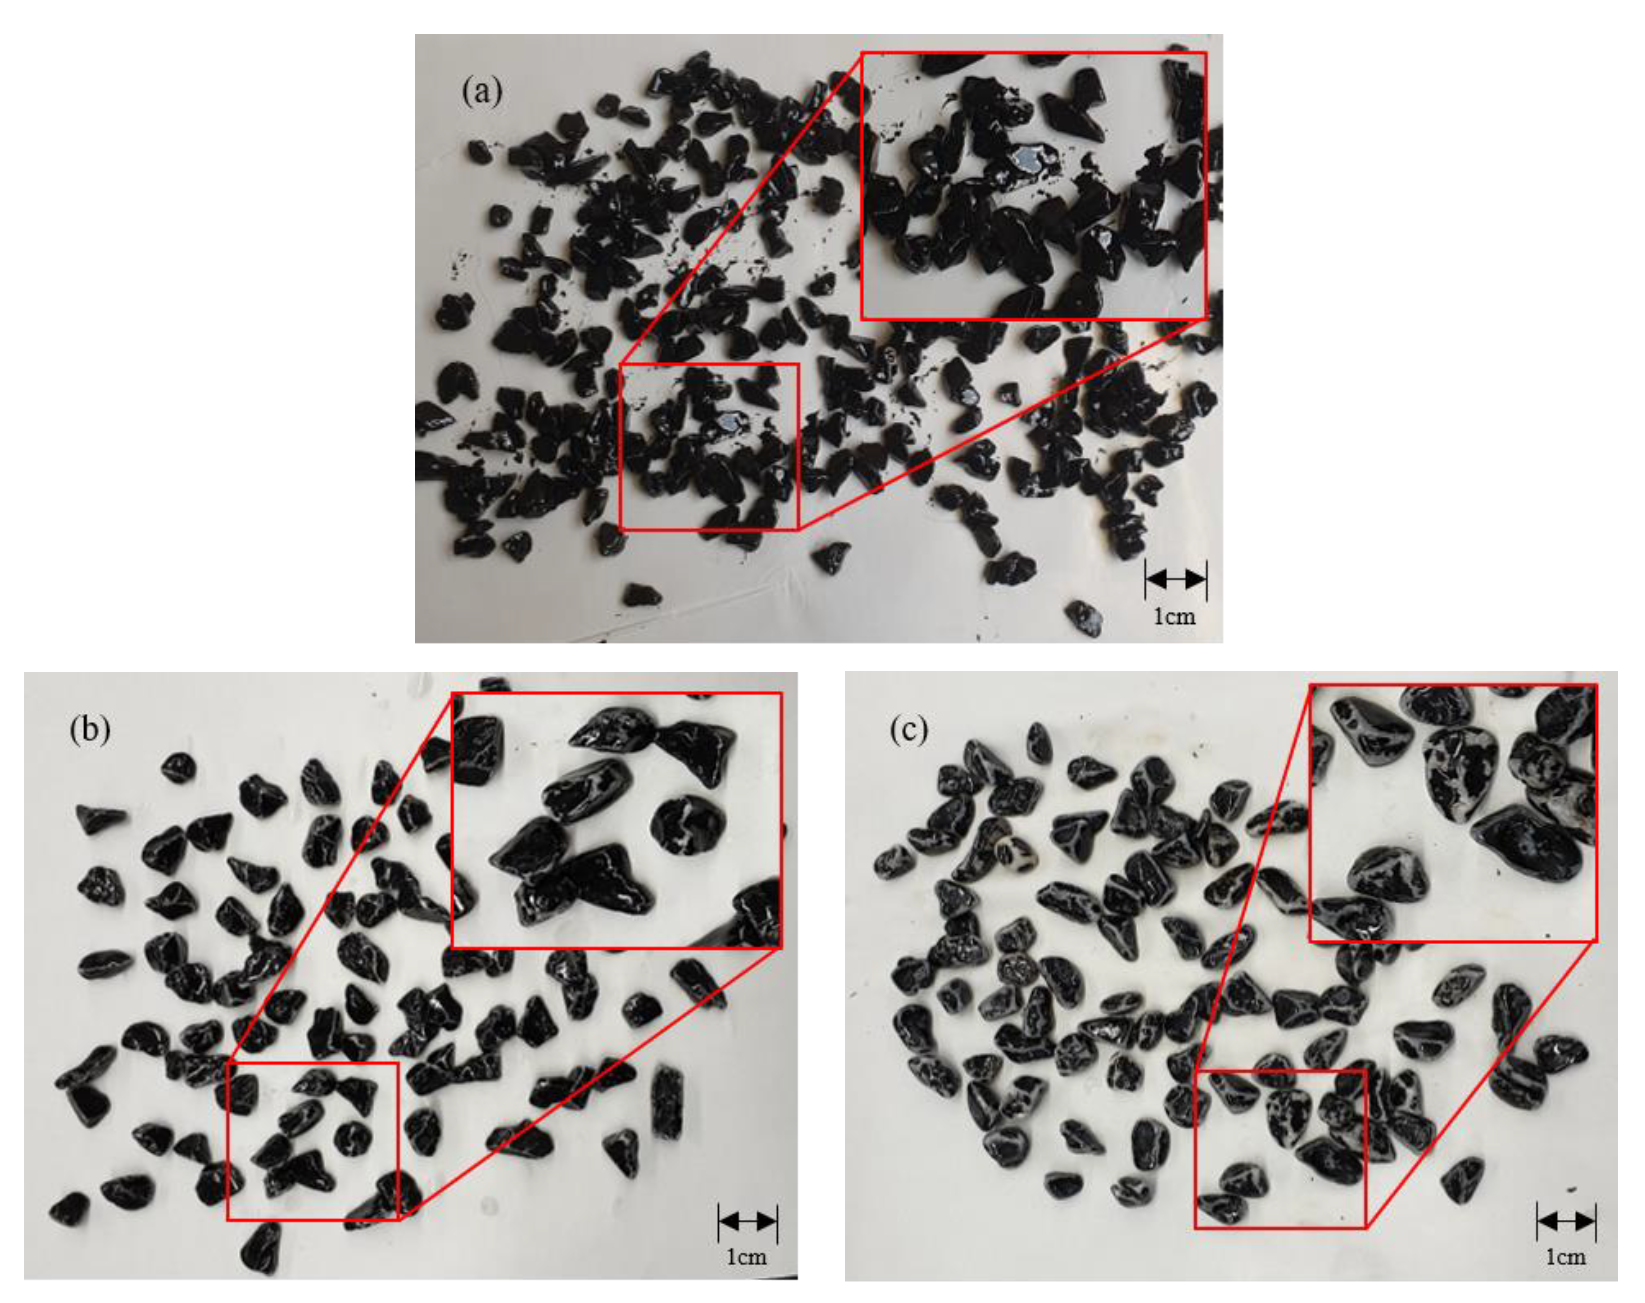
5.1. Aggregate Adhesion from the Rolling-Bottle Method

The performance of the limestone after 6 and 24 h of testing by the rolling-bottle method is shown in Figure 7. After the limestone was tested by the rolling-bottle method, the bitumen on the surface appeared to be significantly dislodged.
The bitumen coverage after the 6 h and 24 h rolling-bottle test is shown in Figure 8. The limestone exhibited the best adhesion to the asphalt. After the 6 h test, the coverage of the limestone was 87%, while that of the granodiorite was only 47%. After the 24 h test, the limestone still retained a 63% coverage, while the granodiorite retained only 17%. The interfacial adhesion of the limestone was better than that of the dolomite and granodiorite. The granodiorite showed the worst interfacial adhesion. The dolomite lay in the middle of the limestone and granodiorite in terms of performance. This was mainly due to the high content of calcareous oxides in the limestone and dolomite compared to the granodiorite. In addition, the large amount of SiO2 in the granodiorite led to insufficient interfacial adhesion with the bitumen.
Since the filler used in this study had the same chemical composition as the aggregate, and their particle sizes were the same, it may be supposed that the limestone filler had better adhesion to the bitumen compared to the dolomite and granodiorite. In the following, the adhesion of the three kinds of fillers to the bitumen is further investigated.

5.2. Interfacial Adhesion Evaluation Based on Rheology

Adding fillers to bitumen will significantly change the rheological properties of the asphalt mastic. Frequency scans using DSR can accurately describe the changes in the rheological properties of asphalt mastic. Figure 9 shows the complex modulus and phase angle master curves of the limestone, dolomite, and granodiorite asphalt mastics. The reference temperature was 20 °C. It can be seen from the main curve that it was difficult to distinguish the effect of the different types of fillers with the same doping amount on the asphalt mastic. Therefore, it was necessary to further work on the evaluation index.
Since the experimental sample of the granodiorite had a much higher specific surface area than the limestone and dolomite, as shown in Table 1, the direct rheological test results were influenced by the surface morphology of the fillers. Therefore, three modified interaction models were used to evaluate the effect of the chemical interaction on the adhesion, as shown in Equations (5)–(7).
The modified interaction results are shown in Figure 10. As mentioned before, a smaller Luis Ibrarra-A, higher K. Ziegel-B, and larger K-G-B indicate stronger interactions between the mineral filler and the bitumen. The modified results showed that the limestone interacted more strongly with the bitumen than the dolomite and granodiorite. Stronger interactions mean better adhesion. Dolomite adhered slightly less to the virgin bitumen than the limestone but much better than the granodiorite. This was primarily due to the large number of calcium oxides inside the dolomite and limestone [24]. All three model results showed the adhesion between the three kinds of fillers and bitumen in good detail. The following MD simulations will be further discussed from the molecular scale.

5.3. Interfacial Adhesion Evaluation Based on Molecular Dynamics

5.3.1. Binding Energy

For the interface between bitumen and mineral filler, the work of adhesion is a well-recognized evaluation value, which is defined as the work needed to separate the bitumen from the surface of the filler [47]. The work of adhesion can be obtained by calculating the interaction energy between the bitumen and filler. The value can be calculated through Equation (9). The work of the adhesion value means that additional energy is required to break the bond state between the bitumen and the mineral filler. The more considerable the absolute value of the work of adhesion is, the better the bonding state between bitumen and mineral filler, which means more energy is required to destroy the bonding state between them.
W adhesion = E inter _ aag A Interface = E bitumen + E filler E total A
where ∆Einter_aag is the interfacial binding energy between bitumen and filler; AInterface is the interfacial contact area; and Etotal, Ebitumen, and Efiller are the potential energy of the interface, bitumen, and filler, respectively. After the system reached equilibrium, the trajectories of the bitumen molecules in each interface model were extracted, and the potential energy was calculated and then averaged.
Figure 11 indicates the work of adhesion between the virgin bitumen and all eight types of oxides. Eight kinds of interfaces between the oxides and bitumen had significant differences in terms of the work of adhesion. The interface between the quartz and virgin bitumen had the lowest work of adhesion among the eight oxides. Similar results have been confirmed in another study [48]. In comparison, the work of adhesion of the TiO2–bitumen and CaO–bitumen systems had the highest values. The large discrepancy in the results indicated a huge difference in the adhesion ability between the different oxides [49].
Since the components of each kind of mineral filler were already clarified, the filler’s work of adhesion was considered as the weighted average of the individual components’ work of adhesion. The work of adhesion of the fillers can be calculated through Equation (10). According to the mineral composition of the filler, the work of adhesion of the different mineral fillers is demonstrated in Figure 12. The work of adhesion of “others” in the mineral composition table, which constituted a tiny part of the mineral composition, was taken as the average work of the adhesion value of the other eight oxides.
W adh _ Filler = A · W adh _ oxide
where Wadh_Filler is the work of adhesion of the filler; A is the assigned weight applied to each oxide component; and Wadh_oxide is the work of adhesion of each oxide–bitumen interface.
It can be seen from Figure 12 that the limestone had the highest work of adhesion compared to the dolomite and granodiorite. This means that more energy was needed to separate the limestone and virgin bitumen interface [50]. Therefore, the limestone filler had the best adhesion with the virgin bitumen among the three kinds of fillers. These results were mainly due to the high calcium oxide content in the limestone and dolomite and the high SiO2 content in the granodiorite. Due to the low work of adhesion between the SiO2 and the bitumen interface, the granodiorite had the worst adhesion with the bitumen.

5.3.2. Concentration Profile

As the energy minimization proceeded, the structure of the bitumen model changed continuously. To monitor the structural change, the concentration profiles of the bitumen layer before and after the adsorption over the mineral surface were computed. The concentration profile of the bitumen layer change indicated the absorption of bitumen over the mineral filler [22,51].
This study calculated the atomic density by projection parallel to the mineral surface. The atom density value is a dimensionless unit. The atom density of the bitumen in the z-direction is defined as the ratio of the actual number of atoms in the parallel projection to the number of atoms in the parallel projection when the atoms are equally dispersed throughout the system. For example, an atom density value of 3 means that there are three times as many atoms in the parallel projection, as all atoms are evenly distributed throughout the system. In order to facilitate the comparison of the different mineral fillers on the structure of the bitumen model, the starting point was moved to the surface of the mineral filler. Figure 13 depicts the adsorption configuration of the bitumen on the SiO2 surface in the initial and equilibrium states.
The grey dashed curve in Figure 13 represents the atom density distribution of the bulk bitumen in the initial state. At this time, the molecular density of the bitumen molecules model was still in a relatively uniform distribution state. The red solid curve shows the atomic density distribution of the bitumen molecules model after the equilibrium state. The bitumen atoms were significantly closer to the mineral filler’s surface after the equilibration than in the initial state. This was due to the adhesion behavior between the bitumen and the mineral filler. At the same time, the spacing of the distribution of the bitumen molecules model was reduced from 63.4 Å to 50.1 Å, which means that the bitumen molecules were more compact after the equilibrium in a limited space. More molecules were close to the filler surface. The change in the density of the bitumen molecular model was essentially due to the continuous change in the molecular structure within the bitumen. This is a complex process and is influenced by many factors, such as intermolecular van der Waals forces, etc. Studies have shown that minerals have different attraction capacities for different bitumen components. Among them, asphaltenes have the most robust polarity. Their concentration peaks are closer to the surface of the mineral components than those of resin, aromatics, or saturates [28,52].
As shown in Figure 14, the adsorption of each oxide to the bitumen varied greatly. For CaO and TiO2, there was a clear peak in atomic density within 5 Å. In contrast, the molecular density in the SiO2 interface model was much flatter. For Fe2O3 and SiO2, there was a transparent decreasing gradient away from the mineral fillers. There was a strong interaction between the oxide and bitumen, leading to the rearrangement of the bitumen molecules. The accumulation of bitumen molecules forming π–π bonds on the mineral surface also contributed to the peak atomic density [53].
The results showed that the CaO and TiO2, in combination with the other oxides made the aggregation and rotation of the bitumen molecules more significant. The Al2O3, MgO, and K2O had slightly weaker forces on the bitumen molecules. The interactions of the SiO2 and Fe2O3 with the bitumen were the weakest. There was a direct relationship between the strength of the interaction force of the oxides and bitumen molecules and the resulting adhesion [54]. The results were consistent with the respective adhesion work. It was therefore concluded that the concentration profile can be used as a qualitative method to evaluate the adhesion of bitumen and filler.

6. Conclusions and Outlook

The present study aimed to investigate the effect of chemical compositions on the adhesion between mineral aggregate/filler and bitumen. Limestone, dolomite, and granodiorite were tested by the rolling-bottle method. Then, MD models and three kinds of bitumen–filler interaction models (Luis Ibrarra-A, K. Ziegel-B, and the K-B-G parameter) were developed to further analyze the molecular and rheological properties. All in all, the following conclusions were drawn:
  • The limestone and dolomite aggregates and fillers had more significant interfacial interaction with the bitumen than the granodiorite.
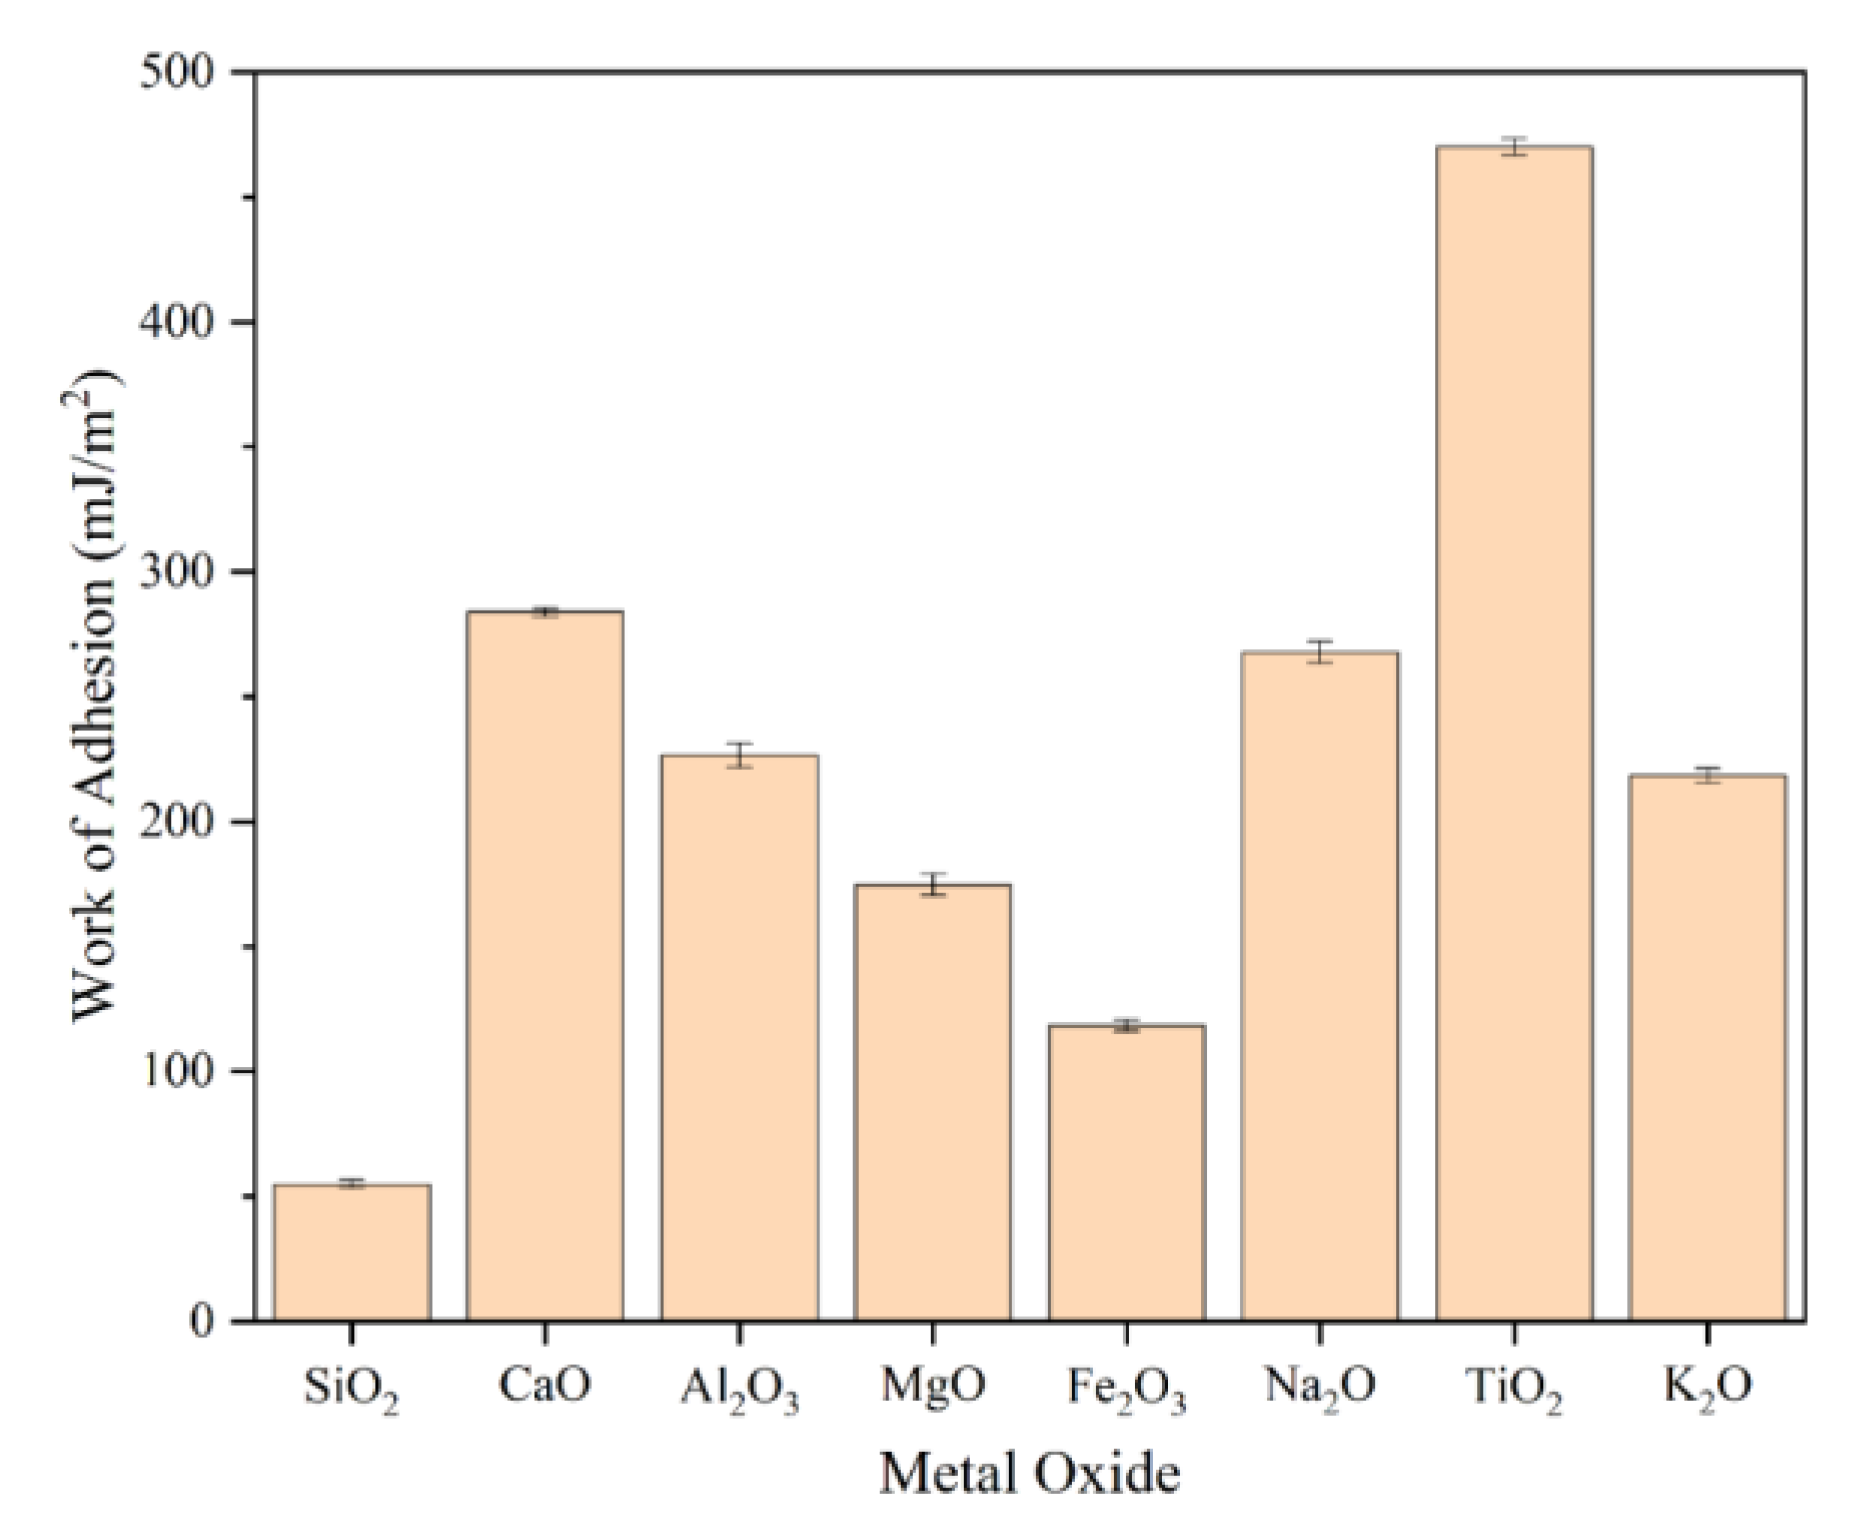
  • The titanium oxide and calcium oxide had the most robust adhesion to the bitumen in the filler compositions. Since the calcium oxide content within the limestone and dolomite far exceeded that of the titanium oxide, their adhesions were mainly attributed to their calcium oxide content. In addition, the SiO2 has the worst adhesion to the bitumen. The large amount of SiO2 within the granodiorite led to its poor adhesion to the bitumen.
  • The filler specific surface area cannot be neglected in the three interaction models. The modified parameter of the specific surface area per unit volume more effectively reflected the influence of the chemical composition of the mineral fillers on the adhesion.
This paper investigated the effect of aggregate/filler chemical components on adhesive properties. The study was thereby complicated by the close relation of this interaction to the aggregate and filler’s surface morphology and roughness. Therefore, the future study of filler morphology and roughness seems of great importance. In addition, the anisotropy caused by the fracturing of the filler surface needs to be further taken into account. Meanwhile, the structural characteristics of bitumen molecules on the surface of different filler components are still to be quantified in MD simulations, such as peak concentrations.

Author Contributions

Conceptualization, Z.F. and P.L.; methodology, Z.F. and P.L.; software, F.P. and H.Y.; validation, Z.F.; formal analysis, F.P.; investigation, F.P.; resources, S.L.; data curation, M.R. and G.C.F.; writing—original draft preparation, F.P.; writing—review and editing, H.Y. and P.L.; visualization, F.P.; supervision, P.L.; project administration, M.O. and P.L.; funding acquisition, H.Y., M.O. and P.L. All authors have read and agreed to the published version of the manuscript.

Funding

This research was funded by the Deutsche Forschungsgemeinschaft (DFG, German Research Foundation) OE 514/15-1 under grant number 459436571 and was supported by Guangdong Basic and Applied Basic Research Foundation under grant numbers 2022A1515011607 and 2023A1515030287.

Data Availability Statement

The data presented in this study are available on request from the authors.

Conflicts of Interest

The authors declare no conflict of interest.

References

  1. Wei, Z.; Jia, Y.; Wang, S.; Li, Z.; Li, Y.; Wang, X.; Gao, Y. Utilization of iron ore tailing as an alternative mineral filler in asphalt mastic: High-temperature performance and environmental aspects. J. Clean. Prod. 2021, 335, 130318. [Google Scholar] [CrossRef]
  2. Sahari Moghaddam, A.; Rezazadeh Azar, E.; Mejias, Y.; Bell, H. Estimating stripping of asphalt coating using k-means clustering and machine learning–based classification. J. Comput. Civ. Eng. 2020, 34, 04019044. [Google Scholar] [CrossRef]
  3. Cui, P.; Wu, S.; Xiao, Y.; Wang, F.; Wang, F. Quantitative evaluation of active based adhesion in Aggregate-Asphalt by digital image analysis. J. Adhes. Sci. Technol. 2019, 33, 1544–1557. [Google Scholar] [CrossRef]
  4. Caputo, P.; Miriello, D.; Bloise, A.; Baldino, N.; Mileti, O.; Ranieri, G.A. A comparison and correlation between bitumen adhesion evaluation test methods, boiling and contact angle tests. Int. J. Adhes. Adhes. 2020, 102, 102680. [Google Scholar] [CrossRef]
  5. Zaidi, S.B.A.; Grenfell, J.; Airey, G.; Ahmad, N.; Ahmed, I.; Fareed, A.; Abed, A. Application of image analysis tools in Matlab to better estimate the degree of binder coverage in rolling bottles test. Road Mater. Pavement Des. 2020, 23, 601–616. [Google Scholar] [CrossRef]
  6. Guo, M.; Tan, Y. Interaction between asphalt and mineral fillers and its correlation to mastics’ viscoelasticity. Int. J. Pavement Eng. 2021, 22, 1–10. [Google Scholar] [CrossRef]
  7. Zhang, H.; Li, H.; Abdelhady, A.; Xie, N.; Li, W.; Liu, J.; Liang, X.; Yang, B. Fine solid wastes as a resource-conserving filler and their influence on the performance of asphalt materials. J. Clean. Prod. 2020, 252, 119929. [Google Scholar] [CrossRef]
  8. Yalghouzaghaj, M.N.; Sarkar, A.; Hamedi, G.H.; Hayati, P. Application of the surface free energy method on the mechanism of low-temperature cracking of asphalt mixtures. Constr. Build. Mater. 2021, 268, 121194. [Google Scholar] [CrossRef]
  9. Guo, F.; Pei, J.; Zhang, J.; Xue, B.; Sun, G.; Li, R. Study on the adhesion property between asphalt binder and aggregate: A state-of-the-art review. Constr. Build. Mater. 2020, 256, 119474. [Google Scholar] [CrossRef]
  10. Kataware, A.V.; Singh, D. Dynamic mechanical analysis of crumb rubber modified asphalt binder containing warm mix additives. Int. J. Pavement Eng. 2019, 20, 1044–1054. [Google Scholar] [CrossRef]
  11. Liu, P.; Lu, G.; Yang, X.; Jin, C.; Leischner, S.; Oeser, M. Influence of Different Fillers on Mechanical Properties of Porous Asphalt Mixtures Using Microstructural Finite-Element Analysis. J. Transp. Eng. Part B Pavements 2021, 147, 04021004. [Google Scholar] [CrossRef]
  12. Tan, Y.; Guo, M. Micro-and nano-characteration of interaction between asphalt and filler. J. Test. Eval. 2014, 42, 1089–1097. [Google Scholar] [CrossRef]
  13. Yuan, Y.; Zhu, X.; Chen, L. Relationship among cohesion, adhesion, and bond strength: From multi-scale investigation of asphalt-based composites subjected to laboratory-simulated aging. Mater. Des. 2020, 185, 108272. [Google Scholar] [CrossRef]
  14. Du, Z.; Zhu, X.; Yuan, Y. Molecular investigation on the adhesion and deformation behaviors of asphalt binder under nanoindentation. Constr. Build. Mater. 2021, 295, 123683. [Google Scholar] [CrossRef]
  15. Wu, W.; Jiang, W.; Yuan, D.; Lu, R.; Shan, J.; Xiao, J.; Ogbon, A.W. A review of asphalt-filler interaction: Mechanisms, evaluation methods, and influencing factors. Constr. Build. Mater. 2021, 299, 124279. [Google Scholar] [CrossRef]
  16. Zhang, Z.; Liu, P.; Rochlani, M.; Falla, G.C.; Leischner, S.; Oeser, M. A fuzzy comprehensive evaluation method to select the optimal mineral filler for optimization of the performance of asphalt mastics. Constr. Build. Mater. 2021, 298, 123847. [Google Scholar] [CrossRef]
  17. Liu, G.; Zhao, Y.; Zhou, J.; Li, J.; Yang, T.; Zhang, J. Applicability of evaluation indices for asphalt and filler interaction ability. Constr. Build. Mater. 2017, 148, 599–609. [Google Scholar] [CrossRef]
  18. Ziegel, K.; Romanov, A. Modulus reinforcement in elastomer composites. I. Inorganic fillers. J. Appl. Polym. Sci. 1973, 17, 1119–1131. [Google Scholar] [CrossRef]
  19. Rochlani, M.; Canon Falla, G.; Wellner, F.; Wang, D.; Fan, Z.; Leischner, S. Feasibility study of waste ceramic powder as a filler alternative for asphalt mastics using the DSR. Road Mater. Pavement Des. 2021, 22, 2591–2603. [Google Scholar] [CrossRef]
  20. Sun, W.; Wang, H. Moisture effect on nanostructure and adhesion energy of asphalt on aggregate surface: A molecular dynamics study. Appl. Surf. Sci. 2020, 510, 145435. [Google Scholar] [CrossRef]
  21. Long, Z.; You, L.; Tang, X.; Ma, W.; Ding, Y.; Xu, F. Analysis of interfacial adhesion properties of nano-silica modified asphalt mixtures using molecular dynamics simulation. Constr. Build. Mater. 2020, 255, 119354. [Google Scholar] [CrossRef]
  22. Sun, D.; Sun, G.; Zhu, X.; Ye, F.; Xu, J. Intrinsic temperature sensitive self-healing character of asphalt binders based on molecular dynamics simulations. Fuel 2018, 211, 609–620. [Google Scholar] [CrossRef]
  23. Liu, J.; Yu, B.; Hong, Q. Molecular dynamics simulation of distribution and adhesion of asphalt components on steel slag. Constr. Build. Mater. 2020, 255, 119332. [Google Scholar] [CrossRef]
  24. Fan, Z.; Lin, J.; Chen, Z.; Liu, P.; Wang, D.; Oeser, M. Multiscale understanding of interfacial behavior between bitumen and aggregate: From the aggregate mineralogical genome aspect. Constr. Build. Mater. 2021, 271, 121607. [Google Scholar] [CrossRef]
  25. Cui, B.; Gu, X.; Hu, D.; Dong, Q. A multiphysics evaluation of the rejuvenator effects on aged asphalt using molecular dynamics simulations. J. Clean. Prod. 2020, 259, 120629. [Google Scholar] [CrossRef]
  26. Fini, E.H.; Samieadel, A.; Rajib, A. Moisture damage and its relation to surface adsorption/desorption of rejuvenators. Ind. Eng. Chem. Res. 2020, 59, 13414–13419. [Google Scholar] [CrossRef]
  27. Guo, M.; Liang, M.; Fu, Y.; Sreeram, A.; Bhasin, A. Average molecular structure models of unaged asphalt binder fractions. Mater. Struct. 2021, 54, 173. [Google Scholar] [CrossRef]
  28. Guo, M.; Tan, Y.; Wei, J. Using molecular dynamics simulation to study concentration distribution of asphalt binder on aggregate surface. J. Mater. Civ. Eng. 2018, 30, 04018075. [Google Scholar] [CrossRef]
  29. Rochlani, M.; Leischner, S.; Falla, G.C.; Wang, D.; Caro, S.; Wellner, F. Influence of filler properties on the rheological, cryogenic, fatigue and rutting performance of mastics. Constr. Build. Mater. 2019, 227, 116974. [Google Scholar] [CrossRef]
  30. Forschungs Gesellschaft für Straßen-und Verkehrswesen. TL Asphalt-StB 07. In Technische Lieferbedingungen für Asphaltmischgut für den Bau von Verkehrsflächenbefestigungen; Forschungs Gesellschaft für Straßen-und Verkehrswesen: Köln, Germany, 2007. [Google Scholar]
  31. DIN EN 12697-11; Asphalt-Prüfverfahren für Heiß asphalt–Teil 11: Bestimmung der Affinität von Gesteinskörnungen und Bitumen. Beuth Verlag: Berlin, Germany, 2012.
  32. Li, F.; Yang, Y.; Wang, L. The interfacial interaction between asphalt binder and mineral filler: A comprehensive review on mechanisms, evaluation methods and influence factors. Int. J. Pavement Eng. 2021. [Google Scholar] [CrossRef]
  33. Fang, C.; Guo, N.; You, Z.; Tan, Y. Investigating fatigue life prediction of rubber asphalt mixture based on damage evolution using residual strain analysis approach. Constr. Build. Mater. 2020, 257, 119476. [Google Scholar] [CrossRef]
  34. Guo, M.; Tan, Y.; Hou, Y.; Wang, L.; Wang, Y. Improvement of evaluation indicator of interfacial interaction between asphalt binder and mineral fillers. Constr. Build. Mater. 2017, 151, 236–245. [Google Scholar] [CrossRef]
  35. Xing, B.; Du, Y.; Fang, C.; Sun, H.; Lyu, Y.; Fan, W. Particle morphology of mineral filler and its effects on the asphalt binder-filler interfacial interaction. Constr. Build. Mater. 2022, 321, 126292. [Google Scholar] [CrossRef]
  36. Wang, F.; Xiao, Y.; Chen, Z.; Cui, P.; Liu, J.; Wang, N. Morphological characteristics of mineral filler and their influence on active adhesion between aggregates and bitumen. Constr. Build. Mater. 2022, 323, 126520. [Google Scholar] [CrossRef]
  37. Mukhtar, N.; Hasan, M.R.M.; Shariff, K.A.; Van Den Bergh, W. Relationship between the physicochemical and electrostatic charge characteristics of filler materials on the morphological and adhesive Pull-Off tensile strength of asphalt mastics. Constr. Build. Mater. 2022, 346, 128343. [Google Scholar] [CrossRef]
  38. Martinho, F.C.; Farinha, J.P.S. An overview of the use of nanoclay modified bitumen in asphalt mixtures for enhanced flexible pavement performances. Road Mater. Pavement Des. 2019, 20, 671–701. [Google Scholar] [CrossRef]
  39. Ding, Y.; Huang, B.; Shu, X. Investigation of functional group distribution of asphalt using liquid chromatography transform and prediction of molecular model. Fuel 2018, 227, 300–306. [Google Scholar] [CrossRef]
  40. Artok, L.; Su, Y.; Hirose, Y.; Hosokawa, M.; Murata, S.; Nomura, M. Structure and reactivity of petroleum-derived asphaltene. Energy Fuels 1999, 13, 287–296. [Google Scholar] [CrossRef]
  41. Yao, H.; Dai, Q.; You, Z.; Bick, A.; Wang, M. Modulus simulation of asphalt binder models using Molecular Dynamics (MD) method. Constr. Build. Mater. 2018, 162, 430–441. [Google Scholar] [CrossRef]
  42. Chu, L.; Luo, L.; Fwa, T. Effects of aggregate mineral surface anisotropy on asphalt-aggregate interfacial bonding using molecular dynamics (MD) simulation. Constr. Build. Mater. 2019, 225, 1–12. [Google Scholar] [CrossRef]
  43. Li, D.D.; Greenfield, M.L. Chemical compositions of improved model asphalt systems for molecular simulations. Fuel 2014, 115, 347–356. [Google Scholar] [CrossRef]
  44. Guo, F.; Zhang, J.; Pei, J.; Ma, W.; Hu, Z.; Guan, Y. Evaluation of the compatibility between rubber and asphalt based on molecular dynamics simulation. Front. Struct. Civ. Eng. 2020, 14, 435–445. [Google Scholar] [CrossRef]
  45. Ren, S.; Liu, X.; Lin, P.; Erkens, S.; Xiao, Y. Chemo-physical characterization and molecular dynamics simulation of long-term aging behaviors of bitumen. Constr. Build. Mater. 2021, 302, 124437. [Google Scholar] [CrossRef]
  46. Ren, S.; Liu, X.; Zhang, Y.; Lin, P.; Apostolidis, P.; Erkens, S.; Li, M.; Xu, J. Multi-scale characterization of lignin modified bitumen using experimental and molecular dynamics simulation methods. Constr. Build. Mater. 2021, 287, 123058. [Google Scholar] [CrossRef]
  47. Suárez-Villagrán, M.Y.; Botari, T.; Miller Jr, J.H.; Machado, L.D. Prediction of strain-controlled adhesion in a single-layer covalent organic framework. Carbon 2019, 143, 172–178. [Google Scholar] [CrossRef]
  48. Du, Z.; Zhu, X. Molecular dynamics simulation to investigate the adhesion and diffusion of asphalt binder on aggregate surfaces. Transp. Res. Rec. 2019, 2673, 500–512. [Google Scholar] [CrossRef]
  49. Cui, B.; Gu, X.; Wang, H.; Hu, D. Numerical and experimental evaluation of adhesion properties of asphalt-aggregate interfaces using molecular dynamics simulation and atomic force microscopy. Road Mater. Pavement Des. 2022, 23, 1564–1584. [Google Scholar] [CrossRef]
  50. Tadmor, R.; Das, R.; Gulec, S.; Liu, J.; N’guessan, H.E.; Shah, M.; Wasnik, P.S.; Yadav, S.B. Solid–liquid work of adhesion. Langmuir 2017, 33, 3594–3600. [Google Scholar] [CrossRef] [PubMed]
  51. Li, F.; Yang, Y. Understanding the temperature and loading frequency effects on physicochemical interaction ability between mineral filler and asphalt binder using molecular dynamic simulation and rheological experiments. Constr. Build. Mater. 2020, 244, 118311. [Google Scholar] [CrossRef]
  52. Ahmadi, M.; Chen, Z. Insight into the interfacial behavior of surfactants and asphaltenes: Molecular dynamics simulation study. Energy Fuels 2020, 34, 13536–13551. [Google Scholar] [CrossRef]
  53. Chen, Z.; Li, Y.; Chen, C.; Sun, X.; Liu, W. Aggregation Behavior of Asphalt on the Natural Gas Hydrate Surface with Different Surfactant Coverages. J. Phys. Chem. C 2021, 125, 16378–16390. [Google Scholar] [CrossRef]
  54. Fan, Z. Multiscale Study of the Bitumen–Aggregate Interfacial Behavior Based on Molecular Dynamics Simulation and Micromechanics. Ph.D. Dissertation, Rheinisch-Westfälische Technische Hochschule Aachen, Aachen, Germany, 2021. [Google Scholar]
Figure 1. Research flowchart.
Buildings 13 01207 g001
Figure 2. The rolling-bottle machine and samples.
Buildings 13 01207 g002
Figure 3. The dynamic shear rheometer (DSR).
Buildings 13 01207 g003
Figure 4. The 12-component model of virgin bitumen.
Buildings 13 01207 g004
Figure 5. Stabilized model of virgin bitumen.
Buildings 13 01207 g005
Figure 6. Interface of bitumen and quartz.
Buildings 13 01207 g006
Figure 7. The limestone (a) after rolling for 0 h, (b) 6 h, and (c) 24 h in the bottle.
Buildings 13 01207 g007
Figure 8. The coverage of three kinds of aggregates after the rolling-bottle test.
Buildings 13 01207 g008
Figure 9. Three asphalt mastic master curves: (a) complex modulus; and (b) phase angle.
Buildings 13 01207 g009
Figure 10. The modified bitumen–filler interaction parameters.
Buildings 13 01207 g010
Figure 11. The work of adhesion between virgin bitumen and eight kinds of components of fillers.
Buildings 13 01207 g011
Figure 12. The work of adhesion of different mineral fillers.
Buildings 13 01207 g012
Figure 13. Adsorption configuration of bitumen on SiO2 surface: (a) initial tate; and (b) equilibrated State.
Buildings 13 01207 g013
Figure 14. Adsorption configuration of bitumen on the oxide surface.
Buildings 13 01207 g014
Table 1. Physical properties of the fillers.
FillerSpecific Surface Area (m2/g)Pore Volume (mL/g)Average Pore Size (nm)Density (g/cm3)
Limestone4.19040.016816.042.72
Dolomite6.42820.020212.572.85
Granodiorite18.46650.04118.92.74
Table 2. Oxide composition of the fillers investigated in (%).
Filler NameNa2OMgOAl2O3SiO2K2OCaOTiO2Fe2O3Others
Limestone0.182.021.291.940.1992.970.120.820.46
Dolomite0.2726.022.265.230.6161.970.071.911.60
Granodiorite3.222.4418.0961.703.422.731.046.350.58
Table 3. Detailed compositions of the virgin 12-component bitumen model.
Molecular ComponentsMolecular FormulaNo. of MoleculesMolecular Mass (g/mol)Mass Ratio (%)
SqualaneC30H624422.85.2
HopaneC35H624482.95.9
PHPNC35H4411464.715.7
DOCHNC30H4613406.716.2
QuinolinohopaneC40H59N4553.96.8
ThioisorenierataneC40H60S4573.07.0
TrimethylbenzeneoxaneC29H50O5414.76.4
PvridinohopaneC36H57N4503.96.2
BenzobisbenzothiopheneC18H10S215290.413.4
Asphaltene-phenolC42H54O3574.95.3
Asphaltene-pyrroleC66H81N2888.45.5
Asphaltene-thiopheneC51H62S3707.16.5
Table 4. Comparison of solubility.
Simulation ResultReference ResultError
Solubility (J/cm3)0.517.72018.236 [44]2.8%
18.33 [45]3.4%
18.32 [46]3.4%
Disclaimer/Publisher’s Note: The statements, opinions and data contained in all publications are solely those of the individual author(s) and contributor(s) and not of MDPI and/or the editor(s). MDPI and/or the editor(s) disclaim responsibility for any injury to people or property resulting from any ideas, methods, instructions or products referred to in the content.

