1. Introduction
Heating and cooling account for a significant proportion of energy use in buildings (e.g., 50% in the USA [
1,
2]). These high energy costs could be reduced by using ventilation strategies that use naturally occurring wind and buoyancy forces to drive flows [
3,
4]. However, people have become accustomed to well-controlled indoor conditions, which are difficult to achieve when ventilation is strongly affected by outdoor conditions.
In hot and humid climates, such as Indonesia and other countries in Southeast Asia, natural ventilation plays an important role in controlling indoor air quality and temperature. It also prevents the risk of occupants overheating [
5,
6]. Natural ventilation in the built environment can improve thermal comfort in indoor and outdoor spaces, resulting in lower energy consumption and greenhouse gas emissions in the tropics [
7]. Therefore, natural ventilation can save the energy consumed by the heating, mechanical ventilation, and air-conditioning systems in a building if it provides acceptable indoor air quality and thermal comfort levels. Enhanced indoor airflow can promote adequate thermal comfort, suggesting incorporating mechanical and natural ventilation to overcome the limitations of natural ventilation [
8].
A facade is the part of a building that forms the primary thermal barrier with its environment. It represents the most crucial factor for determining thermal comfort, daylighting and ventilation level and the amount of energy required to heat and cool the environment [
9,
10,
11]. In the case of high-rise buildings, the location of windows, elevation and opening area affected the natural ventilation performance [
10,
12], along with air temperature and wind speed [
8]. The positions of window openings are important parameters for analysing the effectiveness of wind-driven cross-ventilation in buildings [
13,
14,
15]. The impact of opening placement is not immediately apparent due to the complexity of position arrangement. For wind-driven single-sided ventilation (SSV), the vertical location of the opening substantially affects the ventilation rate, and the ventilation rate decreases as the opening increases, owing to the pressure reduction along the height [
16]. In SSVs with many openings on one side, the relative horizontal position between openings, referred to as opening separation, will impact the SSV ventilation rate. It has been discovered that a big opening separation may increase the ventilation rate in small and medium-sized structures, particularly in windward or leeward ventilation [
17,
18].
The orientation of an opening in respect to the direction of the wind influences indoor ventilation. When a single-sided ventilated building is constructed, improved indoor ventilation performance can be attained by placing an opening on the windward side rather than the leeward side of the structure. Wind incident in the perpendicular direction (0°) or on the windward side performs better than the opening of an SSV room on the leeward side of the building [
19]. However, this occurred at a certain wind speed. It was found that the lower level of the building at the leeward side had high wind speed due to the generated turbulence between the building and the vertical wall; therefore, opening the leeward window at the lower level will enhance ventilation. In another study, it is shown that single-sided ventilation performs better in cases with a lateral (90°) and a leeward opening (180°) than with a windward opening (0°) [
20,
21]. Operable windows or air outlets on the leeward side of the building are as important as those on the windward side [
22].
Previously we have studied the natural ventilation condition of a few apartment units across Jakarta by conducting field test measurements [
23]. Statistical analysis suggested that external weather conditions influence indoor temperature, relative humidity, and airflow velocity, ultimately affecting indoor thermal comfort. The ever-varying outdoor wind speed and direction resulted in different indoor airflow in another unit. Thus, the window position towards the wind is important to study. This research investigated the influence of window position to wind direction on indoor airflow. We described the simulation setup and discussed the validity of the setup in
Section 2.
Section 3 presents the results of the simulation results. We present our discussion in
Section 4 and the study’s conclusion in
Section 5.
2. Materials and Methods
This study employed Computational Fluid Dynamics (CFD) as a tool to simulate the outdoor and indoor air movement for the buildings due to its flexibility, cost-effectiveness, and ability to provide complex data. This section covers the case study and the simulation setup employed for the CFD simulation.
2.1. Description of the Case Study and the Climate Data
This study was performed in Jakarta, the capital city of Indonesia, where most high-rise buildings are situated. According to the Koppen climate classification [
24,
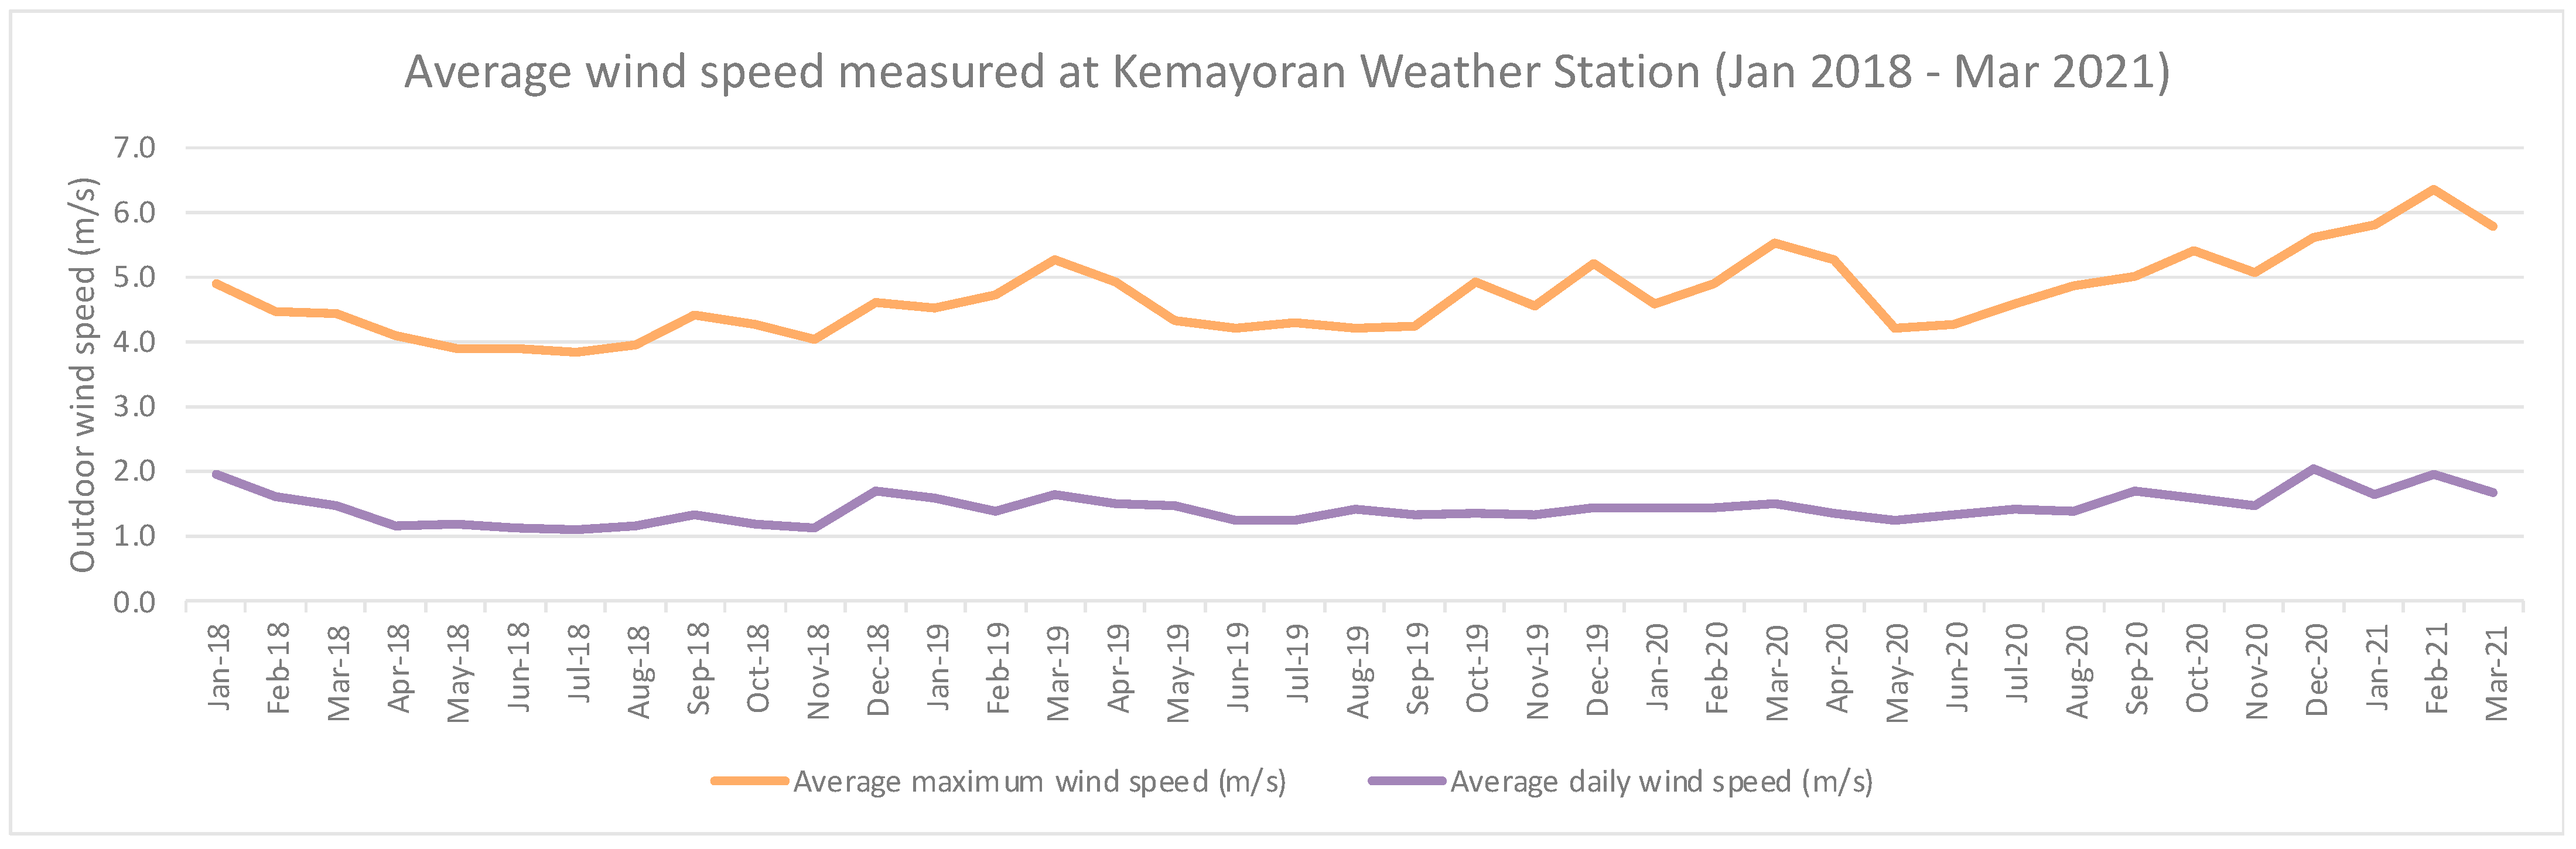
25], Jakarta is categorised as Af or tropical rainforest climate, with a minimum temperature of 18 °C. Over the last three years, the average minimum, maximum, and monthly temperatures were 25.8°, 32.3° and 28.6°, respectively. The outside relative humidity was high, ranging from 68% to almost 85%. The average daily wind speed was 1.4 m/s, with the mean maximum wind speed being 4.7 m/s. The data over the last three years had a low standard deviation, which means the data clustered around the mean. This suggested that over the year, the outside temperature in Jakarta was stagnant or did not fluctuate much (
Figure 1). A similar trend also occurred in the outdoor wind speed (
Figure 2). This suggested that the weather conditions of Jakarta does not differ much all year long. Therefore, conducting research at any time during the year can yield similar results.
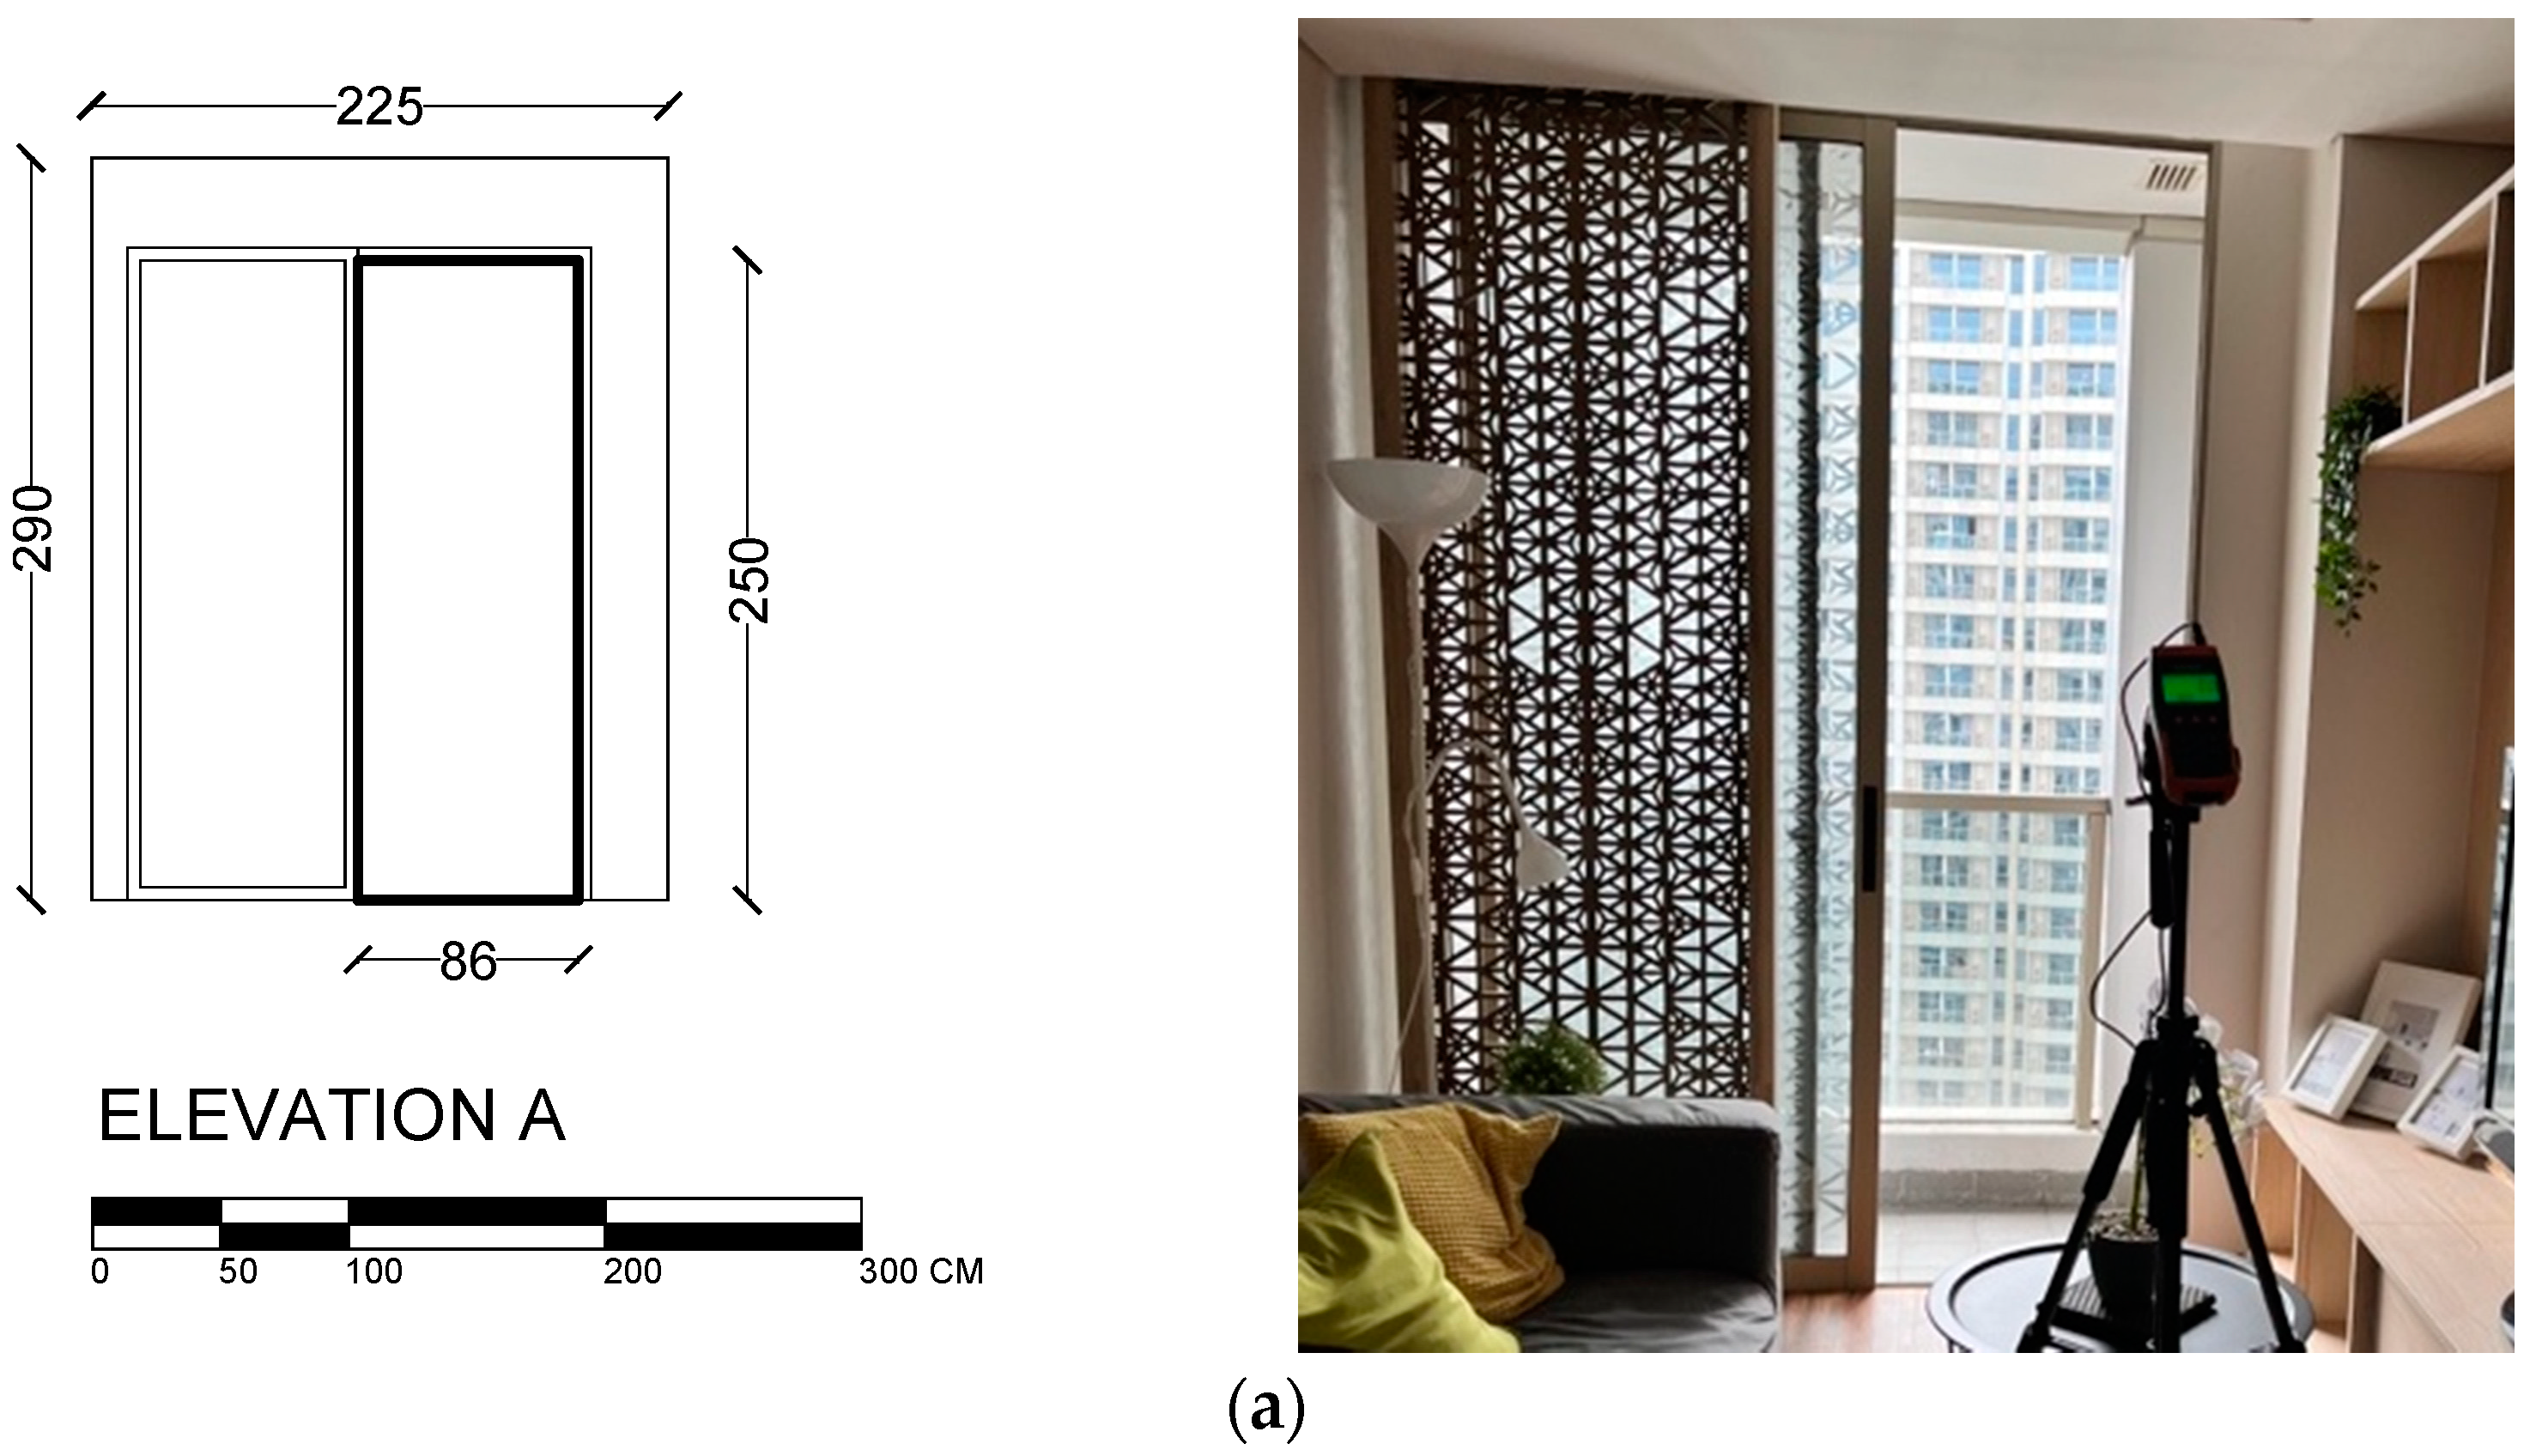
The selected case in this study is a high-rise residential building in West Jakarta named Taman Anggrek Residence. It is located among high-rise buildings and surrounded by lower-rise settlements (
Figure 3a). The apartment unit of Taman Anggrek Residence was on the 38th floor at 120 m high with a typical floor plan in a double-loaded corridor configuration (
Figure 3b). The selected apartment was a two-bedroom apartment in the corner with one living dining kitchen (LDK) area, two bedrooms, one bathroom and a balcony. The corner location allowed more facade exposure to the outdoors.
Figure 3c illustrates the room simulated in this research: the living room and the master bedroom. A sliding door to the balcony configures Opening A (
Figure 4a) in the living room, and the opening area corresponds to the 14.2% of the gross living floor and 32.9% of the window-to-wall ratio. The master bedroom has two window openings, Opening B (
Figure 4b) and Opening C (
Figure 4c); both have similar opening sizes, 140 cm high and 70 cm wide, and the total of both openings corresponds to 21.5% of the gross living floor and 12.2% of the window-to-wall ratio. Opening A and B are both facing south, and Opening C is perpendicular to the other openings, facing west.
Previously, we measured the indoor airflow, temperature, and relative humidity at point 1 in the living room and Point 2 in the bedroom, which will be the reference point as the baseline or existing condition. We used the Extech SDL310 thermo-anemometer data logger and Extech 42270 temperature and humidity data logger in each point to record indoor airflow, temperature, and relative humidity. The instruments were set 150 m from the floor and the measurements were recorded for 3 days with 1 min intervals.
2.2. CFD Simulation Setup
In this paper, the Navier–Stokes equations are coupled with the standard k-turbulence (SKE) model in the case of incompressible steady-state fluid flow using the COMSOL Multiphysics software package. This research employed the CFD module COMSOL Multiphysics as a tool to simulate the airflow pattern inside the building. COMSOL Multiphysics used the Finite Element Method (FEM) to solve a partial differential equation. Moreover, CFD simulation using software that employed the Finite Volume Method (FVM) to solve the PDE was more popular in the literature.
A study by Molina-Aiz, F.D. et al. [
26], compared CFD simulation using FEM software and FVM with similar governing equations using a greenhouse as an object to study natural ventilation. In terms of predicting temperature, FEM simulated more accurate temperature distribution than FVM, while in simulating airflow patterns, FEM provided better airflow descriptions than FVM. Although in some cases, FVM predicted better airflow patterns than the experimental results. Moreover, FEM allowed easier meshing than FVM for complex geometries. Although, the FEM must carefully formulate the mesh type, quality, and number of mesh elements, it is much more stable than the FVM approach [
27]. The drawback of FEM is that, on average, it requires two to five times the computing time per cell and step and approximately two times larger memory storage than FVM [
27,
28].
We ran the CFD using stationary solver settings and utilized the parametric sweep function to save computational time, where the following simulation can use the solution of the previous parameter simulation results. Pseudo time-stepping, following the default settings, was used in transport problems to stabilize the convergence toward steady state.
2.2.1. Computational Domain
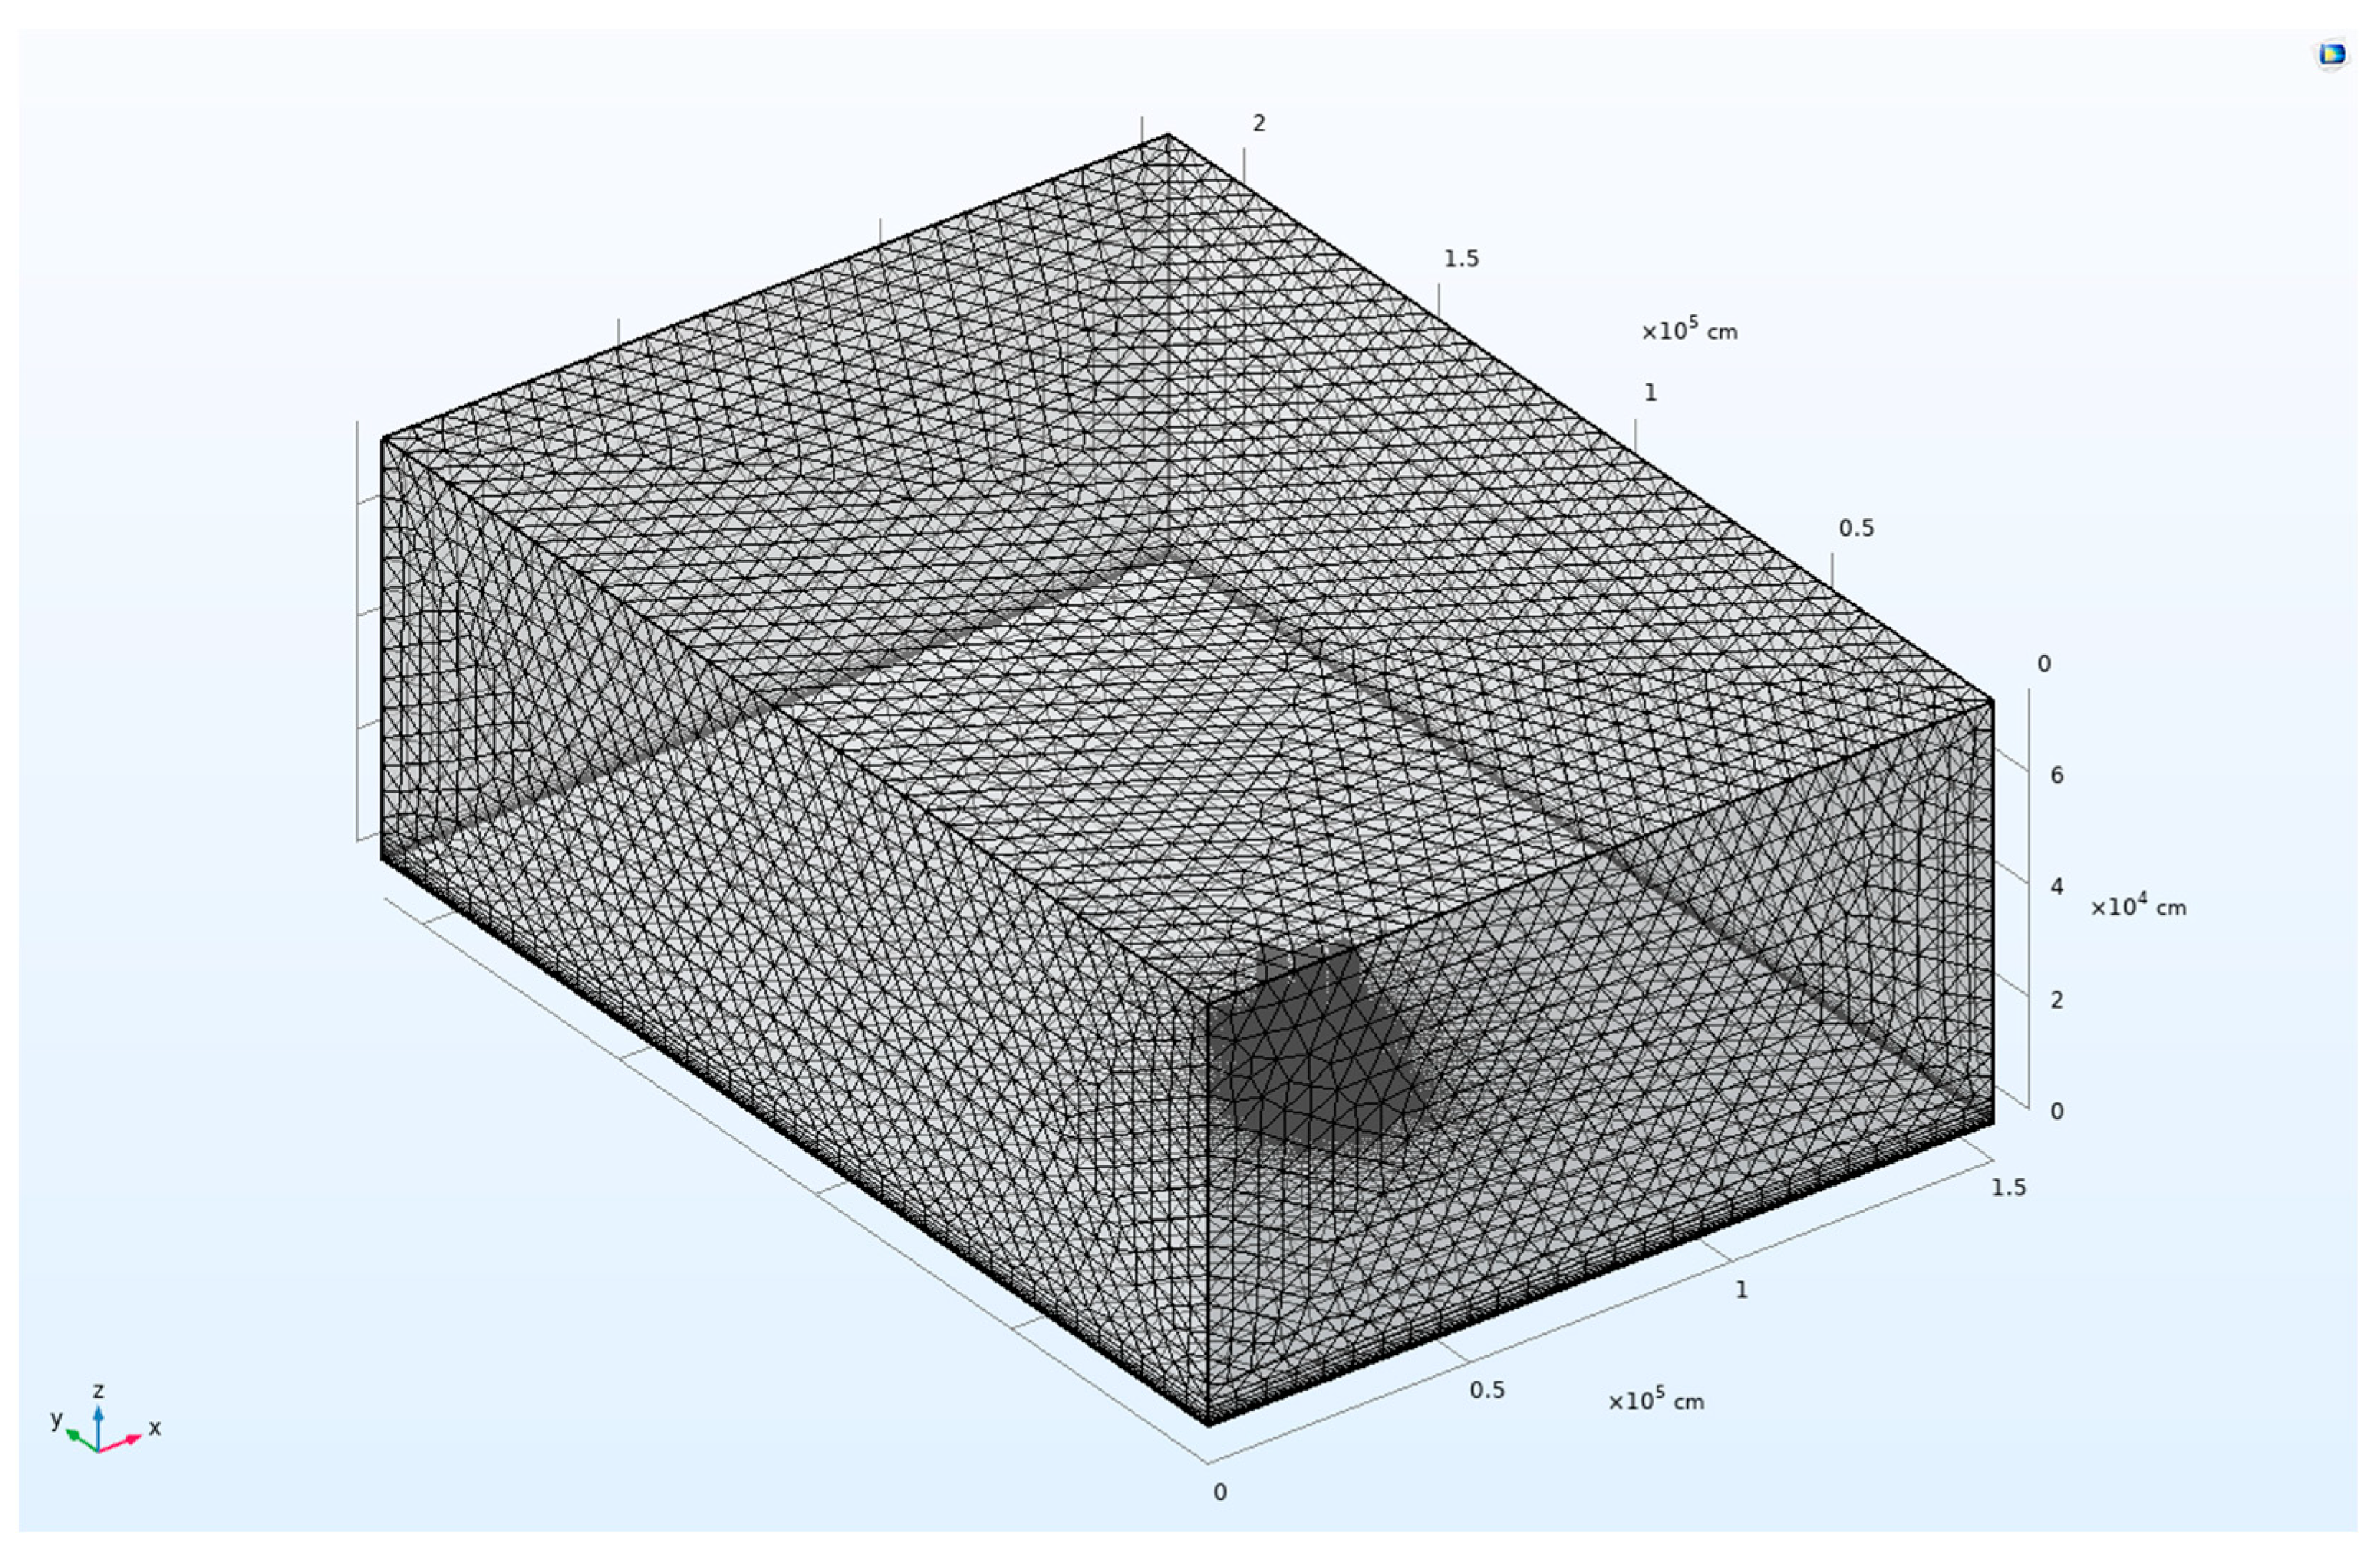
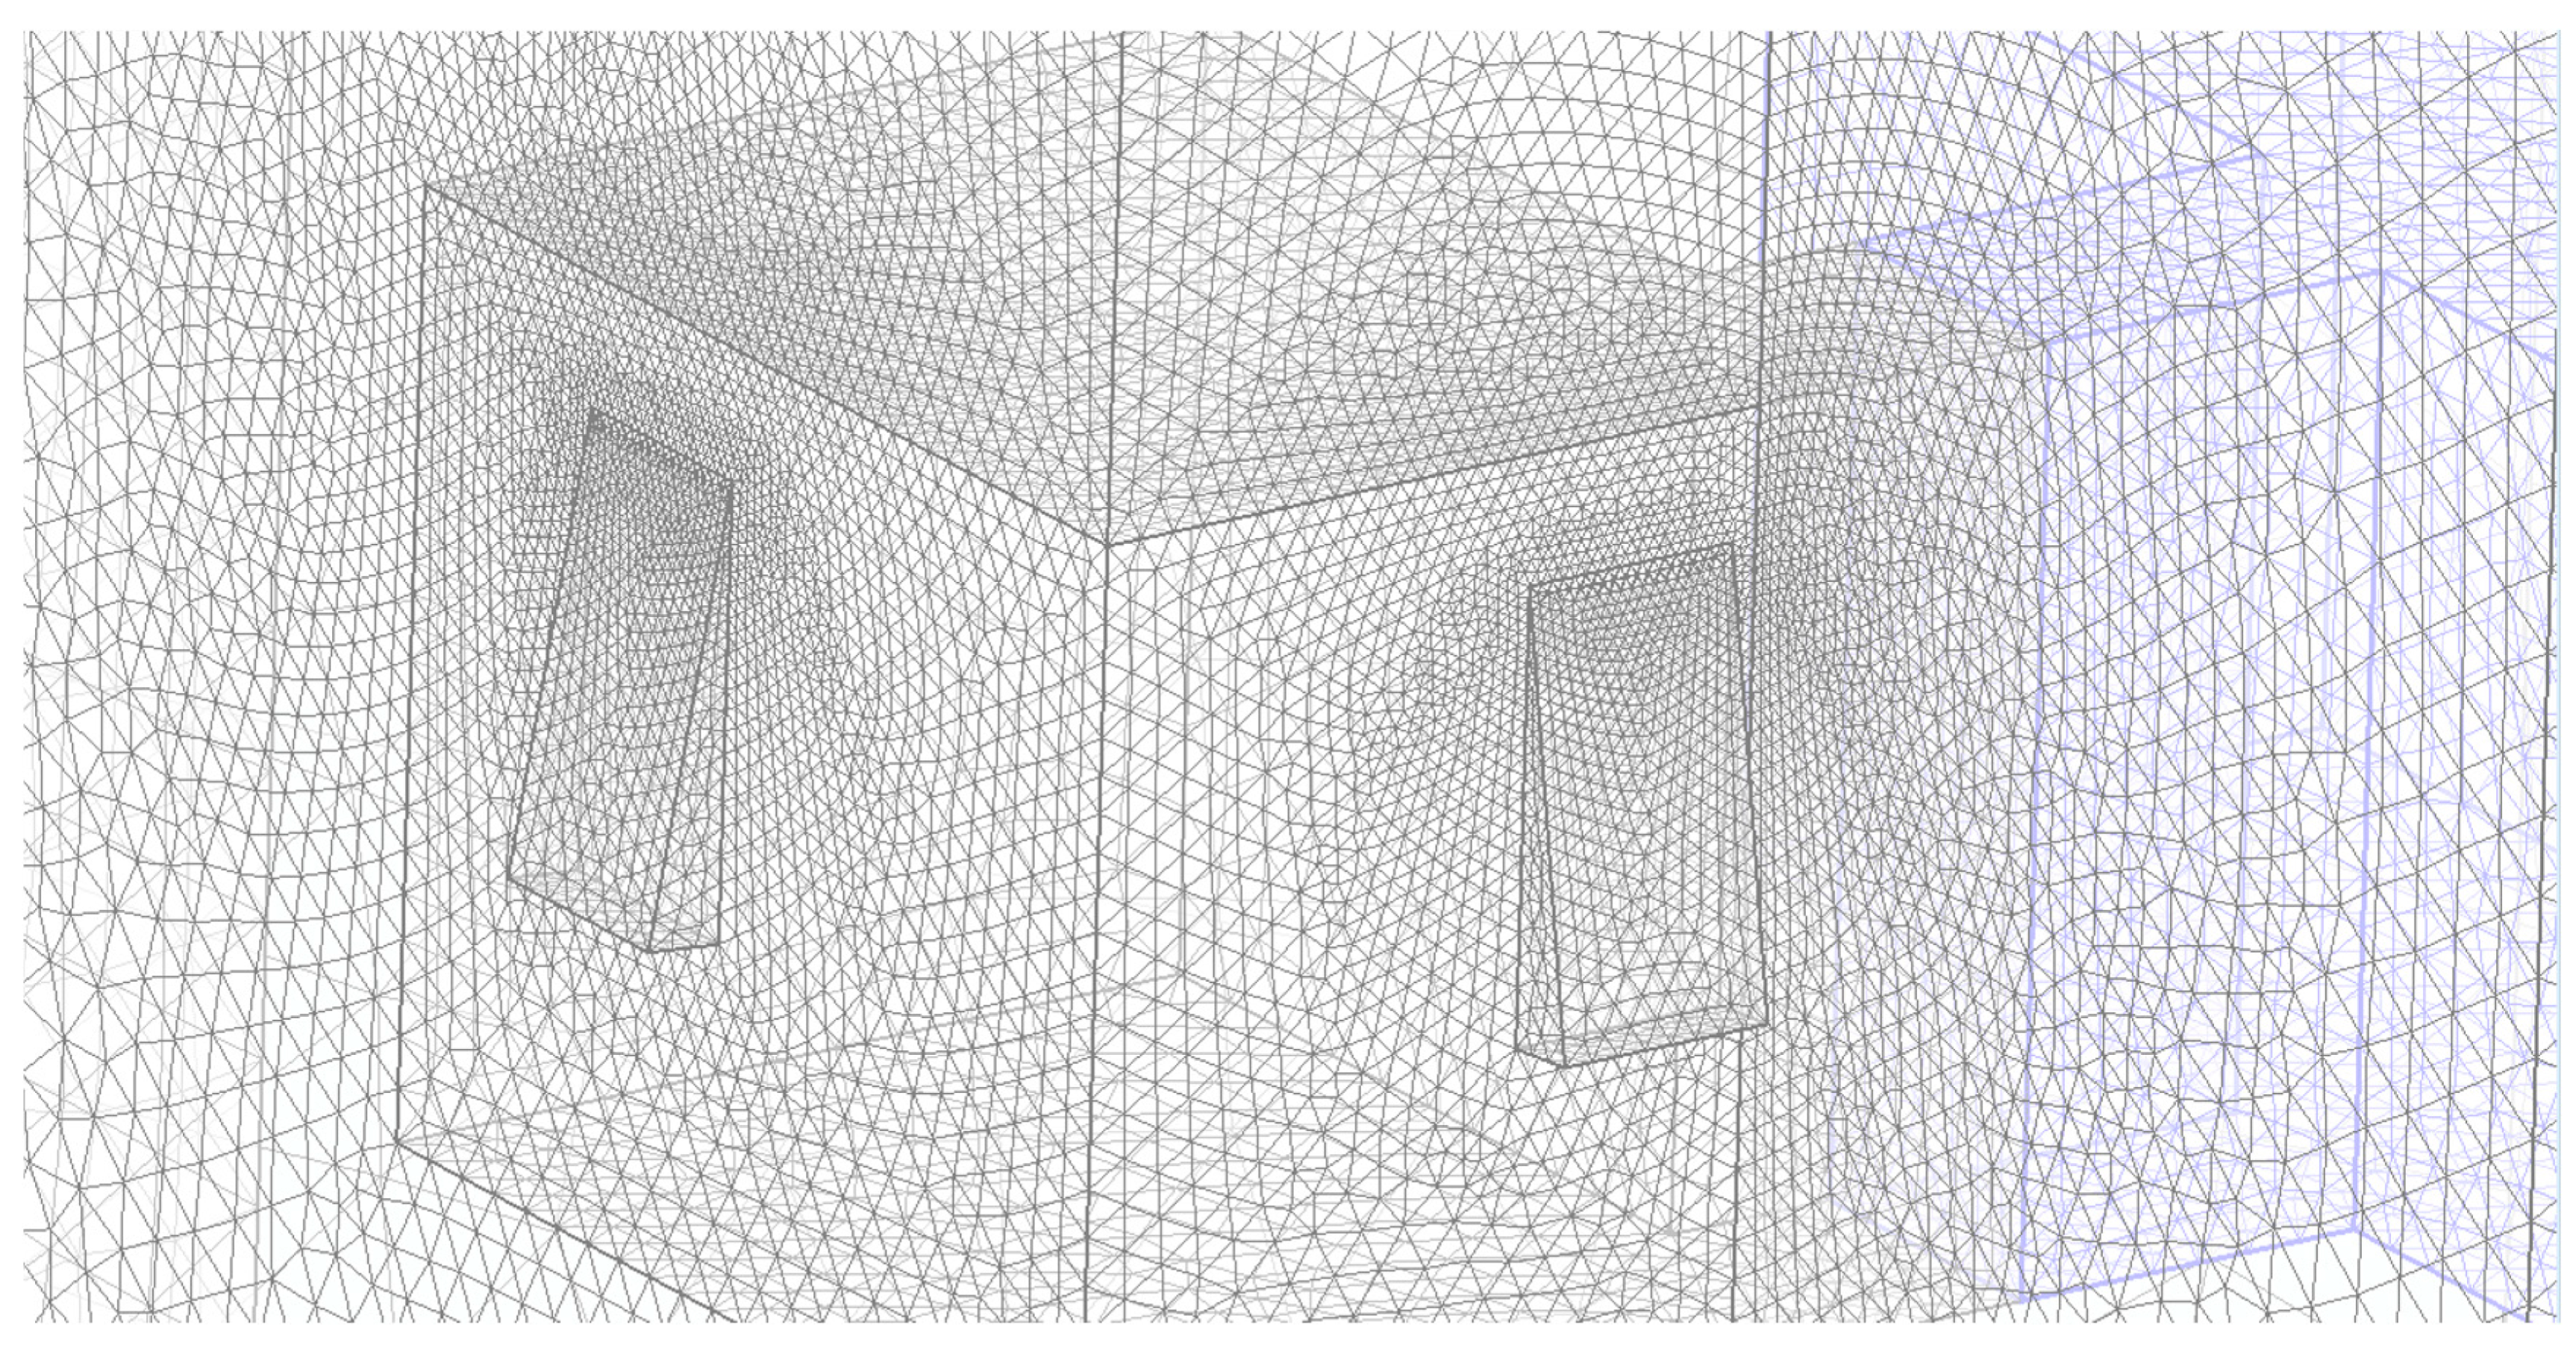
The geometry of Building Case 2 stems from the floor plan
Figure 3c, with the external computational domain modelled using SketchUp. The Atmospheric Boundary Layer (ABL) setting was applied to the external computational domain. The modelled internal computational domain included the entire building, the living room, the bedroom, and the windows (
Figure 5). The awning window was modelled as illustrated in
Appendix A (
Figure A3). After being exported to COMSOL, the geometry consisted of 6 domains and 62 boundaries. The air–fluid properties and material were applied to external and internal computational domains: the bedroom, the living room, and the awning windows. The building domain was ignored by applying an internal wall boundary setting to the boundaries of the building domain. The computational domain size selected in this study was selected based on the best practice guideline [
29]. The upstream, downstream, lateral, and height of the internal computational domain or the building height (H) are 5H, 15H, 5H, 5H, and 5H, respectively.
Figure 5 illustrates the computational domain of this study.
Furthermore, the direction blockage ratio was defined as the ratio of frontal/projected/cross-section area from the vertical and lateral view upon the cross-section area of the boundary section. The frontal blockage ratio
and lateral blockage ration
, where A is the area of the projected view [
30]. The frontal blockage ratio was 4.25% and the lateral blockage ratio was 1.83%.
2.2.2. Boundary Conditions
Since the simulation employed the RANS numerical method with the standard k-ε (turbulence model), the inlet’s setting (dissipation rate and kinetic energy) followed the default setting. For the k-ε model, the inlet profile was defined by the mean wind speed U, turbulent kinetic energy k and turbulence dissipation rate ε in the ABL. Since the height of the building case computational domain is significantly lower than the ABL height, these profiles are generally simplified by assuming a constant shear stress with height [
31]:
where
Uz (m/s): The wind speed at height
Z (m),
Uref (m/s): is the wind speed recorded at the weather station height (
Zref),
: The exponent that represents the terrain roughness exponent and the city of Jakarta is categorized as urban terrain the value of
adjusted to 0.20 [
32],
u* the ABL friction velocity,
the von Karman constant (adjusted to 0.40) and C
μ is the model constant of the standard k-ε model (0.09).
Standard wall functions are used as the most popular method for near-wall velocity processing with regard to k-ε models. In areas close to the wall, the flow is modelled using empirical formulas [
33] and the boundary layer was applied. According to COMSOL Multiphysics default wall functions, the standard logarithmic relation for velocity near the wall is given by (4).
where in turn,
κv, is the von Kárman constant (default value 0.41) and
B is a dimensionless constant set to 5.2. The wall lift-off in viscous unit (
) is defined as
Cμ is a model constant. The first argument is based on the law of the wall. The second argument is the distance from the wall, in viscous units, between the logarithmic layer and the viscous sublayer. This lower limit ensures the wall functions remain non-singular for all Reynolds numbers.
δw is defined as h/2 when
, but it can become larger when the lower limit for
, 11.06, goes into effect. The wall lift-off, δ
w, is defined as
where the friction velocity (
uτ) is defined by:
Furthermore, to reduce the computational time, we assigned a symmetry wall to the side boundary, and a no-slip wall function was assigned to the ground boundary. The boundary of the modelled building wall and surrounding buildings were assigned as an internal wall of the external computational domain.
Table 1 summarizes the current simulation’s turbulence model, domain, boundary, and mesh settings.
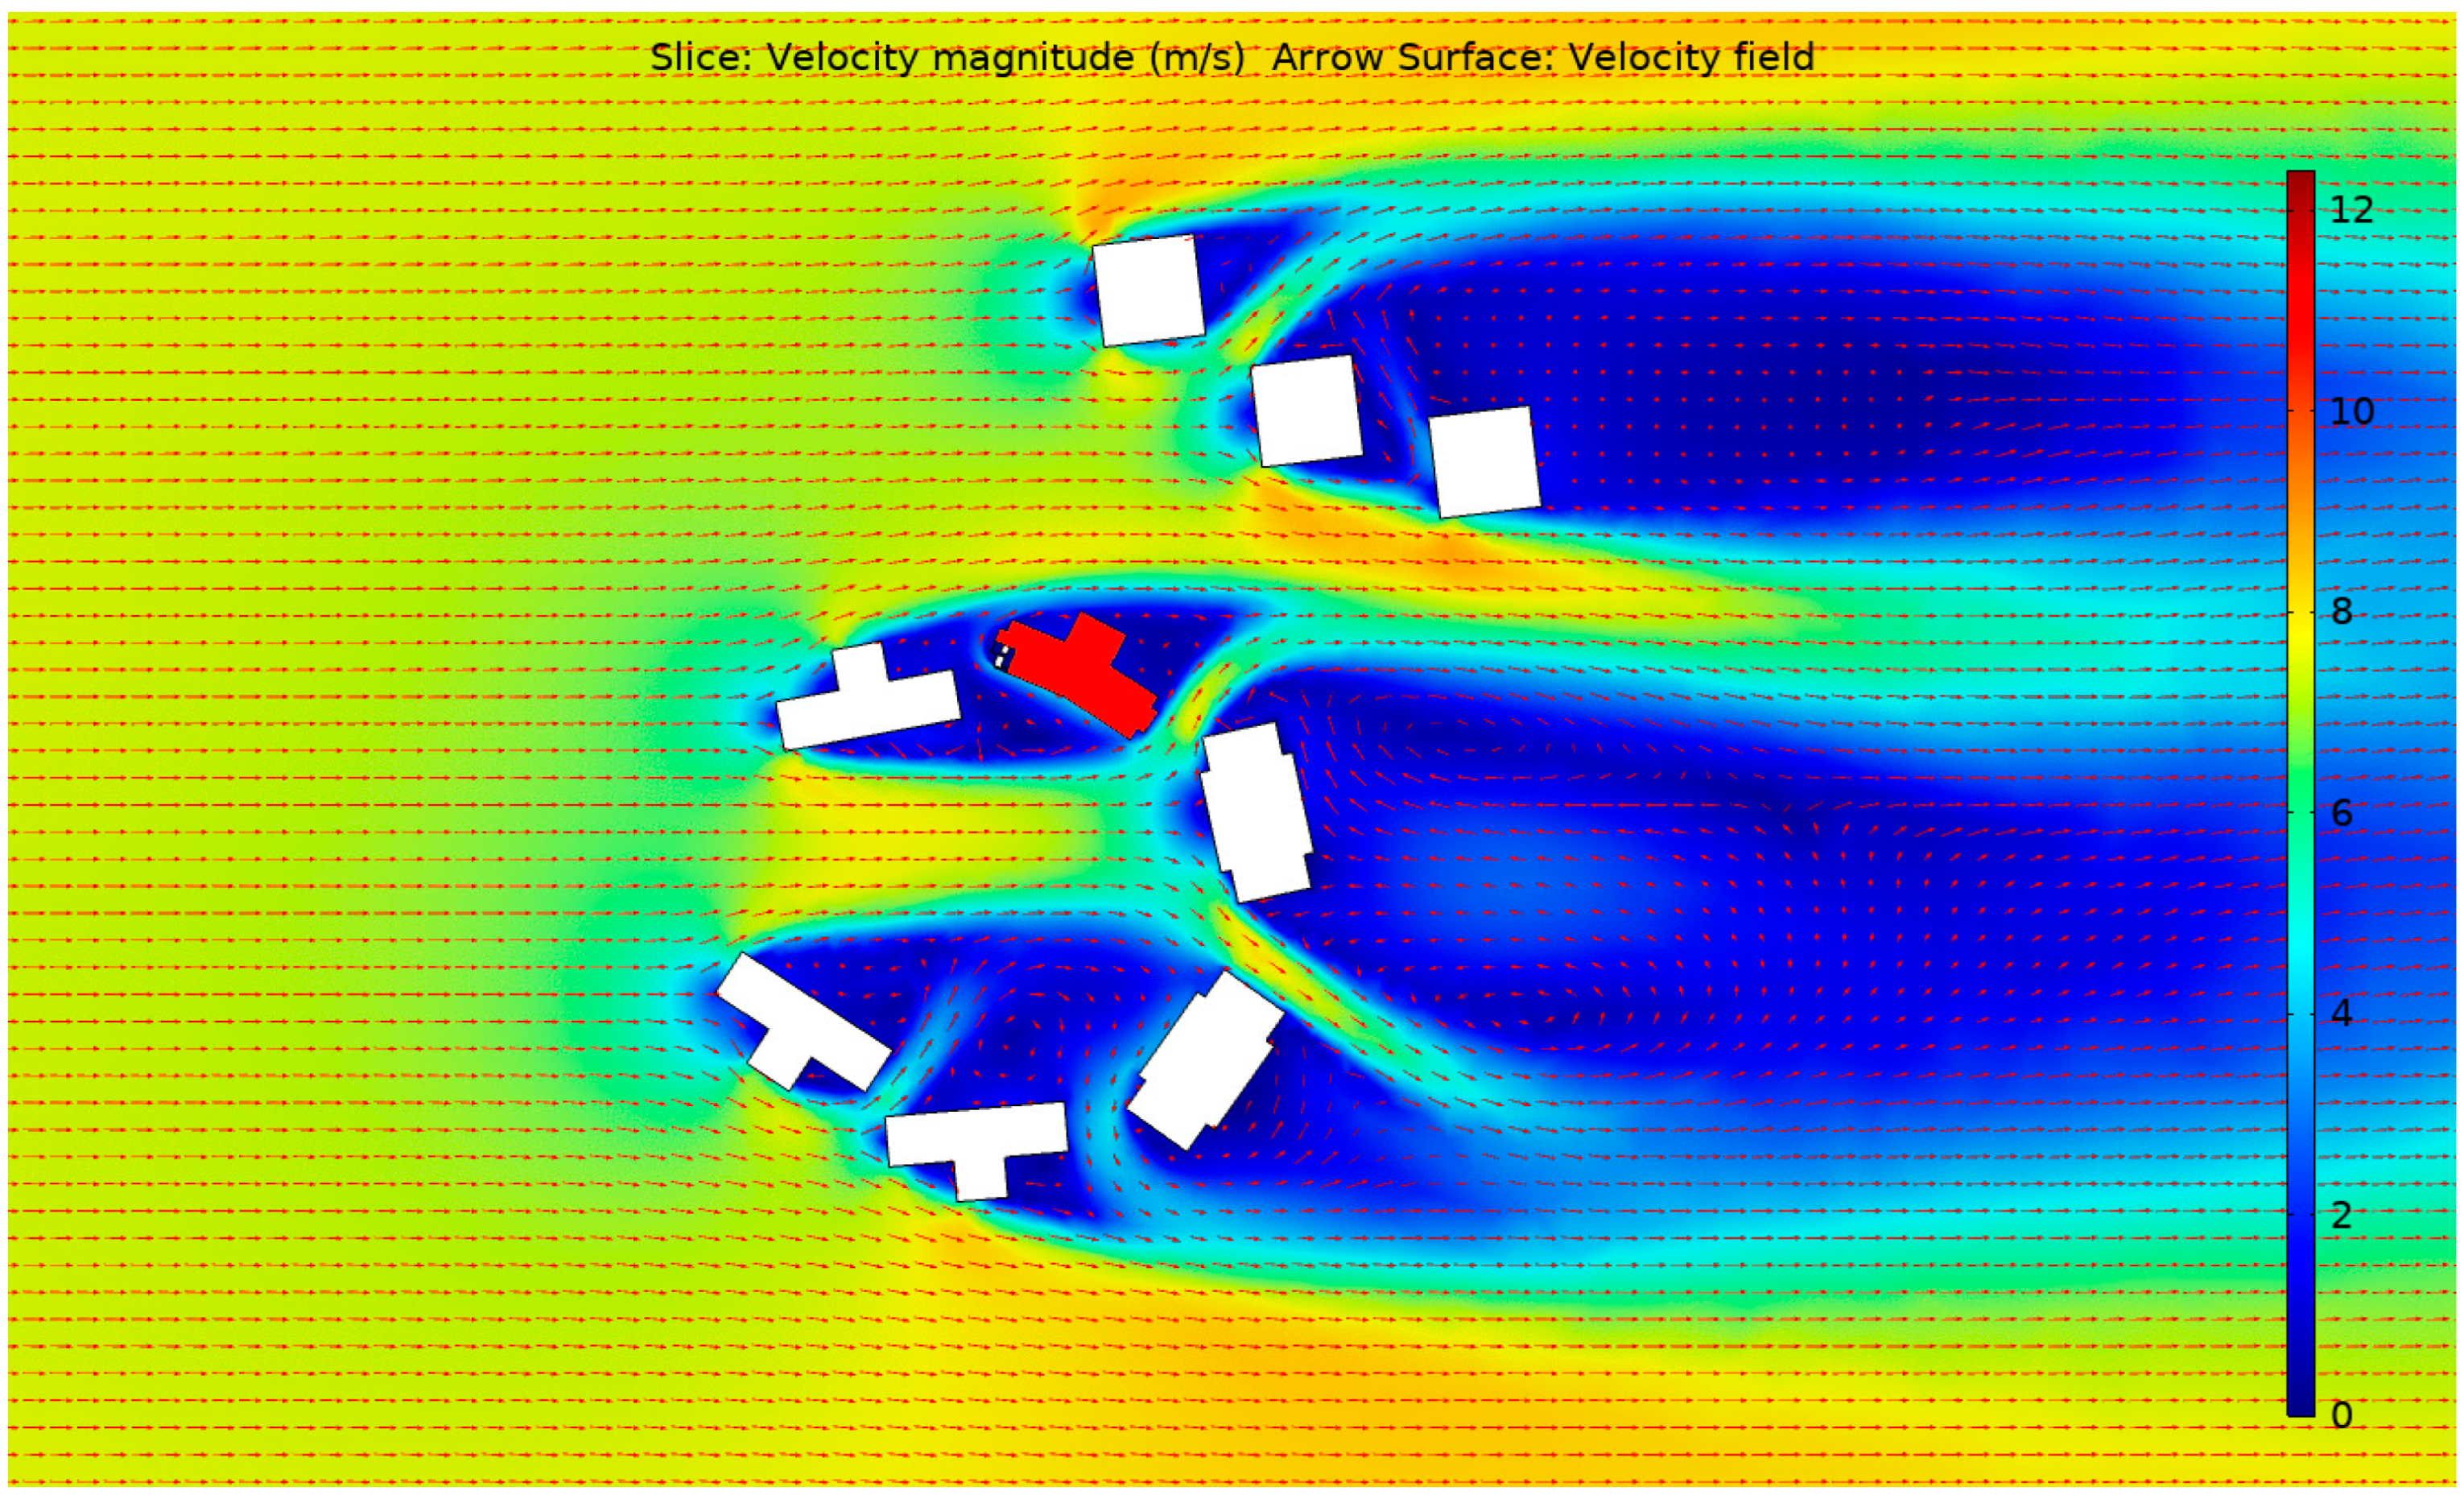
The results of ABL simulation are presented in
Figure 6. The building cases were surrounded by similarly high buildings. Furthermore, the surroundings affect the wind contour and direction around the building case as shown in
Figure 7.
2.2.3. Validation of CFD Simulation
CFD requires validation processes to deliver a reliable prediction model. This study validated the CFD model against field measurements conducted on the premises on 30 November 2021, 16.00 to 3 December 2021, 16.15. The inlet velocity profile was defined based on the average outdoor wind during the measurement period. The Kemayoran weather station, the closest weather station to the building, was the most prevalent wind direction from the west and southwest. The average wind speed of these recorded data is Uz. Although the weather station height was 4 m, the Uref provided in this paper was the wind speed at 10 m high. Five different inlet velocity profiles were selected to simulate the building: 1 m/s with southwest wind direction, 2 m/s with west wind direction, 3 m/s with southwest wind direction, 3.6 m/s with west wind direction, and 4 m/s with west wind direction. The defined velocity profile was set as the inlet velocity, and the findings were compared with the measurement results.
3. Results
The results of mesh sensitivity analysis, validation simulation and simulation with different wind directions are presented in this section, supplemented by data in
Appendix A.
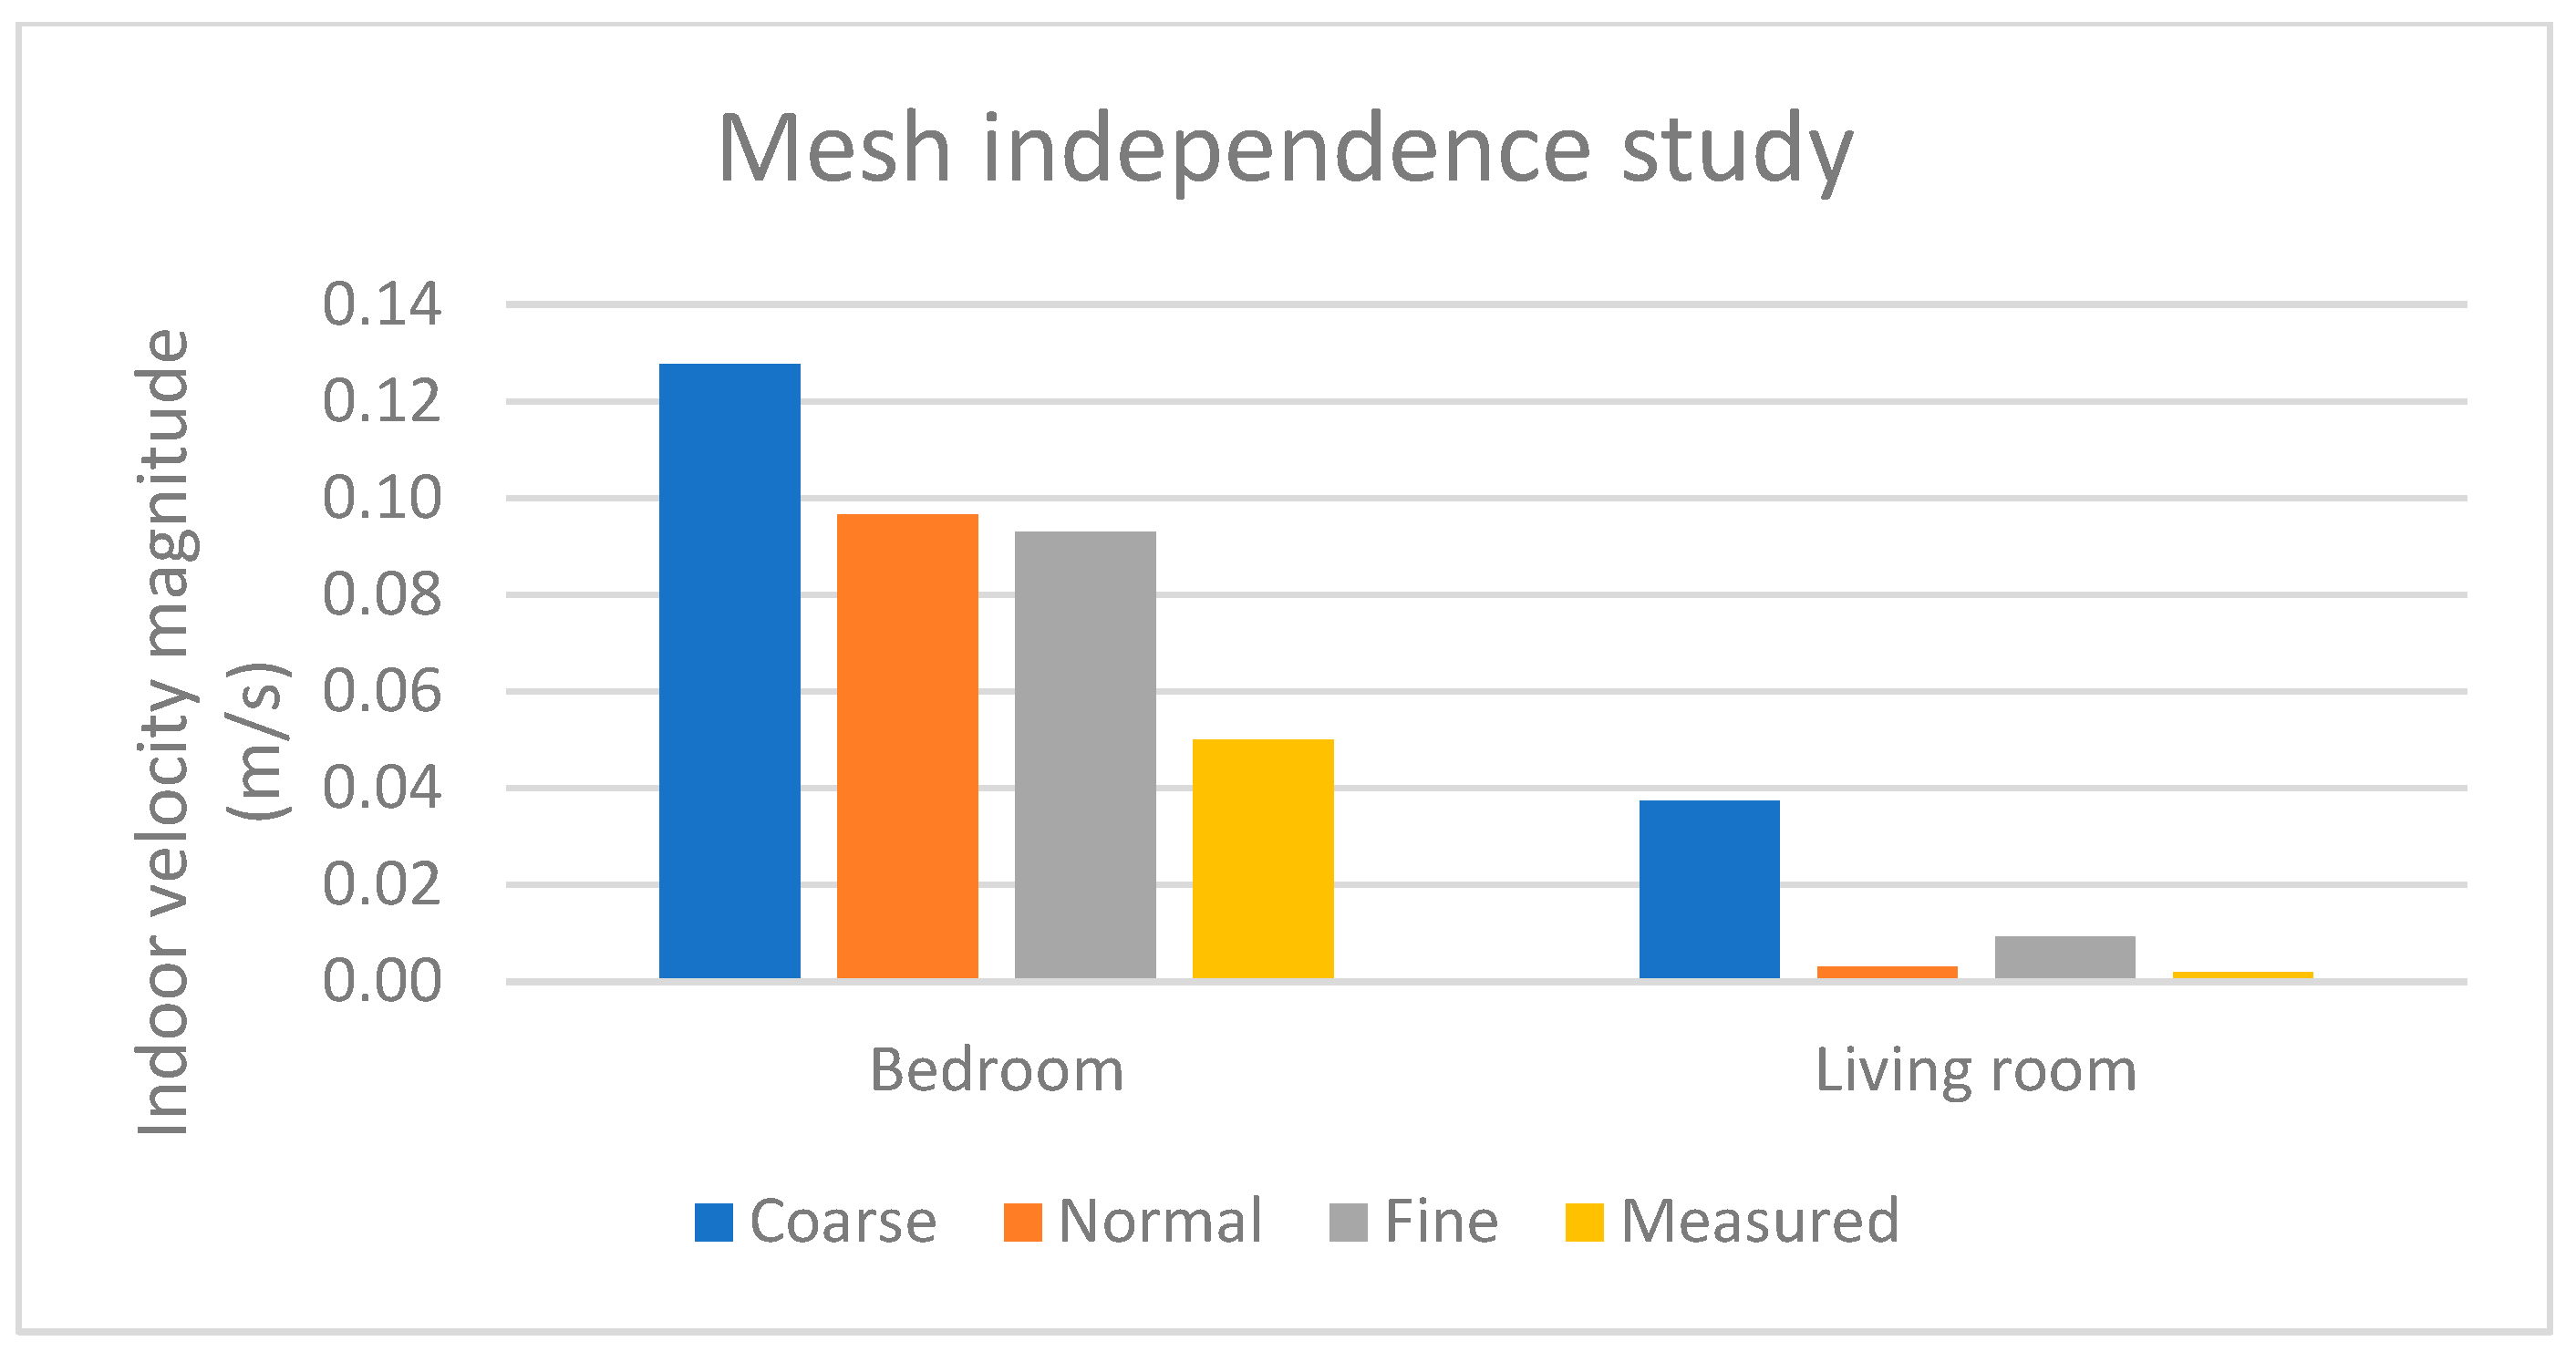
3.1. Mesh Sensitivity Study
As previously mentioned in
Section 2, this step is completed by comparing the results of calculations with grids of different sizes. The procedure concludes when any improvement in meshing does not alter the findings (or does not show significant changes depending on the accuracy required). The sizes of grid cells should also vary based on their placements, with a refined grid positioned in crucial places such as those with a high gradient or significant variations. Therefore, the geometry was modelled and simulated with different mesh size settings. The geometry selected for this study was the Building Case, and different mesh sizes: coarse, normal, and fine, were tested. To produce proper meshing, the mesh sequence used in the software was essential. The sequence began with the part of the geometry (the domain or boundary) requiring a smaller mesh size. Uniform mesh size cannot be applied to all parts of the geometry because it requires a higher computational cost. Therefore, the mesh sequence began from the smallest to the biggest mesh size. The total cells for coarse, normal, and fine mesh settings were 1,816,098, 2,226,920 and 2,826,952 cell counts, respectively.
Furthermore,
Figure 8 and
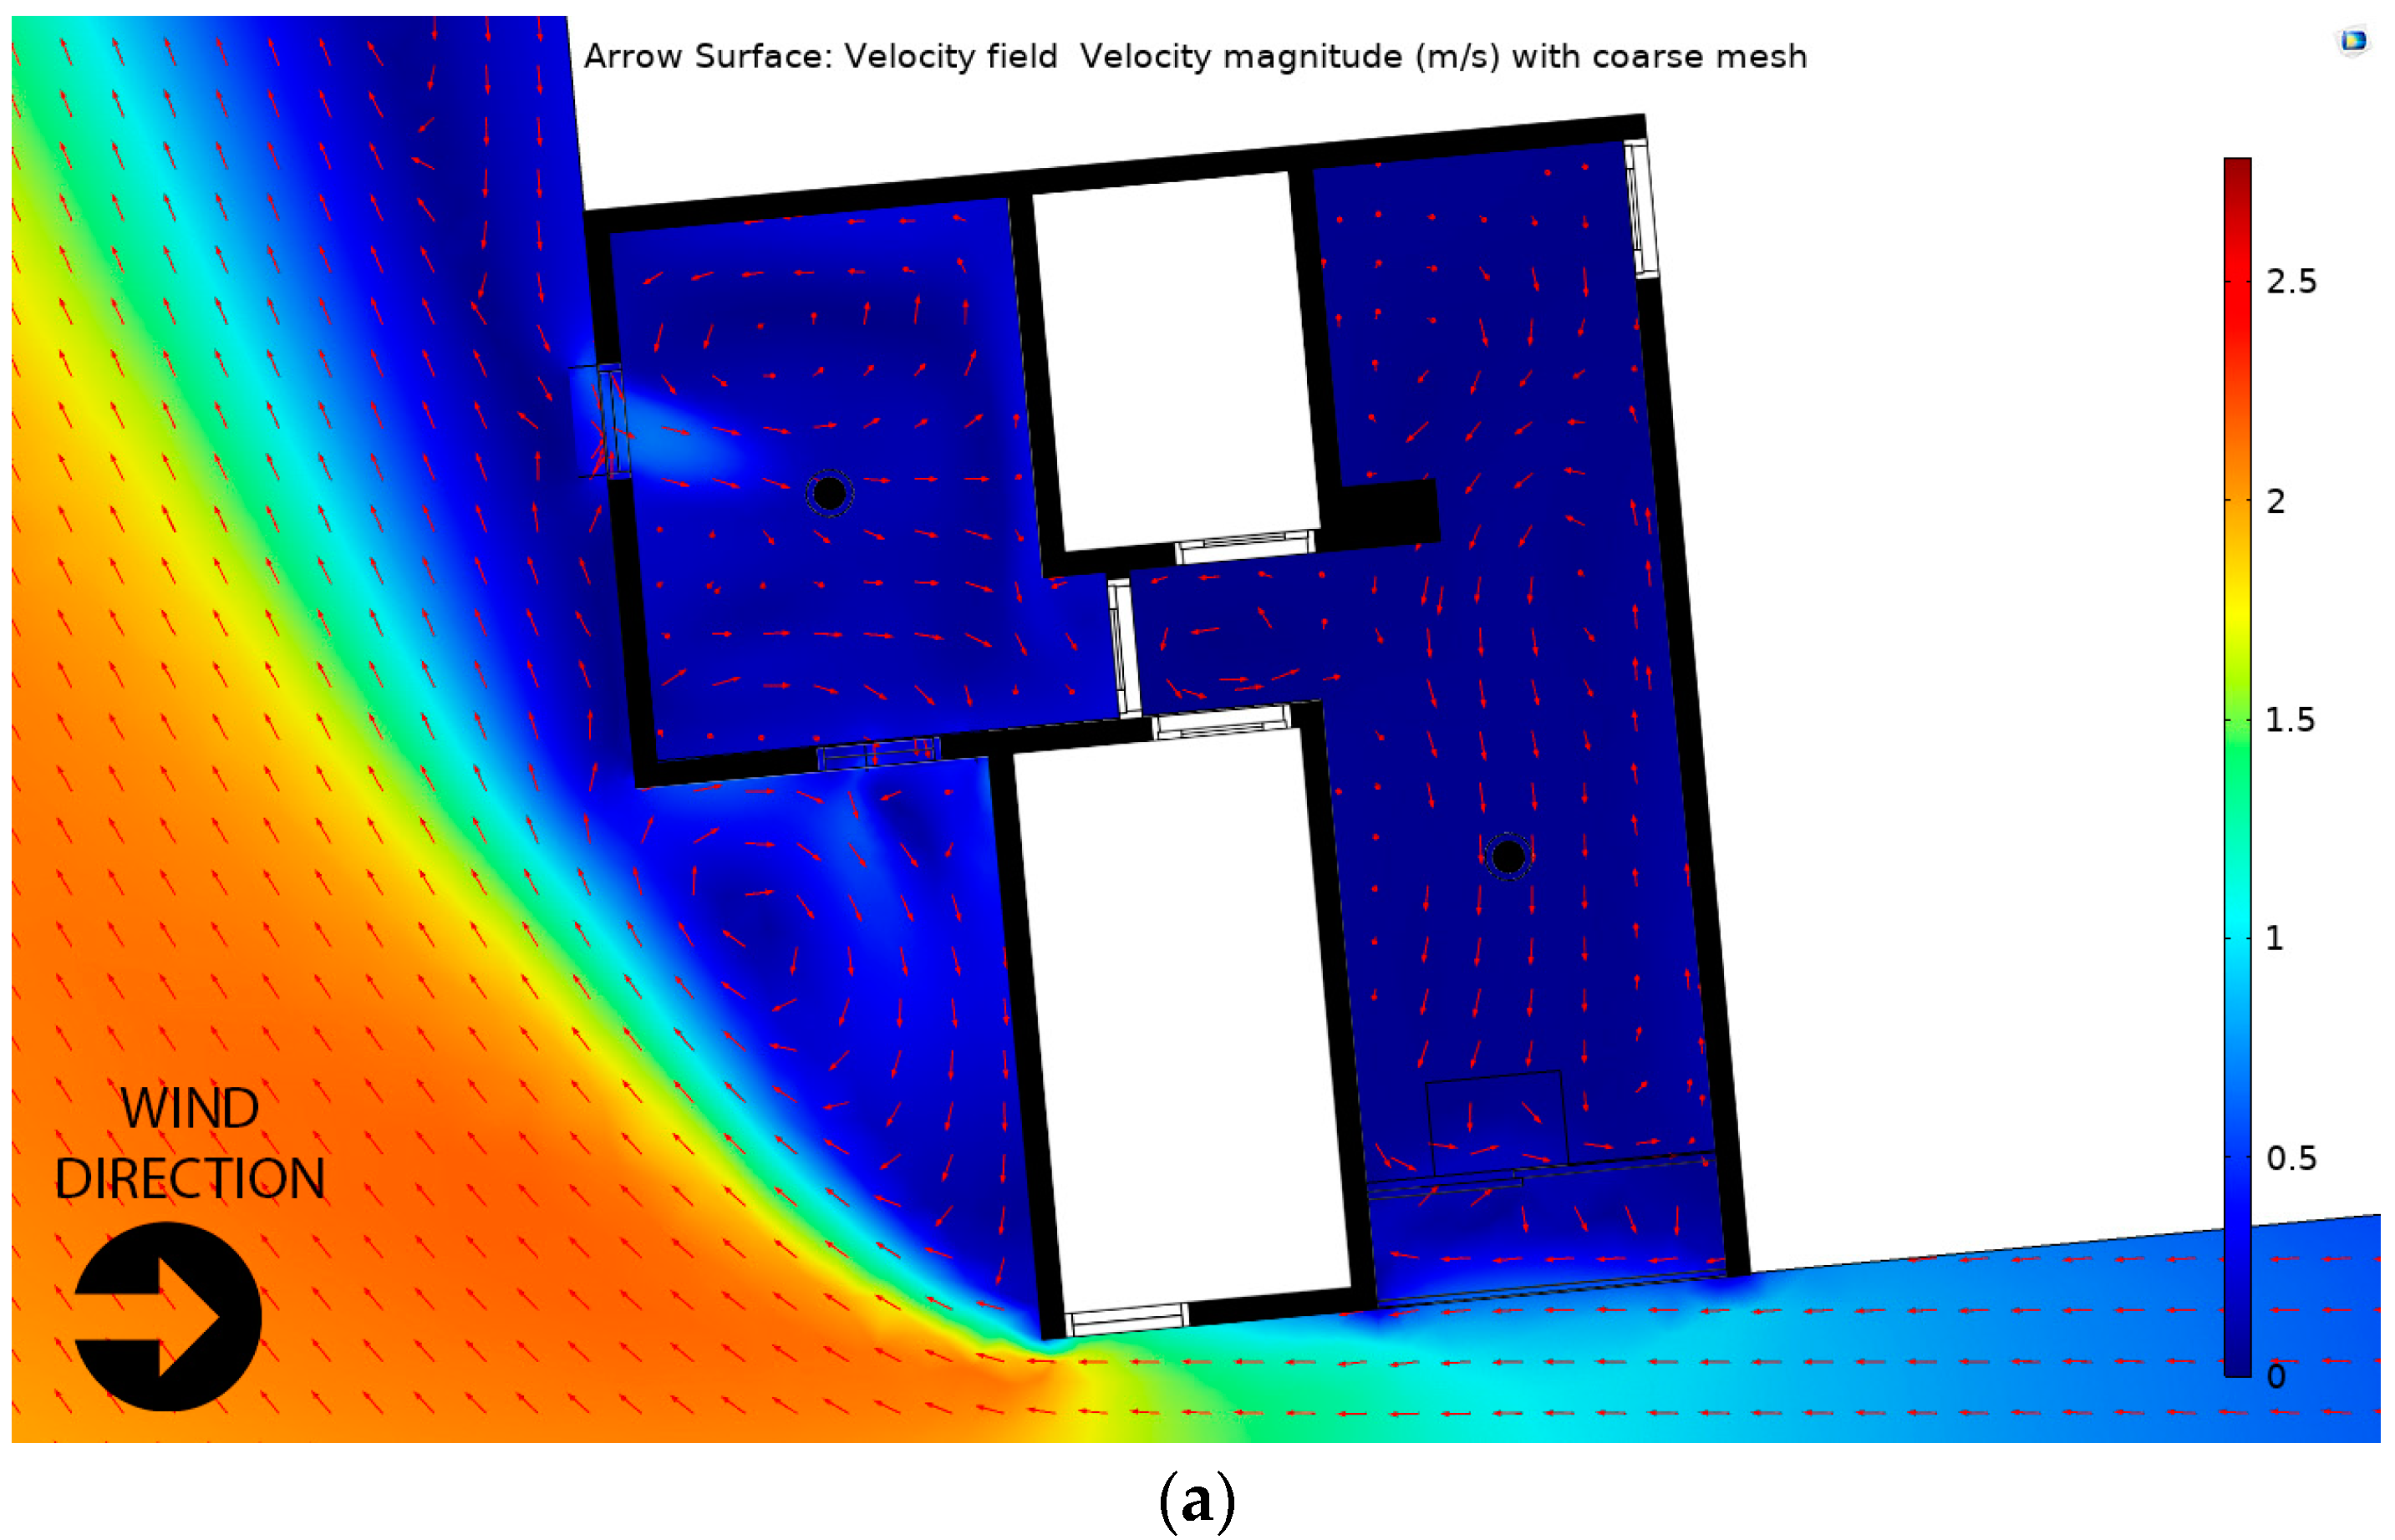
Table 2 illustrate the results of the mesh sensitivity study. The results between coarse and normal mesh sizes have deviated after running three different simulations with three different mesh sizes. In the case of the bedroom, there was little difference in results between simulations with normal and fine mesh sizes. The simulation results deviated but not as much as when coarse mesh settings were applied. In the case of living room, normal mesh settings suggested closer results to the actual measurement results.
Figure 9a showed that the airflow pattern was different with coarse mesh compared to the simulation results with normal (
Figure 9b) and fine mesh settings (
Figure 9c). Therefore, the results from the coarse mesh setting can be eliminated since it also overestimated the results compared to the measurement results. All mesh settings produced comparable patterns in terms of airflow. Therefore, this study employed a normal mesh setting with adjusted mesh size in the smaller domain region for the meshing options in the simulation because it required less computational cost than applying a finer mesh size. The mesh shape selected was tetrahedral, and the final mesh generated comprised a total of 2,226,920 cells. The average mesh quality in skewness was 0.6623, with the minimum mesh quality being 0.1083. The mesh quality was still acceptable within the good quality mesh to reduce errors and uncertainties. The general mesh sequence followed
Table A1,
Figure A1,
Figure A2 and
Figure A3 illustrate the meshing of the domains (please refer to
Appendix A).
3.2. Validated Simulation Results
The next step was to compare the airflow velocity magnitude of the simulated building and the results of the measurement under similar outdoor wind speeds and directions. For these purposes, a total of four sampled combinations of outdoor wind speed and direction were tested. The outdoor wind speeds and wind directions were selected for the CFD simulation based on the percentage frequency of their occurrence derived from the meteorological data for the area close to the building under study, as explained in the previous section. The simulation converged to 10−3 residual targets upon stimulation with a segregated solver.
Table 2 compares the CFD simulation results of the various scenarios applied to the building and the average of the measured velocity magnitude. The accuracy of the instruments limited this study because the instrument recorded the indoor wind speed in rounded numbers. However, the simulation results were nearly identical to the instruments’ readings. Therefore, we can validate the simulation results of the building’s current CFD setup because the results closely confirmed the measurement results. When the outdoor wind was lower at 1–2 m/s, the simulation yielded similar results to the indoor air velocity. In the case of the bedroom with an outdoor wind speed of 2 m/s, the simulation predicted a slightly lower speed than the measured one. However, this could be due to the rounded number of the instrument readings.
Furthermore, when the outdoor wind speed was higher, the simulation over-predicted the indoor wind speed. The results, however, were still in an acceptable range. Since the maximum outdoor wind speed recorded was around 4 m/s and rarely occurred, it was not necessary to simulate with higher outdoor wind speed. Therefore, the simulation setup with RANS k-ε turbulence model, ABL profile and current mesh setup are validated with the measurement results.
In order to determine the environmental conditions during the measurement period, weather data from respective weather stations was gathered one week prior to, and one week after the measurement time. During the measurement, the wind speed and direction were relatively constant and did not fluctuate significantly. The measurement averages taken in different wind directions were used to provide a more accurate representation of the actual airflow performance. As a result, for the CFD simulation, the average wind speed would be the wind reference for the velocity inlet.
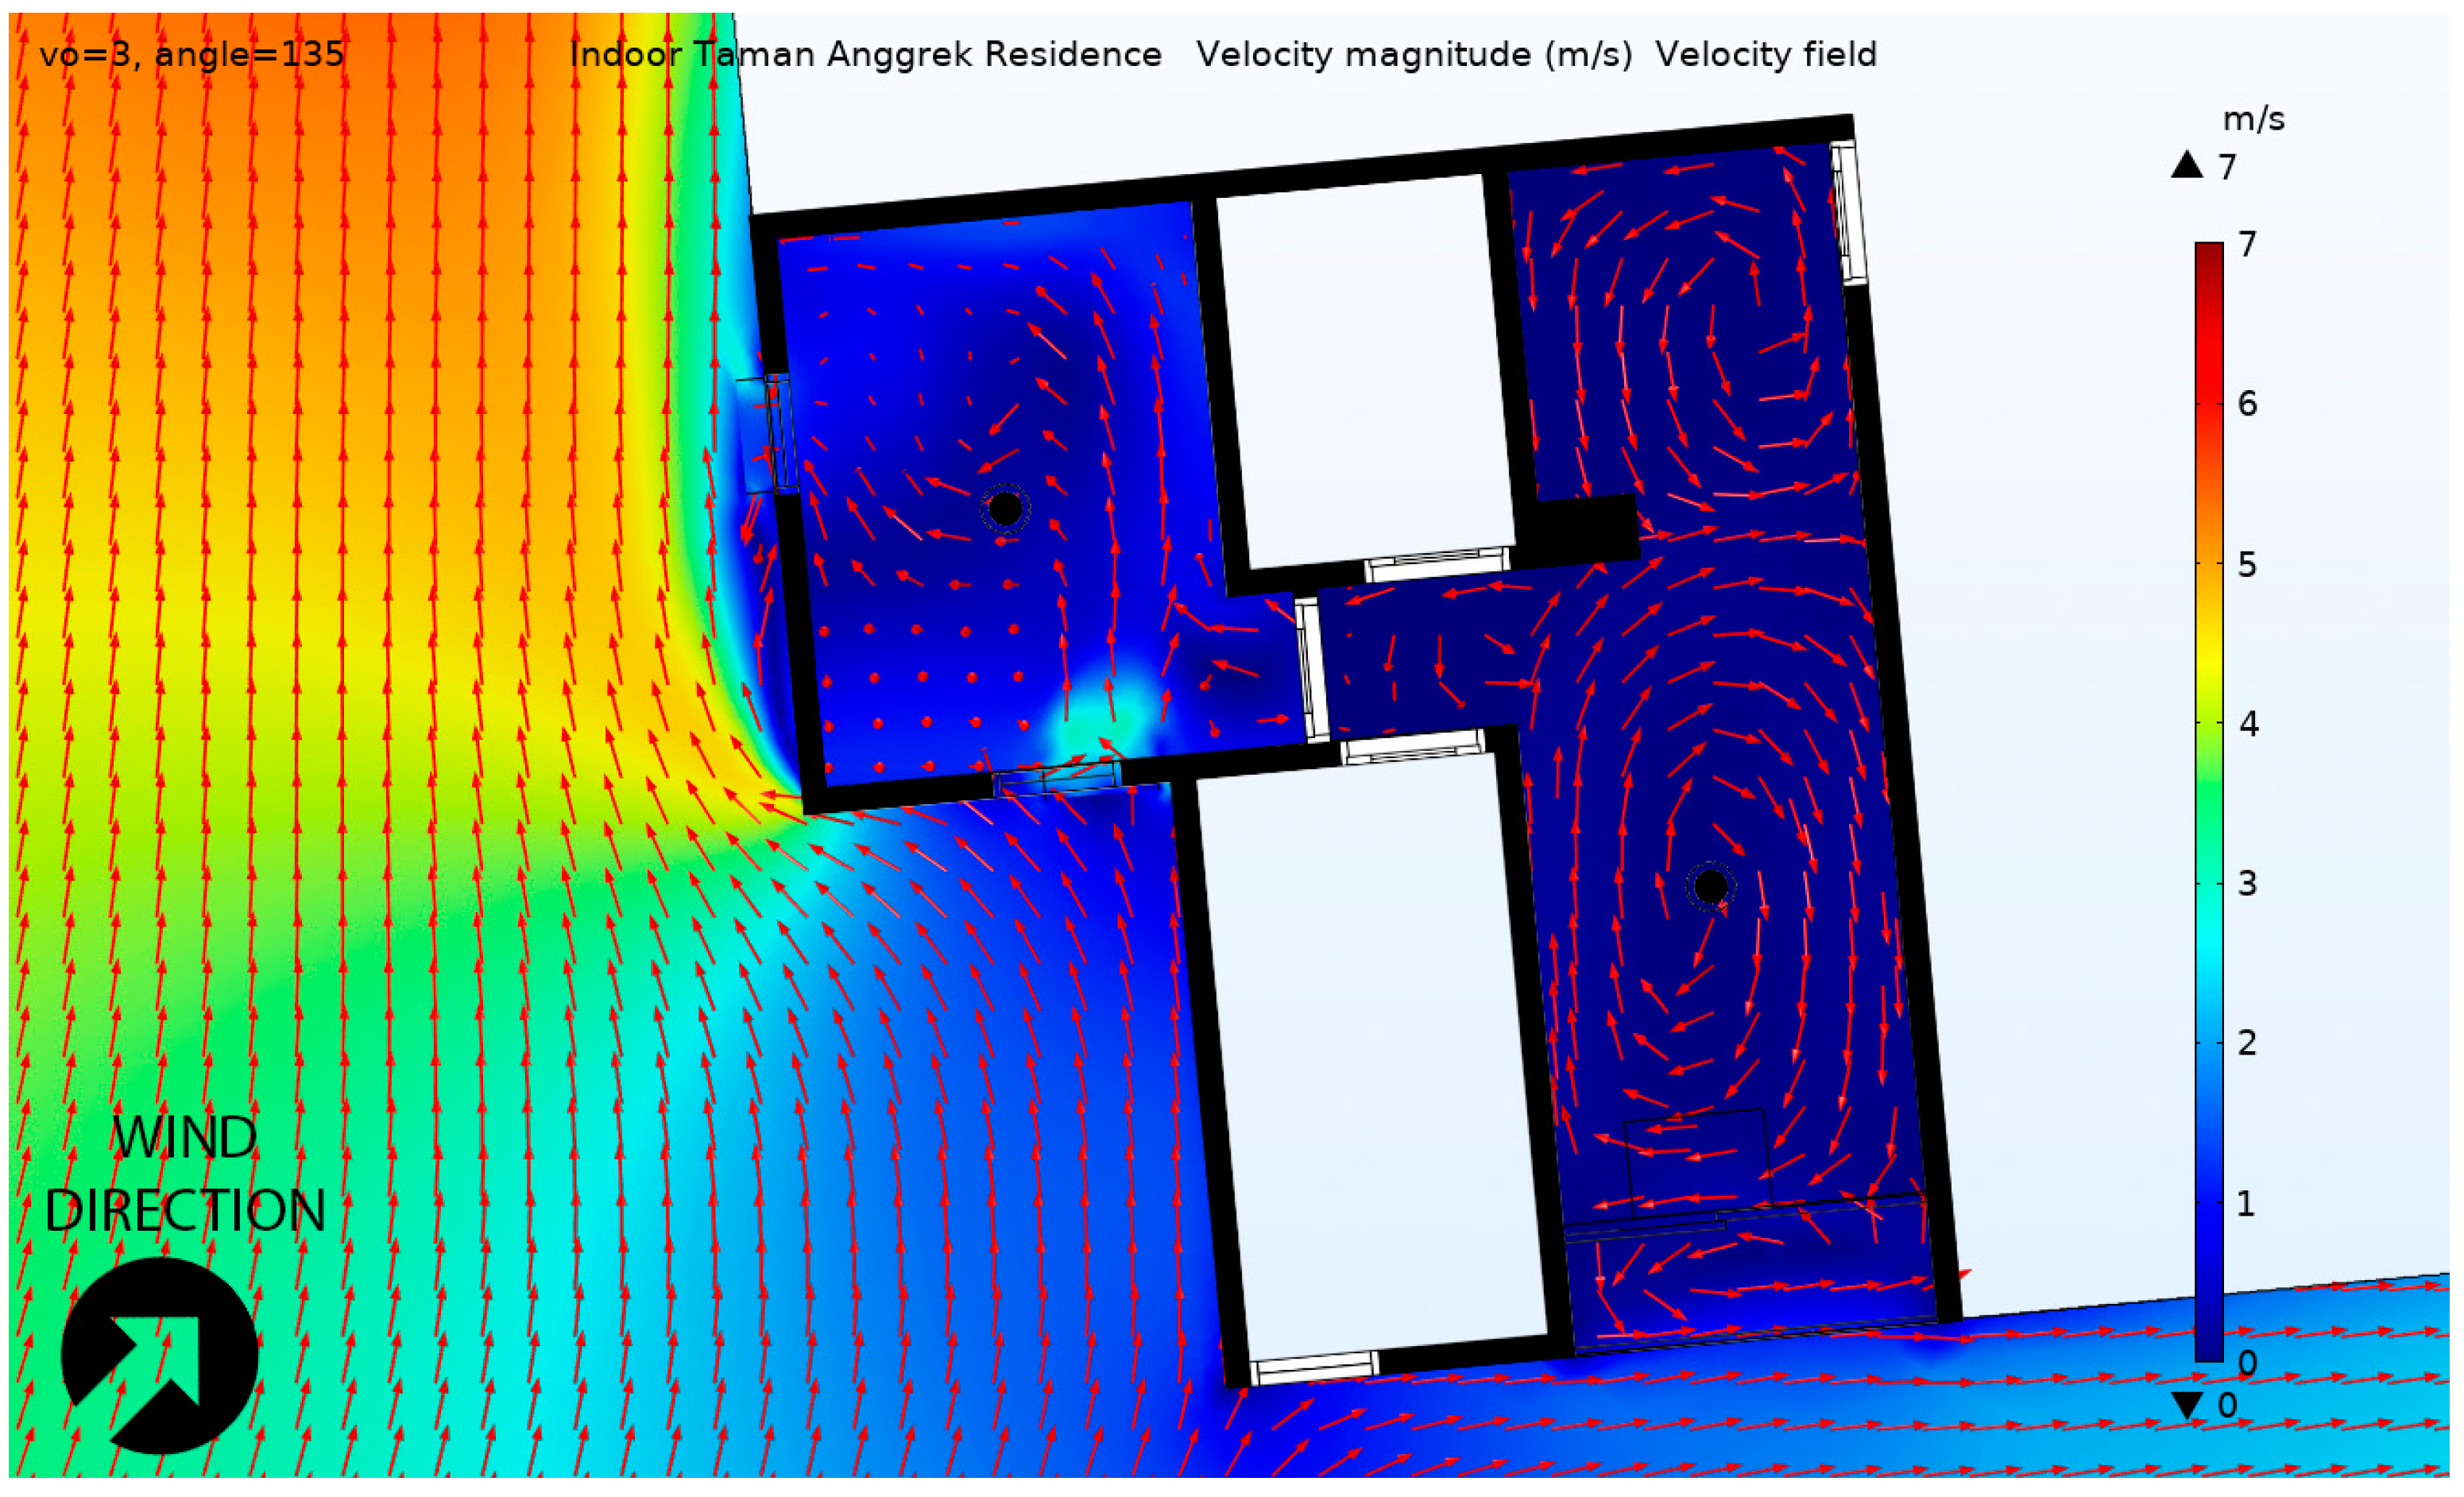
We tested with the two most prevalent wind directions that occurred during the measurement period, from west and southwest. There was one opening in the living room (Opening A) and two in the bedroom: Opening B on the south side and Opening C on the west side. When the wind came from the southwest, it occurred at 45° incident to the openings. The modelling result as shown in
Figure 10 revealed a very low velocity magnitude, and the airflow within the living room was quite modest. The arrow represents the velocity field, and the size suggested the magnitude of the indoor air velocity. Cross ventilation occurred in the bedroom where the outdoor wind entered from Opening B and exited from Opening C. Single-sided ventilation occurred in the living room where air entered and exited from the same Opening A. The air movement occurrence was more apparent in
Figure 11 due to the higher velocity magnitude occurring when the outside wind speed was higher, which rarely occurred. Nevertheless, the facade openings still provided airflow circulation inside the rooms.
Furthermore, when the wind came from the west, Opening C (windward) became the inlet of the bedroom cross ventilation and Opening B, perpendicular to the wind direction, became the outlet. There was also turbulence that occurred outside Opening B. In terms of numerical value, perpendicular wind direction resulted in better airflow compared to 45° wind incident to the opening. The same conclusion occurred in the living room, wind incident in the perpendicular direction (0°) performs better than the wind incident 45° on the windward side of the building (
Figure 12). The results of the simulation suggested that natural ventilation contributed, also unnoticeable, to the airflow inside the apartment unit. The optimum window configurations, however, need to be tested further to determine the effect on the indoor airflow.
However, the mesh independence study suggested employing the normal mesh size setup instead of the finer settings because the results were not significantly different, and the normal mesh size required less computational cost. However, the mesh in smaller regions of the domains needed to be refined. The k-ε turbulence settings were selected because the simulation did not reach convergence when we tested with realisable k-ε (RLZ) turbulence. Furthermore,
Table 2 suggested that the simulation results did not deviate significantly from the measurement results. Therefore, the CFD simulation was validated, and the current setup is appropriate for testing different window designs in the apartment units. The following section presents the indoor airflow resulting from different window positions by simulating the unit against different wind directions.
3.3. Wind Direction Effect on Indoor Air Flow
The simulation results of the window position on the leeward and windward sides showed that there was little airflow in the living room when the opening was windward. When the wind is perpendicular to the opening, there is more indoor airflow in the bedroom, which corroborates the findings of previous studies [
20,
21,
34]. Furthermore, the openings in the bedroom created cross ventilation (specifically corner ventilation).
Figure 13 suggested that the separation between the two openings was quite a distance and created better airflow in the bedroom, which was also proven by previous studies [
17,
18].
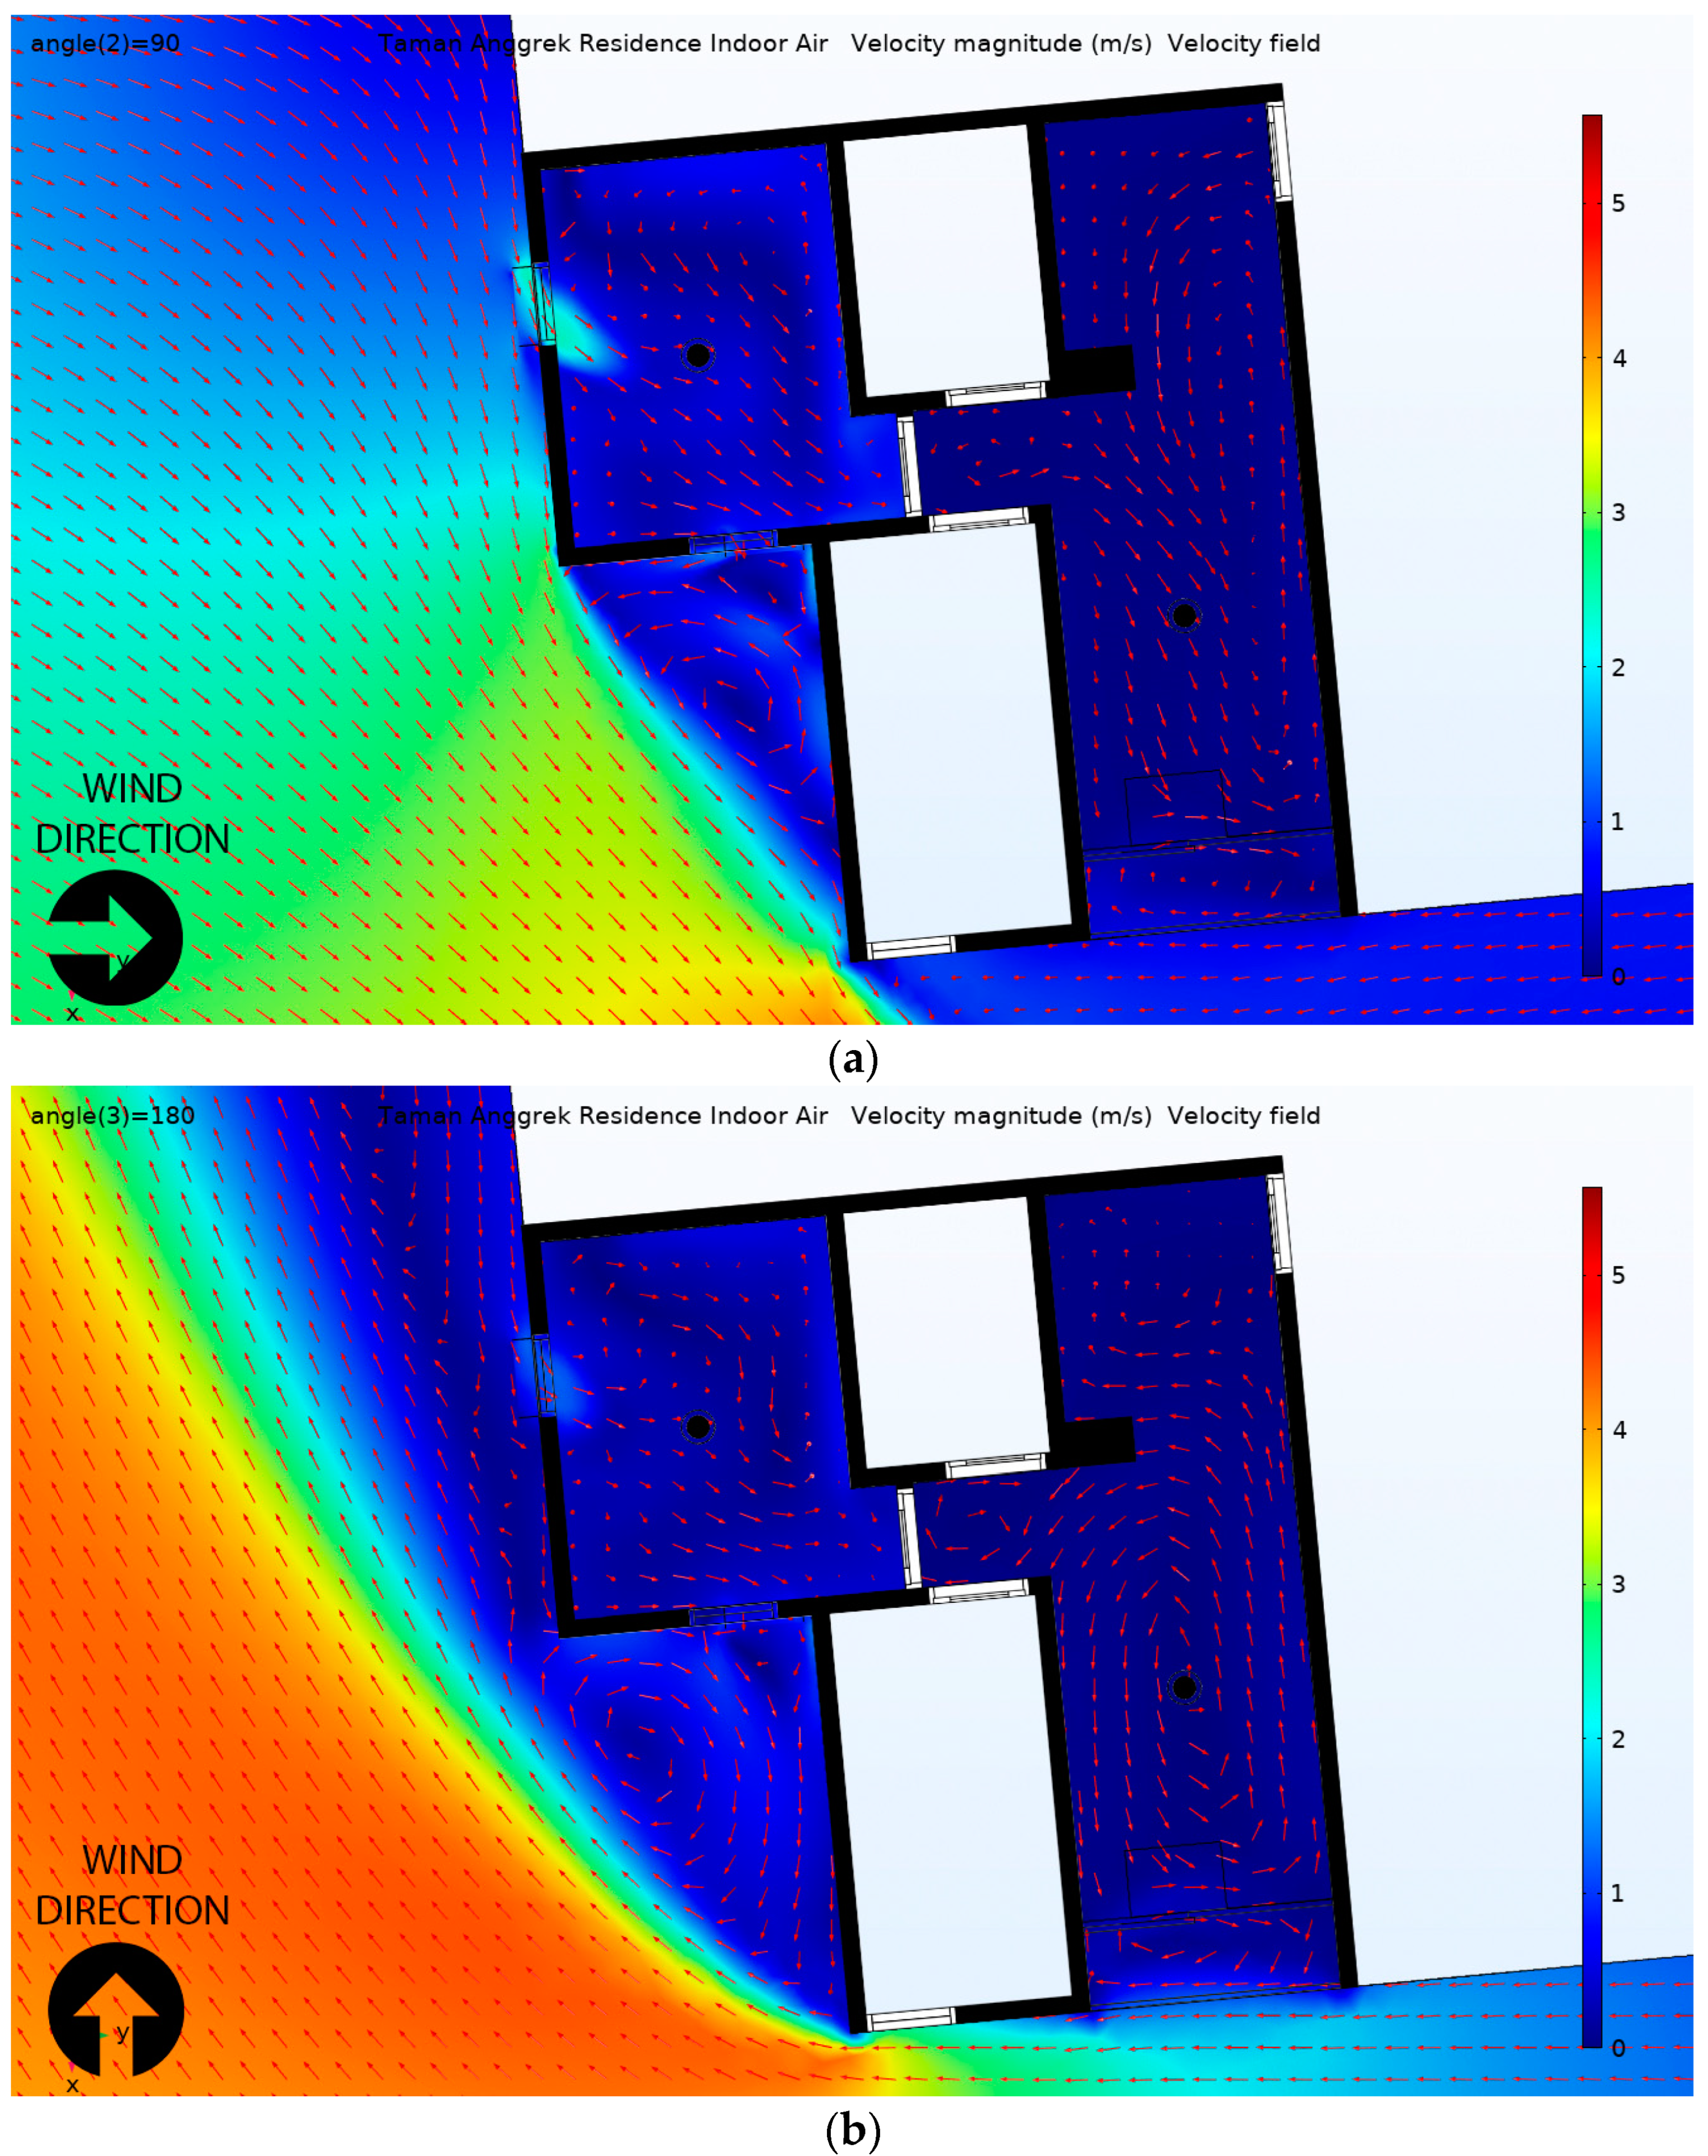
Not all units in an apartment building have windward windows. The window orientation with respect to the wind’s direction affected the indoor ventilation performance. To investigate the ventilation performance with windward and leeward windows, we simulated different wind directions with similar wind speeds at 1 m/s. Mostly leeward, windward, perpendicular. As previously mentioned, the living room has only one opening (Opening A), and the bedroom has two openings (Opening B and C). The bedroom openings were perpendicular to each other, with one facing the same direction as the opening in the living room (Opening B).
Figure 13a,b illustrated the ventilation performance of the apartment unit with windows on the windward side, where the direction was perpendicular to Opening C, and Opening A and B, respectively.
Figure 13c,d illustrated the ventilation performance of the apartment unit with windows on the leeward side, where the direction was perpendicular to Opening C, and Opening A and B, respectively. According to
Figure 13, the direction of the outdoor wind effects the indoor airflow pattern and the role of inlet and outlet, as seen in the cross-ventilation room. As every figure showed the original wind direction, the wind contour (illustrated by the arrow) near the building is different to the original wind direction because of the surrounding buildings affecting the outdoor wind flow around the building case (as shown in the ABL simulation results in
Figure 6).
4. Discussion
Depending on the location on the building facade (windward and leeward position), the wind speed, wind direction, and temperature may vary, which is why investigating the located opening of the building is vital to find whether the building should be orientated at an oblique angle or perpendicular to the prevailing wind direction. Results in
Table 3 show that when the windows were on the windward side, the bedroom air velocity was higher (0.40 and 0.26 m/s) compared to the windows on the leeward side (0.37 and 0.60 m/s). On the contrary, the indoor air velocity in the living room was higher when the opening was parallel to the wind direction (Position 1 at 0.05 m/s and Position 2 at 0.1 m/s) compared to when the window was on the windward side (0.03 m/s) or leeward side (0.04 m/s). Cross ventilation occurred in the bedroom, while the living room relied upon single-sided ventilation. This suggested that when the room has cross ventilation, a window perpendicular to the prevailing wind (either windward or leeward) is preferred to provide increased air circulation. When the inlet was on the windward side, the air velocity was higher than the outlet on the windward side. Furthermore, for a room with single-sided ventilation, an opening parallel to the prevailing wind yielded higher indoor air velocity than when the opening was either windward or leeward.
In high-rise living, where higher levels experience higher outdoor wind velocity magnitudes, natural ventilation is often limited by the building height and the size of available operable facade openings due to safety issues. With a deeper floor plan, it can be more difficult to benefit from natural ventilation, as seen in the visual results of the CFD simulation, where still air was evident in the furthest area of the unit from the opening. Still air leads to higher humidity in the deeper part of the unit. Therefore, most residents often have additional mechanical ventilation to maintain indoor thermal comfort.
Extreme outdoor conditions will lead to higher airflow velocity magnitudes. Although in the case of tropical countries, such phenomenon will be beneficial to reduce the indoor temperature, the drawbacks of higher indoor velocity can cause discomfort when doing sedentary activities for the residents and objects. In the case of extreme weather, the opening in the living room can be adjusted due to the form of the sliding door. Since the bedroom has the advantage of cross ventilation, opening and closing any window can be a solution during extreme weather. Therefore, besides allowing a better airflow pattern, as suggested by the simulation results, having more openings provides flexibility to adjust the intake air.
5. Conclusions
A CFD simulation was employed to study the existing opening design and different window orientations corresponding to the external wind direction. This was based on the simulation of the implementation of four various positions of external wind direction. The changes and distributions of wind airflow and velocity magnitude were discussed.
The mesh sensitivity analysis suggested that the results of the model with too coarse mesh would deviate too far from the experimental (field measurement) results, and too fine mesh would yield higher computational costs and more difficulty in reaching convergence, leading to an undesired outcome.
This research showed that the wind direction, and the subsequent opening orientation, influences the airflow pattern around the exterior air of the building and the indoor air and determines the inlet and outlet for rooms with cross ventilation. Thus, it also influenced the indoor air velocity magnitude. The windward opening is beneficial for cross ventilation, and a leeward opening or wind perpendicular to the opening creates better indoor airflow for single-sided ventilation.
Although the simulation approach has limitations, it was primarily due to assumptions in defining the boundary conditions. The study and findings can be updated with more precise measurements of the input boundary conditions and combined with a thermal study. This study has provided a modelled simulation with validation data. A more accurate experimental setup and apparatus are recommended for future research. Despite potential limitations, the general approach is applicable to various window design studies and is a promising approach for green building planning.
Furthermore, this paper discussed the indoor airflow resulting from different window positions by simulating the unit against different wind directions on the 38th floor at 120 m high. Results on different floors need further assessments, especially when the height of high-rise buildings affects the turbulence profile. The presented simulation results also suggest that the natural ventilation effect on the airflow inside the apartment unit is unnoticeable. Therefore, further research on the optimum window configurations, number of windows, distance between is needed.
Author Contributions
Conceptualization, A.M.R.A. and M.A.I.; Methodology, C.N.B. and M.A.I.; Formal analysis, C.N.B. and P.U.P.; Investigation, C.N.B. and R.W.; Writing—original draft, C.N.B.; Writing—review & editing, A.M.R.A. and M.A.I.; Supervision, A.M.R.A. and M.A.I. All authors have read and agreed to the published version of the manuscript.
Funding
This research received no external funding.
Data Availability Statement
The data presented in this study are available on request from the corresponding author.
Conflicts of Interest
The authors declare no conflict of interest.
Appendix A
This appendix consists of the mesh setup applied to the building on CFD simulation.
Figure A1.
External computational domain.
Figure A1.
External computational domain.
Figure A2.
The case study and surrounding buildings mesh.
Figure A2.
The case study and surrounding buildings mesh.
Figure A3.
Smaller mesh size applied on smaller regions in the internal computational domains.
Figure A3.
Smaller mesh size applied on smaller regions in the internal computational domains.
Table A1.
Mesh settings of the building simulation.
Table A1.
Mesh settings of the building simulation.
| Mesh Settings | Value |
|---|
| Size 1 applied to domain with the smaller region: window | |
| Maximum: | 955 cm |
| Minimum: | 4 cm |
| Maximum element growth rate: | 1.05 |
| Curvature factor: | 0.2 |
| Resolution narrow regions: | 1 |
| Size 2 applied to the interior rooms’ domain | |
| Maximum: | 2720 cm |
| Minimum: | 294 cm |
| Maximum element growth rate: | 1.1 |
| Curvature factor: | 0.4 |
| Resolution narrow regions: | 0.9 |
| Size 3 applied to the building | |
| Maximum: | 3890 cm |
| Minimum: | 735 cm |
| Maximum element growth rate: | 1.13 |
| Curvature factor: | 0.5 |
| Resolution narrow regions: | 0.8 |
| Size 4 applied to the external domain | |
| Maximum: | 4920 cm |
| Minimum: | 1470 cm |
| Maximum element growth rate: | 1.15 |
| Curvature factor: | 0.6 |
| Resolution narrow regions: | 0.7 |
References
- Pérez-Lombard, L.; Ortiz, J.; Pout, C. A Review on Buildings Energy Consumption Information. Energy Build. 2008, 40, 394–398. [Google Scholar] [CrossRef]
- International Energy Agency. Southeast Asia Energy Outlook 2019; International Energy Agency: Paris, France, 2019. [Google Scholar]
- Santamouris, M.; Allard, F.; Alvarez, S.; European Commission ALTENER Programme. Natural Ventilation in Buildings: A Design Handbook; BEST (Buildings Energy and Solar Technology) Series; James and James (Science Publishers) Ltd.: London, UK, 1998; ISBN 978-1-873936-72-6. [Google Scholar]
- Ghiaus, C.; Routlet, C.-A. Strategies for Natural Ventilation. In Natural Ventilation in the Urban Environment: Assesment and Design; Ghiaus, C., Allard, F., Eds.; Earthscan: Oxford, UK, 2005; pp. 136–157. [Google Scholar]
- Gong, N.; Tham, K.W.; Melikov, A.K.; Wyon, D.P.; Sekhar, S.C.; Cheong, K.W. The Acceptable Air Velocity Range for Local Air Movement in The Tropics. HVACR Res. 2006, 12, 1065–1076. [Google Scholar] [CrossRef]
- Wang, L.; Nyuk, W.H.; Li, S. Facade design optimization for naturally ventilated residential buildings in Singapore. Energy Build. 2007, 39, 954–961. [Google Scholar]
- Kubota, T.; Chyee, D.T.H.; Ahmad, S. The Effects of Night Ventilation Technique on Indoor Thermal Environment for Residential Buildings in Hot-Humid Climate of Malaysia. Energy Build. 2009, 41, 829–839. [Google Scholar] [CrossRef]
- Yu, X.; Zhang, Q.; Kang, J.; Cui, F. Predicting Integrated Thermal and Acoustic Performance in Naturally Ventilated High-Rise Buildings Using CFD and FEM Simulation. Build. Simul. 2018, 11, 507–518. [Google Scholar] [CrossRef]
- Tong, S.; Wong, N.H.; Tan, E.; Jusuf, S.K. Experimental Study on the Impact of Facade Design on Indoor Thermal Environment in Tropical Residential Buildings. Build. Environ. 2019, 166, 8. [Google Scholar] [CrossRef]
- You, W.; Qin, M.; Ding, W. Improving Building Facade Design Using Integrated Simulation of Daylighting, Thermal Performance and Natural Ventilation. Build. Simul. 2013, 6, 269–282. [Google Scholar] [CrossRef]
- Ihara, T.; Gustavsen, A.; Petter, B. Effect of Facade Components on Energy Efficiency in Office Buildings. Appl. Energy 2015, 158, 422–432. [Google Scholar] [CrossRef]
- Cho, J.; Yoo, C.; Kim, Y. Effective Opening Area and Installation Location of Windows for Single Sided Natural Ventilation in High-Rise Residences. J. Asian Archit. Build. Eng. 2012, 11, 391–398. [Google Scholar] [CrossRef]
- Yoon, N.; Piette, M.A.; Han, J.M.; Wu, W.; Malkawi, A. Optimization of Window Positions for Wind-Driven Natural Ventilation Performance. Energies 2020, 13, 2464. [Google Scholar] [CrossRef]
- Manigandan, S.; Gunasekar, P.; Devipriya, J.; Anderson, A.; Nithya, S. Energy-Saving Potential by Changing Window Position and Size in an Isolated Building. Int. J. Ambient Energy 2018, 39, 462–466. [Google Scholar] [CrossRef]
- Hawendi, S.; Gao, S. Impact of Windward Inlet-Opening Positions on Fluctuation Characteristics of Wind-Driven Natural Cross Ventilation in an Isolated House Using LES. Int. J. Vent. 2018, 17, 93–119. [Google Scholar] [CrossRef]
- Wang, H.; Chen, Q. A New Empirical Model for Predicting Single-Sided, Wind-Driven Natural Ventilation in Buildings. Energy Build. 2012, 54, 386–394. [Google Scholar] [CrossRef]
- Albuquerque, D.P.; Sandberg, M.; Linden, P.F.; Carrilho da Graça, G. Experimental and Numerical Investigation of Pumping Ventilation on the Leeward Side of a Cubic Building. Build. Environ. 2020, 179, 106897. [Google Scholar] [CrossRef]
- Daish, N.C.; Carrilho da Graça, G.; Linden, P.F.; Banks, D. Impact of Aperture Separation on Wind-Driven Single-Sided Natural Ventilation. Build. Environ. 2016, 108, 122–134. [Google Scholar] [CrossRef]
- Caciolo, M.; Cui, S.; Stabat, P.; Marchio, D. Development of a New Correlation for Single-Sided Natural Ventilation Adapted to Leeward Conditions. Energy Build. 2013, 60, 372–382. [Google Scholar] [CrossRef]
- Ai, Z.T.; Mak, C.M. Modeling of Coupled Urban Wind Flow and Indoor Air Flow on a High-Density near-Wall Mesh: Sensitivity Analyses and Case Study for Single-Sided Ventilation. Environ. Model. Softw. 2014, 60, 57–68. [Google Scholar] [CrossRef]
- Jiang, Y.; Alexander, D.; Jenkins, H.; Arthur, R.; Chen, Q. Natural Ventilation in Buildings: Measurement in a Wind Tunnel and Numerical Simulation with Large-Eddy Simulation. J. Wind Eng. Ind. Aerodyn. 2003, 91, 331–353. [Google Scholar] [CrossRef]
- Aynsley, R. Natural Ventilation in Passive Design. Environ. Des. Guide 2014, 2014, 1–16. [Google Scholar]
- Bramiana, C.N.; Aminuddin, A.M.R.; Ismail, M.A. Investigating Natural Ventilation Performance on Apartment Units in Jakarta Based on Field Test Measurements. J. Des. Built Environ. 2022, 22, 140–186. [Google Scholar]
- Beck, H.E.; Zimmermann, N.E.; McVicar, T.R.; Vergopolan, N.; Berg, A.; Wood, E.F. Present and Future Köppen-Geiger Climate Classification Maps at 1-Km Resolution. Sci. Data 2018, 5, 1–12. [Google Scholar] [CrossRef] [PubMed]
- Kottek, M.; Grieser, J.; Beck, C.; Rudolf, B.; Rubel, F. World Map of the Köppen-Geiger Climate Classification Updated. Meteorol. Z. 2006, 15, 259–263. [Google Scholar] [CrossRef] [PubMed]
- Molina-Aiz, F.D.; Fatnassi, H.; Boulard, T.; Roy, J.C.; Valera, D.L. Comparison of Finite Element and Finite Volume Methods for Simulation of Natural Ventilation in Greenhouses. Comput. Electron. Agric. 2010, 72, 69–86. [Google Scholar] [CrossRef]
- Zawawi, M.H.; Saleha, A.; Salwa, A.; Hassan, N.H.; Zahari, N.M.; Ramli, M.Z.; Muda, Z.C. A Review: Fundamentals of Computational Fluid Dynamics (CFD). AIP Conf. Proc. 2018, 2030, 020252. [Google Scholar]
- Jeong, W.; Seong, J. Comparison of Effects on Technical Variances of Computational Fluid Dynamics (CFD) Software Based on Finite Element and Finite Volume Methods. Int. J. Mech. Sci. 2014, 78, 19–26. [Google Scholar] [CrossRef]
- Blocken, B. Computational Fluid Dynamics for Urban Physics: Importance, Scales, Possibilities, Limitations and Ten Tips and Tricks towards Accurate and Reliable Simulations. Build. Environ. 2015, 91, 219–245. [Google Scholar] [CrossRef]
- Janssen, W.D.; Blocken, B.; van Wijhe, H.J. CFD Simulations of Wind Loads on a Container Ship: Validation and Impact of Geometrical Simplifications. J. Wind Eng. Ind. Aerodyn. 2017, 166, 106–116. [Google Scholar] [CrossRef]
- Richards, P.J.; Hoxey, R.P. Appropriate Boundary Conditions for Computational Wind Engineering Models Using the K-ϵ Turbulence Model. J. Wind Eng. Ind. Aerodyn. 1993, 46–47, 145–153. [Google Scholar] [CrossRef]
- Rasaq, A.K.; Baba, R.A.; Ayomide, G.A.; Oladimeji, A.G.; Idris, O.A. Assessment of Wind Resource for Possibility of Small Wind Turbine Installation in Ilorin, Nigeria. Eng. Appl. Sci. Res. 2015, 4, 42. [Google Scholar]
- Fiuza, G.C.C.; Rezende, A.L.T. Comparison of K-E Turbulence Model Wall Functions Applied on a T-Junction Channel Flow. Int. J. Eng. Res. Sci. 2018, 4, 60–70. [Google Scholar]
- Ai, Z.T.; Mak, C.M. Determination of Single-Sided Ventilation Rates in Multistory Buildings: Evaluation of Methods. Energy Build. 2014, 69, 292–300. [Google Scholar] [CrossRef]
Figure 1.
Chart of temperature measurements from the Kemayoran weather station.
Figure 1.
Chart of temperature measurements from the Kemayoran weather station.
Figure 2.
Chart of average wind speed measured at the Kemayoran Weather Station.
Figure 2.
Chart of average wind speed measured at the Kemayoran Weather Station.
Figure 3.
The case study building (a) 3D view of the building and the surroundings (b) Typical floor plan (c) Apartment unit plan.
Figure 3.
The case study building (a) 3D view of the building and the surroundings (b) Typical floor plan (c) Apartment unit plan.
Figure 4.
The window opening of the apartment unit (a) Opening A is a sliding door in the living room, (b) Opening B is an awning window in the master bedroom, and (c) Opening C is another awning window in the master bedroom.
Figure 4.
The window opening of the apartment unit (a) Opening A is a sliding door in the living room, (b) Opening B is an awning window in the master bedroom, and (c) Opening C is another awning window in the master bedroom.
Figure 5.
Computational domain with building models for CFD simulation with ABL flow.
Figure 5.
Computational domain with building models for CFD simulation with ABL flow.
Figure 6.
The results of ABL simulation.
Figure 6.
The results of ABL simulation.
Figure 7.
The wind contour and vector around the building case.
Figure 7.
The wind contour and vector around the building case.
Figure 8.
The results of mesh sensitivity analysis.
Figure 8.
The results of mesh sensitivity analysis.
Figure 9.
The airflow pattern in the building with different mesh sizes: (
a) coarse mesh; (
b) normal mesh; and (
c) fine mesh. The mesh setting is presented in
Appendix A.
Figure 9.
The airflow pattern in the building with different mesh sizes: (
a) coarse mesh; (
b) normal mesh; and (
c) fine mesh. The mesh setting is presented in
Appendix A.
Figure 10.
Top view of the simulation results with outdoor wind speed (Uref) 1 m/s from the southwest.
Figure 10.
Top view of the simulation results with outdoor wind speed (Uref) 1 m/s from the southwest.
Figure 11.
Top view of the simulation results with Uref 3 m/s from southwest.
Figure 11.
Top view of the simulation results with Uref 3 m/s from southwest.
Figure 12.
Top view of the simulation results with Uref 2 m/s from west.
Figure 12.
Top view of the simulation results with Uref 2 m/s from west.
Figure 13.
The simulation results of different window positions towards the wind direction with Uref 1 m/s (a) Position 1 is west windward while Opening C is windward, (b) Position 2 is south windward while Openings A and B are windward, (c) Position 3 is east leeward while Opening C is leeward, and (d) Position 4 is north leeward while Openings A and B are leeward.
Table 1.
Summary of CFD simulation setup.
Table 1.
Summary of CFD simulation setup.
| Settings | Value |
|---|
| Turbulence model | R.A.N.S. with: k-ε turbulence model |
| Domain fluid properties | Air, incompressible fluid |
| Inlet | Velocity profile (UZ), kinetic energy (k) and dissipation rate (ε) |
| Outlet | Pressure = 0 |
| Boundary | Side boundary: symmetry, slip
Ground surface: no slip |
| Interior wall | Building and interior |
| Verification | |
| Validation | Results of field measurements |
Table 2.
Numerical simulation results of Taman Anggrek Residence on various wind speeds and angle.
Table 2.
Numerical simulation results of Taman Anggrek Residence on various wind speeds and angle.
| Outdoor Wind Condition | Simulated Results of Velocity Magnitude at the Reference Point (m/s) | Measured Indoor Air Velocity at the Reference Point (m/s) |
|---|
| Bedroom | Living Room | Bedroom | Living Room |
|---|
Wind speed: 1 m/s
Wind angle: SW | 0.044151
(Re: 32.881) | 0.0093505
(Re: 7.9174) | 0 | 0 |
Wind speed: 2 m/s
Wind angle: W | 0.39971
(Re: 386.21) | 0.052069
(Re: 49.116) | 0.4 | 0 |
Wind speed: 3 m/s
Wind angle: SW | 0.14312
(Re: 109.50) | 0.028541
(Re: 25.351) | 0.1 | 0 |
Wind speed: 3.6 m/s
Wind angle: W | 0.7234
(Re: 697.19) | 0.086335
(Re: 90.526) | 0.6 | 0 |
Wind speed: 4 m/s
Wind angle: W | 0.80553
(Re: 775.03) | 0.096096
(Re: 100.96) | 0.6 | 0.1 |
Table 3.
Indoor velocity magnitude from different window positions.
Table 3.
Indoor velocity magnitude from different window positions.
| Wind Direction | Velocity Magnitude at the Reference Point (m/s) |
|---|
| Bedroom | Living Room |
|---|
| Outdoor wind speed 1 m/s | | |
| Position 1: Opening C on the windward side | 0.1987 | 0.0259 |
| Position 2: Opening A and B on the windward side | 0.1298 | 0.0159 |
| Position 3: Opening C on the leeward side | 0.0182 | 0.0499 |
| Position 4: Opening A and B on the leeward side | 0.0294 | 0.0245 |
| Outdoor wind speed 2 m/s | | |
| Position 1: Opening C on the windward side * | 0.4007 * | 0.0520 * |
| Position 2: Opening A and B on the windward side | 0.2549 | 0.0343 |
| Position 3: Opening C on the leeward side | 0.0369 | 0.1027 |
| Position 4: Opening A and B on the leeward side | 0.0597 | 0.0465 |
| Disclaimer/Publisher’s Note: The statements, opinions and data contained in all publications are solely those of the individual author(s) and contributor(s) and not of MDPI and/or the editor(s). MDPI and/or the editor(s) disclaim responsibility for any injury to people or property resulting from any ideas, methods, instructions or products referred to in the content. |
© 2023 by the authors. Licensee MDPI, Basel, Switzerland. This article is an open access article distributed under the terms and conditions of the Creative Commons Attribution (CC BY) license (https://creativecommons.org/licenses/by/4.0/).

 ,
, 


