1. Introduction
Climate change is a consequence of global warming, generated by excessive amounts of carbon dioxide (
) emitted to the environment [
1]. Some consequences of climate change are an increasing number of droughts, floods, and melting glaciers [
2].
emissions are released to the atmosphere mostly as a result of human activities, where fossil fuels combustion for power generation and energy consumption are the main emitters [
3,
4,
5,
6,
7,
8,
9]. Acaroglu et al. [
7] observed the direct relationship between climate change and energy consumption. They showed that if energy came from renewable sources, energy consumption would not increase the Earth’s temperature while maintaining economic growth.
Other authors in [
6] evidenced a positive direct relationship between the
increase in emissions, and global growth of the gross domestic product (GDP). They also showed how this emissions increment comes from a more intensive use of energy to keep higher living standards, but also causes the degradation of many environmental systems [
8].
The built environment is one of the biggest energy consumers these days. According to Nejat et al. [
10], global energy consumption is approximately distributed as follows: 35% from residential and commercial buildings, 29% from the industry, 33% from transportation, and 3% for other uses. Similar percentages can be found in Chile, where this study was developed: 23% from buildings, 40% from the manufacturing industry (including mining operations), 33% from transportation, and 4.2% from other uses [
11].
To reduce energy consumption, increasing energy efficiency is one of the most effective approaches with potentially lower environmental impact [
12]. Energy efficiency measures in buildings can be classified into active and passive strategies. Active strategies involve energy consumption to achieve some predefined level of indoor environmental comfort. This is the case with heating, ventilation, and air conditioning (HVAC) or artificial lighting. Active strategies could be very efficient in their energy use but still involve energy consumption for their operation.
Conversely, passive strategies do not consider energy consumption to achieve a reduction of the building energy demand [
13,
14]. Some examples of passive strategies are elements for solar control gains, thermal insulation, natural light, air infiltration mechanisms, and natural ventilation [
15,
16]. Most of these elements need to be considered at the architectural and planning stage of the building. They can also involve complementary elements such as landscaping or surrounding objects (sometimes other buildings). Most of these elements and strategies also entail lower investments when considered at the building design stage.
Some passive strategies related to landscaping are the incorporation of water elements (pools, wetlands), hardscape materials (bricks, stones), and vegetation (trees, bushes) [
17]. These elements significantly contribute to the hygrothermal comfort of their surrounding spaces, but also protect human beings from solar ultraviolet (UV) radiation [
18]. Particularly, trees decrease the temperature around them while providing visual comfort and mental health. They also protect biodiversity and reduce urban heat islands. Hence, trees are especially beneficial in locations with high temperatures [
19,
20,
21,
22].
Among them, deciduous trees have advantages in climates with hot summers and cold winters [
17]. Deciduous trees lose their leaves in autumn, renewing them again in spring. This way, they do not impede solar radiation when more thermal energy is needed in the building (autumn, winter), yet they partially block the solar radiation when the temperature is high (spring, summer) [
23]. However, although this contribution is recognized, neither the reduction of solar radiation they generate nor their variation for different types of deciduous trees have been fully addressed. That is why, in this paper, we propose a low-cost, fast, and simple method to measure how effective deciduous trees are when they are blocking solar radiation. Our results will help building designers when anticipating solar control strategies in building energy assessments.
1.1. Literature Review
As mentioned earlier, deciduous trees can be used for passive energy conservation in buildings. During the winter, they allow solar irradiance to trespass on the empty spaces between their branches. In summer, their leaves partially block solar radiation, providing a cooler thermal sensation, while they also contribute to reducing the carbon footprint. Trees also increase soil humidity around them as a consequence of the temperature reduction wherever their shade is projected.
However, what is the real impact of deciduous trees on solar radiation control during summer? It is difficult to quantify, mostly because of their organic nature [
24,
25,
26]. Some variables are the tree’s age, biochemical trails, canopy structure, phenological events (flowering), and other disturbances (such as droughts), which make it difficult to obtain consistent results [
27,
28,
29,
30]. This great variability suggests the need to study the average contribution of deciduous trees in solar control. However, this contribution is expected to suffer from high variability, depending on the tree. This is why we analyze different types of deciduous trees and use an easy-to-implement and low-cost equipment method to measure that contribution. This way, other researchers and building practitioners will be able to replicate our measurements in different contexts.
Studies developed by some researchers determined that the effect on building energy savings as a result of tree shades remains between 8.8% and 40% [
23,
24,
31,
32]. More specifically, authors in [
23] determined that deciduous trees generate 15% cooling savings on the west and east façades of a building, 7% on the north one, and a maximum of 40% heating energy savings. Other authors have investigated the benefits of tree shades in building energy savings [
33,
34]. For example, some of them studied some shade characteristics (extension and quality) to predict the temperature of exterior walls [
24]. Others studied the influence of long-wave and short-wave thermal radiation influence of trees at different locations around the west wall of buildings in summer [
35]. Similarly, [
31] evaluated the impact of trees on the indoor and outdoor thermal comfort and energy demand in courtyard buildings in Iran. All this research generated interesting advances in the effect generated by the shade of trees on the energy efficiency of buildings. However, when it comes to building energy assessments, those results can be hardly transferred to other climates, especially when the building envelope properties and the internal loads are different.
Namely, there is still a significant lack of information about the spectral irradiance blocked by a deciduous tree shade. By knowing the different wavelengths of the light spectrum trespassing the tree’s branches and leaves, it should be possible to determine the amount of energy that is effectively controlled by the tree and arrives at its shade. This is why our study involves all light wavelengths to produce representative results from a varied set of deciduous trees. This will allow future studies to derive other variables, such as the temperature or spectrum range under the shade of different types of deciduous trees.
Additionally, when performing previous research studies, different data collection and processing methods have been used (field measurements, numerical simulation methods, thermal infrared remote sensing, etc.) [
35,
36,
37,
38,
39].
1.1.1. Processing Methods
In general, there are two types of numerical simulation methods commonly used when modeling urban climates and microclimates: the energy balance model and computational fluid dynamics. Energy balance models are based on heat flow stabilization, whereas fluid dynamics models use fluid dynamics equations such as conservation of energy, mass, and momentum. Among the latter, a software widely used to simulate the impact of vegetation in cities is the ENVI-met simulation software [
36,
40,
41,
42]. ENVI-met includes a microclimate model for simulating the interactions between buildings and green areas in a urban environment. However, its accuracy ultimately depends on the input data quality. In the absence of solar control values to be applied as a function of the type of the tree, the margin of error of the results is uncertain.
1.1.2. Data Collection Methods
Authors in [
43] used a mobile, up–down lifting tower, and an autoleveling instrument-mounting platform with UV radiation sensors to gather representative spectral light information projected on a building. The authors of [
18] measured the UV light with electronic dosimeters between 11:00 to 14:00 to obtain a UV protection factor. However, these approaches failed to capture the effect of a tree shade across all light wavelengths; hence, they were unable to obtain the amount of irradiance present in the shade of the tree. That is why, in our study, we use a spectrometer to measure the solar irradiance trespassing on a tree shade, and with it, we are able to quantify the solar radiation controlled by trees when they are located around a building. This information allows building designers to feed existing software with more realistic data and to estimate the temperature more accurately beneath a tree shade. It will also help them to select the most suitable deciduous tree according to the climate conditions and energy efficiency strategies adopted in each building project.
2. Materials and Methods
2.1. Location
This research was conducted in the central valley of Chile. Chile is a country with different climatic zones due to its 3800 km length. In this country, some effects of climate change have become evident: droughts in most of its territory, melting glaciers, stronger wind gusts, and intense rains in short time periods [
44,
45].
The central valley of Chile has a Mediterranean climate, with hot temperatures during summer and cold winters. Summer lasts around 5 months, with an average maximum temperature of 30 °C, including an average day temperature of nearly 20 °C [
46]. In this region, the insolation rate in January (summer in the southern hemisphere) is 7047 Wh/m
per day [
47]. Nevertheless, climate change is currently extending the hot seasons’ duration [
45].
The season with low temperatures in the central valley of Chile takes place between May and August. In those months, the average temperature remains around 7 °C and the average minimum temperature around 4 °C. Additionally, in July (the central month in the winter), the insolation rate drops to 1825 Wh/m
per day [
47]. Under these conditions, buildings require solar control in months with high temperatures and solar gains in colder months. Thus, deciduous trees represent a suitable alternative to achieve both aims.
There is a wide variety of trees in every climate. That is why this piece of research analyzes the shade of five deciduous trees that can commonly be found in Mediterranean climates (and also in the central valley of Chile). As described later, a spectrometer is used for performing field measurements. The measurements are taken from noon to afternoon, for a future application of these results in west façade building energy simulations. However, other factors such as tree size, nutrition, growth rate, age, and soil quality, which can affect the physical conditions of the tree, are not analyzed in this work. The reason is that these factors could considerably expand the scope of this research and so will be left for future research. Yet, an important contribution of this study is that our method approach can be easily reproduced in any other conditions and locations.
2.2. Instruments
A convenient device for measuring the amount of energy of the light spectral irradiance is the spectroradiometer, or spectrometer for short. Spectrometers measure the amount of electromagnetic radiation (EMR) passing through a substance. The EMR reduction measured by this device represents the reflection and interferences that occur in the body of the substance.
Spectrometers are widely used in chemistry, biochemistry, genetics, and molecular biology, as they allow quantifying the amount of light absorbed at a specific wavelength [
48]. Similarly, they also allow indirectly quantifying the amount of chemical substances contained in a solution [
48,
49]. Additionally, most spectrometers allow the analysis of a wide range of energy frequencies of spectral irradiance, generally between gamma rays and radio waves [
50].
The advantages of spectrometers are their ease of use, and that they allow quick and quantitative measurements [
51,
52]. For example, the authors in [
27] used a spectrometer to measure the leaf reflectance of different trees, determining the leaf pigments variation among species. However, to the best of our knowledge, a spectrometer has never been used to determine the spectral irradiance of a tree shade.
A spectrometer is capable of breaking down the light it receives into different wavelengths. Each wavelength has a determined irradiance level depending on its frequency. This allows measuring the total amount of energy of the light spectrum. In the case of trees, their leaves mostly use energy from the visible spectrum to perform photosynthesis. These are known as photosynthetically active regions (PARs), which absorb (instead of reflecting, as do most inorganic materials) most of the energy during this process.
However, within the spectral irradiance, the PAR (corresponding to the visible spectrum between 400 nm and 650 nm) represents approximately 45% from the global solar radiation (GR) [
53], whereas IR radiation (between 650 nm and 4000 nm) represents approximately 50% of solar radiation. Hence, more than 70% of light is reflected by and transmitted from leaves. These amounts are similar across different tree species [
54].
The authors in [
55] used a spectrometer to measure the spectral distribution in a thinned Sitka spruce (Picea sitchensis) forest at noon for three days. They proved the effectiveness of solar radiation to penetrate the tree canopy during cloudy, overcast, and clear sky days, allowing the trees to keep their photosynthesis activity.
More research attention has been given to the analysis of UV light (between 280 nm and 400 nm). There are a few researcherswho have performed studies focusing on the UV end of the light spectrum [
56,
57,
58,
59,
60]. For example, the authors of [
58] developed a UV radiation mathematical model under the shades of Korean trees, while in [
59], they determined the percentage of the UV spectrum that tree leaves reflect and transmit. On the other hand, in [
60], the authors resorted to polysulphone films adhered to the ground where the shade of a tree was projected to estimate a UV protection factor on a clear sky day. However, the study that most resembles our work is the impact analysis of the UVB (280 nm–320 nm) and UVA (320 nm–400 nm) spectrum presented in [
57] regarding the shade of five typical Australian trees. The authors of that study took three measurements in the shade of the tree with a spectrometer on a sunny day in summer. They determined that the average ratio of the UV irradiance was 26% lower under the shade compared to the same spectrum in the sun. However, the objective of that study was to determine whether the UV present in the shade exceeds the occupational limit for UV exposure; thus, it lacked many operational and applicable details for buildings energy efficiency design.
2.3. Research Method
The method proposed below seeks to present an alternative that is easy to implement, cheap, and without the need for advanced knowledge to quantify the shading efficiency of different types of deciduous trees during the hot season. As shown in the introduction, the solar control effect of trees is recognized, hence its impact as a passive energy efficiency measured in buildings. The use of the spectrometer with the ASTM G-173-03 standard (created by the American society for testing and materials) allows the replicability of the proposed method, allowing its application in other trees and in other geographical locations. The instruments (spectrometer), tool (the ASTM G-173-03 standard), and the trees analyzed are described below. The workflow summary of the study is also included at the end.
2.3.1. Spectrometer
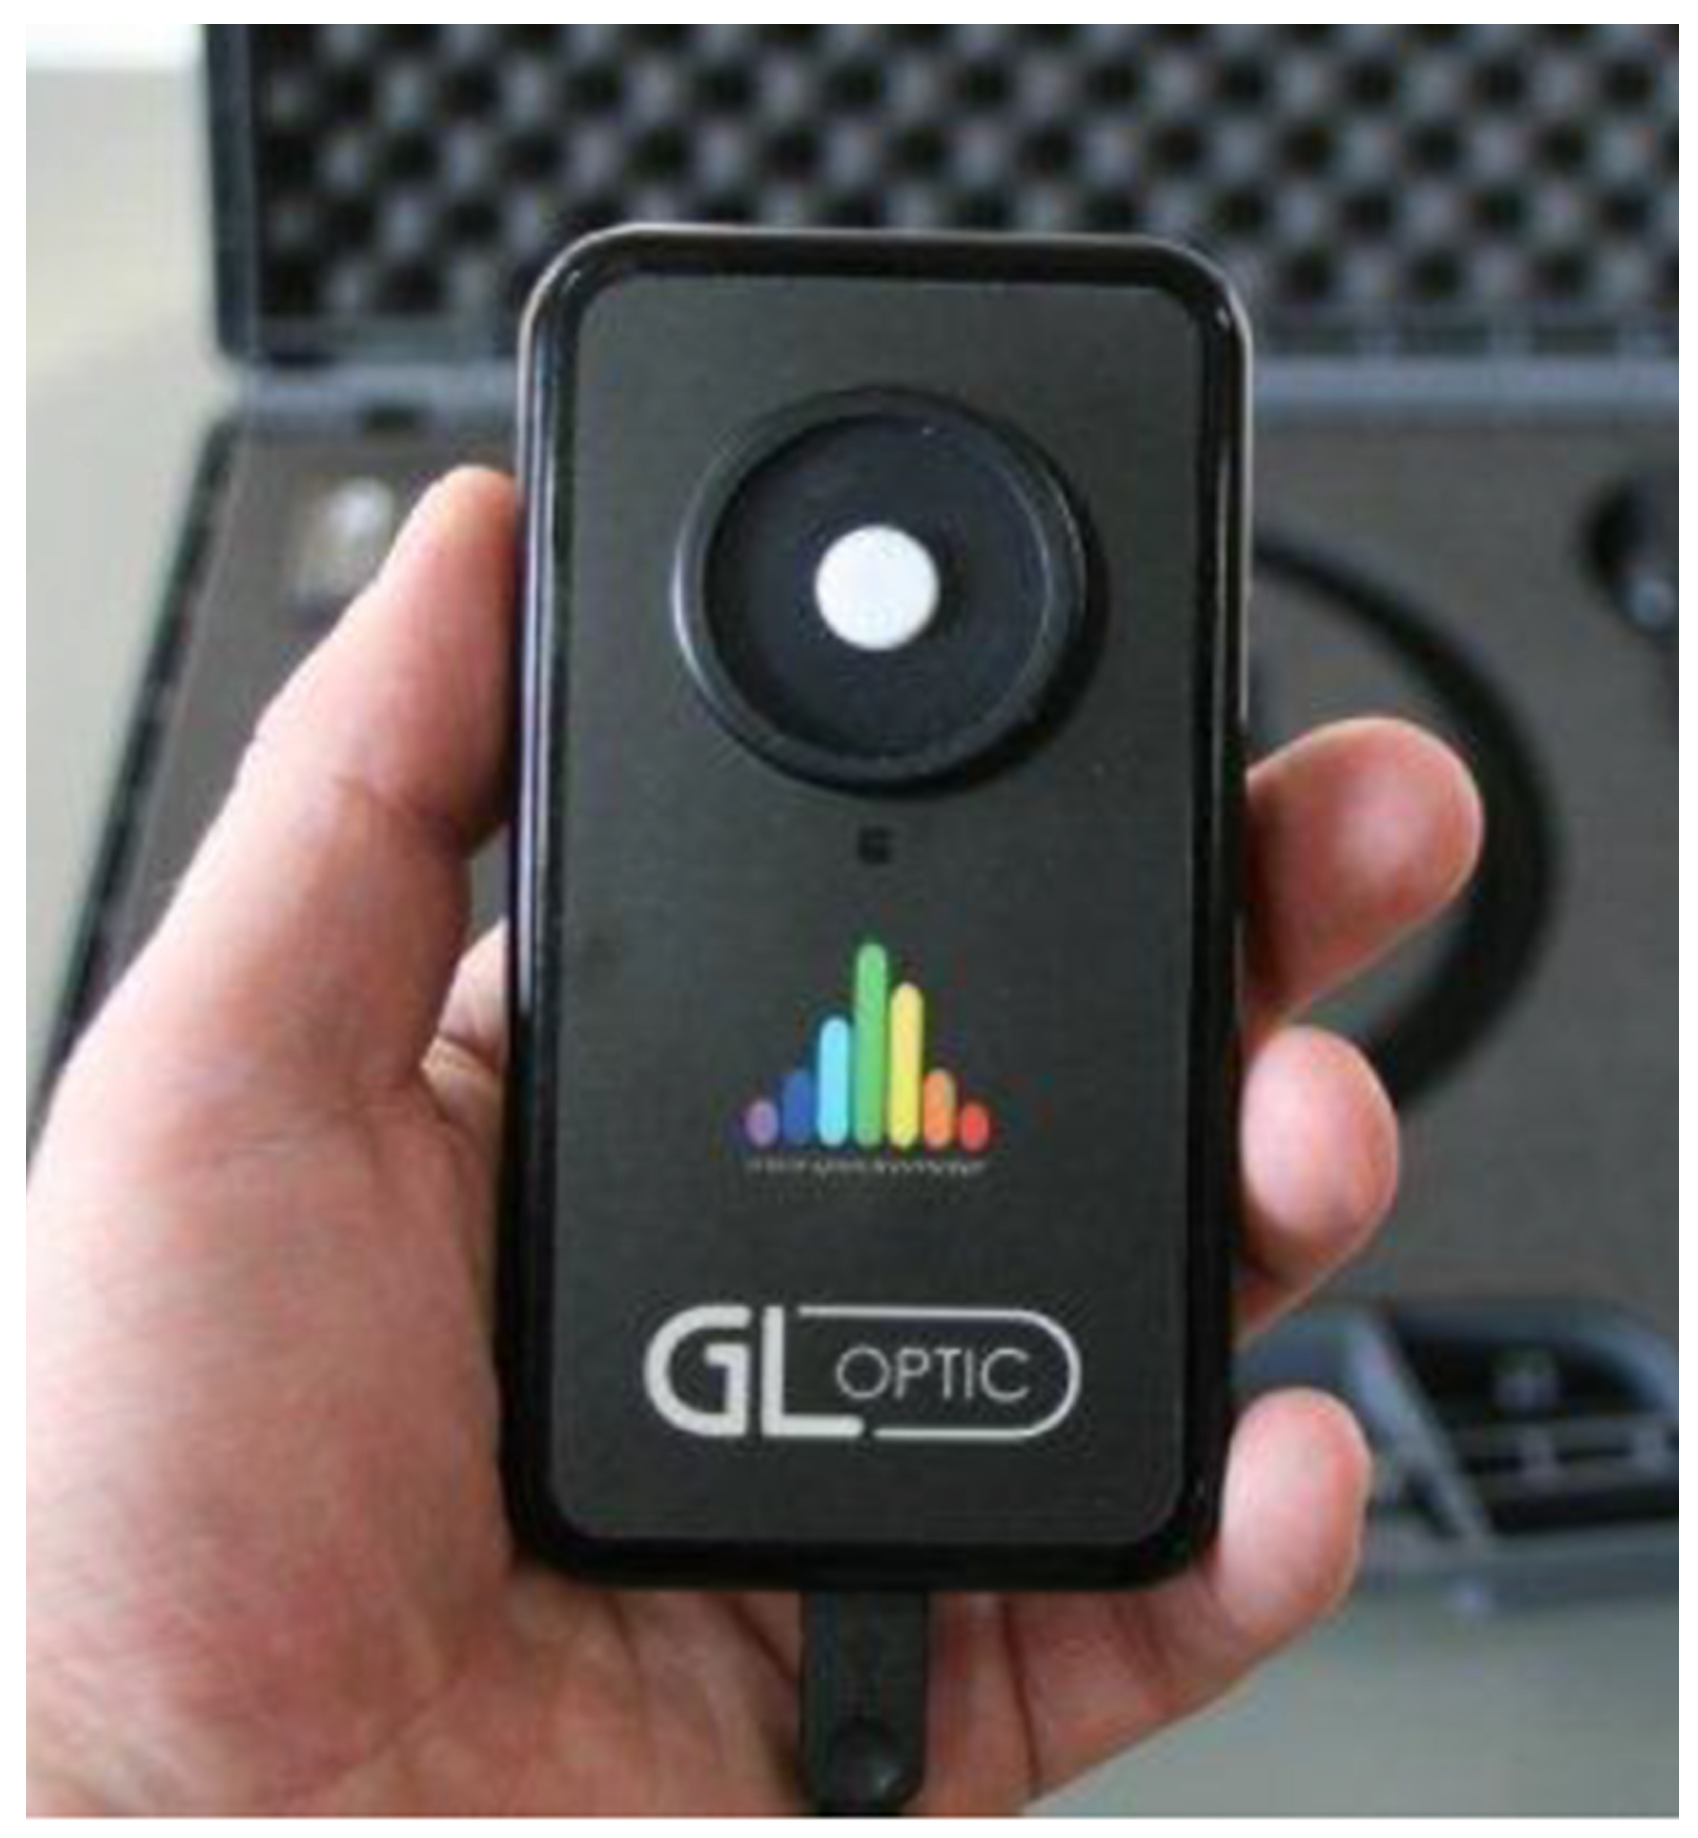
For performing this research, we used the “GL Optic Mini-Spectrometer” and the “GL Optic SpectroSoft” software. The selected spectrometer has a handy size, which makes it appropriate for field measurements (
Figure 1). It has a spectral range of 339–750 nm, and a physical resolution of 1.7 nm–1.8 nm. This equipment also receives and analyzes the UV–visible light, converting it to an electric signal [
50]. The GL Optic SpectroSoft software is a spectral analysis tool for color calculation conforming to CIE 1931 2° XYZ; xy; CIE 1964 10°, uv; u’v’. With this equipment, we analyzed the EMR present in the tree shades, which are made up of diffuse radiation, but mainly of the radiation trespassing the tree canopy. We also used this equipment to obtain the GR by measuring directly pointing at the sun. Hence, by comparing EMR measurements directly facing the sun with those that have the tree canopy in between (under the shade), we managed to estimate the amount of energy that a tree can control.
2.3.2. On-Site Spectral Solar Irradiance
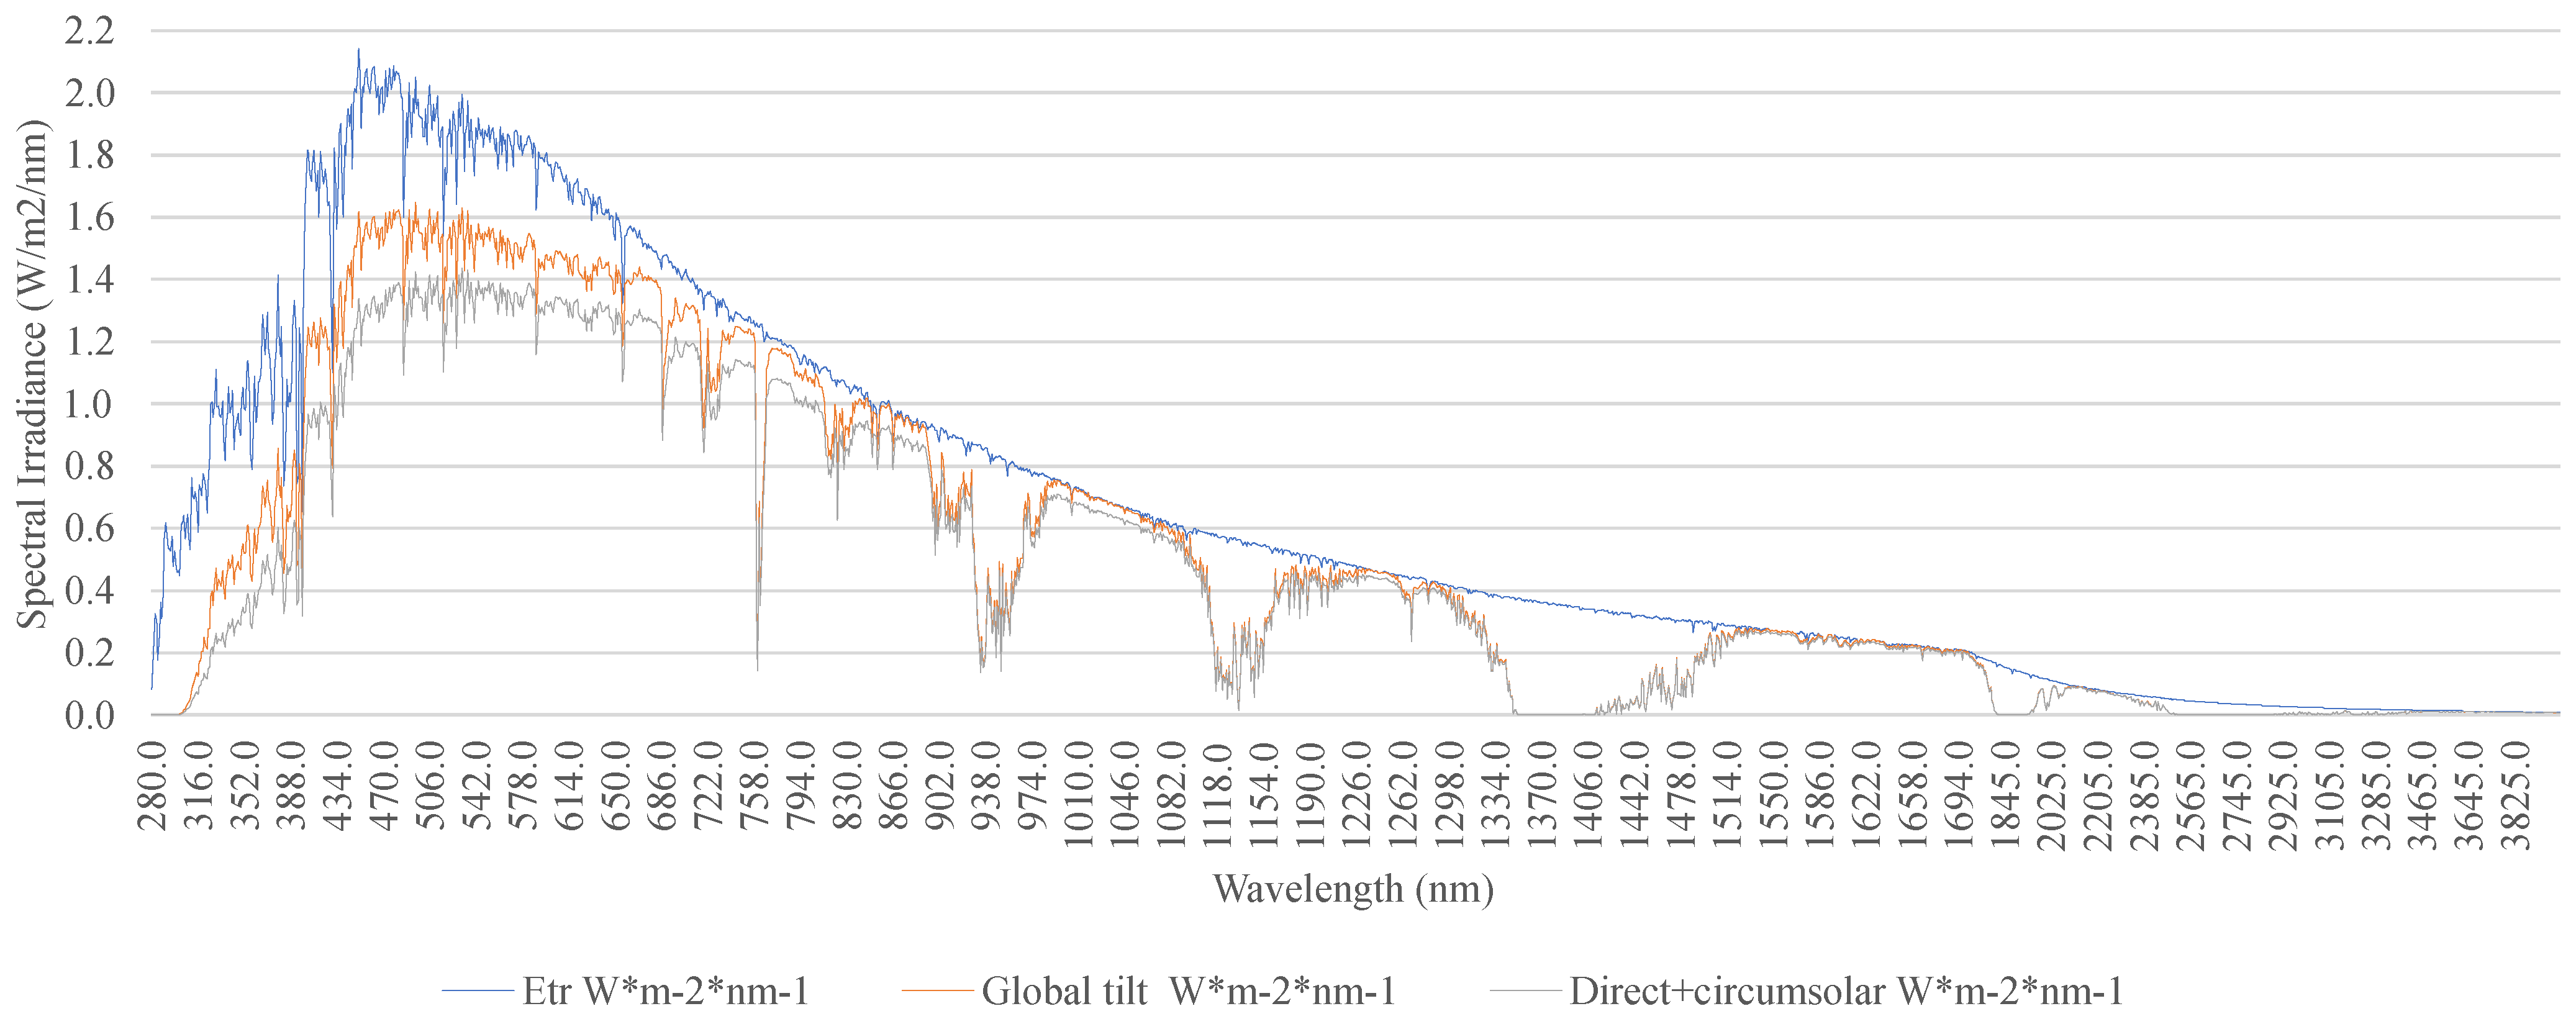
We also used the ASTM G-173-03 standard as a reference for calculating the solar spectral irradiance on site. This standard emerged intending to normalize the information gathered from the solar light spectrum for photovoltaic systems, determining the relative optical performance of materials. This standard was drafted by the American Society for Testing and Materials (ASTM) and the US government. They developed two terrestrial solar spectral irradiance distribution standards. The two spectra encompass a direct normal spectral irradiance model and a standard total (global, hemispherical, within 2-pi steradian field of view of the tilted plane) spectral irradiance model. Both reference spectra incorporated in the ASTM G-173-03 standard (see
Figure 2) can provide solar radiance data for our context and allow comparison with our measurements.
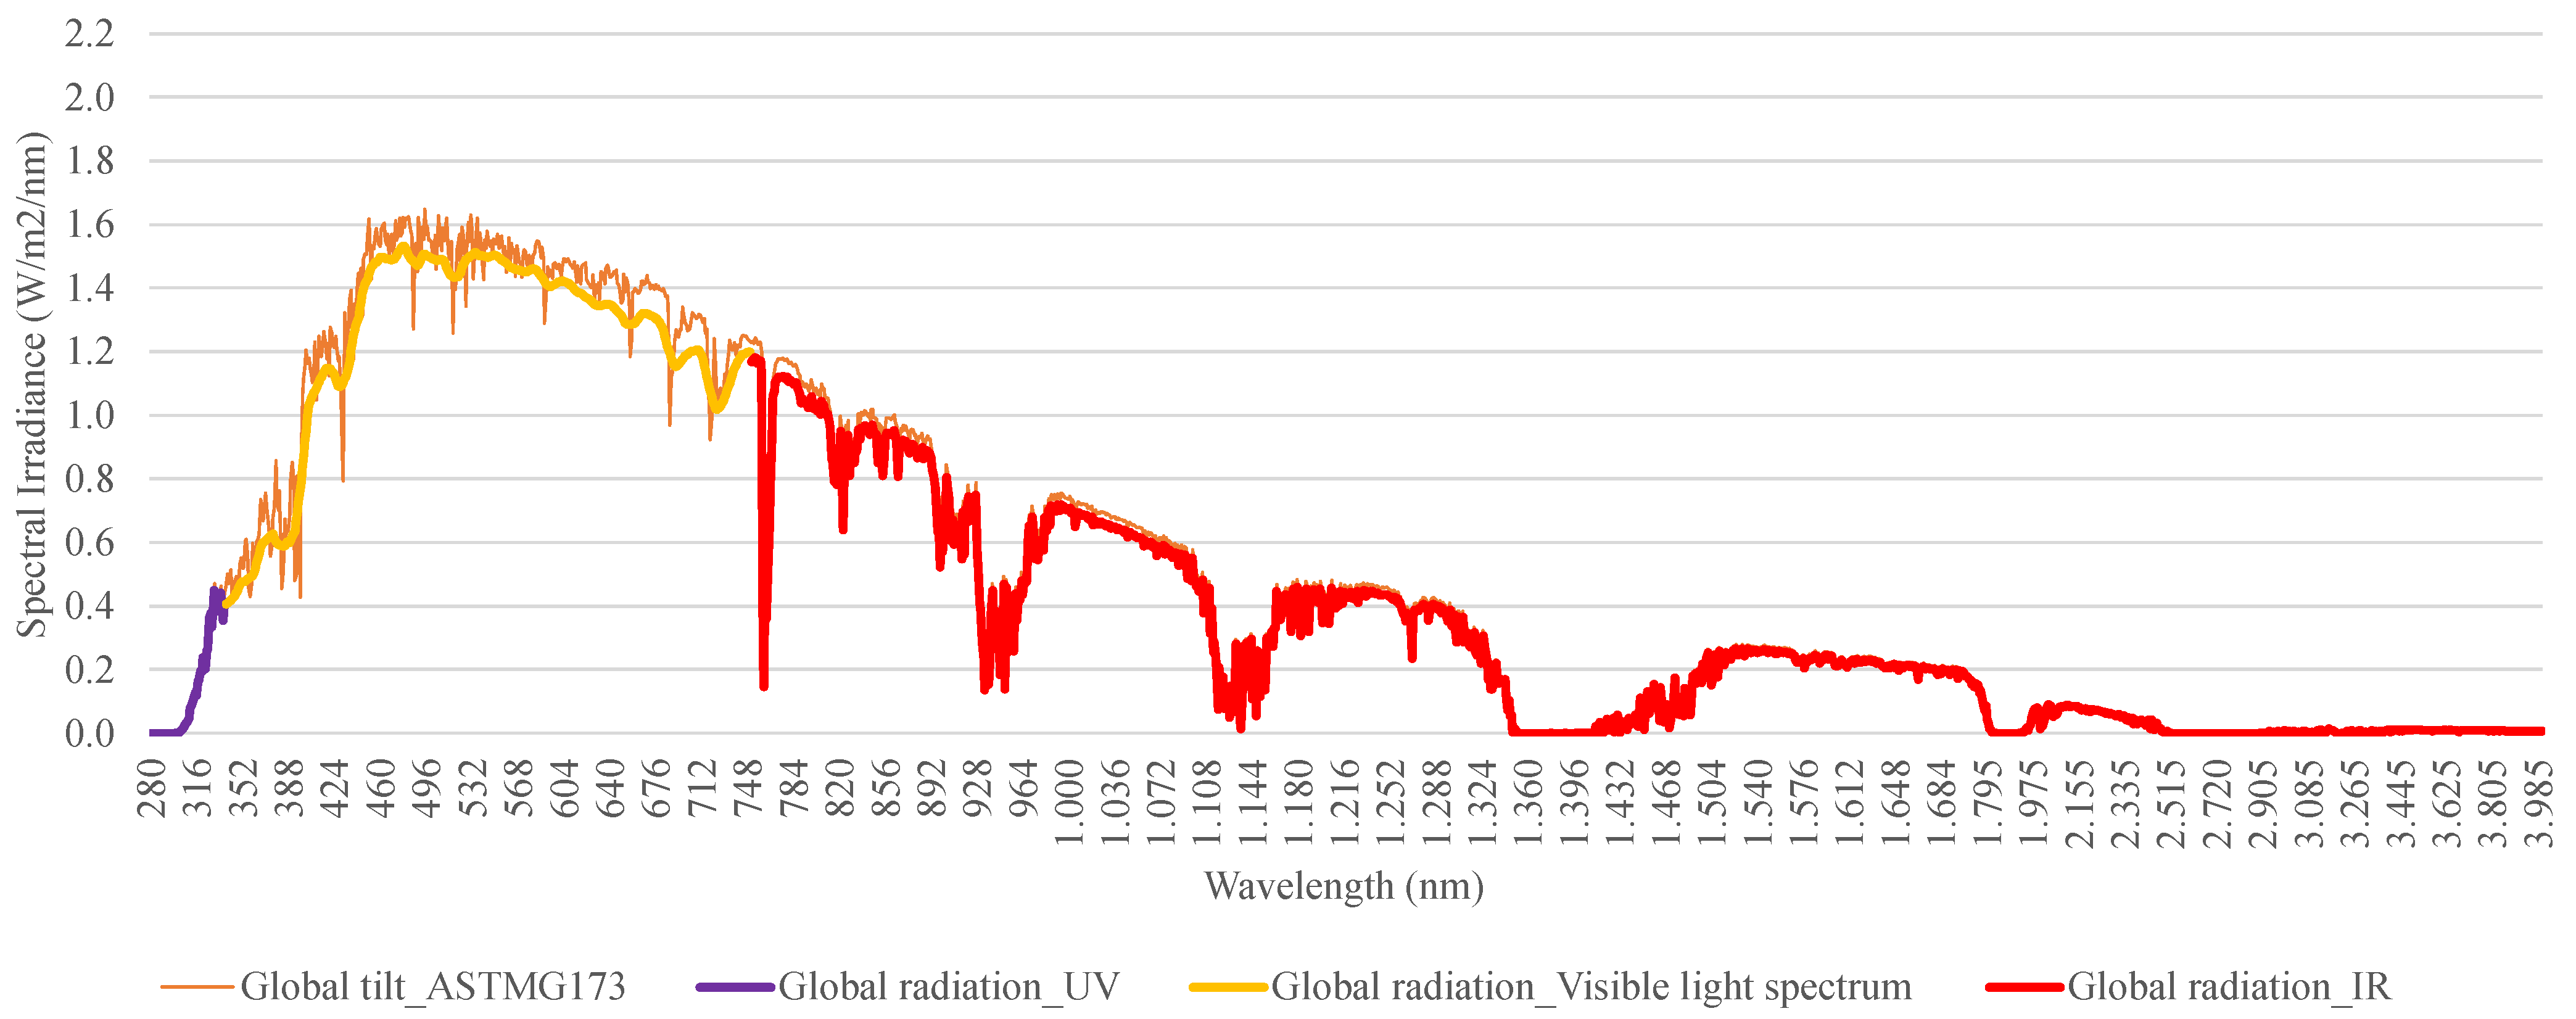
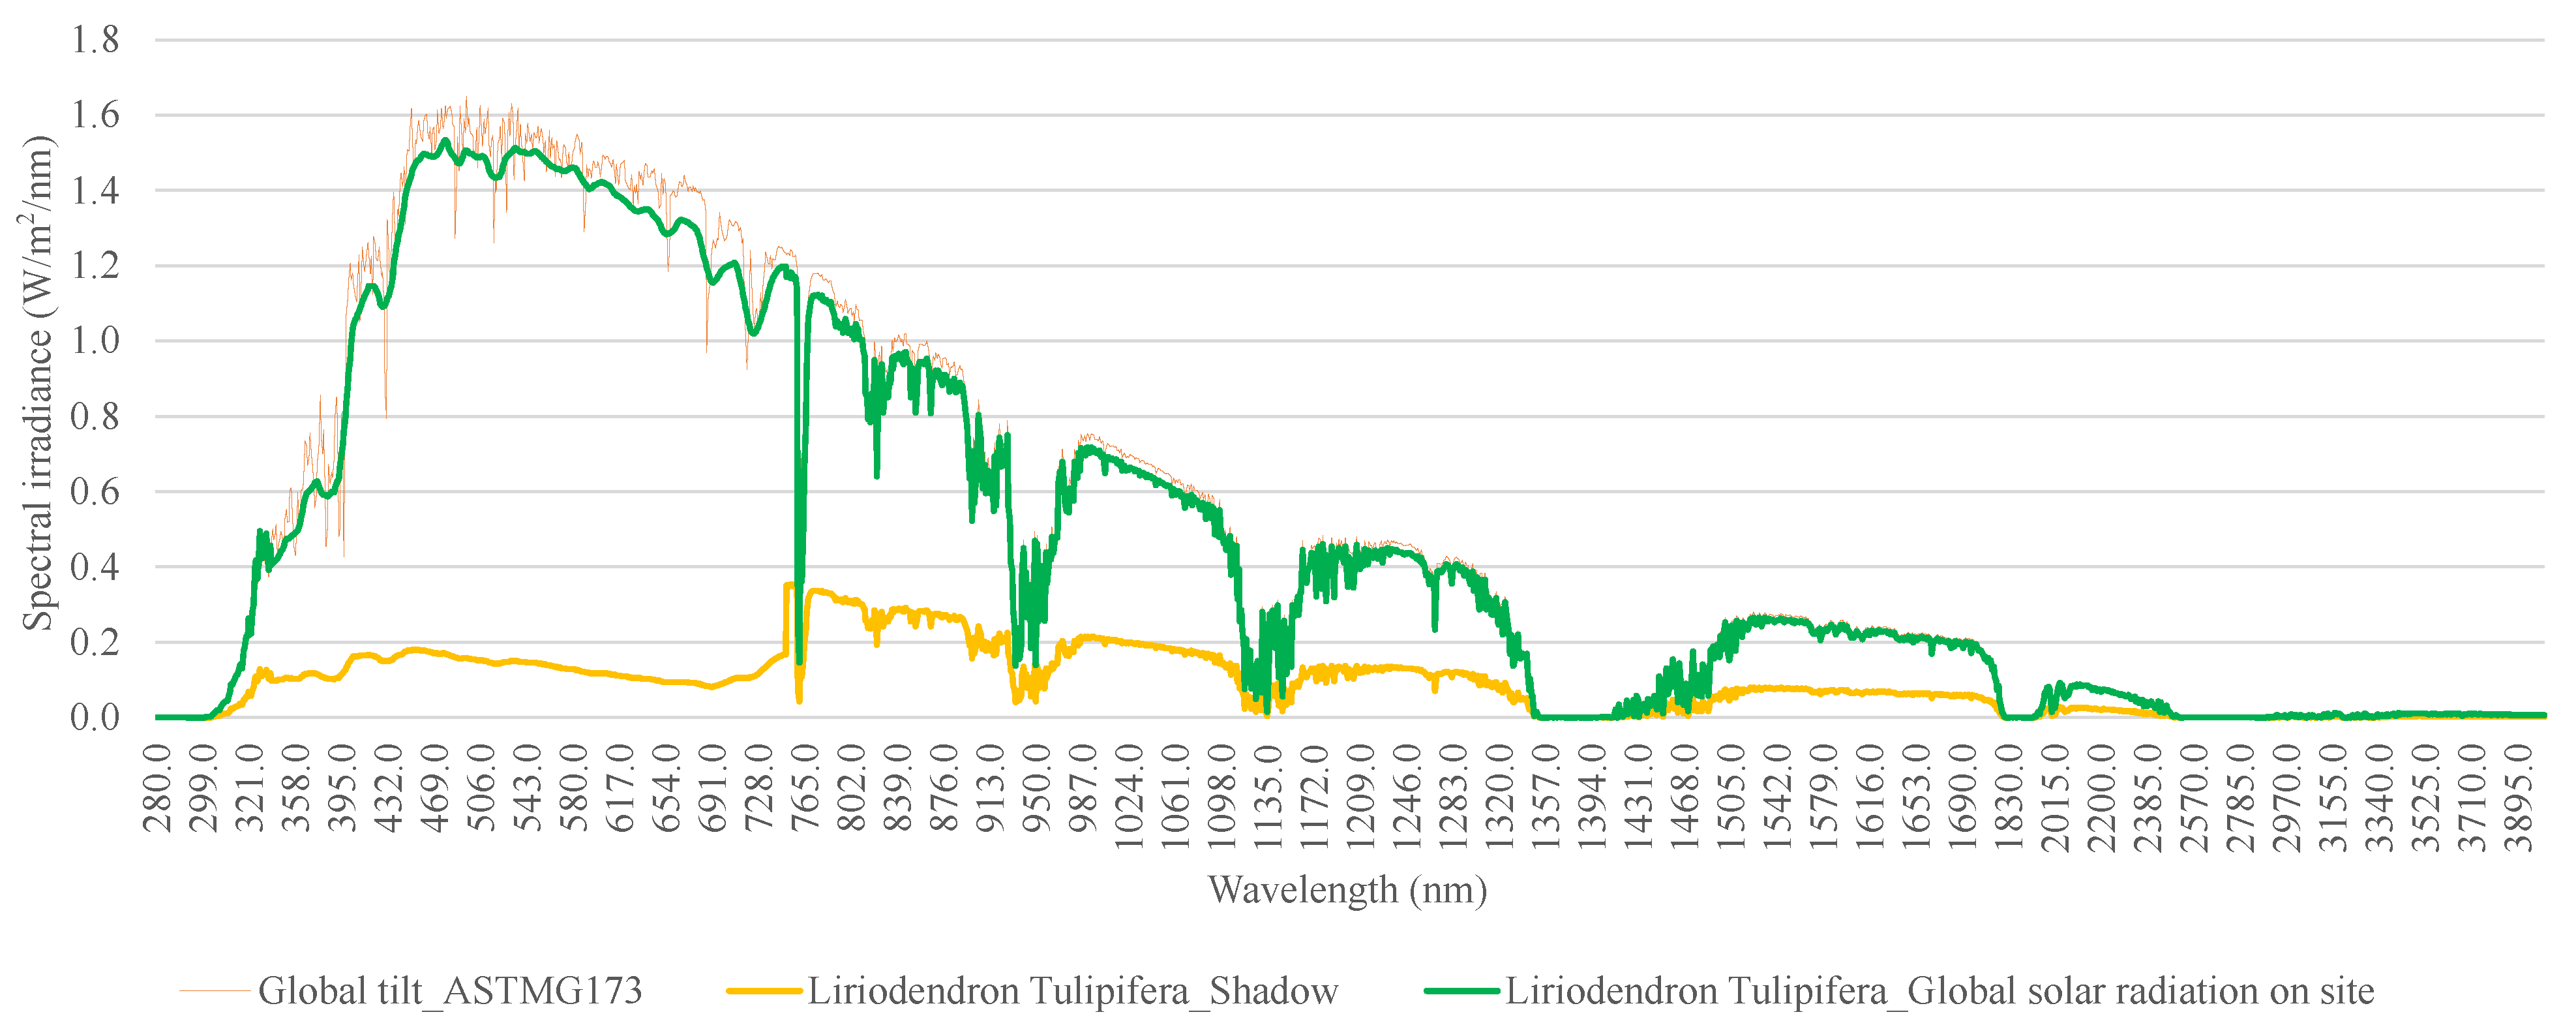
Namely, we used the global normal spectral irradiance model, as it involves the direct and indirect components contributing to the total global (hemispherical) light spectrum. The validation of its use in this paper is carried out by comparing the global radiation curve of the ASTM with the measurement of the spectrometer pointing at the sun, obtaining a difference of 5% regarding the GR measured with the spectrometer. This normalized spectrum allowed us to complete the IR and UV ends of the spectrum that could not be measured by our optical spectrometer on site (
Figure 3).
2.3.3. Types of Studied Trees
The research was conducted on five types of deciduous trees:
(Tulip),
(Liquidambar),
(Maple),
(Melia or White Cedar), and
(Plum). Images of these trees can be found in
Table 1.
These species were chosen because they are common in regions with Mediterranean climates and also in the central valley region of Chile. However, these trees can also be found in different parts of the world, such as coastal, mountainous, and valley regions. These trees are common in areas with an abundance of solar radiation in the summer, whose soils vary from dry to high humidity [
61,
62,
63,
64]. These species are also frequently used for solar control in buildings. The sample trees we used in our measurements comprised adult trees with no elements nearby that could affect our measurements.
2.3.4. Measurements of the Solar Control Carried out by the Tree
To ensure consistency, the measurements in the shadow of each type of tree were always taken by orienting the spectrometer directly to the sun, always on a cloudless day, and between 12:00 to 16:00 h as reported in the
supplementary data. The latitude and longitude of the place were approximately −34.81771° and −71.23644°, respectively. The measurements were taken between 17–20 February 2017, with a clear sky. The altitude and azimuth in which the spectrometer was oriented corresponded to 53.82° and 55.42°, respectively, at 12:00 h, until reaching 53.30° and 303.82° at 16:00 h. This time interval was defined as starting at 12:00 (noon) as this is the time (for future applicability of these results) when trees usually cover the west façade of a nearby building, hence enabling solar gain control. From 16:00, however, the sun position casts shadows from nearby elements overlapping with the trees’ shadows on most buildings. From 16:00 onwards, the temperature also usually starts to decrease (though slowly).
Hence, 12:00–16:00 with hourly measurement intervals was deemed a representative sampling range. Hourly measurement intervals were also deemed appropriate as they captured significant time deviations in the EMR, but did not entail excessive fieldwork.
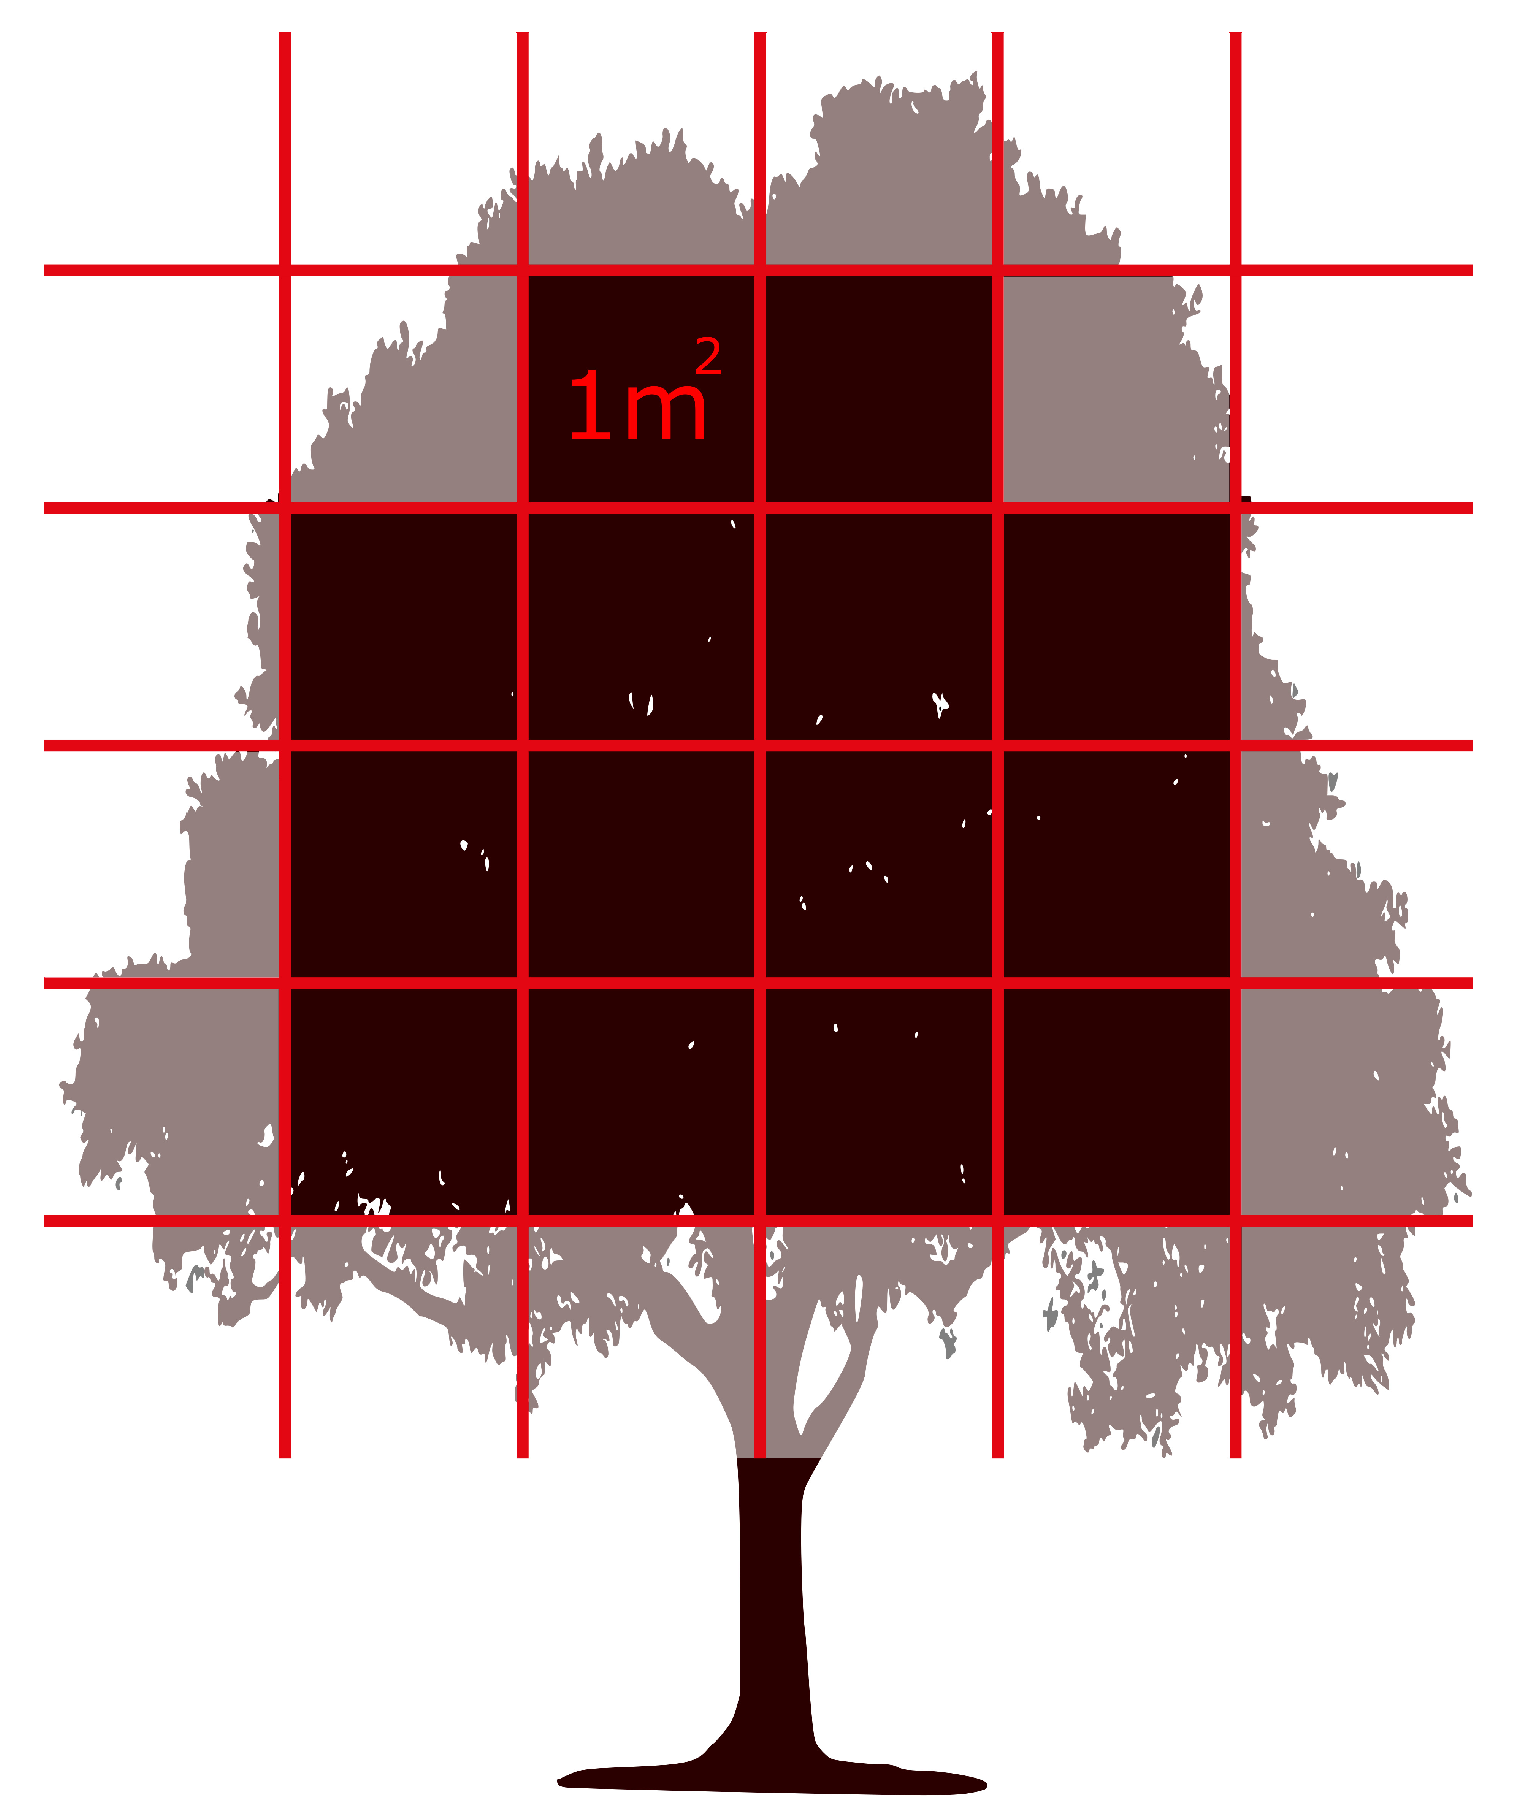
To consider the potential shade heterogeneity (because of the leafless areas of the canopy), several shots were taken under the shade of the tree while pointing at the sun holding the spectrometer on a tripod (see
Figure 4) to ensure homogeneous measurement conditions (azimuth, altitude). To facilitate this task, the shadow of each tree was divided into quadrants with a 1 m
2 grid. Every hour, a solar radiation measurement with the spectrometer was taken for each quadrant. It should be noted that the grid was drawn on the ground where the shade of the tree was present, as shown in
Figure 4. Thus, the measurements are representative of the reduction generated by the tree. Namely, measurements were taken covering the central part of the tree shadow, neglecting the borders (see
Figure 5). An average of 14 quadrants were obtained for each tree that was measured. Then, an average value of solar radiation was calculated for every hour for each tree.
As mentioned earlier, to determine the GR, one shot was made by pointing directly at the sun every hour from 12:00 to 16:00. This allowed us to obtain, by its difference with the average solar radiation values obtained under the tree shade, the EMR value blocked by that tree at that particular time of the day. To calculate this difference, the GL SpectroSoft software was used to extract and process the measurement data.
The GL SpectroSoft software displays the solar light radiation measured of each shot in a two-dimension graph on a Cartesian plane such as the one shown in
Figure 6. In this figure, the X-axis represents the wavelengths, mainly of the visible light spectrum (from 339 nm to 750 nm), and the Y-axis represents the global irradiance magnitude in milliwatts (mW) per square meter (m
2), that is, mW/m
2.
Hence, all measurements had to be stored numerically (one (X, Y) point per wavelength and global irradiance) through several spreadsheets resembling the one shown in
Table 2, where:
Tree: scientific name of the species.
Hour: time of the day at which the measurements were performed.
Measurement date: calendar date of the measurements.
Direct measurement to the sun: represents the GR, capturing the direct and diffuse solar radiation.
Measurements 1…n: measurements collected under the shade of the tree in quadrants 1…n.
Wave: spectrum wavelength, measured in nanometers (nm).
Value: global irradiance delivered by the spectrometer based on each wavelength, and measured in milliwatts/square meter (mW/m2).
This way, the visible light spectrum (between 400 nm and 650 nm) was obtained with the spectrometer, along with some wavelengths of the UV and IR spectra (between 339 nm and 400 nm for the UV, and between 650 nm to 750 nm for the IR). The remaining UV and IR tails of the spectrum that were not measured were completed from the literature. Namely, the UV wavelengths were obtained by subtracting 74% from the onsite spectral irradiance as shown in [
57], whereas, to determine the EMR of the IR wavelengths, we used the spectral irradiance onsite measurement and subtracted 70% of the irradiance values according to [
54].
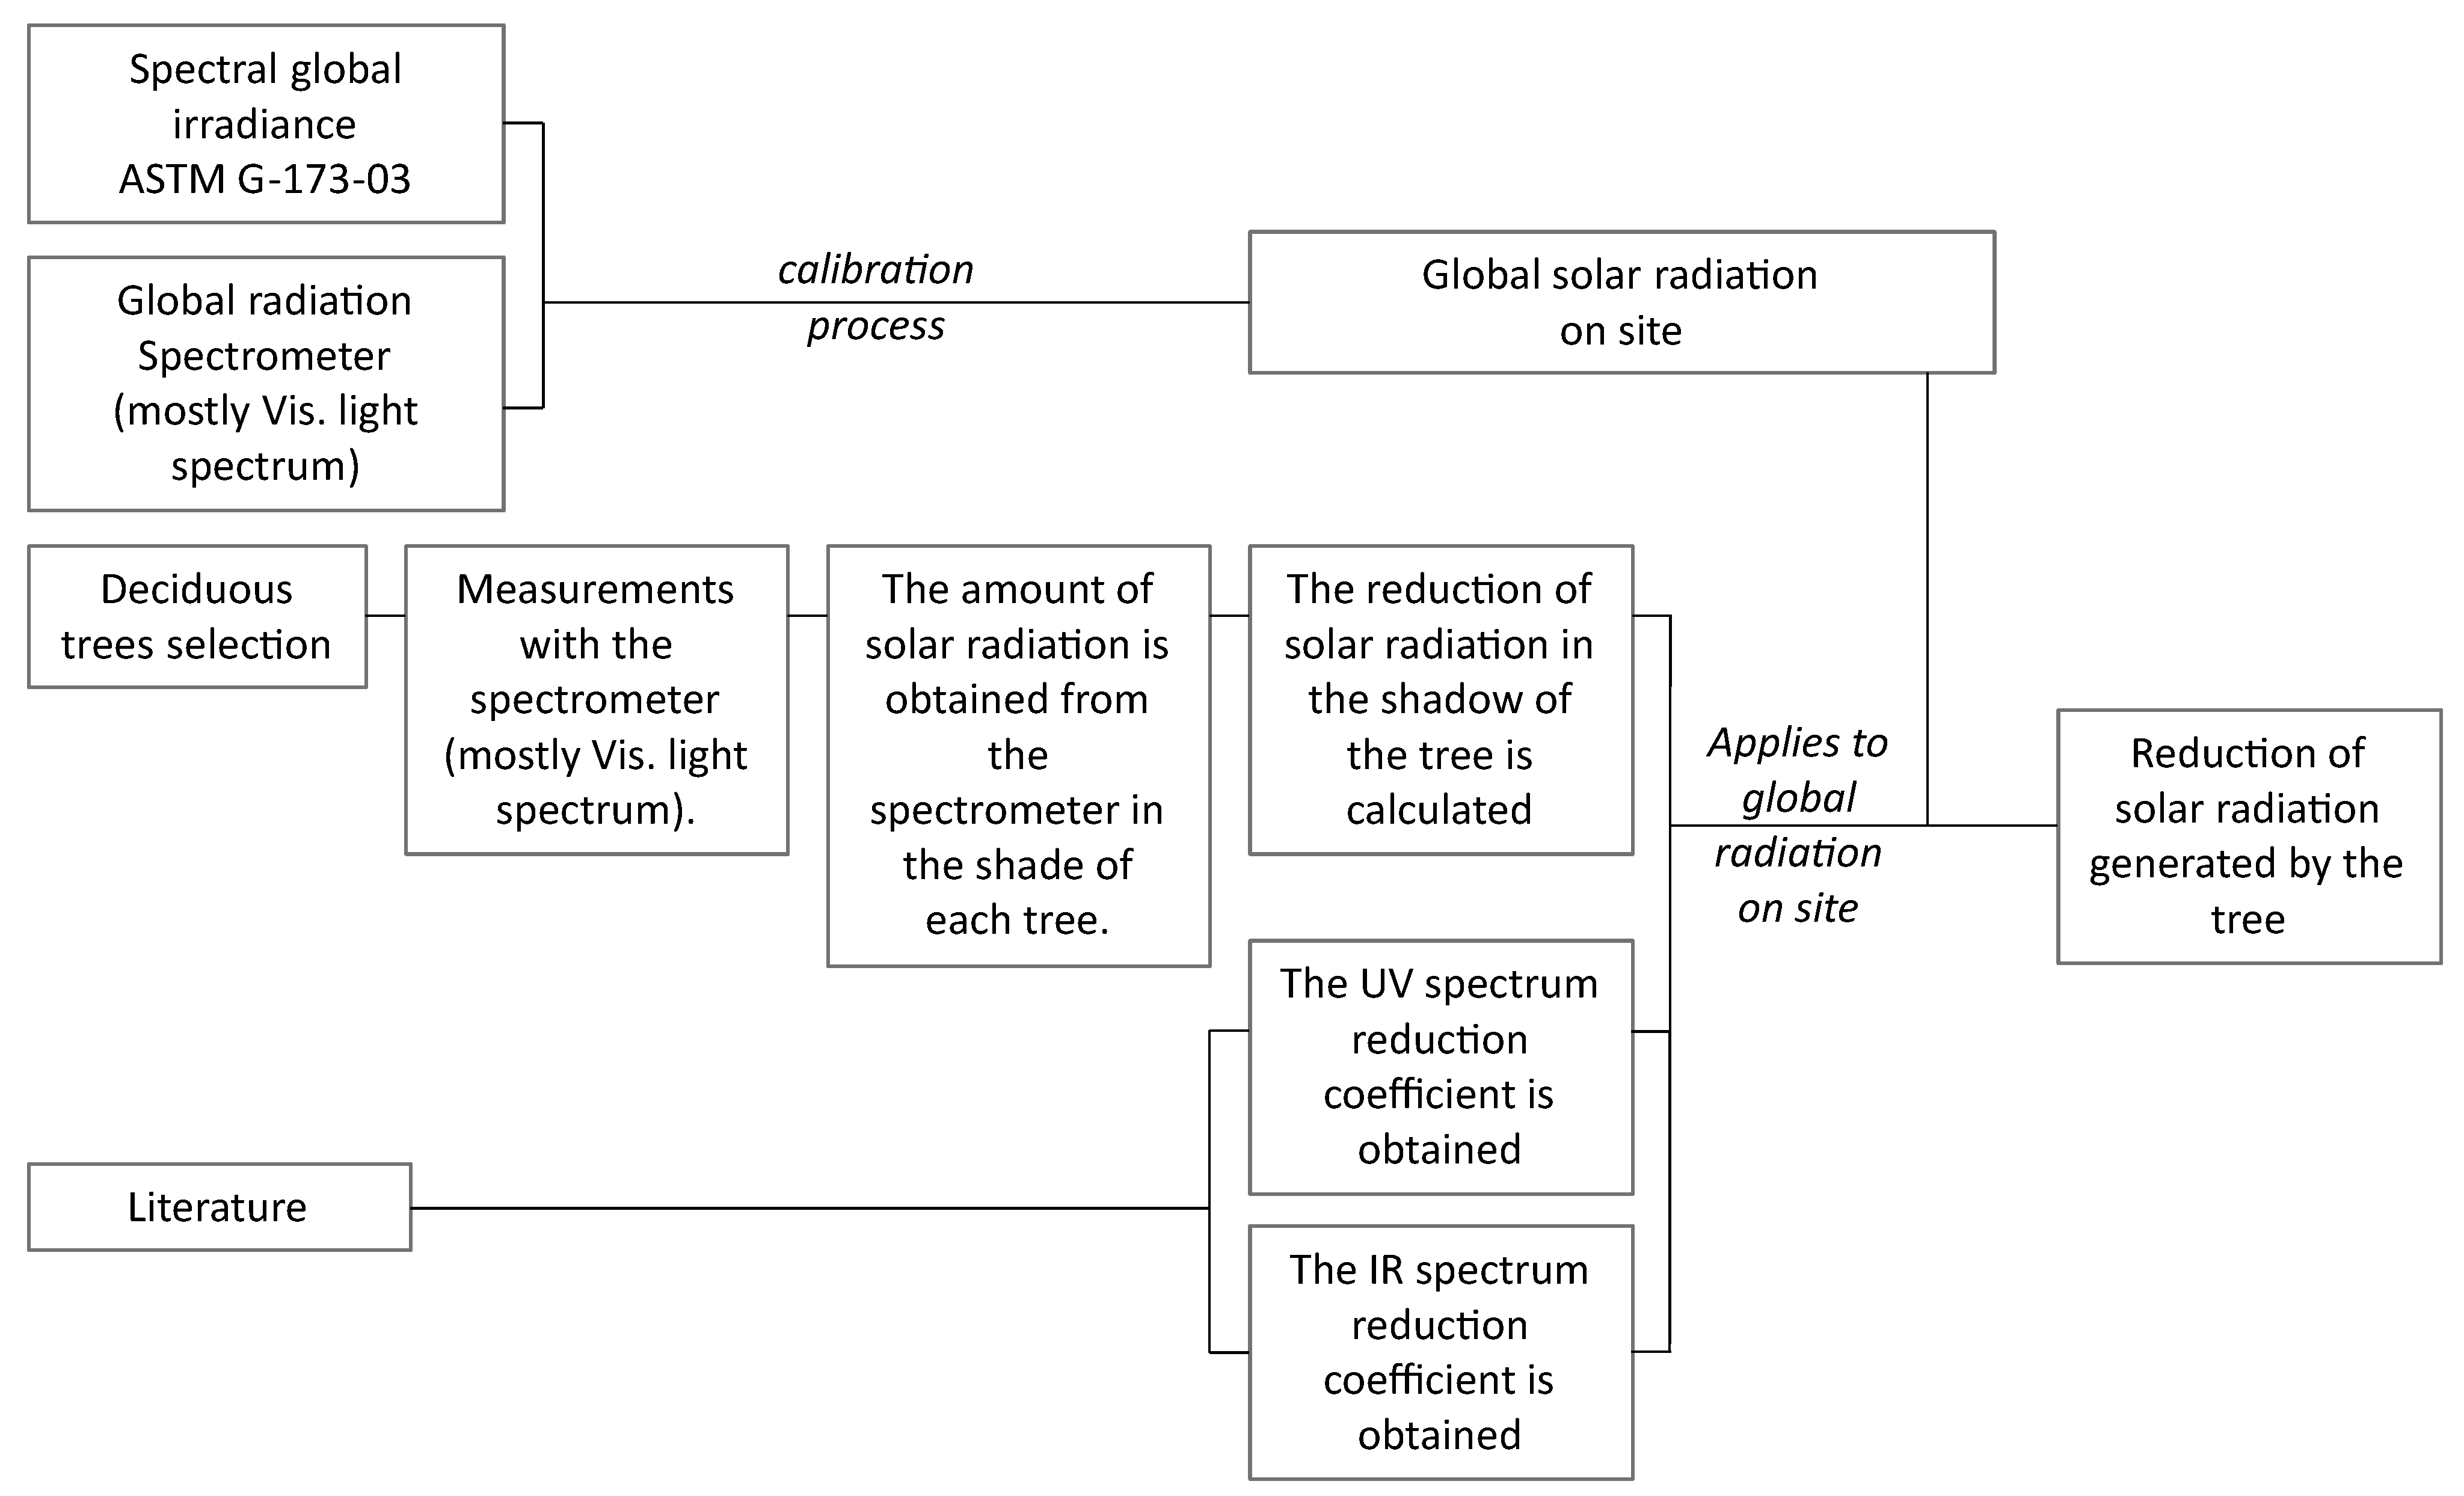
As a summary, the previous research steps are represented in sequential boxes and shown in
Figure 7. In the next section, we will present the main research results.
3. Analysis and Results
In this research, all five types of trees were evaluated under the conditions described in the previous section. The overall average solar radiation results measured with the spectrometer are presented later in
Table 3. All measurement results can also be found as
Supplementary Material. However, for clarity, the data processing steps followed are presented for one of the trees (Liriodendron Tulipifera). Basically, the GR was obtained first by pointing directly at the sun at hourly intervals (12:00, 13:00, 14:00, 15:00, or 16:00).
This is represented in
Figure 8 which represents a measurement taken on 20 February for one of the sample trees. Then, the graph that represents the average measurements of different quadrants under the three (different shots) at that same time of the day for the same tree can also be represented (12:00, as superimposed in
Figure 8 for a better comparison). To determine the amount of solar radiation controlled by the tree, the Y values of average spectral irradiance are subtracted from the values of the solar spectrum (
Figure 8).
Our final comparisons were calculated through the relative difference of intensities of the GR on site and the radiation value obtained under the shade of the tree (
), as shown in Equation (
1):
Equation (
1) was evaluated for every nanometer of the spectrum (from 339 nm to 750 nm). Then, an average value was obtained for that tree and that time of the day, repeating these steps for the five hours of a day and the rest of the trees.
Table 3 and
Figure 9 show that the Acer Negundo (Maple) controls the highest amount of solar radiation, with 95.5% on average. A total of 93.53% on average was obtained for the Prunus Cerasifera (Plum) tree. The Melia Azedarach (Melia) tree controls less radiation than the rest (86.70% on average).
It was also found that the solar radiation reduction measured with the spectrometer under the trees does not vary significantly over time (average values at each time of the day vary both and below the average value without following any visible pattern). This means that the radiation control capacity of a tree is not that affected by the solar azimuth and altitude.
The greatest data dispersion can be found in the Melia Azendarach (Melia) tree, with a difference of 10.72% between 12:00 and 13:00 h. This tree also presents the second-largest difference of 8.01% between 13:00 and 14:00 h. This higher dispersion may be due to the greater separation between the leaves of this tree, thus allowing larger spaces through which the solar radiation can penetrate.
Furthermore, to obtain the solar radiation in the spectral ranges not measured by the spectrometer, a reduction of 74% was applied to the UV range, as defined in [
56,
57]; and a 70% reduction to the IR range, as defined in [
54]. These reductions allowed obtaining the average results shown in
Figure 10.
The total solar radiation reduction results, considering the UV, visible light, and IR spectra, are presented in
Table 4,
Table 5,
Table 6 and
Table 7. The most noteworthy amount of solar radiation reduction was achieved in all trees within the visible light spectrum, with percentages exceeding 86% over the other spectrum ranges. The percentage of average reduction generated by the studied trees was 82%, ranging from 935.45 W/m
2, on average, of GR on site to 167 W/m
2, on average, under the shade of the trees. More specifically, the reduction of each tree is distributed as follows: 79% for the Melia Azedarach, 81% for the Liquidambar styraciflua and Liriodendron Tulipifera, 84% for the Prunus Cerasifera, and 85% for the Acer Negundo.
The largest amount of solar radiation present in the shade of the tree is provided by the IR spectrum (78% on average with respect to the total solar radiation in the shade), while the visible is 18%, and the UV just 4%. Thus, we can notice the great impact of the chlorophyll generation in the leaves, since the GR without the shade of the tree is distributed as follows: 43% of IR, 56% of visible, and 1% of UV, and always reducing, in greater proportion, the spectrum of visible light (between 86% and 95%).
Finally, it is also worth noting that, although measurements were made on clear (cloudless) days to reduce the noise produced by other uncontrolled weather variables, similar percentages of reduction would have been found under different weather conditions. Hence, in the presence of clouds, the indirect solar radiation controlled should be almost the same. However, in the case of rain, the direct solar radiation component would not be present and the diffuse component should be very low. Therefore, the GR impact of the tree shade on a rainy day would be irrelevant.
4. Discussion
The use of the proposed method was proven to be valid for obtaining the reduction of solar radiation generated by a deciduous tree. The combination of instruments, such as ASTM G-173-03 standard and spectrometry, was demonstrated to be a valid option, easy to implement, with fast results, low calculation requirement, and without the requirement of specific knowledge in the use of evaluation software.
This means that the new method can be easily replicated for other geographical locations and other types of trees, testing the versatility of the proposed method. The level of detail obtained in the results (total irradiance, spectral range, wavelengths) allows for other future applications to be explored.
The use of a spectrometer for measuring solar radiation under a tree shade was shown to be a useful and handy tool for field measurements. Additionally, the software is easy to use and allows almost instant results processing. This is how solar irradiance reduction measurements for other tree shapes, sizes, or canopy densities in other locations or climate conditions, as indicated in [
24], could also be calculated by means of spectrometry. The level of detail obtained in the results (total irradiance, spectral range, wavelengths) allows for other future applications to be explored.
On the other hand, the use of the ASTM G-173-03 standard as a basis for constructing the solar irradiance of the site is validated. The solar irradiance results obtained in this study with the spectrometer (between 339 nm and 750 nm) turned out to be almost identical to the ASTM G-173-03 standard for that range, being, on average, 5% lower than ASTM, allowing to adjust and build all the spectral irradiance with that value. This confirms what was observed in [
53], obtaining differences below 10% in the waveband of 400 nm to 700 nm.
As suggested in [
54], a high percentage of the solar radiation within the visible spectrum is absorbed by the tree, regardless of the tree type. Our work measured an average reduction within the visible spectrum of 91% for the five trees (from 95% of the Acer Negundo to 86% of the Melia Azendarach). This also confirms that the trees capture most of the visible light to perform photosynthesis.
The IR spectrum was measured in [
55] with a reduction of 70%, on average, under the shade, a similar value to our study, where the average reduction reached 75% (from 77% of the Acer Negundo and Prunus Cerasifera to 74% of the Melia Azendarach).
The UV spectrum was observed with a reduction of 89% in [
60], while authors in [
57] obtained an average reduction of 74%. Our study determined that, on average, the UV spectrum was reduced by 82%, with Prunus Cerasifera and the Acer Negundo having 86% and 77% for Melia Azendarach.
From the results obtained, it can be concluded that the trees studied controlled between 79% and 85% of the solar radiation under their shade. These percentages mean an average irradiance reduction from 935.5 W/m2 to 169.2 W/m2 by the studied deciduous trees. These results are valid as highly effective elements for passive solar control for adjacent buildings. In that sense, it can be concluded that 169.2 W/m2 on average would be reaching the external envelope (the shadowed surface) of the building. In other words, the shaded areas of the building envelope would receive only 18% of the solar irradiance of the place, while surfaces without shadow would have the entire irradiance, that is, 935.5 W/m2.
This reduction of energy gain will generate energy savings, as well as an improvement in the indoor thermal comfort. However, to determine the magnitude of this improvement, the characteristics of the building envelope, thermal inertia, internal loads, occupants’ behaviors, and shade surface percentage on the building, will also have significant impacts. This is why the shadow effect will be different for each building according to its characteristics. This is demonstrated in [
65], where a statistical model linked with the hedonic characteristics of the building (structure characteristics, occupants’ behaviors, and shade density) was developed and in which 3.8% to 20% electricity reduction was achieved. However, there is scarce research addressing these aspects, due to the variability that all these factors generate in the results. Arguably, that is why, unlike [
65], other authors consider small samples that do not allow generating general conclusions that can be extended to other building characteristics [
34,
66].
Thanks to these measurements, it is possible to determine the total energy transferred to a nearby building when performing building energy assessments. The amount of solar energy effectively transmitted and reflected, though, will depend on other factors of the building (exterior surface emissivity, thermal transmittance, and wind speed, among others), which must also be incorporated as input in the energy efficiency analysis software.
5. Conclusions
Deciduous trees constitute a well-known passive energy measure for controlling solar gains in buildings. However, there is a lack of information about the real impact they have. In this work, we quantified the reduction of solar radiation captured by five types of deciduous trees that are easily found in Mediterranean climates and which are characterized by hot summers and cold winters.
To perform the measurements, we used a spectrometer. This is a validated tool that, in a practical and simple way, allows obtaining quantitative values of solar radiation in the field. However, besides direct measurements, we also used the ASTM G-173-03 standard to complete the data from the IR and UV tails of the light spectrum.
Our results indicate that the deciduous trees analyzed dissipate an average of 82% of the UV radiation, 91% of the visible light spectrum, and 75% of the IR radiation. It was also found that the average solar radiation absorption did not vary significantly either by type of tree or by the time of the day. This was unexpected as all selected trees had different branch structures, as well as different leaf shapes and densities. However, the presence of larger spaces between leaves and branches resulted in higher absorption variability over measurements.
This information will help project designers during the building energy efficiency design phase by more representatively modeling the solar radiation gains allowed by deciduous trees. Specifically, this work contributes to providing a first set of quantitative data on the effectiveness of the tree shade for absorbing solar radiation energy. These data can be used by any building energy simulation software to obtain more accurate and realistic outputs. Additionally, our results confirm again the important effect that deciduous trees have on nearby buildings; this is on top of other benefits of trees in urban climates, such as absorbing CO2 and reducing the carbon footprint.
In future works, we expect to analyze the impact of solar radiation control that evergreen trees may have on different seasons, as photosynthesis activity may affect the solar radiation absorption of the tree leaves during the year. Similarly, we will study the optimum distance of trees to a nearby building depending on the canopy size and the desired level of heat reduction in the building. In this sense, it is also interesting as a future work to evaluate the impact of the shade of deciduous trees in high-rise urban buildings, regarding the energy demand reduction. Just as this study considered the assumption of measuring during the afternoon hours, thinking about the effect on the west façade, one could consider evaluating the solar reduction achieved from the morning to afternoon to evaluate the reduction achieved by a deciduous tree located on a green roof. Finally, as the spectrometer turned out to be a very versatile instrument, future work could be carried out to calculate the energy transmitted inside the building and the indoor thermal comfort achieved, considering the building envelope characteristics.

 ,
, 


