

Occupational Hazards Evaluation in Residential Construction Projects: Novel Sorting Methods Based on q-Rung Orthopair Fuzzy Choquet Integral


 , , , and
Abstract
:1. Introduction
2. Literature Review
3. Preliminaries
3.1. The -Rung Orthopair Fuzzy Sets
- (1)
- If , then ;
- (2)
- If , then ;
- (3)
- If , thenIf , then ;If , then .
- (1)
- (2)
- ,
- (3)
- , if an only if , i.e., and .
3.2. q-ROF Entropy and Cross-Entropy
3.3. Fuzzy Measures and -ROF Choquet Integral
- (i)
- Boundary conditions: and ,
- (ii)
- Monotonicity: If , and , then .
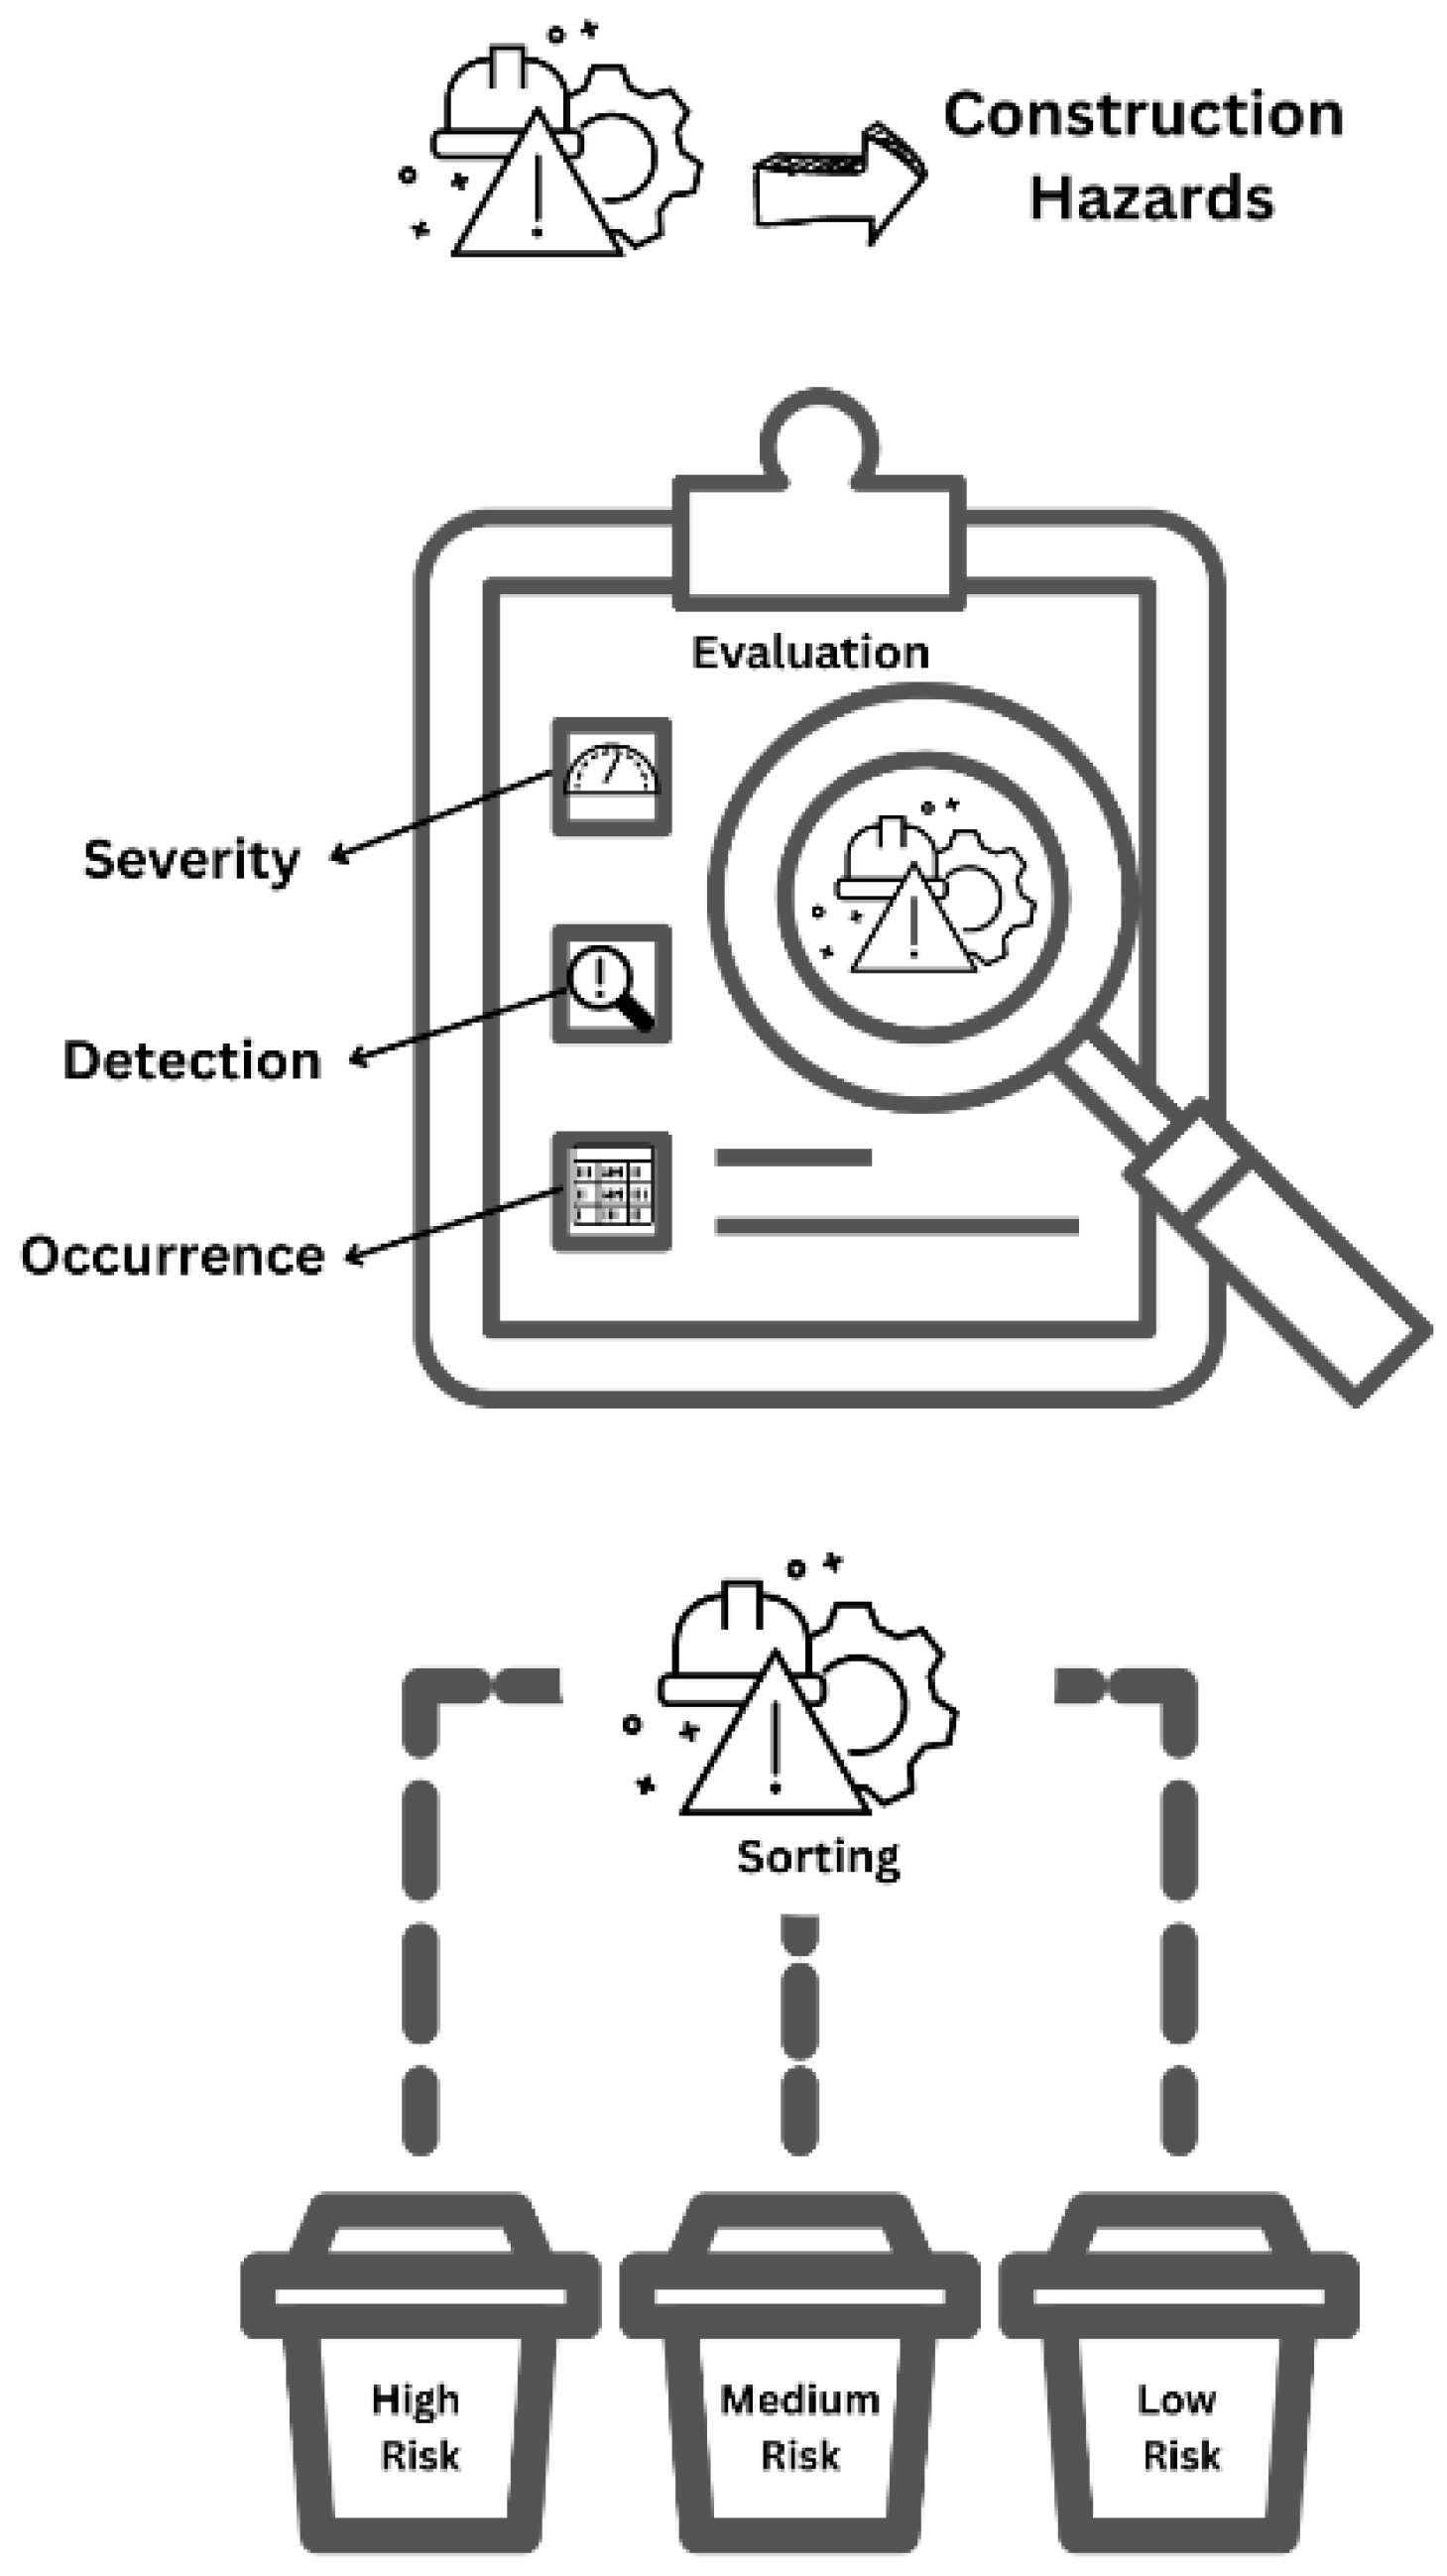
4. Methodology
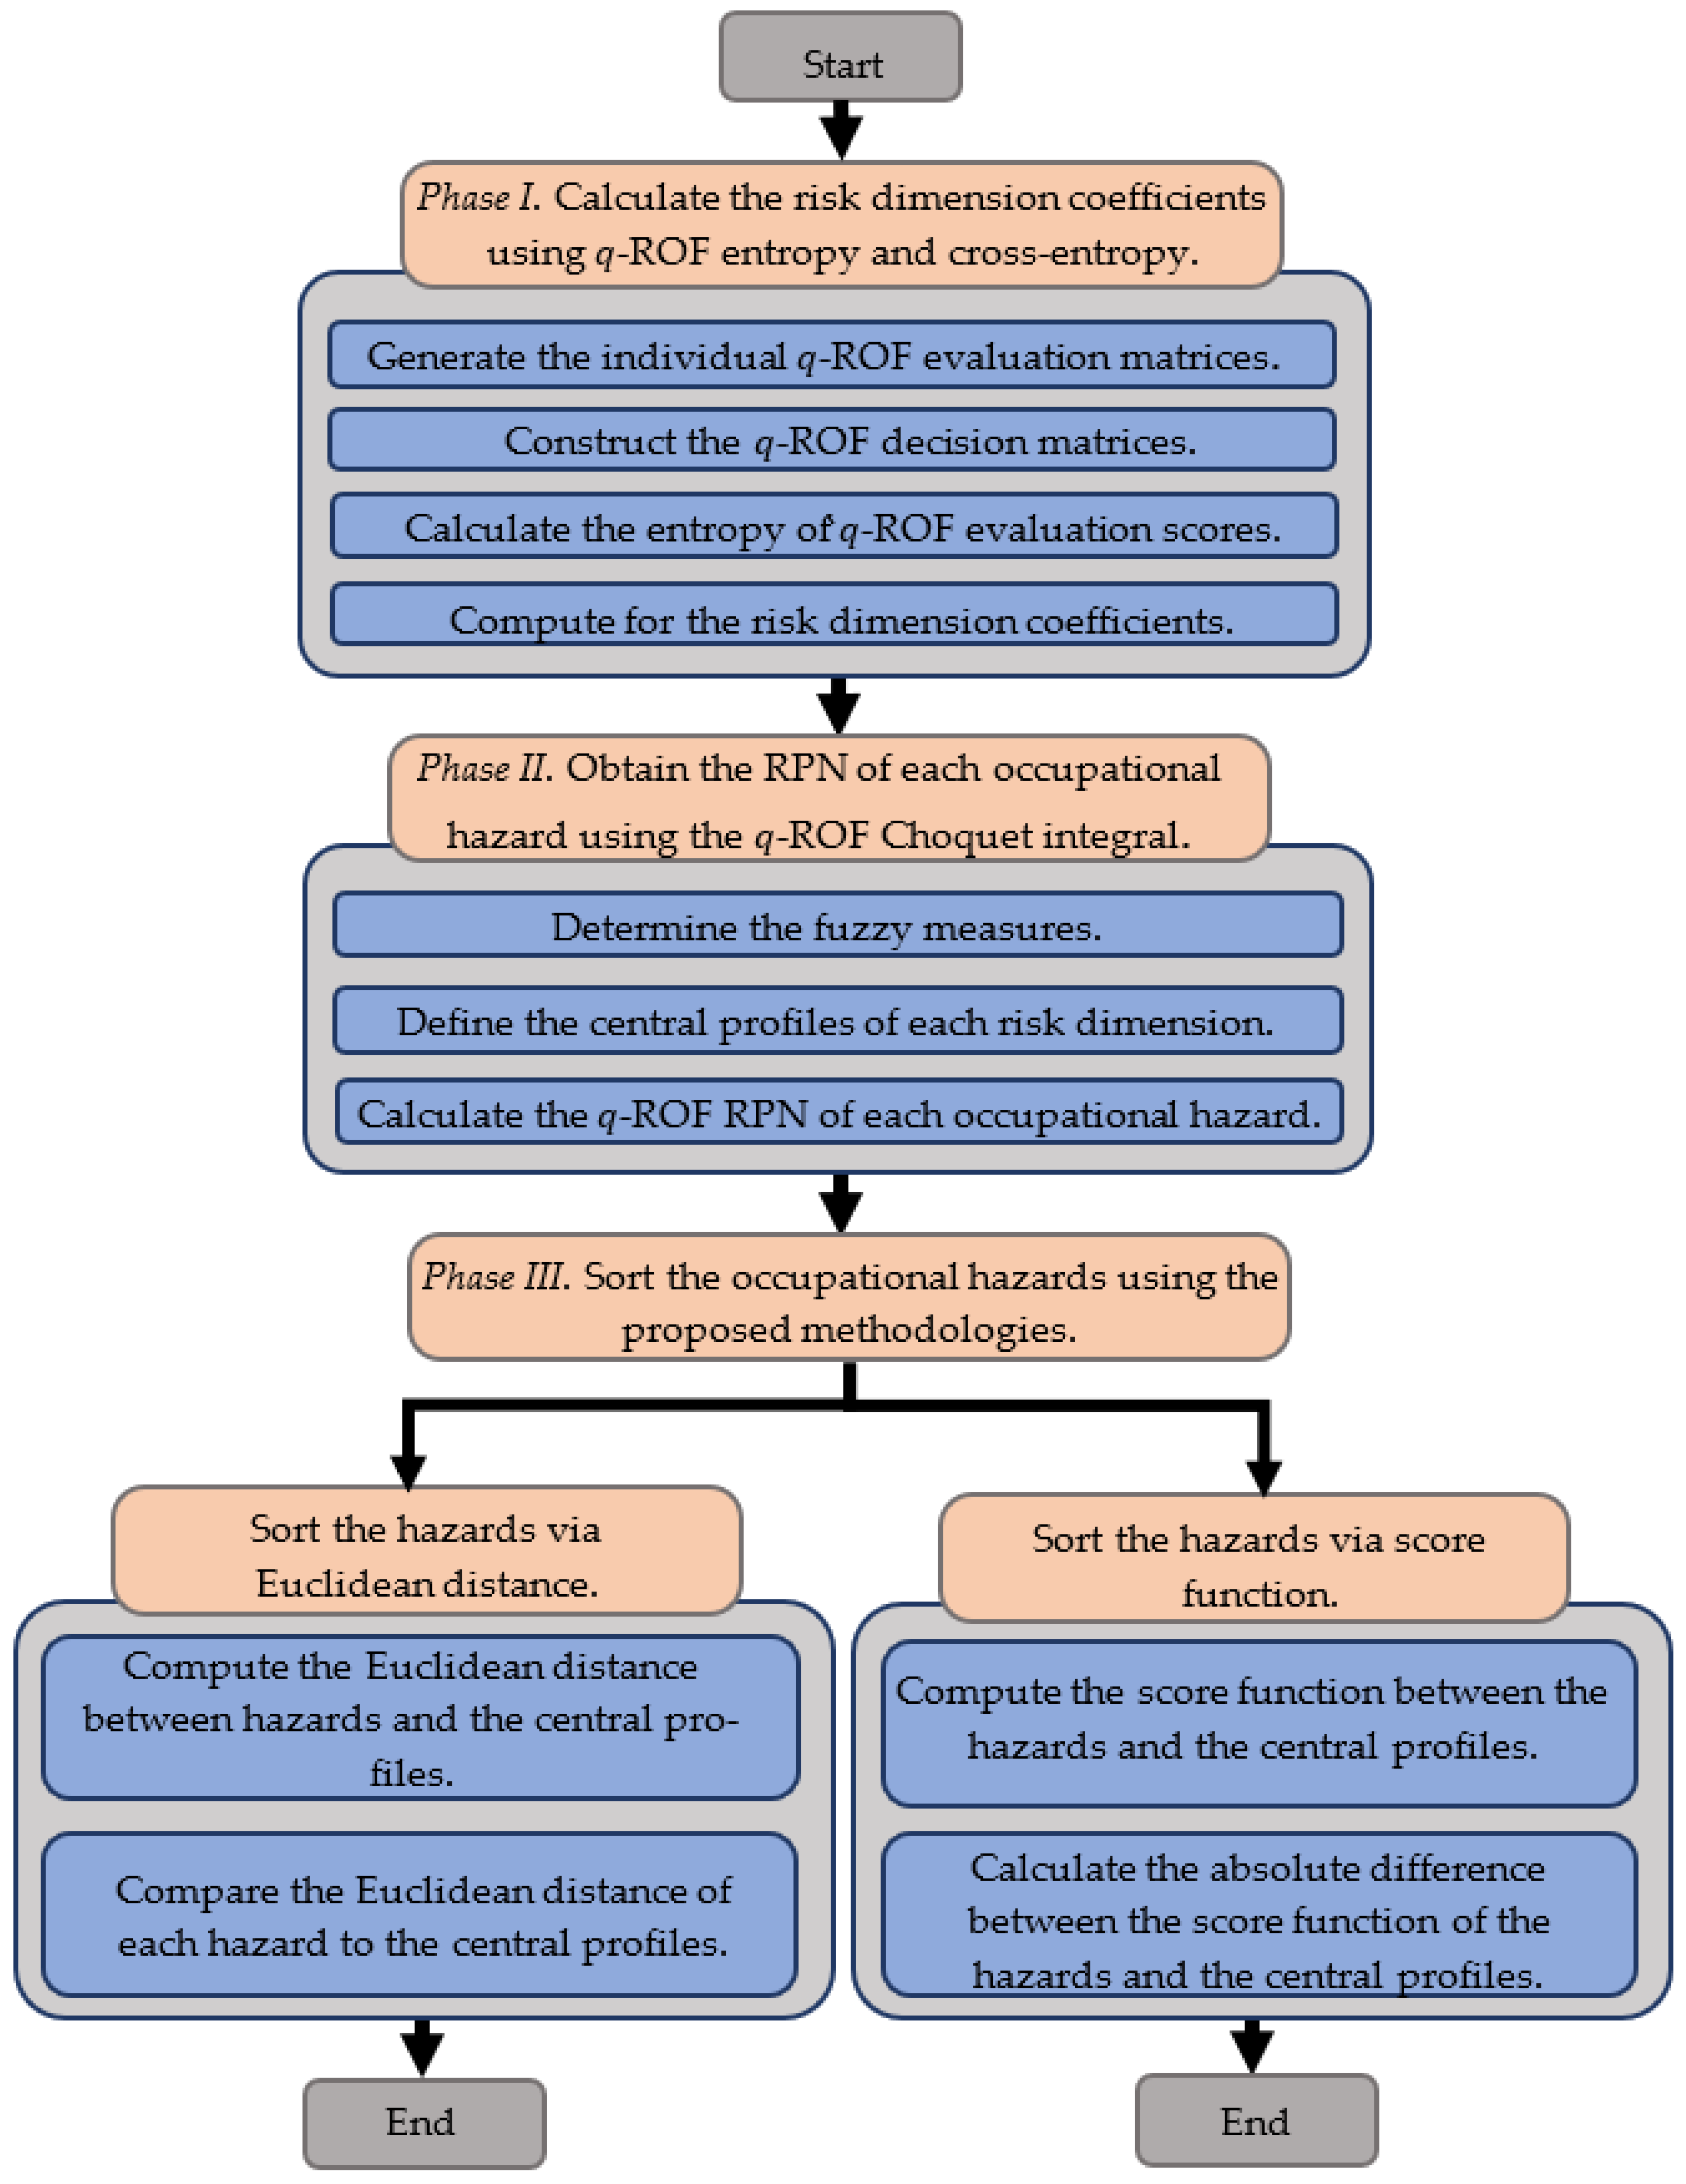
4.1. The Proposed Methodologies
4.1.1. Phase I—Calculate the Risk Dimension Coefficients Using -ROF Entropy and Cross-Entropy
4.1.2. Phase II—Obtain the RPN of Each Failure Mode Using the -ROF Choquet Integral
4.1.3. Phase III—Sort the Failure Modes Using the Proposed Methodologies
Method 1—Sorting Using the Euclidean Distance
| Algorithm 1: Sorting failure modes via Euclidean distance |
| Start for for if then end for end for End |
Method 2—Sorting via Score Function
| Algorithm 2. Sort alternatives via the score function |
| Start for for if then end for end for End |
4.2. Application of the Proposed Approach in Evaluating the Risk of Occupational Hazards in Residential Construction Projects
4.2.1. Phase I—Calculate the Coefficient of Risk Dimensions of FMEA Using -ROF Entropy and Cross-Entropy
4.2.2. Phase II—Obtain the RPN of Each Occupational Hazard Using the -ROF Choquet Integral
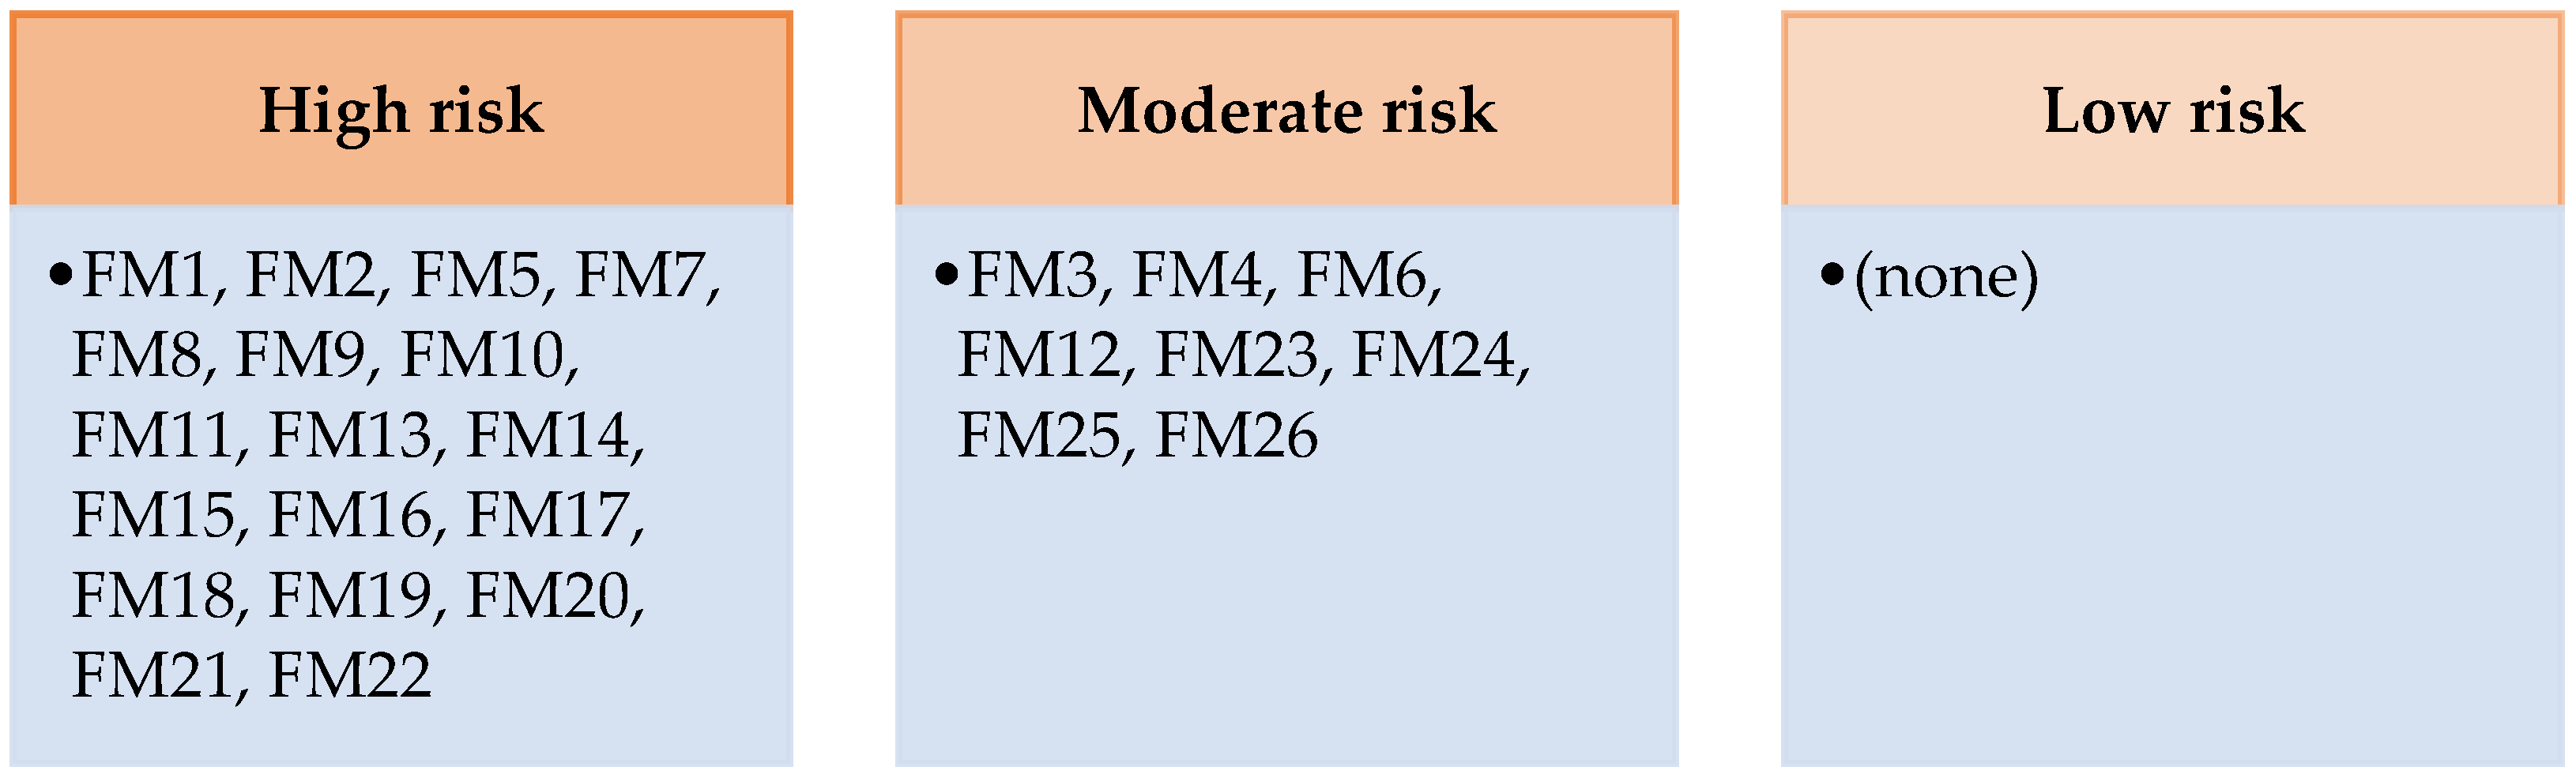
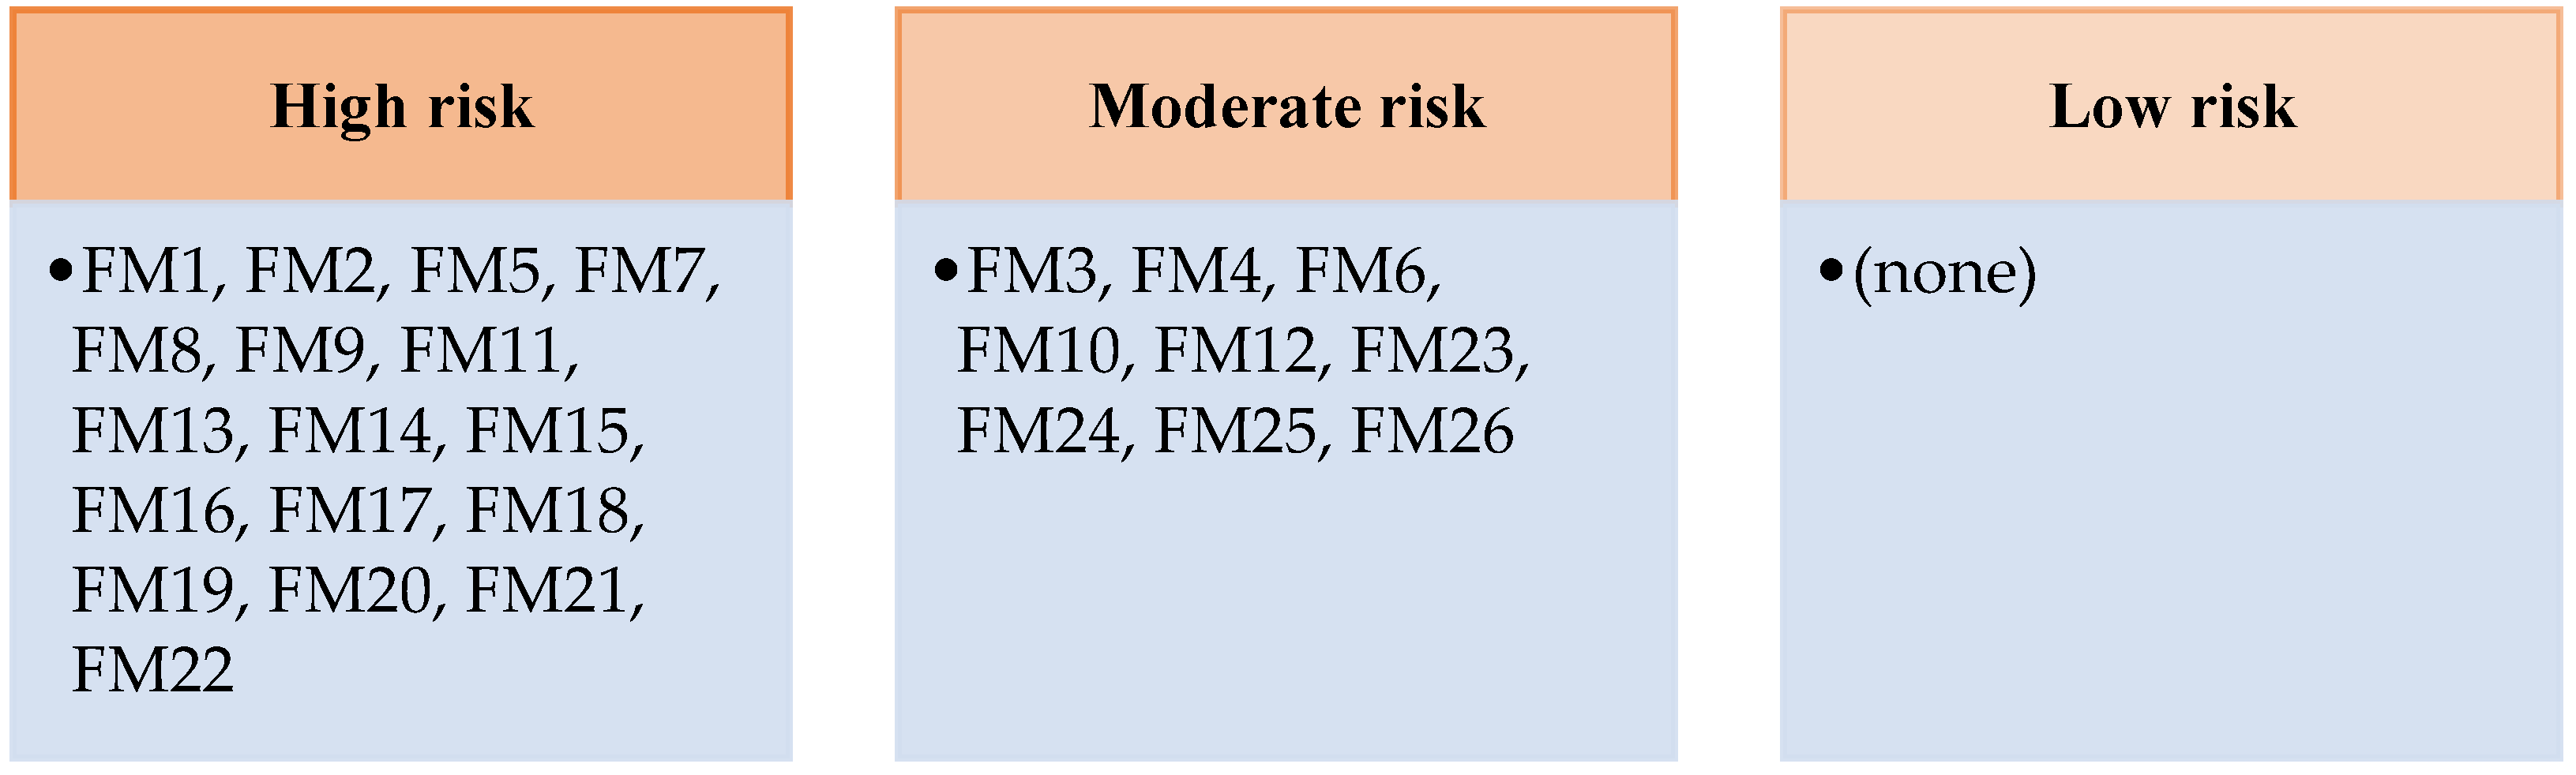
4.2.3. Phase III—Sort the Occupational Hazards Using the Proposed Methodologies
5. Sensitivity and Comparative Analyses
5.1. Sensitivity Analysis
5.2. Comparative Analysis
6. Results and Discussion
7. Conclusions and Future Directions
Supplementary Materials
Author Contributions
Funding
Data Availability Statement
Conflicts of Interest
Appendix A. Raw Evaluation Scores of th Decision-Maker
| Occupational Hazard | Severity | Detection | Occurrence |
| FM1 | 7 | 1 | 6 |
| FM2 | 6 | 1 | 5 |
| FM3 | 4 | 1 | 4 |
| FM4 | 5 | 1 | 5 |
| FM5 | 4 | 3 | 4 |
| FM6 | 4 | 1 | 3 |
| FM7 | 3 | 3 | 3 |
| FM8 | 7 | 1 | 7 |
| FM9 | 4 | 2 | 4 |
| FM10 | 4 | 2 | 4 |
| FM11 | 7 | 1 | 7 |
| FM12 | 3 | 3 | 4 |
| FM13 | 6 | 1 | 5 |
| FM14 | 7 | 1 | 7 |
| FM15 | 5 | 1 | 5 |
| FM16 | 4 | 1 | 7 |
| FM17 | 6 | 2 | 5 |
| FM18 | 4 | 2 | 4 |
| FM19 | 7 | 1 | 5 |
| FM20 | 5 | 2 | 5 |
| FM21 | 5 | 1 | 4 |
| FM22 | 5 | 2 | 5 |
| FM23 | 2 | 1 | 3 |
| FM24 | 1 | 1 | 3 |
| FM25 | 2 | 2 | 2 |
| FM26 | 3 | 2 | 2 |
Appendix B. q-ROF Evaluation Matrix of eth Decision-Maker
| Occupational Hazard | Severity | Detection | Occurrence |
| FM1 | (0.95,0.10) | (0.15,0.90) | (0.80,0.25) |
| FM2 | (0.80,0.25) | (0.15,0.90) | (0.75,0.40) |
| FM3 | (0.50,0.50) | (0.15,0.90) | (0.50,0.50) |
| FM4 | (0.75,0.40) | (0.15,0.90) | (0.75,0.40) |
| FM5 | (0.50,0.50) | (0.45,0.65) | (0.50,0.50) |
| FM6 | (0.50,0.50) | (0.15,0.90) | (0.45,0.65) |
| FM7 | (0.45,0.65) | (0.45,0.65) | (0.45,0.65) |
| FM8 | (0.95,0.10) | (0.15,0.90) | (0.95,0.10) |
| FM9 | (0.50,0.50) | (0.30,0.85) | (0.50,0.50) |
| FM10 | (0.50,0.50) | (0.30,0.85) | (0.50,0.50) |
| FM11 | (0.95,0.10) | (0.15,0.90) | (0.95,0.10) |
| FM12 | (0.45,0.65) | (0.45,0.65) | (0.50,0.50) |
| FM13 | (0.80,0.25) | (0.15,0.90) | (0.75,0.40) |
| FM14 | (0.95,0.10) | (0.15,0.90) | (0.95,0.10) |
| FM15 | (0.75,0.40) | (0.15,0.90) | (0.75,0.40) |
| FM16 | (0.50,0.50) | (0.15,0.90) | (0.95,0.10) |
| FM17 | (0.80,0.25) | (0.30,0.85) | (0.75,0.40) |
| FM18 | (0.50,0.50) | (0.30,0.85) | (0.50,0.50) |
| FM19 | (0.95,0.10) | (0.15,0.90) | (0.75,0.40) |
| FM20 | (0.75,0.40) | (0.30,0.85) | (0.75,0.40) |
| FM21 | (0.75,0.40) | (0.15,0.90) | (0.50,0.50) |
| FM22 | (0.75,0.40) | (0.30,0.85) | (0.75,0.40) |
| FM23 | (0.30,0.85) | (0.15,0.90) | (0.45,0.65) |
| FM24 | (0.15,0.90) | (0.15,0.90) | (0.45,0.65) |
| FM25 | (0.30,0.85) | (0.30,0.85) | (0.30,0.85) |
| FM26 | (0.45,0.65) | (0.30,0.85) | (0.30,0.85) |
Appendix C. The Entropy Values
| Occupational Hazard | Severity | Detection | Occurrence | Occupational Hazard | Severity | Detection | Occurrence |
| FM1 | 0.8037 | 0.9313 | 0.8992 | FM14 | 0.6965 | 0.8299 | 0.7693 |
| FM2 | 0.8220 | 0.8299 | 0.8809 | FM15 | 0.7204 | 0.9617 | 0.8744 |
| FM3 | 0.9771 | 0.8277 | 0.9558 | FM16 | 0.9461 | 0.8299 | 0.7495 |
| FM4 | 0.8781 | 0.8747 | 0.9205 | FM17 | 0.8053 | 0.9378 | 0.8904 |
| FM5 | 0.8373 | 0.9309 | 0.8562 | FM18 | 0.8098 | 0.8453 | 0.8577 |
| FM6 | 0.9705 | 0.8933 | 0.9677 | FM19 | 0.6129 | 0.8299 | 0.8493 |
| FM7 | 0.8718 | 0.9032 | 0.8629 | FM20 | 0.7112 | 0.8453 | 0.8517 |
| FM8 | 0.7119 | 0.8130 | 0.6427 | FM21 | 0.6996 | 0.8299 | 0.8705 |
| FM9 | 0.9249 | 0.8299 | 0.8733 | FM22 | 0.7143 | 0.8319 | 0.8638 |
| FM10 | 0.7291 | 0.8453 | 0.9449 | FM23 | 0.7218 | 0.8130 | 0.9621 |
| FM11 | 0.6991 | 0.7945 | 0.7307 | FM24 | 0.7233 | 0.8831 | 0.9659 |
| FM12 | 0.9651 | 0.9881 | 0.9744 | FM25 | 0.9723 | 0.9387 | 0.9073 |
| FM13 | 0.6106 | 0.8299 | 0.9297 | FM26 | 0.9834 | 0.9622 | 0.9084 |
References
- Pheng, S.L.; Hou, S.L.; Pheng, L.S.; Hou, L.S. The Economy and the Construction Industry. In Construction Quality and the Economy: A Study at the Firm Level; Springer: Berlin/Heidelberg, Germany, 2019; pp. 21–54. [Google Scholar] [CrossRef]
- Olatomide, A.; Oladipupo, A.; Faith, A.; Faith, O.; Oluwakemi, A. Cultivating entrepreneurial capacities in small and medium scale construction firms for a sustained economy. Covenant J. Entrep. Spec. Ed. 2019, 3, 36–47. [Google Scholar]
- Navaratnam, S.; Satheeskumar, A.; Zhang, G.; Nguyen, K.; Venkatesan, S.; Poologanathan, K. The challenges confronting the growth of sustainable prefabricated building construction in Australia: Construction industry views. J. Build. Eng. 2022, 48, 103935. [Google Scholar] [CrossRef]
- Department of Trade and Industry. Construction Industry Contributes 16.6% to GDP Amidst Pandemic. 2021. Available online: https://www.dti.gov.ph/news/construction-industry-contributes-to-gdp/ (accessed on 11 February 2023).
- Bello, S.A.; Oyedele, L.O.; Akinade, O.O.; Bilal, M.; Delgado, J.M.D.; Akanbi, L.A.; Ajayi, A.O.; Owolabi, H.A. Cloud computing in construction industry: Use cases, benefits and challenges. Autom. Constr. 2021, 122, 103441. [Google Scholar] [CrossRef]
- Killip, G. Products, practices and processes: Exploring the innovation potential for low-carbon housing refurbishment among small and medium-sized enterprises (SMEs) in the UK construction industry. Energy Policy 2013, 62, 522–530. [Google Scholar] [CrossRef]
- Smith, N.J.; Merna, T.; Jobling, P. Managing Risk in Construction Projects; John Wiley & Sons: Hoboken, NJ, USA, 2014. [Google Scholar]
- Alaghbari, W.; Al-Sakkaf, A.A.; Sultan, B. Factors affecting construction labour productivity in Yemen. Int. J. Constr. Manag. 2019, 19, 79–91. [Google Scholar] [CrossRef]
- Offei, I.; Kissi, E.; Nani, G. Factors affecting the capacity of small to medium enterprises (SME) building construction firms in Ghana. J. Constr. Dev. Ctries. 2019, 24, 49–63. [Google Scholar] [CrossRef]
- Guo, B.H.; Yiu, T.W.; González, V.A. A system dynamics view of safety management in small construction companies. J. Constr. Eng. Proj. Manag. 2015, 5, 1–6. [Google Scholar] [CrossRef]
- Fang, D.; Zhao, C.; Zhang, M. A cognitive model of construction workers’ unsafe behaviors. J. Constr. Eng. Manag. 2016, 142, 04016039. [Google Scholar] [CrossRef]
- Abukhashabah, E.; Summan, A.; Balkhyour, M. Occupational accidents and injuries in construction industry in Jeddah city. Saud J Biol Sci. 2020, 27, 1993–1998. [Google Scholar] [CrossRef]
- Occupational Safety and Health Administration (OSHA). Commonly Used Statistics. 2017. Available online: https://www.osha.gov/data/commonstats (accessed on 11 February 2023).
- US Bureau of Labor Statistics. Survey of Occupational Injuries and Illnesses. 2017. Available online: https://www.bls.gov/iif/nonfatal-injuries-and-illnesses-tables.htm (accessed on 31 January 2023).
- Schoenfisch, A.L.; Lipscomb, H.; Sinyai, C.; Adams, D. Effectiveness of OSHA Outreach Training on carpenters’ work-related injury rates, Washington State 2000–2008. Am. J. Ind. Med. 2017, 60, 45–57. [Google Scholar] [CrossRef] [PubMed]
- Bentoy, M.; Mata, M.; Bayogo, J.; Vasquez, R.; Almacen, R.M.; Evangelista, S.S.; Wenceslao, C.; Batoon, J.; Lauro, M.D.; Yamagishi, K.; et al. Complex cause-effect relationships of social capital, leader-member exchange, and safety behavior of workers in small-medium construction firms and the moderating role of age. Sustainability 2022, 14, 12499. [Google Scholar] [CrossRef]
- Liu, J.; Gong, E.; Wang, D.; Teng, Y. Cloud model-based safety performance evaluation of prefabricated building project in China. Wirel. Pers. Commun. 2018, 102, 3021–3039. [Google Scholar] [CrossRef]
- Guo, B.H.; Yiu, T.W.; González, V.A. Predicting safety behavior in the construction industry: Development and test of an integrative model. Saf. Sci. 2016, 84, 1–11. [Google Scholar] [CrossRef]
- Chen, Q.; Jin, R. Multilevel safety culture and climate survey for assessing new safety program. J. Constr. Eng. Manag. 2013, 139, 805–817. [Google Scholar] [CrossRef]
- Liao, P.C.; Shi, H.; Su, Y.; Luo, X. Development of data-driven influence model to relate the workplace environment to human error. J. Constr. Eng. Manag. 2018, 144, 04018003. [Google Scholar] [CrossRef]
- Fogarty, G.J.; Shaw, A. Safety climate and the theory of planned behavior: Towards the prediction of unsafe behavior. Accid. Anal. Prev. 2010, 42, 1455–1459. [Google Scholar] [CrossRef] [PubMed]
- Cheung, W.F.; Lin, T.H.; Lin, Y.C. A real-time construction safety monitoring system for hazardous gas integrating wireless sensor network and building information modeling technologies. Sensors 2018, 18, 436. [Google Scholar] [CrossRef]
- Choe, S.; Leite, F.; Seedah, D.; Caldas, C. Evaluation of sensing technology for the prevention of backover accidents in construction work zones. J. Inf. Technol. Constr. 2014, 19, 1–19. [Google Scholar]
- Kim, S.; Irizarry, J.; Costa, D.B. Field test-based UAS operational procedures and considerations for construction safety management: A qualitative exploratory study. Int. J. Civ. Eng. 2020, 18, 919–933. [Google Scholar] [CrossRef]
- Jeelani, I.; Asadi, K.; Ramshankar, H.; Han, K.; Albert, A. Real-time vision-based worker localization & hazard detection for construction. Autom. Constr. 2021, 121, 103448. [Google Scholar]
- Perlman, A.; Sacks, R.; Barak, R. Hazard recognition and risk perception in construction. Saf. Sci. 2014, 64, 22–31. [Google Scholar] [CrossRef]
- Albert, A.; Pandit, B.; Patil, Y. Focus on the fatal-four: Implications for construction hazard recognition. Saf. Sci. 2020, 128, 104774. [Google Scholar] [CrossRef]
- Jeelani, I.; Albert, A.; Azevedo, R.; Jaselskis, E.J. Development and testing of a personalized hazard-recognition training intervention. J. Constr. Eng. Manag. 2017, 143, 04016120. [Google Scholar] [CrossRef]
- Jeelani, I.; Albert, A.; Han, K.; Azevedo, R. Are visual search patterns predictive of hazard recognition performance? Empirical investigation using eye-tracking technology. J. Constr. Eng. Manag. 2019, 143, 04018115. [Google Scholar] [CrossRef]
- Liao, P.C.; Sun, X.; Zhang, D. A multimodal study to measure the cognitive demands of hazard recognition in construction workplaces. Saf. Sci. 2021, 133, 105010. [Google Scholar] [CrossRef]
- Jeelani, I.; Albert, A.; Gambatese, J.A. Why do construction hazards remain unrecognized at the work interface? J. Constr. Eng. Manag. 2017, 143, 04016128. [Google Scholar] [CrossRef]
- Taylor, E.L. Safety benefits of mandatory OSHA 10 h training. Saf. Sci. 2015, 77, 66–71. [Google Scholar] [CrossRef]
- Namian, M.; Albert, A.; Zuluaga, C.M.; Jaselskis, E.J. Improving hazard-recognition performance and safety training outcomes: Integrating strategies for training transfer. J. Constr. Eng. Manag. 2016, 142, 04016048. [Google Scholar] [CrossRef]
- Pandit, B.; Albert, A.; Patil, Y. Developing construction hazard recognition skill: Leveraging safety climate and social network safety communication patterns. Constr. Manag. Econ. 2020, 38, 640–658. [Google Scholar] [CrossRef]
- Uddin, S.J.; Albert, A.; Alsharef, A.; Pandit, B.; Patil, Y.; Nnaji, C. Hazard recognition patterns demonstrated by construction workers. Int. J. Environ. Res. Public Health 2020, 17, 7788. [Google Scholar] [CrossRef] [PubMed]
- Albert, A.; Jeelani, I.; Han, K. Developing hazard recognition skill among the next-generation of construction professionals. Constr. Manag. Econ. 2020, 38, 1024–1039. [Google Scholar] [CrossRef]
- UK Health and Safety Executive. The Control of Vibration at Work Regulations. 2019. Available online: https://www.hse.gov.uk/vibration/hav/regulations.htm (accessed on 20 January 2023).
- Wu, Z.; Liu, W.; Nie, W. Literature review and prospect of the development and application of FMEA in manufacturing industry. Int. J. Adv. Manuf. Technol. 2021, 112, 1409–1436. [Google Scholar] [CrossRef]
- Zeng, S.X.; Tam, C.M.; Tam, V.W. Integrating safety, environmental and quality risks for project management using a FMEA method. Eng. Econ. 2010, 66, 44–52. [Google Scholar]
- Yeganeh, A.; Younesi Heravi, M.; Razavian, S.B.; Behzadian, K.; Shariatmadar, H. Applying a new systematic fuzzy FMEA technique for risk management in light steel frame systems. J. Asian Archit. Build. Eng. 2022, 21, 2481–2502. [Google Scholar] [CrossRef]
- Dahooie, J.H.; Vanaki, A.S.; Firoozfar, H.R.; Zavadskas, E.K.; Čereška, A. An extension of the failure mode and effect analysis with hesitant fuzzy sets to assess the occupational hazards in the construction industry. Int. J. Environ. Res. Public Health 2020, 17, 1442. [Google Scholar] [CrossRef]
- Ma, G.; Wu, M. A Big Data and FMEA-based construction quality risk evaluation model considering project schedule for Shanghai apartment projects. Int. J. Qual. Reliab. Manag. 2019, 37, 18–33. [Google Scholar] [CrossRef]
- Mete, S. Assessing occupational risks in pipeline construction using FMEA-based AHP-MOORA integrated approach under Pythagorean fuzzy environment. Hum. Ecol. Risk Assess. Int. J. 2019, 25, 1645–1660. [Google Scholar] [CrossRef]
- Lee, J.S.; Kim, Y.S. Analysis of cost-increasing risk factors in modular construction in Korea using FMEA. KSCE J. Civ. Eng. 2017, 21, 1999–2010. [Google Scholar] [CrossRef]
- Lee, D.; Lim, H.; Lee, D.; Cho, H.; Kang, K.I. Assessment of delay factors for structural frameworks in free-form tall buildings using the FMEA. Int. J. Concr. Struct. Mater. 2019, 13, 2. [Google Scholar] [CrossRef]
- Cho, J.; Chae, M. Systematic approach of TOPSIS decision-making for construction method based on risk reduction feedback of extended QFD-FMEA. Math. Probl. Eng. 2022, 2022, 1458599. [Google Scholar] [CrossRef]
- Abdelgawad, M.; Fayek, A.R. Risk management in the construction industry using combined fuzzy FMEA and fuzzy AHP. J. Constr. Eng. Manag. 2010, 136, 1028–1036. [Google Scholar] [CrossRef]
- Mohammadi, A.; Tavakolan, M. Construction project risk assessment using combined fuzzy and FMEA. In Proceedings of the 2013 Joint IFSA World Congress and NAFIPS Annual Meeting, Edmond, AB, Canada, 24–28 June 2013; pp. 232–237. [Google Scholar] [CrossRef]
- Ahmadi, M.; Behzadian, K.; Ardeshir, A.; Kapelan, Z. Comprehensive risk management using fuzzy FMEA and MCDA techniques in highway construction projects. J. Civ. Eng. Manag. 2017, 23, 300–310. [Google Scholar] [CrossRef]
- Rahimi, Y.; Tavakkoli-Moghaddam, R.; Iranmanesh, S.H.; Vaez-Alaei, M. Hybrid approach to construction project risk management with simultaneous FMEA/ISO 31000/evolutionary algorithms: Empirical optimization study. J. Constr. Eng. Manag. 2018, 144, 04018043. [Google Scholar] [CrossRef]
- Zolfaghari, S.; Mousavi, S.M. Construction-project risk assessment by a new decision model based on De-Novo multi-approaches analysis and hesitant fuzzy sets under uncertainty. J. Intell. Fuzzy Syst. 2018, 35, 639–649. [Google Scholar] [CrossRef]
- Alvand, A.; Mirhosseini, S.M.; Ehsanifar, M.; Zeighami, E.; Mohammadi, A. Identification and assessment of risk in construction projects using the integrated FMEA-SWARA-WASPAS model under fuzzy environment: A case study of a construction project in Iran. Int. J. Constr. Manag. 2021, 23, 392–404. [Google Scholar] [CrossRef]
- Brun, A.; Savino, M.M. Assessing risk through composite FMEA with pairwise matrix and Markov chains. Int. J. Qual. Reliab. Manag. 2018, 35, 1709–1733. [Google Scholar] [CrossRef]
- Lucca, G.; Sanz, J.A.; Dimuro, G.P.; Borges, E.N.; Santos, H.; Bustince, H. Analyzing the performance of different fuzzy measures with generalizations of the Choquet integral in classification problems. In Proceedings of the 2019 IEEE International Conference on Fuzzy Systems, New Orleans, LA, USA, 23–26 June 2019; pp. 1–6. [Google Scholar] [CrossRef]
- Pacheco, A.; Krohling, R. Aggregation of neural classifiers using a Choquet integral with respect to a fuzzy measure. Neurocomputing 2018, 292, 151–164. [Google Scholar] [CrossRef]
- Chen, L.; Duan, G.; Wang, S.; Ma, J. A Choquet integral based fuzzy logic approach to solve uncertain multi-criteria decision making problem. Expert Syst. Appl. 2020, 149, 113303. [Google Scholar] [CrossRef]
- Peng, X.; Yang, Y. Pythagorean fuzzy Choquet integral based MABAC method for multiple attribute group decision making. Int. J. Intell. Syst. 2016, 31, 989–1020. [Google Scholar] [CrossRef]
- Moradi, M.; Delavar, M.R.; Moshiri, B. A GIS-based multicriteria analysis model for earthquake vulnerability assessment using Choquet integral and game theory. Nat. Hazards 2017, 87, 1377–1398. [Google Scholar] [CrossRef]
- Dubey, S.; Cats, O.; Hoogendorn, S.; Bansal, P. A multinomial probit model with Choquet integral and attribute cut-offs. Transp. Res. Part B Methodol. 2022, 158, 140–163. [Google Scholar] [CrossRef]
- Yager, R.R. Generalized orthopair fuzzy sets. IEEE Trans. Fuzzy Syst. 2016, 25, 1222–1230. [Google Scholar] [CrossRef]
- Wang, D.; Dai, F.; Ning, X. Risk assessment of work-related musculoskeletal disorders in construction: State-of-the-art review. J. Constr. Eng. Manag. 2015, 141, 04015008. [Google Scholar] [CrossRef]
- Kaskutas, V.; Dale, A.M.; Lipscomb, H.; Evanoff, B. Fall prevention and safety communication training for foremen: Report of a pilot project designed to improve residential construction safety. J. Saf. Res. 2013, 44, 111–118. [Google Scholar] [CrossRef]
- Zhu, Z.; Dutta, A.; Dai, F. Exoskeletons for manual material handling–A review and implication for construction applications. Autom. Constr. 2021, 122, 103493. [Google Scholar] [CrossRef]
- Dale, A.M.; Jaegers, L.; Welch, L.; Gardner, B.T.; Buchholz, B.; Weaver, N.; Evanoff, B.A. Evaluation of a participatory ergonomics intervention in small commercial construction firms. Am. J. Ind. Med. 2016, 59, 465–475. [Google Scholar] [CrossRef] [PubMed]
- Anderson, R.; McGaw, S.; Parra, G. Electrical safety in industrial construction: An analysis of 10 years of incidents in the global engineering, procurement, and construction industry. IEEE Ind. Appl. Mag. 2021, 27, 31–41. [Google Scholar] [CrossRef]
- Floyd, H.L. A practical guide for applying the hierarchy of controls to electrical hazards. In Proceedings of the 2015 IEEE IAS Electrical Safety Workshop, Louisville, KY, USA, 26–30 January 2015; pp. 1–4. [Google Scholar] [CrossRef]
- Calvert, G.M.; Luckhaupt, S.E.; Sussell, A.; Dahlhamer, J.M.; Ward, B.W. The prevalence of selected potentially hazardous workplace exposures in the US: Findings from the 2010 National Health Interview Survey. Am. J. Ind. Med. 2013, 56, 635–646. [Google Scholar] [CrossRef] [PubMed]
- Wu, Z.; Zhang, X.; Wu, M. Mitigating construction dust pollution: State of the art and the way forward. J. Clean. Prod. 2016, 112, 1658–1666. [Google Scholar] [CrossRef]
- Ahrens, M. Structure Fires Caused by Hot Work; National Fire Protection Association: Quincy, MA, USA, 2021; Available online: https://www.nfpa.org/-/media/Files/News-and-Research/Fire-statistics-and-reports/US-Fire-Problem/Fire-causes/osHotWork.ashx (accessed on 8 February 2023).
- Antwi-Afari, M.F.; Li, H.; Anwer, S.; Yevu, S.K.; Wu, Z.; Antwi-Afari, P.; Kim, I. Quantifying workers’ gait patterns to identify safety hazards in construction using a wearable insole pressure system. Saf. Sci. 2020, 129, 104855. [Google Scholar] [CrossRef]
- Esmaeili, B.; Hallowell, M.R.; Rajagopalan, B. Attribute-based safety risk assessment. II: Predicting safety outcomes using generalized linear models. J. Constr. Eng. Manag. 2015, 141, 04015022. [Google Scholar] [CrossRef]
- Hallowell, M.R.; Hardison, D.; Desvignes, M. Information technology and safety: Integrating empirical safety risk data with building information modeling, sensing, and visualization technologies. Constr. Innov. 2016, 16, 323–347. [Google Scholar] [CrossRef]
- Karthick, S.; Kermanshachi, S.; Pamidimukkala, A.; Namian, M. A review of construction workforce health challenges and strategies in extreme weather conditions. Int. J. Occup. Saf. Ergon. 2023, 29, 773–784. [Google Scholar] [CrossRef] [PubMed]
- Bureau of Labor Statistics. Fatal Occupational Injuries by Selected Worker Characteristics and Selected Event or Exposure, All U.S., All Ownerships, 2011–2019. 2017. Available online: https://data.bls.gov/gqt/InitialPage (accessed on 8 February 2023).
- National Institute for Occupational Safety and Health (NIOSH). Hierarchy of Controls. 2015. Available online: https://www.cdc.gov/niosh/topics/hierarchy/default.html (accessed on 11 February 2023).
- Liu, P.; Wang, P. Some q-rung orthopair fuzzy aggregation operators and their applications to multiple-attribute decision making. Int. J. Intell. Syst. 2018, 33, 259–280. [Google Scholar] [CrossRef]
- Peng, X.; Huang, H. Fuzzy decision-making method based on CoCoSo with CRITIC for financial risk evaluation. Technol. Econ. Dev. Econ. 2020, 26, 695–724. [Google Scholar] [CrossRef]
- Peng, X.; Huang, H.; Luo, Z. q-Rung orthopair fuzzy decision-making framework for integrating mobile edge caching scheme preferences. Int. J. Intell. Syst. 2021, 36, 2229–2266. [Google Scholar] [CrossRef]
- Jana, C.; Muhiuddin, G.; Pal, M. Some Dombi aggregation of Q-rung orthopair fuzzy numbers in multiple-attribute decision making. Int. J. Intell. Syst. 2019, 34, 3220–3240. [Google Scholar] [CrossRef]
- Wei, G.; Wei, C.; Wang, J.; Gao, H.; Wei, Y. Some q-rung orthopair fuzzy maclaurin symmetric mean operators and their applications to potential evaluation of emerging technology commercialization. Int. J. Intell. Syst. 2019, 34, 50–81. [Google Scholar] [CrossRef]
- Banerjee, D.; Dutta, B.; Guha, D.; Martínez, L. SMAA-QUALIFLEX methodology to handle multicriteria decision-making problems based on q-rung fuzzy set with hierarchical structure of criteria using bipolar Choquet integral. Int. J. Intell. Syst. 2020, 35, 401–431. [Google Scholar] [CrossRef]
- Farhadinia, B.; Liao, H. Score-based multiple criteria decision making process by using q-rung orthopair fuzzy sets. Informatica 2021, 32, 709–739. [Google Scholar] [CrossRef]
- Rani, P.; Mishra, A.R. Multicriteria weighted aggregated sum product assessment framework for fuel technology selection using q-rung orthopair fuzzy sets. Sustain. Prod. Consum. 2020, 24, 90–104. [Google Scholar] [CrossRef]
- Liu, D.; Chen, X.; Peng, D. Some cosine similarity measures and distance measures between q-rung orthopair fuzzy sets. Int. J. Intell. Syst. 2019, 34, 1572–1587. [Google Scholar] [CrossRef]
- Shannon, C.E. A mathematical theory of communication. Bell Syst. Tech. J. 1948, 27, 379–423. [Google Scholar] [CrossRef]
- Nijkamp, P. Gravity and Entropy Models: The State of the Art; Economische Fakulteit, Vrije Universiteit: Amsterdam, The Netherlands, 1977. [Google Scholar]
- Chen, P. Effects of normalization on the entropy-based TOPSIS method. Expert Syst. Appl. 2019, 136, 33–41. [Google Scholar] [CrossRef]
- Liang, D.; Zhang, Y.; Cao, W. q-Rung orthopair fuzzy Choquet integral aggregation and its application in heterogeneous multicriteria two-sided matching decision making. Int. J. Intell. Syst. 2019, 34, 3275–3301. [Google Scholar] [CrossRef]
- Murofushi, T.; Sugeno, M. Some quantities represented by the Choquet integral. Fuzzy Sets Syst. 1993, 56, 229–235. [Google Scholar] [CrossRef]
- Grabisch, M. Fuzzy integral in multicriteria decision making. Fuzzy Sets Syst. 1995, 69, 279–298. [Google Scholar] [CrossRef]
- Grabisch, M.; Murofushi, T.; Sugeno, M. Fuzzy Measure and Integrals; Physica-Verlag: Heidelberg, Germany, 2000. [Google Scholar]
- Choquet, G. Theory of capacities. Ann. Inst. Fourier 1954, 5, 131–295. [Google Scholar] [CrossRef]
- Tan, C.; Chen, X. Intuitionistic fuzzy Choquet integral operator for multicriteria decision making. Expert Syst. Appl. 2010, 37, 149–157. [Google Scholar] [CrossRef]
- Joshi, D.; Kumar, S. Interval-valued intuitionistic hesitant fuzzy Choquet integral based TOPSIS method for multicriteria group decision making. Eur. J. Oper. Res. 2016, 248, 183–191. [Google Scholar] [CrossRef]
- Tian, G.; Hao, N.; Zhou, M.; Pedrycz, W.; Zhang, C.; Ma, F.; Li, Z. Fuzzy grey Choquet integral for evaluation of multicriteria decision making problems with interactive and qualitative indices. IEEE Trans. Syst. Man Cybern. Syst. 2019, 51, 1855–1868. [Google Scholar] [CrossRef]
- Department of Labor and Employment (DOLE). DOLE, ILO Conduct ‘Toolbox Talks’ on Young Workers’ Safety, Health; DOLE: Intramuros, Manila, 2017. [Google Scholar]
- Olson, R.; Varga, A.; Cannon, A.; Jones, J.; Gilbert-Jones, I.; Zoller, E. Toolbox talks to prevent construction fatalities: Empirical development and evaluation. Saf. Sci. 2016, 86, 122–131. [Google Scholar] [CrossRef]
- Department of Labor and Employment (DOLE). Guidelines Governing Occupational Safety and Health in the Construction Industry; DOLE: Intramuros, Manila, 2005. [Google Scholar]
- Wang, W.; Liu, X.; Qin, Y.; Fu, Y. A risk evaluation and prioritization method for FMEA with prospect theory and Choquet integral. Saf. Sci. 2018, 110, 152–163. [Google Scholar] [CrossRef]
- Yin, R.K. Case Study Research: Design and Methods (Applied Social Research Methods), 5th ed.; Sage Publications: Thousand Oaks, CA, USA, 2014. [Google Scholar]
- Peng, X.; Liu, L. Information measures for q-rung orthopair fuzzy sets. Int. J. Intell. Syst. 2019, 34, 1795–1834. [Google Scholar] [CrossRef]
- Keshavarz-Ghorabaee, M.; Zavadskas, E.K.; Olfat, L.; Turskis, Z. Multi-criteria inventory classification using a new method of evaluation based on distance from average solution (EDAS). Informatica 2015, 26, 435–451. [Google Scholar] [CrossRef]
- Lolli, F.; Ishizaka, A.; Gamberini, R.; Rimini, B.; Messori, M. FlowSort-GDSS–A novel group multicriteria decision support system for sorting problems with application to FMEA. Expert Syst. Appl. 2015, 42, 6342–6349. [Google Scholar] [CrossRef]
- Yang, J.; Ye, G.; Zhang, Z.; Liu, X.; Yang, L. Linking construction noise to worker safety behavior: The role of negative emotion and regulatory focus. Saf. Sci. 2023, 162, 106093. [Google Scholar] [CrossRef]
- Ning, X.; Qi, J.; Wu, C.; Wang, W. Reducing noise pollution by planning construction site layout via a multi-objective optimization model. J. Clean. Prod. 2019, 222, 218–230. [Google Scholar] [CrossRef]
- Mohandes, S.; Sadeghi, H.; Fazeli, A.; Mahdiyar, A.; Hosseini, M.; Arashpour, M.; Zayed, T. Causal analysis of accidents on construction sites: A hybrid fuzzy Delphi and DEMATEL approach. Saf. Sci. 2022, 151, 105–730. [Google Scholar] [CrossRef]
- Ayodele, O.; Richards, A.; Gonzales, V. Factors affecting workforce turnover in the construction sector: A systematic review. J. Constr. Eng. Manag. 2020, 146, 03119010. [Google Scholar] [CrossRef]


| Proponents | Score Functions |
|---|---|
| Peng et al. [78] | |
| Jana et al. [79] and Wei et al. [80] | |
| Banerjee et al. [81] | |
| Farhadinia and Liao [82] | |
| Rani and Mishra [83] |
| Codes | Occupational Hazards | Some Accompanying Risks |
|---|---|---|
| FM1 | Working on a scaffold/stair | Fall, scaffold collapse, struck by scaffold |
| FM2 | Working at a height above two meters | Fall |
| FM3 | Handling manual non-electric tools (e.g., hammer, saw, chisel, pliers, shovel) | Cuts, bruises, struck by, foreign materials into the eyes |
| FM4 | Using hydraulic and power tools (e.g., cutter, drill, grinder) | Cuts, bruises, struck by, foreign materials into the eyes, electrocution, spasm |
| FM5 | Fumes from using hydraulic and power tools (e.g., cutter, drill, grinder) | Nausea, eye irritation, upper respiratory irritation |
| FM6 | Manual excavation works | Soil collapse, fall, struck by |
| FM7 | Uneven surfaces on the site | Trip, fall, slip |
| FM8 | Cables, dangling wires, cut wood, and scrap metals scattered around the workplace | Trip, fall, slip |
| FM9 | Electrical wiring installation and troubleshooting | Electrocution |
| FM10 | Working on ground/lower floors with possible flying and falling objects | Struck by |
| FM11 | Workers stepping on protruding objects (e.g., nails) | Trip, fall, slip |
| FM12 | Vehicular traffic on construction sites | Struck by |
| FM13 | Working within a ‘danger zone’ (e.g., a possible collision with equipment) | Struck by |
| FM14 | Mechanical/electrical malfunction | Electrocution, burns, cuts |
| FM15 | Exposure to the extreme noise level in the workplace | Hearing disorder, nausea |
| FM16 | Exposure to hazardous substances (e.g., lacquer/paint thinner) | Nausea, eye irritation, upper respiratory irritation, skin irritation, headaches, respiratory problems |
| FM17 | Excessive hand and arm vibrations from vibrating power tools (e.g., jackhammers, compactors, hand drills) | Spasm, blister |
| FM18 | Welding/hot work | Burns, nausea, eye irritation, upper respiratory irritation |
| FM19 | Airborne fibers and materials (e.g., asbestos, roofing insulation, fiberglass) | Nausea, eye irritation, upper respiratory irritation |
| FM20 | Inhalation of fine dust from cement, sand, gravel, and other concrete aggregates | Nausea, eye irritation, upper respiratory irritation |
| FM21 | Sun/extreme weather exposure | Skin burns, dehydration, heat stroke |
| FM22 | Prolonged and repeated lifting and carrying of heavy objects heavier than 20 kg | Muscle pains, back pains, back injury, sprain and strain, |
| FM23 | Snake bites and animal attacks | Poison, fever, cuts and bruises, swelling and inflammation, fatality |
| FM24 | Contact with poisonous plants | Skin irritation, headache |
| FM25 | Insect bites | Skin irritation, headache, swelling and inflammation, fatality |
| FM26 | Molds from structural lumber | Upper respiratory irritation, eye irritation, Skin irritation |
| Linguistic Terms | Scores | -ROFN |
|---|---|---|
| Strongly disagree | 1 | (0.15,0.9) |
| Disagree | 2 | (0.3,0.85) |
| Somewhat disagree | 3 | (0.45,0.65) |
| Neutral | 4 | (0.5,0.5) |
| Somewhat agree | 5 | (0.75,0.4) |
| Agree | 6 | (0.8,0.25) |
| Strongly agree | 7 | (0.95,0.1) |
| Occupational Hazards | Severity | Detection | Occurrence |
|---|---|---|---|
| FM1 | (0.8479,0.3374) | (0.4310,0.7700) | (0.7946,0.3670) |
| FM2 | (0.8383,0.2459) | (0.4001,0.8382) | (0.8066,0.3320) |
| FM3 | (0.6993,0.4554) | (0.3819,0.8385) | (0.7346,0.3881) |
| FM4 | (0.8072,0.2737) | (0.5010,0.8230) | (0.7758,0.3560) |
| FM5 | (0.8312,0.2903) | (0.5098,0.7813) | (0.8214,0.3157) |
| FM6 | (0.7079,0.3998) | (0.4186,0.8021) | (0.7155,0.4137) |
| FM7 | (0.8121,0.3195) | (0.4210,0.7948) | (0.8172,0.3007) |
| FM8 | (0.8798,0.2060) | (0.3971,0.8459) | (0.8992,0.1872) |
| FM9 | (0.7706,0.3341) | (0.4001,0.8382) | (0.8115,0.3320) |
| FM10 | (0.8744,0.2125) | (0.4029,0.8306) | (0.7495,0.3758) |
| FM11 | (0.8837,0.1902) | (0.3940,0.8537) | (0.8738,0.2168) |
| FM12 | (0.7194,0.4017) | (0.4713,0.6647) | (0.7015,0.4250) |
| FM13 | (0.9071,0.1722) | (0.4001,0.8382) | (0.7668,0.3626) |
| FM14 | (0.8844,0.1866) | (0.4001,0.8382) | (0.8606,0.2600) |
| FM15 | (0.8772,0.2328) | (0.4468,0.7309) | (0.8111,0.3415) |
| FM16 | (0.7489,0.3901) | (0.4001,0.8382) | (0.8677,0.2509) |
| FM17 | (0.8458,0.2431) | (0.4332,0.7630) | (0.8006,0.3523) |
| FM18 | (0.8438,0.2427) | (0.4029,0.8306) | (0.8203,0.3010) |
| FM19 | (0.9066,0.1730) | (0.4001,0.8382) | (0.8252,0.3132) |
| FM20 | (0.8801,0.2180) | (0.4029,0.8306) | (0.8239,0.3146) |
| FM21 | (0.8835,0.2014) | (0.4001,0.8382) | (0.8132,0.3260) |
| FM22 | (0.8791,0.2069) | (0.4004,0.8373) | (0.8172,0.3234) |
| FM23 | (0.8768,0.2272) | (0.3971,0.8459) | (0.7257,0.4080) |
| FM24 | (0.8763,0.2314) | (0.4162,0.8090) | (0.7229,0.4441) |
| FM25 | (0.7137,0.4699) | (0.4359,0.7623) | (0.7907,0.4099) |
| FM26 | (0.6888,0.4939) | (0.4470,0.7301) | (0.7899,0.4116) |
| Central Profiles | Severity | Detection | Occurrence |
|---|---|---|---|
| (0.8000,0.2500) | (0.8000,0.2500) | (0.8000,0.2500) | |
| (0.5000,0.5000) | (0.5000,0.5000) | (0.5000,0.5000) | |
| (0.3000,0.8500) | (0.3000,0.8500) | (0.3000,0.8500) |
| Risk Dimensions | Fuzzy Measures | Risk Dimensions | Fuzzy Measure |
|---|---|---|---|
| Severity | 0.3199 | Severity, Occurrence | 0.7135 |
| Detection | 0.1260 | Detection, Occurrence | 0.4327 |
| Occurrence | 0.2504 | Severity, Detection, Occurrence | 1.0000 |
| Severity, Detection | 0.5179 |
| Occupational Hazards | -ROF RPN | Occupational Hazards | -ROF RPN | Occupational Hazards | -ROF RPN |
|---|---|---|---|---|---|
| FM1 | (0.7282,0.5191) | FM11 | (0.7947,0.4129) | FM21 | (0.7517,0.4837) |
| FM2 | (0.7320,0.4996) | FM12 | (0.6375,0.5235) | FM22 | (0.7526,0.4836) |
| FM3 | (0.6720,0.5211) | FM13 | (0.7373,0.4945) | FM23 | (0.7005,0.5386) |
| FM4 | (0.7091,0.5159) | FM14 | (0.7848,0.4385) | FM24 | (0.6999,0.5463) |
| FM5 | (0.7467,0.4835) | FM15 | (0.7498,0.4696) | FM25 | (0.7054,0.5216) |
| FM6 | (0.6711,0.4923) | FM16 | (0.7619,0.4349) | FM26 | (0.6937,0.5278) |
| FM7 | (0.7714,0.4086) | FM17 | (0.7316,0.4880) | p1 | (0.8000,0.2500) |
| FM8 | (0.8468,0.3014) | FM18 | (0.7433,0.4779) | p2 | (0.5000,0.5000) |
| FM9 | (0.7439,0.4342) | FM19 | (0.7691,0.4672) | p3 | (0.3000,0.8500) |
| FM10 | (0.7113,0.5127) | FM20 | (0.7575,0.4797) |
| Occupational Hazard | High Risk | Moderate Risk | Low Risk | Occupational Hazard | High Risk | Moderate Risk | Low Risk |
|---|---|---|---|---|---|---|---|
| FM1 | 1.00 | 0.00 | 0.00 | FM14 | 1.00 | 0.00 | 0.00 |
| FM2 | 1.00 | 0.00 | 0.00 | FM15 | 1.00 | 0.00 | 0.00 |
| FM3 | 0.00 | 1.00 | 0.00 | FM16 | 1.00 | 0.00 | 0.00 |
| FM4 | 0.78 | 0.22 | 0.00 | FM17 | 1.00 | 0.00 | 0.00 |
| FM5 | 1.00 | 0.00 | 0.00 | FM18 | 1.00 | 0.00 | 0.00 |
| FM6 | 0.00 | 1.00 | 0.00 | FM19 | 1.00 | 0.00 | 0.00 |
| FM7 | 1.00 | 0.00 | 0.00 | FM20 | 1.00 | 0.00 | 0.00 |
| FM8 | 1.00 | 0.00 | 0.00 | FM21 | 1.00 | 0.00 | 0.00 |
| FM9 | 1.00 | 0.00 | 0.00 | FM22 | 1.00 | 0.00 | 0.00 |
| FM10 | 0.37 | 0.63 | 0.00 | FM23 | 0.37 | 0.63 | 0.00 |
| FM11 | 1.00 | 0.00 | 0.00 | FM24 | 0.37 | 0.63 | 0.00 |
| FM12 | 0.29 | 0.71 | 0.00 | FM25 | 0.76 | 0.24 | 0.00 |
| FM13 | 0.41 | 0.59 | 0.00 | FM26 | 0.73 | 0.27 | 0.00 |
| Occupational Hazard | High Risk | Moderate Risk | Low Risk | Occupational Hazard | High Risk | Moderate Risk | Low Risk |
|---|---|---|---|---|---|---|---|
| FM1 | 0.88 | 0.12 | 0.00 | FM14 | 1.00 | 0.00 | 0.00 |
| FM2 | 0.63 | 0.37 | 0.00 | FM15 | 1.00 | 0.00 | 0.00 |
| FM3 | 0.00 | 1.00 | 0.00 | FM16 | 1.00 | 0.00 | 0.00 |
| FM4 | 0.69 | 0.31 | 0.00 | FM17 | 0.88 | 0.12 | 0.00 |
| FM5 | 1.00 | 0.00 | 0.00 | FM18 | 0.92 | 0.08 | 0.00 |
| FM6 | 0.00 | 1.00 | 0.00 | FM19 | 1.00 | 0.00 | 0.00 |
| FM7 | 1.00 | 0.00 | 0.00 | FM20 | 0.98 | 0.02 | 0.00 |
| FM8 | 1.00 | 0.00 | 0.00 | FM21 | 0.82 | 0.18 | 0.00 |
| FM9 | 1.00 | 0.00 | 0.00 | FM22 | 0.73 | 0.27 | 0.00 |
| FM10 | 0.04 | 0.96 | 0.00 | FM23 | 0.02 | 0.98 | 0.00 |
| FM11 | 1.00 | 0.00 | 0.00 | FM24 | 0.12 | 0.88 | 0.00 |
| FM12 | 0.29 | 0.71 | 0.00 | FM25 | 0.76 | 0.24 | 0.00 |
| FM13 | 0.06 | 0.94 | 0.00 | FM26 | 0.73 | 0.27 | 0.00 |
| Score Function | Jana | Banerjee | Farhadinia | Rani | Peng |
|---|---|---|---|---|---|
| Jana | 1.00 | 0.96 | 0.96 | 0.88 | 0.73 |
| Banerjee | - | 1.00 | 0.92 | 0.85 | 0.69 |
| Farhadinia | - | - | 1.00 | 0.92 | 0.77 |
| Rani | - | - | - | 1.00 | 0.85 |
| Peng | - | - | - | - | 1.00 |
| Distance Method | Euclidean | D1 | D2 | D3 | D4 | D5 |
|---|---|---|---|---|---|---|
| Euclidean | 1.00 | 0.96 | 0.96 | 0.96 | 1.00 | 1.00 |
| D1 | - | 1.00 | 0.92 | 0.92 | 0.96 | 0.96 |
| D2 | - | - | 1.00 | 1.00 | 0.96 | 0.96 |
| D3 | - | - | - | 1.00 | 0.96 | 0.96 |
| D4 | - | - | - | - | 1.00 | 1.00 |
| D5 | - | - | - | - | - | 1.00 |
| Occupational Hazards | Severity | Detection | Occurrence | |
|---|---|---|---|---|
| FM1 | 4.2400 | 1.9200 | 4.5200 | 36.7964 |
| FM2 | 5.7400 | 1.6000 | 5.1200 | 47.0221 |
| FM3 | 4.0800 | 1.7400 | 4.9400 | 35.0700 |
| FM4 | 5.7400 | 1.6200 | 5.1800 | 48.1678 |
| FM5 | 5.3400 | 1.9400 | 5.2000 | 53.8699 |
| FM6 | 4.7000 | 1.7800 | 4.6600 | 38.9856 |
| FM7 | 5.1400 | 1.9400 | 5.2600 | 52.4506 |
| FM8 | 6.0600 | 1.4400 | 6.1000 | 53.2310 |
| FM9 | 5.2400 | 1.6000 | 5.0400 | 42.2554 |
| FM10 | 5.9200 | 1.7600 | 5.0000 | 52.0960 |
| FM11 | 6.2400 | 1.2800 | 5.9400 | 47.4440 |
| FM12 | 4.5400 | 2.7200 | 4.4800 | 55.3226 |
| FM13 | 6.2800 | 1.6000 | 5.1600 | 51.8477 |
| FM14 | 6.2800 | 1.6000 | 5.4800 | 55.0630 |
| FM15 | 5.7800 | 2.2400 | 4.9600 | 64.2181 |
| FM16 | 4.4200 | 1.6000 | 5.6400 | 39.8861 |
| FM17 | 5.8400 | 2.0800 | 4.8200 | 58.5495 |
| FM18 | 5.7600 | 1.7600 | 5.3200 | 53.9320 |
| FM19 | 6.2600 | 1.6000 | 5.3200 | 53.2851 |
| FM20 | 5.9200 | 1.7600 | 5.3000 | 55.2218 |
| FM21 | 6.0800 | 1.6000 | 5.1400 | 50.0019 |
| FM22 | 6.0400 | 1.6200 | 5.2600 | 51.4680 |
| FM23 | 5.6000 | 1.4400 | 4.6600 | 37.5782 |
| FM24 | 5.4200 | 1.7200 | 4.3400 | 40.4592 |
| FM25 | 4.2200 | 2.0800 | 4.3000 | 37.7437 |
| FM26 | 3.9000 | 2.2600 | 4.3000 | 37.9002 |
| Occupational Hazards | Category | Occupational Hazards | Category | Occupational Hazards | Category |
|---|---|---|---|---|---|
| FM1 | moderate risk | FM10 | moderate risk | FM19 | moderate risk |
| FM2 | moderate risk | FM11 | moderate risk | FM20 | moderate risk |
| FM3 | low risk | FM12 | moderate risk | FM21 | moderate risk |
| FM4 | moderate risk | FM13 | moderate risk | FM22 | moderate risk |
| FM5 | moderate risk | FM14 | moderate risk | FM23 | moderate risk |
| FM6 | moderate risk | FM15 | moderate risk | FM24 | moderate risk |
| FM7 | moderate risk | FM16 | low risk | FM25 | moderate risk |
| FM8 | moderate risk | FM17 | moderate risk | FM26 | moderate risk |
| FM9 | moderate risk | FM18 | moderate risk |
| Occupational Hazards | Categories via Different Methods | ||
|---|---|---|---|
| Proposed Method | FlowSort | FMEA | |
| FM1 | high risk | moderate risk | - |
| FM2 | high risk | moderate risk | - |
| FM3 | moderate risk | low risk | - |
| FM4 | moderate risk | moderate risk | - |
| FM5 | high risk | moderate risk | - |
| FM6 | moderate risk | moderate risk | - |
| FM7 | high risk | moderate risk | - |
| FM8 | high risk | moderate risk | - |
| FM9 | high risk | moderate risk | - |
| FM10 | high risk | moderate risk | - |
| FM11 | high risk | moderate risk | - |
| FM12 | moderate risk | moderate risk | high risk |
| FM13 | high risk | moderate risk | - |
| FM14 | high risk | moderate risk | high risk |
| FM15 | high risk | moderate risk | high risk |
| FM16 | high risk | low risk | - |
| FM17 | high risk | moderate risk | high risk |
| FM18 | high risk | moderate risk | high risk |
| FM19 | high risk | moderate risk | - |
| FM20 | high risk | moderate risk | high risk |
| FM21 | high risk | moderate risk | - |
| FM22 | high risk | moderate risk | - |
| FM23 | mod | moderate risk | - |
| FM24 | mod | moderate risk | - |
| FM25 | mod | moderate risk | - |
| FM26 | mod | moderate risk | - |
| Occupational Hazards | Severity | Detection | Occurrence |
|---|---|---|---|
| FM1 | |||
| FM2 | |||
| FM3 | |||
| FM4 | |||
| FM5 | |||
| FM6 | |||
| FM7 | |||
| FM8 | |||
| FM9 | |||
| FM10 | |||
| FM11 | |||
| FM12 | |||
| FM13 | |||
| FM14 | |||
| FM15 | |||
| FM16 | |||
| FM17 | |||
| FM18 | |||
| FM19 | |||
| FM20 | |||
| FM21 | |||
| FM22 | |||
| FM23 | |||
| FM24 | |||
| FM25 | |||
| FM26 |
 ; Moderate risk index:
  ; High risk index:
  .
.Disclaimer/Publisher’s Note: The statements, opinions and data contained in all publications are solely those of the individual author(s) and contributor(s) and not of MDPI and/or the editor(s). MDPI and/or the editor(s) disclaim responsibility for any injury to people or property resulting from any ideas, methods, instructions or products referred to in the content. |
© 2023 by the authors. Licensee MDPI, Basel, Switzerland. This article is an open access article distributed under the terms and conditions of the Creative Commons Attribution (CC BY) license (https://creativecommons.org/licenses/by/4.0/).
Share and Cite
Guinitaran, R.; Canseco-Tuñacao, H.A.; Patunob, M.; Silagpo, G.; Villamor, C.A.; Villarosa, R.; Aro, J.L.; Evangelista, S.S.; Ocampo, L. Occupational Hazards Evaluation in Residential Construction Projects: Novel Sorting Methods Based on q-Rung Orthopair Fuzzy Choquet Integral. Buildings 2023, 13, 1129. https://doi.org/10.3390/buildings13051129
Guinitaran R, Canseco-Tuñacao HA, Patunob M, Silagpo G, Villamor CA, Villarosa R, Aro JL, Evangelista SS, Ocampo L. Occupational Hazards Evaluation in Residential Construction Projects: Novel Sorting Methods Based on q-Rung Orthopair Fuzzy Choquet Integral. Buildings. 2023; 13(5):1129. https://doi.org/10.3390/buildings13051129
Chicago/Turabian StyleGuinitaran, Raul, Hana Astrid Canseco-Tuñacao, Marlito Patunob, Gilbert Silagpo, Cheryl Ann Villamor, Rica Villarosa, Joerabell Lourdes Aro, Samantha Shane Evangelista, and Lanndon Ocampo. 2023. "Occupational Hazards Evaluation in Residential Construction Projects: Novel Sorting Methods Based on q-Rung Orthopair Fuzzy Choquet Integral" Buildings 13, no. 5: 1129. https://doi.org/10.3390/buildings13051129