Article

Finite Element Modeling of Interface Behavior between Normal Concrete and Ultra-High Performance Fiber-Reinforced Concrete

Department of Civil Engineering, Kumoh National Institute of Technology, Gumi 39177, Republic of Korea
*
Author to whom correspondence should be addressed.
Buildings 2023, 13(4), 950; https://doi.org/10.3390/buildings13040950
Submission received: 6 March 2023 / Revised: 27 March 2023 / Accepted: 29 March 2023 / Published: 3 April 2023
(This article belongs to the Special Issue Advanced Numerical and Computer Methods in Civil Engineering)

Abstract

:
The behavior at the interface between normal strength concrete (NSC) and Ultra-High Performance Fiber-Reinforced Concrete (UHPFRC) plays a crucial role in accurately predicting the capacity of UHPFRC for strengthening and repairing concrete structures. Until now, there has been a lack of sufficient finite element (FE) models for accurately predicting the behavior at the interface between NSC and UHPFRC. This study aims to investigate the structural behavior of composite members made of NSC and UHPFRC by developing a model that accurately simulates the interface between the two materials using a linear traction-separation law. Novel parameters for the surface-based cohesive model, based on the traction-separation model, were obtained and calibrated from prior experiments using analytical methods. These parameters were then integrated into seven FE models to simulate the behavior at the interface between NSC and UHPFRC in shear, tensile, and flexural tests. The accuracy of the FE models was validated using experimental data. The findings revealed that the proposed FE models could effectively predict the structural behavior of composite NSC-UHPFRC members under various working conditions. Specifically, the maximum deviations between EXP and FEA were 6.8% in ultimate load for the shear test and 15.9% and 2.8% in ultimate displacement for the tensile and flexural tests, respectively. The model can be utilized to design the use of UHPFRC and ultra-high performance fiber-reinforced shotcrete (UHPFRS) for repairing and strengthening damaged concrete structures.

1. Introduction

Ultra-High Performance Fiber-Reinforced Concrete (UHPFRC) is a highly advanced material renowned for its exceptional strength, high ductility, and low permeability [1,2,3]. This advancement has led to increasing interest in UHPFRC as a promising solution for rehabilitating and strengthening aged and damaged concrete structures. UHPFRC’s excellent bonding ability with normal strength concrete (NSC) has been particularly noteworthy, making it an attractive option for repair and strengthening applications. Therefore, the objective of this study is to develop a reliable model for predicting the bonding behavior at the interface between NSC and UHPFRC under various loading conditions.
Finite Element (FE) analysis is a vital tool for studying the behavior of composite NSC-UHPFRC members and designing them to enhance their strength and repairability. Despite its widespread use in investigating bonding behavior in composite structures, previous studies have mostly focused on specific conditions.
The cohesive zone model is a popular technique used to model the behavior between NSC and UHPFRC using a thin material layer. This approach allows for the simulation of debonding, crack initiation, and crack propagation that can occur at the interface between NSC and UHPFRC. Tong et al. [4] developed a 2D eight node quadratic line cohesive element FE model to simulate the thin layer between NSC and UHPFRC, with the parameters calibrated from slant shear. The findings showed good agreement with experimental results in a flexural test of composite NC-UHPC members. Yu et al. [5] developed a 2D cohesive model with fixed parameters to study the bonding behavior of the NSC-UHPFRC interface. Surface roughness was modeled using representative volume elements (RVEs). The simulated traction-separation curve agreed well with experimental data, with a maximum deviation of around 27%.
Additionally, 3D models have been developed by researchers using cohesive zone models to simulate the bonding behavior between NSC and UHPFRC. For instance, Valikhani et al. [6] created a 3D FE model using ATENA software with a cohesive element calibrated from a bi-surface shear test. The simulated results matched well with the experimental results in the bi-surface test. Similarly, Hussein et al. [7] successfully used a cohesive zone model to analyze the direct tensile behavior of HSC-UHPFRC specimens, with results that matched well with the experimental data. Another study by Kadhim et al. [8] employed a cohesive zone model with contact-target elements in ANSYS software, but the results were not validated. However, while cohesive models have been introduced in some studies, their validity for accurately modeling NSC-UHPFRC composite members under different working conditions is yet to be established.
Perfect bonding using tie constraints is also a common method for modeling the NSC-UHPFRC interface, but it can lead to an overestimation of load-carrying capacity and design errors. According to Farzad et al. [9], the use of a tie constraint to simulate the bonding interface between NSC and UHPFRC in slant shear and direct shear tests led to overestimated results that were up to 150% different from the experimental data.
Several other models have been developed to simulate the behavior of the NSC-UHPFRC interface. For instance, Lampropoulos et al. [10] proposed a 3D model with a cohesion and friction coefficient of 1.5 MPa and 1.5, respectively, to simulate the behavior of a composite beam on a well-roughened substrate. However, the model’s validity on the composite beam has not been tested. Farzad et al. [9] used a contact layer with a thickness of 100 μm and defined its characteristics using the CDP model to model the NSC-UHPFRC interface. They found a maximum error of 18% when comparing the results of this model with experimental data. In addition, Hor Yin et al. [11] used LS-DYNA to model the NSC-UHPC interface with equivalent beam elements, achieving good agreement between simulated and experimental results for composite beams.
As far as the authors know, no studies have investigated how different working conditions, such as the tensile, shear, and bending behavior of composite members, affect the validity of these models.
This study aims to develop a model for simulating the interfacial bonding between NSC and UHPFRC and integrate it into 3D FE models using ABAQUS software. The goal is to accurately predict the nonlinear behavior of NSC-UHPFRC composite members under various working conditions. The assumption of traction-separation law [12] is used as a starting point, as it imitates the constitutive behavior of the NSC-UHPFRC interface. Parameters for the interfacial bonding model are then determined through an analytical method based on shear and tensile tests. The interfacial model is subsequently integrated into seven ABAQUS models to verify its accuracy by comparing simulated results with experimental results for shear, tensile, and flexural tests.
The study yielded promising results, indicating that the developed parameters for the surface-based cohesive model in ABAQUS can accurately simulate the bonding behavior of NSC-UHPFRC composite members under shear, tensile, and bending loads. This innovative model holds significant potential for predicting the behavior of concrete members that have been reinforced and repaired with UHPFRC, thereby extending their service life.
This study is structured as follows: In Section 2, an analytical method is presented to determine specific parameters for the surface-based cohesive model, taking into account the diverse conditions of surface states. In Section 3, the developed model is applied to investigate the tensile, shear, and flexural behaviors of composite structures, and its accuracy is validated through comparison with experimental data. Section 4 presents the obtained results and provides a discussion of these results. Finally, Section 5 summarizes the key findings of the study and discusses their implications.

2. Interfacial Bonding Model at the NC-UHPFRSC Interface

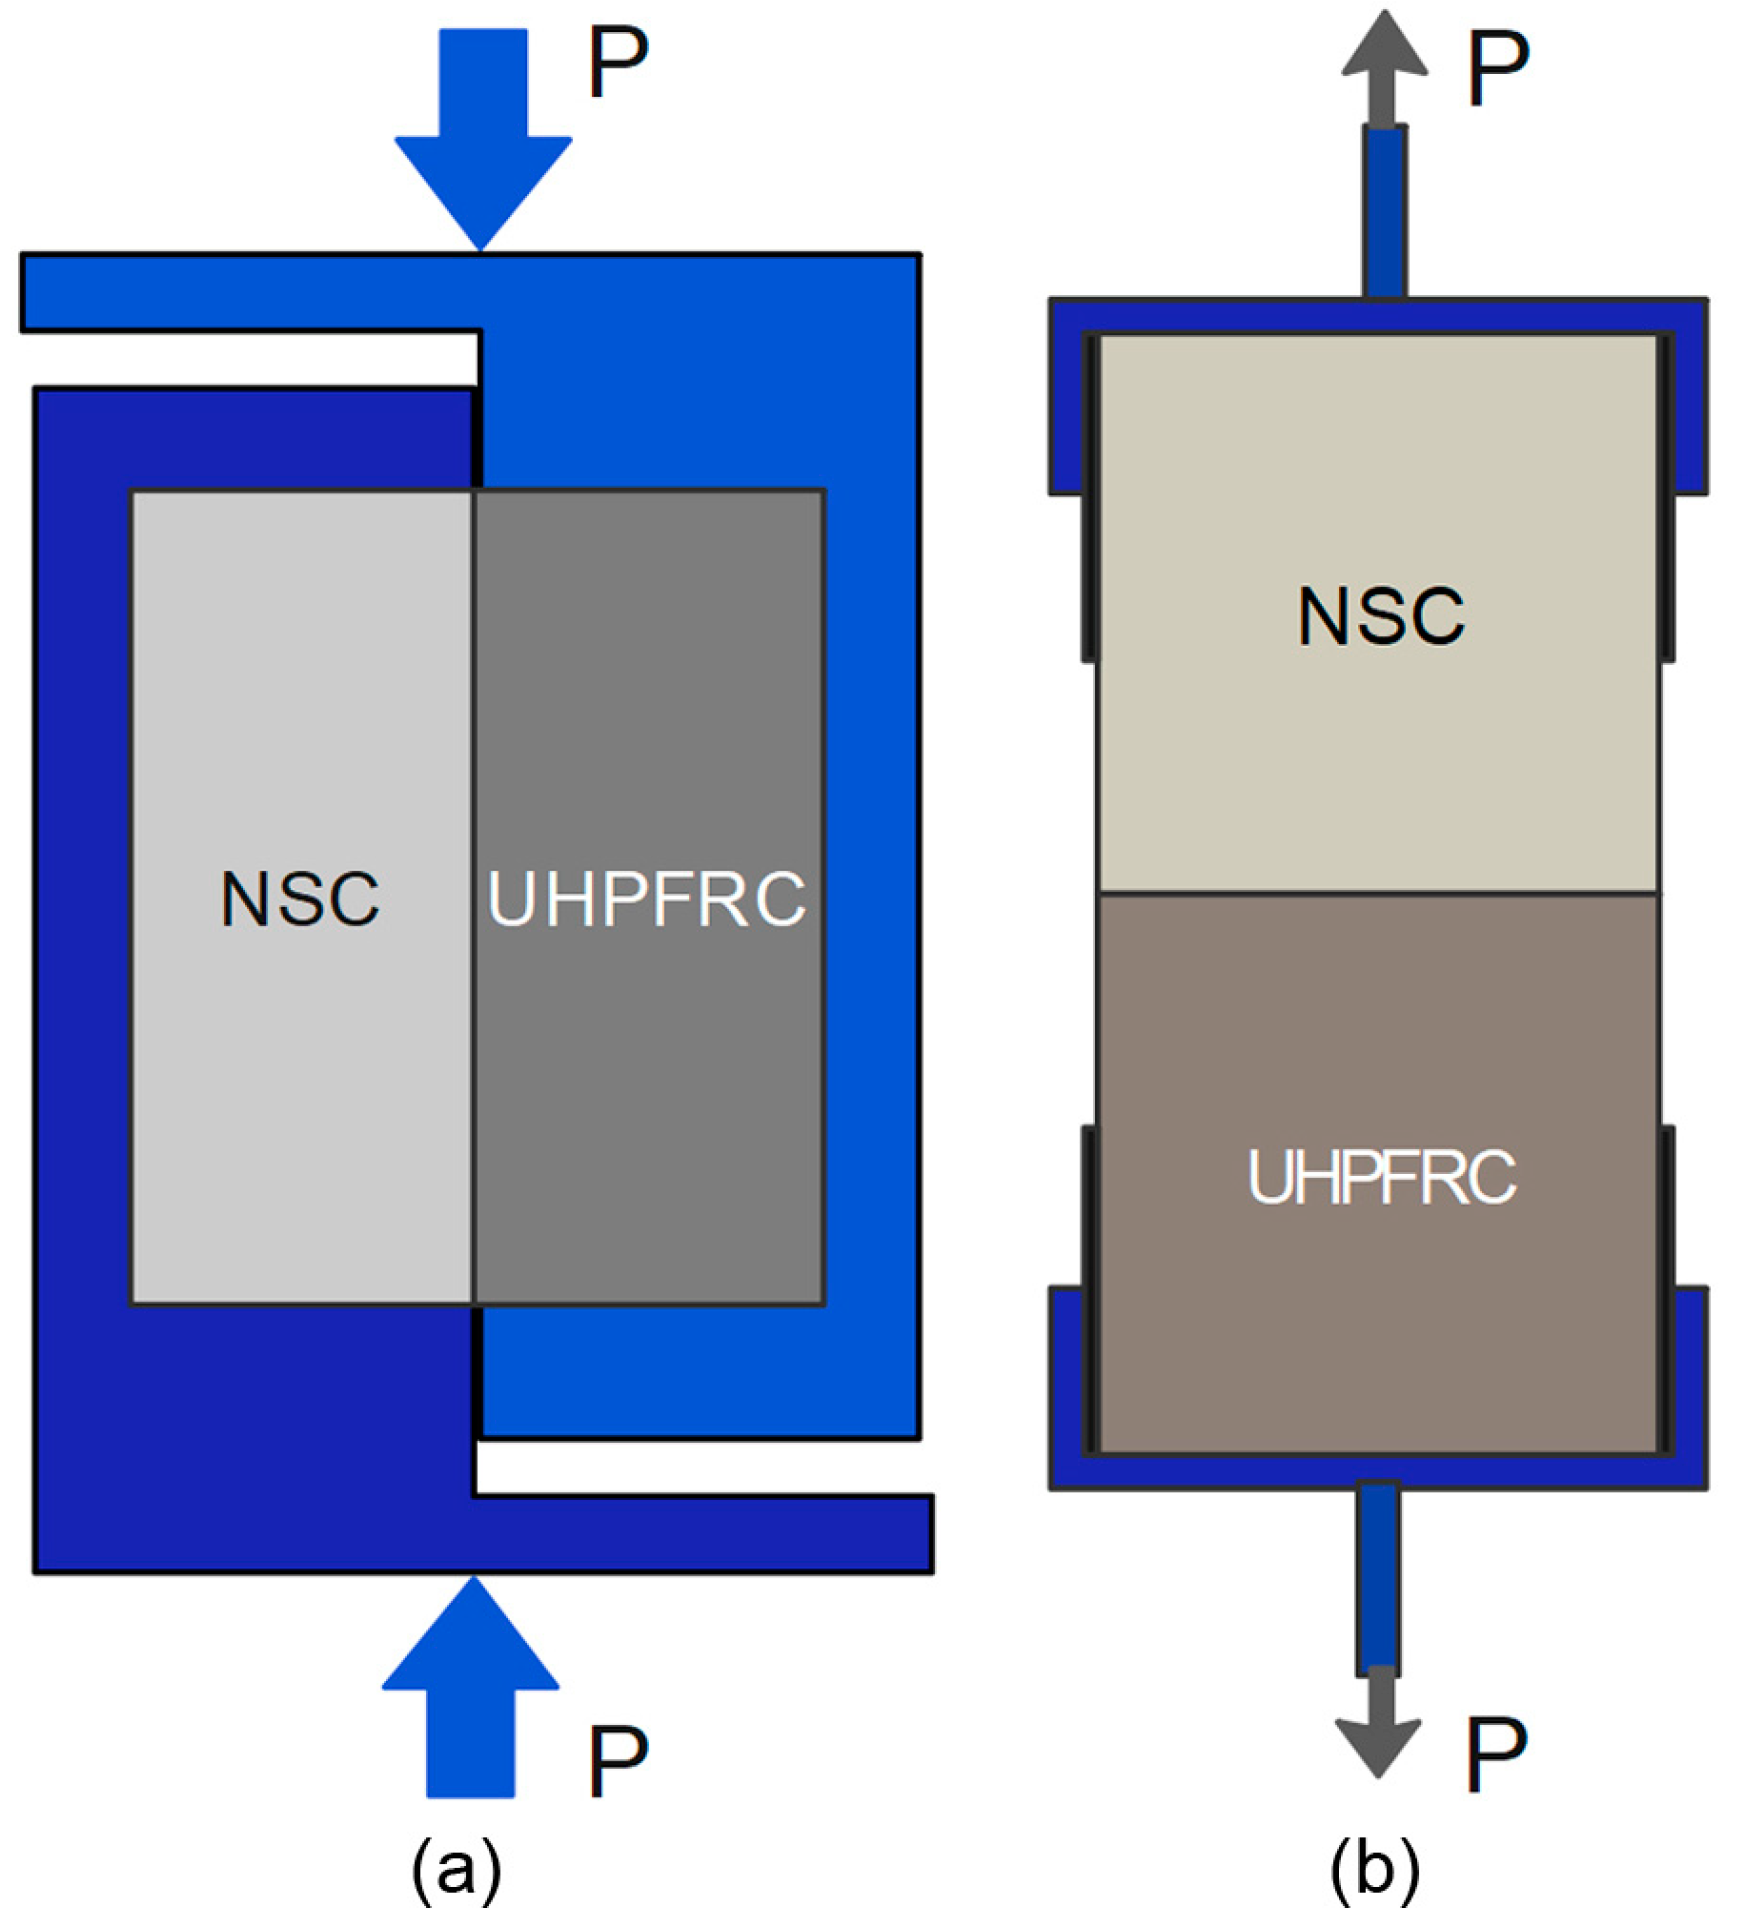
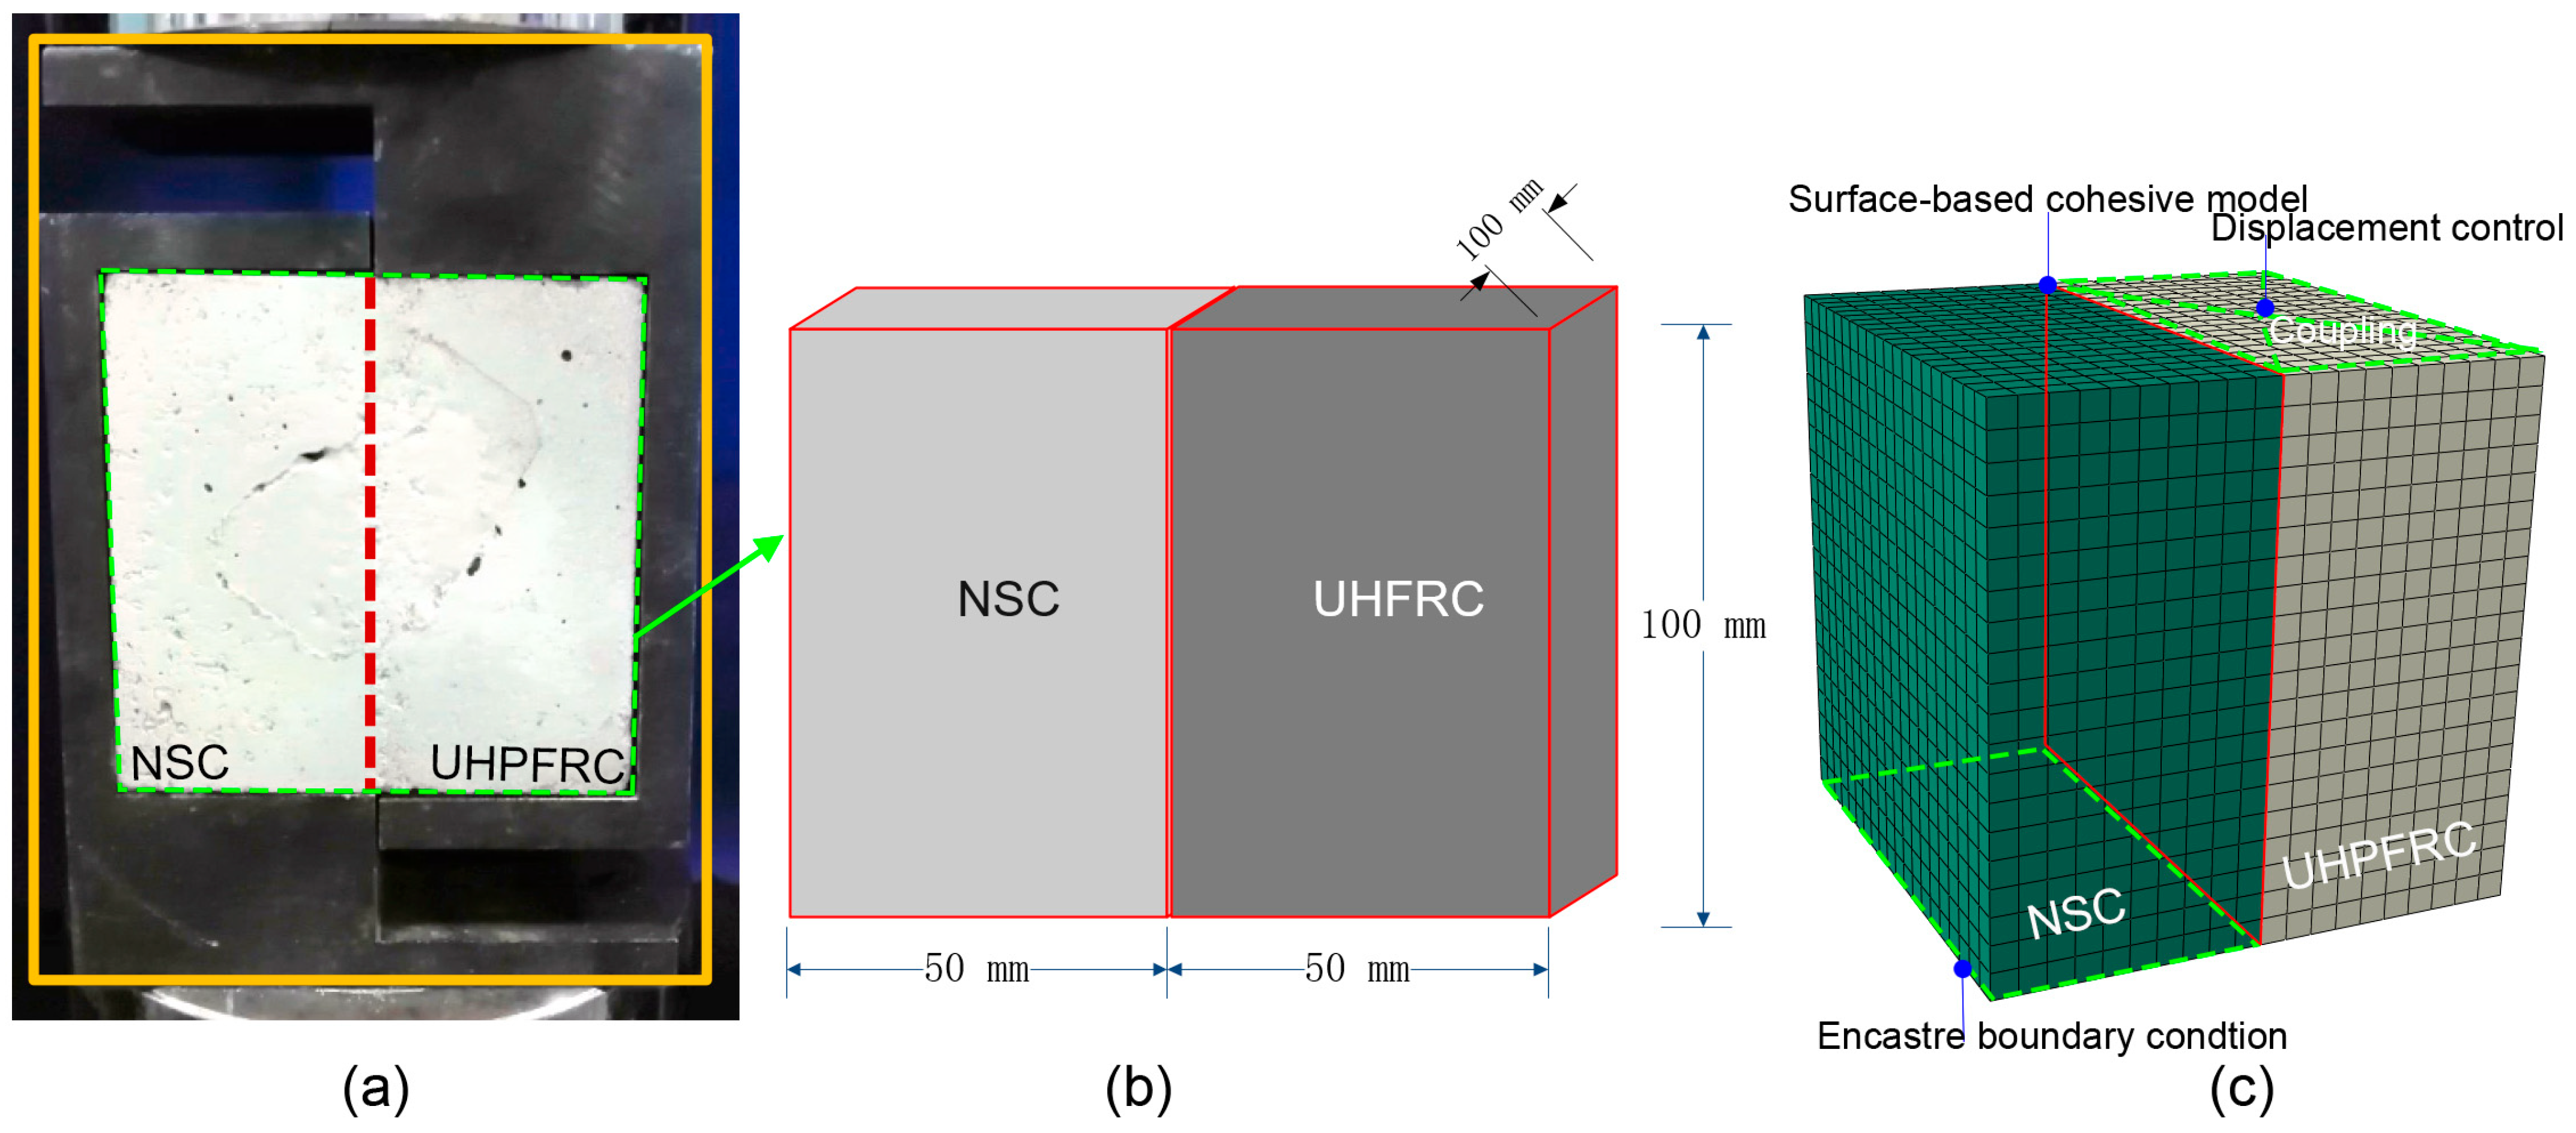
Interfacial debonding phenomena between UHPC and NSC typically occur in three stress cases: pure shear, tensile, and mixed modes of shear and tensile or compressive stresses [13,14]. The ASSHTO LRFD Bridge Design Specifications [15] outline a shear test (Figure 1a) for a composite specimen composed of two different materials. The shear strength at the interface of different concretes cast at various times is determined using the following:
v u = c A c v + μ ( A v f f y + P c )
where c is the cohesion and Acv is the area between two layers of concrete. Avf and fy denote the area and the yield stress of reinforcement, respectively. µ is the friction coefficient, and Pc is the compressive force perpendicular to the shear plane.
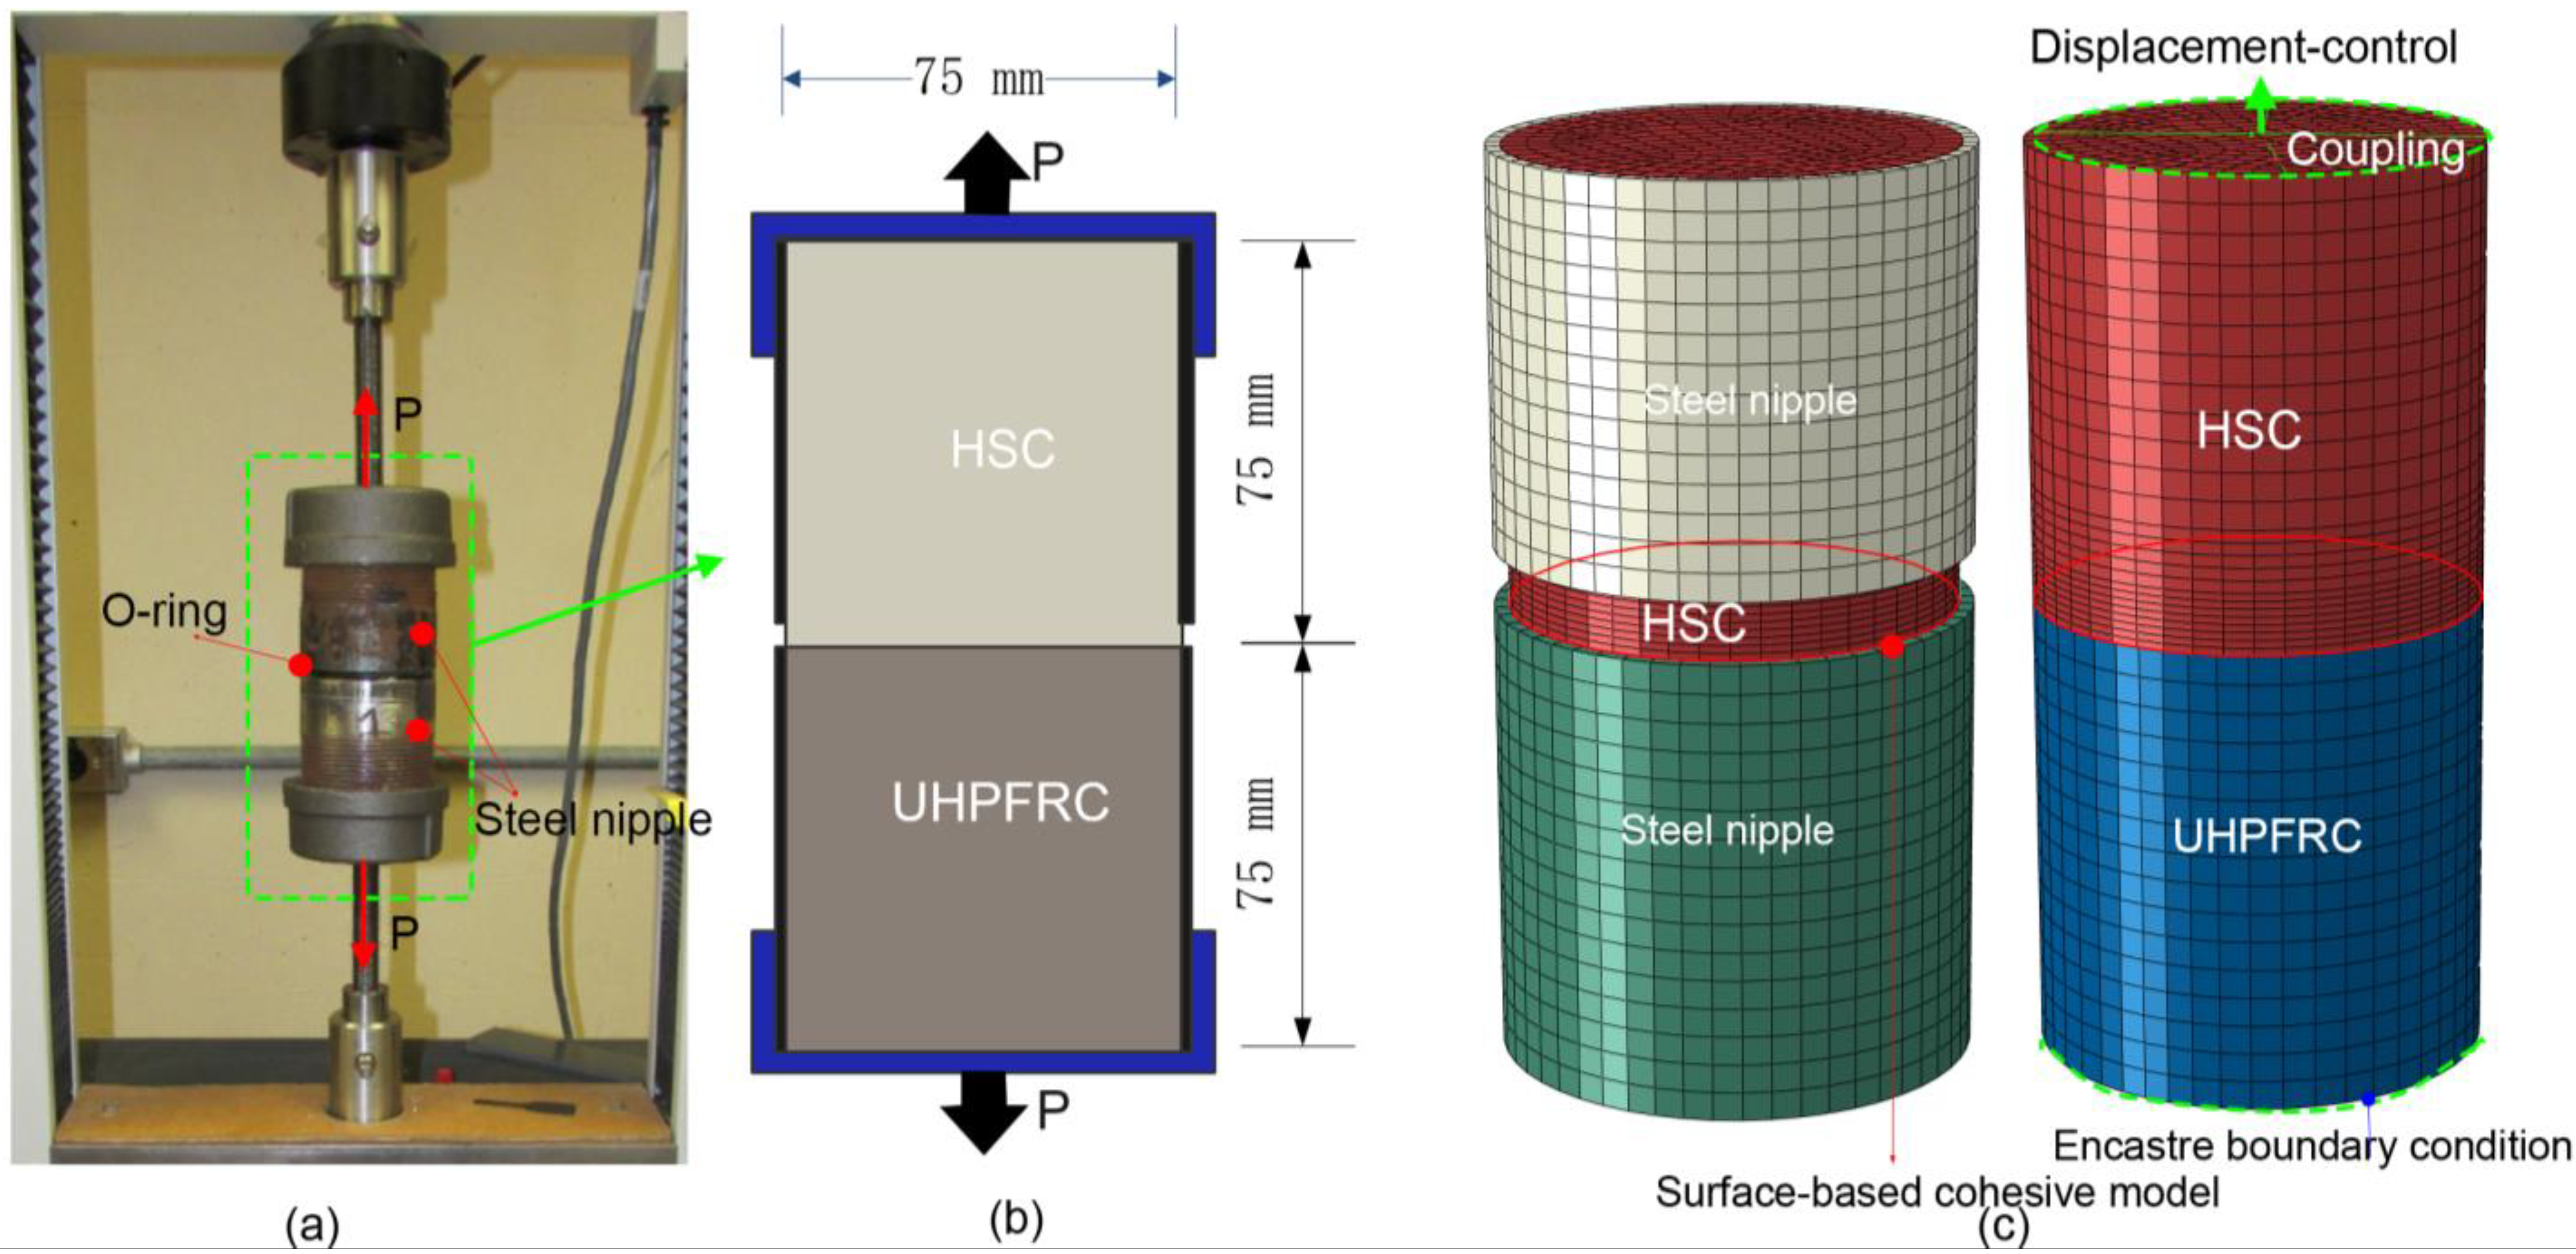
The tensile strength is calculated based on the pull-off test (Figure 1b) according to ASTM C1583/C1583M [16] and is shown as follows:
f t = T A
where ft is the direct tensile strength. T and A are the tensile force and the cross-sectional area of the test specimen, respectively.
The bonded interface between the NSC and UHPFRC in in situ casting can be accurately modeled using cohesive elements and surface-based cohesive behavior in ABAQUS software [17]. This modeling approach effectively represents the interface, which is usually composed of a thin layer of UHPFRC material, except in cases of abnormal surface roughness. Therefore, neglecting the surface thickness and using the surface-based cohesive behavior to model the interfacial behavior between NSC and UHPFRC is appropriate.
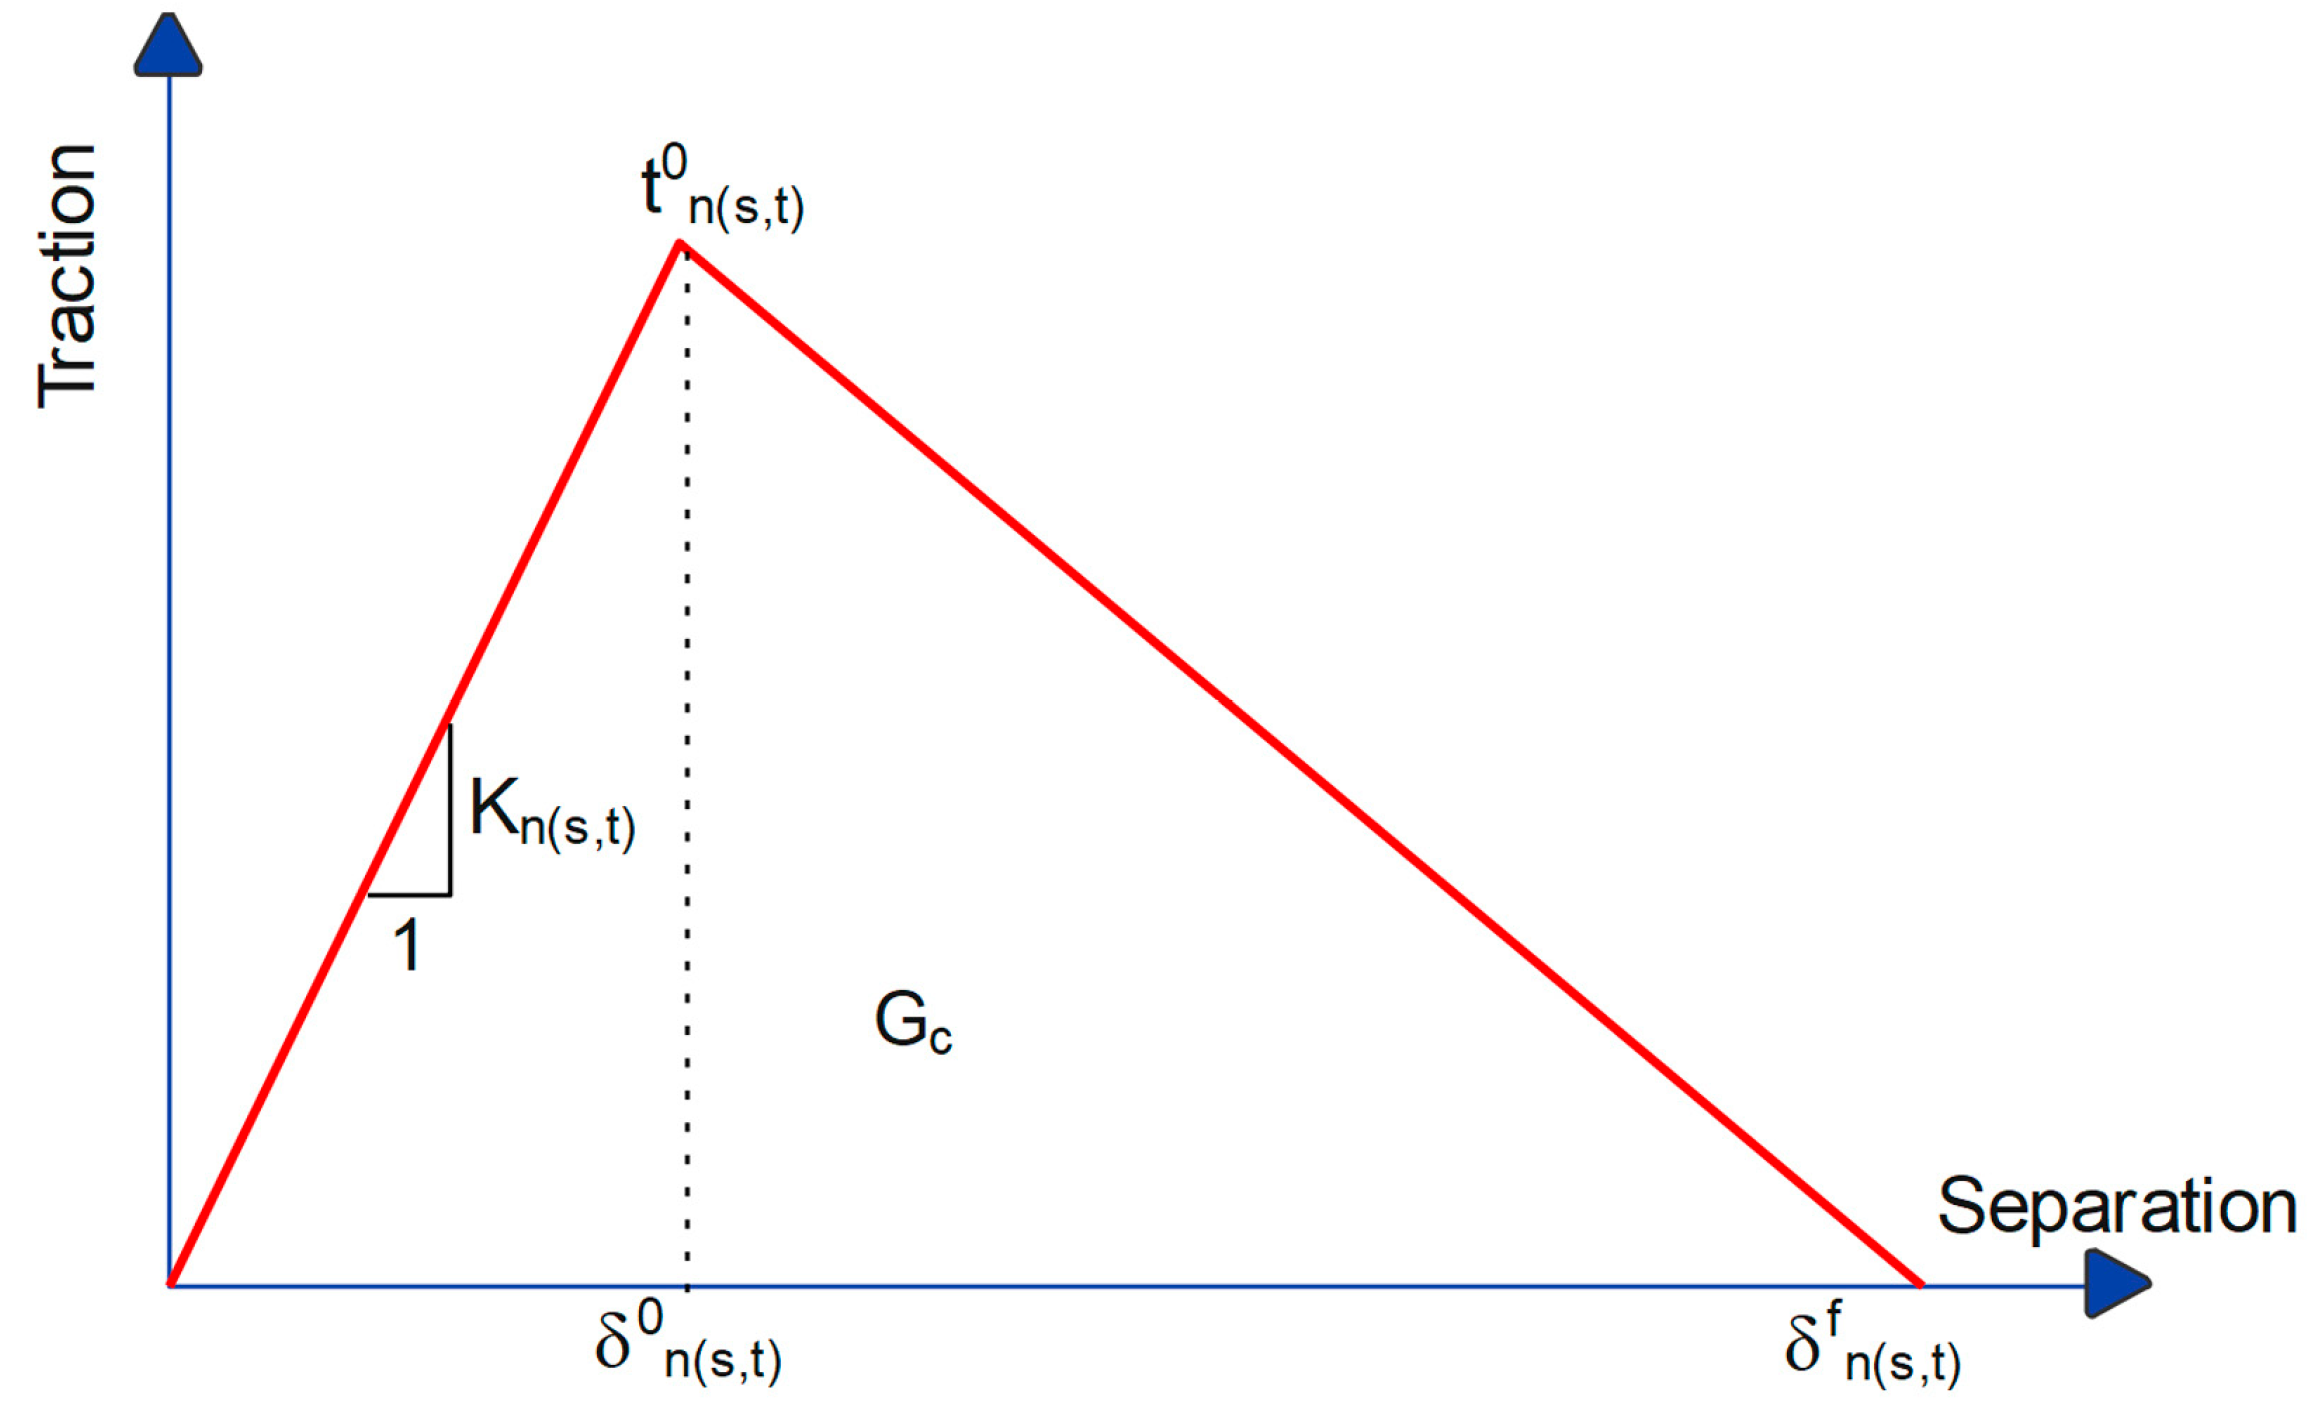
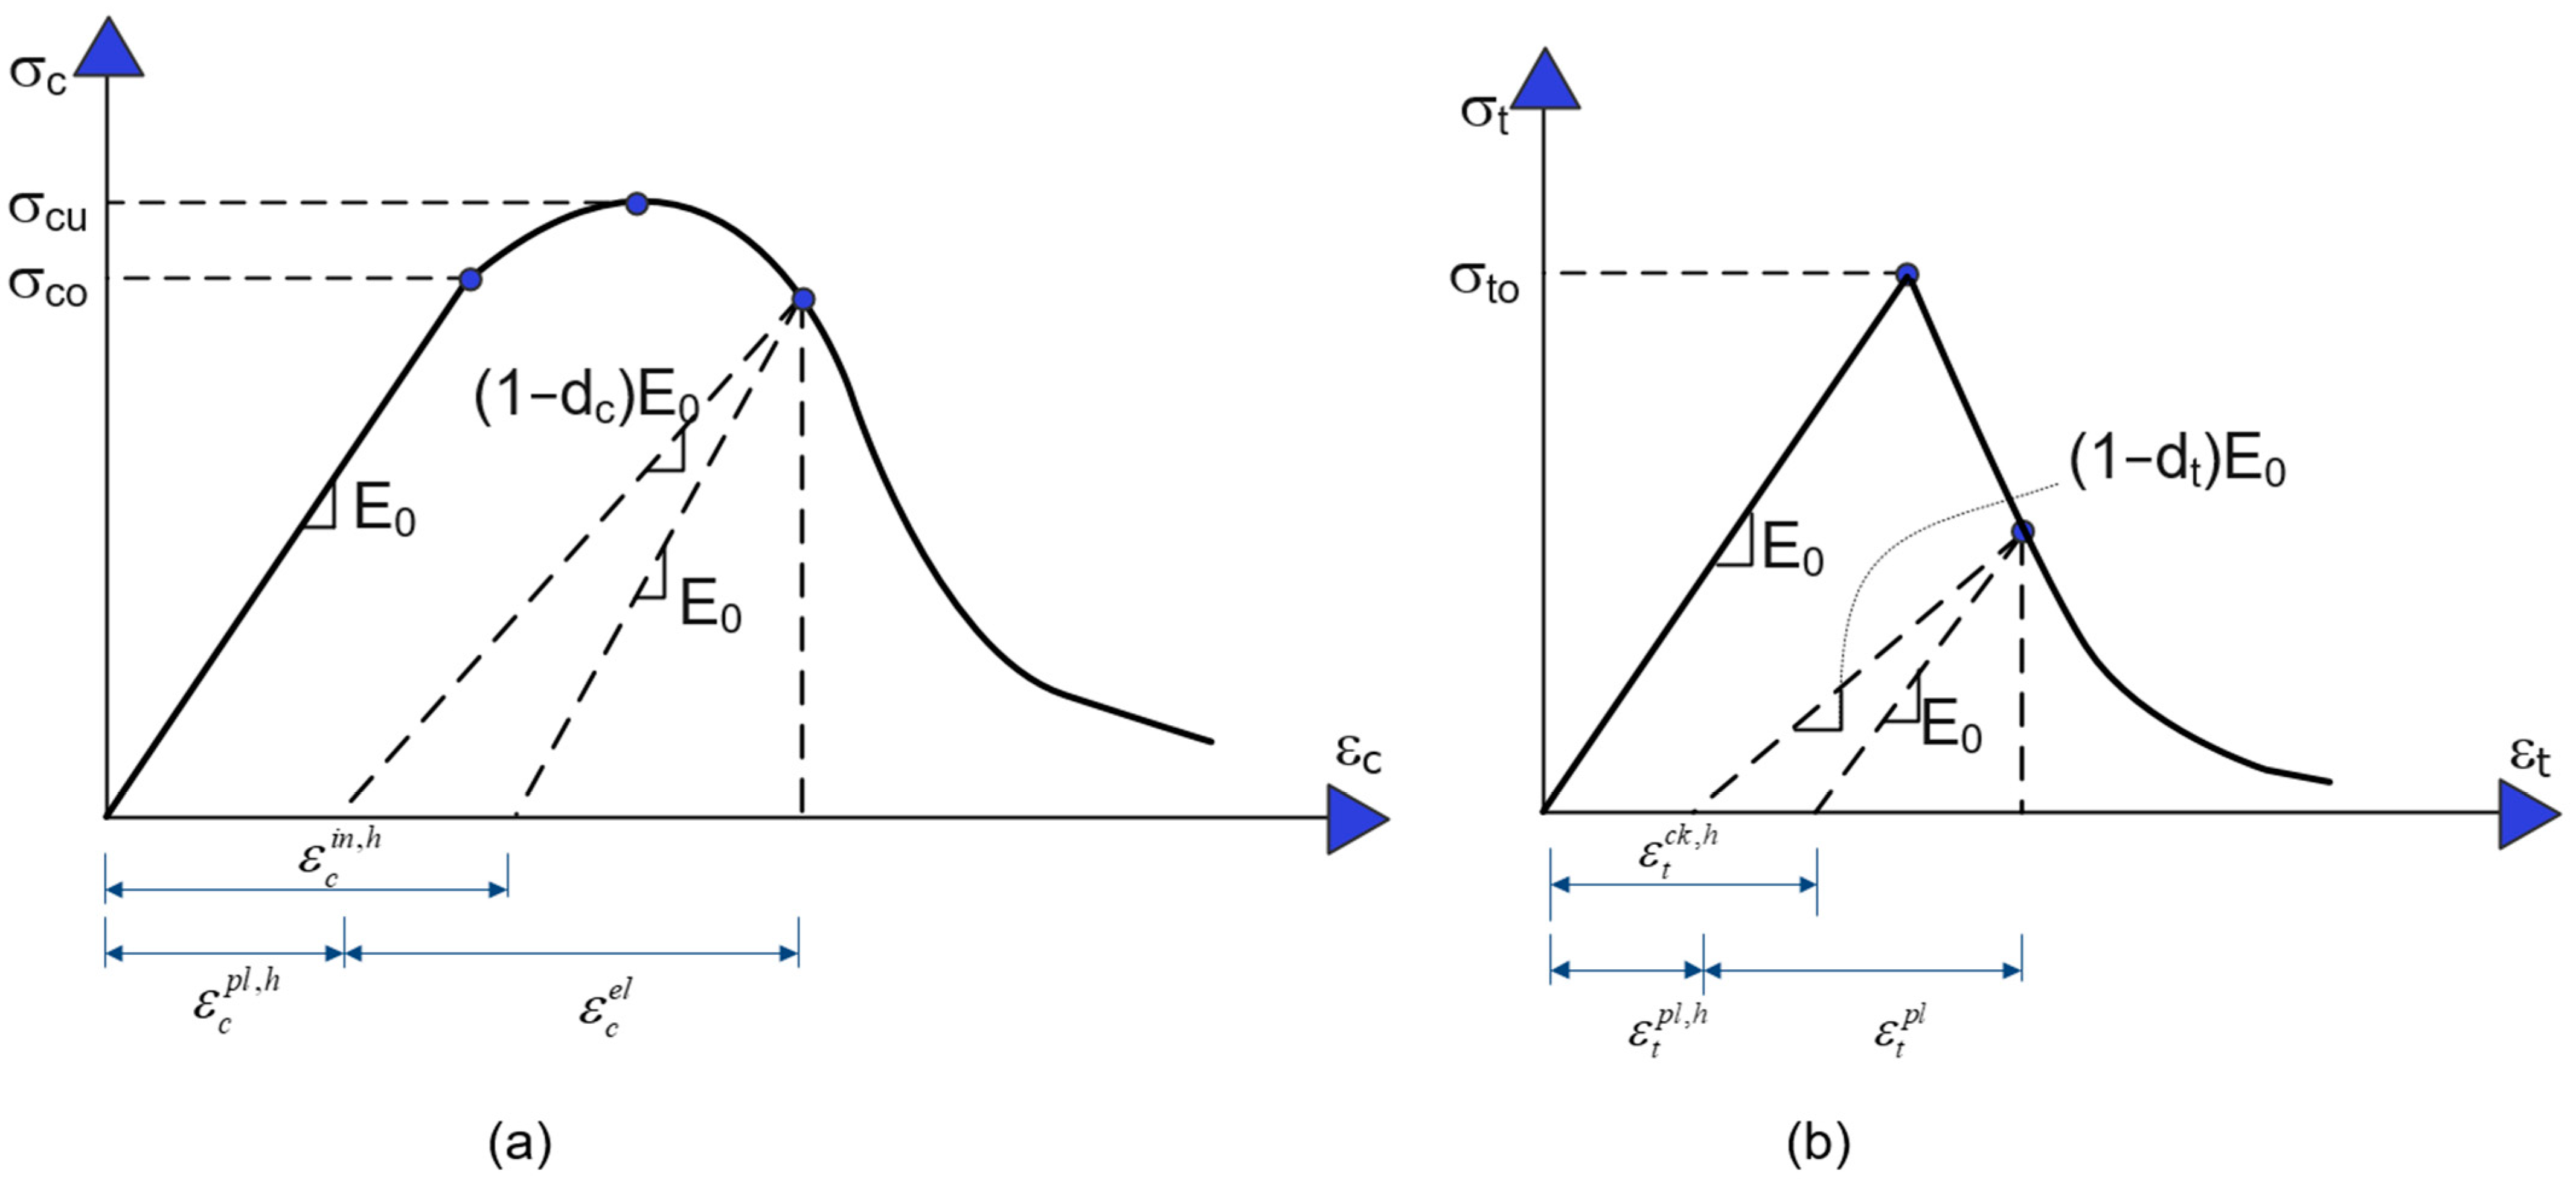
The surface-based cohesive behavior can be simulated using the common bi-linear traction-separation law [12], as shown in Figure 2. The parameters Kn(s,t), t0n(s,t), δ0n(s,t), and δtn(s,t) represent the normal and two tangential stiffnesses, maximum stresses, corresponding displacements to the maximum stress, and maximum displacements at zero stress, respectively. The law of the model includes two stages. In the first stage, the stress at the interface increases linearly up to the peak t0n(s,t) with the stiffness K. At the peak, damage initiation occurs and is followed by the evolution of that damage. The relationship between traction tn(s,t) and separation δ in the linear traction-separation law can be described by Equation (3):
t n ( s , t ) ( δ ) = { K n ( s , t ) δ = t n ( s , t ) 0 δ δ n ( s , t ) 0 ; 0 < δ < δ n ( s , t ) 0 t n ( s , t ) 0 δ n ( s , t ) f δ δ n ( s , t ) f δ n ( s , t ) 0 ; δ n ( s , t ) 0 < δ < δ n ( s , t ) f 0 ; δ n ( s , t ) f < δ
ABAQUS offers various criteria to determine damage initiation, which is the point at which the bonding at the interface begins to degrade. In this study, the maximum stress criterion was utilized, where damage initiation occurs when the maximum contact stress ratio reaches one. This criterion is expressed in Equation (4):
max { t n t n 0 , t s t s 0 , t t t t 0 } = 1
The Macaulay bracket notation, denoted by the symbol <>, is used in this context to represent purely compressive stress.
The damage evolution law characterizes the degradation of cohesive stiffness following damage initiation. During this stage, Equation (5) is used to describe the contact stress components at the interface that are affected by a scalar damage variable, D.
t n ( s , t ) ( δ ) = ( 1 D ) t n ( s , t ) 0
The value of the scalar damage variable, D, is zero when there is no damage and one when the bonding has completely failed. Since the maximum stress criterion was utilized, a linear damage evolution model was adopted in this study. When the bonding experiences complete failure, D reaches a value of one, indicating complete plastic displacement. This displacement is determined by the difference between δfn(s,t) and δ0n(s,t).
The elastic behavior is determined by Equation (6):
t = { t n t s t t } = [ K n n K n s K n t K n s K s s K t s K n t K s t K t t ] { δ n δ s δ t } = K δ
The nominal traction stress vector, represented by t, includes tn for the normal traction and ts and tt for the two shear tractions. δn, δs, and δt denote corresponding separations. The uncoupled traction-separation behavior is normally utilized to model the interface’s working behavior. This uncoupled behavior is applied when the pure normal separation and the pure shear separation do not affect each other [17].
For surface-based cohesive and uncoupled behavior, the thickness of the cohesive element is assumed to be equal to one [17]. Therefore, the elastic behavior can be written as follows:
t = { t n t s t t } = [ K n 0 0 0 K s 0 0 0 K t ] { δ n δ s δ t }
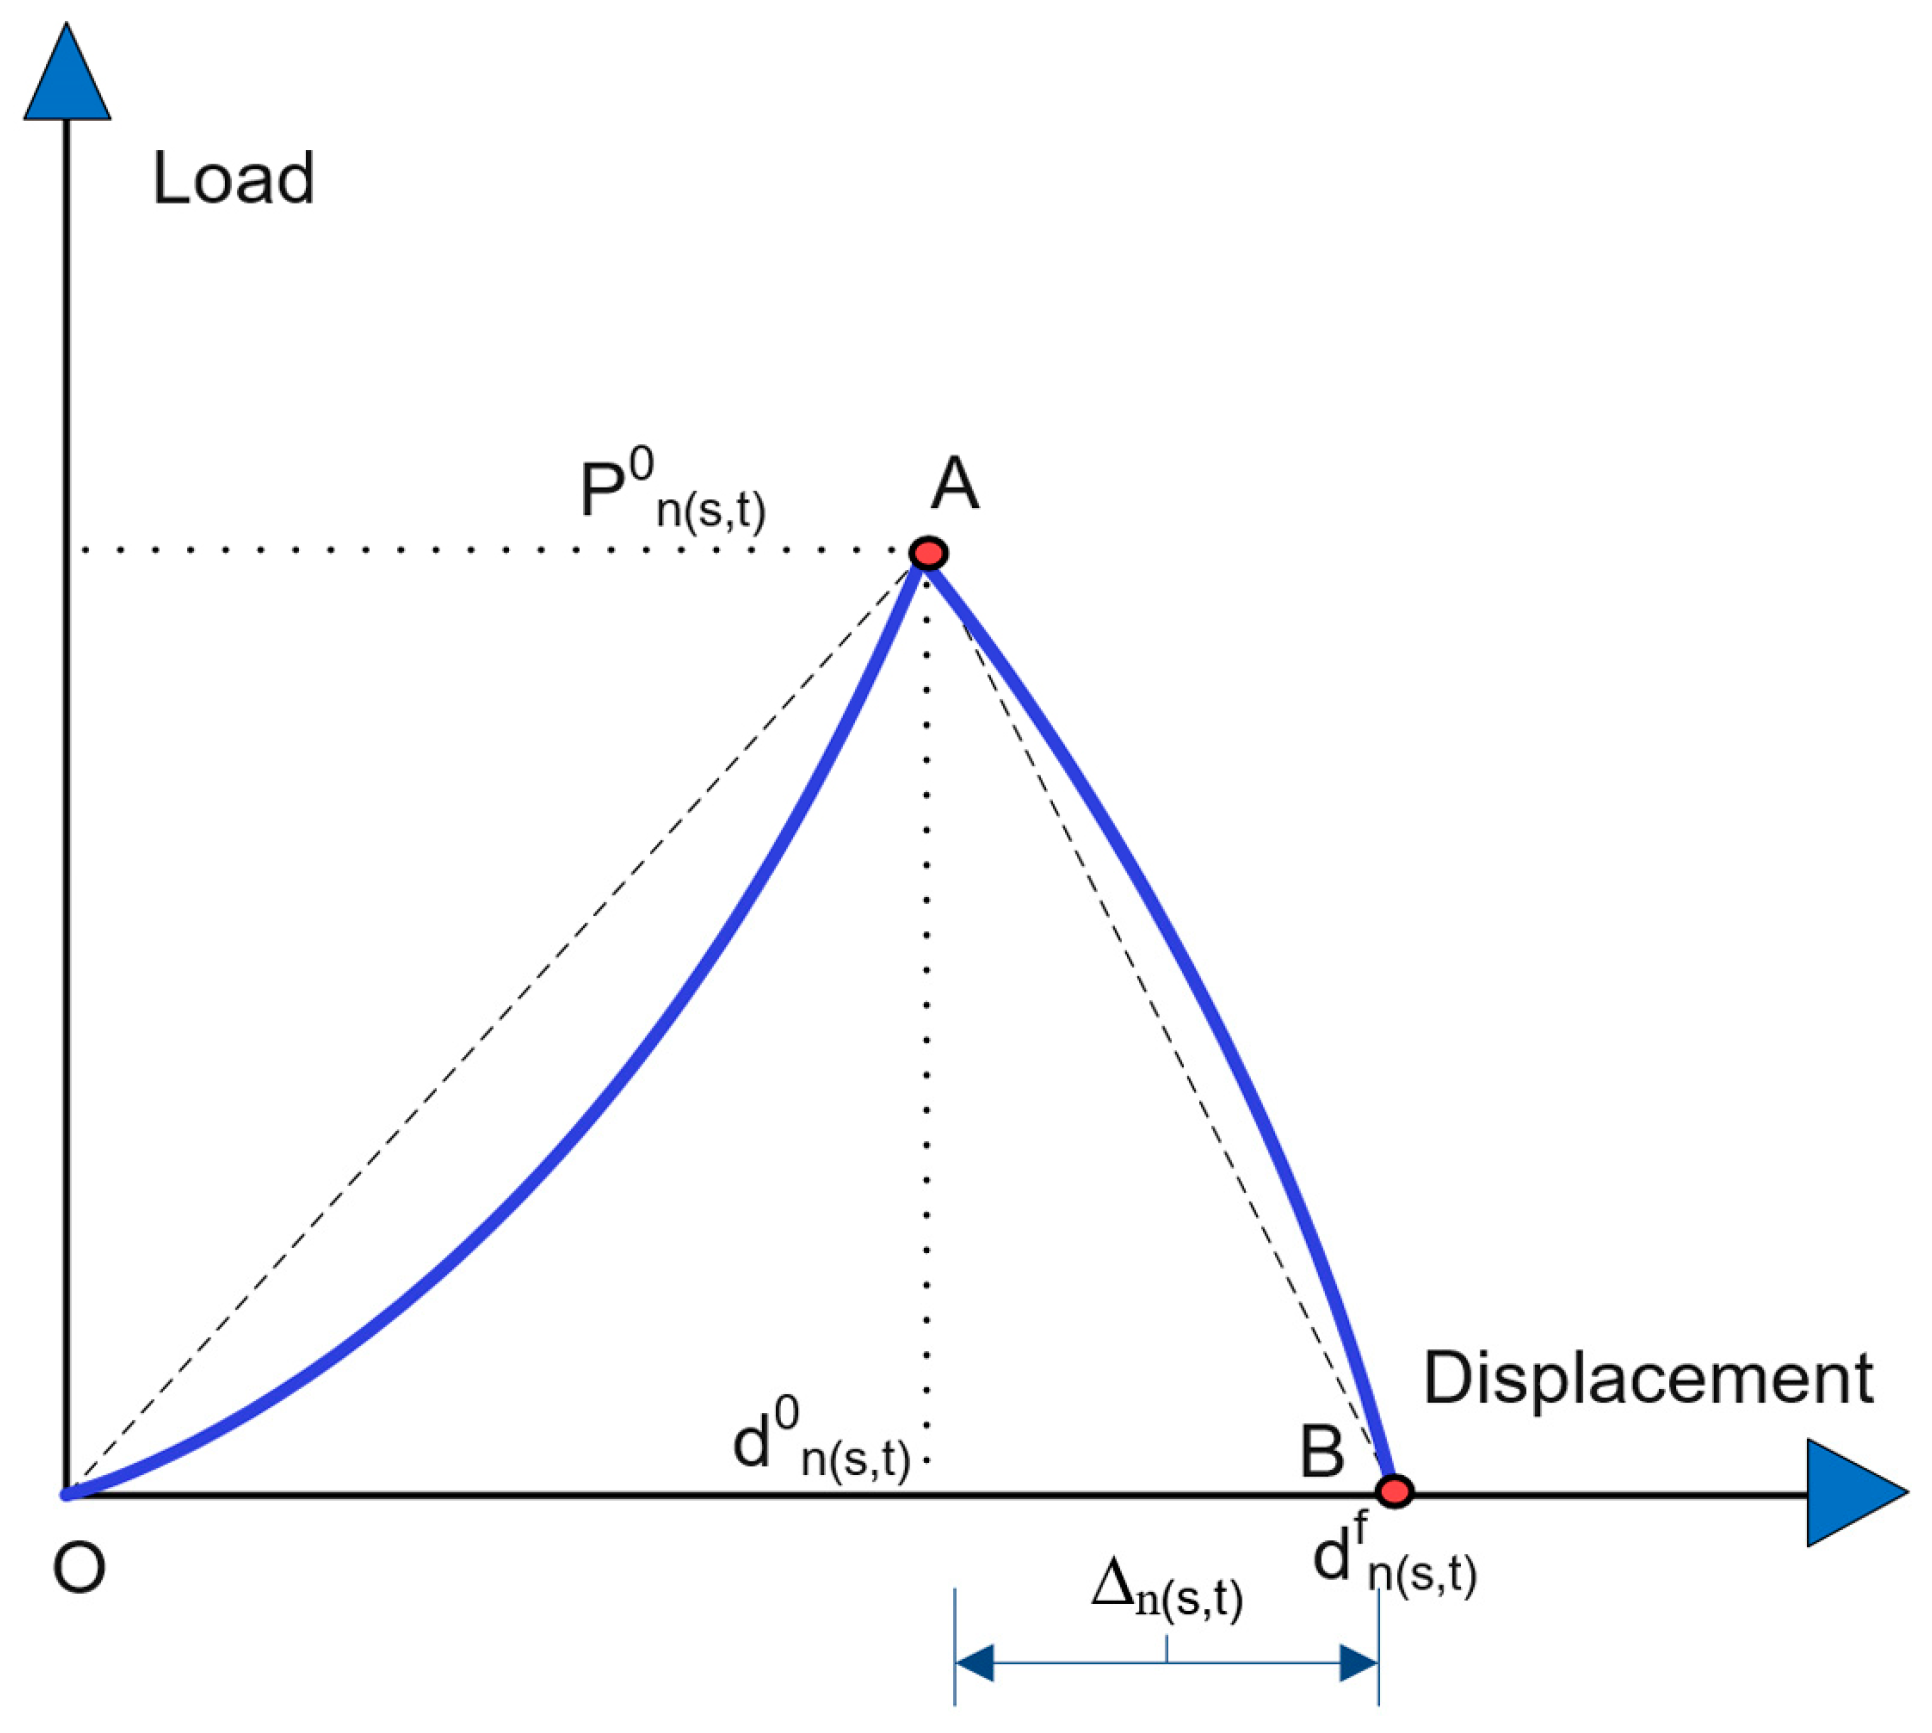
Figure 3 illustrates the typical load-displacement curve for both the shear bonding test (Figure 1a) and the pure direct tensile test (Figure 1b), shown by the blue curve. This curve is approximated as being linear over two segments, OA and AB. This relationship between load Pn(s,t) and displacement d can be expressed using Equation (8):
P n ( s , t ) ( d ) = { K n ( s , t ) d = P n ( s , t ) 0 d d n ( s , t ) 0 ; 0 < d < d n ( s , t ) 0 P n ( s , t ) 0 d n ( s , t ) f d d n ( s , t ) f d n ( s , t ) 0 ; d n ( s , t ) 0 < d < d n ( s , t ) f 0 ; d n ( s , t ) f < d
The ultimate loads of each mode are Pn°, Ps°, and Pt°, with corresponding displacements of dn°, ds°, and dt°, respectively. The highest displacement at the end of each damage evolution is represented by dnf, dsf, and dtf. The differences between the highest and corresponding displacements are denoted as Δn, Δs, and Δt.
The ultimate stresses and corresponding displacements are typically reached at the peak points of each mode’s load-displacement curve. By applying these conditions to Equation (7), the corresponding Equation can be derived as follows:
{ K n δ n = K n d n 0 = t n 0 = P n 0 A n K s δ s = K s d s 0 = t s 0 = P s 0 A s K t δ t = K t d t 0 = t t 0 = P t 0 A t
The interfacial areas between NSC and UHPFRC in the tensile and shear tests are denoted by An and As(At), respectively.
Thus, the normal stiffness and two tangential stiffnesses can be determined from Equation (10), which is derived from Equation (9).
{ K n = P n 0 A n d n 0 K s = P s 0 A s d s 0 K t = P t 0 A t d t 0
The damage of the interface is defined by using the maximum nominal stress tn°(ts°, tt°) and the total/plastic displacement.
The bonding strength of an interface is primarily determined by its roughness [18,19]. In civil engineering, the roughness of a concrete surface refers to the irregularity or variation in its texture. The quantification of a concrete surface’s roughness is commonly determined by its average sand-filling depth, represented as “h” in Figure 4a. Equation (11) can be used to calculate the value of “h”:
h = V s A s
where h represents the average depth of sand filling (mm); Vs is the volume of sand (mm3); and As represents the area of the treated concrete substrate (mm2).
For example, Feng et al.’s study [20] investigated the bonding strength of three types of surfaces: smooth, mid-rough, and rough (Figure 4b–d), which corresponded to sand-filling depths of 0, 0.64, and 1.29 mm, respectively.
Feng et al. [20] and Hussei et al. [21] previously investigated the shear and tensile behaviors of NSC-UHPFRC composite specimens with various surfaces. These studies tested NSC-UHPFRC specimens with smooth, mid-rough, and rough interfaces to determine load-displacement behaviors, as described in Section 3.2 and Section 3.3. Table 1 summarizes the experimental results, including the ultimate loads (Pn(s,t)0), surface areas (A n(s,t)0), displacements (d n(s,t)0), and maximum plastic displacement (∆) for both shear and tensile tests. Additionally, the table provides the values of tractions and stiffnesses for the three types of surfaces, which were obtained using Equations (9) and (10).
The parameters for the smooth, mid-rough, and rough surfaces of the NSC-UHPFRC interface, which were derived from Table 1, are presented in 
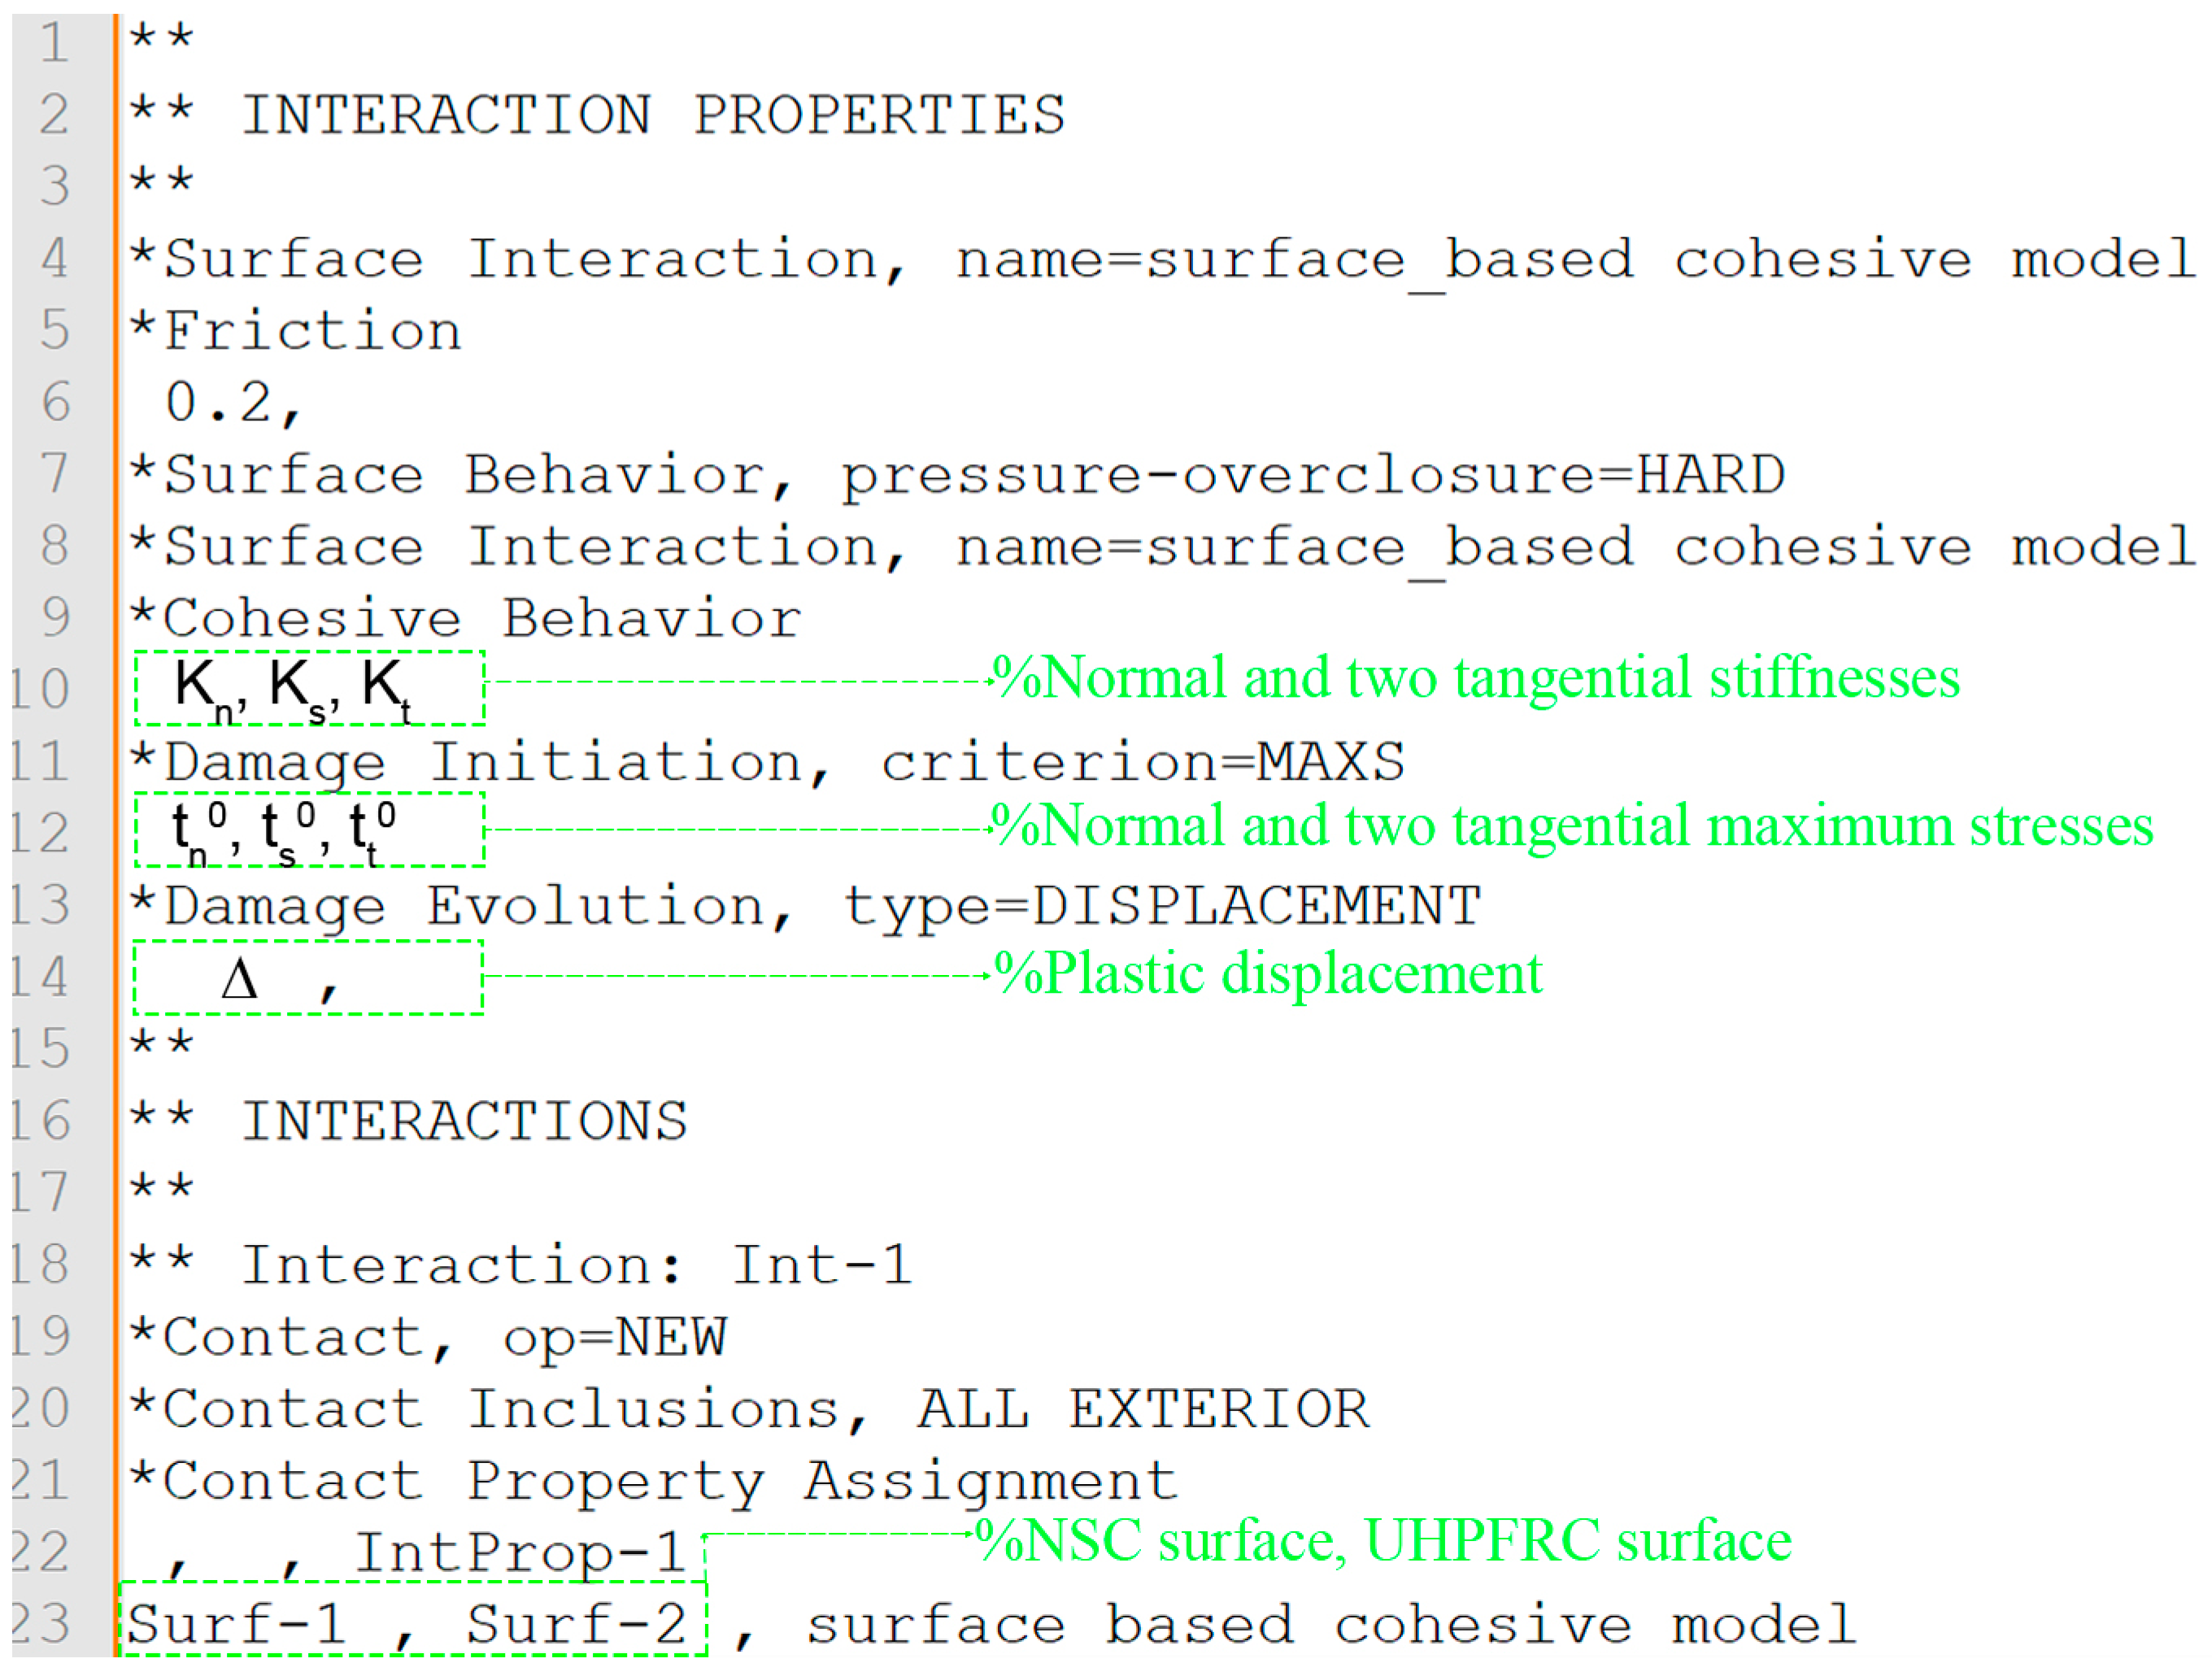
Table 2 for the surface-based cohesive model used in ABAQUS. The input data required to simulate the bonding behavior between NSC and UHPFRC for different surfaces is presented in Figure 5. This includes the interaction properties and interactions defined in ABAQUS for the FE models.

3. Modeling of Composite Members of NSC and Cast In Situ UHPFRC

This section outlines the modeling process for composite members made up of NSC and cast in situ UHPFRC. The interfacial bonding between these materials is modeled using the surface-based cohesive model with the proposed parameters. The accuracy of the proposed interfacial model is validated by comparing the simulated results with experimental results obtained from shear, tensile, and flexural tests.

3.1. FE Analysis

3.1.1. Element Types

The C3D8R element (eight node linear brick with reduced integration) was selected to model NSC and UHPFRC due to its ability to capture concrete materials’ tensile cracking and compressive crushing accurately [17,22,23]. The T3D2 element [17] was used to model reinforcements, which can simulate the working behavior between reinforcement and concrete. In order to model the steel pins and supports in contact simulation, a discrete rigid shell element was employed [17].

3.1.2. Material Modeling

Concrete damaged plasticity (CDP) is widely recognized as the most popular model to simulate the nonlinear response of concrete [24,25]. The CDP model can simulate cracking patterns and crack widths using dt and dc parameters for tension and compression (Figure 6). Therefore, in this study, the CDP model was chosen to model NSC and UHPFRC. The CDP model requires five additional parameters, including the dilation angle (ψ), the eccentricity of the plastic flow (ε), the ratio of the initial biaxial to initial uniaxial compressive strength (σb0c0), and the shape of the failure surface (Kc). Stress-inelastic strain relationships for compression and tension are based on models by Kent and Park [26] and Massicotte et al. [27] or experimental data. Table 3 presents the parameters of the CDP model for simulations of both NSC and UHPFRC materials.

3.1.3. Interfacial Interactions

The embedded constraint technique was implemented to simulate the working behavior between reinforcements and concrete, as recommended by ABAQUS [17]. The interfacial bonding behavior between NSC and UHPFRC was modeled using a surfaced-based cohesive contact model with parameters presented in Table 2.

3.1.4. Mesh Sensitivity

The accuracy of the finite element (FE) simulation is typically directly related to the mesh density used in the simulation process, as evidenced by previous research [31,32,33,34]. However, it is noted that a higher mesh density also results in greater computational costs. Therefore, a mesh sensitivity study should be conducted to select an appropriate simulation model. The subsequent sections will present the mesh sensitivity for each specific problem.

3.1.5. ABAQUS Solver

The ABAQUS/Explicit solver was selected for solving all problems in this study, as it is known to perform better in solving nonlinear and contact problems when mass scaling is not used, and the step time is one second. Analysis of all models in the study showed that the total energy remained constant and the ratio of kinetic energy to internal energy in the system did not exceed 10%. These results demonstrate that the ABAQUS/Explicit solver is suitable for solving quasistatic problems in this study [17].

3.2. Pure Shear Model

In the previous study, Feng et al. [20] investigated the effect of various factors on the shear performance at the NC-UHPFRC smooth, mid-rough, and rough interfaces. The concrete substrate and the UHPFRC have compressive strengths of 42 MPa and 120.61 MPa, respectively. Figure 7a,b show the detailed experimental setup and geometry.
The selection of a simulation model for the current problem was based on the methodology presented in Section 3. Specifically, the C3D8R element was used to model NSC and UHPFRC. The CDP model parameters for NSC and UHPFRC are provided in Table 4 and Table 5, respectively. In addition, a surface-based cohesive contact model was used to model the bonding interface between NSC and UHPFRC. The model parameters are specified in Table 2, along with a penalty contact with a friction coefficient of 0.2 [35]. Figure 7c illustrates the FE model for the shear test.
In order to evaluate mesh convergence, several FE models were created with mesh sizes ranging from 2 to 20 mm. The results showed that a 5 mm mesh size provided both accurate numerical results and a reasonable computation time. Therefore, the 5 mm mesh size was chosen for the present FE model.

3.3. Pure Tensile Model

In a study by Hussein et al. [21], the bonding behavior of the interface between UHPFRC and high-strength concrete (HSC) was analyzed. The interface was tested using cylindrical specimens with a diameter and height of 75 mm. Three types of surfaces were used to investigate the bonding behavior between the materials. The experimental setup and specimen geometry are illustrated in Figure 8a,b.
The simulation model consisted of HSC, UHPFRC, and cylindrical steel nipples modeled with C3D8R elements. The CDP model was applied to HSC and UHPFRC specimens, and their material properties are presented in Table 6 and Table 7. The plastic material parameter of steel was used to model the nonlinear behavior of the steel nipples. A penalty contact with a friction coefficient of 0.2 was applied at the interface of the cylindrical steel nipples and the concrete specimens. A surface-based cohesive model was used to model the interaction between HSC and UHPFRC surfaces, with the parameters shown in Table 2. The detailed simulation model of the tensile test is presented in Figure 8c. A mesh size of 5 mm was chosen based on the results of a mesh convergence study.

3.4. Model for Composite Beam Subjected to Four-Point Bending

Osta et al. [36] studied the flexural behavior of an RC beam strengthened by UHPFRC. The dimensions of the RC beam are 140 × 230 × 1600 mm, made from NSC with a compressive strength of 54 MPa. In order to enhance the structural integrity of the RC beam, a UHPFRC layer of 30 mm with a compressive strength of 121 MPa was applied at the soffit of the RC beam. Figure 9a illustrates the detailed geometry and reinforcements of the NSC-UHPFRC composite beam.
The element types for NSC, UHPFRC, reinforcing bars, and pins were adopted as presented in Section 3.1.1. In order to model the interfacial bonding between NSC and UHPFRC, the study adopted a surface-based cohesive model with the parameters listed in Table 2. The CDP model was applied to both NSC and UHPFRC materials, while the plastic material model was selected for reinforcements. Table 8, Table 9 and Table 10 present the material properties of NSC, UHPFRC, and reinforcements. Figure 9b depicts the detailed simulation model of the NSC-UHPFRC composite beam. Following a comprehensive evaluation of a mesh sensitivity study, a mesh size of 5mm was identified as the optimal value due to its balance between computational efficiency and accuracy.

4. Results and Discussion

4.1. Results Obtained from the Analysis of Shear Tests

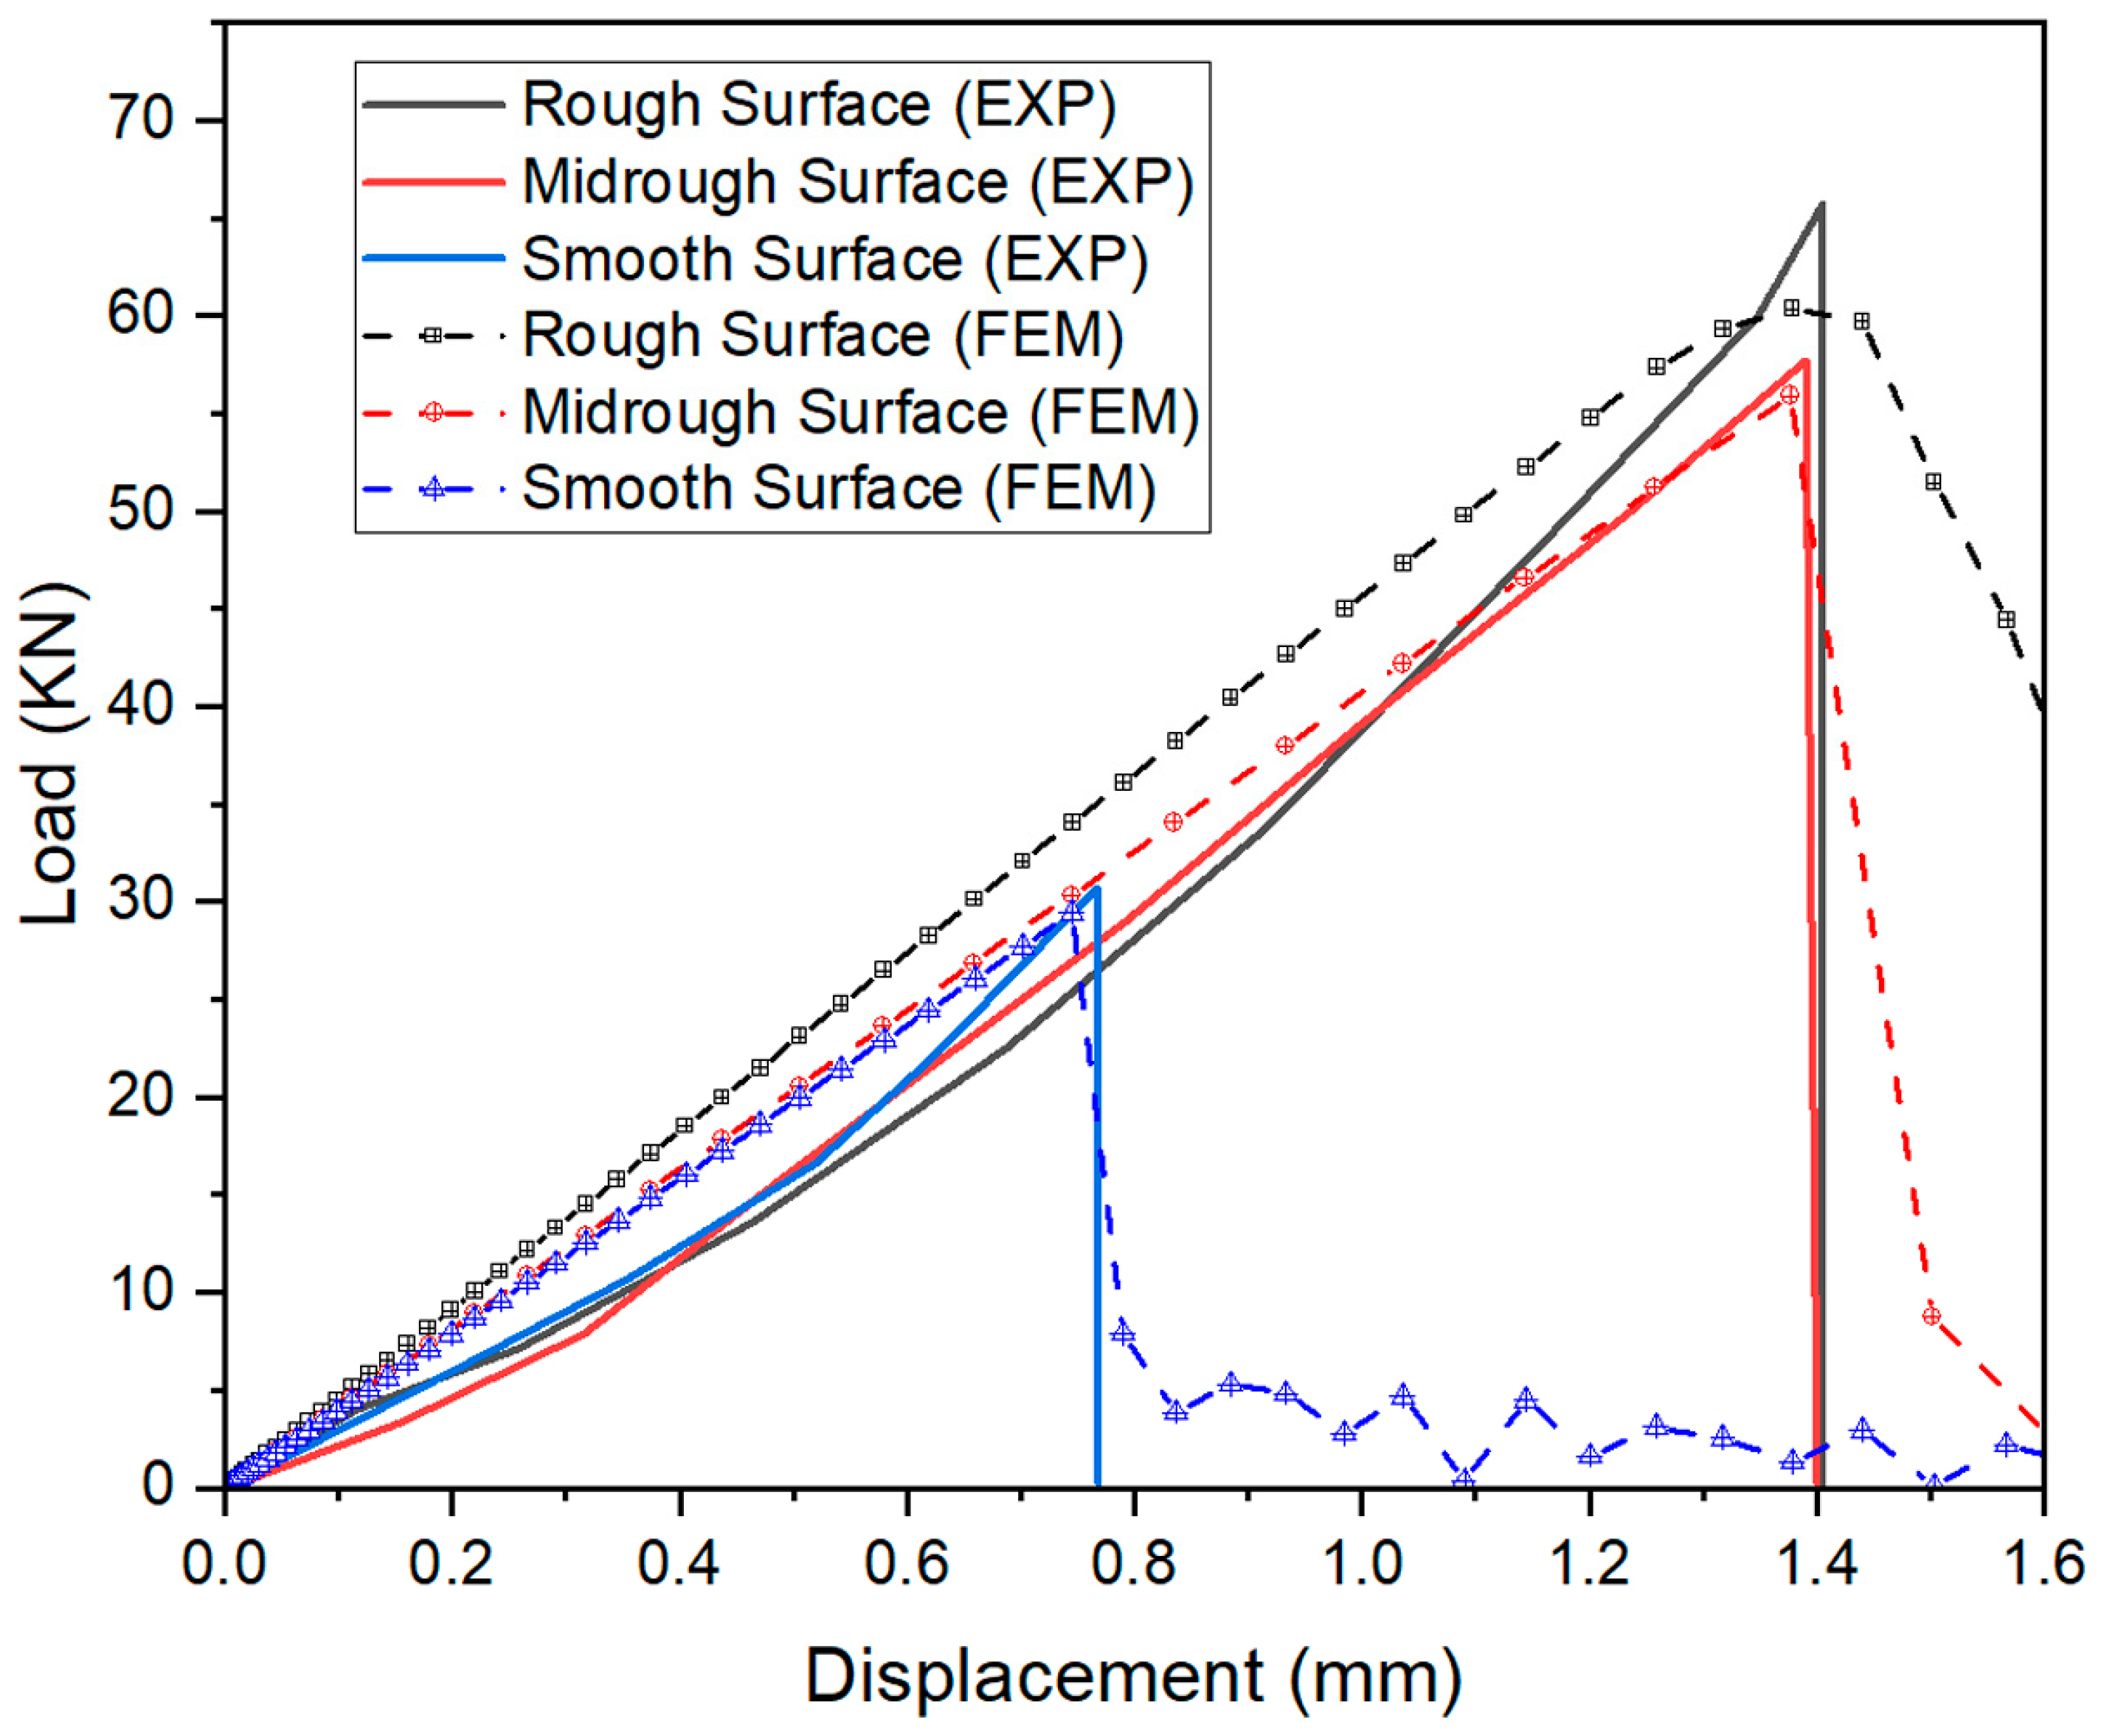
Figure 10 shows a strong agreement between the experimental and simulation results for three surface types in terms of peak loads and displacements. The agreement is demonstrated by small deviations between experimental and simulated ultimate loads, measuring 6.8%, 4.1%, and 5.8% for rough, mid-rough, and smooth surfaces, respectively. Corresponding small errors in displacements at ultimate loads are also observed for the same surfaces, measuring 2%, 0.9%, and 2.4%, as shown in Table 11. The highest deviation of 6.8% is found in the case of the rough surface. It can be explained that in composite members with a rough surface, the strength of the interface between UHPFRC and NSC is stronger than the NSC itself due to the majority of UHPFRC penetrating into the NSC to form the interface. Consequently, the composite member’s shear resistance depends on the NSC’s strength. Therefore, any difference in the strength of the NSC between the EXP and FEM may affect the ultimate load difference between them.
The study found that the load-displacement curves of the experimental and simulation results for the smooth surface were in good agreement. However, the simulation demonstrates a higher interface stiffness for the mid-rough and rough surfaces than the experimental results. This difference is due to the simultaneous participation in shear resistance of both NSC and UHPFRC. The combination of these factors causes the overall stiffness of the interface to change over time. Additionally, defects in the NSC [37] constitute a crucial factor that unsettles its stiffness under loading.
Furthermore, the separation of the mid-rough and rough specimens in the simulation was observed to occur gradually, while the experimental results indicated that the specimens fractured immediately after reaching the peak load. The discrepancy in the damage evolution phase between FEA and EXP on mid-rough and rough surfaces could be attributed to differences in the concrete material’s damage behavior between the simulation and experiment. In the case of the rough and mid-rough surfaces, the composite members’ damage occurred in the NSC part. However, the CDP model used to model concrete assumes that it is homogeneous and isotropic, neglecting concrete’s potential variations in properties and strengths in different directions as well as the existence of microcracks. Those factors could lead to the difference in the damage evolution stage between FEA and EXP.
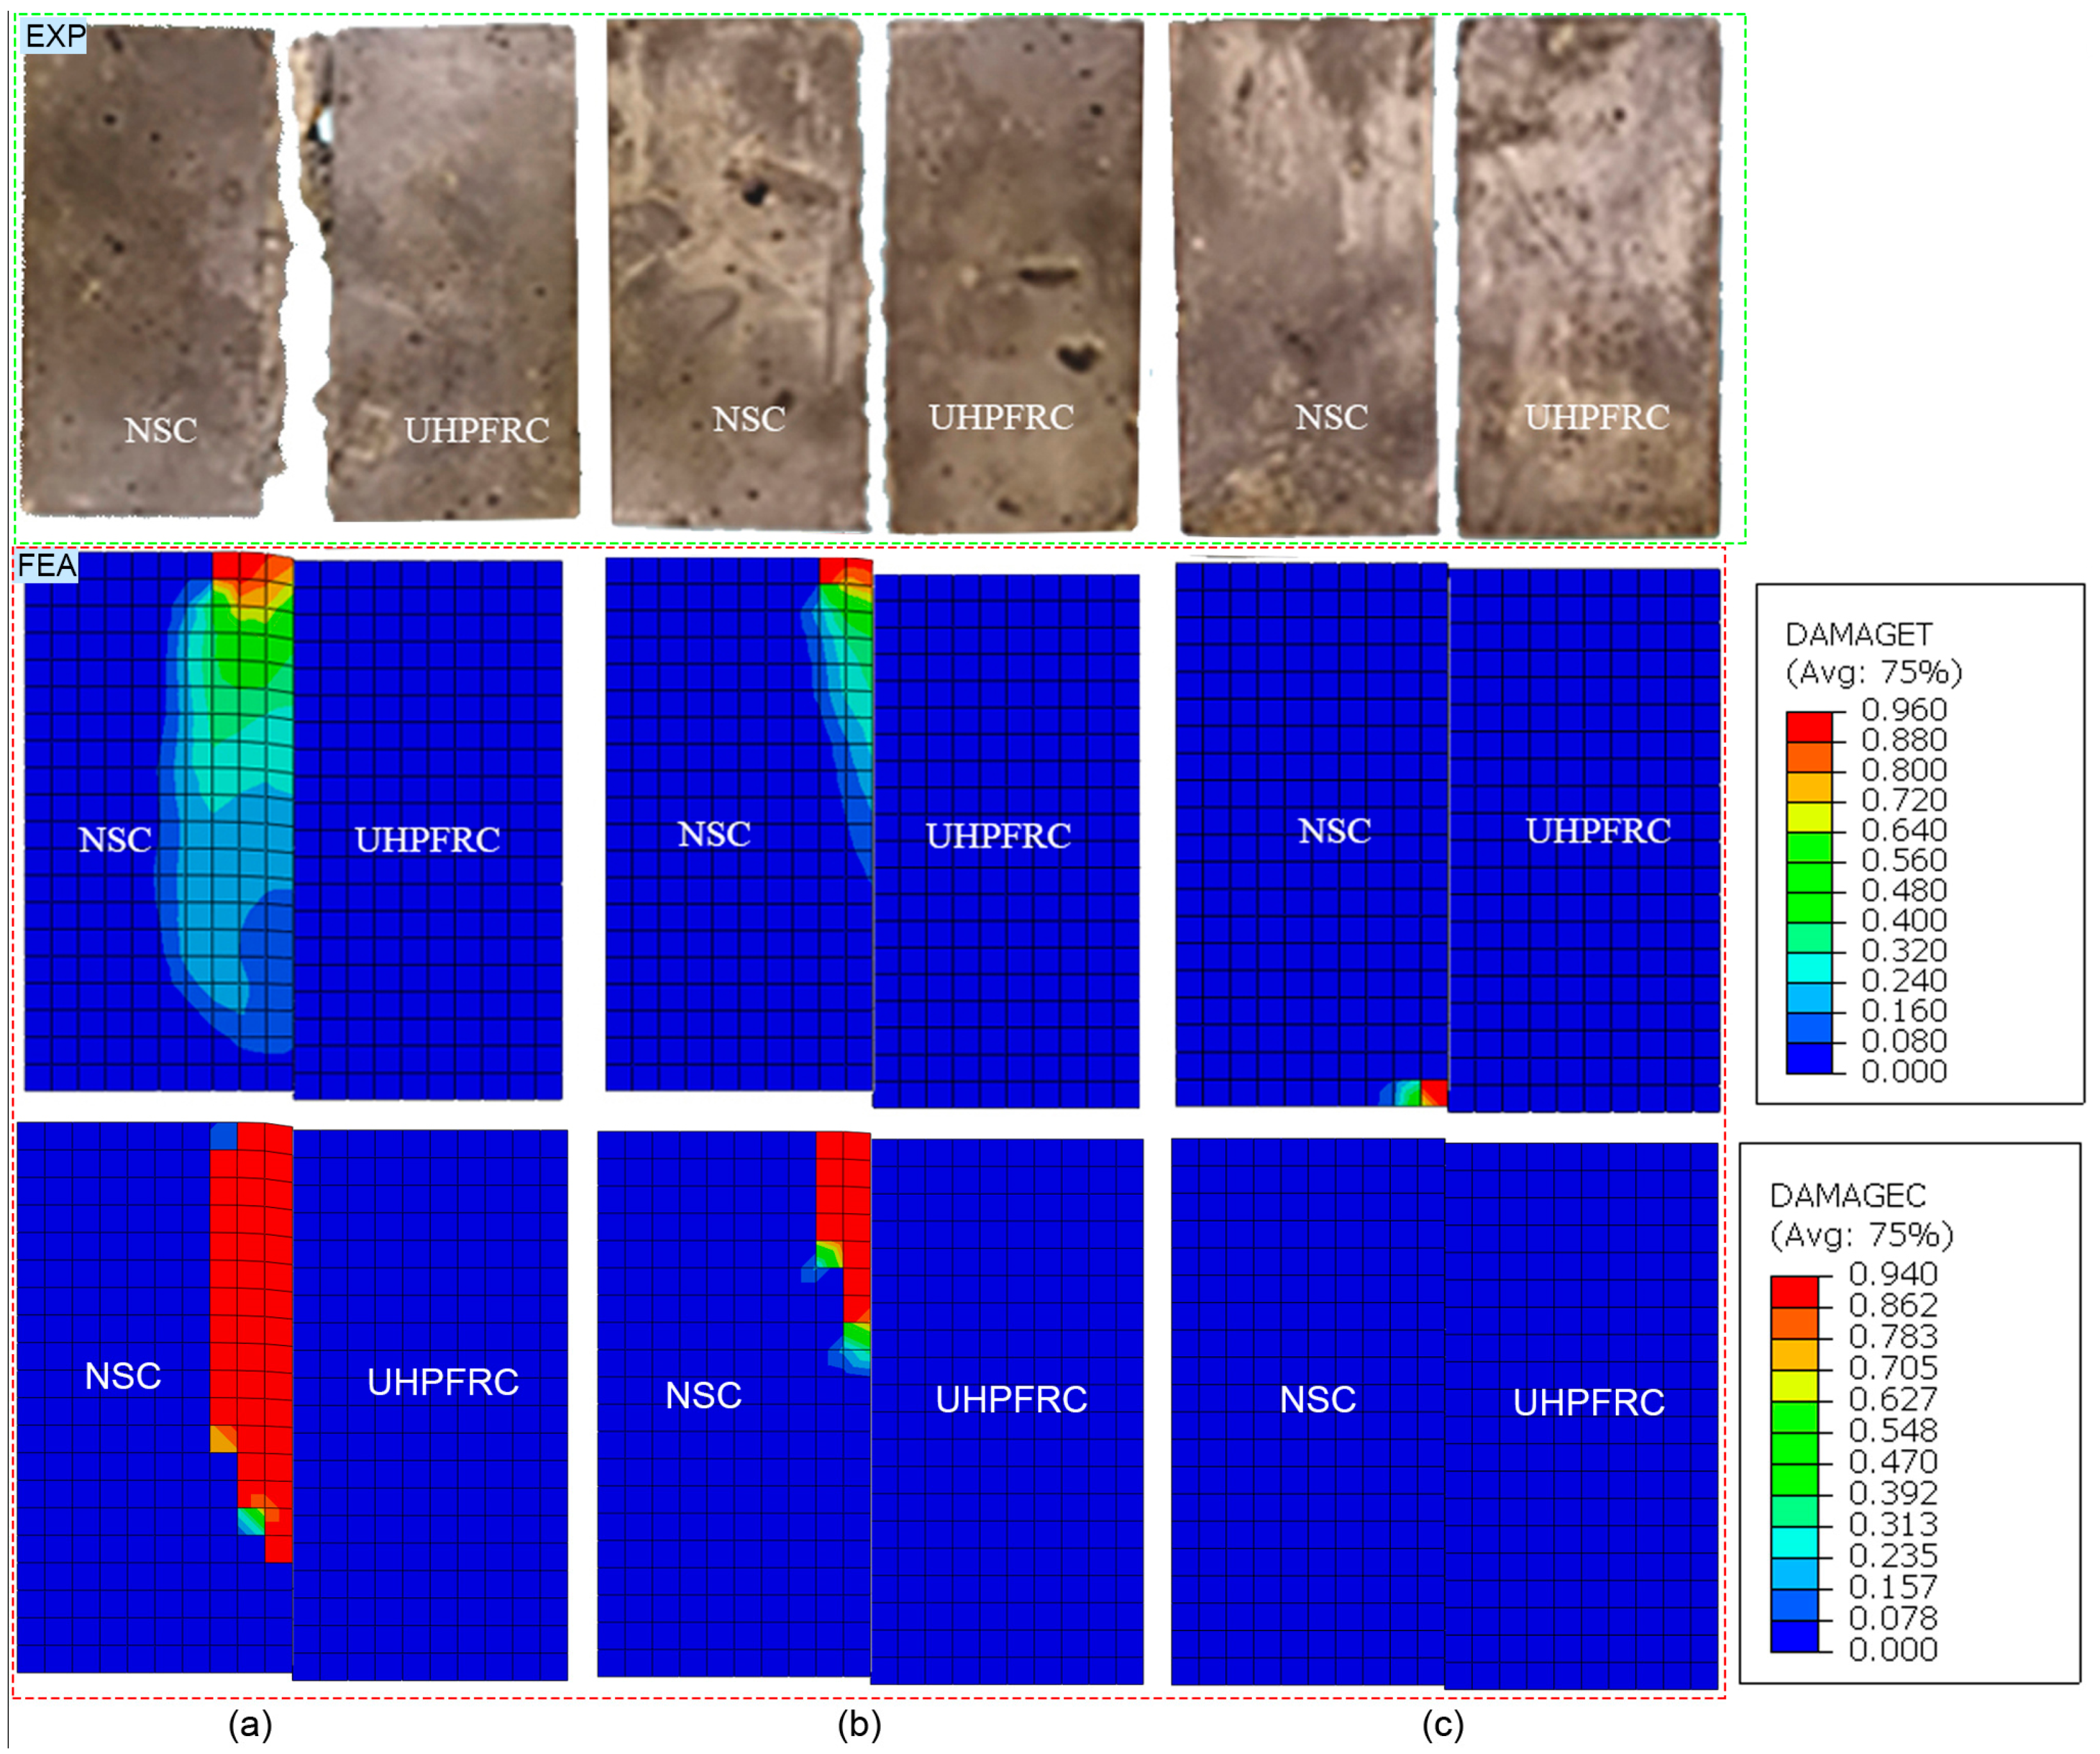
Figure 11 illustrates the damage patterns of composite specimens through the visualization of the tensile damage variable “DAMAGET” and the compressive damage variable “DAMAGEC” in the ABAQUS output for three distinct surface types. The simulation results accurately depicted failure modes in all three cases. In the mid-rough and rough surface cases, failure concentrated on both the NSC and interface (Figure 11a,b). In the smooth surface case, debonding occurred solely at the interface between NSC and UHPFRC (Figure 11c).
The failures observed between NSC and UHPFRC can be attributed to the formation of chemical bonding and mechanical interlocking. Chemical bonding occurs through the reaction between calcium oxide and silica at the NSC-UHPFRC interface, forming a calcium-silicate-hydrate gel. Mechanical interlocking is formed when UHPFRC penetrates the pores and voids of the NSC surface. On the smooth NSC surface, few pores allow for mechanical interlocking, so bonding is primarily achieved through chemical bonding. However, this bond is weaker than the shear strength of NSC, causing failure to occur at the interface of NSC and UHPFRC. Mechanical interlocking occurs between the NSC and UHPFRC surfaces on a mid-rough or rough NSC surface, creating small bridges that enhance the shear strength of the interface. A rougher NSC surface with a higher roughness degree results in a deeper average sand-fill depth, forming larger UHPFRC small bridges in the NSC. This can cause a larger failure area in the NSC specimen.
The simulation results revealed that crushing failure accounted for the majority of the area compared to cracking failure. This is because the shear force at the interface transmits the compressive load to the NSC specimen. With a higher degree of roughness in the interface between NSC and UHPFRC, more failures occurred in the top flange of the NSC. This is because, as the UHPFRC specimen moves downward, the highest node at the interface between the NSC and UHPFRC experiences a greater load than the lower nodes do. This is due to the compressive strain of each element between nodes, generating a compressive force that reduces the load at the lower node. As a result, the highest node experiences more stress than the lower nodes, which can lead to failure in the top flange of the NSC specimen. Therefore, failure in the NSC specimen occurs first in the top flange compared to other parts.
In the surface-based cohesive model used in this study, a rougher surface was assigned a greater shear strength at the interface in the parameters (Table 2). Therefore, if an element near the surface is damaged, the load is transmitted to the adjacent element, and failure develops until the corresponding compressive stress is lower than the compressive strength of NSC. In the case of a smooth surface, the compressive stress generated in the NSC by bonding with UHPFRC is lower than its compressive strength, resulting in failure at the interface instead of within the NSC.
The developed FE models are useful for predicting the shear bonding strength at the NSC and UHPFRC interfaces for different levels of roughness. This is particularly beneficial for designing effective strengthening solutions for concrete structures, such as bridge decks, that are being repaired or reinforced using UHPFRC. Accurately predicting the shear strength at the interface can ensure the durability and longevity of the structure, making it an important consideration for engineers.

4.2. Results Obtained from the Analysis of Tensile Tests

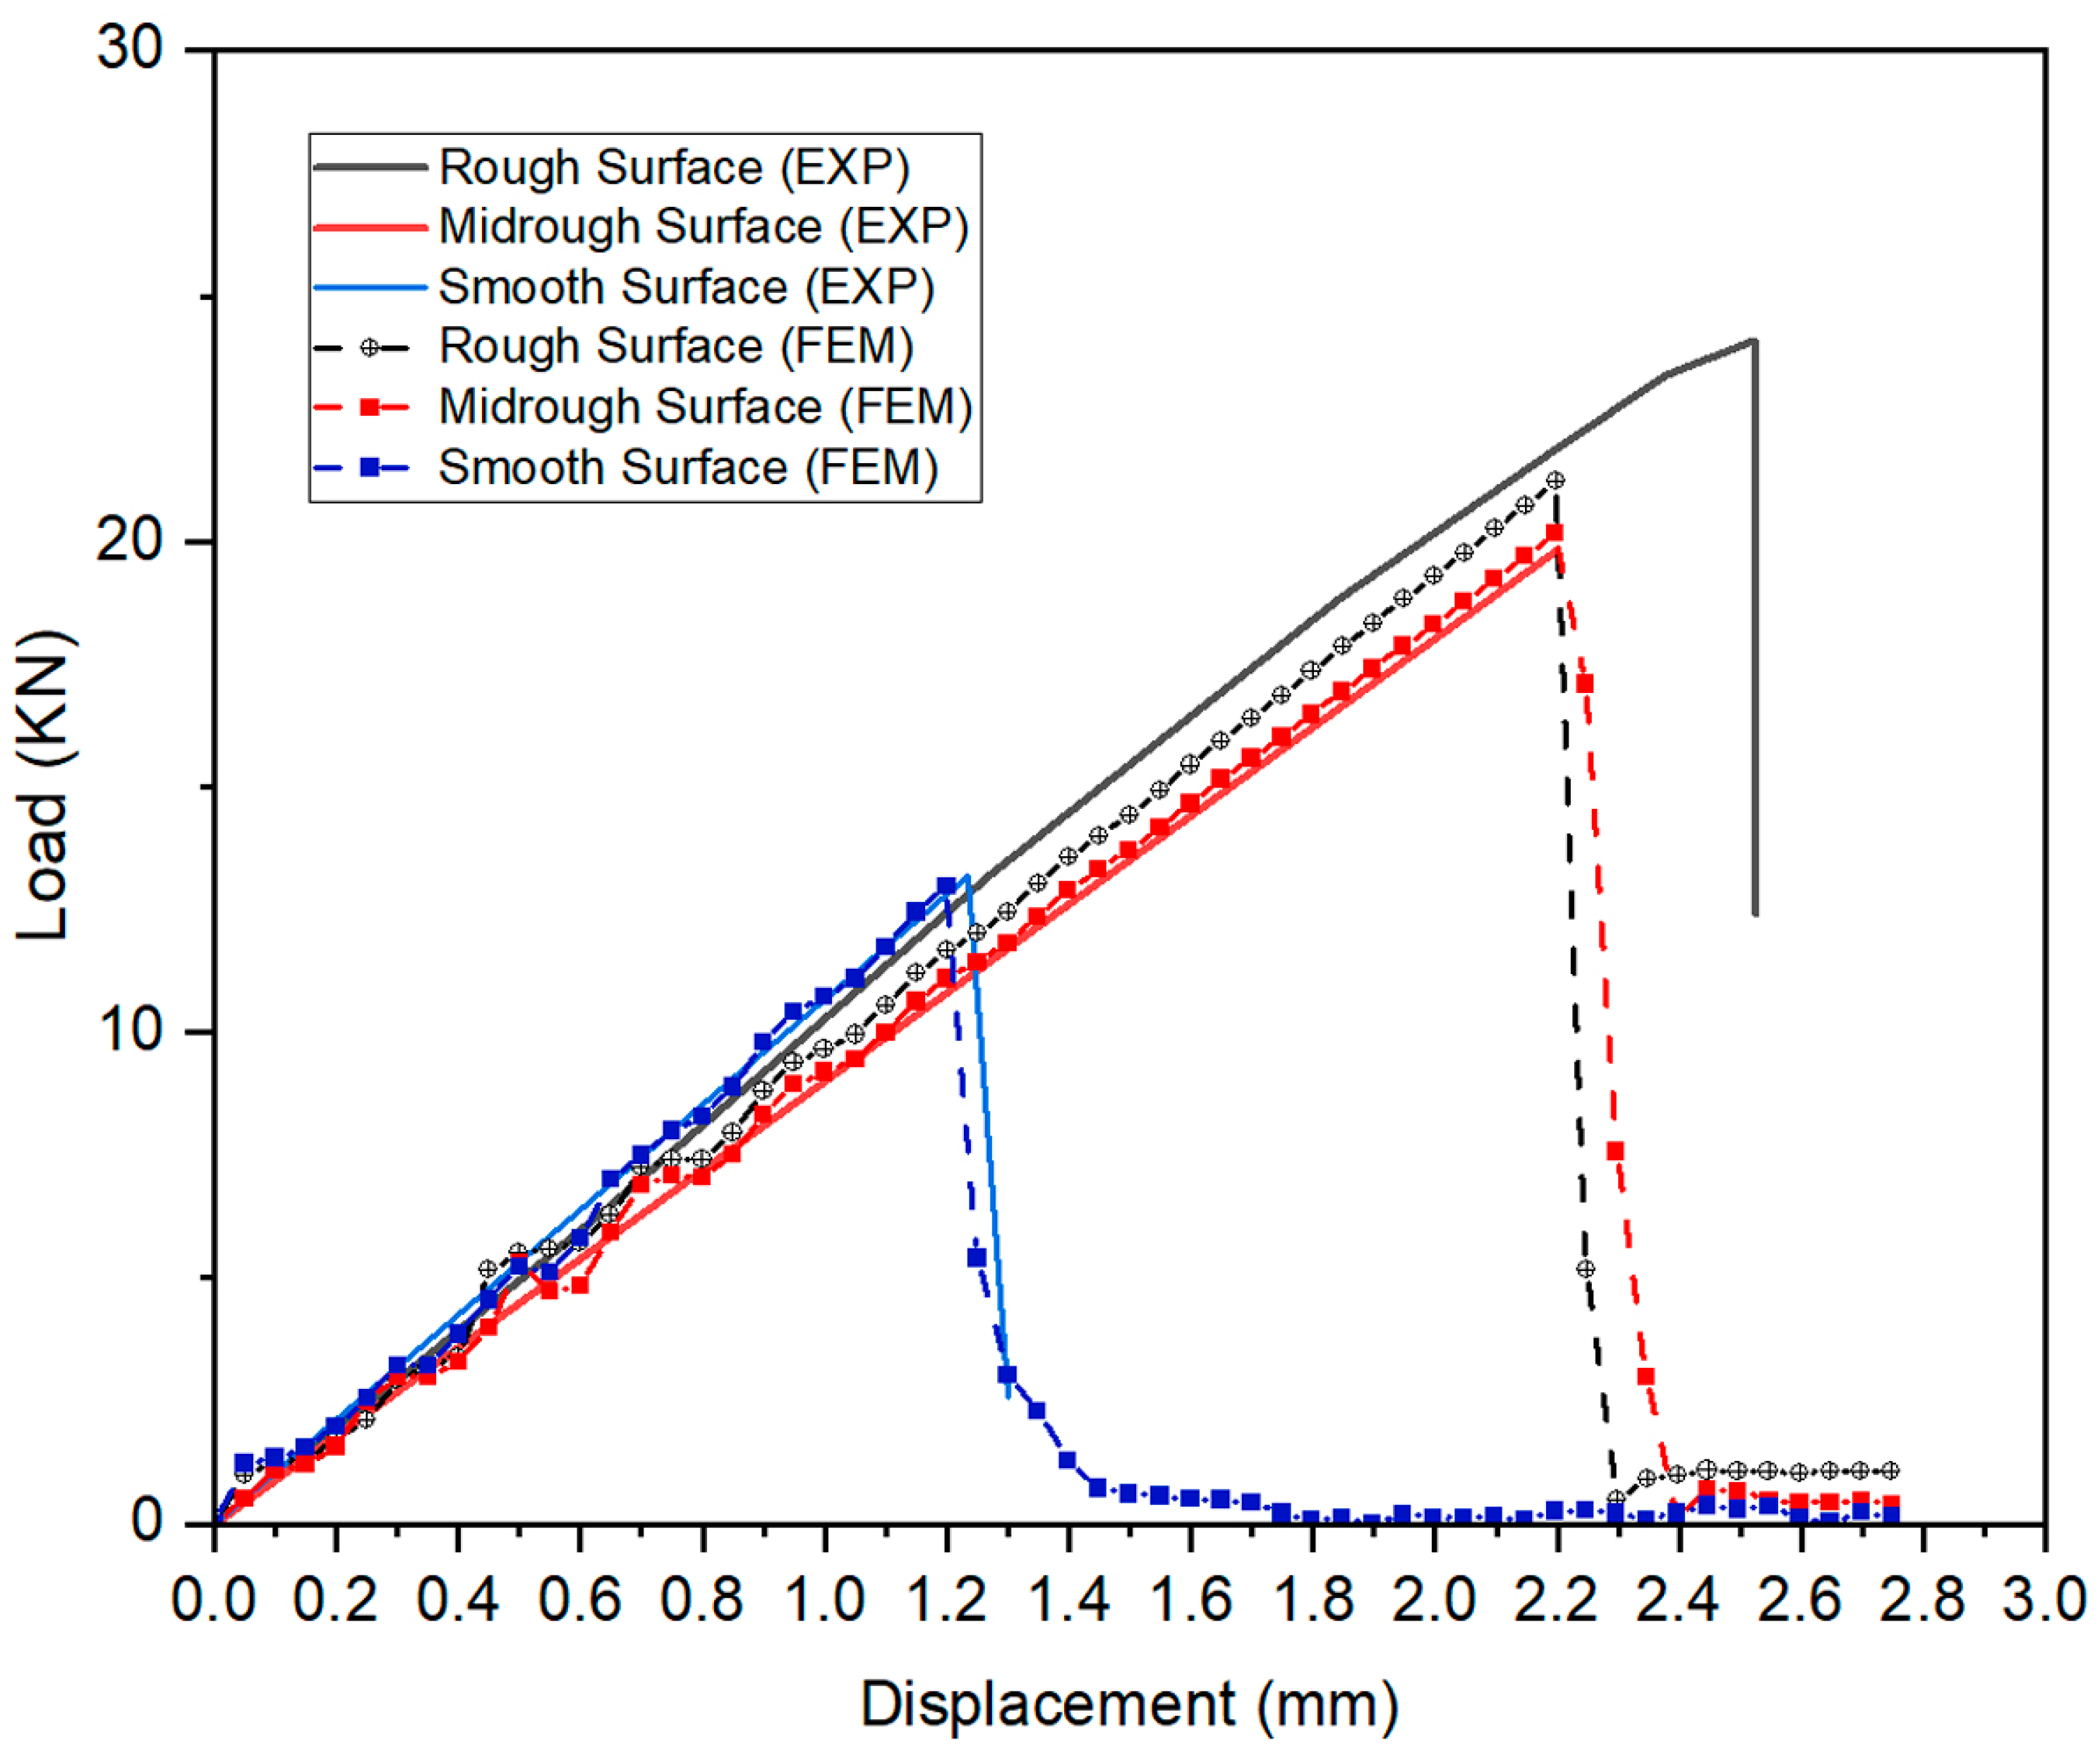
Figure 12 shows a high degree of agreement between the simulation and experimental results for the load-displacement curves overall, particularly for stiffness, peak loads, and corresponding displacements on both smooth and mid-rough surfaces. The deviation between EXP and FEA in those comparing variables is less than 3% (Table 11). Although the simulation and experimental results matched well in terms of stiffness for the rough surface, Table 11 shows a 13.6% and 15.9% discrepancy for the ultimate load and corresponding displacement, respectively. A discrepancy in the concrete’s tensile strength used in the experiment and simulation could be the reason for the observed difference in ultimate load and corresponding displacement. This is because the rough surface has a higher tensile strength (5.63 MPa) than the NSC (5.36 MPa), as shown in Table 2. Consequently, the tensile strength of the NSC-UHPFRC composite specimen during tensile testing is primarily determined by the strength of the NSC.
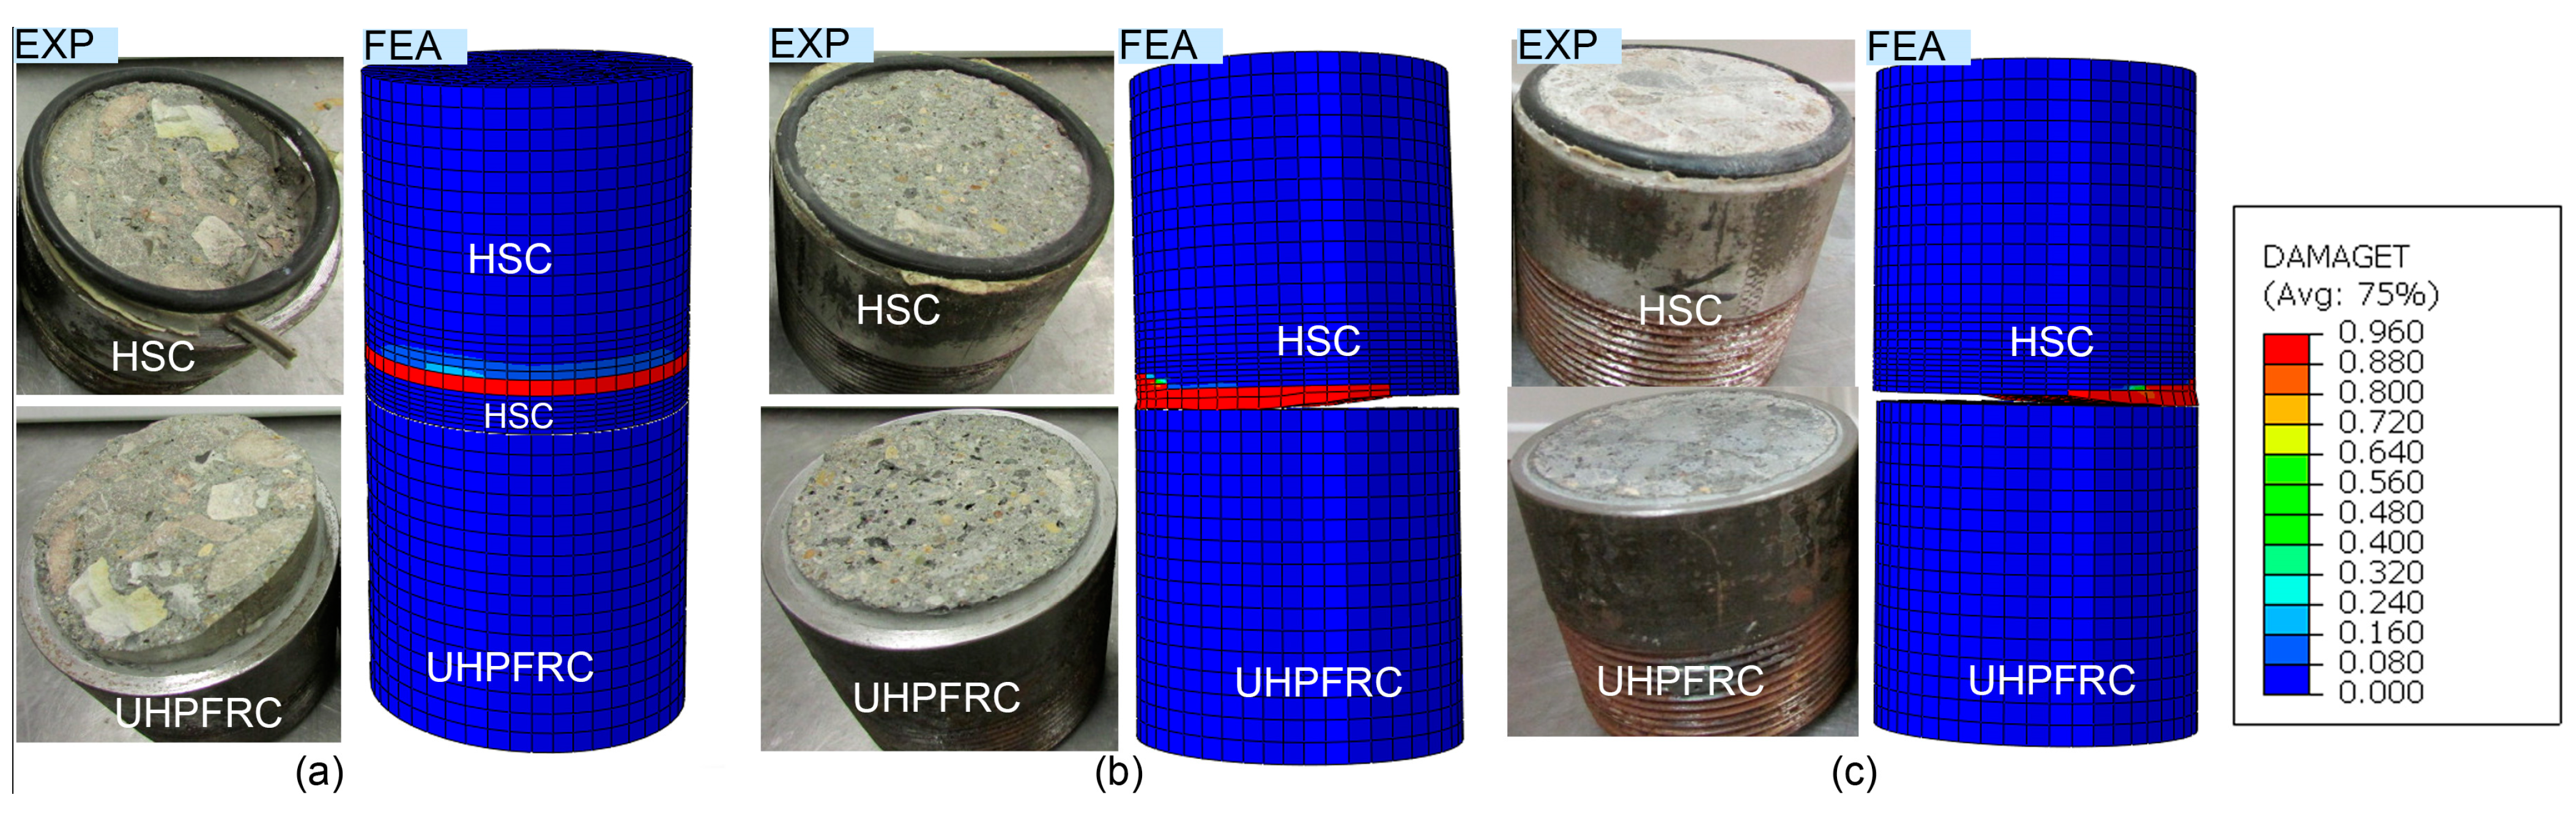
Regarding damage patterns, Figure 13 demonstrates that the simulation results are consistent with the experimental results. The simulation results show greater damage in the NSC for the mid-rough and rough surfaces. Additionally, on the rough surface, the failure of NSC occurred further away from the interface than on the mid-rough surface. Furthermore, debonding mostly occurred at the NSC and UHPFRC interfaces for the smooth surface.
The reasons for these results can be explained as follows: The rough surface has a larger tensile strength at the interface, causing the tensile strain of elements near the interface to be lower than those farther away during tensile loading. Due to this behavior, the concrete elements farthest from the interface, particularly those located at the position of the steel nipple in the NSC, are more prone to failure. In contrast, the mid-surface and smooth surface have a lower tensile strength at the interface than NSC, leading to a failure tendency at the interface. During failure, the NSC-UHPFRC interface undergoes a reduction in area, which results in an increase in its tensile strength at that specific location. Consequently, some elements of the NSC fail because their tensile strength exceeds the ultimate tensile strength of the NSC. The extent of concrete damage depends on the interface’s tensile strength. As the interface’s tensile strength increases, the concrete’s damaged area also increases. This finding explains why the damaged area of NSC in the mid-rough surface was greater than that in the smooth surface, as shown in Figure 13b,c.
By accurately predicting the tensile behavior at the HSC-UHPFRC interface, this FE model can be used to optimize interface design and maximize the tensile bonding strength between HSC and UHPC. This optimization can ultimately improve the performance and durability of concrete structures. Additionally, the model can be utilized to simulate different scenarios and loading conditions, enabling engineers to evaluate the structural behavior of the interface and make informed decisions about design modifications and repairs.
Based on the two analyses mentioned above, when the interface between HSC and UHPFRC has a higher roughness level, the concrete substrate experiences either shear or tensile failure, and the composite member’s shear or tensile strength capacity depends on the corresponding strength of the concrete substrate. Therefore, it is recommended that substrate surfaces be prepared with sufficient roughness to ensure that failure occurs in the substrate during the repair and strengthening of concrete members.

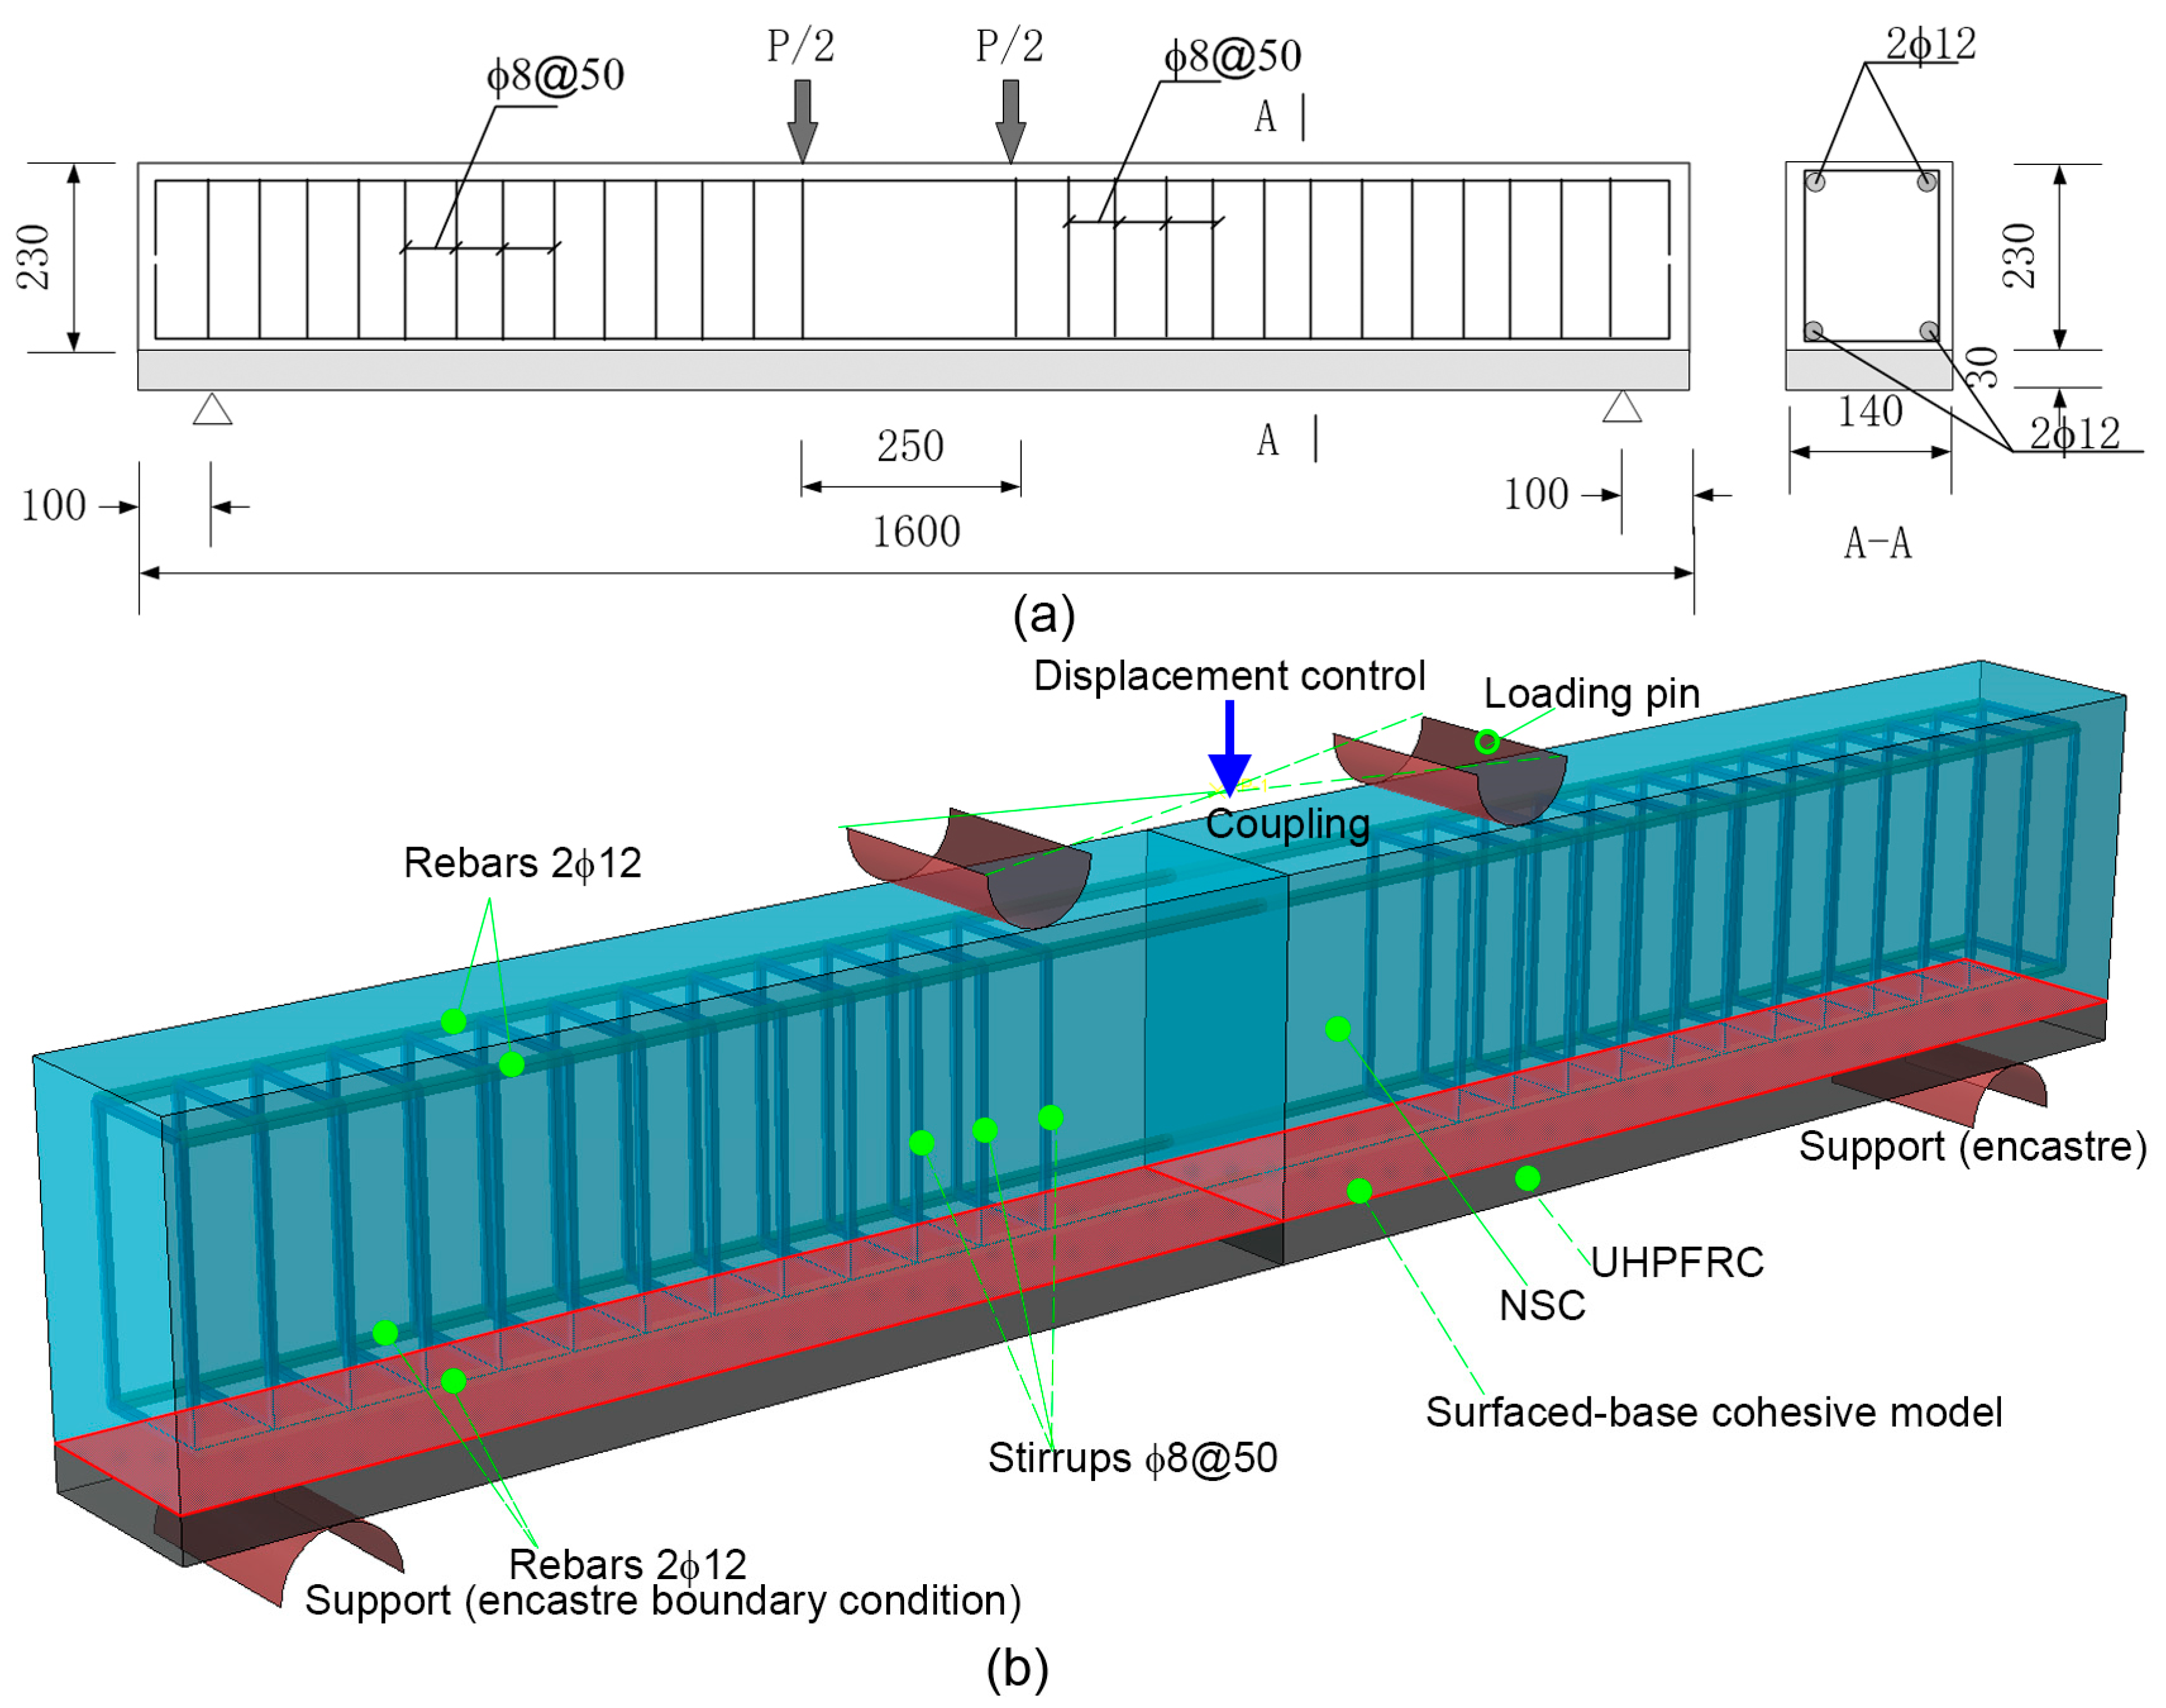
4.3. Results Obtained from Analysis of Flexural Test

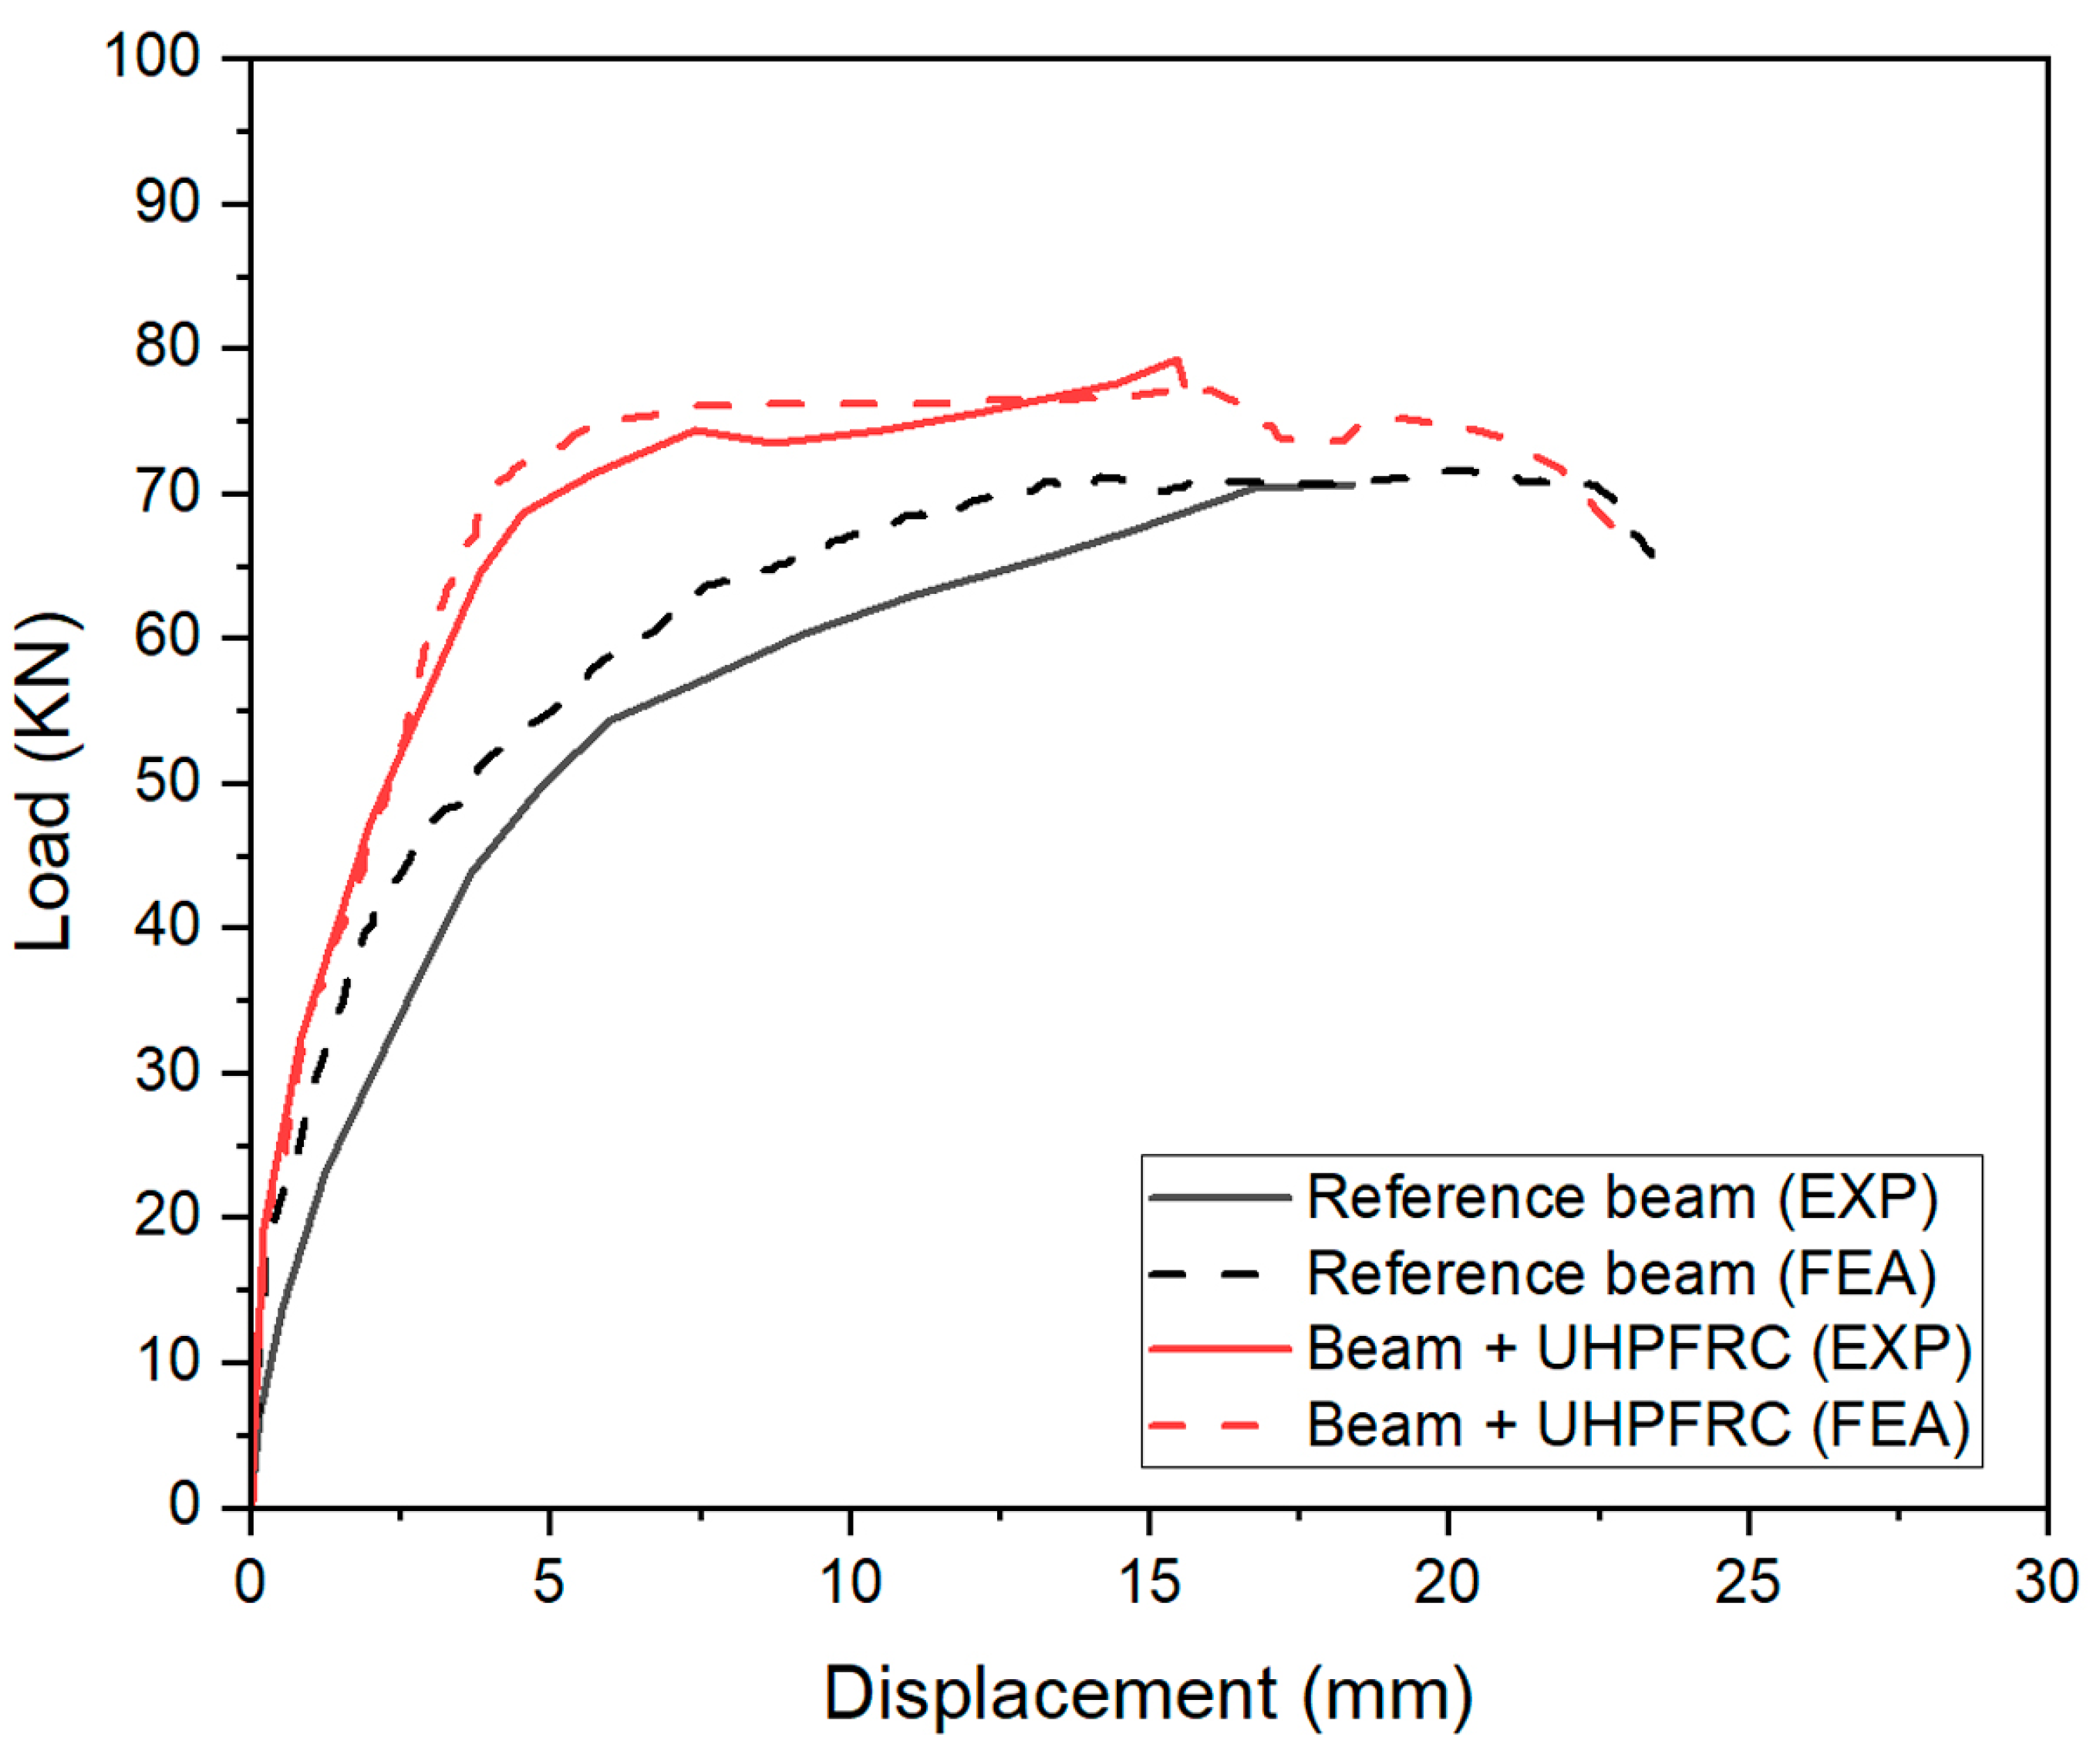
Figure 14 demonstrates that the load-displacement curves of the simulated results are aligned with the experimental results for both the reference beam and composite beam. This high degree of concordance is evident from the small difference of around 3% between the simulation and experimental results for both peak load and corresponding displacement (Table 11). Additionally, the FE model captures the ductile behavior of the composite beam as observed in the experimental results, with the initiation of the first crack observed at approximately 22 KN and the first yielding of the reinforcements estimated to occur at approximately 70 KN. However, the simulation results reveal a higher initial stiffness compared to the experimental results. The disparity in the initial stiffness of an RC beam between the experimental and simulated results can be attributed to several factors. One such factor is the presence of voids and defects inside the experimental beam, which can reduce its stiffness [37]. Additionally, the modeling assumptions made in the simulation, such as the use of the embedded constraint technique, may not accurately reflect the actual response between the reinforcement and concrete, potentially leading to an overestimation of the beam’s stiffness in the simulated model.
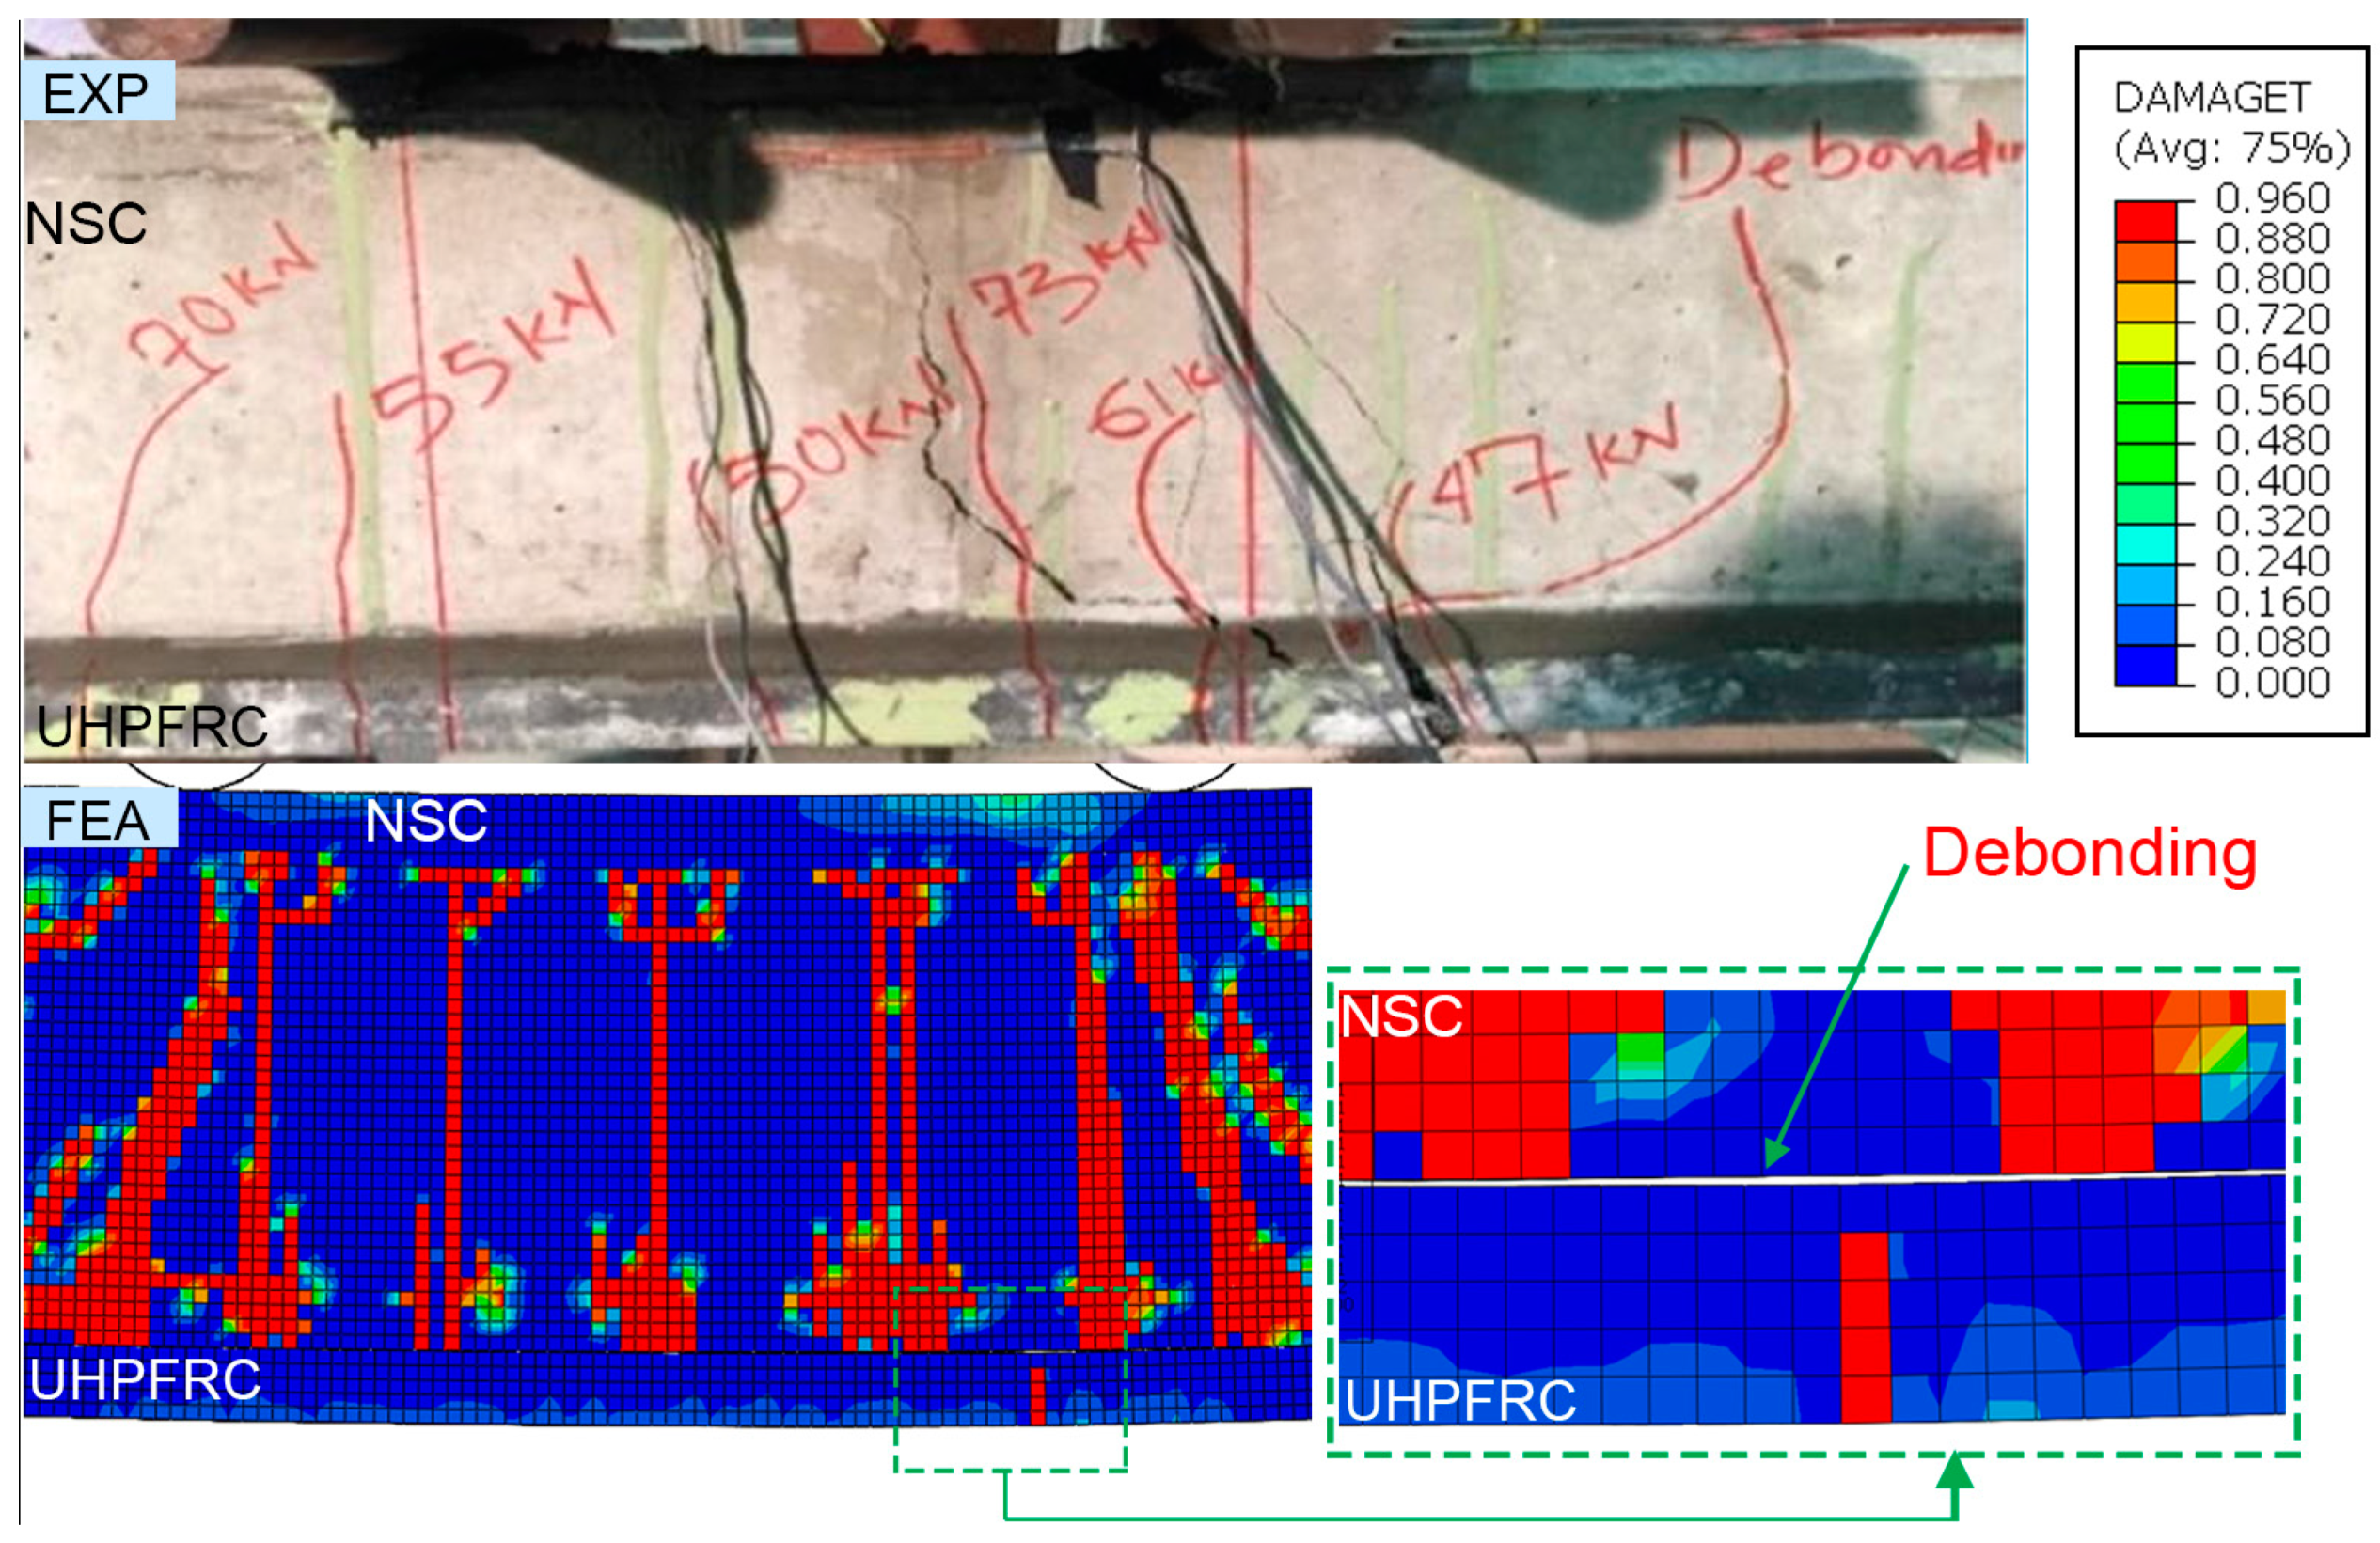
Figure 15 demonstrates a strong correlation in damage patterns between the simulation and experimental results. The results indicate that the debonding between the NSC and UHPFRC primarily occurred at the interface, highlighting the critical role of the bond between the two materials in the overall performance of composite beams. Furthermore, the experimental results revealed the presence of crushing damage at the location of applied loads. This damage may be attributed to the high concentration of stresses in this region, which can exceed the material’s load-bearing capacity. These findings underscore the importance of considering both the bond between the NSC and UHPFRC and the distribution of loads and stresses when designing reinforced and retrofitted concrete structures.

5. Conclusions

This study utilized the ABAQUS software to investigate the response of composite members made of NSC (or HSC) and UHPFRC. The bonding between the NSC and UHPFRC was modeled using a surface-based cohesive model derived and calibrated based on previous experimental results. This cohesive model was then integrated into seven FE models to simulate and validate the behavior of NSC-UHPFRC composite members under various loading conditions. The key conclusions derived from this study are as follows:
(1)
The developed FE models show good agreement with experimental data for the overall response of NSC (HSC)-UHPFRC composite members under different working conditions. In the rough surface tests, the shear test shows a maximum deviation of 6.8% in the ultimate load, while the tensile test shows a 15.9% deviation in the ultimate displacement;
(2)
A linear traction-separation model based on experimental data from pure shear and tensile tests is used to develop an analytical method for determining the parameters of a surface-based cohesive model in ABAQUS;
(3)
Novel parameters for the surface-based cohesive model are proposed to simulate the bonding between NSC (HSC) and cast in situ UHPFRC, as presented in Table 2.
The present study provides valuable insights into the potential use of UHPFRC and UHPFRS for reinforcing and retrofitting damaged concrete structures. While the findings indicate a high potential for UHPFRC in these applications, it is essential to acknowledge that the uniform surface roughness observed in this study may not fully reflect the complex conditions encountered in real-world scenarios, where the bonding surfaces of NSC and UHPFRC can exhibit non-uniform roughness. Therefore, future research should consider the impact of surface roughness variations on the performance of UHPFRC in practical settings to ensure its optimal use in reinforcing and retrofitting structural members.

Author Contributions

Supervision, S.-K.K.; methodology, X.-B.L.; software, X.-B.L.; validation, X.-B.L.; writing—review and editing, S.-K.K. and X.-B.L.; funding acquisition, S.-K.K. All authors have read and agreed to the published version of the manuscript.

Funding

This research was funded by a National Research Foundation of Korea (NRF) grant funded by the Korean government (MIST) (No.2021R1C1C1013130).

Data Availability Statement

Not applicable.

Acknowledgments

This work was supported by a National Research Foundation of Korea (NRF) grant funded by the Korean government (MIST) (No.2021R1C1C1013130).

Conflicts of Interest

The authors declare no conflict of interest.

References

  1. Oesterlee, C. Structural Response of Reinforced UHPFRC and RC Composite Members. Ph.D. Thesis, Swiss Federal Institute of Technology Lausanne, Lausanne, Switzerland, 2010. [Google Scholar]
  2. Makita, T.; Brühwiler, E. Tensile Fatigue Behaviour of Ultra-High Performance Fibre Reinforced Concrete Combined with Steel Rebars (R-UHPFRC). Int. J. Fatigue 2014, 59, 145–152. [Google Scholar] [CrossRef]
  3. Yoo, D.Y.; Banthia, N. Mechanical Properties of Ultra-High-Performance Fiber-Reinforced Concrete: A Review. Cem. Concr. Compos. 2016, 73, 267–280. [Google Scholar] [CrossRef]
  4. Tong, T.; Yuan, S.; Wang, J.; Liu, Z. The Role of Bond Strength in Structural Behaviors of UHPC-NC Composite Beams: Experimental Investigation and Finite Element Modeling. Compos. Struct. 2021, 255, 112914. [Google Scholar] [CrossRef]
  5. Yu, J.; Zhang, B.; Chen, W.; Liu, H.; Li, H. Multi-Scale Study on Interfacial Bond Failure between Normal Concrete (NC) and Ultra-High Performance Concrete (UHPC). J. Build. Eng. 2022, 57, 104808. [Google Scholar] [CrossRef]
  6. Valikhani, A.; Jahromi, A.J.; Mantawy, I.M.; Azizinamini, A. Numerical Modelling of Concrete-to-UHPC Bond Strength. Materials 2020, 13, 1379. [Google Scholar] [CrossRef] [Green Version]
  7. Hussein, H.H.; Walsh, K.K.; Sargand, S.M.; Al Rikabi, F.T.; Steinberg, E.P. Modeling the Shear Connection in Adjacent Box-Beam Bridges with Ultrahigh-Performance Concrete Joints. I: Model Calibration and Validation. J. Bridg. Eng. 2017, 22, 1–14. [Google Scholar] [CrossRef]
  8. Kadhim, M.M.A.; Jawdhari, A.; Peiris, A. Development of Hybrid UHPC-NC Beams: A Numerical Study. Eng. Struct. 2021, 233, 111893. [Google Scholar] [CrossRef]
  9. Farzad, M.; Shafieifar, M.; Azizinamini, A. Experimental and Numerical Study on Bond Strength between Conventional Concrete and Ultra High-Performance Concrete (UHPC). Eng. Struct. 2019, 186, 297–305. [Google Scholar] [CrossRef]
  10. Lampropoulos, A.P.; Paschalis, S.A.; Tsioulou, O.T.; Dritsos, S.E. Strengthening of Reinforced Concrete Beams Using Ultra High Performance Fibre Reinforced Concrete (UHPFRC). Eng. Struct. 2016, 106, 370–384. [Google Scholar] [CrossRef] [Green Version]
  11. Yin, H.; Shirai, K.; Teo, W. Numerical Model for Predicting the Structural Response of Composite UHPC–Concrete Members Considering the Bond Strength at the Interface. Compos. Struct. 2019, 215, 185–197. [Google Scholar] [CrossRef]
  12. Abdel Wahab, MM Simulating Mode I Fatigue Crack Propagation in Adhesively-Bonded Composite Joints. Fatigue and Fracture of Adhesively-Bonded Composite Joints; Vassilopoulos, A.P., Ed.; Woodhead Publishing: Sawston, UK, 2015; pp. 323–344. ISBN 978-0-85709-806-1. [Google Scholar]
  13. Chabot, A.; Hun, M.; Hammoum, F. Mechanical Analysis of a Mixed Mode Debonding Test for “ Composite” Pavements. Constr. Build. Mater. 2013, 40, 1076–1087. [Google Scholar] [CrossRef] [Green Version]
  14. Bissonnette, B.; Courard, L.; Fowler, D.W.; Granju, J.-L. Bonded Cement-Based Material Overlays for the Repair, the Lining or the Strengthening of Slabs or Pavements: State-of-the-Art Report of the RILEM Technical Committee 193-RLS; Springer Science & Business Media: Berlin, Germany, 2011; Volume 3. [Google Scholar]
  15. AASHTO. AASHTO LRFD Bridge Design Specifications; American Association of State Highway and Transportation Officials: Washington, DC, USA, 2017; ISBN 9781560516545. [Google Scholar]
  16. ASTM International. 1583: Standard Test Method for Tensile Strength of Concrete Surface and the Bond Strength or Tensile Strength of Concrete Repair and Overlay Materials by Direct Tension (Pull-off Method); ASTM International: West Conshohocken, PA, USA, 2004. [Google Scholar]
  17. Hibbitt, K.; Karlsson, B.I. ABAQUS: User’s Manual; Hibbitt, Karlsson & Sorensen: Birmingham, AL, USA, 2013. [Google Scholar]
  18. Gadri, K.; Guettala, A. Evaluation of Bond Strength between Sand Concrete as New Repair Material and Ordinary Concrete Substrate (The Surface Roughness Effect). Constr. Build. Mater. 2017, 157, 1133–1144. [Google Scholar] [CrossRef]
  19. Júlio, E.N.B.S.; Branco, F.A.B.; Silva, V.D. Concrete-to-Concrete Bond Strength. Influence of the Roughness of the Substrate Surface. Constr. Build. Mater. 2004, 18, 675–681. [Google Scholar] [CrossRef] [Green Version]
  20. Feng, S.; Xiao, H.; Liu, M.; Zhang, F.; Lu, M. Shear Behaviour of Interface between Normal-Strength Concrete and UHPC: Experiment and Predictive Model. Constr. Build. Mater. 2022, 342, 127919. [Google Scholar] [CrossRef]
  21. Hussein, H.H.; Walsh, K.K.; Sargand, S.M.; Steinberg, E.P. Interfacial Properties of Ultrahigh-Performance Concrete and High-Strength Concrete Bridge Connections. J. Mater. Civ. Eng. 2016, 28, 04015208. [Google Scholar] [CrossRef]
  22. Willam, K.J. Constitutive Model for the Triaxial Behaviour of Concrete. Proc. Intl. Assoc. Bridg. Structl. Engrs 1975, 19, 1–30. [Google Scholar]
  23. Lapidus, L.; Pinder, G.F. Numerical Solution of Partial Differential Equations in Science and Engineering; John Wiley& Sons: Hoboken, NJ, USA, 2011. [Google Scholar]
  24. Johnson, S. Comparison of Nonlinear Finite Element Modeling Tools for Structural Concrete; University of Illinois: Urbana, IL, USA, 2006. [Google Scholar]
  25. Kmiecik, P.; Kamiński, M. Modelling of Reinforced Concrete Structures and Composite Structures with Concrete Strength Degradation Taken into Consideration. Arch. Civ. Mech. Eng. 2011, 11, 623–636. [Google Scholar] [CrossRef]
  26. Kent, D.C.; Park, R. Flexural Members With Confined Concrete. J. Struct. Div. 1971, 97, 1969–1990. [Google Scholar] [CrossRef]
  27. Massicotte, B.; Elwi, A.E.; MacGregor, J.G. TensionStiffening Model for Planar Reinforced Concrete Members. J. Struct. Eng. 1990, 116, 3039–3058. [Google Scholar] [CrossRef]
  28. Bahij, S.; Adekunle, S.K.; Al-Osta, M.; Ahmad, S.; Al-Dulaijan, S.U.; Rahman, M.K. Numerical Investigation of the Shear Behavior of Reinforced Ultra-High-Performance Concrete Beams. Struct. Concr. 2018, 19, 305–317. [Google Scholar] [CrossRef] [Green Version]
  29. Curbach, M.; Speck, K. Ultra High Performance Concrete under Biaxial Compression. In Proceedings of the Second International Symposium on Ultra High Performance Concrete, Kassel, Germany, 5–7 March 2008; Kassel University Press GmbH: Kassel, Germany, 2008; pp. 477–484. [Google Scholar]
  30. Da Silva, V.D. A Simple Model for Viscous Regularization of Elasto-Plastic Constitutive Laws with Softening. Commun. Numer. Methods Eng. 2004, 20, 547–568. [Google Scholar] [CrossRef] [Green Version]
  31. Wang, Z.M.; Huang, Y.J.; Yang, Z.J.; Liu, G.H.; Wang, F. Efficient Meso-Scale Homogenisation and Statistical Size Effect Analysis of Concrete Modelled by Scaled Boundary Finite Element Polygons. Constr. Build. Mater. 2017, 151, 449–463. [Google Scholar] [CrossRef]
  32. Chen, J.H.; Xu, W.F.; Xie, R.Z.; Zhang, F.J.; Hu, W.J.; Huang, X.C.; Chen, G. Sample Size Effect on the Dynamic Torsional Behaviour of the 2A12 Aluminium Alloy. Theor. Appl. Mech. Lett. 2017, 7, 317–324. [Google Scholar] [CrossRef]
  33. Jumaa, G.B.; Yousif, A.R. Numerical Modeling of Size Effect in Shear Strength of FRP-Reinforced Concrete Beams. In Structures; Elsevier: Amsterdam, The Netherlands, 2019; Volume 20, pp. 237–254. [Google Scholar]
  34. Sun, Q.; Zhu, H.; Wang, G.; Fan, J. Effects of Mesh Resolution on Hypersonic Heating Prediction. Theor. Appl. Mech. Lett. 2011, 1, 22001. [Google Scholar] [CrossRef] [Green Version]
  35. Européen, C. Eurocode 2: Design of Concrete Structures—Part 1-1: General Rules and Rules for Buildings; British Standard Institution: London, UK, 2004; p. 66. [Google Scholar]
  36. Al-Osta, M.A.; Isa, M.N.; Baluch, M.H.; Rahman, M.K. Flexural Behavior of Reinforced Concrete Beams Strengthened with Ultra-High Performance Fiber Reinforced Concrete. Constr. Build. Mater. 2017, 134, 279–296. [Google Scholar] [CrossRef]
  37. Hainsworth, S.V.; Chandler, H.W.; Page, T.F. Analysis of Nanoindentation Load-Displacement Loading Curves. J. Mater. Res. 1996, 11, 1987–1995. [Google Scholar] [CrossRef]
Figure 1. Types of tests: (a) simple shear bonding test; and (b) pure tensile bonding test.
Buildings 13 00950 g001
Figure 2. Linear traction-separation response.
Buildings 13 00950 g002
Figure 3. The typical load-displacement curve for pure shear and tensile tests.
Buildings 13 00950 g003
Figure 4. Surface roughness of the concrete substrate: (a) sand-filling method; (b) smooth surface (no sand filling, h = 0 mm); (c) mid-rough surface (sand filling depth of 0.64 mm); and (d) rough surface (sand filling depth of 1.29 mm).
Buildings 13 00950 g004
Figure 5. Input data for a surface-based cohesive model on various surface types. Note: The symbols * and ** respectively denote the beginning of a command and introduce a comment in the input file in ABAQUS.
Buildings 13 00950 g005
Figure 6. Response of concrete to a uniaxial loading condition: (a) compression and (b) tension [23].
Buildings 13 00950 g006
Figure 7. Pure shear test: (a) experimental setup [20]; (b) specimen dimensions; and (c) FE model.
Buildings 13 00950 g007
Figure 8. Pure tensile test: (a) experimental setup [21]; (b) dimensions of the specimens; and (c) FE model.
Buildings 13 00950 g008
Figure 9. Flexural test: (a) geometry and reinforcements of the NSC-UHPFRC composite beam [36]; and (b) FE model.
Buildings 13 00950 g009
Figure 10. Comparison of the load-displacement characteristics between the EXP [20] and FEM in three distinct surface types in the shear tests.
Buildings 13 00950 g010
Figure 11. Comparison of the failure of the NSC-UHPFRC specimens between the EXP [20] and simulations for three distinct surface types in the shear test: (a) a rough surface; (b) a mid-rough surface; and (c) a smooth surface.
Buildings 13 00950 g011
Figure 12. Comparison of the load-displacement characteristics between the EXP [21] and FEM for three distinct surface types in the tensile test.
Buildings 13 00950 g012
Figure 13. Comparison of the failure of the HSC-UHPFRC specimens between the EXP [21] and FEM simulations in three distinct surface types in the tensile test: (a) rough interface; (b) mid-rough interface; and (c) smooth interface.
Buildings 13 00950 g013
Figure 14. Comparison of load-displacement characteristics between the EXP [36] and FEM simulations in the flexural test for rough surfaces.
Buildings 13 00950 g014
Figure 15. Comparison of the failure of the NSC-UHPFRC specimens between the EXP [36] and FEM simulations for the rough surface in the flexural test.
Buildings 13 00950 g015
Table 1. Calculation of surface-based cohesive model parameters for various surfaces.
TestSurfaceP n(s,t)0(KN)An(s,t)(mm2)dn(s,t)0(mm)Δ(mm)tn(s,t)(MPa)Kn(s,t)(N/mm3)
Shear test [20]Smooth30.8110,0000.760.023.084.04
Mid-rough57.9210,0001.390.125.794.17
Rough65.9410,0001.410.156.64.69
Tensile test [21]Smooth13.354417.861.230.023.022.45
Mid-rough20.344417.862.200.14.612.09
Rough24.834417.862.560.245.632.2
Note: Pn(s,t)0, A n(s,t)0, d n(s,t)0, and Δ represent the ultimate loads, surface areas, corresponding displacements, and maximum plastic displacement in both shear and tensile tests.
Table 2. Mechanical parameters of the surface-based cohesive model for different types of NSC-UHPFRC interfaces.
PropertySmooth SurfaceMid-Rough SurfaceRough Surface
Kn (N/mm3)2.452.092.20
Ks, Kt (N/mm3)4.044.174.69
tn° (MPa)3.024.615.63
ts°, tt° (MPa)3.085.796.60
Total/plastic displacement ∆ (mm)0.020.120.24
Table 3. Parameters of the CDP model for NSC and UHPFRC materials.
Concreteψεσb0c0KcViscosity
NC30 [24]0.1 [24]1.16 [24]0.6667 [24]0.0001 [24]
UHPFRC36 [28]0.1 [28]1.07 [29]0.6667 [25]0.005 [30]
Table 4. Properties of NSC along with CDP model parameters in compression and tension in the shear test.
Compressive Concrete Strength (MPa)42
Elastic Modulus (GPa)30.5
Poisson Ratio0.18
Strength (MPa)dcεinStrength (MPa)dtεck
16.8003.64400
37.800.0010572.420.333330.000993
4200.0012271.3660.6250.001742
39.90.050.0013510.6070.833330.002958
2.940.930.0036830.18220.950.00333
2.520.940.0037720.144770.960.003607
Table 5. Properties of UHPFRC along with CDP model parameters in compression and tension in the shear test.
Compressive Concrete Strength (MPa)120.61
Elastic Modulus (GPa)46.5
Poisson Ratio0.21
Strength (MPa) dcεinStrength (MPa)dtεck
84.427007.3624100
108.54900.001037.500.00484
120.6100.0014350.333330.00989
114.580.050.001982.81250.6250.01244
108.5490.10.002531.250.833330.01397
7.23660.940.011940.5250.930.01457
Table 6. Properties of HSC along with CDP model parameters in compression and tension in the tensile test.
Compressive Concrete Strength (MPa)75
Elastic Modulus (GPa)41
Poisson Ratio0.2
Strength (MPa)dcεinStrength (MPa)dtεck
30005.363800
67.500.000673.575860.333330.00109
7500.000772.011420.6250.00191
71.250.050.000960.893970.833330.00325
67.50.10.001150.804570.850.00334
4.50.940.004640.214550.960.00396
Table 7. Properties of UHPFRC along with CDP model parameters in compression and tension in the tensile test.
Compressive Concrete Strength (MPa)158.58
Elastic Modulus (GPa)53
Poisson Ratio0.21
Strength (MPa)dcεinStrength (MPa)dtεin
111.006008.8361600
142.72200.00074900.00483
158.5800.0010160.333330.00989
150.6510.050.001713.3750.6250.01244
142.7220.10.002411.50.833330.01397
9.51480.940.014470.630.930.01457
Table 8. Properties of NSC along with CDP model parameters in compression and tension in the flexural test.
Compressive Concrete Strength (MPa)54
Elastic Modulus (GPa)33
Poisson Ratio0.19
Strength (MPa)dcεinStrength (MPa)dtεck
21.600.00003.260.00000.0000
48.600.0004952.10.33330.00022
5400.0005631.1850.62500.00052
51.30.050.0017160.520.83330.00099
5.940.890.0034120.1580.95000.0013
4.320.920.003550.12640.96000.0014
Table 9. Properties of UHPFRC along with CDP model parameters in compression and tension in the flexural test.
Compressive Concrete Strength (MPa)121
Elastic Modulus (GPa)41.5
Poisson Ratio0.21
Strength (MPa)dcεinStrength (MPa)dtεck
90.75006.500
108.900.000985.0050.230.0023794
12100.001482.9250.550.0079295
114.950.050.001710.650.90.0173843
108.90.10.001940.5850.910.0188459
9.680.920.005740.3250.950.0246922
Table 10. Plastic properties of reinforcements in the flexural test.
Diameter (mm)8 and 10
Poisson Ratio0.3
Elastic Modulus (GPa)200
Yield Stress (MPa)Plastic Strain
Plastic behavior5900
589.990.000668
589.9910.00295
650.70.23455
6350.2470
Table 11. Summary and comparison of FE model and experimental results.
TypeAuthorsSurfacePexp(KN)PFEM(KN)exp(mm)FEM(mm)P Error (%)∆ Error(%)
Shear testFeng et al. [20]Rough65.77361.5871.4061.3796.82.0
Mid-rough57.71355.4451.3891.3764.10.9
Smooth30.74229.0650.7630.7455.82.4
Tensile testHussein et al. [21] Rough24.15521.2342.5552.20513.615.9
Mid-rough19.82520.122.2032.2051.50.1
Smooth13.18012.9541.2331.2051.72.3
Flexural testOsta et al. [36]Rough79.30277.22315.46015.0412.72.8
Note: Pexp and PFEM denote the peak load in the experimental and simulation, respectively. Δexp and ΔFEM indicate the corresponding displacements at the peak load in the experimental and simulated results, respectively. P error and ∆ error indicate the percent error of the peak load and corresponding displacement, respectively, between the EXP and FEM.
Disclaimer/Publisher’s Note: The statements, opinions and data contained in all publications are solely those of the individual author(s) and contributor(s) and not of MDPI and/or the editor(s). MDPI and/or the editor(s) disclaim responsibility for any injury to people or property resulting from any ideas, methods, instructions or products referred to in the content.

