1. Introduction
Composite beams have been extensively used in building structures due to their excellent structural behavior [
1]. A high-strength steel (HSS)—concrete composite beam is a structural component where the high-strength steel beam and concrete slab are joined through reliable shear connections [
2]. In HSS—concrete composite beams, the shear connections sufficiently transfer the loads between the materials. The composite beam utilizes the material properties of both high-strength steel and concrete effectively, as the tensile forces are primarily resisted by the high-strength steel beam and compressive forces are resisted by the concrete slab [
3,
4]. This results in a composite beam with improved bending capacity and flexural stiffness. The shear connections are critical in the mechanical performance of HSS—concrete composite beams, as they transfer shear forces at the HSS—concrete interface and prevent detachment [
5,
6]. The stud connections are extensively used in composite beams due to the advantages of excellent shear properties and easy handling [
7,
8]. So far, extensive push-out tests and numerical analyses have been conducted on shear properties of stud connectors. The studies showed that the shear properties of stud connections were mainly influenced by the parameters of stud diameter, height, tensile strength, and concrete strength [
9,
10].
Substantial experimental and analytical investigations on the mechanical performance of HSS—concrete composite beams have been published [
11]. Nie et al. [
12] performed static bending experiments and analyzed influences of steel strength and concrete flange width. It was found that the failure mode of steel–high-strength concrete composite beams under sagging moments was bending failure, which had obvious plastic failure characteristics. With the concrete strength and concrete flange width increased, the ultimate deflection and ductility of composite beams were greatly improved. The ultimate bearing capacity was effectively improved as the steel beams strength increased. Mans et al. [
13] performed bending tests on composite beams constructed by 485 MPa high-strength steel. The test results show that the tension flange of composite beam constructed by high-strength steel achieves a high level of tensile strain without fracturing. Hegger et al. [
14] conducted bending experiments on HSS–high-strength concrete composite beams. The research results indicate that when strength grades of steel beams and concrete are increased from S235 and C30 to S460 and C70, respectively, the ultimate strength of the composite beam subjected to sagging moments and negative bending moments is increased by 70% and 90%, respectively. Youn et al. [
15] investigated ultimate bending capacity of composite beams using HSB600 high-performance steel. It was found that when the plastic bending moment was determined by 0.2% offset yield strength, the ultimate bending capacity of composite beams was underestimated. Jun et al. [
16] proposed hybrid utilization of high-strength steel in composite beams. The high=strength steels were used for the bottom flange, while normal-strength steels were utilized for the top flange and web. Ban et al. [
17] developed three-dimensional finite element models to investigate the influences of steel strength and shear connection ratio. It was found that when the concrete strength was low, the plastic method overestimated the ultimate bending strength of HSS—concrete composite beams. The main reason was that the effectiveness of rectangular stress block for the plastic analysis was limited by the lower strain-hardening range of high-strength steel. Thus, it is necessary to conduct further studies to better understand the bending performance of HSS—concrete composite beams. The theoretical model for the ultimate strength of HSS—concrete composite beams needs to be further optimized.
Therefore, four HSS—concrete composite beams were tested under static load. The influence of concrete strength on load-deflection behavior, flexural capacity, and ductility of HSS—concrete composite beams was analyzed. According to the bending test results, the simplified plastic method for the ultimate strength of HSS—concrete composite beams was compared to the nonlinear method based on material constitutive model. After analyzing the flexural capacity of 192 sample beams, the simplified plastic method was modified, and the calculation method for the ultimate strength of HSS—concrete composite beams was presented.
2. Experimental Programme
2.1. Test Specimen Geometry
For the investigation on bending behavior of HSS—concrete composite beams, four HSS—concrete composite beams were designed and tested. The principal variable of the test specimens was the concrete strength (
Table 1). The HSS—concrete composite beams were designed as fully shear connected.
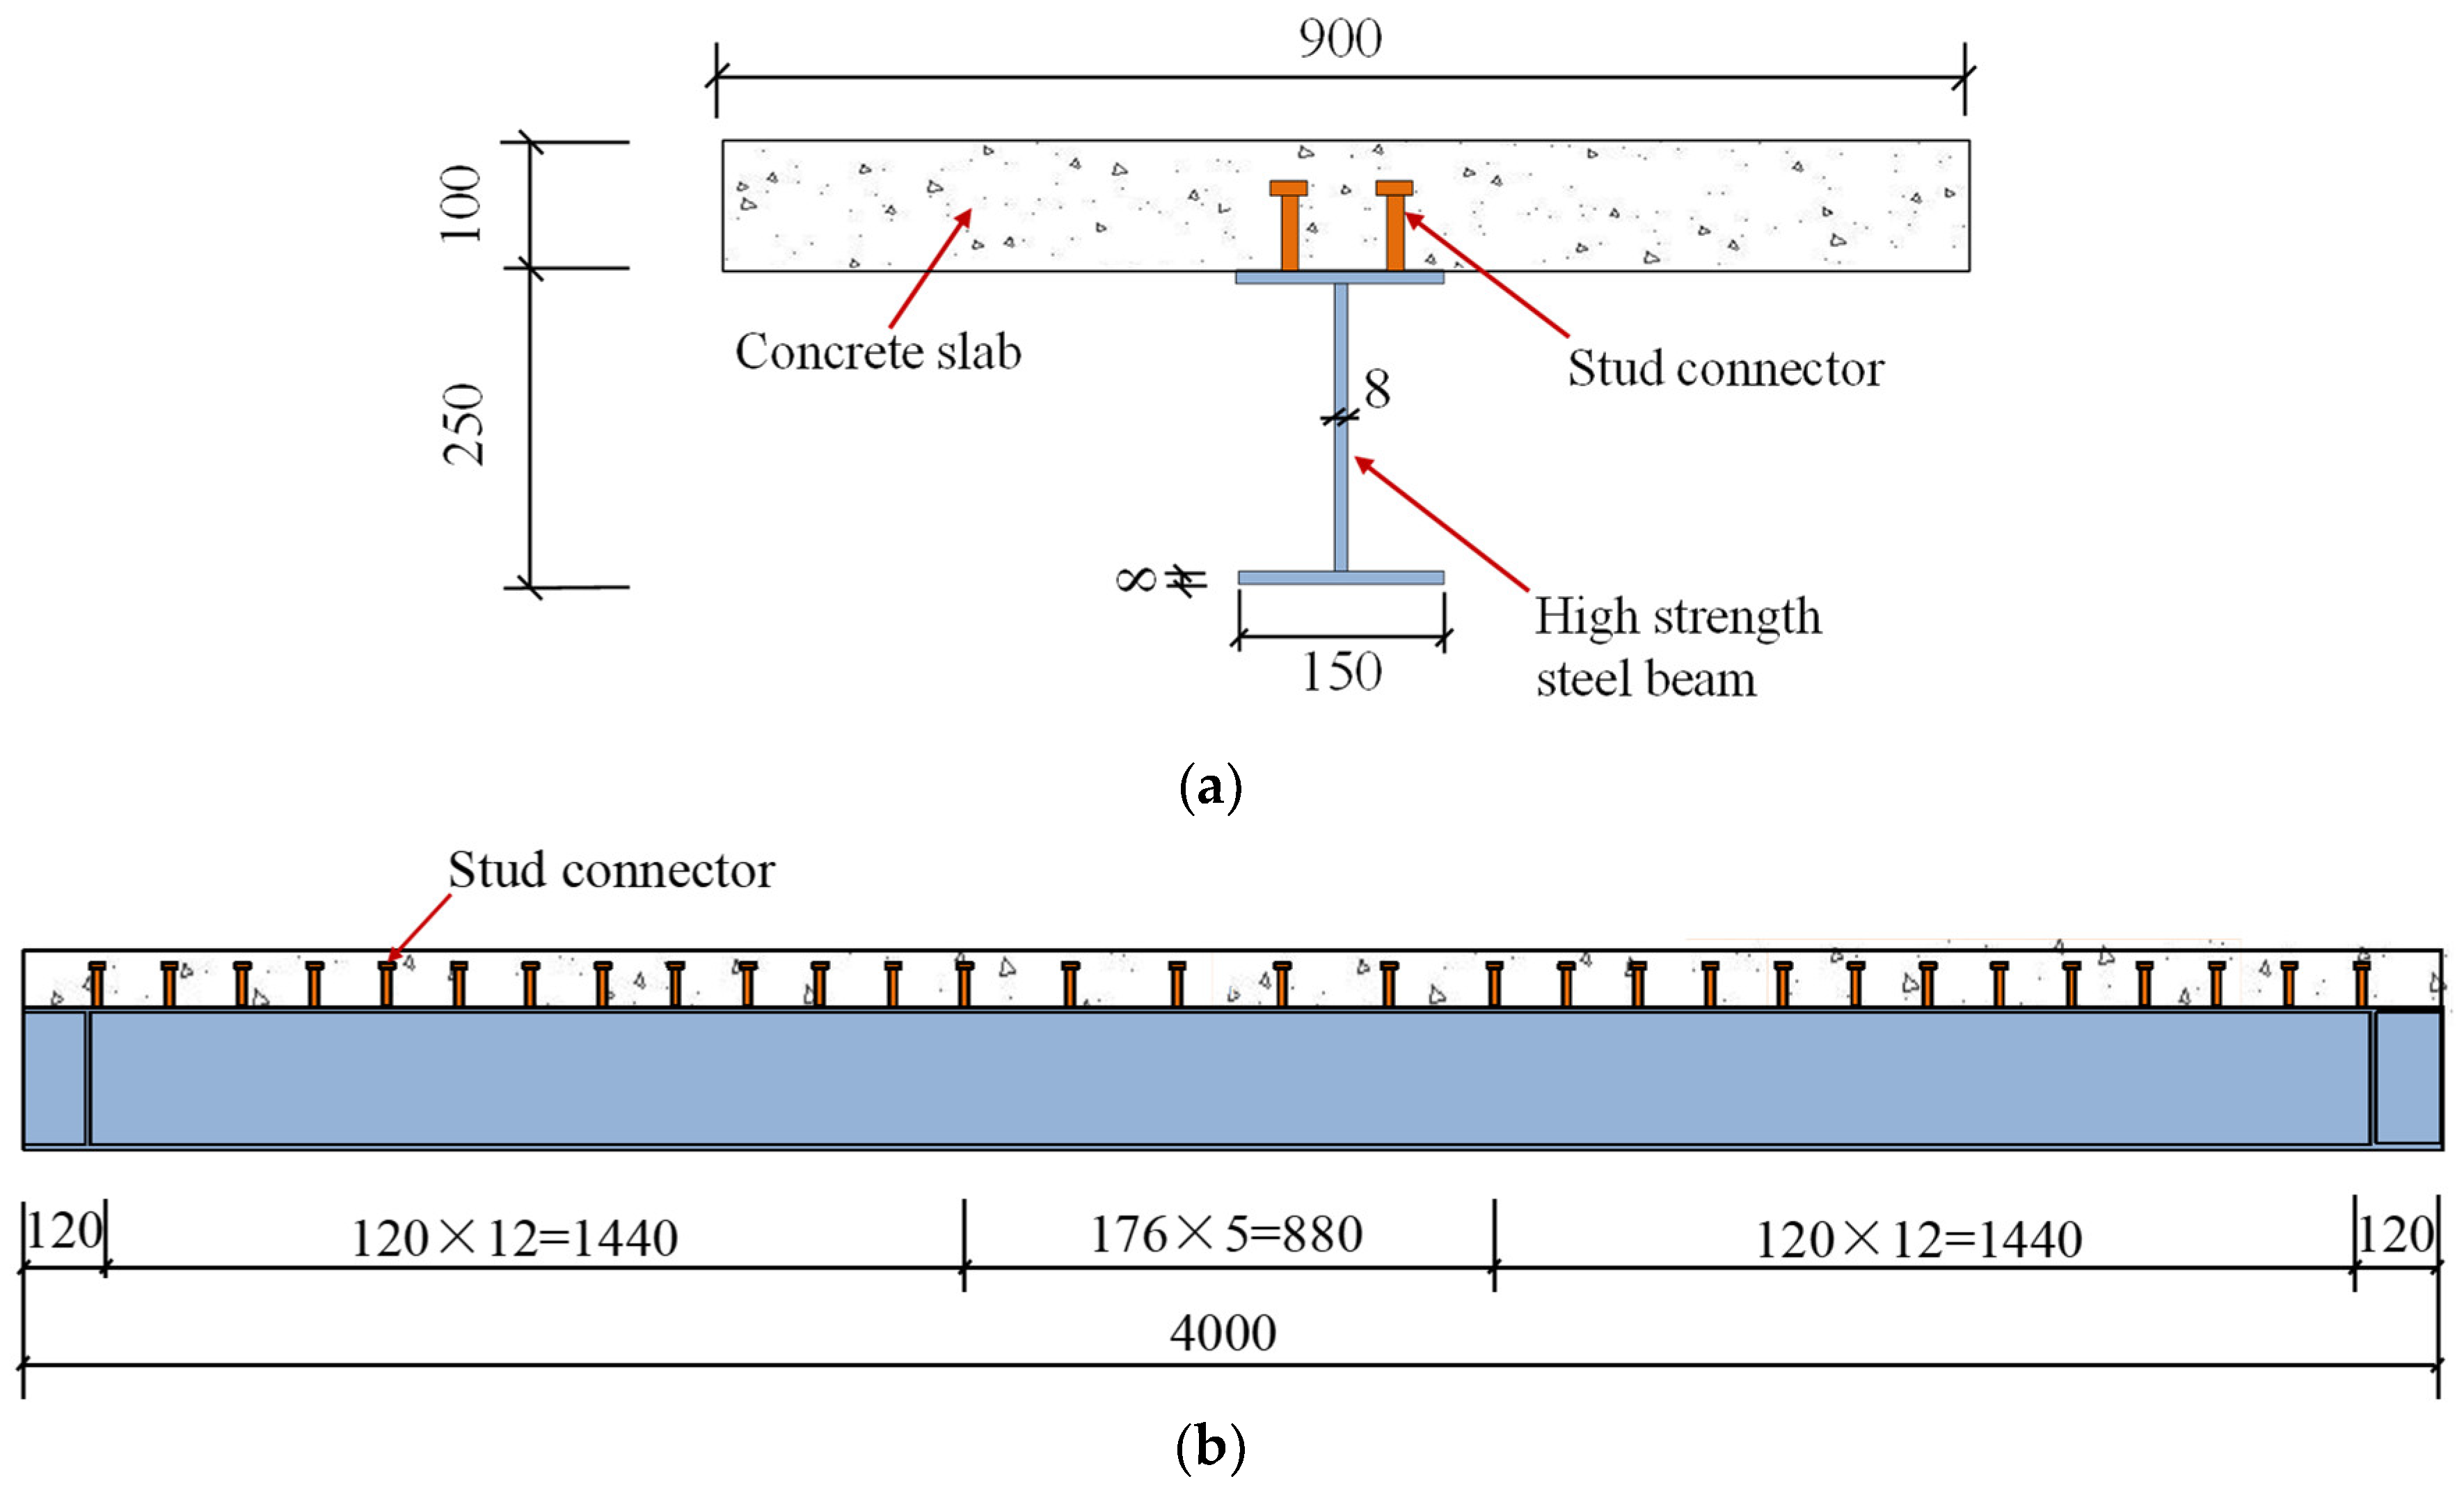
Figure 1 presents the cross-sectional dimensions of beam samples. Each beam specimen consisted of a 250 mm × 150 mm × 8 mm × 8 mm H-shaped steel beam and a 100 mm × 900 mm concrete member. Sixty stud connections were installed at the top flange of the steel member, with double rows on account of plastic analytical model from EN 1994-1-1 [
18]. The longitudinal spacing of stud connectors in pure bending zone was 176 mm. The longitudinal spacing of stud connections in the bending shear zone was 120 mm, and transverse spacing was 80 mm.
2.2. Material Properties
The steel tensile coupon test was performed on the steel plate according to ISO 6892-1 [
19]. The steel yield strength and ultimate tensile strength were 495.4 N/mm
2 and 572.8 N/mm
2, respectively. The design strength grades of concrete slab were C25, C45, C65, and C80 for each of the four beams, respectively. The concrete mix proportion is presented in
Table 2. Concrete cubes 150 × 150 mm in width and height were constructed and examined to obtain the compressive strength of concrete based on GB/T 50081 [
20]. According to the cubic compression tests of concrete, the compressive strength for concrete strength grade C25, C45, C65, and C80 was 24.5 N/mm
2, 45.9 N/mm
2, 63.1 N/mm
2, and 78.3 N/mm
2, respectively. The push-out tests were performed on the stud connection. The shearing capacity of the stud connection in normal concrete was 136 kN. The shearing capacity of the stud connection in high strength concrete was 135 kN. The measured yield strength of stud connectors was 352 N/mm
2, and the tensile strength was 480 N/mm
2.
2.3. Bending Test Setup
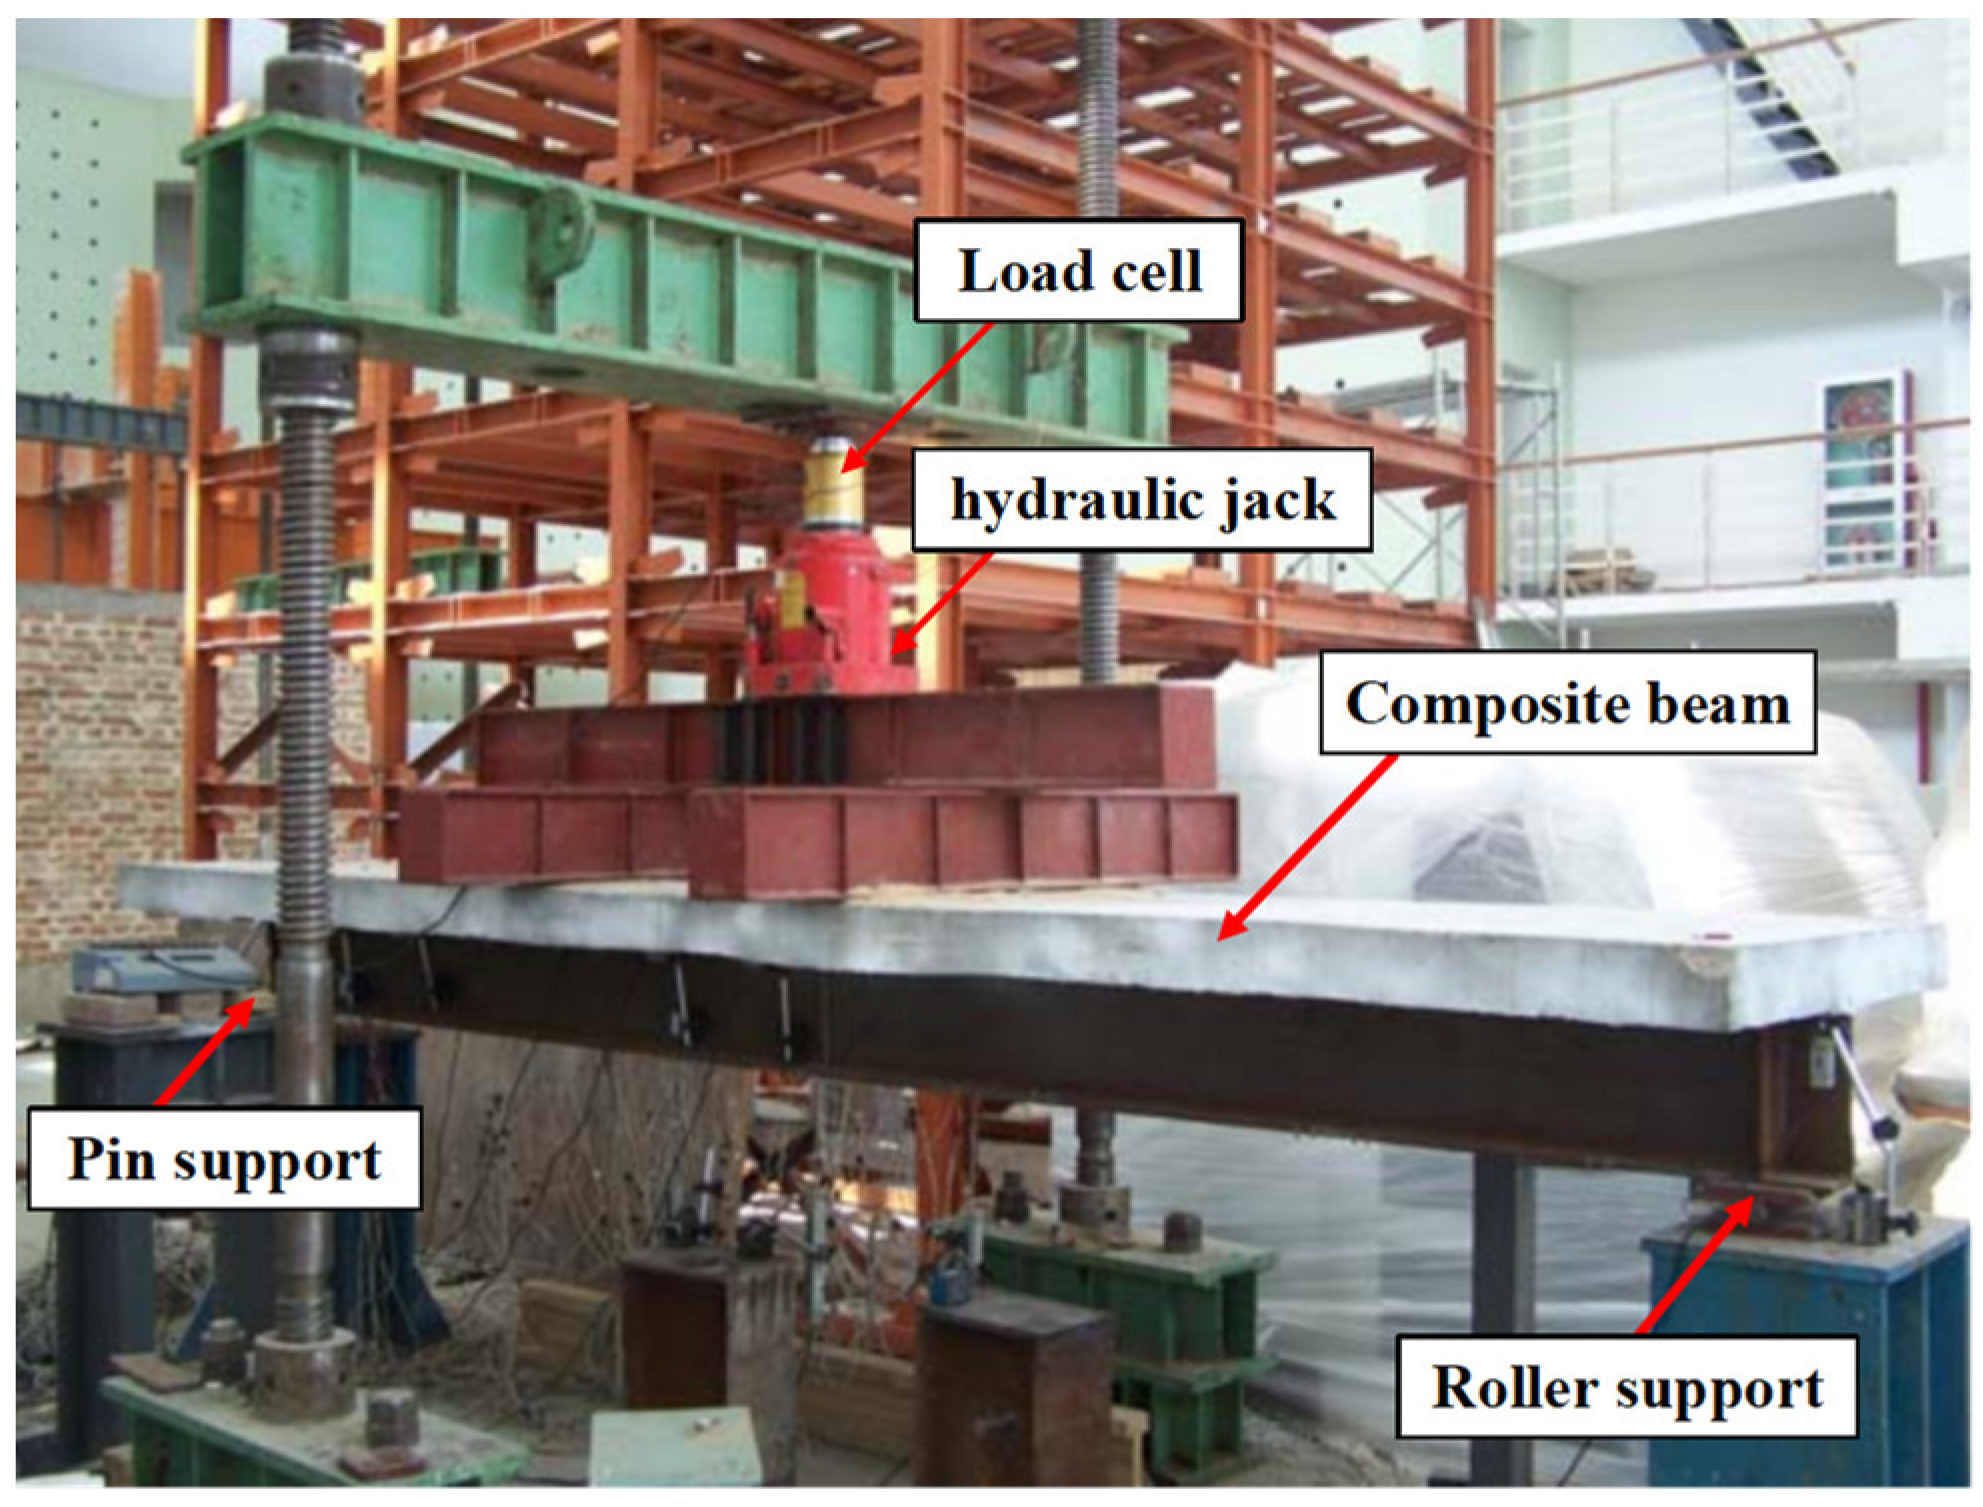
A 100 kN hydraulic jack was adopted to apply the four-point bending loads on the HSS—concrete composite beam specimens, as presented in
Figure 2. The steel beams were placed at each loading point to prevent local crushing of concrete due to excessive local compressive stress at the loading point. The displacement meters were fixed at the support and mid-span of beam specimens to achieve deflection deformations. To measure the strain distribution of the HSS—concrete composite cross-section, the strain gauges were bonded on the surfaces of the concrete flange and steel member along the height direction. The arrangements of measuring points are presented in
Figure 3. In order to examine working condition of flexural test setup and measuring instrument, the load increased with a rate of 0.5 kN/s to 10% of predicted maximum load, and then the load was released. Afterwards, the load was applied until it approached 80% of predicted maximum load. Eventually, the further load increased with a rate of 0.25 kN/s until the failure occurred on the beam specimens.
3. Test Results and Discussion
3.1. Test Phenomenon and Failure Mechanism
The experimental phenomena and failure mechanisms of HSS—concrete composite beams under bending load are similar. At the initial loading stage, the longitudinal shear forces are shared by the natural interface bonding effect and stud connectors. When the load increases to 0.65
Fu, a transverse crack occurs on the bottom surface of the concrete flange at the loading point. When the load reaches 0.72
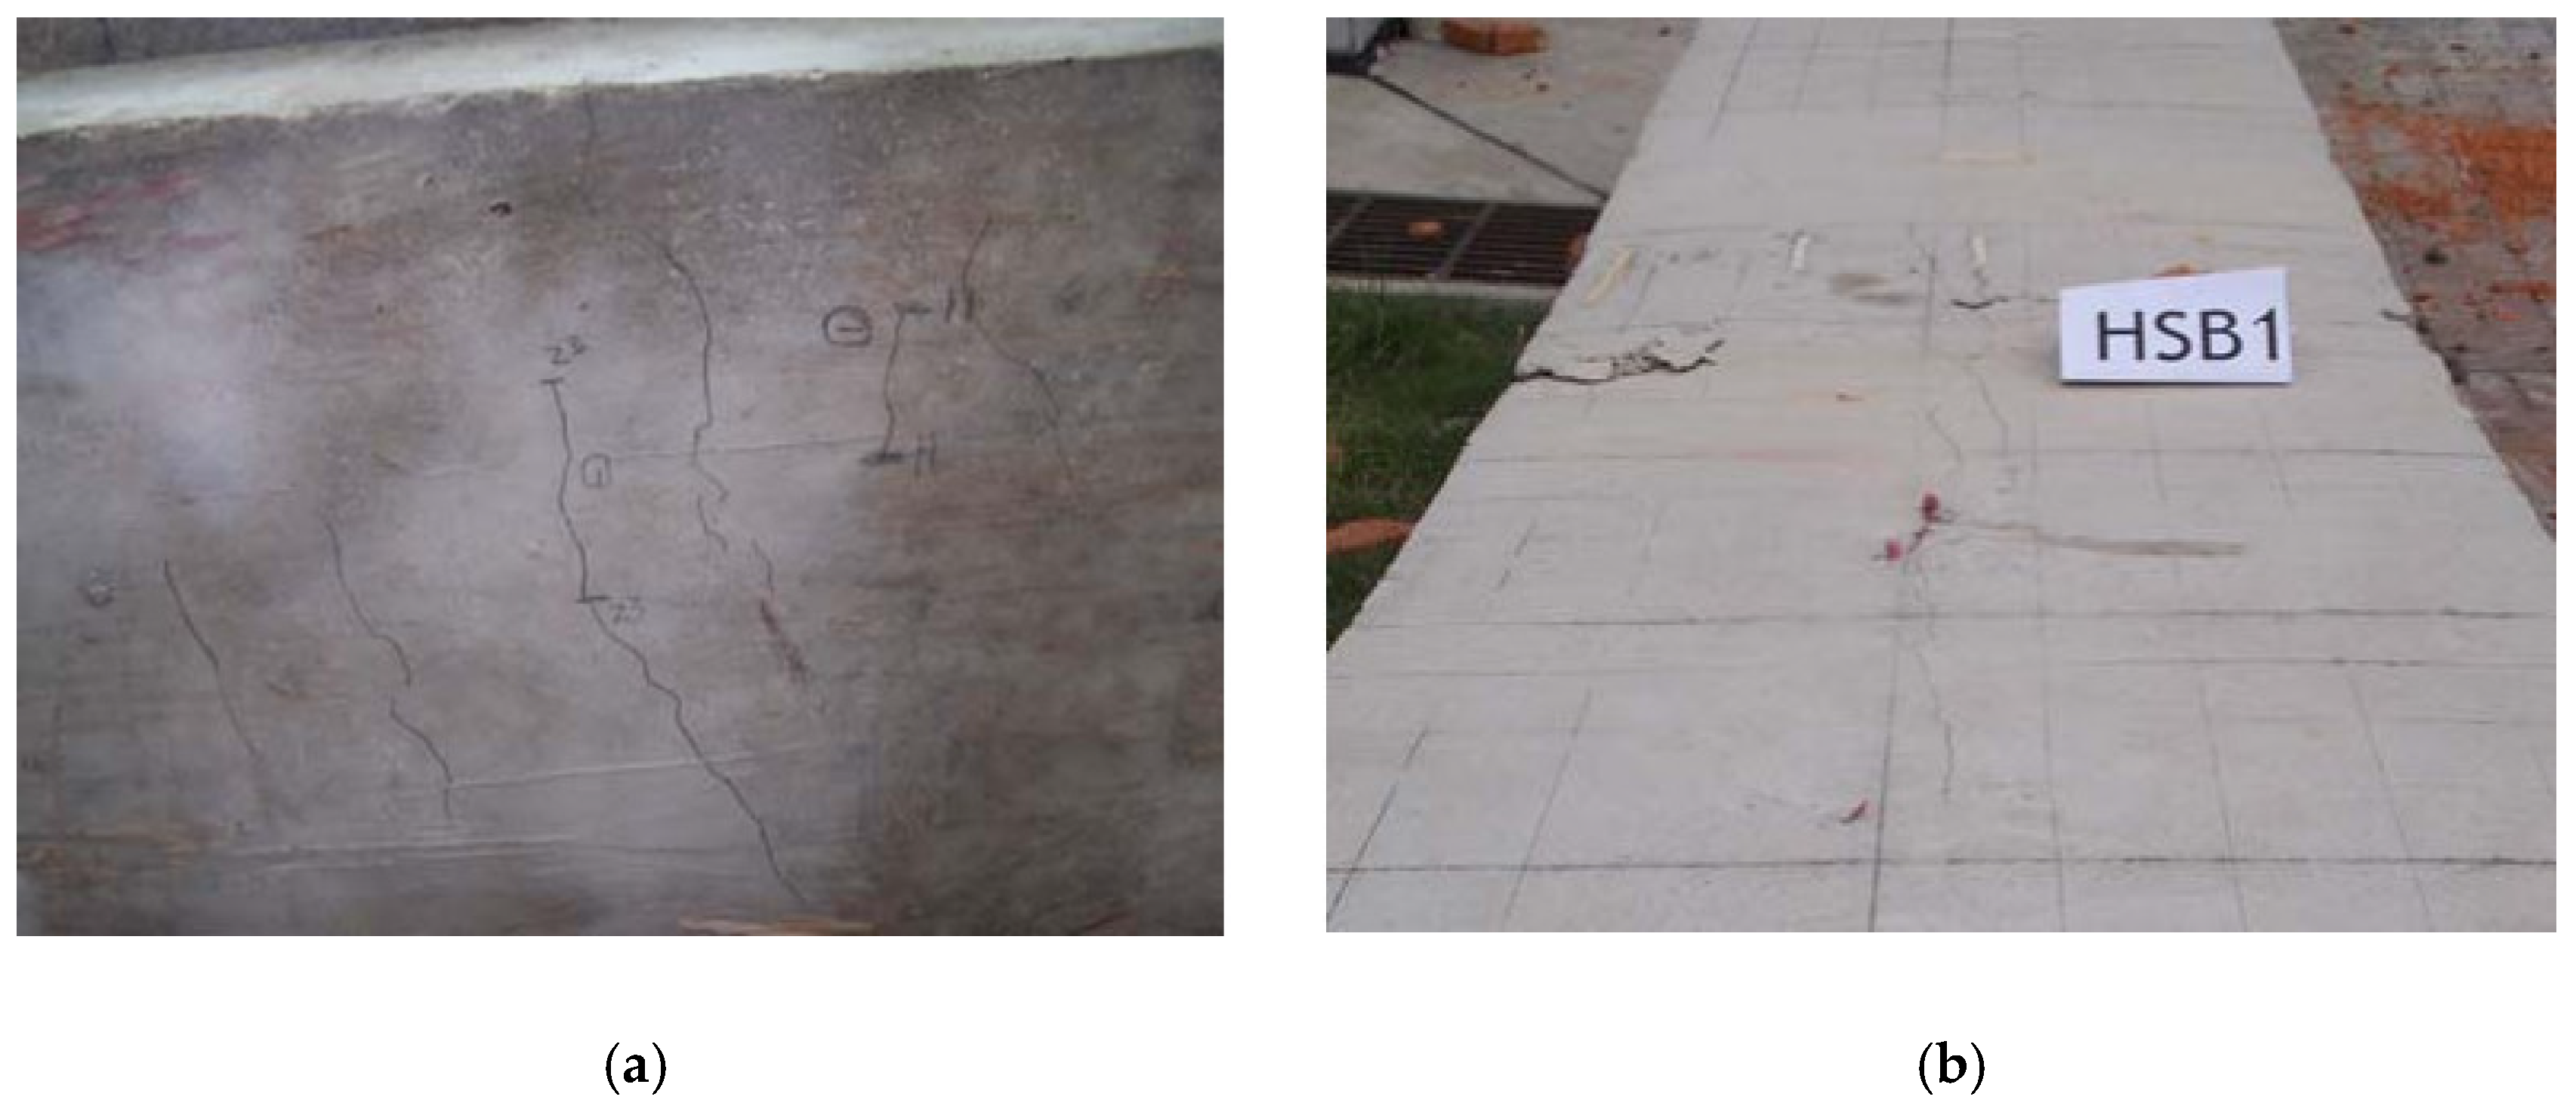
Fu, the longitudinal crack occurs on the concrete flange surface near the loading point, with a crack width of 0.04 mm. As the applied load increases, the transverse cracks at the bottom surface of the concrete flange develop and extend to the side of the slab, as shown in
Figure 4a. When the load increases to 0.82
Fu, the lower flange of the steel member yields, and longitudinal cracks at the concrete slab surface continuously appear and develop (
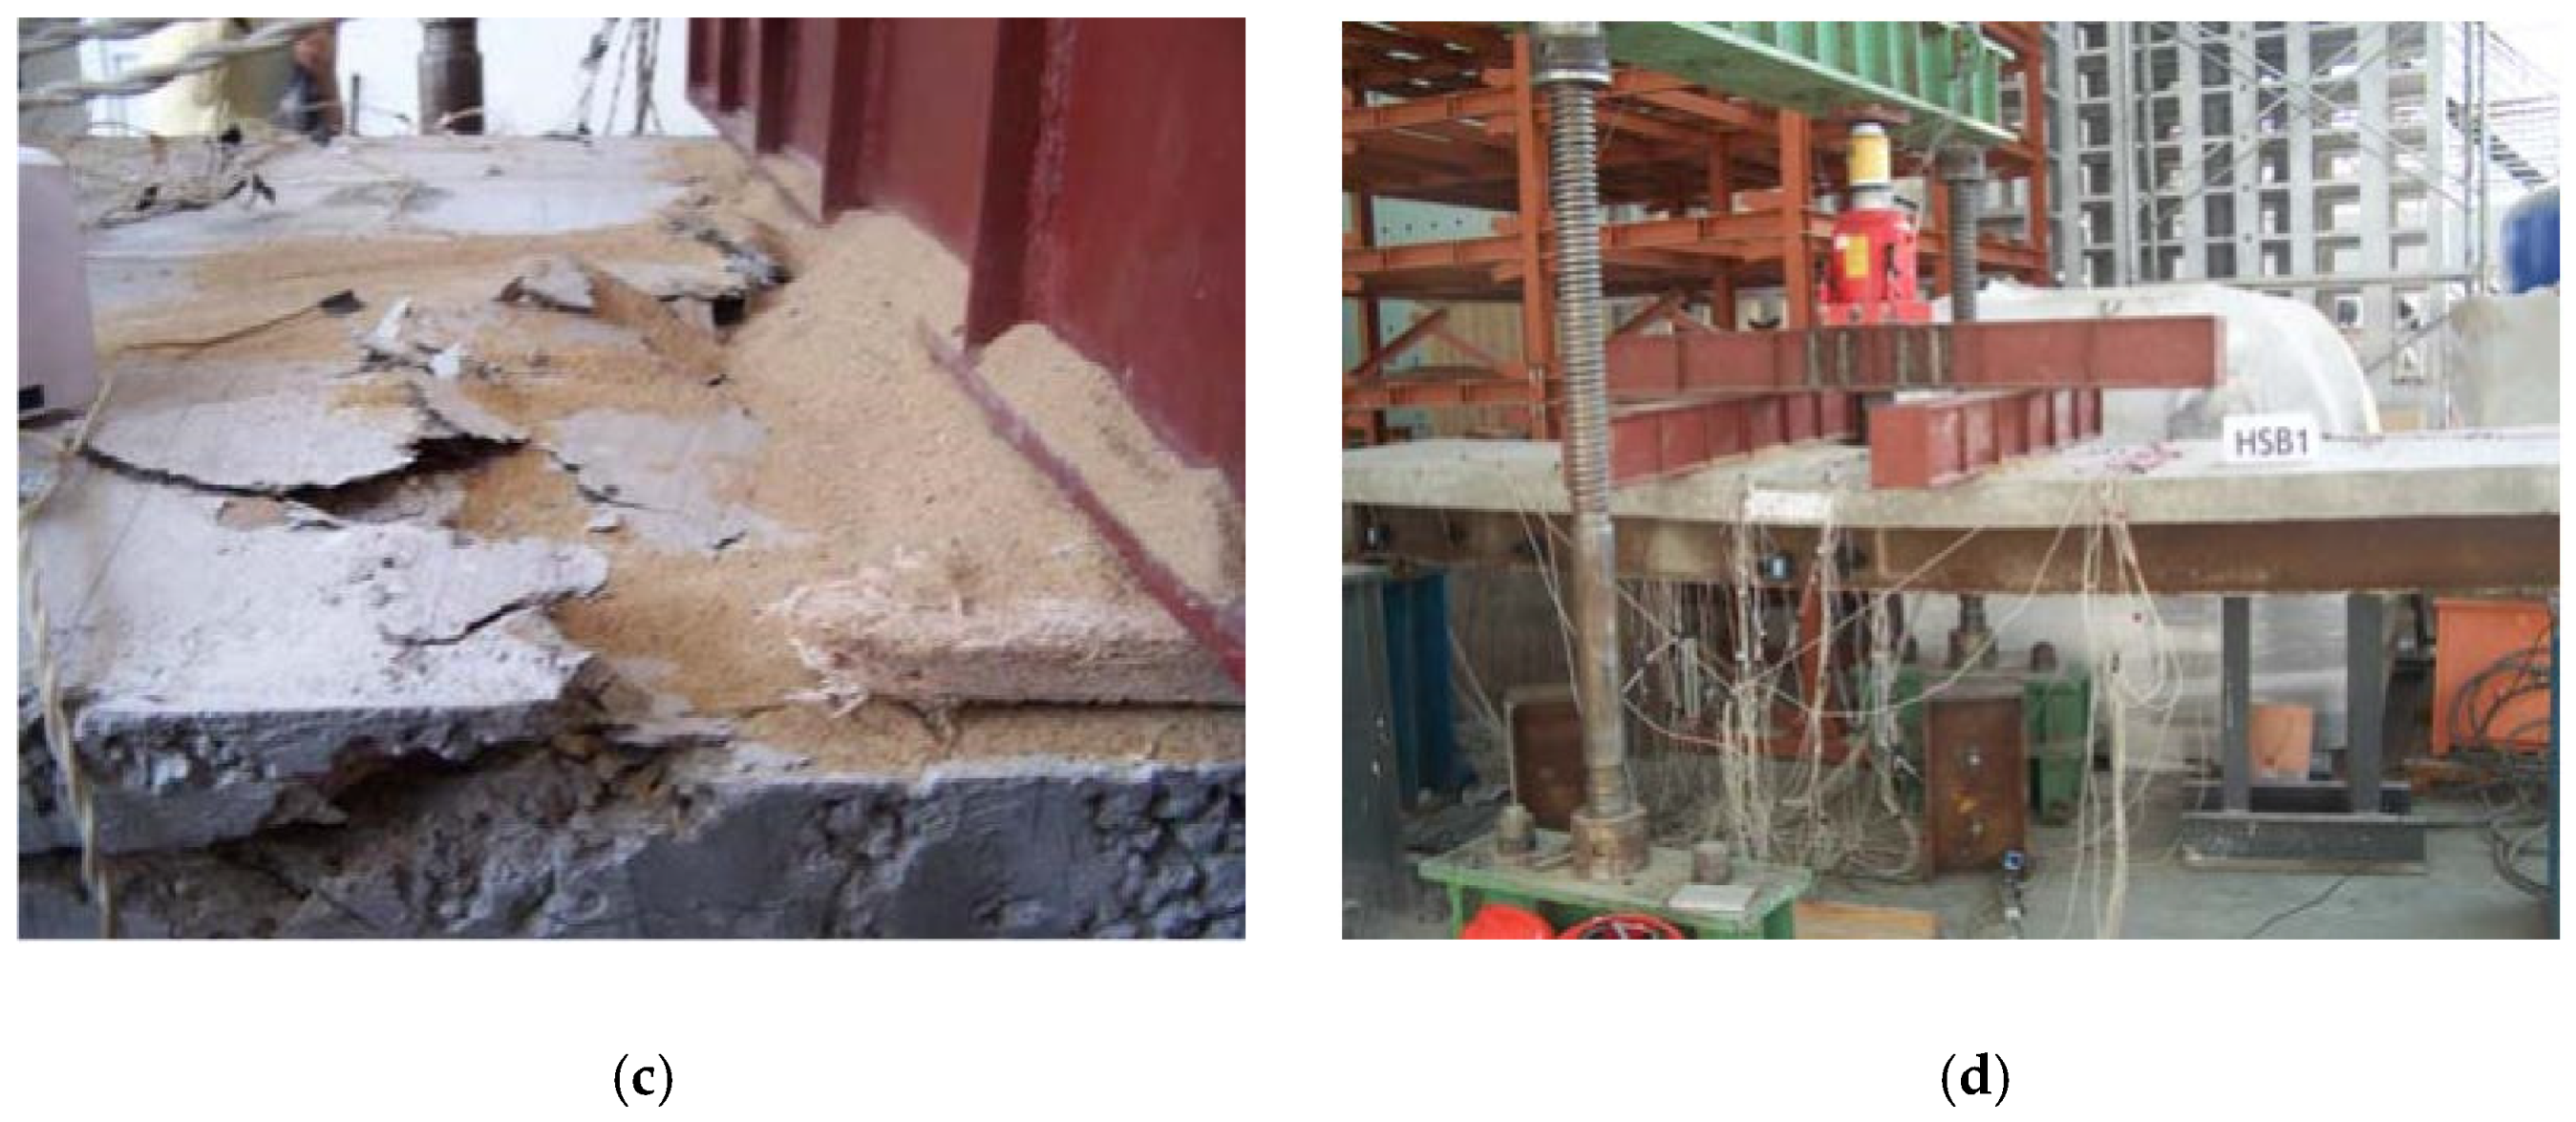
Figure 4b). When the load reaches the ultimate load
Fu, the failure modes of the HSS—concrete composite beam are flexural failure of the steel member and compression fracture of the concrete flange at mid-span (
Figure 4c,d).
It is found that compared to composite beam specimen HSB1 with concrete strength grade C25, the elastic bending strength of beam specimens HSB2, HSCB1, and HSCB2 increase by 2.6%, 7.9%, and 6.6%, respectively (
Table 3). The ultimate bending strength is improved by 8.6%, 17.2%, and 21.5%, respectively. This demonstrates that the elastic flexural capacity and ultimate strength of HSS—concrete composite beams are enhanced as the concrete strength increases. The deflection results of the composite beams HSB1, HSB2, HSCB1, and HSCB2 were compared to study the effect of concrete strength on ductility, as shown in
Table 3. It is found that the ultimate deflections of composite beam specimens HSB1, HSB2, HSCB1, and HSCB2 are 35.42, 45.81, 49.38, and 59.47 mm, and the ductility ratios are 1.78, 2.11, 2.34, and 2.79, respectively. The results demonstrate that the ductility of HSS—concrete composite beams is improved as the concrete strength increases.
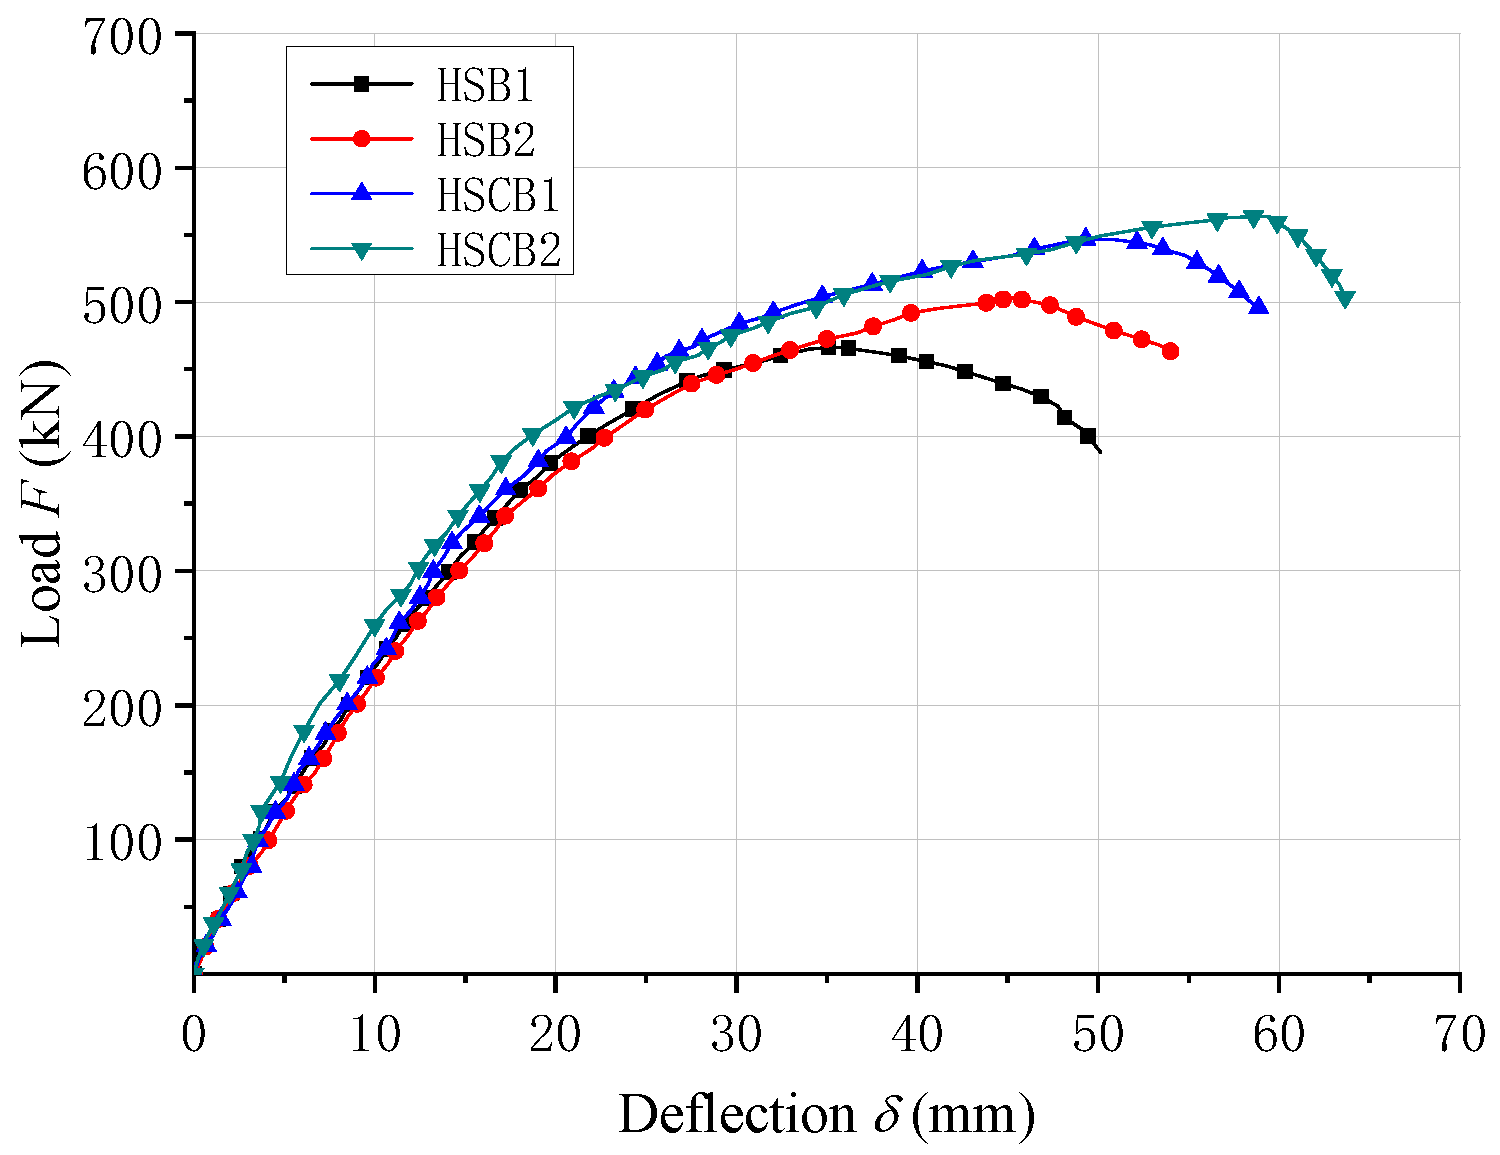
3.2. Load-Deflection Behavior
Figure 5 illustrates load-deflection curves of HSS—concrete composite beams. It turns out that the load-deflection behavior of HSS—concrete composite beams includes three working stages: elastic stage, elastic–plastic stage, and descending stage. The process from loading to yielding of the lower flange of the HSS beam is considered as the elastic working stage. It is found that the load-deflection curves of the HSS—concrete composite beams are basically linear before the applied load approaches 80% of the maximum load. In this phase, the composite beam has good overall mechanical performance. The process from the yielding of the lower flange of the HSS beam to maximum load is considered as the elastic–plastic working stage. When the lower flange of HSS beam yields, the yield zone of steel beam develops upward and the internal force of the composite cross-section redistributes. In addition, the flexural stiffness of the HSS—concrete composite beams decreases. In this phase, the load-deflection curves present nonlinear growth. After the load up to maximum load, the load reduces continuously as the slip increases. The deflection still has great development, and the HSS—concrete composite beam shows good ductility.
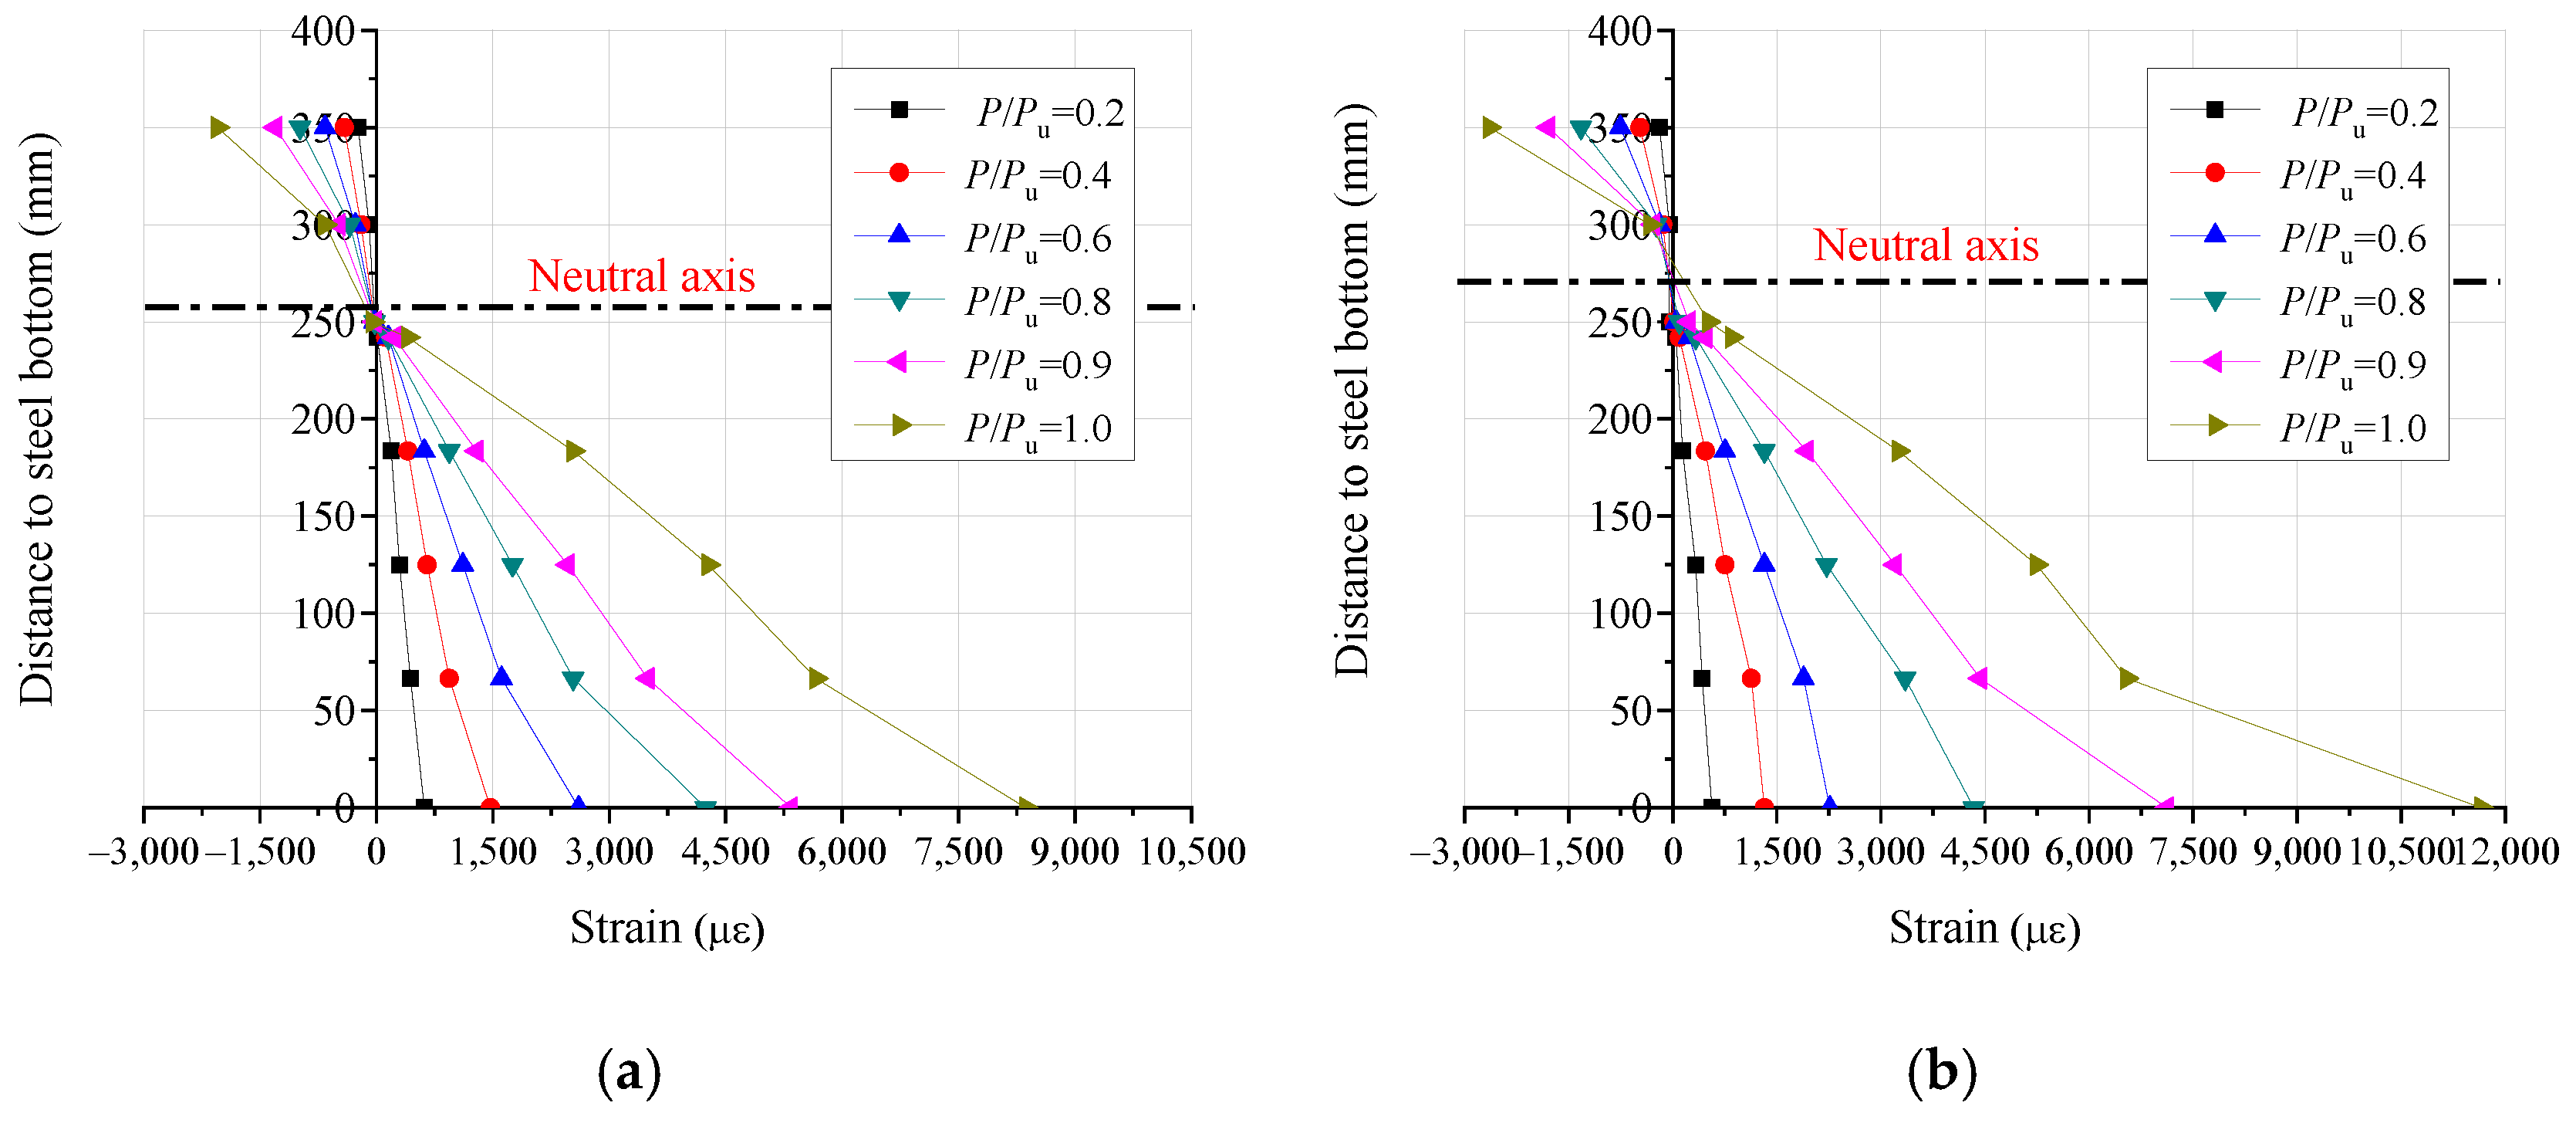
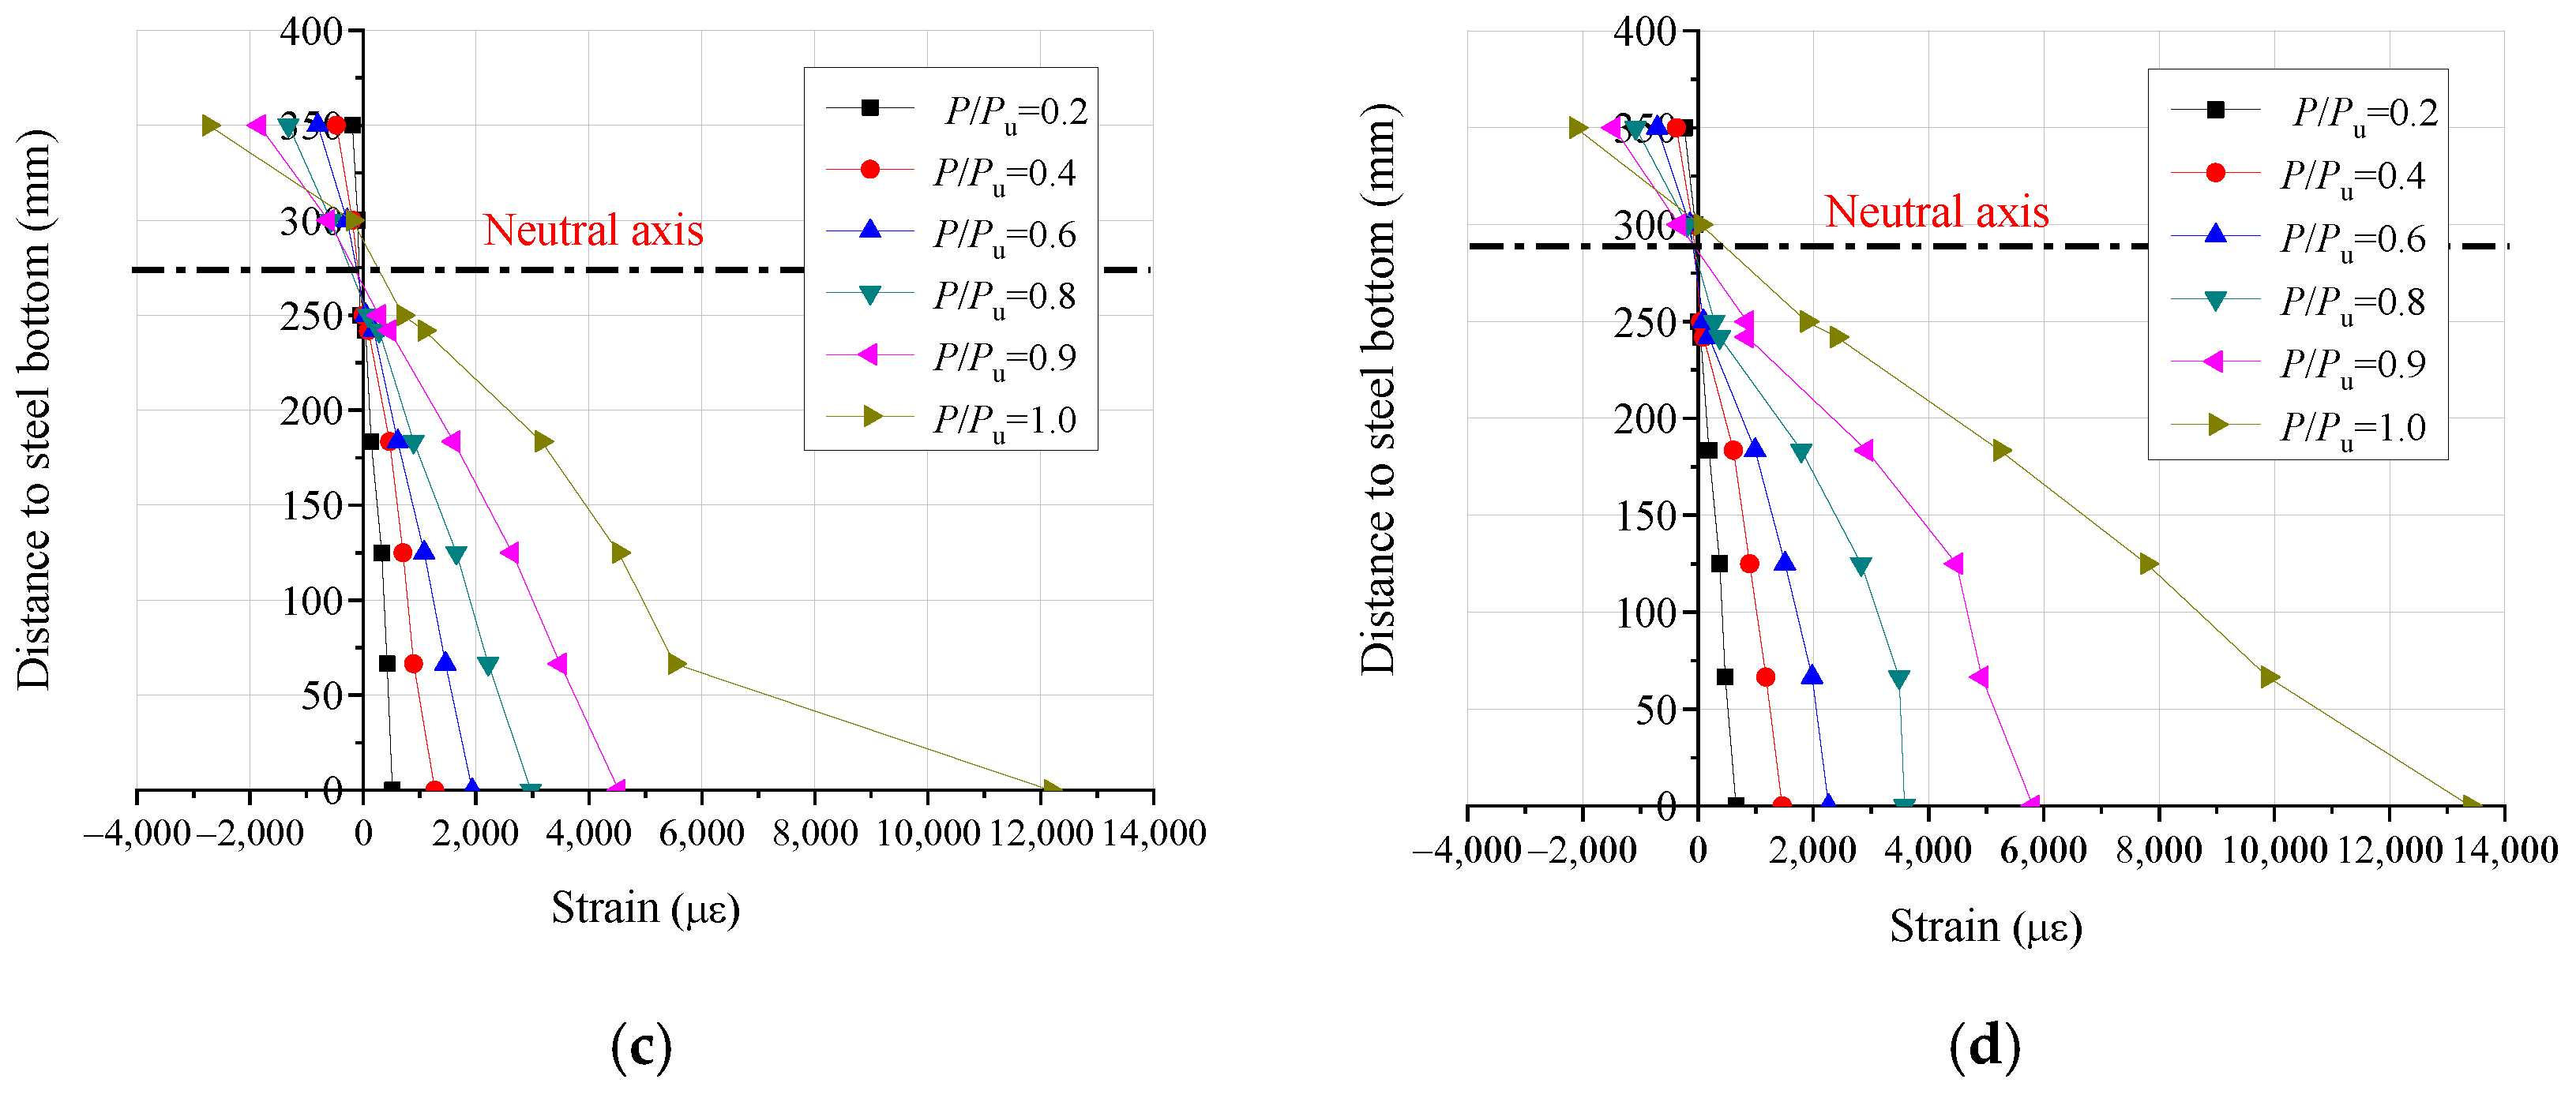
3.3. Strain Distribution of Composite Cross Section
The strain development of the central composite cross-section of the HSS—concrete composite beams along the section height is shown in
Figure 6. It turns out that the HSS—concrete composite cross-section is basically in line with plane section assumption in the loading process. The concrete strain at the interface is almost equal to the strain of the top flange of the HSS beam, which indicates that the slip strain of the composite specimens is small and can be ignored in the theoretical analysis. According to the stress–strain curves of high-strength steel obtained from the material tests, when the maximum load is reached, the lower steel flanges in the composite beam specimens have not yet fully entered into strengthened stage, and the partial upper flanges and webs of the steel beams have not yet entered the yield stage. This results in the simplified plastic method overestimating the ultimate bending capacity. The test result demonstrates that with the concrete strength increased, the position of the composite section neutral axis moves upwards. In addition, the strain value of the lower flange of HSS beam increases, and the point at which the HSS beam section enters the yield stage increases.
4. Calculation Method for Bending Capacity
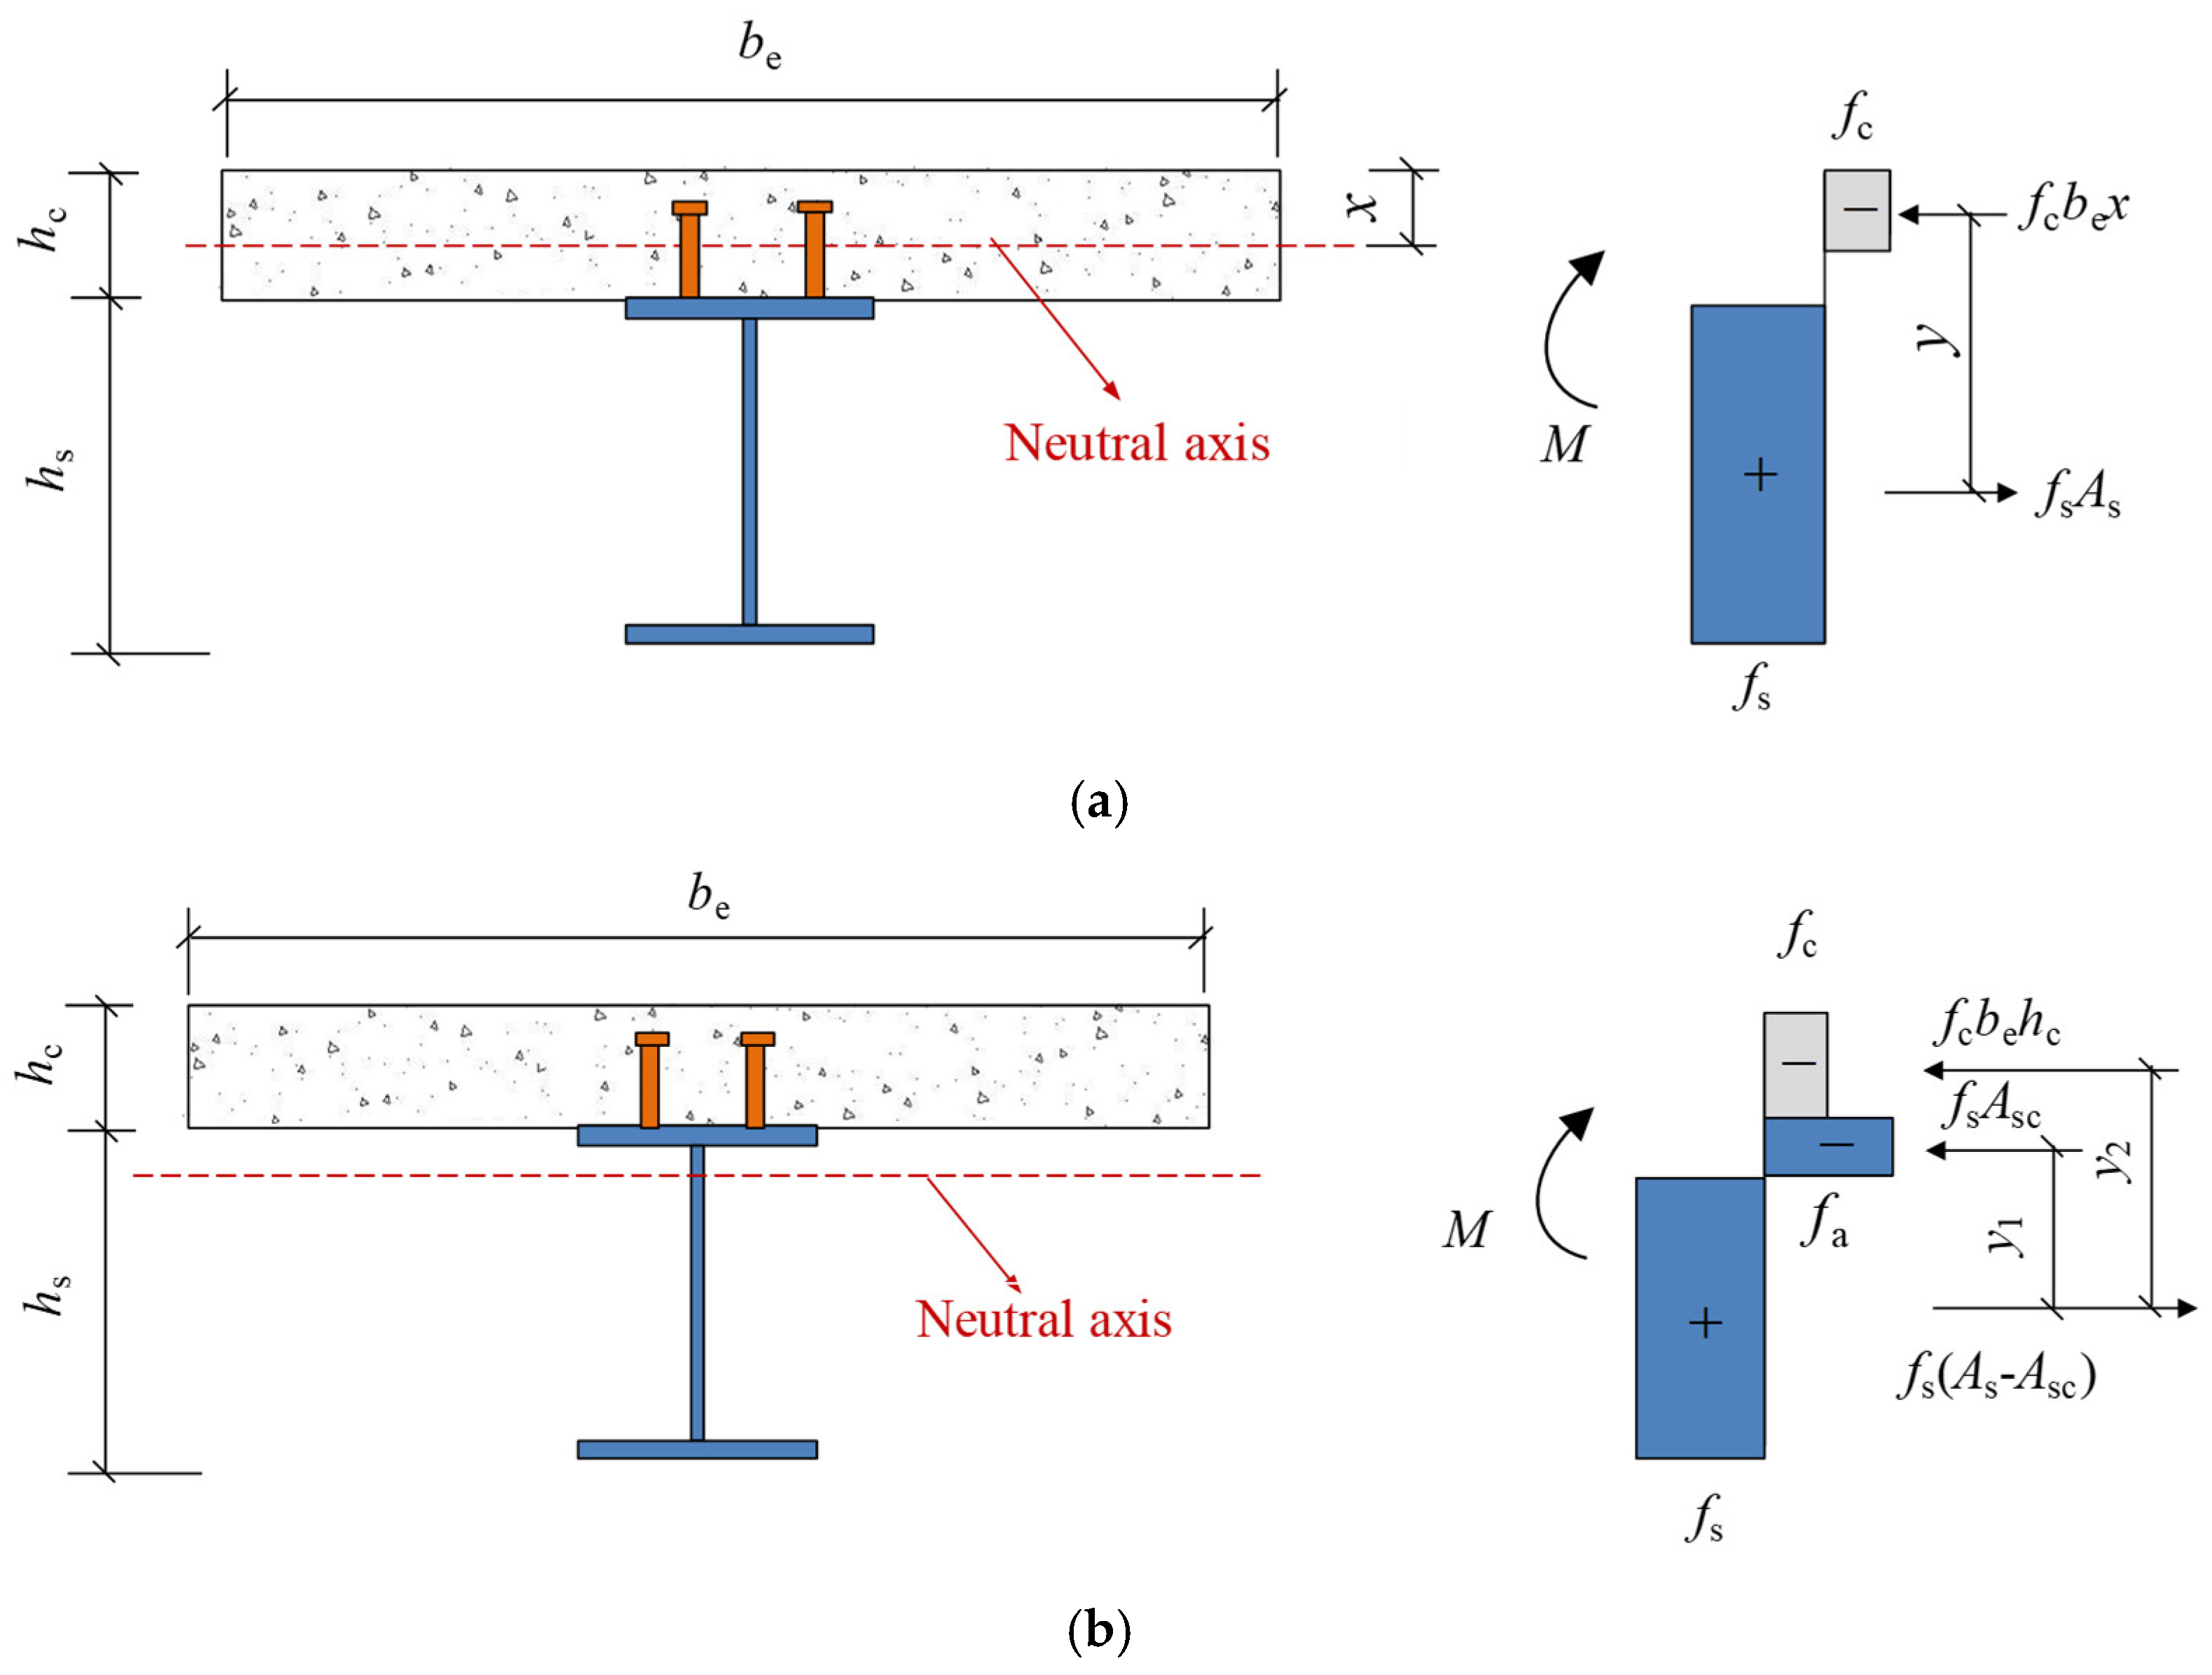
4.1. Simplified Plastic Method
The simplified plastic model is a commonly used theoretical method for calculating ultimate bending strength of composite beams. According to simplified plastic theory, the concrete compressive stresses are simulated by the rectangular stress block, and the concrete stress value is the axial compressive strength without considering the reduction in compression zone height. It is assumed that the steel member is uniformly compressed in the compression zone and uniformly tensioned in the tension zone, and its stress values are steel compressive strength and tensile strength.
The stress distribution of the composite cross-section when the neutral axis is located in the concrete flange is presented in
Figure 7a. The concrete compression height
x can be determined by:
The ultimate bending capacity of the composite beam was estimated as:
where
fs = steel tensile strength;
fc = concrete compressive strength; and
be = effective width of concrete slab.
The stress distribution of the composite cross-section when the neutral axis is located in the steel member is illustrated in
Figure 7b. The ultimate bending strength was calculated by:
where
Asc = section area of steel compressive zone.
4.2. Nonlinear Method Based on Material Constitutive Theory
To accurately calculate the ultimate bending strength of the HSS—concrete composite beams, the actual stress–strain models of concrete and steel under the limit state were adopted in the nonlinear method. Due to the reliable shear connection at the composite interface, the interface slip could be ignored, and the composite section agreed with the plane hypothesis. The stress–strain curve for the steel tension and compression is presented as:
where
σs = steel stress;
εy = steel strain when the steel yielded;
εh = steel strain at strengthened stage;
Es = steel elastic modulus;
= steel deformation modulus at strengthened stage;
fy = steel yield strength. According to material property test results of high-strength steel,
εy = 0.0028,
εh = 0.0237,
Es = 1.77 × 10
5 N/mm
2,
= 717.66 N/mm
2, and
fy = 495.3 N/mm
2.
The stress–strain curves adopted for concrete compression are presented as [
21]:
where
σc = concrete stress;
εc = concrete strain; and
ε0 = concrete peak strain.
When the composite beam attains extreme limit load, the concrete at the compression zone edge is crushed. The concrete at the top flange plate obtains ultimate compressive strain
εu. The curvature of the composite section
φu is calculated as:
According to plane hypothesis of composite section, the section strain is linear with the distance from the strain point to the neutral axis. Thus, the section strain can be expressed as:
where
c = height of the compression zone of composite section;
xc = distance from the strain point on the concrete section to the neutral axis;
εc = concrete section strain;
xs = distance from the steel strain point on steel beam section to neutral axis,
εs = steel section strain.
Based on the stress–strain curves of concrete and steel under limit state, the ultimate bending strength can be predicted by using force and moment equilibrium and deformation compatibility equation.
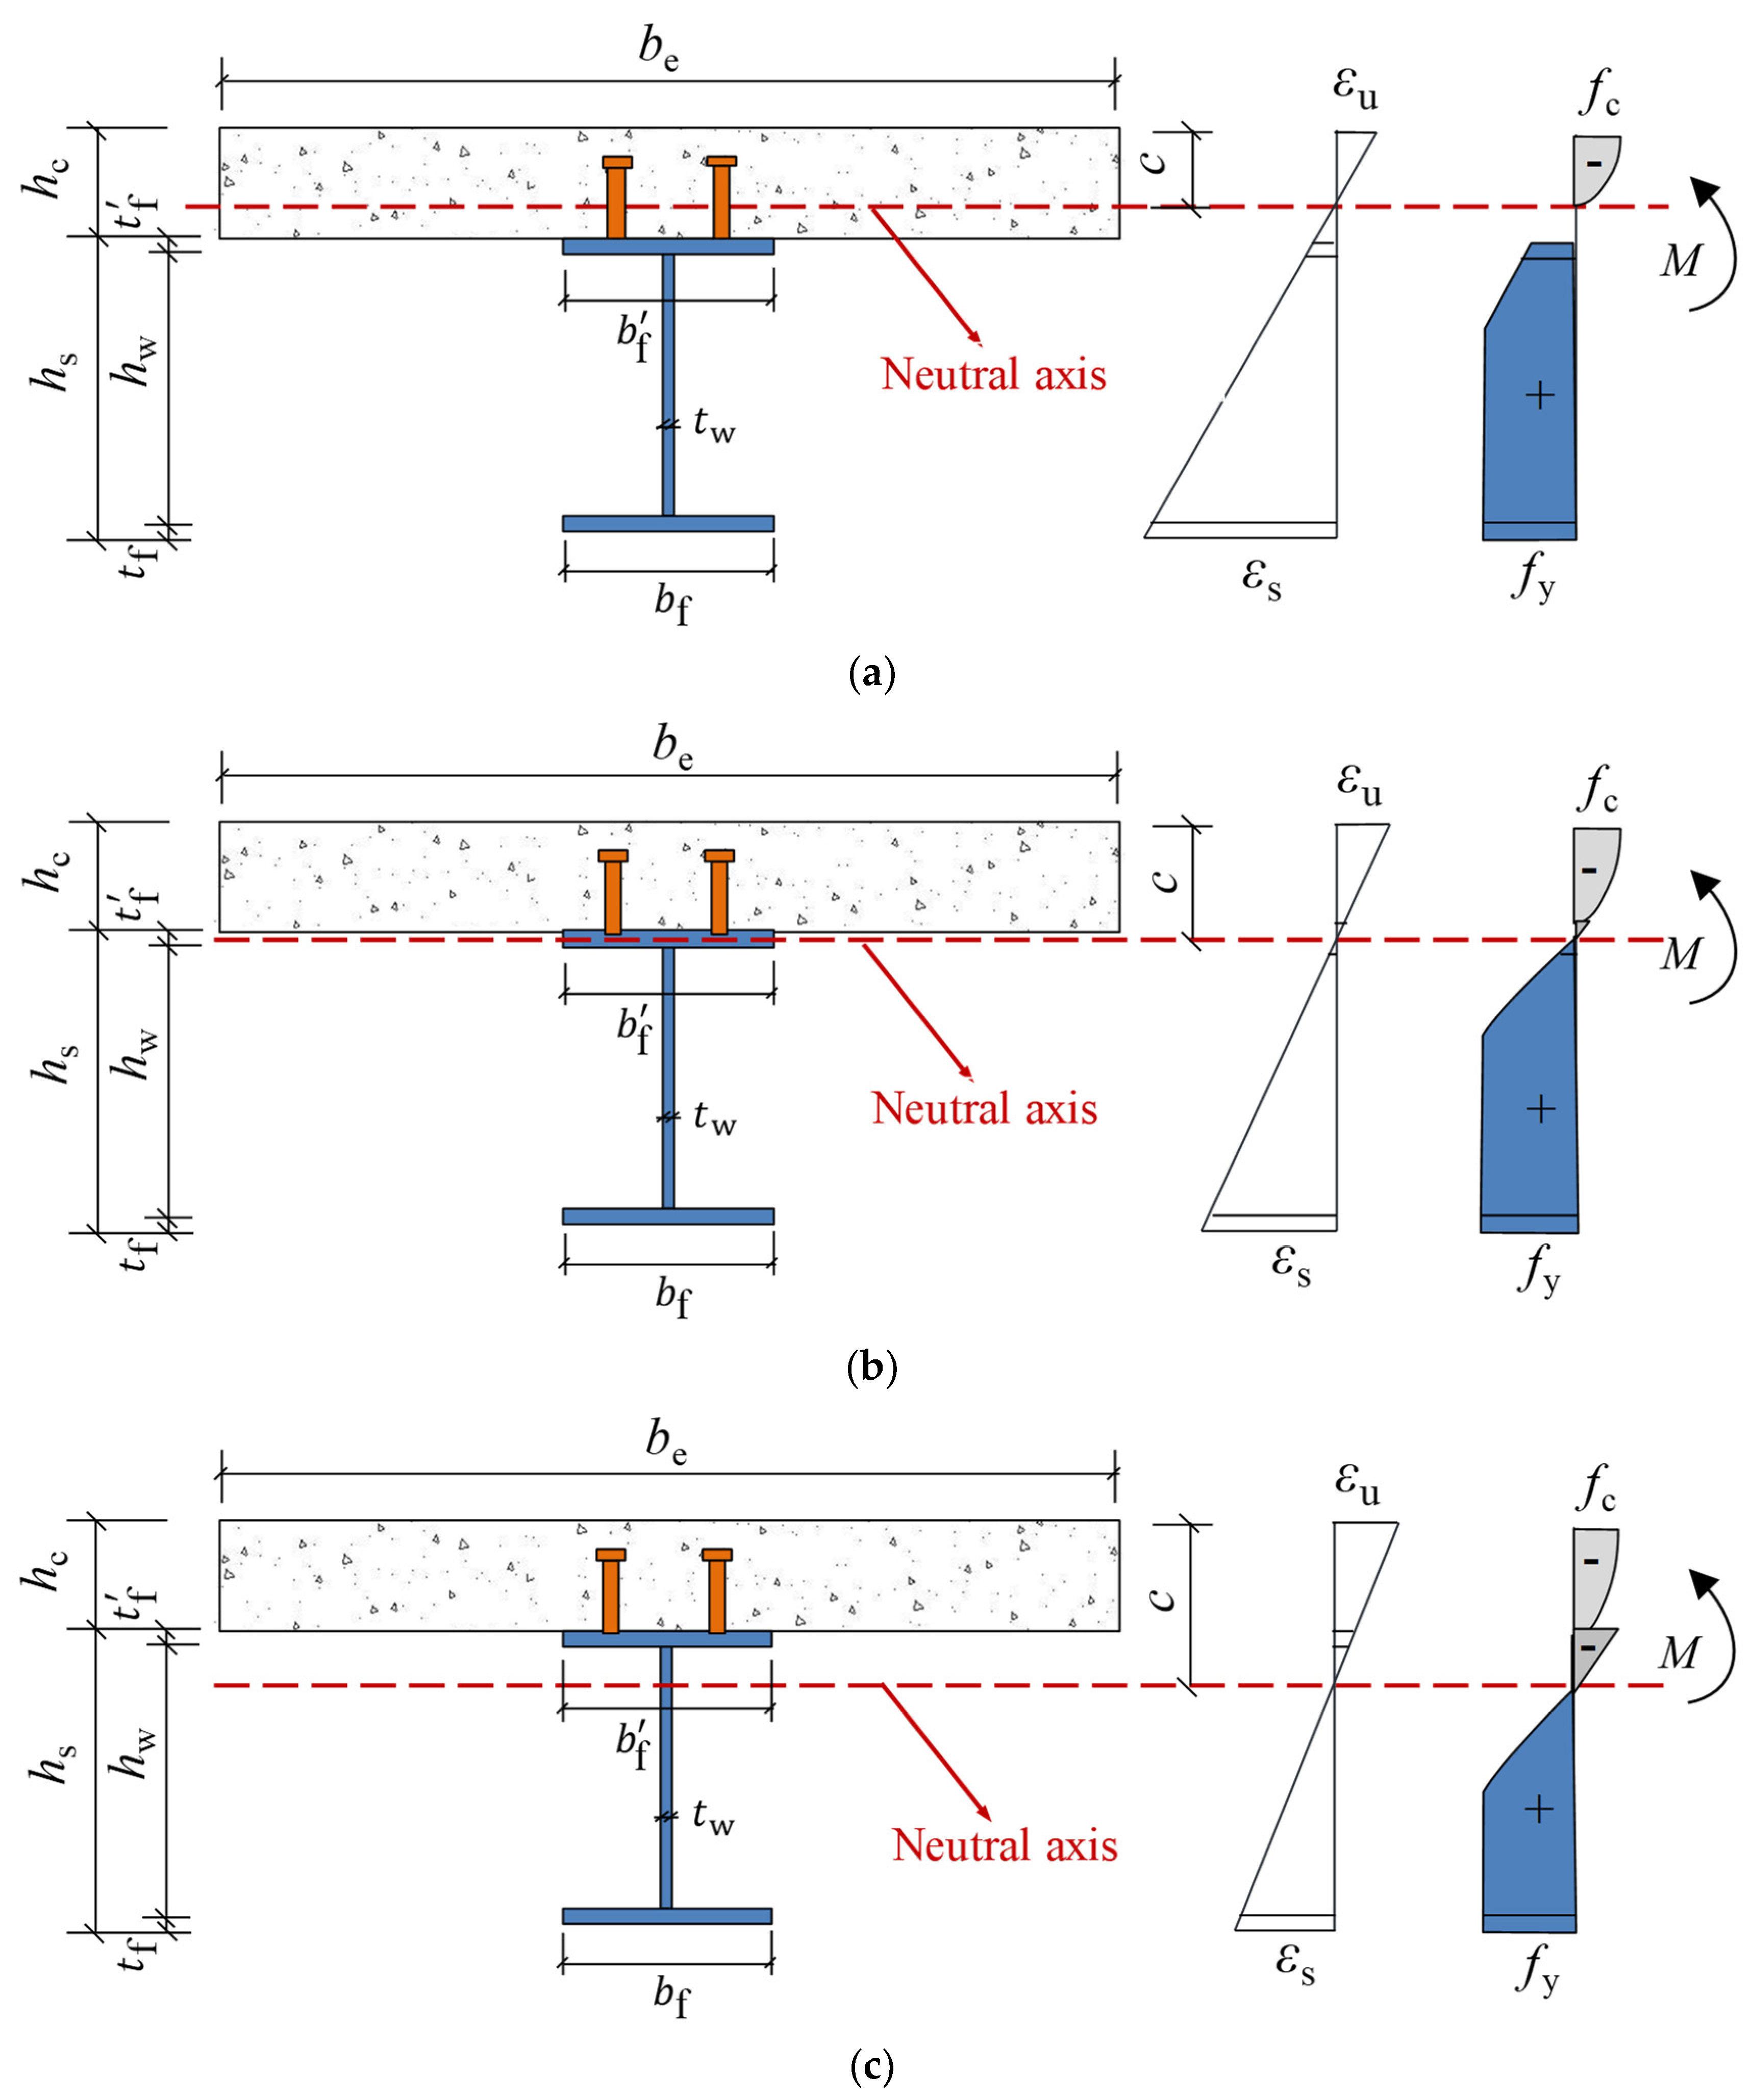
The strain distribution of the composite cross-section when the neutral axis is located in concrete flange (0 < c ≤
hc) is illustrated in
Figure 8a. The ultimate bending strength was estimated by:
The strain distribution of the composite beam section when the neutral axis is located in the steel top flange (
hc <
c ≤
hc +
) is shown in
Figure 8b. The ultimate bending strength was calculated by:
The strain distribution of the composite beam section when the neutral axis is located in the steel beam web (
hc <
c ≤
hc +
) is illustrated in
Figure 8c. The ultimate bending strength of the HSS—concrete composite beam was predicted as:
4.3. Comparisons between Test and Theoretical Results
To verify the accuracy and applicability of the simplified plastic method and nonlinear method for ultimate bending strength of HSS—concrete composite beams, the test results in this paper and reference [
12,
13,
15] were compared with the calculation result (
Table 4). The average ratio between the calculated results
Mu,s and test results
Mu,t for the simplified plastic method is 1.02, and the dispersion coefficient is 3.8%. The average ratio between the calculated results
Mu,n and test results
Mu,t for the nonlinear method is 1.00, and the dispersion coefficient is 2.9%. It is found that the simplified plastic model overestimates ultimate bending strength. The nonlinear method based on material constitutive theory could accurately calculate ultimate bending strength.
5. Modified Plastic Method
In order to modify the simplified plastic method to calculate the bending bearing capacity of HSS—concrete composite beams, 192 sample beams were selected in this paper, and each sample beam was calculated by the simplified plastic method and the nonlinear method based on material constitutive theory. The steel strength grade was 480 MPa. The parameters of the sample beam included the section size of steel beam (HN100 × 50 × 5 × 7; HN250 × 125 × 6 × 9; HN450 × 200 × 9 × 14; HN700 × 300 × 13 × 24), thickness of concrete slab (80 mm, 110 mm, 150 mm), width of concrete slab (800 mm, bf + 12hc), and concrete strength grade (C20, C25, C30, C40, C50, C60, C70, and C80).
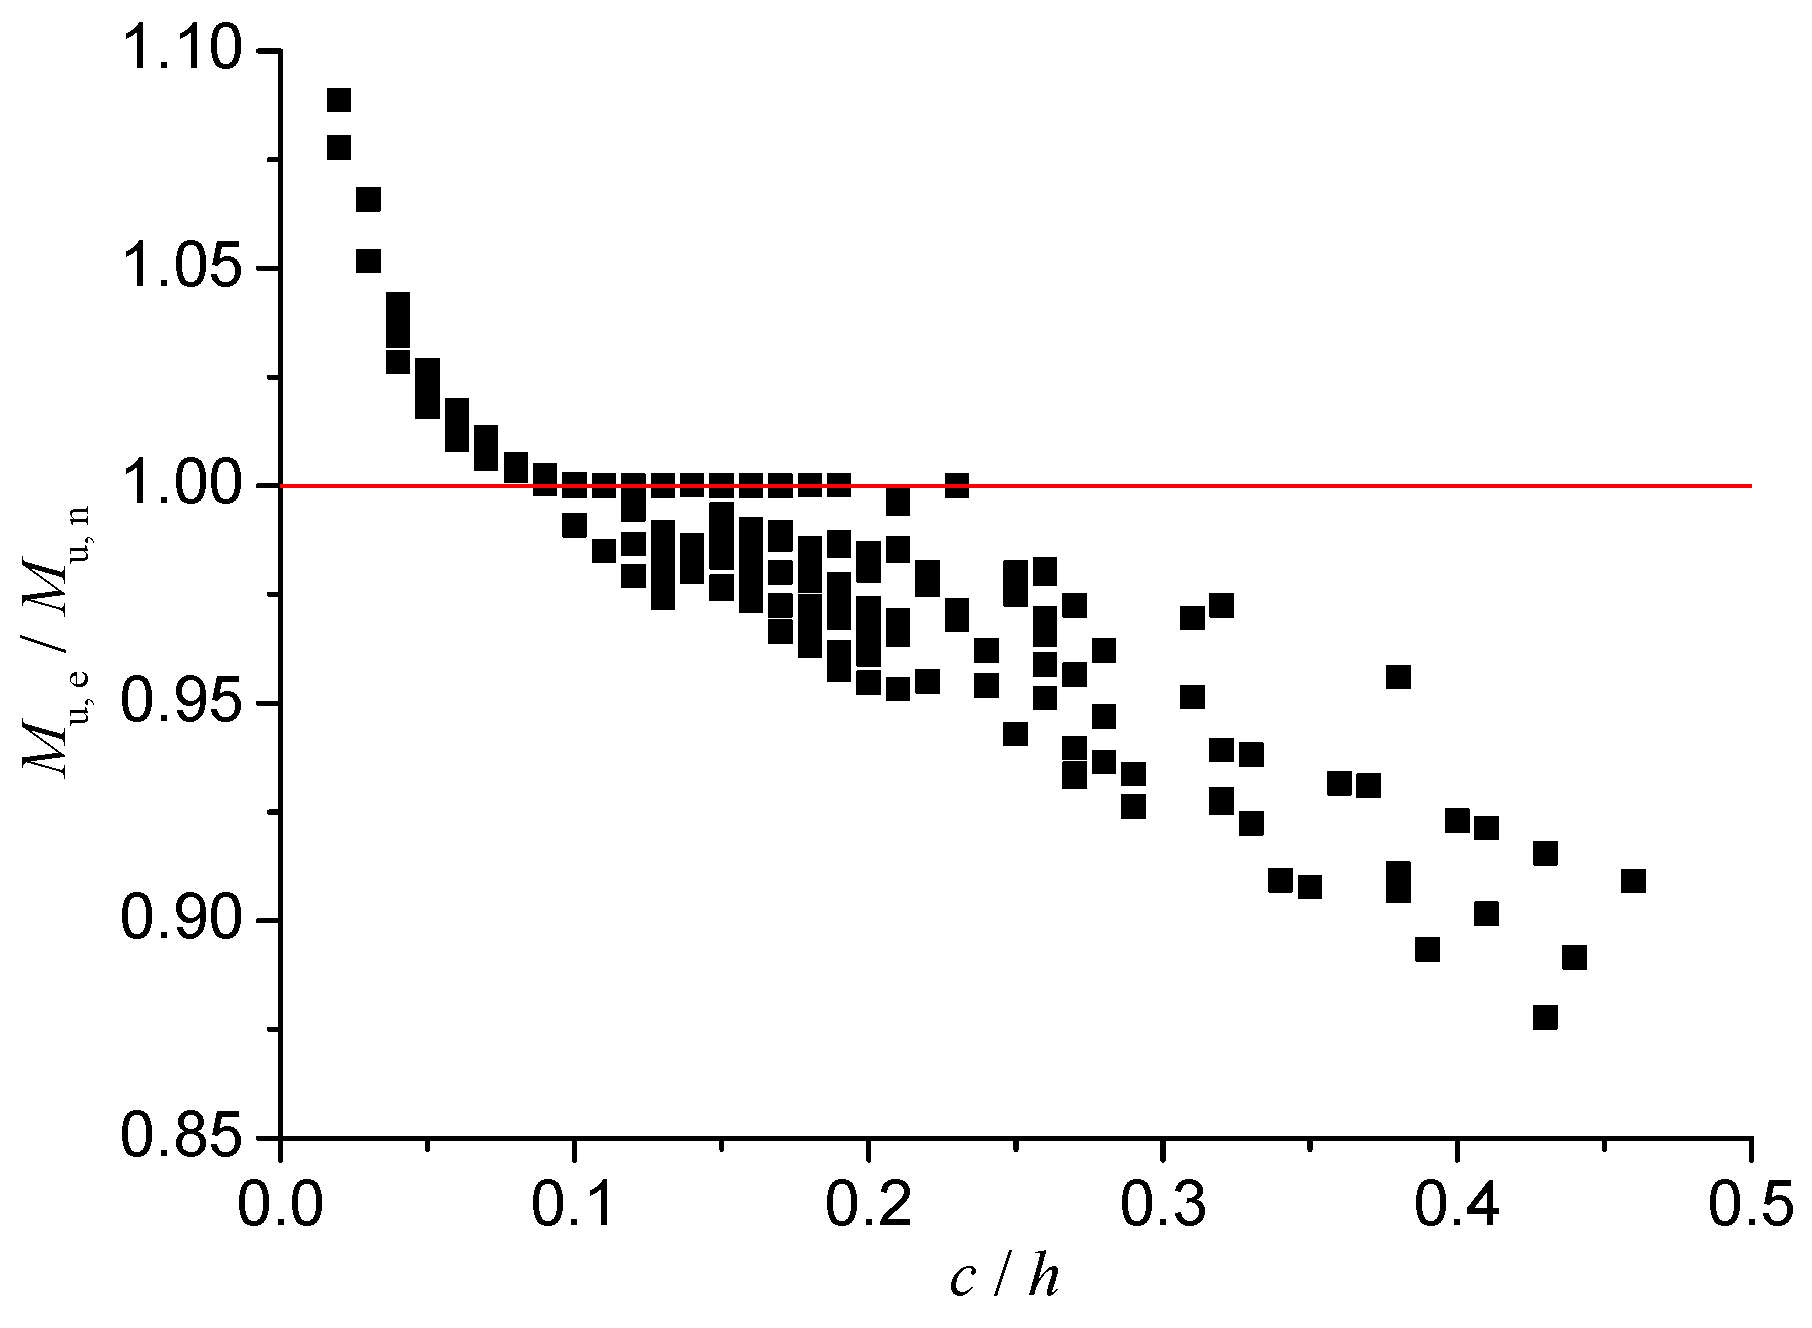
Figure 9 illustrates comparisons between the calculation results of the simplified plastic method and the nonlinear method. The results show that bending bearing capacity
Mu,s obtained by the simplified plastic method for most sample beams is larger than the bending bearing capacity
Mu,n calculated by the nonlinear method. According to the theoretical analysis, when ultimate compressive strains of concrete are the same, the lower neutral axis position of the composite section results in smaller strain of the steel beam in the tensile zone under the limit state. This leads to a smaller section area of the HSS beam entering the strengthened stage. In addition, the plastic development of the HSS beam is less sufficient. Therefore, when the composite section neutral axis is lower, the simplified plastic method is more likely to overestimate the ultimate bearing capacity of HSS—concrete composite beams.
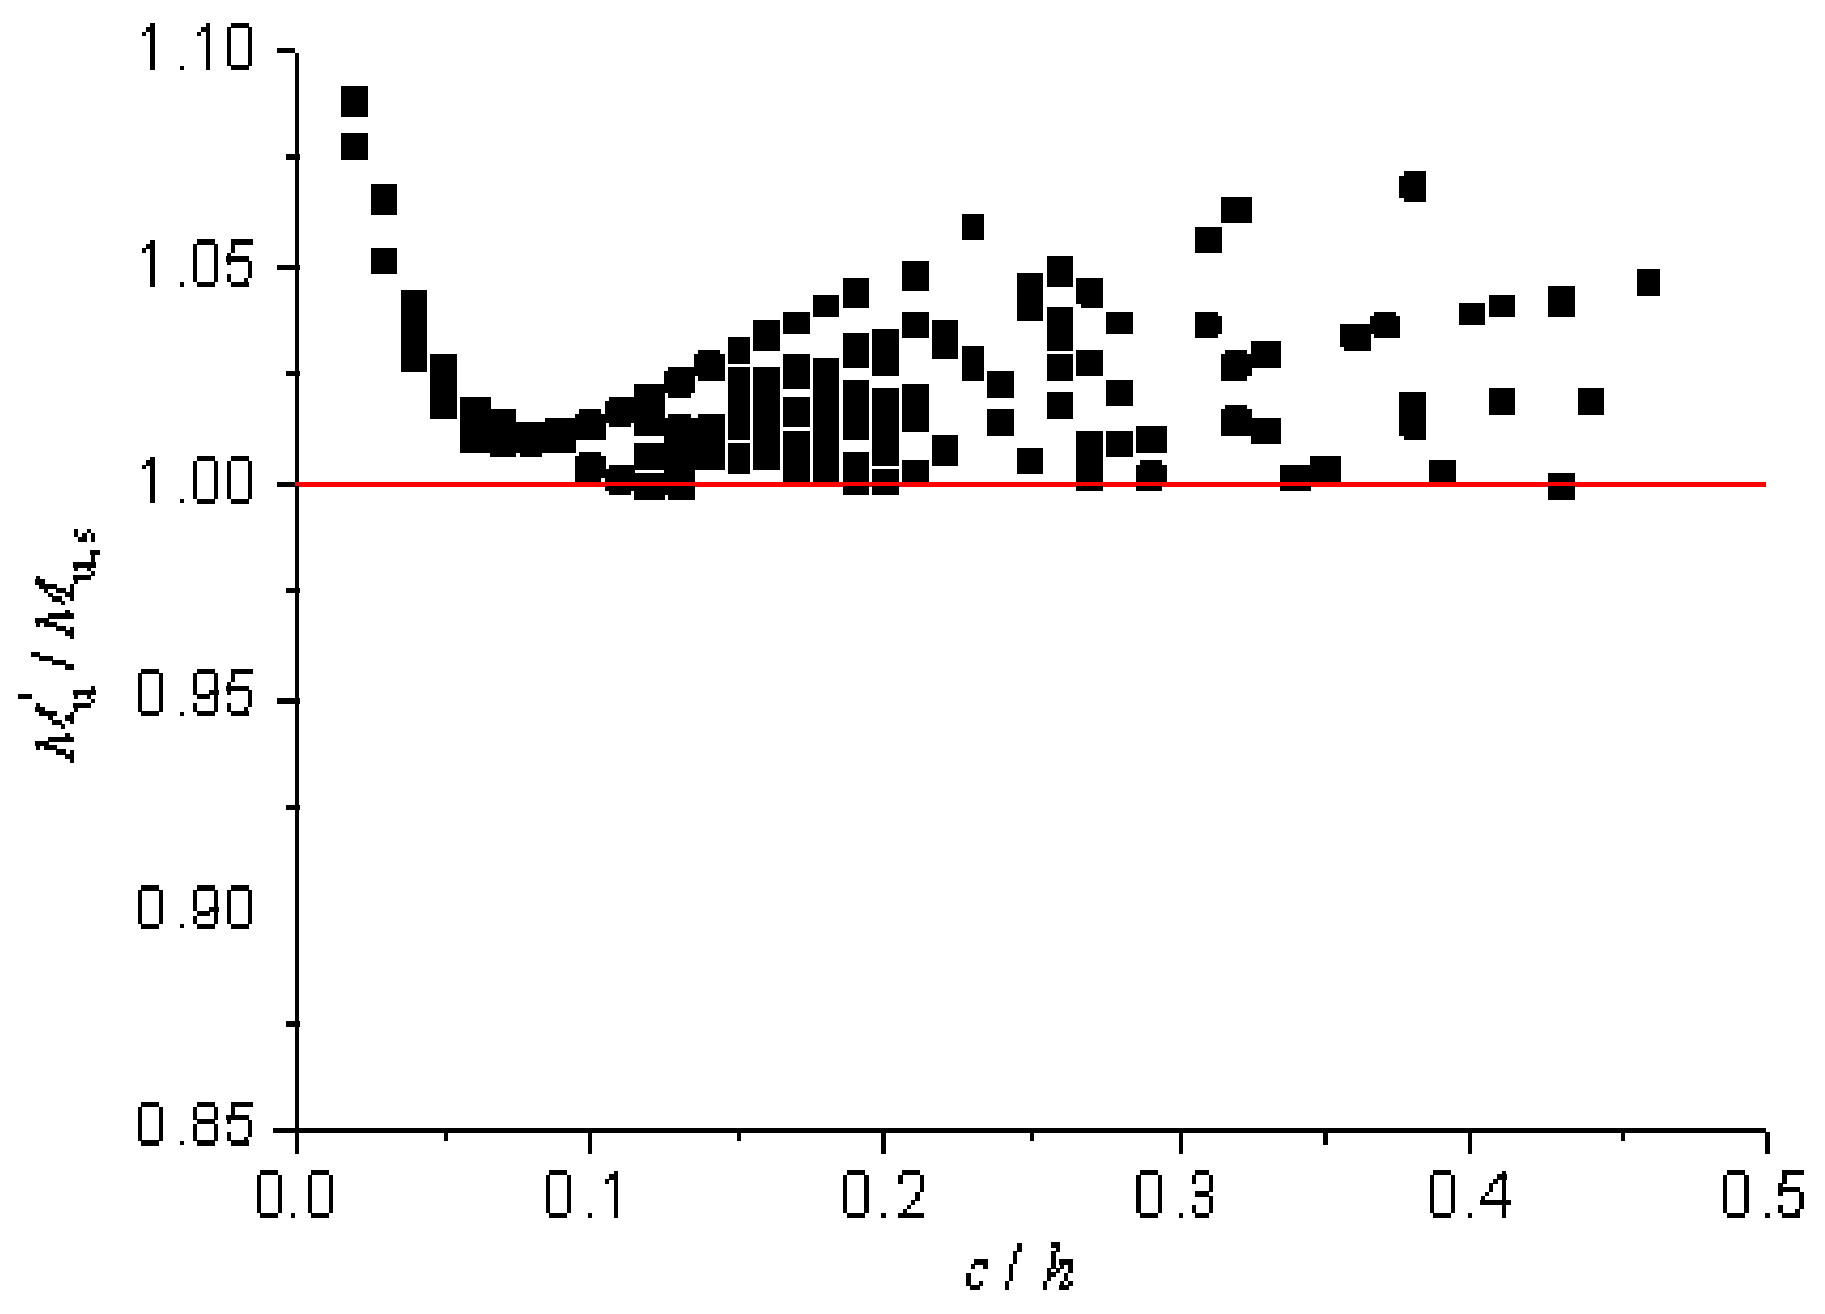
When the strength steel grade is 480 MPa, the modified coefficient γ of the simplified plastic method for ultimate bending strength is calculated by:
Finally, the modified plastic method for calculating the ultimate bending strength is obtained as follows:
The calculated results of the modified plasticity method and material constitutive nonlinear method are compared (
Figure 10). The results demonstrate that ultimate bending capacity obtained by the modified plastic method is not larger than that obtained by the nonlinear method after the introduction of the modified coefficient, and the calculation error of the bending capacity of 96% of the sample beams is within 5%.
To further verify the accuracy and applicability of modified plastic method, the experimental results were compared to the calculation results (
Table 5). It is found that ultimate bending strength of HSS—concrete composite beams calculated by the modified plastic method agree well with the experimental results.
6. Conclusions
The bending tests were performed to study flexural properties of HSS—concrete composite beams. The influence of concrete strength on the failure mode, load-deflection behavior, flexural capacity, and ductility was analyzed. The calculation method for ultimate bending strength was proposed. The following conclusions were reached:
- (1)
The failure mechanism of HSS—concrete composite beams is flexural failure of the steel member and compression fracture of concrete. The HSS—concrete composite beam exhibits good mechanical performance and deformation behavior. The ultimate bending strength and ductility of HSS—concrete composite beams are enhanced with increased concrete strength;
- (2)
The theoretical results indicate that the simplified plastic method overestimates ultimate bending strength of HSS—concrete composite beams. The main reason is that only a small part of the steel beam bottom shows plastic strengthening, which is not enough to make up for the strength loss caused by the steel near the neutral axis failure to yield and relative interface slip. The nonlinear method based on material constitutive model could predict the load bearing capacity accurately;
- (3)
According to the analysis results of the ultimate bending strength of 192 sample beams, the simplified plastic method was modified, and the calculated method for ultimate bending strength was proposed. The predicted results of the proposed modified method agree well with the experimental results.
The present study has a limited scope and focuses solely on analyzing the flexural behavior of HSS—concrete composite beams under a positive bending moment. However, a subsequent paper will undertake a finite element analysis of HSS—concrete composite beams to investigate the effects of several factors such as steel beam strength, shear connection ratios, and concrete slab thickness on their global behavior and failure mechanisms. Furthermore, it is recommended that future research should also explore the flexural performance of HSS—concrete composite beams under a negative bending moment.
Author Contributions
Conceptualization, H.D.; Formal analysis, H.D. and S.Y.; Funding acquisition, H.D.; investigation, H.D.; Writing—original draft, H.D.; Data curation, S.Y. and T.Y.; Software, S.Y.; Visualization, S.Y.; Validation, T.Y.; Resources, T.Y.; Project administration, X.H.; Supervision, X.H.; Writing—review & editing, X.H. All authors have read and agreed to the published version of the manuscript.
Funding
The research was supported by National Natural Science Foundation of China (No. 52208257) and Natural Science Foundation of Colleges and Universities of Jiangsu Province (22KJB560023).
Institutional Review Board Statement
Not applicable.
Informed Consent Statement
Not applicable.
Data Availability Statement
Not applicable.
Conflicts of Interest
The authors declare no conflict of interest.
References
- Bjorhovde, R. Development and use of high performance steel. J. Constr. Steel Res. 2004, 60, 393–400. [Google Scholar] [CrossRef]
- Tanaka, T.; Sakai, J.; Umezaki, M. Experimental study on bending behavior of composite beam using h-sa700a high strength steel: The stress transfer effect of perfobond plate connector. J. Struct. Eng. B 2011, 57, 517–526. [Google Scholar]
- Du, H.; Hu, X.; Shi, D.; Xue, W. Flexural Performance of Composite Beams Using High-Strength Steel and High-Strength Concrete. Int. J. Steel Struct. 2021, 22, 27–41. [Google Scholar] [CrossRef]
- Lam, D.; Lobody, E. Behavior of Headed Stud Shear Connectors in Composite Beam. J. Struct. Eng. 2005, 131, 96–107. [Google Scholar] [CrossRef]
- Du, H.; Hu, X.; Meng, Y.; Han, G.; Guo, K. Study on composite beams with prefabricated steel bar truss concrete slabs and demountable shear connectors. Eng. Struct. 2020, 210. [Google Scholar] [CrossRef]
- Gattesco, N.; Giuriani, E. Experimental study on stud shear connectors subjected to cyclic loading. J. Constr. Steel Res. 1996, 38, 1–21. [Google Scholar] [CrossRef]
- Xue, W.; Ding, M.; Wang, H.; Luo, Z. Static Behavior and Theoretical Model of Stud Shear Connectors. J. Bridg. Eng. 2008, 13, 623–634. [Google Scholar] [CrossRef]
- Kim, J.-S.; Kwark, J.; Joh, C.; Yoo, S.-W.; Lee, K.-C. Headed stud shear connector for thin ultrahigh-performance concrete bridge deck. J. Constr. Steel Res. 2015, 108, 23–30. [Google Scholar] [CrossRef]
- Kruszewski, D.; Zaghi, A.E.; Wille, K. Finite element study of headed shear studs embedded in ultra-high performance concrete. Eng. Struct. 2019, 188, 538–552. [Google Scholar] [CrossRef]
- Cao, J.; Shao, X.; Deng, L.; Gan, Y. Static and fatigue behavior of short-headed studs embedded in a thin ultrahigh-performance concrete layer. J. Bridge Eng. 2017, 22, 04017005. [Google Scholar] [CrossRef]
- Uy, B.; Sloane, R. Behaviour of composite tee beams constructed with high strength steel. J. Constr. Steel Res. 1998, 46, 203–204. [Google Scholar] [CrossRef]
- Nie, J.; Li, H.; Tang, L. Experimental study on high strength steel-concrete composite beams. J. Build. Structures. 2009, 30, 64–69. (In Chinese) [Google Scholar]
- Mans, P.; Yakel, A.J.; Azizinamini, A. Full-Scale Testing of Composite Plate Girders Constructed Using 485-MPa High-Performance Steel. J. Bridg. Eng. 2001, 6, 598–604. [Google Scholar] [CrossRef]
- Hegger, J.; Doinghaus, P. High performance steel and high performance concrete in composite structures. In Proceedings of the Composite Construction in Steel and Concrete IV Conference, Banff, AB, Canada, 25–27 September 2000. [Google Scholar]
- Youn, S.; Bae, D.; Kim, Y.J. Ultimate Flexural Strength of Hybrid Composite Girders Using High-Performance Steel of HSB600. In Proceedings of the International Conference on Composite Construction in Steel and Concrete, Tabernash, CO, USA, 20–24 July 2008; pp. 680–690. [Google Scholar]
- Jun, S.-C.; Lee, C.-H.; Han, K.-H.; Kim, J.-W. Flexural behavior of high-strength steel hybrid composite beams. J. Constr. Steel Res. 2018, 149, 269–281. [Google Scholar] [CrossRef]
- Ban, H.; Bradford, M.A. Flexural behaviour of composite beams with high strength steel. Eng. Struct. 2013, 56, 1130–1141. [Google Scholar] [CrossRef]
- EN 1994-1-1: 2004; Eurocode 4: Design of Composite Steel and Concrete Structures Part 1-1: General Rules and Rules for Buildings. European Committee for Standardization: Brussels, Belgium, 2004.
- ISO6892-1:2016; Metallic Materials-Tensile Testing-Part1: Method of Test at Room Temperature. ISO: Geneva, Switzerland, 2016.
- GB/T 50081; Standard for Test Method of Mechanical Properties on Ordinary Concrete. Standardization Administration of China: Beijing, China, 2016. (In Chinese)
- GB50010: 2010; Code for Design of Concrete Structures. Standardization Administration of China: Beijing, China, 2015. (In Chinese)
Figure 1.
Cross-sectional dimensions of composite beams: (a) cross-section; (b) longitudinal section.
Figure 1.
Cross-sectional dimensions of composite beams: (a) cross-section; (b) longitudinal section.
Figure 2.
Bending test set-up.
Figure 2.
Bending test set-up.
Figure 3.
Measuring points arrangement.
Figure 3.
Measuring points arrangement.
Figure 4.
Failure mechanisms of composite beam HSB1: (a) transverse cracks at concrete slab bottom, (b) longitudinal cracks at concrete slab surface, (c) compression fracture of concrete flange, and (d) flexural failure of steel member.
Figure 4.
Failure mechanisms of composite beam HSB1: (a) transverse cracks at concrete slab bottom, (b) longitudinal cracks at concrete slab surface, (c) compression fracture of concrete flange, and (d) flexural failure of steel member.
Figure 5.
Load-deflection curves of HSS—concrete composite beams.
Figure 5.
Load-deflection curves of HSS—concrete composite beams.
Figure 6.
Strain profile of composite cross-section, (a) specimen HSB1, (b) specimen HSB2, (c) specimen HSCB1, and (d) specimen HSCB2.
Figure 6.
Strain profile of composite cross-section, (a) specimen HSB1, (b) specimen HSB2, (c) specimen HSCB1, and (d) specimen HSCB2.
Figure 7.
Stress distributions of composite beam section. (a) Neutral axis in concrete flange and (b) neutral axis in steel member.
Figure 7.
Stress distributions of composite beam section. (a) Neutral axis in concrete flange and (b) neutral axis in steel member.
Figure 8.
Strain and stress distributions of composite beam section. (a) Neutral axis in concrete flange. (b) Neutral axis in steel top flange. (c) Neutral axis in steel beam web.
Figure 8.
Strain and stress distributions of composite beam section. (a) Neutral axis in concrete flange. (b) Neutral axis in steel top flange. (c) Neutral axis in steel beam web.
Figure 9.
Comparisons of calculated results from simplified plastic method and nonlinear method.
Figure 9.
Comparisons of calculated results from simplified plastic method and nonlinear method.
Figure 10.
Comparison between the calculated results from modified plastic method and nonlinear method.
Figure 10.
Comparison between the calculated results from modified plastic method and nonlinear method.
Table 1.
Main parameters of composite beams.
Table 1.
Main parameters of composite beams.
| Test Specimen | Steel Beam (mm) | Concrete Slab Width (mm) | Concrete Slab Thickness (mm) | Concrete Grade |
|---|
| Height | Width | Web Thickness | Flange Thickness |
|---|
| HSB1 | 250 | 150 | 8 | 8 | 900 | 100 | C25 |
| HSB2 | 250 | 150 | 8 | 8 | 900 | 100 | C45 |
| HSCB1 | 250 | 150 | 8 | 8 | 900 | 100 | C65 |
| HSCB2 | 250 | 150 | 8 | 8 | 900 | 100 | C80 |
Table 2.
Concrete mix proportion.
Table 2.
Concrete mix proportion.
| Concrete Strength | Cement
(kg/m3) | Water
(kg/m3) | Sand
(kg/m3) | Coarse Aggregate
(kg/m3) | Water-Reducing Agent
(kg/m3) |
|---|
| C25 | 295.1 | 133.3 | 730.9 | 1242.5 | 0 |
| C45 | 336.8 | 130.1 | 727.6 | 1195.6 | 0 |
| C65 | 366.2 | 102.3 | 710.9 | 1220.6 | 3.662 |
| C80 | 540.5 | 104.5 | 735.3 | 1019.7 | 5.405 |
Table 3.
Bending test results of composite beams.
Table 3.
Bending test results of composite beams.
| Test Specimen | Mcr (kN·m) | My (kN·m) | Mu (kN·m) | δy (mm) | δu (mm) | δu/δy | Failure Mode |
|---|
| HSB1 | 217.5 | 281.3 | 341.3 | 19.86 | 35.42 | 1.78 | FS |
| HSB2 | 120.0 | 292.5 | 378.8 | 21.75 | 45.81 | 2.11 | FS |
| HSCB1 | 270.0 | 307.5 | 408.8 | 21.14 | 49.38 | 2.34 | FS |
| HSCB2 | 232.5 | 315.8 | 423.8 | 21.31 | 59.47 | 2.79 | FS |
Table 4.
Comparison between experimental and theoretical results of ultimate bending strength.
Table 4.
Comparison between experimental and theoretical results of ultimate bending strength.
| Reference | Specimen | Test Mu,t
(kN·m) | Simplified Plastic Method | Nonlinear Method |
|---|
| Mu,s (kN·m) | Mu,s/Mu,t | Mu,n (kN·m) | Mu,n/Mu,t |
|---|
| This paper | HSB1 | 341.3 | 353.3 | 1.04 | 343.7 | 1.01 |
| HSB2 | 378.8 | 400.8 | 1.06 | 388.3 | 1.03 |
| HSCB1 | 408.8 | 419.2 | 1.03 | 411.7 | 1.01 |
| HSCB2 | 423.8 | 428.4 | 1.01 | 425.0 | 1.00 |
| Nie et al. [12] | SCB35 | 153.6 | 157.1 | 1.02 | 151.4 | 0.99 |
| SCB36 | 154.1 | 160.4 | 1.04 | 156.3 | 1.01 |
| SCB37 | 173.1 | 163.3 | 0.94 | 162.8 | 0.94 |
| SCB38 | 167.9 | 166.7 | 0.99 | 167.1 | 1.00 |
| SCB39 | 180.9 | 181.2 | 1.00 | 175.9 | 0.97 |
| SCB40 | 177.5 | 187.4 | 1.06 | 182.9 | 1.03 |
| SCB41 | 193.4 | 193.7 | 1.00 | 186.5 | 0.96 |
| SCB42 | 184.6 | 198.4 | 1.07 | 193.9 | 1.05 |
| Mans et al. [13] | POS1 | 5304.3 | 5351.8 | 1.01 | 5357.3 | 1.01 |
| POS2 | 4368.7 | 4286.1 | 0.98 | 4325.1 | 0.99 |
| Youn et al. [15] | H1 | 1346.9 | 1427.7 | 1.06 | 1387.3 | 1.03 |
| H2 | 1865.4 | 1753.5 | 0.94 | 1790.8 | 0.96 |
| Means | 1.02 | | 1.00 |
| Coefficient of variation (%) | 0.038 | | 0.029 |
Table 5.
Comparison between experimental and theoretical results of modified plastic method.
Table 5.
Comparison between experimental and theoretical results of modified plastic method.
| Reference | Specimen | Test Mu,t (kN·m) | (kN·m) | /Mu,t |
|---|
| This paper | HSB1 | 341.3 | 324.0 | 0.95 |
| HSB2 | 378.8 | 380.8 | 1.01 |
| HSCB1 | 408.8 | 404.9 | 0.99 |
| HSCB2 | 423.8 | 417.3 | 0.98 |
| Nie et al. [12] | SCB35 | 153.6 | 152.9 | 1.00 |
| SCB36 | 154.1 | 157.4 | 1.02 |
| SCB37 | 173.1 | 161.4 | 0.93 |
| SCB38 | 167.9 | 166.3 | 0.99 |
| SCB39 | 180.9 | 173.6 | 0.96 |
| SCB40 | 177.5 | 181.9 | 1.02 |
| SCB41 | 193.4 | 190.6 | 0.99 |
| SCB42 | 184.6 | 194.5 | 1.05 |
| Mans et al. [13] | POS1 | 5304.3 | 5354.6 | 1.01 |
| POS2 | 4368.7 | 4325.1 | 0.99 |
| Youn et al. [15] | H1 | 1346.9 | 1357.7 | 1.02 |
| H2 | 1865.4 | 1764.6 | 0.95 |
| | Means | | 0.99 |
| | Coefficient of variation (%) | | 0.031 |
| Disclaimer/Publisher’s Note: The statements, opinions and data contained in all publications are solely those of the individual author(s) and contributor(s) and not of MDPI and/or the editor(s). MDPI and/or the editor(s) disclaim responsibility for any injury to people or property resulting from any ideas, methods, instructions or products referred to in the content. |
© 2023 by the authors. Licensee MDPI, Basel, Switzerland. This article is an open access article distributed under the terms and conditions of the Creative Commons Attribution (CC BY) license (https://creativecommons.org/licenses/by/4.0/).


