Article

Numerical Simulation Analyses on Envelope Structures of Economic Passive Buildings in Severe Cold Region

1
College of Economics and Management, Heilongjiang Institute of Technology, Harbin 150050, China
2
Harbin Sayyas Windows Co., Ltd., Harbin 150137, China
3
Veolia (Harbin) Heat Power Co., Ltd., Harbin 150086, China
4
School of Mechanical & Power Engineering, Harbin University of Science and Technology, Harbin 150080, China
*
Author to whom correspondence should be addressed.
Buildings 2023, 13(4), 1098; https://doi.org/10.3390/buildings13041098
Submission received: 9 March 2023 / Revised: 6 April 2023 / Accepted: 18 April 2023 / Published: 21 April 2023
(This article belongs to the Special Issue Climate Change and Building Energy Efficiency)

Abstract

:
The present study provides comprehensive analyses of a newly constructed passive energy-efficient building located in Harbin, China, which is a prime example of how to design a passive building that withstands the severe cold climate in northeast Asia. Conduction transfer functions of heat flux equilibrium are employed to simulate energy consumption characteristics of the paradigm passive building. The climatic conditions in severe cold region are analyzed, and the energy-saving designs in the studied engineering cases are summarized for their practical applications. Building physical models are established to perform numerical simulation analyses on the passive building paradigm in northeast Asian frigid zone. The dominant technical parameters of envelope structure affecting energy consumption in severe cold region, including thermal insulation thickness and heat transfer coefficient of building envelope, as well as window-to-wall ratio for each building facade, are taken into consideration as simulation variables to calculate cooling load, heating load, electricity consumption, and CO2 emission, which account for energy efficiency of passive buildings. The simulation results demonstrate the high energy-saving potential of the proposed passive building design and render the optimal energy-efficient parameters suitable for severe cold regions, which can reduce energy consumption and CO2 emission while ensuring comfort for occupants. The present study provides a theoretical reference for envelope structures of passive buildings in severe cold regions, which is of great significance to the development of green buildings and relevant policies.

1. Introduction

Passive building design has gained popularity due to its potential for reducing energy consumption and environmental impact. In severe cold regions, optimizing the passive building envelope structure is crucial for achieving energy efficiency and indoor thermal comfort. This optimization process often involves a combination of simulation and experimentation. Recent studies have investigated the thermal performances of various insulation materials, window types, and phase change materials (PCMs) for building envelopes in cold regions. For example, vacuum insulation panels (VIPs) and aerogels have been shown to significantly reduce heat loss [1,2,3,4]. The use of PCMs in building envelopes can reduce energy consumption by efficiently storing and releasing energy [5,6,7,8]. Low-emissivity coatings applied to double- and triple-pane windows are highly competent in reducing heat loss [9,10]. However, it is important to balance natural ventilation with the need for thermal insulation in order to achieve optimal thermal performance [11].
Improving air-tightness in building envelopes is preferable for significantly reducing energy consumption in cold regions. Numerical simulation studies indicate that air-tightness has a significant impact on energy consumption and can evidently reduce heat loss of residential buildings in cold regions, particularly in climate conditions with high wind speeds [12,13]. The use of air-tight membranes and tapes has also been verified to be capable of reducing air leakage in building envelopes [14,15,16]. Optimization algorithms have been successfully applied to improve thermal performances of building envelope components such as insulation materials and windows in cold regions. A genetic algorithm has been used to optimize the insulation thickness and type of building envelopes in cold regions [17]. Another study used NSGA-II to optimize the thermal and structural performances of building envelopes in a cold region [18]. TRNSYS has also been employed for building energy simulations and optimizations in cold regions [19,20,21].
In addition, the use of renewable energy sources, such as solar and geothermal energy, has been investigated as a means of reducing heating demand in cold regions [22,23]. It was also noted that building orientation and shape should first be considered in optimal designs for improving thermal insulation performances of building envelopes in cold regions [24,25,26]. Outdoor shading devices, such as overhangs and louvers, have also attracted great attention in recent days in terms of promoting energy efficiency of passive buildings in cold regions [27,28]. Overall, recent reports highly suggest that analyzing and optimizing envelope structures for passive buildings is the necessary and promising approach to achieving energy efficiency, a sustainable environment, and indoor thermal comfort in severe cold regions. Further research is needed to identify the most effective strategies for optimizing building envelope structure in this context.
In China, passive buildings, such as low-energy and comfortable living buildings, have rapidly emerged recently and become the mainstream trend of future development in Chinese construction industry. However, due to its short development time, most Chinese passive buildings are now conforming to German strategy standards. Especially, due to the vast territory and the complexity of climate conditions of China’s areas, there is a significant discrepancy in severe cold regions between China and Germany, and they are quite different in terms of practical heat loads and application of technical parameters of building enclosure structures. Therefore, with regard to the immature construction technology of low-energy buildings and the imperfect relevant policies, the present study is based on the standpoint of enclosure structure strategy for Chinese passive buildings in severe cold regions. We systematically analyze the key technical parameters of enclosure structures and render the optimizing schemes to minimize energy consumption under severe cold climate conditions, which will enrich the design theory of passive buildings and promote further development of energy-saving and green buildings.

2. Passive Building Case

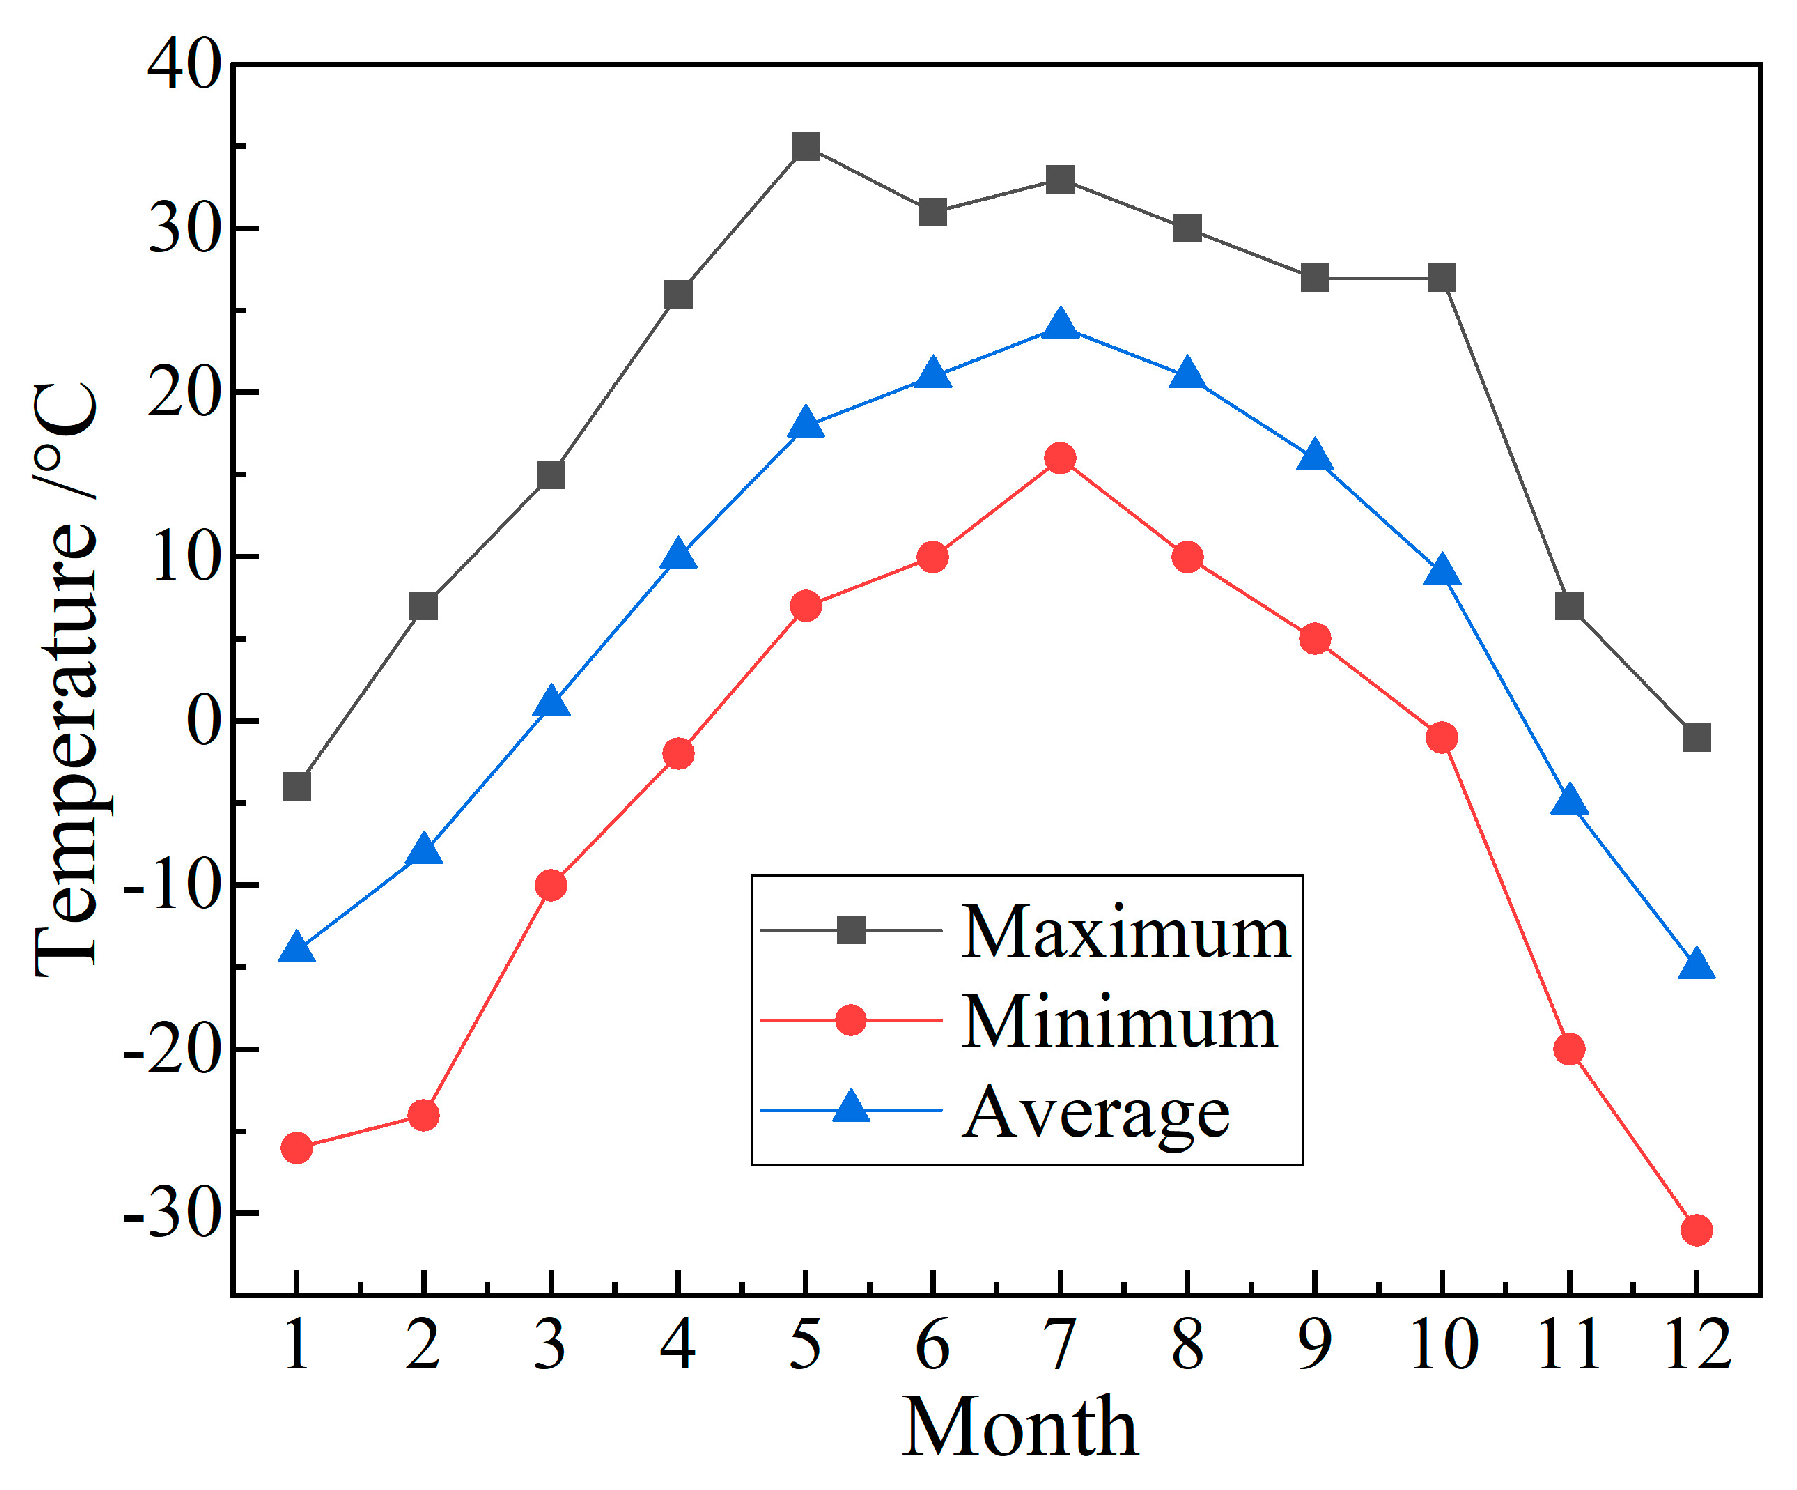
2.1. Climate Analyses on Severe Cold Region of China

Humans have adapted to the environment through buildings in order to survive, and energy-efficient buildings can minimize the impact of climate conditions on all aspects of human life. When designing buildings in severe cold regions, the building’s thermal insulation in winter should be the focus. China has a vast land area and a complex climate and thus is divided into five climate regions according to the design specifications of building thermal engineering. The severe cold region in China is represented by Harbin city with four distinct seasons: a long winter with low temperatures, a relatively short and comfortable summer, and spring and autumn with quick temperature changes and short transitions. Harbin city has the typical weather characteristics of severe cold regions, with a long cold winter and a short comfortable summer, where the average outdoor temperature approaches 4.5 °C throughout the year with a large temperature difference, as shown in Figure 1.
Harbin city, with an average temperature below zero for most of the year, has a summer average temperature of ~20 °C between June and August, with the hottest month averaging 23 °C and the coldest month being January with an average temperature of −18.8 °C. Harbin winters are characterized by rapid cooling, large temperature range, and long duration, with the lowest temperature reaching −30 °C. In Harbin winter, central heating is necessary to ensure human body comfort, while in summer, keeping in human body comfortable temperature range without using large auxiliary refrigeration equipment.

2.2. Energy-Saving Measures of Passive Building

Taking the passive building in Harbin city as the research object, as shown in Figure 2, the passive building is located in Shuangcheng district of Harbin city, which is representative of severe cold regions. The building is a typical office building with a flat roof, divided into two floors composed of an exhibition hall, meeting rooms, offices, canteens, and a bathroom. The total building area is 5025.74 m2, the first-floor area is 2683.58 m2, the second-floor area is 2464.37 m2, and the building height is 9 m, as shown in Table 1 for the individual area for each functional division.
It takes full account of thermal insulation in this passive building by using an ultra-insulating honeycomb wall system with dedicated P160 passive doors and windows, high-efficiency ventilation systems, and other ecological systems as energy-saving measures. These measures not only safeguard human needs but also highly improve comfort and reduce building energy consumption. The exterior wall insulation of this passive building utilizes an open curtain structure and extruded polystyrene insulation material, with graphite polystyrene board as the insulation layer, added with a fire-proof isolation band and thermal insulation sealant. To reduce thermal bridge of building envelope, the connection hardware adopts thermal insulation materials to make the heat transfer coefficient of exterior walls less than 0.1 W/(m2·K). In addition, the insulation materials used for roof are the same as that for exterior walls.
The building exterior windows adopt a three-layer two-cavity or four-layer three-cavity insulating glass system combined with low-emissivity (low-E) glass and a 95% argon gas-filled hollow part to avoid low-E film oxidization and sufficiently reduce air convection and sound noise. Warm edge spacer bars are built in the connection between glass and window frames, and molecular sieves are filled in the gaps. The window frame adopts an aluminum-enclosed wooden form and is connected by a tenon structure without extra hardware causing heat leakage. Sealed strips are used to insulate heat transfer and keep warm at the joint between window frame and glass subsystems. Aluminum frames are all welded seamlessly with patented technology to prevent the heat bridge and increase air-tightness. As a result, the heat transfer coefficient of the entire window is less than 0.8 W·m−2·K−1.
In this passive building, the rotary heat recovery method is employed to acquire the heat recovery efficiency of >75% and the new airflow of >5000 m³/h. In order to ensure safe operation, preheating systems with low-temperature-resistant media are adopted for new air. The transparent curtain wall is also equipped with professional slides for external shading. Other ecological energy efficiency measures such as a renewable energy system, photovoltaic integration, rainwater reuse, and waste disposal are also implemented.

3. Computational Methodology and Physical Model

3.1. Computational Methodology

The application of building thermal balance is more extensive than the weighted coefficient method with a more complicated calculating process, while the calculation results are more accurate. Building thermal balance mainly comprises thermal equilibrium from the inner and outer surface of the building, through which the indoor cooling and heating load under air thermal equilibrium can be solved as [29]:
i = 1 n q i r A i + Q other Q heat extraction = ρ V room C p Δ T Δ t
Q ( t ) = i = 1 m A i h i ( T i ( t ) T r ( t ) ) + m ( t ) C p ( T 0 ( t ) T r ( t ) ) + Q s ( t )
q i ( t ) = h i ( T r ( t ) T i ( t ) ) + i = 1 n h r i k ( T r ( t ) T i ( t ) ) + R i
where qir represents flow heat transfer through i-th interior surface; Ai refers to the area of interior surface i; ρ denotes air density; Vroom represents room volume; t denotes time; Ti(t) represents the temperature of interior surface i at moment t; T0(t) is the temperature of building exterior surface at moment t; ΔT stands for the change of indoor temperature; Cp is the specific heat capacity at constant pressure; qi(t) denotes heat transfer of interior surface i at moment t; hi refers to heat transfer coefficient of interior surface i; hrik stands for the radiation heat transfer coefficient between interior surfaces of i and k; Ri indicates the radiation absorption capacity of interior surface i; Qs(t) symbolizes indoor heat generation at moment t; Q(t) stands for cooling load at moment t; m(t) denotes the amount of fresh air intake at moment t.
Thermal balance of building walls can be calculated using conduction transfer functions (CTF). According to the typical turbulent effect on the load, the Z transfer function H(z) is calculated to output parameter Y(z) at each moment, and then the thermal balance relationship between heat flux and temperature is solved as follows:
H ( z ) = Y ( z ) U ( z ) = b 0 + b 1 z 1 + b 2 z 2 + b 3 z 3 + + b n + 1 z ( n + 1 ) 1 + d 1 z 1 + d 2 z 2 + d 3 z 3 + + d n + 1 z ( n + 1 )
Y ( z ) = i = 0 n b i U ( n i ) i = 0 n d i Y ( n i )
q k i ( t ) = X T i , t j = 1 n z Z j T i , 1 j + X T 0 , 1 + j = 1 n z Y j T 0 , 1 j + j = 1 n q Φ j q 0 , 1 j
where X, Yj, and Zj represent the CTF coefficients of surface layer, middle layer, and inner surface, respectively; Φj refers to the CTF coefficient of heat flux; q0 and qki signify the heat flux of outer and inner layers, respectively.

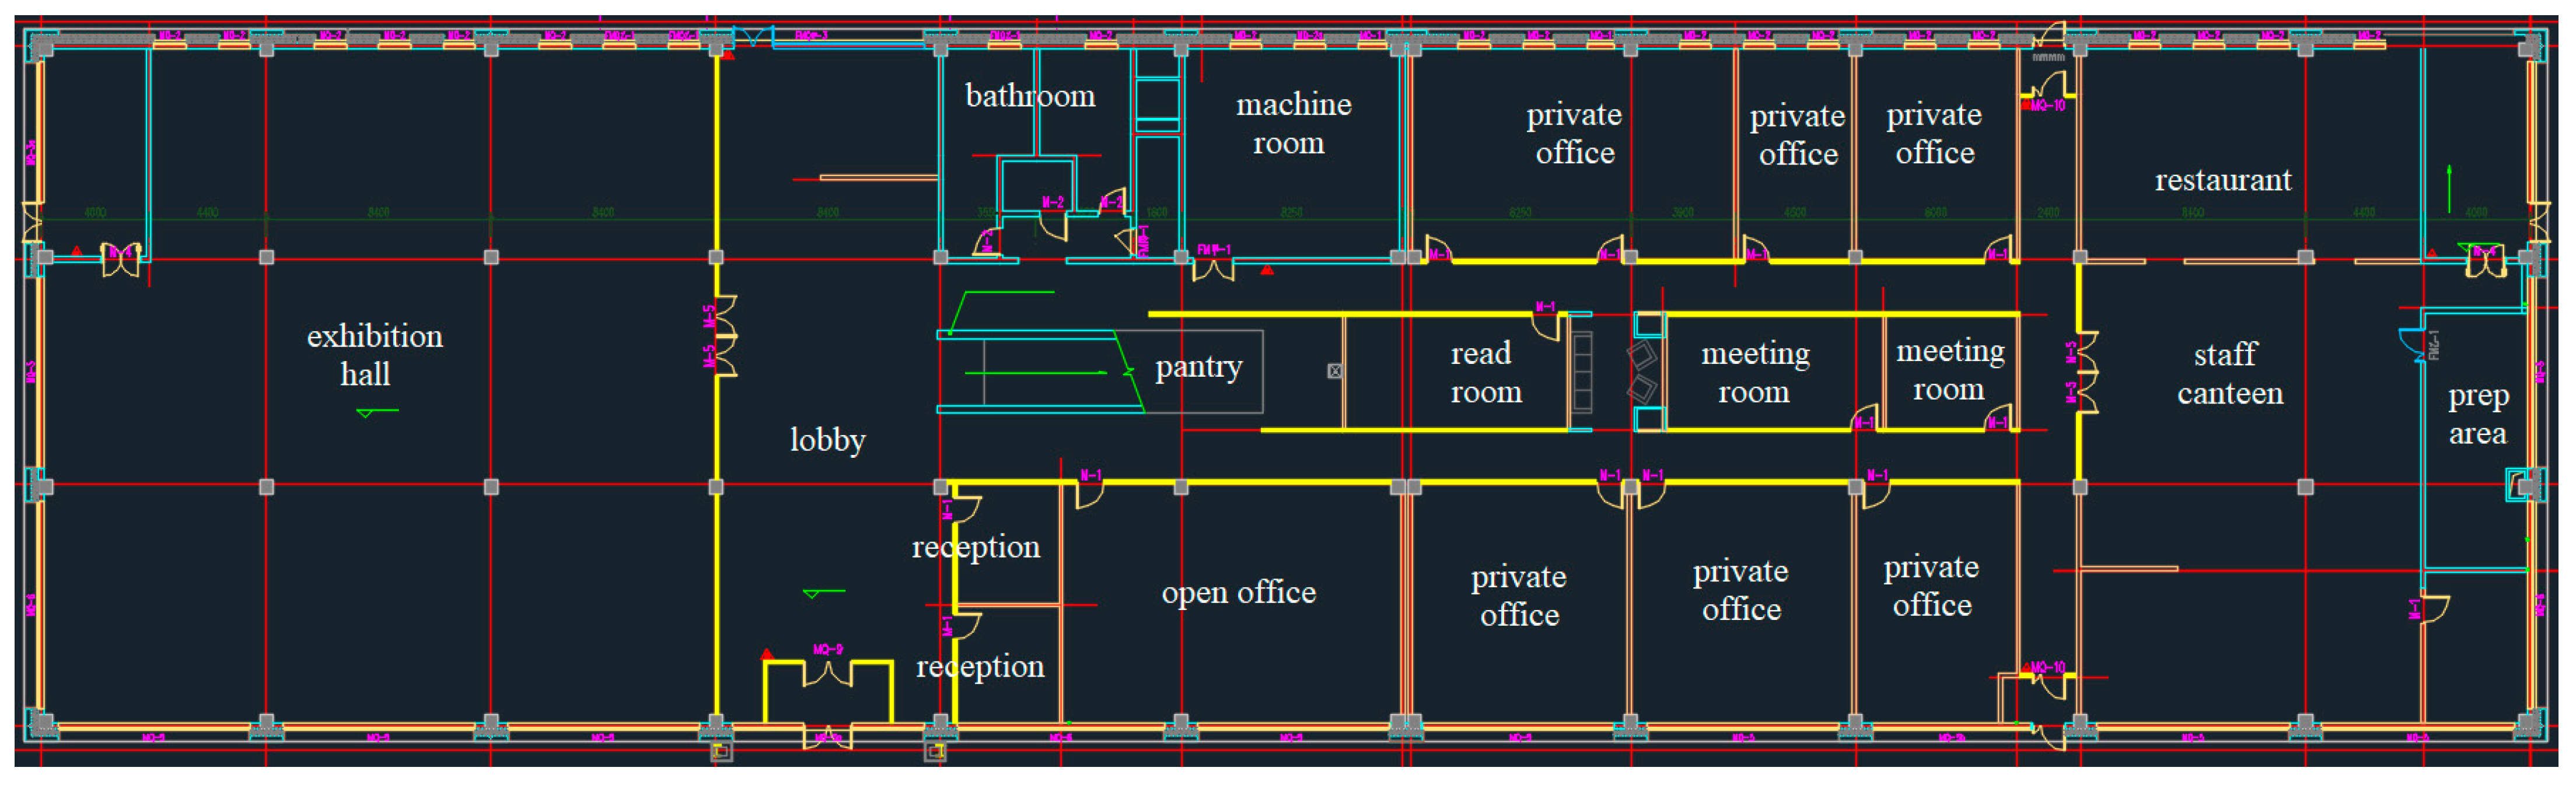
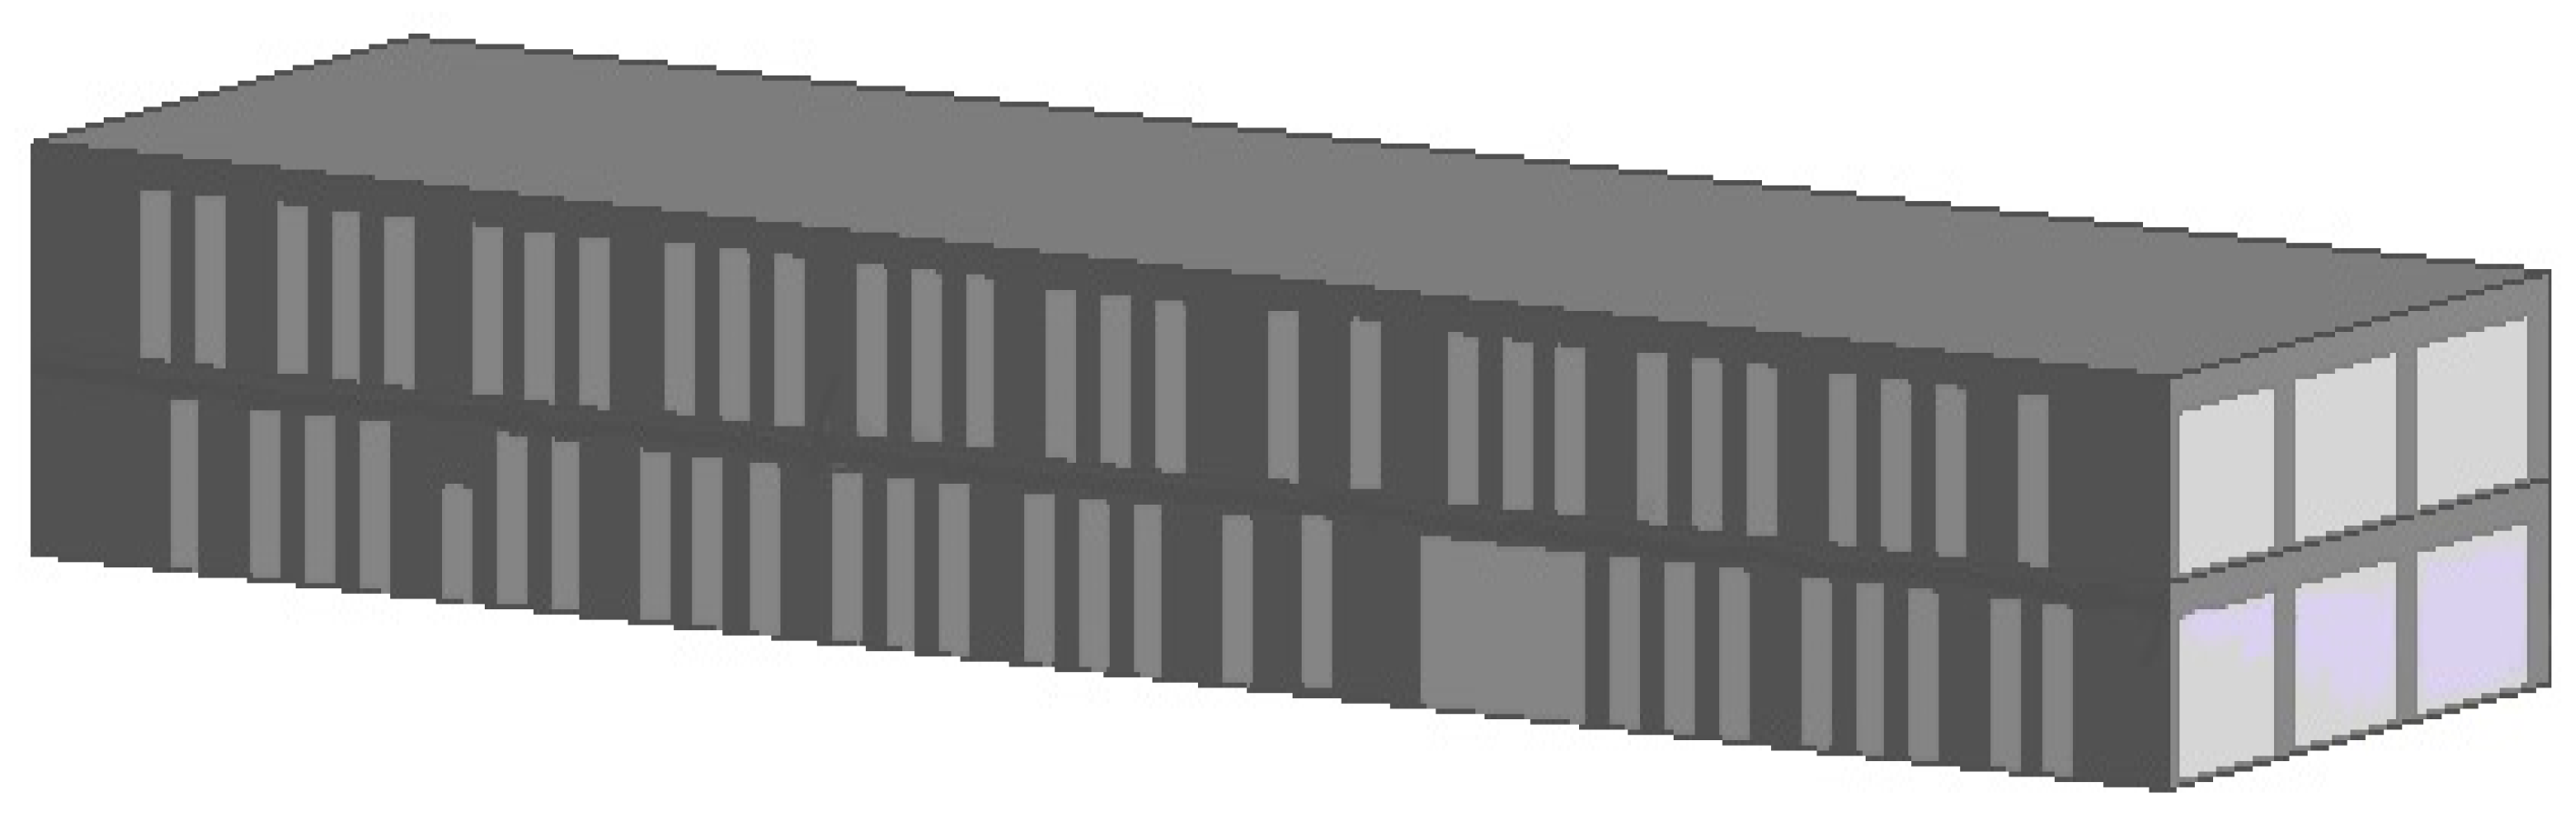
3.2. Passive Building Physical Model

In the present study, we use building design software—Design Builder (V7, Designbuilder Software Limited, Stroud, UK) to model and calculate the energy consumption of the present researched passive building in severe cold region. A uniform flat roof, north-south glass curtain walls, and large numbers of small-sized glass windows are applied to establish the passive building, as illustrated in Figure 3. The north-facing offices and meeting rooms are relatively small, whereas the south-facing offices are bigger with two reception rooms where relatively larger-scaled glass curtain walls are adopted for maximum inward light capture, meanwhile, adjustable external sunshade louvers are installed outside.
Passive building thermal design parameters are mainly derived from the domestic public building energy conservation building standards and near-zero energy building technology guidelines (GB50189-2015). Indoor thermal and humidity environment parameters include indoor temperature, humidity, and other parameters, the value of which is closely related to the indoor comfort level, building energy consumption, etc., and should meet the higher thermal comfort level, as indicated by the specific setting values in Table 2. The basic parameters of lighting density, electrical equipment power, etc. are selected according to the energy-saving design standard of public buildings, as listed in Table 3. Initial parameters for the enclosure structure are specified based on the comprehensive consideration of the energy-saving design standards for public buildings and the guidelines for passive building technology, as listed in Table 4. Building air tightness usually refers to the ability of buildings to prevent air infiltration under closed conditions, which is represented by the ventilation frequency under a pressure difference of 50 Pa between indoors and outdoors. According to the current Chinese building standards, the window air-tightness level of passive buildings should be greater than or equal to level 8, and the window water-tightness level should be greater than or equal to level 6. Thus, for the studied passive building case, the actual air infiltration of 1.0 m3/(m2·h) during regular use and the air ventilation rate of 0.1 h−1 supplied by the mechanical ventilation system comply with the required building standard that should be lower than 1.5 m3/(m2·h) and 0.6 h−1, respectively. In passive buildings, high-efficiency fresh air heat exchange systems should be adopted, the heat exchange efficiency of which should not be lower than 75%, and the purification efficiency of air purification equipment for the particulates such as haze should be higher than 80%.

3.3. Validation for Simulation Method

To validate the accuracy of our simulation method, we have simulated a low-energy demonstration building in Shenyang city (which is also a cold region in China) to calculate its indoor and outdoor temperature and power consumption [30]. The comprehensive heat transfer coefficients of exterior walls, roof, and exterior windows with a triple-pane hollow glass structure are specified as 0.099 W/(m2·K), 0.09 W/(m2·K), and 1.0 W/(m2·K), respectively. In comparing the present simulation and the literature-reported measurement, as shown in Table 5, it is indicated that the differences between the simulation results and the measured data are minimal: the errors of average indoor temperature and power consumption are lower than 2 °C and 12%, respectively, which demonstrates the effectiveness and reliability of the simulation method we adopted for passive buildings in severe cold regions.

4. Results and Discussion

4.1. Energy Consumption Characteristics

Based on the actual building as a reference to establish a physical model, Figure 4 shows the physical model of the building facing south and east. Harbin city belongs to a severe cold region, and October each year to May of the following year is selected as the heating period, July to September as the cooling period, and June as the transition period. During the transition period, passive measures such as natural ventilation and outdoor shading can meet human comfort without mechanical heating and cooling. The energy consumption, peak load, and CO2 emission of the reference passive building are calculated, with the results being listed in Table 6.
In severe cold regions, under the maximum applicable thermal transmission coefficient of enclosure structure, the overall energy consumption of the heating period is greater than that of the cooling period, and the peak load appears when the indoor and outdoor temperature difference is 55.8 °C, causing the building load difference of 72.91% between cooling and heating periods. Simultaneously, the electricity used by buildings in the heating period is greater than that in the cooling period. As for the heat gain and loss of buildings, the heat gain accounts for up to 41.5%, which is the largest portion of overall energy consumption, mostly because of the significant heat transfer of the building envelope and the unavoidable penetration of gaps in the envelope structure. Furthermore, the contribution rate from transmission and ventilation heat losses to the total heating load approaches 34.7%. Due to large areas of windows and curtain walls in building, the heat radiation from windows accounts for 16.84% of the cooling load, but the overall daylighting effect is obvious, and the energy consumed by lighting fixtures is small, as shown in Figure 5. In addition, there are many office areas in this passive building, thus the energy consumption of equipment is lower than that of exterior window irradiation by 3.09% in the percentage of the total energy consumption.

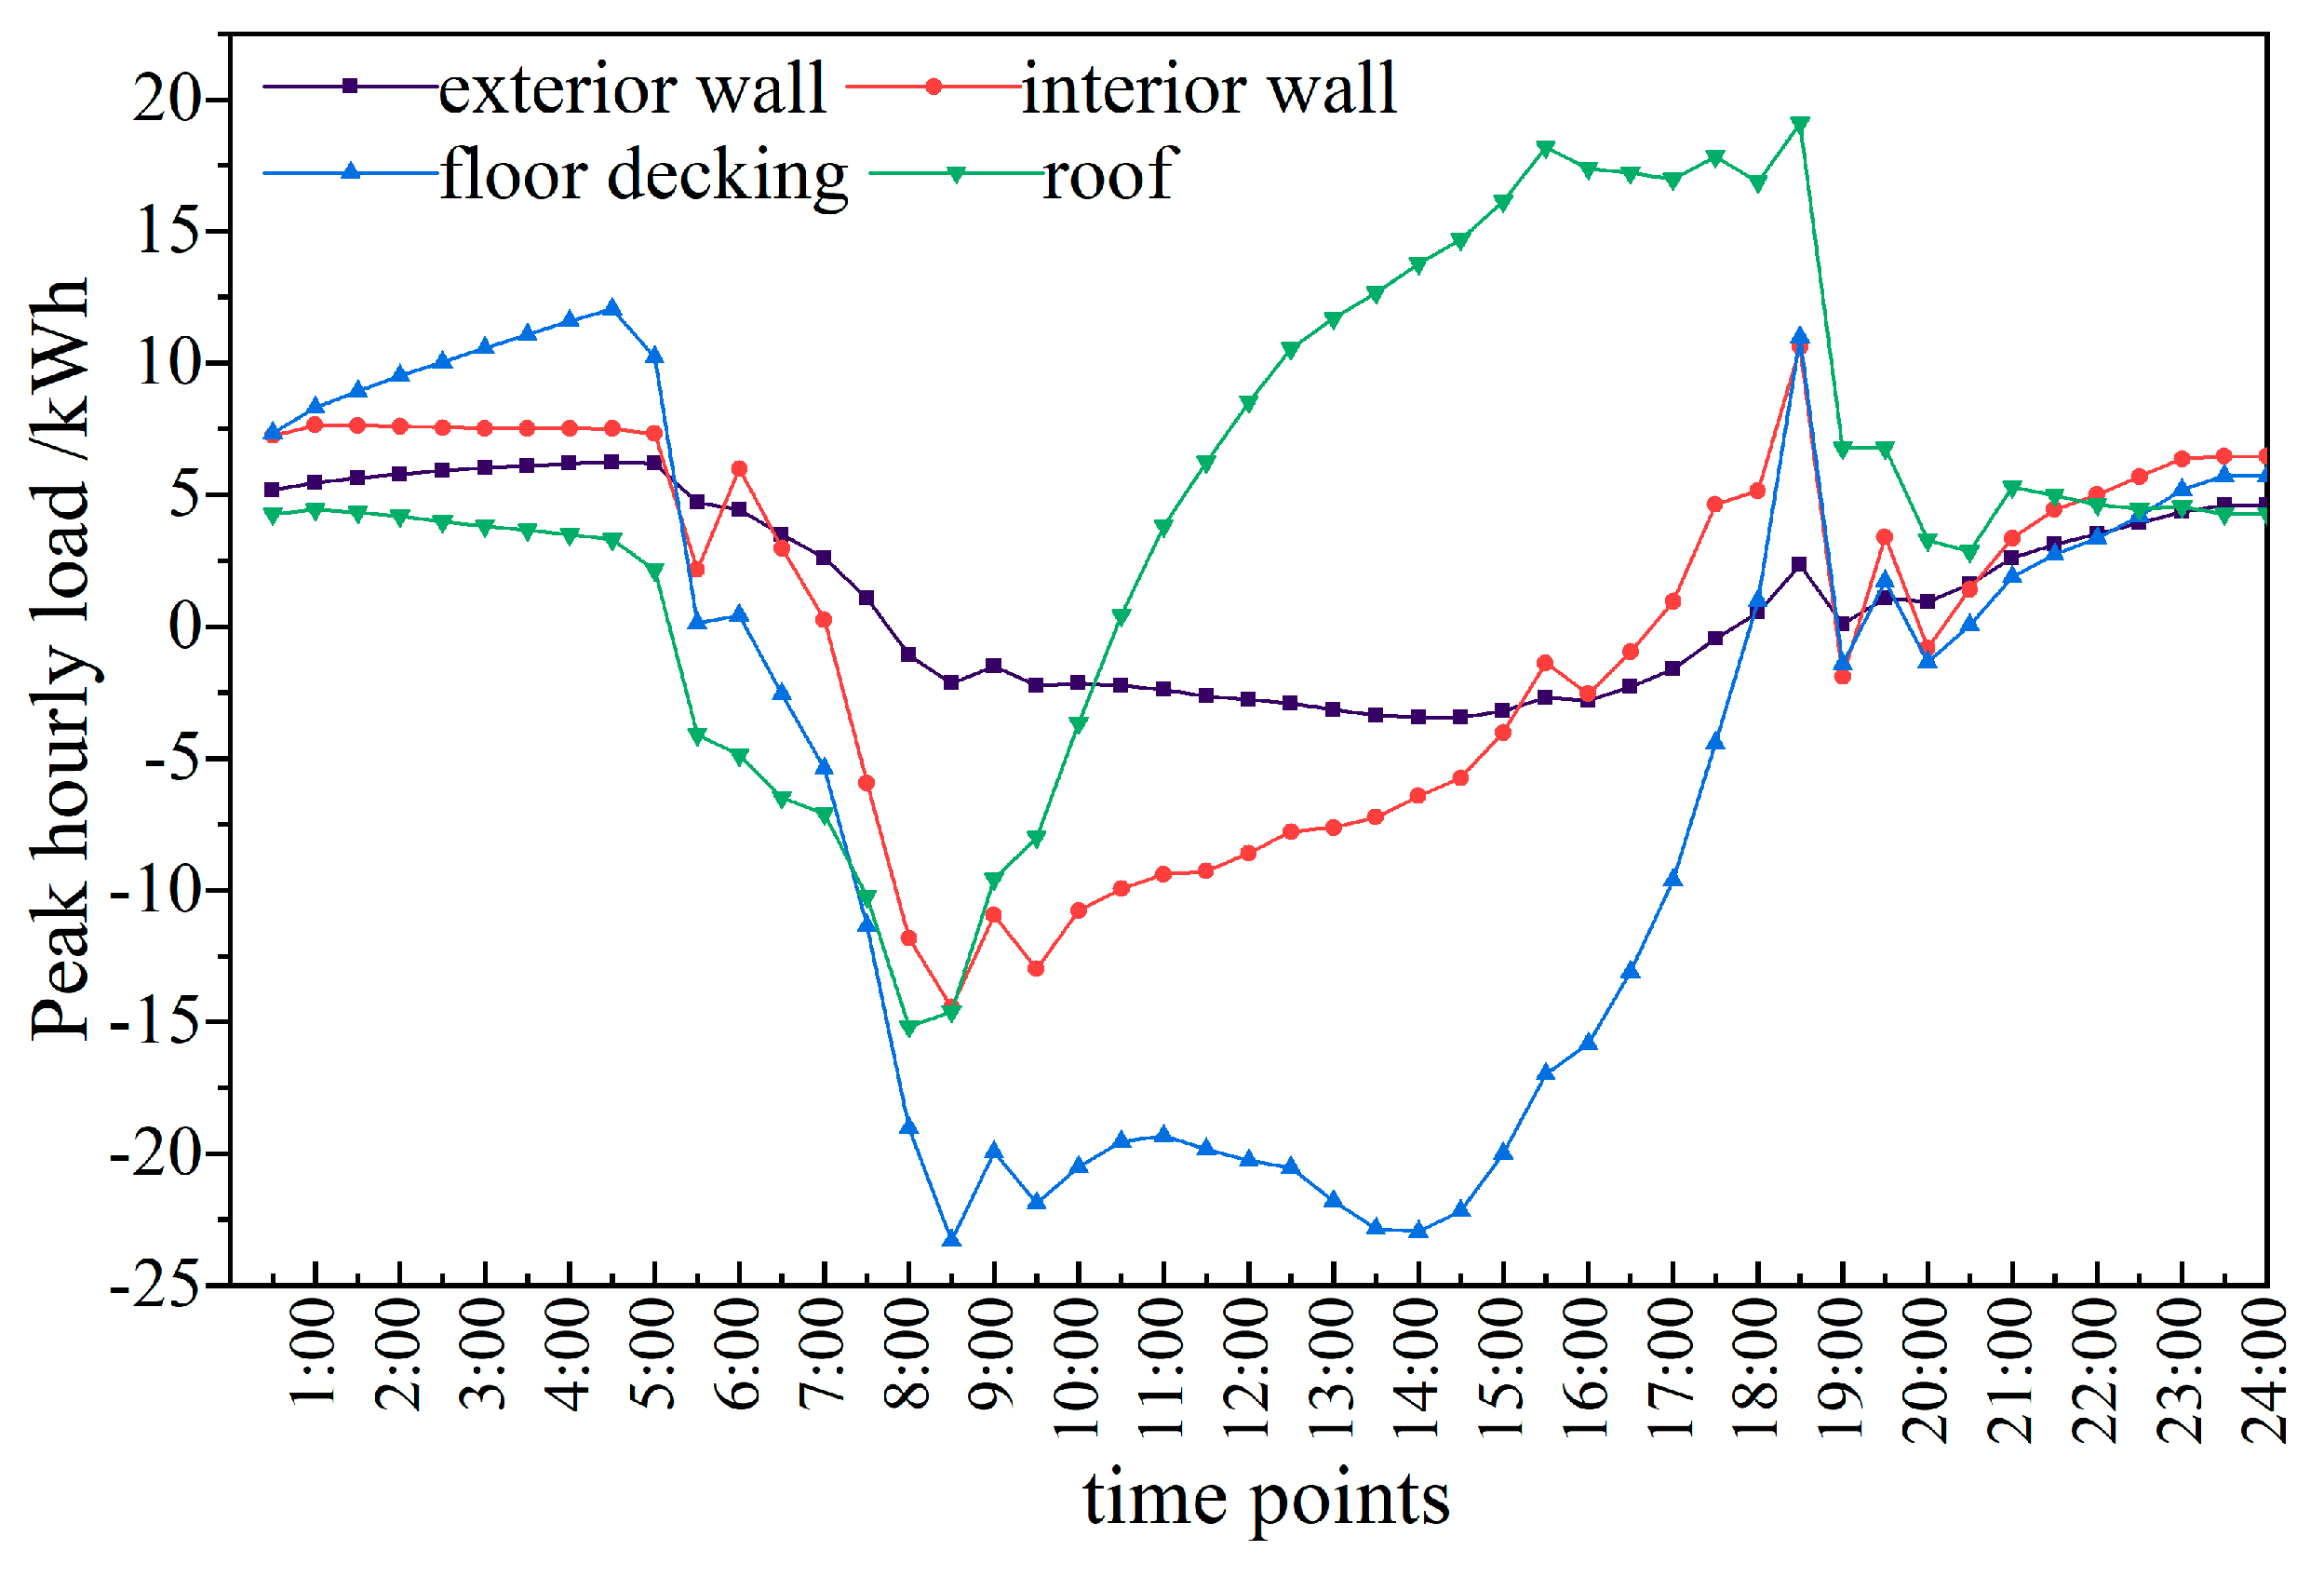
4.2. Energy Consumption of Non-Transparent Envelope Structure

Non-transparent enveloping structures of a building can be further divided into exterior walls, interior walls, roof, floor decking, etc. They are the main structures that prevent heat exchange between the building and outside. In terms of the reference building load, the energy consumption for different enveloping structures is different in both the heating season and the cooling season. During the cooling season, the hourly load does not change dramatically and the hourly load of the various enveloping structures changes similarly because the personnel movement in office buildings is small at night and the temperature requirement for indoor cooling is relatively low. The hourly load changes of roofs are more prominent, and the floors and internal walls have higher thermal coefficients than exterior walls, leading to more severe heat loss. In terms of the overall envelope load, the load ranks from high to low are roofs, exterior walls, floors, and interior walls. The loads of floors and exterior walls in the heating season are relatively higher than the other parts of envelope. While during the cooling season, the loads of exterior and interior walls are relatively higher, as shown in Figure 6.
In actual engineering projects, the thickness of wall insulation material determines the wall’s heat storage and insulation capacity, directly influencing the entire heat transfer coefficient, which is the main envelope performance indicator. While taking into consideration the building envelope structure, the wall cladding, exterior walls, floor decking, and interior walls account for the major building load. Hence, the selection of four different envelope structures with a new insulation material, which is commonly found in markets, is made to determine the effect of insulation thickness on heat transfer coefficient as well as building energy consumption of non-transparent envelope structures. While satisfying the indoor environment requirements of heat storage and the summer cooling capacity of building walls, an appropriate insulation material thickness is chosen to confirm the influence of non-transparent envelope on building load and energy consumption, thereby setting up a reasonable range.

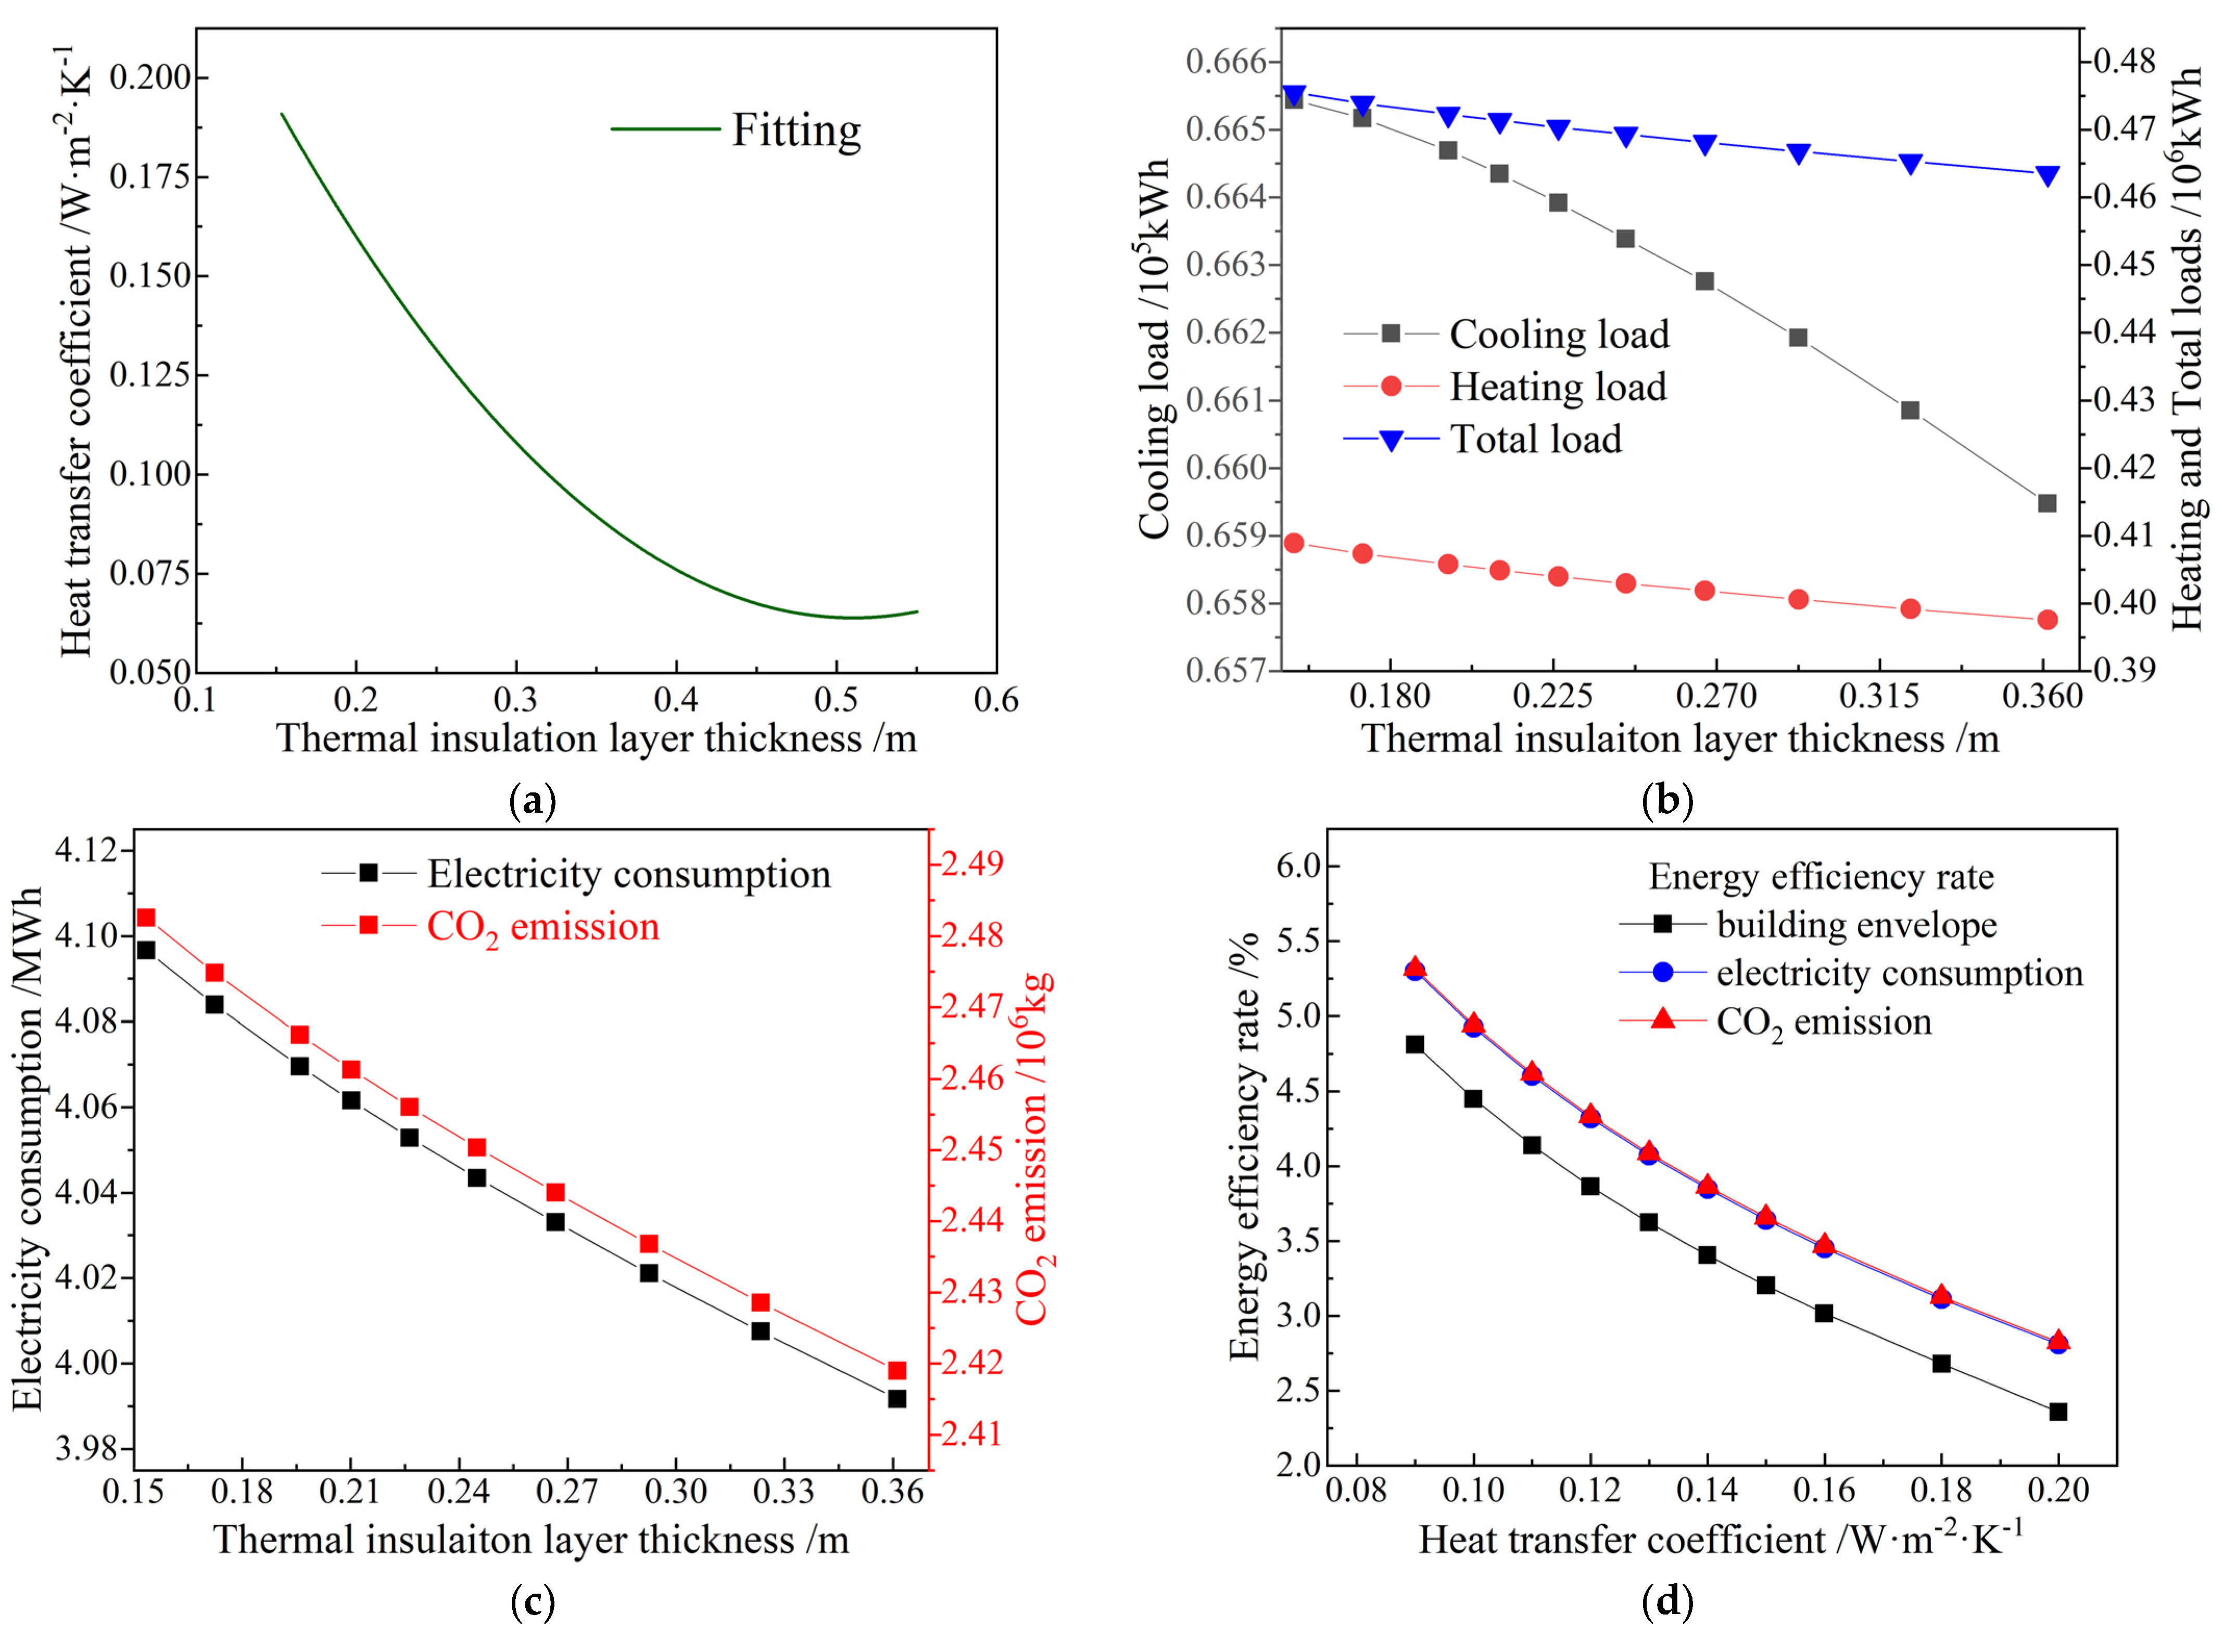
4.2.1. Energy Consumption of Exterior Wall

Here, we take four typical non-transparent enveloping structures, namely roof, exterior wall, floor decking, and interior wall, as research objects. In order to reduce the influence of other structural materials on exterior walls, a simple structure with thermal insulation material thickness as a single factor variable is selected to analyze the effect of thermal insulation layer thickness on heat transfer coefficient and energy consumption of this passive building. Building energy efficiency is analyzed according to the following formula:
η = E E r E r × 100 %
where η stands for energy efficiency percentage; E denotes building energy consumption, Er refers to the energy consumption of the referenced building. A three-layer wall insulation structure with the same inner and outer layer material thickness is chosen, and the thickness of middle insulation structure is set as a single-factor variable. The heat transfer coefficient of 0.2 W/(m2·K) is defined as the upper limit conforming to the design guideline for passive buildings. According to the specified material properties, as shown in Table 7, the relationship between heat transfer coefficient and thermal insulation layer thickness is fitted to simulate energy consumption and CO2 emission of building walls for various wall thicknesses. As shown in Figure 7, the referenced building energy consumption is set as the initial value to calculate energy efficiency. In the thermal insulation layer thicknesses of 0.15~0.55 m based on practical engineering experiences, the heat transfer coefficient of building wall decreases obviously with the increase in thermal insulation layer thickness, as shown in Figure 7a. When the thermal insulation layer thickness is 0.15~0.3 m, the heat transfer coefficient most significantly varies by 0.1~0.35 m. The change rate gradually decreases between 0.3~0.4 m, and the heat transfer coefficient increases when the thickness increases to 0.5 m. After a single linear regression analysis, the quadratic polynomial relationship between heat transfer coefficient and insulation layer thickness for exterior walls is obtained:
K wall = 0.3429 1.16893 x + 1.26914 x 2
where Kwall denotes the heat transfer coefficient of exterior walls, x is the thickness of the wall insulation material (thermal insulation layer thickness). Regression fitting of R2(0.9934) as shown in Figure 7a implies that the heat transfer coefficient of exterior walls can be effectively reduced by keeping thermal insulation layer thickness in a range of 0.1~0.4 m, which should not exceed 0.4 m, otherwise, it may even lead to an increased heat transfer coefficient for exterior walls.
The energy consumption of various building loads decreases as thermal insulation material gets thicker. However, while the trends in building heating load and total load follow the same pattern with changes in insulation thickness, the trends in cooling load and other types of load are different, as illustrated in Figure 7b. This suggests that heating load has a greater impact on the total load. Regarding the cooling load, the effect of insulation thickness is relatively small between 0.2~0.25 m but becomes more pronounced after 0.25 m. Increasing insulation thickness by 0.05 m can reduce cooling energy consumption by up to 100 kWh. As for the heating load, insulation thickness between 0.2~0.3 m has a more significant impact, with every 0.05 m increase in thickness leading to a reduction of about 1000 kWh in energy consumption. Overall, changes in thermal insulation layer thickness for exterior walls have a minor effect on cooling load but a substantial impact on heating load, which can abate the heating load to 17.96 kWh/m2, lower than the standard 18 kWh/m2 of passive buildings in Harbin city.
As the thickness of thermal insulation material increases, the total electricity consumption and CO2 emissions decrease, as shown in Figure 7c, indicating that the trend of electricity consumption and CO2 emissions changes slightly with thermal insulation thickness. If the insulation material is less than 0.25 m, adding only 0.02 m can save approximately 100 kWh of electricity. However, after reaching 0.25 m, a thicker insulation layer of 0.04 m is needed to achieve the same improvement. Increasing thermal insulation thickness by 0.02 m at any stage can reduce CO2 emissions by 1000 kg and save 150 kWh of electricity.
As shown in Figure 7d, the building energy consumption follows the same pattern as the heat transfer coefficient of exterior walls. A lower heat transfer coefficient leads to higher energy efficiency for each type of energy consumption. The variation trend of energy efficiency of electricity consumption and CO2 emission is nearly identical, which is significantly higher than building envelope energy efficiency. When the heat transfer coefficient of exterior walls falls below 0.16 W·m−2·K−1, the energy efficiency is notably greater than that in 0.16~0.2 W·m−2·K−1. This indicates that a higher heat transfer coefficient has a greater impact on building energy consumption. Regarding the exterior wall structure using a single thermal insulation material, it is advisable to keep the insulation thickness within 0.35 m to effectively reduce the heat transfer coefficient. Maintaining the heat transfer coefficient within 0.11~0.16 W·m−2·K−1 can effectively reduce building energy consumption. For each abatement of heat transfer coefficient by 0.1 W·m−2·K−1, the average building energy efficiency increases by 0.5%. Notably, the energy efficiency for electricity consumption and CO2 emission is higher than that for building envelope, implying that modifying thermal insulation thickness can effectively reduce building heating load and electricity consumption.

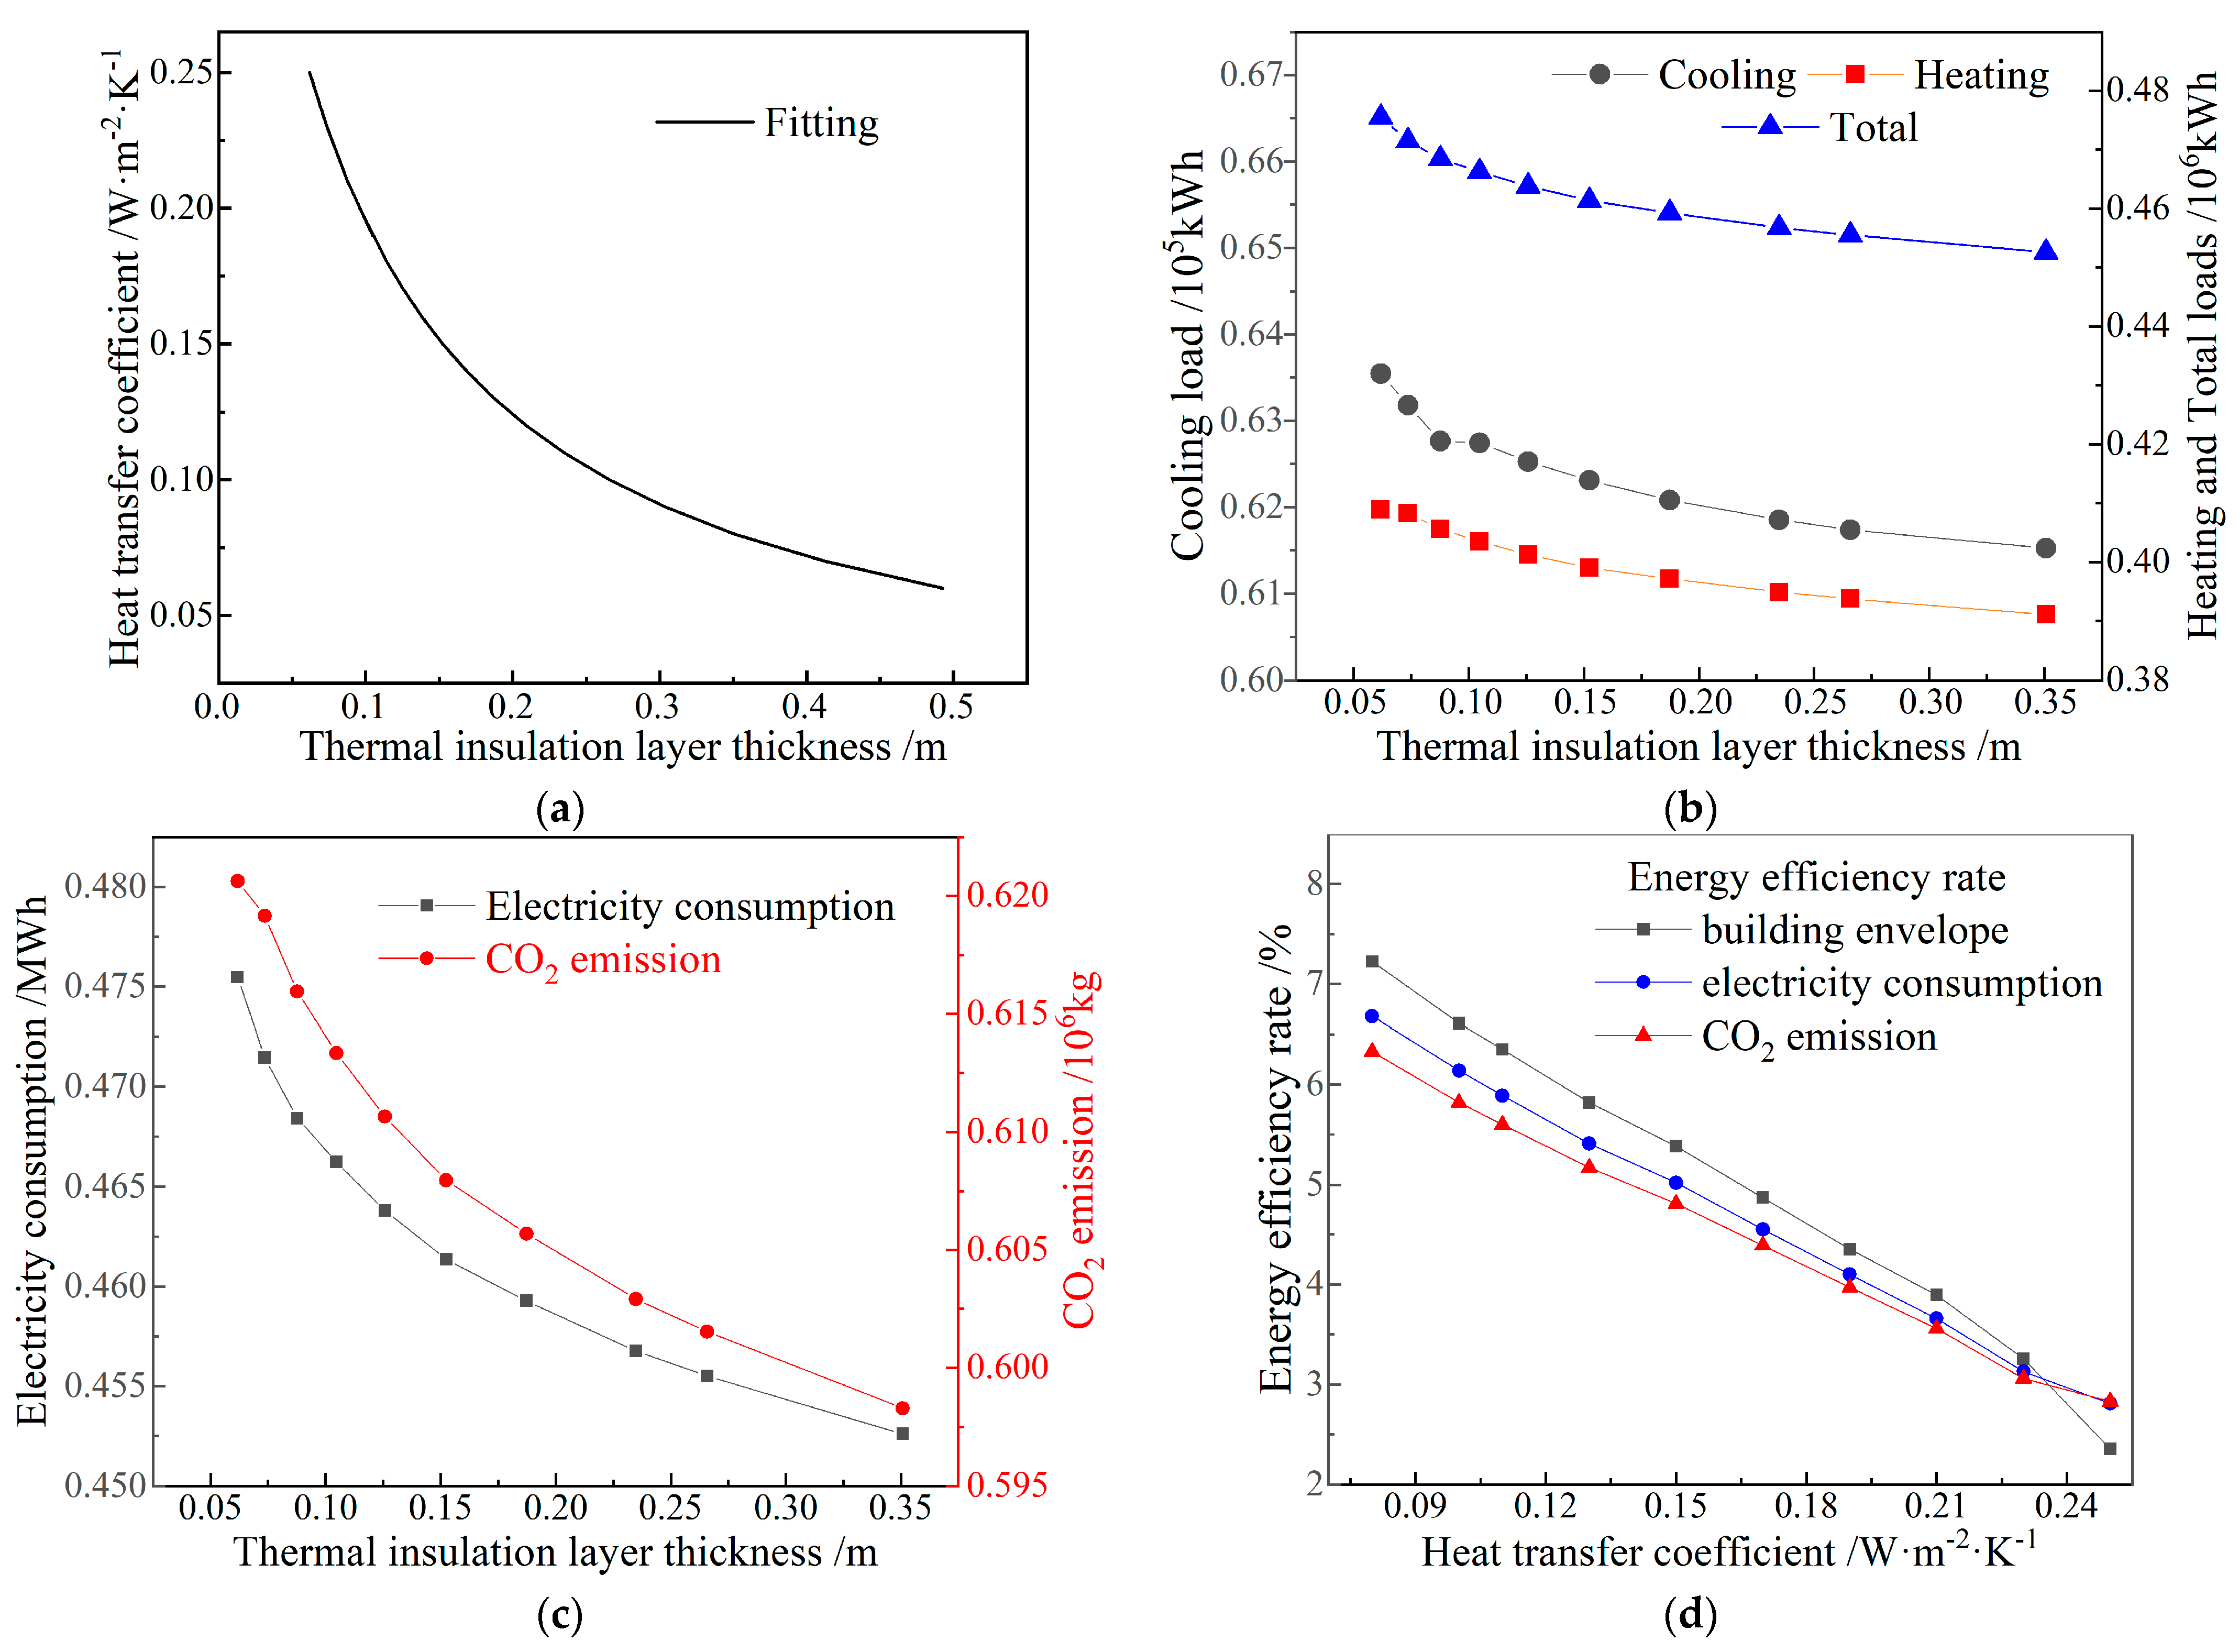
4.2.2. Energy Consumption of Building Roof

The selection of building envelope is based on a four-layered thermal insulation structure, with the thickness of other interfering materials being fixed. The thickness of the middle insulation material is considered as a single variable factor, with a heat transfer coefficient of 0.25 W·m−2·K−1 being set as the upper limit, in accordance with the design guideline for passive building. Ten sets of data are established based on the performance parameters of the roof structure materials (as shown in Table 8). The relationship between heat transfer coefficient and insulation thickness is analyzed for building roof, and the building load energy consumption, electricity consumption, and CO2 emissions are simulated to evaluate the influence of roof’s heat transfer coefficient on energy efficiency (as shown in Figure 8). As the thickness of roof insulation increases, the heat transfer coefficient decreases accordingly in range of 0.1~0.3 m. After univariate linear regression analysis, the quadratic polynomial relationship between the insulation thickness and heat transfer coefficient of building roof is obtained:
K roof = 0.2599 0.894 x + 1.0913 x 2
where Kroof denotes the heat transfer coefficient of building roof, and x signifies the thermal insulation thickness of roof envelope structure. The high R2(0.9991) of regression, as shown in Figure 8a, indicates that Equation (9) accurately models the relationship between variables. Overall, the results of this study suggest that in the four-layered basic structure, the thickness of thermal insulation material significantly affects the heat transfer coefficient of building roof within the range of 0.05~0.3 m.
Energy consumption of building loads decreases non-linearly as the roof thermal insulation thickness increases, as illustrated in Figure 8b. Cooling load decreases most rapidly with increasing the roof thermal insulation thickness in 0.05~0.08 m. For every 0.05 m increase in roof insulation thickness within 0.1~0.25 m, the cooling energy consumption decreases by 100 kWh. However, 0.2 m onwards, a minimum increase of 0.07 m is required to achieve a similar energy-saving effect. Heating energy consumption decreases by approximately 3500 kWh for each 0.05 m increase in roof thermal insulation thickness when <0.2 m. Beyond 0.2 m, a minimum increase of 0.1 m is necessary to achieve a similar reduction in heating load. A thicker roof thermal insulation results in lower total energy consumption and CO2 emission, as shown in Figure 8c. When <0.18 m, every 0.05 m increase can introduce reductions of an average of 8000 kWh in building energy consumption and 4000 kg in CO2 emission.
As shown in Figure 8d, the building achieves the best energy-saving effect when the heat transfer coefficient of roof is between 0.22~0.24 W·m−2·K−1, with a relatively small impact on electricity consumption and CO2 emission. A smaller roof heat transfer coefficient leads to a higher energy efficiency of each consumption, resulting in the higher building envelope’s energy efficiency than that of electricity consumption and the lowest CO2 emission. When the heat transfer coefficient is maintained between 0.1~0.19 W·m−2·K−1, the total energy efficiency increases most rapidly, in which the average energy efficiency increases by 0.5% for every 0.1 W·m−2·K−1 decrease in the roof heat transfer coefficient, even the building envelope’s energy efficiency rises by 0.7%. The building envelope’s energy efficiency maintains a uniformly increasing rate with the decreasing roof heat transfer coefficient. When the roof heat transfer coefficient drops to around 0.15 W·m−2·K−1, the energy efficiency of electricity consumption increases significantly faster than that of CO2 emission. For the roof envelope structure, using a typical XPS insulation layer with a thickness of <0.3 m can effectively reduce the roof’s heat transfer coefficient into 0.1~0.19 W·m−2·K−1 for effectively reducing each energy consumption.

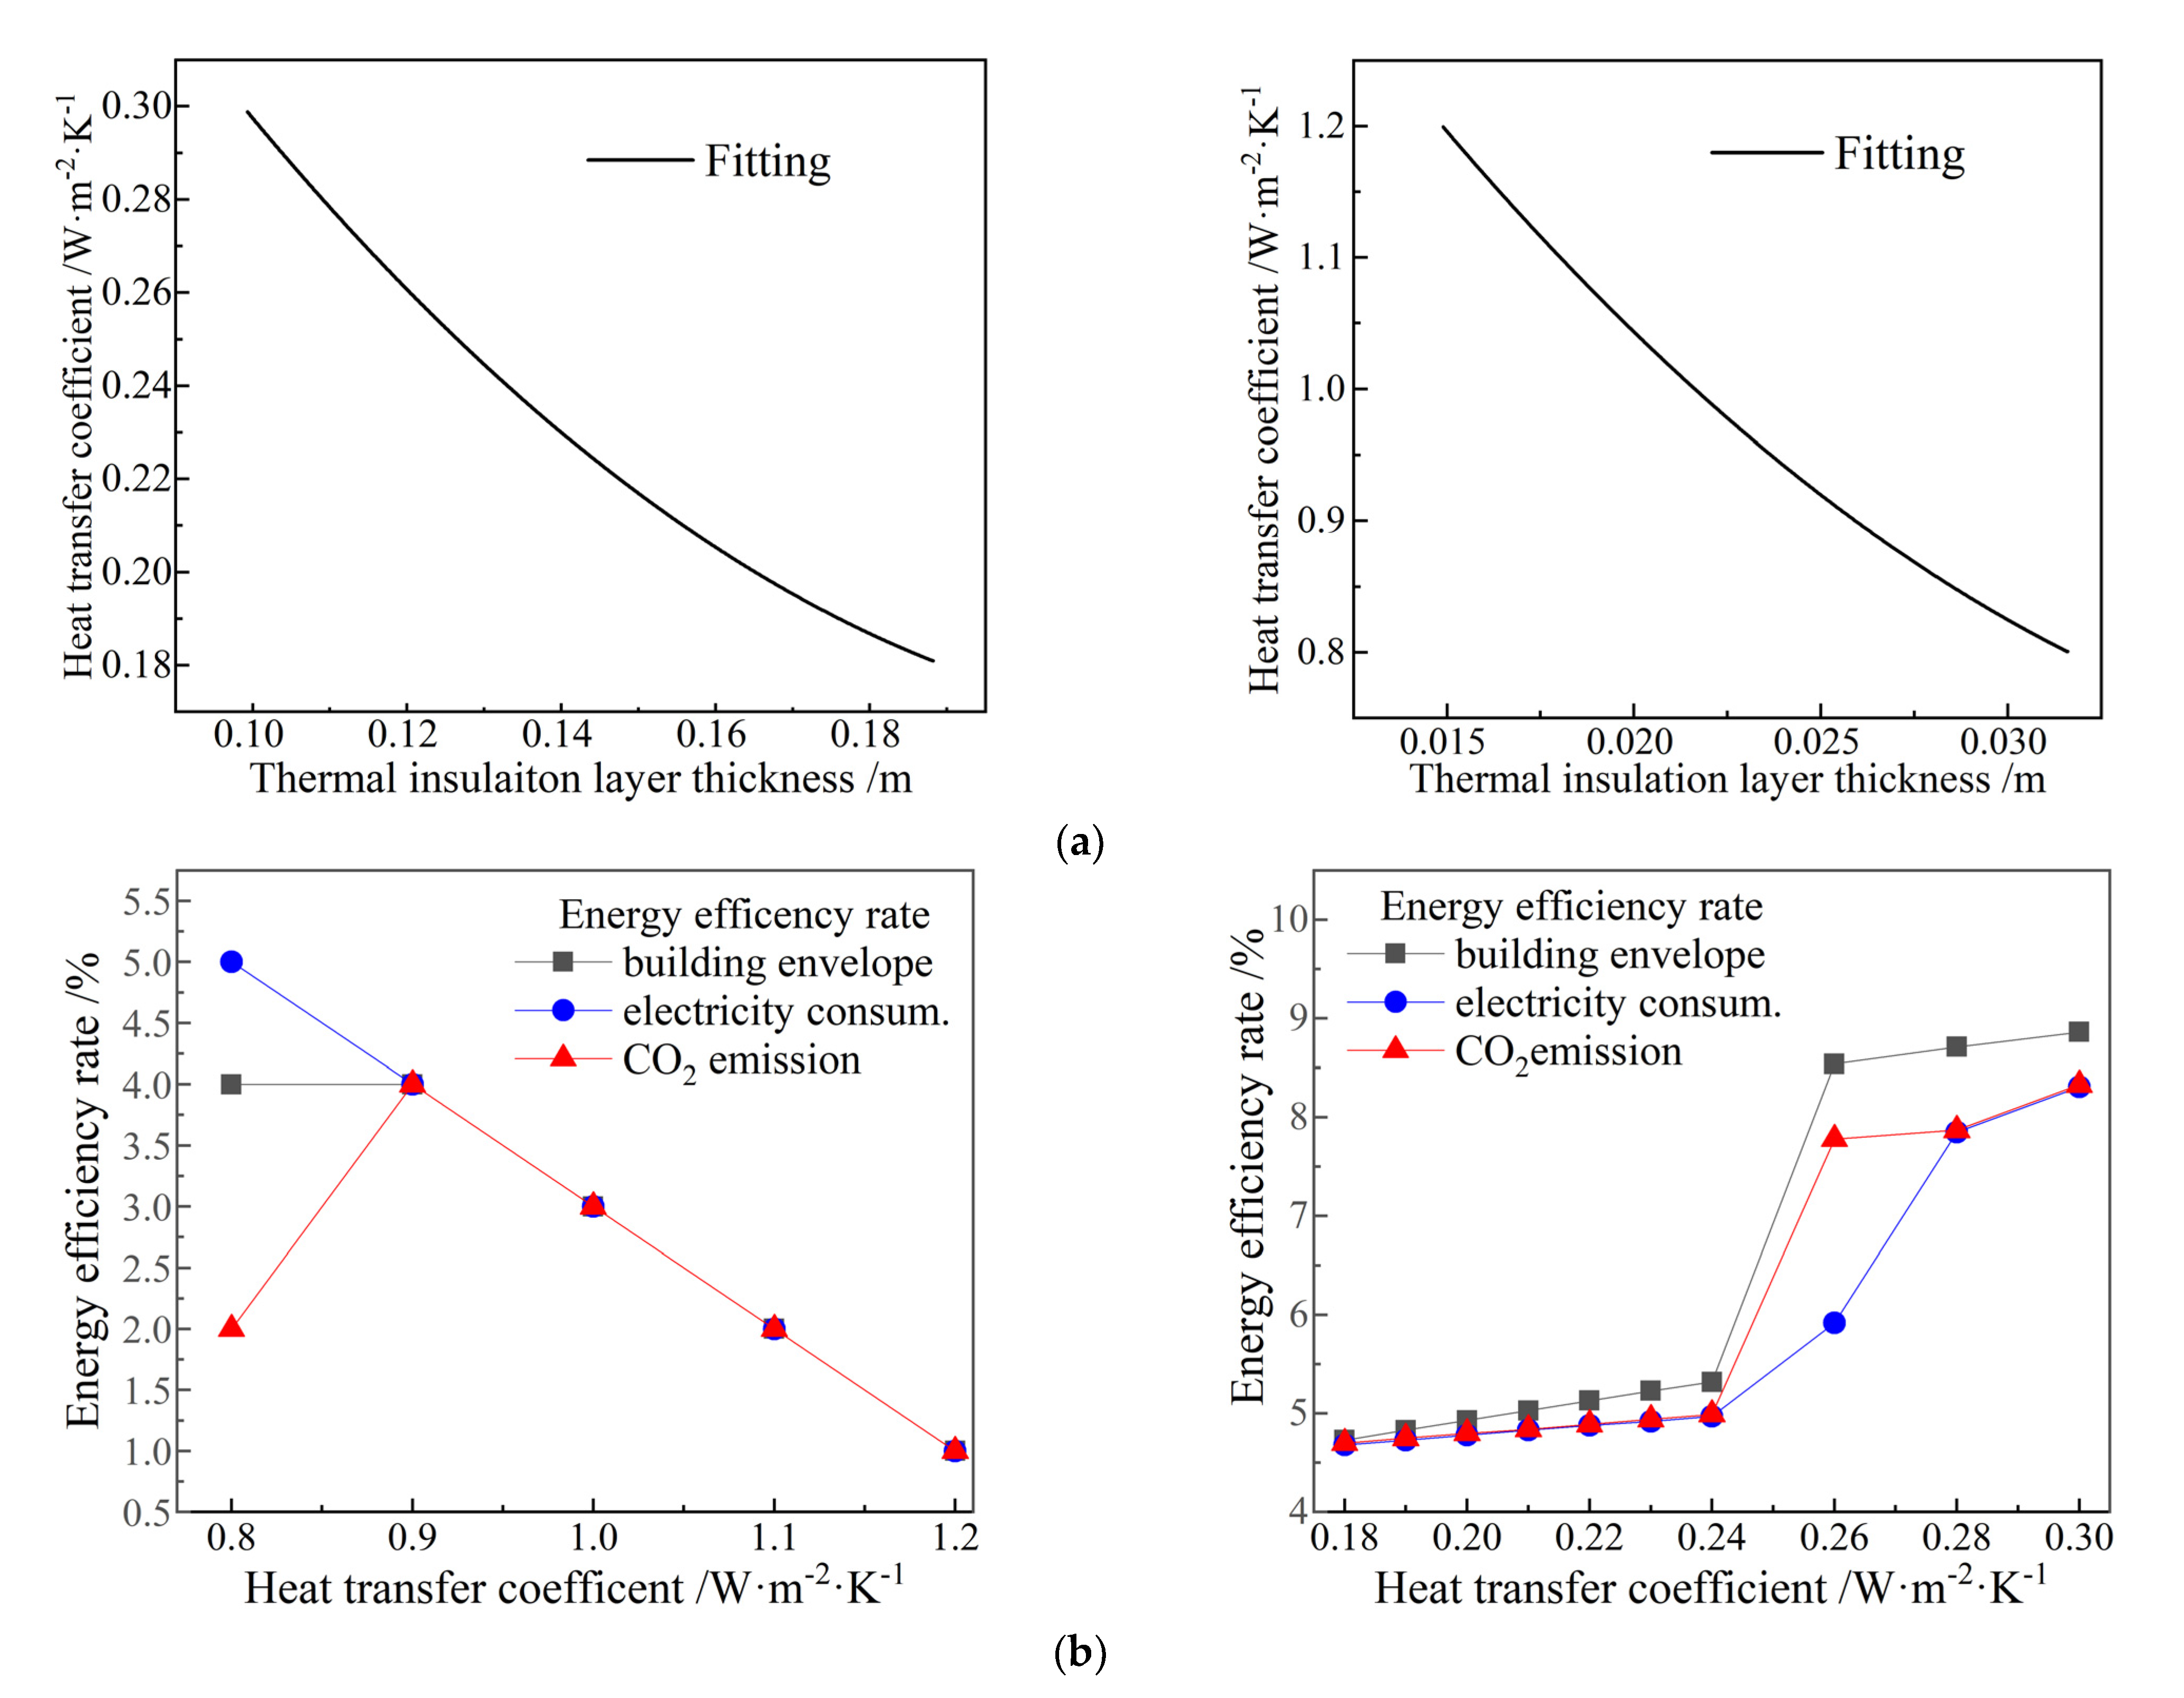
4.2.3. Energy Consumption of Floor Decking and Interior Walls

In general, for studies of building envelope structures, the building floors and interior walls, which are part of the envelope structure, often have large upper limits or are not considered for energy conservation. However, in the actual use of buildings, the energy consumption of floors and interior walls cannot be ignored. In the analysis process, urea-formaldehyde foam insulation board is selected as thermal insulation material, and the upper limit of heat transfer coefficient is set to 0.3 W·m−2·K−1 for floor structure, while the insulation material for interior walls is the same as that of exterior walls with their upper limit of heat transfer coefficient being set to 1.2 W·m−2·K−1. By changing insulation material thickness as a single factor, the building load energy consumption, electricity consumption, and CO2 emissions are simulated to reveal the influence of heat transfer coefficients of floors and interior walls on energy efficiencies, as shown in Figure 9.
The heat transfer coefficient of both floors and interior walls decreases rapidly with the increase of insulation material thickness. Among commonly used heat transfer coefficients, increasing insulation material thickness is more effective in reducing floor heat transfer coefficient. For every 0.1 W·m−2·K−1 reduction in heat transfer coefficient, the floor thickness needs to be increased by 0.06 m, while the interior wall thickness only needs to be increased by 0.003 m, which means a 95% material saving rate. When other energy consumption factors are the same, it is recommended to first consider reducing the heat transfer coefficient of interior walls. After performing a simple linear regression analysis, the linear regression equation between thermal insulation layer thickness and heat transfer coefficient for both floors and interior walls are obtained as follows:
K floor = 0.57217 3.504 x + 7.576 x 2 ,   K in = 1.8255 50.59 x + 574.5 x 2
where Kfloor and Kin denote insulation thicknesses of floor decking and interior walls respectively. Both regression curves have an R2 close to 1 (0.9996 and 0.9999) as shown in Figure 9a, indicating that increasing insulation material thickness is competent in abating heat transfer coefficients of floor decking and interior walls. However, in actual engineering, the floor decking and interior walls cannot be too thick to avoid shrinking indoor areas and ensure building load-bearing safety. It should be noted that the smaller the thickness of internal wall insulation, the faster the indoor heat transfer, which can lead to lower heating consumption and increased energy efficiency. In actual engineering, the energy-saving effect of internal wall insulation is not significant, and for economic reasons, insulation is generally only implemented on exterior walls.
As shown in the left panel of Figure 9b, when the floor heat transfer coefficient is 0.9~1.2 W·m−2·K−1, the three kinds of building energy efficiencies are almost the same. For every 0.1 W·m−2·K−1 reduction in floor heat transfer coefficient, all the energy efficiencies rise up by an average of 0.5%. When the floor heat transfer coefficient is less than 0.9 W·m−2·K−1, the energy efficiency of electricity consumption can still be improved, but the energy efficiency of building envelope remains unchanged, whilst that of CO2 emission even decreases. Therefore, when the floor heat transfer coefficient is too low, it is actually not conducive to building energy efficiency. As shown in the right panel of Figure 9b, only when the heat transfer coefficient of interior walls increases by 0.3~0.24 W·m−2·K−1, all the energy efficiencies of building envelope, electricity consumption, and CO2 emission significantly improve by 3~4%, which is the most. For <0.24 W·m−2·K−1 of interior walls, all three energy efficiencies remain almost unchanged. The energy efficiencies of CO2 emission are evidently lower than that of building envelope and electricity consumption around 0.26 W·m−2·K−1 heat transfer coefficient of interior walls. Therefore, it is notably suggested of improving the energy efficiency of building envelope structures by reducing the heat transfer coefficient of internal structural components such as floor decking and interior walls. To this end, the overall building energy efficiency is hereby demonstrated to approach maximum when heat transfer coefficients of floor decking and interior walls reside in 0.9~1.2 W·m−2·K−1 and 0.28~0.3 W·m−2·K−1, respectively.

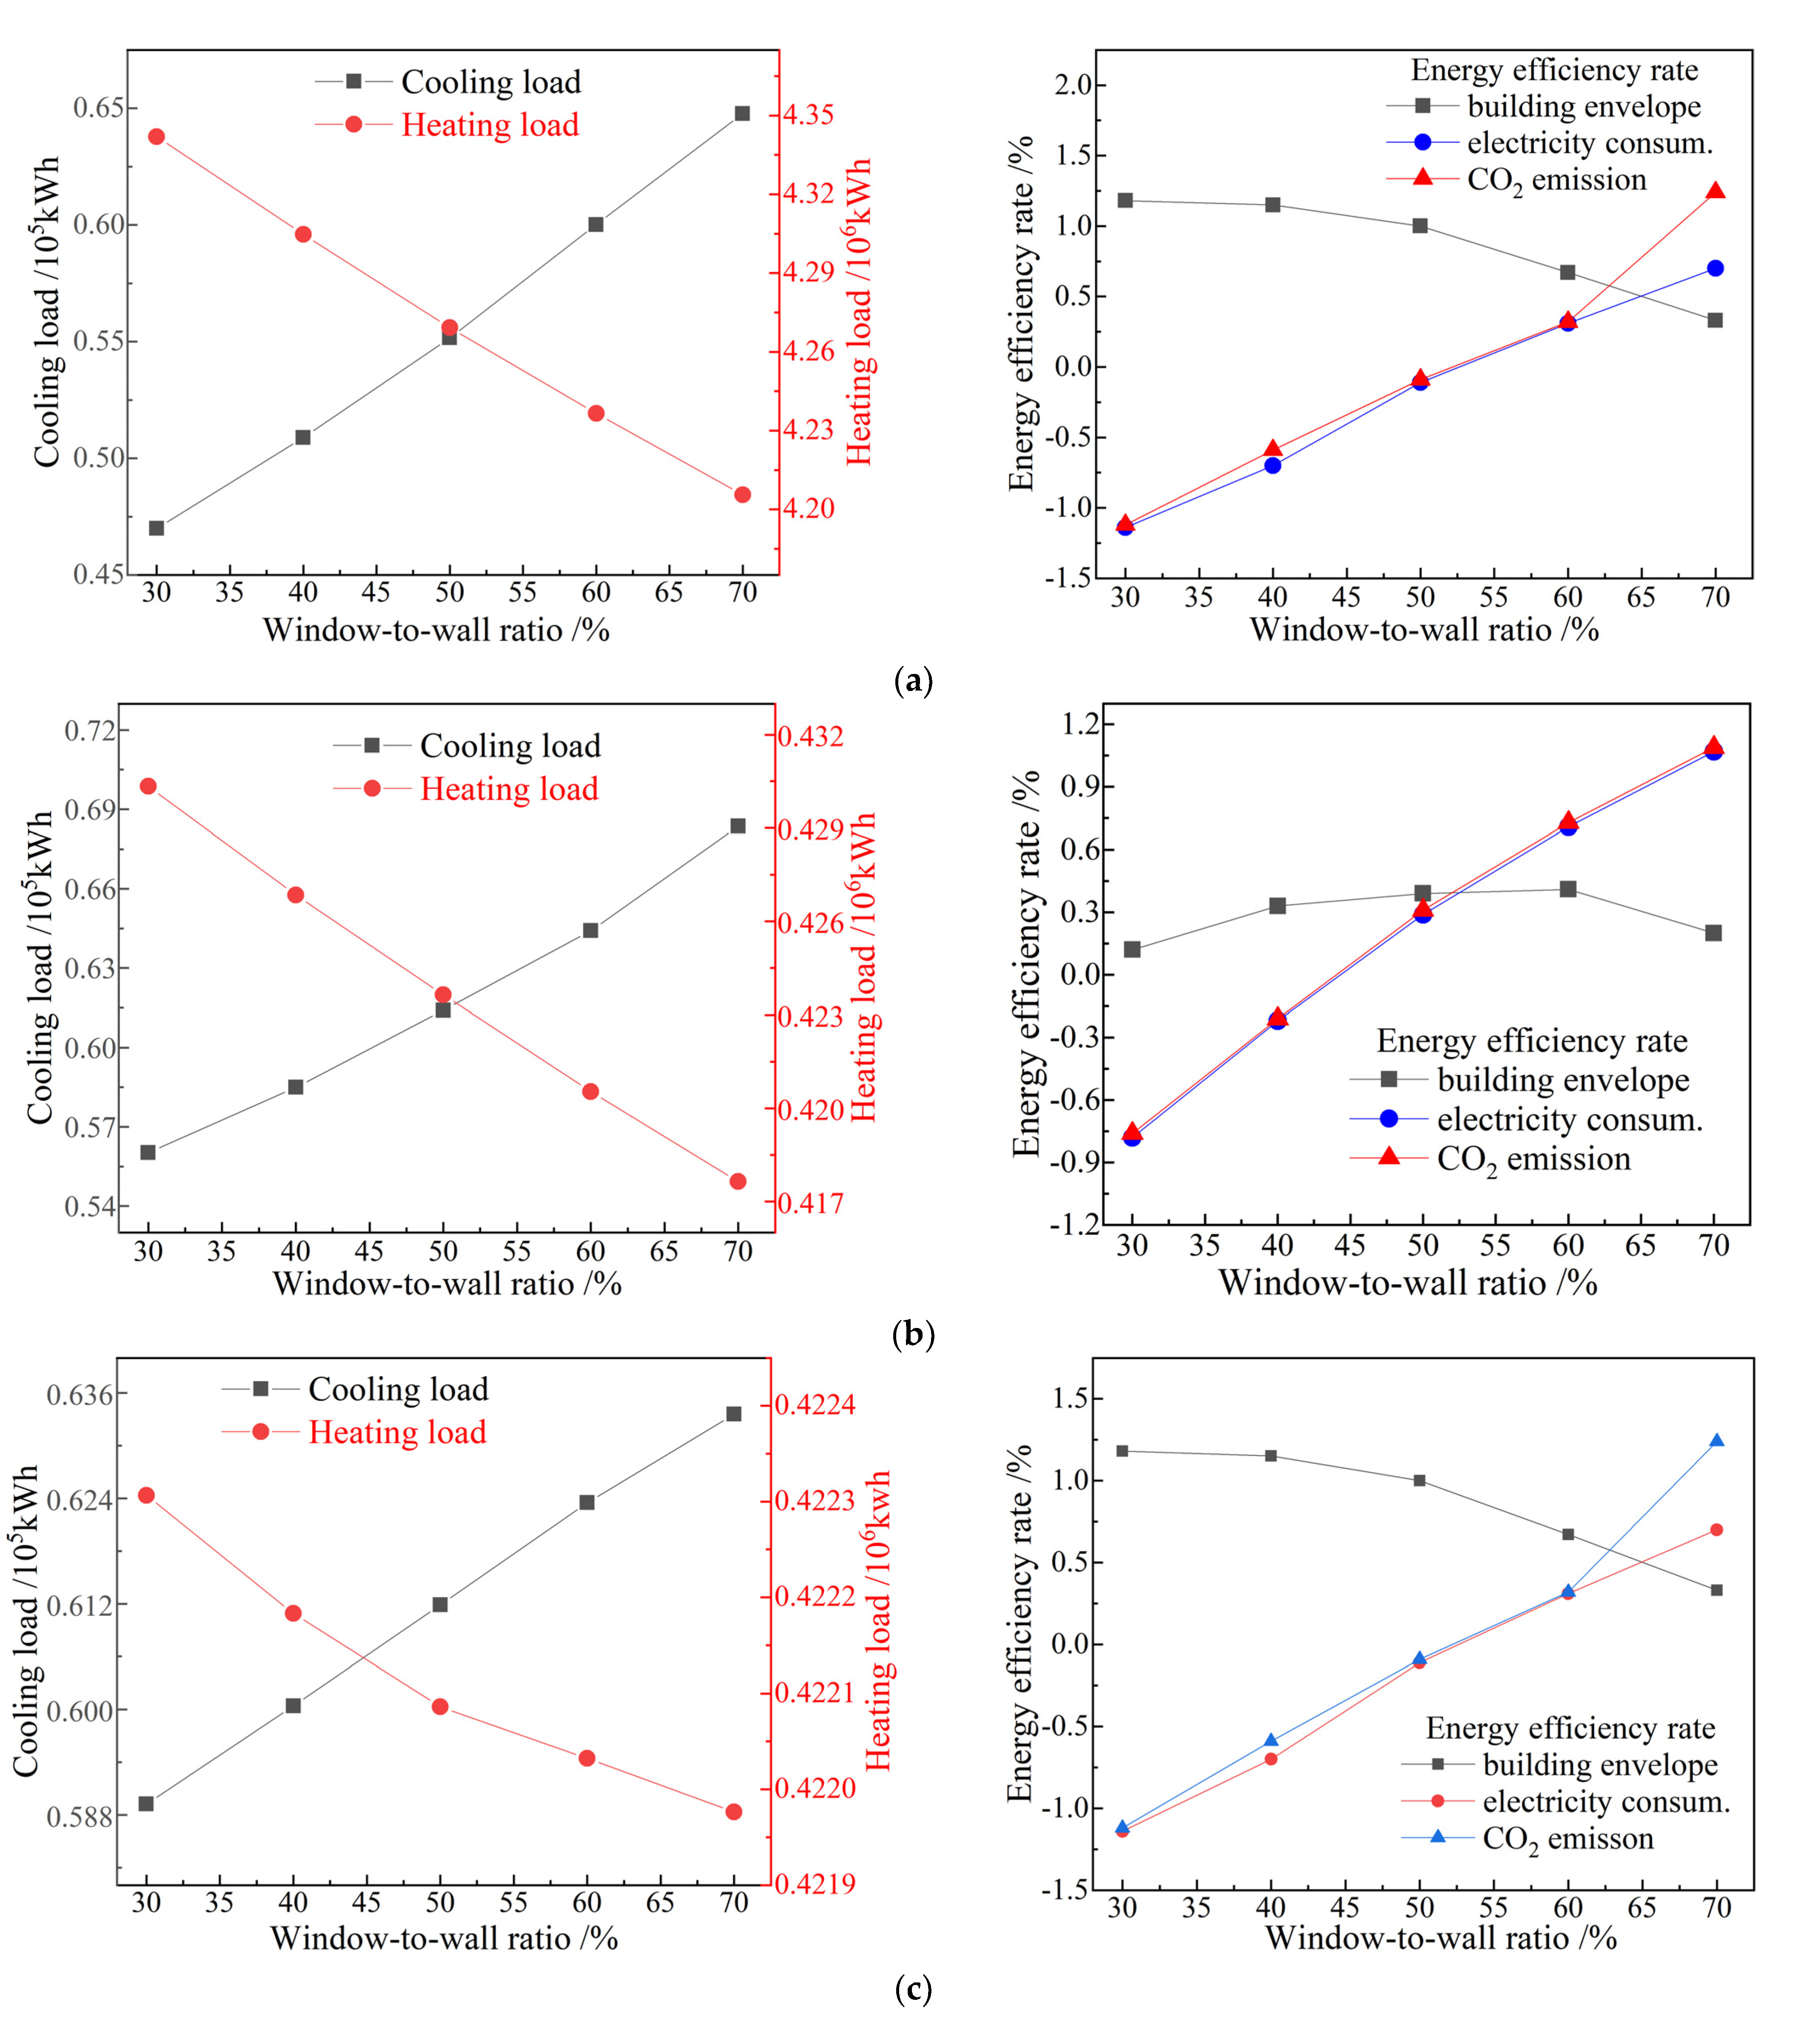
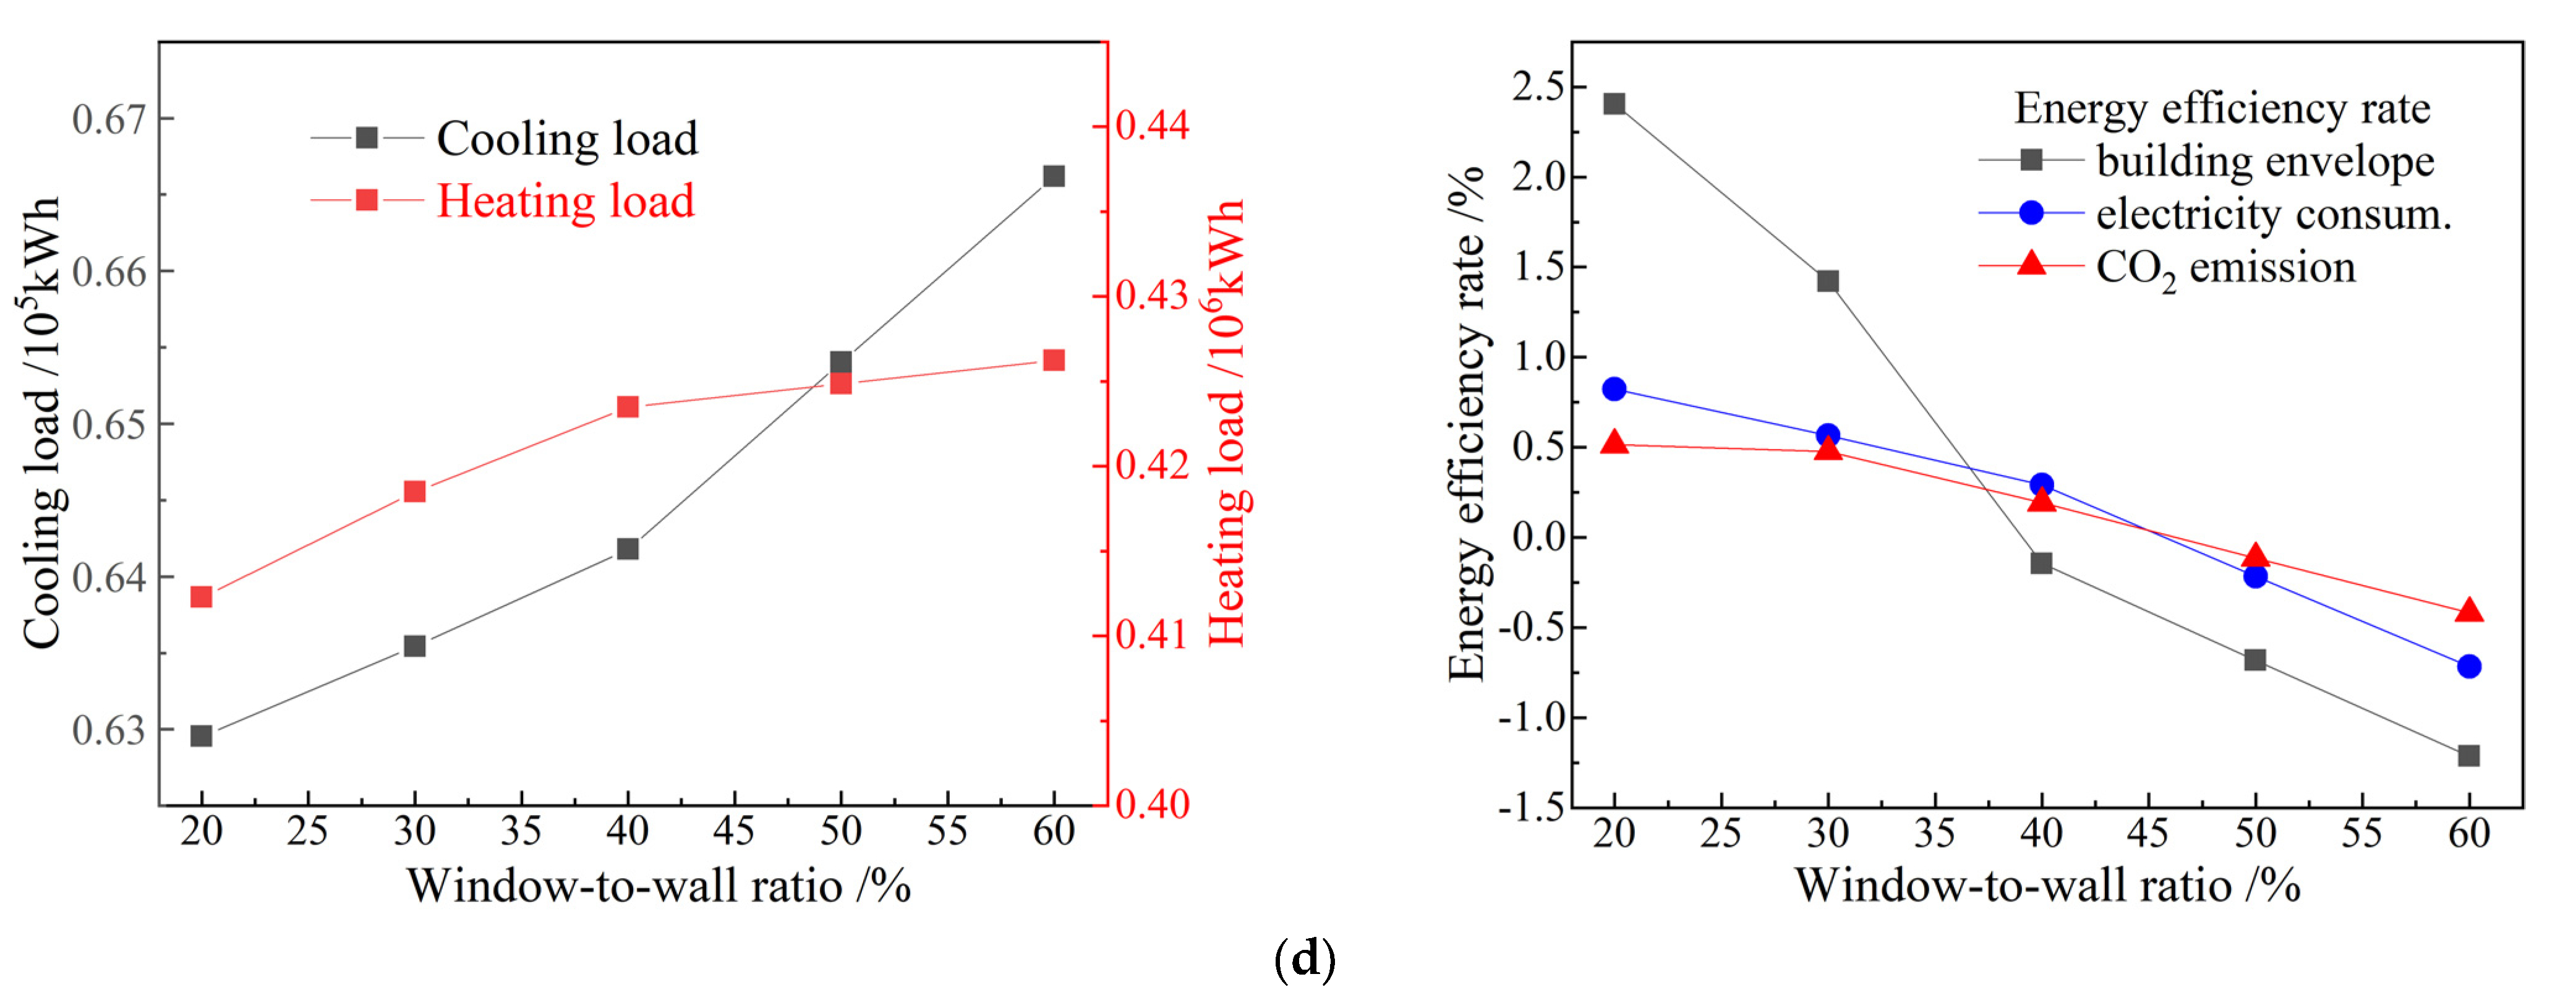
4.3. Energy Consumption of Exterior Windows

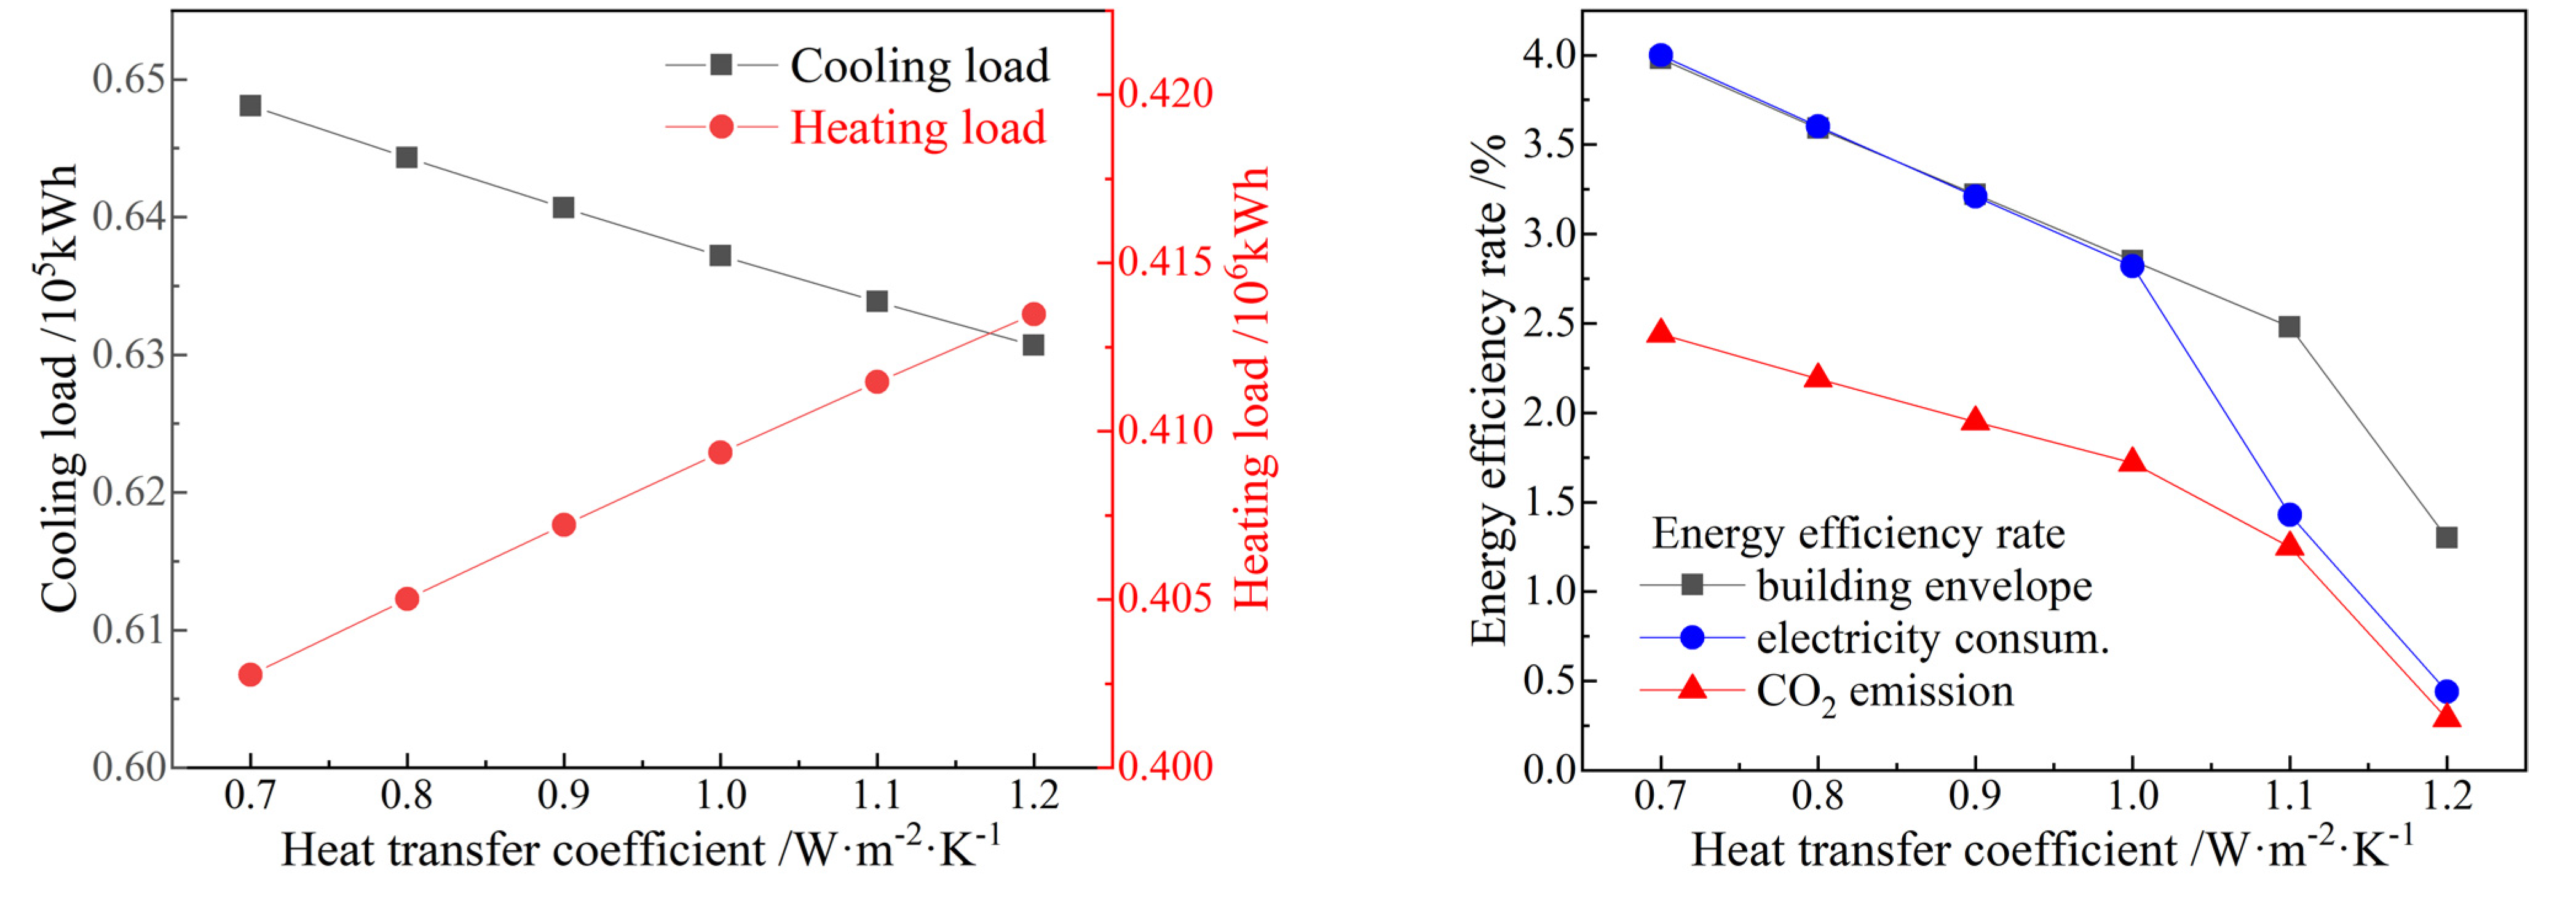
4.3.1. Heat Transfer Coefficients of Exterior Windows

The calculated profiles of building energy consumption throughout the year with respect to exterior window heat transfer coefficient in range of 0.7~1.2 W·m−2·K−1 are shown in Figure 10. The cooling load rises and heating load declines linearly with the increasing heat transfer coefficient of exterior windows, respectively, as shown in the left panel of Figure 10. For every 0.1 W·m−2·K−1 abatement of heat transfer coefficient, the annual cooling and heating loads increase by an average of about 400 kWh (2.7%) and decrease by 2000 kWh (2.5%), respectively. Furthermore, the heat transfer coefficient of exterior windows has a greater impact on heating load than on cooling load. However, as shown in the right panel of Figure 10, the total building energy efficiency decreases monotonically with the increasing heat transfer coefficient of exterior windows, especially in the range of 1.1~1.2 W·m−2·K−1 by 1.21%. In the range of 0.7~1.0 W·m−2·K−1, the energy efficiencies of building envelope and electricity consumption are almost identical, which meanwhile are evidently greater than that of CO2 emission.

4.3.2. Window-to-Wall Ratio

Keeping other fundamental factors of the building physical model constant, the window-wall ratios on four facades are individually modified to optimize cooling load, heating load, and energy efficiencies, as shown in Figure 11. The cooling and heating loads will be substantially aggravated and alleviated, respectively, by increasing the east-facade window-wall ratio, in which an increment of 10% in window-wall ratio results in a rise of ~4.4 MWh and a fall of ~3.4 MWh for cooling and heating loads respectively, as shown by the left panel of Figure 11a. Electricity consumption and CO2 emission represent a very similar energy-saving state merely when the east window-wall ratio exceeds 50%, as shown by the right panel of Figure 11a. In contrast, the building envelope energy efficiency drops with the increase of the east window-wall ratio when it exceeds 40%. Therefore, it is suggested to acquire the highest level of building energy efficiency by specifying an east window-wall ratio of 65~70%.
Cooling load increases and heating load decreases linearly with respect to the south window-to-wall ratio, respectively, as shown by the left graph of Figure 11b. Every relative enlargement of 10% in south exterior windows causes increments of 2.5~4.0 MWh and ~2.5 MWh in annual cooling and heating loads, respectively, as indicated by the right graph of Figure 11b. In 30~50% of south window-to-wall ratios, both electricity consumption and CO2 emission render a negative energy efficiency. It is required for >50% of south window-to-wall ratios to reach an energy-saving state, where the energy efficiency of building envelope begins to decline. Accordingly, when the south window-to-wall ratio exceeds 65%, the total building energy efficiency decreases with the increasing south window-to-wall ratio. Therefore, the 60~65% of south window-to-wall ratio is optimal to achieve the highest level of energy efficiency, where the energy efficiencies of CO2 emission and electricity consumption are almost identical and greater than that of building envelope. It is worth noting that the orientation of the building facing north and south, with ample sunlight on the south and east facades, can reduce heating demand appropriately. Nevertheless, A 100% window-to-wall ratio in actual buildings is beneficial for decreasing the heating load but for increasing the cooling load.
The dependence of cooling load, heating load, and various energy efficiencies on the west window-to-wall ratio is very similar to that on the east window-to-wall ratio, which optimizes at 20~30% approaching a maximum building energy efficiency of 1%, as shown in Figure 11c. In contrast, a higher north window-to-wall ratio leads to higher cooling and heating loads, and results in a significant abatement in all three dominant energy efficiencies, as shown in Figure 11d. Maintaining a north window-to-wall ratio within 20~40% is required for optimal energy efficiency up to an average rate of 1.25%. This finding is especially relevant to severe cold climates, where the heating load of passive buildings is much higher than that in warm regions. Since the west and north facades are shaded areas with short and insufficient sunlight exposure, the west-oriented areas of the researched passive building have been designed mostly as non-office areas such as stairwells and storage rooms. Meanwhile, a high window-to-wall ratio requires a large area of exterior windows, which will significantly increase building costs. Therefore, increasing the window-to-wall ratio on west or north facade does not have substantial significance for optimizing passive buildings in severe cold regions.

5. Conclusions

According to the climate conditions of severe cold regions and the design energy-saving measures of the studied engineering case, a paradigm physical model of passive building is established based on the actual building standards, in which the technical parameters essentially accounting for energy consumption characteristics are modified to perform numerical simulation analyses on energy efficiency and CO2 emission. Through numerical calculations of heat flux equilibrium, the non-transparent building envelope structures with various thermal insulation thicknesses and various window-to-wall ratios are simulated to predict and evaluate the energy efficiency of passive buildings in northeast Asia frigid zone. Heat transfer coefficient of non-transparent building envelope shows a linear dependence on thermal insulation layer thickness, by which an optimal building design is verified. The heat transfer coefficient of exterior walls, roof, interior walls, and floor decking is optimal within the range of 0.11~0.16 W·m−2·K−1, 0.10~0.19 W·m−2·K−1, 0.28~0.30 W·m−2·K−1, and 0.9~1.2 W·m−2·K−1 respectively to achieve the highest level of energy efficiency. It is also valid for improving the energy efficiency of passive buildings in severe cold regions by reducing the heat transfer coefficient of exterior windows. Window-to-wall ratio in each facade highly determines the energy efficiency of passive buildings in severe cold regions: it is demonstrated from simulation analyses to specify the window-to-wall ratios facing east, south, west, and north into 65~70%, 60~65%, 20~30%, and 20~40%, respectively, for achieving the maximum energy efficiency.
As a prospective study, the energy-saving benefits of passive buildings can be utilized to the fullest, such as by planting green plants on roof and walls to insulate heat in summer. Consistent with severe cold climates, natural water reuse and garbage treatment can be set up for passive buildings, in which photovoltaic integrated technology and waste heat recovery should be preferentially utilized as auxiliary heat sources.

Author Contributions

Investigation, methodology, writing—original draft preparation, C.L.; project administration, resources, C.S. and G.L.; data curation, formal analysis, W.Y.; conceptualization, writing—review and editing, F.W. All authors have read and agreed to the published version of the manuscript.

Funding

This research received no external funding.

Institutional Review Board Statement

Not applicable.

Informed Consent Statement

Not applicable.

Data Availability Statement

Theoretical methods and results are available from the corresponding author.

Conflicts of Interest

The authors declare no conflict of interest.

References

  1. Mukhopadhyaya, P.; MacLean, D.; Korn, J.; van Reenen, D.; Molleti, S. Building application and thermal performance of vacuum insulation panels (VIPs) in Canadian subarctic climate. Energy Build. 2014, 85, 672–680. [Google Scholar] [CrossRef]
  2. Orsini, F.; Marrone, P.; Asdrubali, F.; Roncone, M.; Grazieschi, G. Aerogel insulation in building energy retrofit. Performance testing and cost analysis on a case study in Rome. Energy Rep. 2020, 6, 56–61. [Google Scholar] [CrossRef]
  3. Čekon, M.; Čurpek, J.; Slávik, R.; Šikula, O. Coupled transparent insulation system with low emissivity solar absorber: An experimentally validated building energy simulation study. Sci. Technol. Built Environ. 2020, 26, 511–523. [Google Scholar] [CrossRef]
  4. Shameri, M.A.; Alghoul, M.A.; Elayeb, O.; Zain, M.F.M.; Alrubaih, M.S.; Amir, H.; Sopian, K. Daylighting characterstics of existing double-skin façade office buildings. Energy Build. 2013, 59, 279–286. [Google Scholar] [CrossRef]
  5. Liu, Z.; Yu, Z.; Yang, T.; Qin, D.; Li, S.; Zhang, G.; Haghighat, F.; Joybari, M.M. A review on macro-encapsulated phase change material for building envelope applications. Build. Environ. 2018, 144, 281–294. [Google Scholar] [CrossRef]
  6. da Cunha, S.R.L.; de Aguiar, J.L.B. Phase change materials and energy efficiency of buildings: A review of knowledge. J. Energy Storage 2020, 27, 101083. [Google Scholar] [CrossRef]
  7. Lachheb, M.; Younsi, Z.; Naji, H.; Karkri, M.; Nasrallah, S.B. Thermal behavior of a hybrid PCM/plaster: A numerical and experimental investigation. Appl. Therm. Eng. 2017, 111, 49–59. [Google Scholar] [CrossRef]
  8. Cui, Y.; Xie, J.; Liu, J.; Pan, S. Review of Phase Change Materials Integrated in Building Walls for Energy Saving. Procedia Eng. 2015, 121, 763–770. [Google Scholar] [CrossRef]
  9. Ibrahim, M.; Bianco, L.; Ibrahim, O.; Wurtz, E. Low-emissivity coating coupled with aerogel-based plaster for walls’ internal surface application in buildings: Energy saving potential based on thermal comfort assessment. J. Build. Eng. 2018, 18, 454–466. [Google Scholar] [CrossRef]
  10. Somasundaram, S.; Thangavelu, S.R.; Chong, A. Improving building efficiency using low-e coating based retrofit double glazing with solar films. Appl. Therm. Eng. 2020, 171, 115064. [Google Scholar] [CrossRef]
  11. Shao, T.; Zheng, W.; Cheng, Z. Passive Energy-Saving Optimal Design for Rural Residences of Hanzhong Region in Northwest China Based on Performance Simulation and Optimization Algorithm. Buildings 2021, 11, 421. [Google Scholar] [CrossRef]
  12. Zhang, T.; Wang, D.; Hui, L.; Wu, H. Numerical investigation on building envelope optimization for low-energy buildings in low latitudes of China. Build. Simul. 2020, 13, 257–269. [Google Scholar] [CrossRef]
  13. Sadineni, S.B.; Madala, S.; Boehm, R.F. Passive building energy savings: A review of building envelope components. Renew. Sustain. Energy Rev. 2011, 15, 3617–3631. [Google Scholar] [CrossRef]
  14. Younes, C.; Shdid, C.A. A methodology for 3-D multiphysics CFD simulation of air leakage in building envelopes. Energy Build. 2013, 65, 146–158. [Google Scholar] [CrossRef]
  15. Yang, J.; Wu, H.; Xu, X.; Huang, G.; Xu, T.; Guo, S.; Liang, Y. Numerical and experimental study on the thermal performance of aerogel insulating panels for building energy efficiency. Renew. Energy 2019, 138, 445–457. [Google Scholar] [CrossRef]
  16. Koç, S.G.; Kalfa, S.M. The effects of shading devices on office building energy performance in Mediterranean climate regions. J. Build. Eng. 2021, 44, 102653. [Google Scholar] [CrossRef]
  17. Tzempelikos, A.; Athienitis, A.K. The impact of shading design and control on building cooling and lighting demand. Sol. Energy 2007, 81, 369–382. [Google Scholar] [CrossRef]
  18. Mohammed, A.; Tariq, M.A.U.R.; Ng, A.W.M.; Zaheer, Z.; Sadeq, S.; Mohammed, M.; Mehdizadeh-Rad, H. Reducing the Cooling Loads of Buildings Using Shading Devices: A Case Study in Darwin. Sustainability 2022, 14, 3775. [Google Scholar] [CrossRef]
  19. Xing, Q.; Hao, X.; Lin, Y.; Tan, H.; Yang, K. Experimental investigation on the thermal performance of a vertical greening system with green roof in wet and cold climates during winter. Energy Build. 2019, 183, 105–117. [Google Scholar] [CrossRef]
  20. He, G.; Shu, L.; Zhang, S. Double skin facades in the hot summer and cold winter zone in China: Cavity open or closed? Build. Simul. 2011, 4, 283–291. [Google Scholar] [CrossRef]
  21. Preet, S.; Sharma, M.K.; Mathur, J.; Chowdhury, A.; Mathur, S. Performance evaluation of photovoltaic double-skin facade with forced ventilation in the composite climate. J. Build. Eng. 2020, 32, 101733. [Google Scholar] [CrossRef]
  22. Hamdy, M.; Mauro, G.M. Optimizing Hybrid Ventilation Control Strategies Toward Zero-Cooling Energy Building. Front. Built Environ. 2019, 5, 97. [Google Scholar] [CrossRef]
  23. Bhamare, D.K.; Rathod, M.K.; Banerjee, J. Passive cooling techniques for building and their applicability in different climatic zones—The state of art. Energy Build. 2019, 198, 467–490. [Google Scholar] [CrossRef]
  24. Aridi, R.; Yehya, A. Review on the sustainability of phase-change materials used in buildings. Energy Convers. Manag. X 2022, 15, 100237. [Google Scholar] [CrossRef]
  25. Sawadogo, M.; Duquesne, M.; Belarbi, R.; Hamami, A.E.A.; Godin, A. Review on the Integration of Phase Change Materials in Building Envelopes for Passive Latent Heat Storage. Appl. Sci. 2021, 11, 9305. [Google Scholar] [CrossRef]
  26. Chua, K.J.; Chou, S.K. Evaluating the performance of shading devices and glazing types to promote energy efficiency of residential buildings. Build. Simul. 2010, 3, 181–194. [Google Scholar] [CrossRef]
  27. Chi, F.; Xu, Y.; Pan, J. Impact of shading systems with various type-number configuration combinations on energy consumption in traditional dwelling (China). Energy 2022, 255, 124520. [Google Scholar] [CrossRef]
  28. Al-Saadi, S.N.; Al-Jabri, K.S. Optimization of envelope design for housing in hot climates using a genetic algorithm (GA) computational approach. J. Build. Eng. 2020, 32, 101712. [Google Scholar] [CrossRef]
  29. Yang, S.; Su, H.; Dou, X.; Chen, M.; Huang, Y. Heat Balance Calculation and Energy Efficiency Analysis for Building Clusters Based on Psychrometric Chart. Sensors 2021, 21, 7606. [Google Scholar] [CrossRef]
  30. Feng, G.H.; Wang, Y.; Xu, X.L.; Wang, K.R. Analysis of Measured Results of Energy Consumption for the Nearly Zero Energy Building in Severe Cold Area. J. Build. Energy Effic. 2019, 47, 1–5. [Google Scholar]
Figure 1. Monthly averaged outdoor temperature for a year in Harbin city of China.
Buildings 13 01098 g001
Figure 2. Architectural floor design of passive building.
Buildings 13 01098 g002
Figure 3. Building physical model.
Buildings 13 01098 g003
Figure 4. Front building physical model facing (left panel) south and east (right panel).
Buildings 13 01098 g004
Figure 5. Percentage diagram of partial loads.
Buildings 13 01098 g005
Figure 6. Hourly dependent peak load in cooling season.
Buildings 13 01098 g006
Figure 7. (a) Fitted profile of heat transfer coefficient versus insulation layer thickness, (b) building load energy consumption varying with insulation layer thickness, (c) electricity consumption and CO2 emission in dependence on insulation layer thickness, and (d) energy efficiency versus heat transfer coefficient, for wall envelope.
Buildings 13 01098 g007
Figure 8. (a) Fitted profile of heat transfer coefficient versus thermal insulation layer thickness, (b) building load energy consumption varying with thermal insulation layer thickness, (c) electricity consumption and CO2 emission in dependence on insulation layer thickness, and (d) energy efficiency versus heat transfer coefficient, for roof envelope.
Buildings 13 01098 g008
Figure 9. (a) Fitted profile of heat transfer coefficient versus thermal insulation layer thickness and (b) energy efficiency versus heat transfer coefficient, for floor (left panels) and interior wall (right panels) envelopes.
Buildings 13 01098 g009
Figure 10. Building load (left panel) and energy efficiency (right panel) versus heat transfer coefficient for exterior windows.
Buildings 13 01098 g010
Figure 11. Building load (left panels) and energy efficiency (right panels) in dependence on the window-wall ratio of (a) east, (b) south, (c) west, and (d) north facades.
Buildings 13 01098 g011aBuildings 13 01098 g011b
Table 1. Built-up areas in main functional divisions of passive building.
Functional DivisionBuilt-Up Area/m2Functional RegionBuilt-Up Area/m2
First-floor exhibition hall600Staff canteen250
Large office110Restroom63
Small office30Second-floor conference room260
Reception room20Second-floor office70
Table 2. Specifications on indoor temperature and environment humidity.
SeasonTemperature during
Working Hours/°C
Temperature during
Non-Working Hours/°C
Relative Humidity
/%
Summer263040~65
Winter2015
Table 3. Indoor parameters.
ParameterLighting Power/W·m−2Per Capita Occupied Area/m2·p−1Per Capita Fresh Air Volume/m3·h−1·p−1Electrical Equipment Power/W·m−2Human Metabolic Rate/W·p−1
Value33230150.9
Table 4. Heat transfer coefficient K of envelope structure.
Building Envelope StructureExterior WallRoofFloorInterior WallExterior WindowExterior Door
K/W·m−2·K−10.20.250.31.21.21.5
Table 5. Comparison between the results of simulation and measurement.
Indoor Temperature/°CPower Consumption/kW·h
SummerWinterSummerWinter
Simulation24.7522.4246.3763.58
Measurement26.0924.3452.4172.24
Table 6. Referenced building performances.
Building Performance IndicatorsCooling SeasonHeating Season
cumulative load/kWh68,137.95418,808.38
cumulative load per unit area/kWh·m−213.5583.34
peak load/W45,747.56168,892.77
peak load per unit area/W·m−29.1033.60
peak load timeAug-09-14:00Jan-23-12:30
outdoor temperature at peak load/°C33.10−22.7
Peak power consumption/W175,942.45
annual power consumption per unit area/kWh·m−2 12.80
CO2 emission/kg836,130.4
Table 7. Material properties of building exterior wall.
MaterialHeat Transfer Coefficient/W·m−2·K−1Heat Capacity/J·kg−1·K−1Density/kg·m−3
Brick (100 mm)0.848001700
Extruded polystyrene foam board (XPS)0.034140035
Concrete block (100 mm)0.5110001409
Table 8. Material properties of building roof.
MaterialHeat Transfer Coefficient/W·m−2·K−1Heat Capacity/J·kg−1·K−1Density/kg·m−3
Asphalt (0.01 m)0.710002100
Fiberglass (0.05 m)0.035140025
Gypsum board (0.15 m)0.25896.32800
Disclaimer/Publisher’s Note: The statements, opinions and data contained in all publications are solely those of the individual author(s) and contributor(s) and not of MDPI and/or the editor(s). MDPI and/or the editor(s) disclaim responsibility for any injury to people or property resulting from any ideas, methods, instructions or products referred to in the content.

