1. Introduction
Nowadays, most sectors are establishing greater energy efficiency demands because of both natural resource depletion as well as global warming. This aspect, together with deficient building energy performance [
1,
2,
3,
4], is a starting point on which this study focuses. In the quantified data, the building sector is responsible for almost 30% of the global energy consumption [
5], generating 40% of pollutant gas emissions in the atmosphere.
One of the main challenges of the building sector is meeting the European goals concerning sustainable or high energy efficiency buildings or nearly zero energy buildings (nZEB). The relevant strategies have focused on reducing the energy demand as much as possible; hence, the European Commission has developed new strategies related to indoor air quality, whose scope is based on designing high energy performance buildings [
6]. Moreover, several energy efficiency and sustainability indicators have been recently developed. In particular, LEED, BREAM, VERDE, and Passivhaus certifications, as well as the last and most original certification developed by the European Union, LEVEL (S), have shown a tendency towards integrating environmental parameters into buildings. Certified buildings are not only environmentally sustainable and healthy, but are very effective for reducing energy demands, with reductions from 62% in modern buildings in Ireland [
7] to 80% in traditional buildings in the middle of Europe [
8,
9].
As for research into global warming, six assessment reports [
10] and many other studies on climate change, the increase on greenhouse gas emissions (GHG), and the lack of natural resources [
11,
12,
13] have been written since the foundation of the Intergovernmental Group of Experts on Climate Change (IPCC) in 1988. Energy consumption predictions and users’ climate adaptability could be modified because of climate change. Thus, building energy modernisation is among the main challenges of today’s society, mainly to guarantee an acceptable performance in future scenarios.
As for reducing emissions in the building sector, populations have recently increased in urban areas. In 2020, 55.3% of the world population lived in urban areas, and according to the United Nations’ projection, this percentage is expected to increase up to 68% by 2050 [
14]. Migratory movements from the country to the city are more common in Latin American countries, where people commonly migrate to increase their income. However, this movement does not guarantee an improvement in individuals’ quality of life but causes housing deficits because the dwellings’ demand is not always met due to both the lack of infrastructure or the fact that many family units have no access to a dwelling that meets habitability and health conditions.
According to the Inter-American Development Bank’s data, one out of three family units (i.e., 59 million people) in Latin America lives in a dwelling under unacceptable or poor conditions or does not have access to basic services [
15]. Some of these family units live in dwellings built directly on the ground, with no sanitary services or waste collection. These situations, together with crowding, increase the possibilities for parasitic diseases to be spread among users. Other problems, such as a lack of access to heating and/or cooling systems, could result in respiratory or skin diseases [
16].
Therefore, there are public programmes in each country to reduce these data; however, most of them focus on reducing the quantitative deficit and address new family units, without considering family units made up by members of advanced years or living in a dwelling under unacceptable conditions [
17]. Funds of these types of programmes are limited, so buildings are usually built in areas with low land value, mostly in urban peripheries [
18]. A low investment in infrastructure and equipment also implies that the dwellings of these programmes are not always adapted to the place where they are constructed (often over a short term), thus increasing the use, conservation, and maintenance costs [
19].
This situation is similar in Ecuador, the country on which this study focuses. A total of 45% of Ecuadoran family units live under unacceptable conditions, with 36% corresponding to a qualitative deficit and with the remaining 9% corresponding to family units with no dwelling [
20]. If these values are extrapolated to the two quintiles with less income, the result is that the deficit reaches 67% (i.e., 53% qualitative and 14% quantitative).
Thus, the Government of the Republic of Ecuador has been developing social housing programmes to reduce that deficit according to the principles of the National Plan for Good Living [
21], in turn referring to the Constitution of the Republic of Ecuador of 2008 [
22], which indicates that all Government levels should guarantee the population access to decent dwellings.
The energy and resource components are other problems that arise due to the building sector being directly or indirectly responsible for almost 40% of global energy consumption, and two tons of raw material are required by each building square meter [
22]. Thus, buildings are responsible for 39% of global GHG emissions. In the buildings’ life cycle, most emissions are generated by the use and maintenance phase, i.e., between 80 and 90% of the total emissions, from which up to 60% are related to the energy required for cooling and heating [
23].
In Ecuador, greater than 16% of energy was consumed by the building sector in 2015, whereas 12% corresponded to the residential sector in the same year [
24]. A portion of this energy corresponds to the users’ high expenditure to keep thermal comfort inside the dwellings that are not appropriate for the climate zone in which they are located. Moreover, the thermal transmittance of their walls is high, necessitating the use of active cooling or heating systems. For this reason, this study aims at assessing several options for dwellings that have been implemented by social programmes in Ecuador, focusing on their thermal comfort performance in both the current climate situation and the projection to 2050.
2. Data and Methods
2.1. Building Information
This study analyses the thermal comfort performance of an actual dwelling block, which was developed by the Republic of Ecuador’s Casa para Todos programme, whose project reaches 4174 dwellings distributed in 12 provinces [
25]. This paper is part of a sequence of a previous diagnosis that was identified as the first phase [
26] and established the climate zones to study, as well as the programming factors such as the comfort temperature ranges and usage and research profiles, which are this paper’s basis for presenting passive improvement options in the dwelling block and to study how they operate in each climate zone in two scenarios (2020 and 2050), considering the results obtained in the first phase.
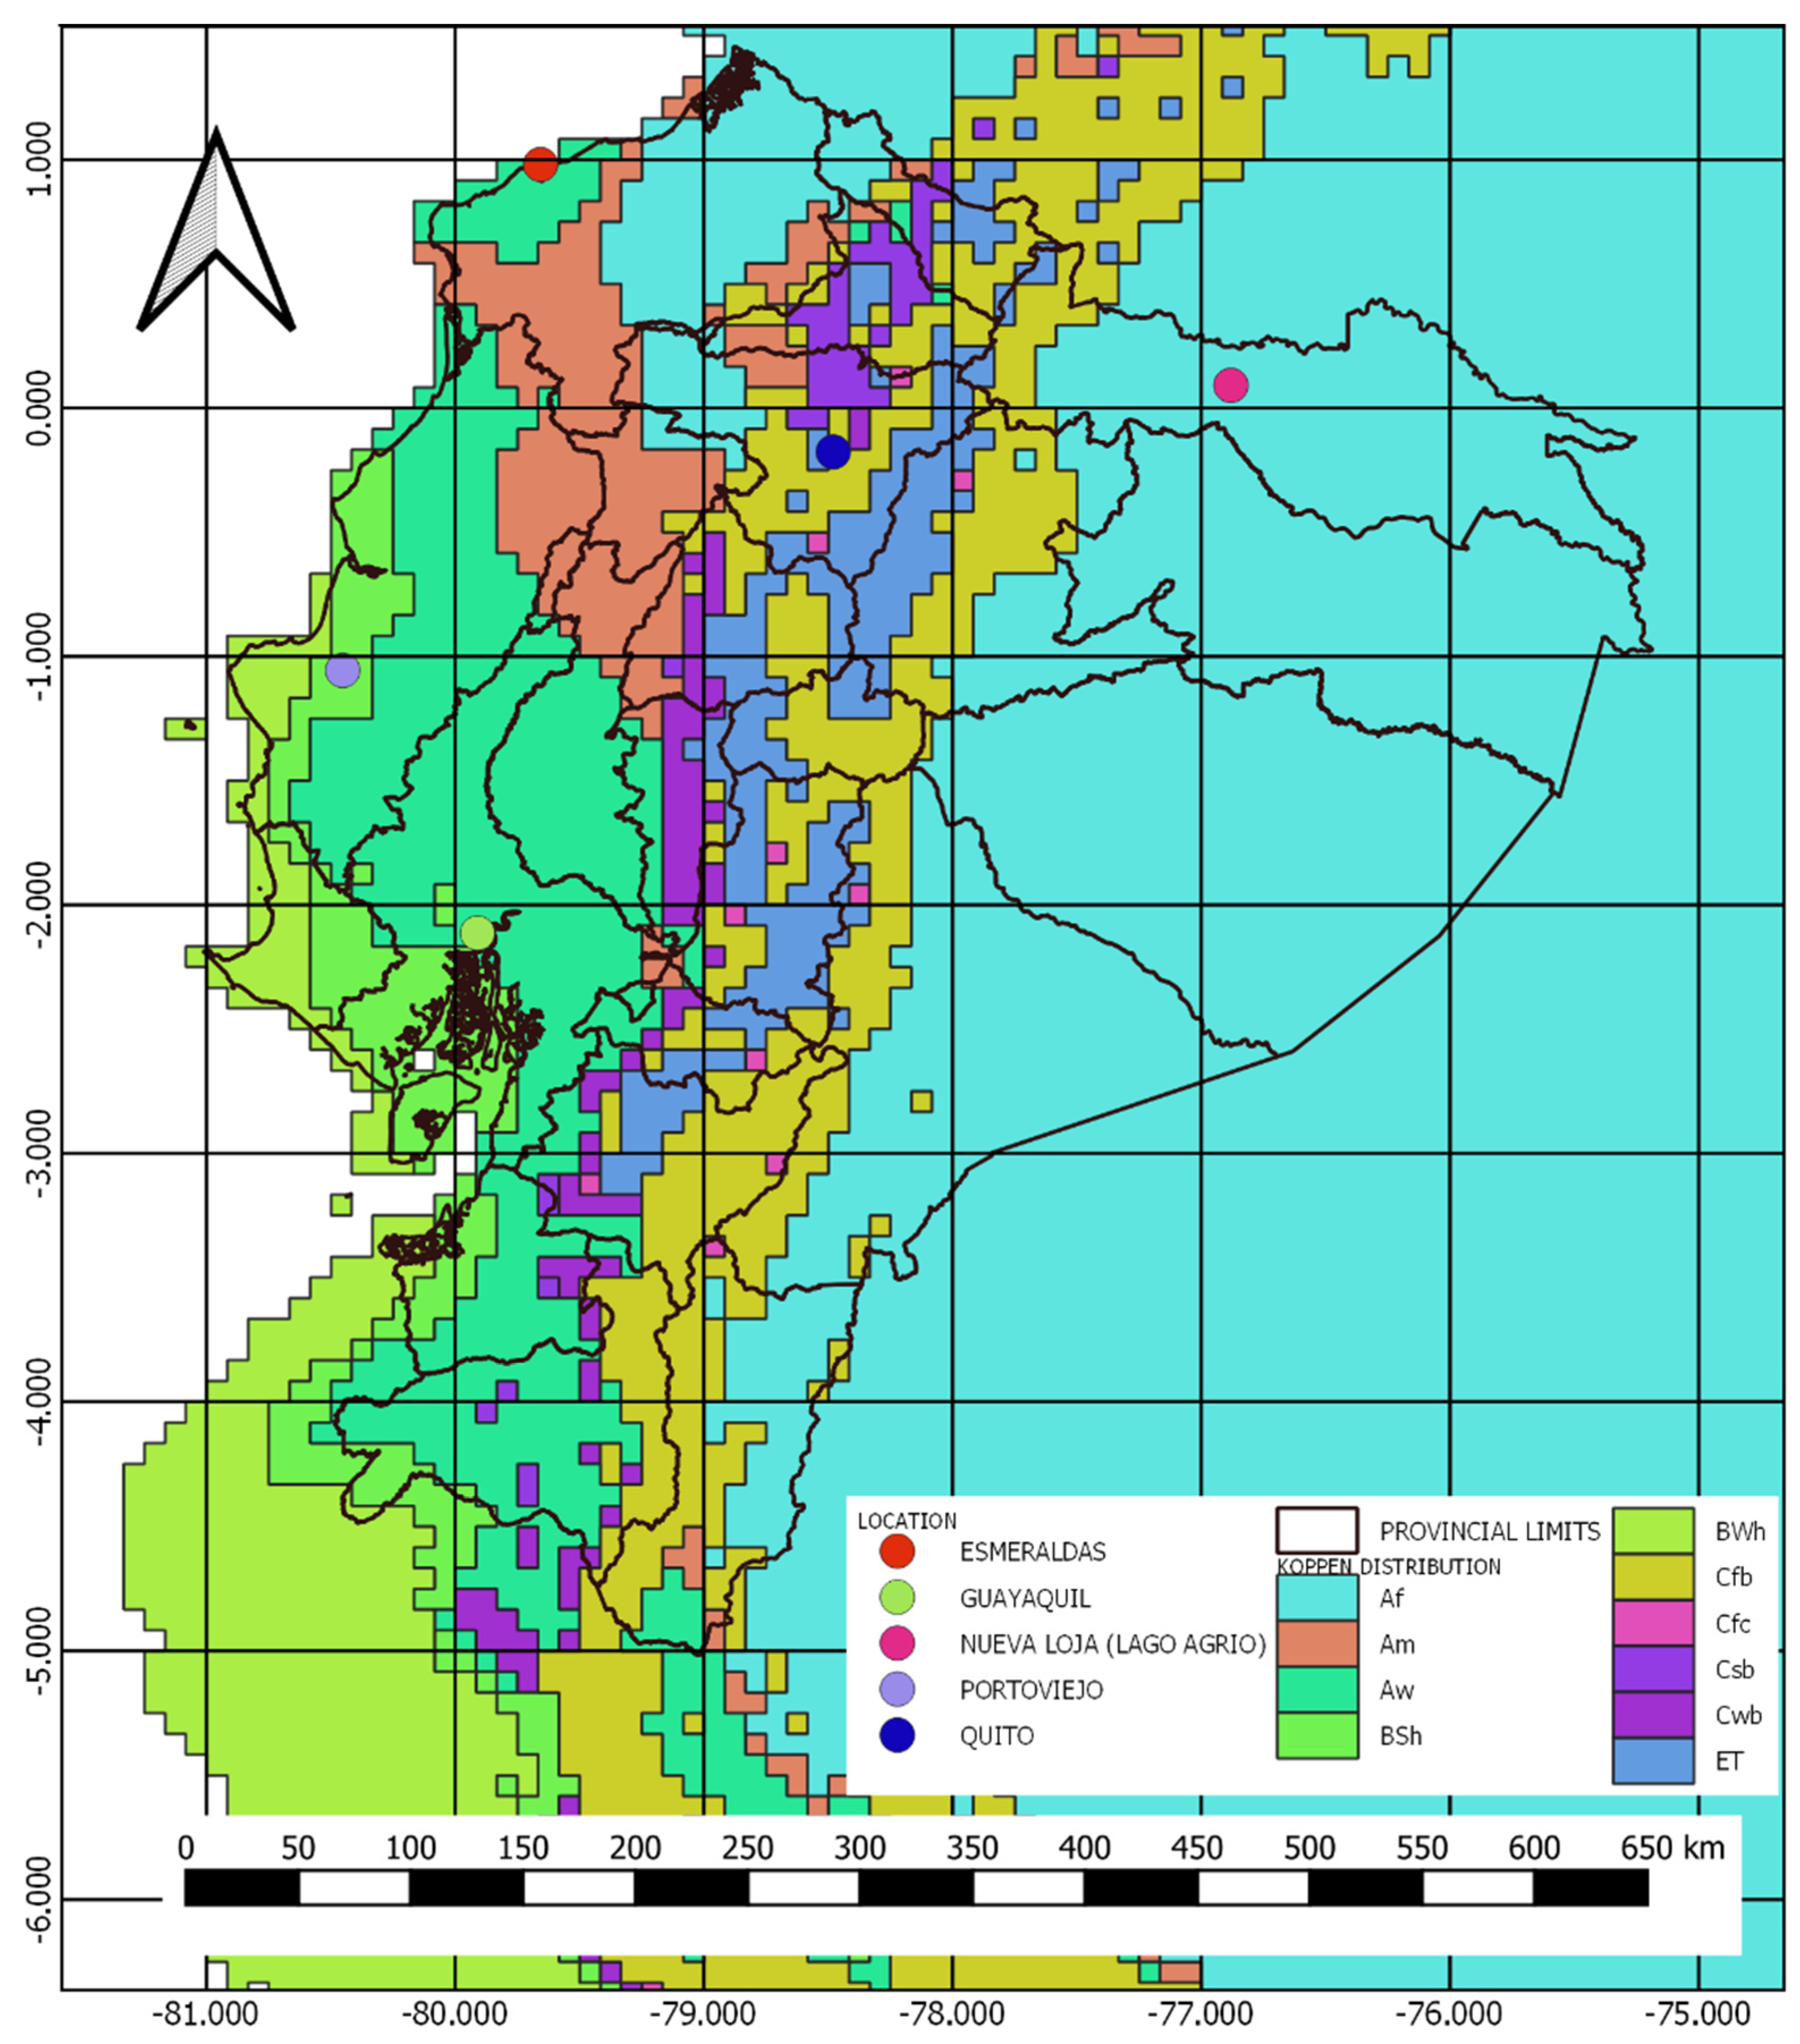
Four out of the eight climate zones existing in Ecuador, according to the Köppen–Geiger classification (
Figure 1), have been considered (i.e., Cfb, Af, Aw and BSh). This decision was made based on the statistical data that indicate that these climate zones are the most populated and have the greatest inhabitable area of the country. Likewise, the cities chosen per climate zone are those with the greatest demographic density (
Table 1) [
27].
Table 2 shows average monthly outdoor temperatures of the study cities in 2020 and
Table 3 shows them in projection B1 to 2050.
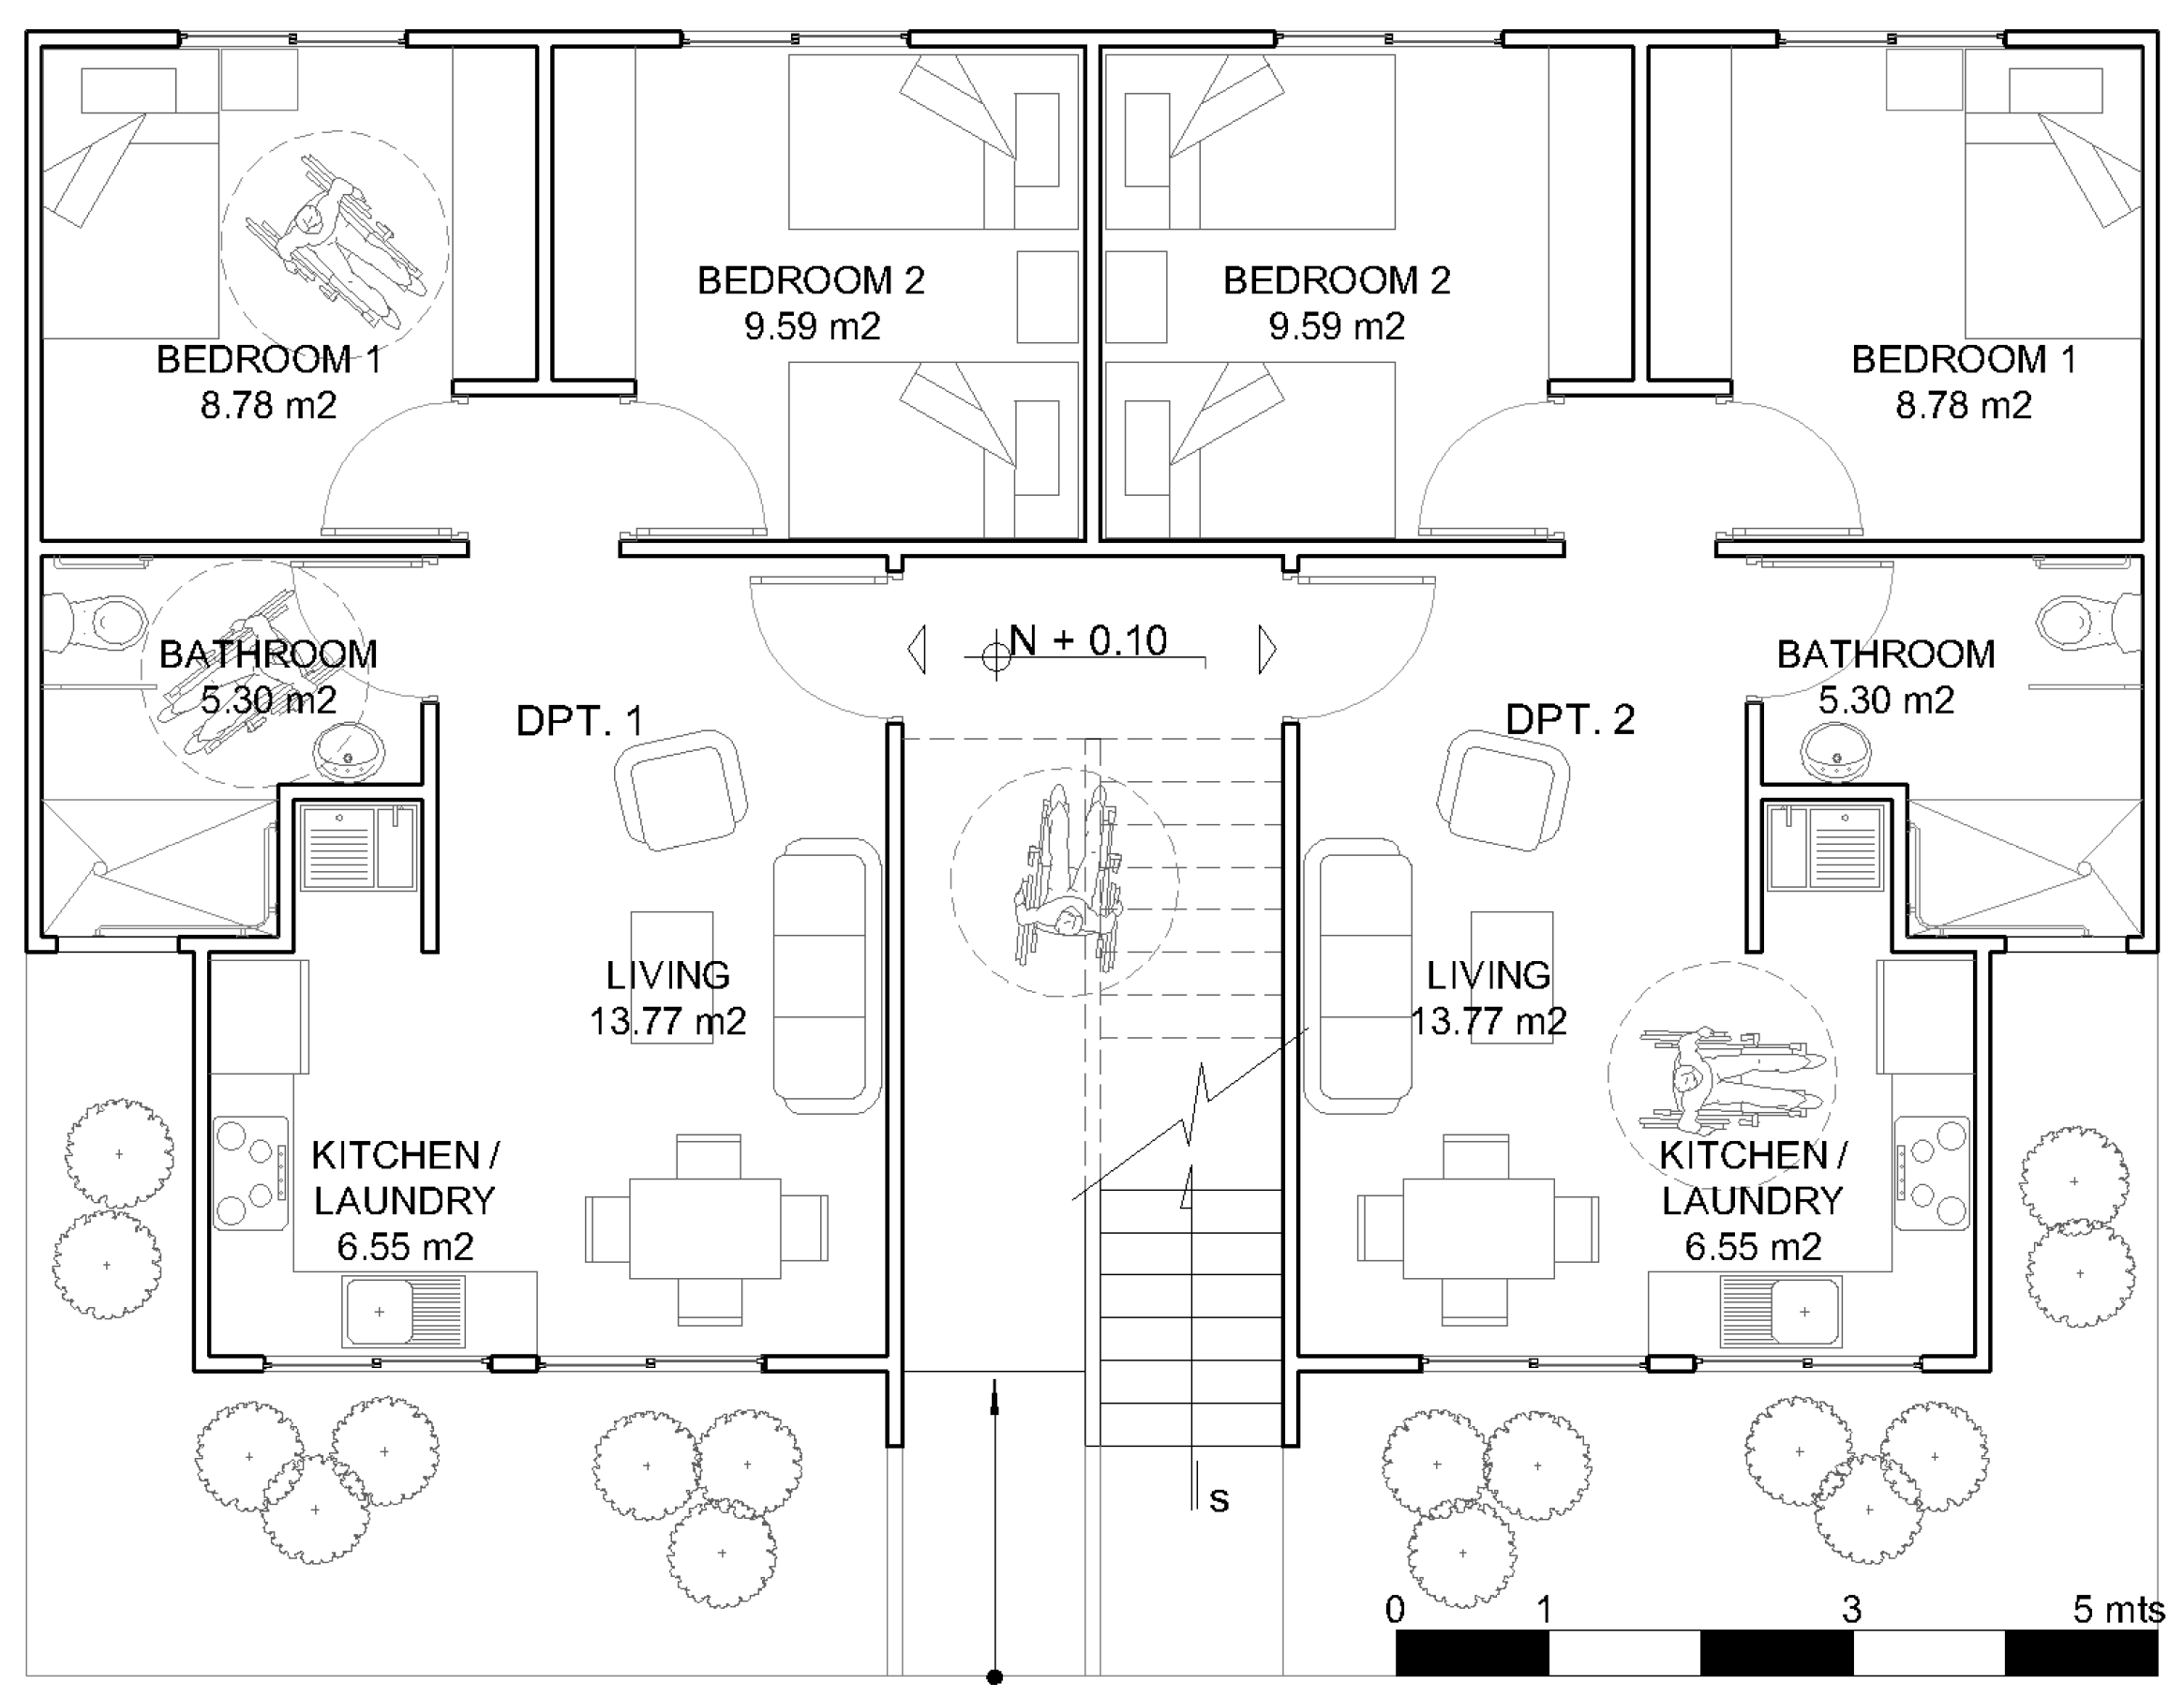
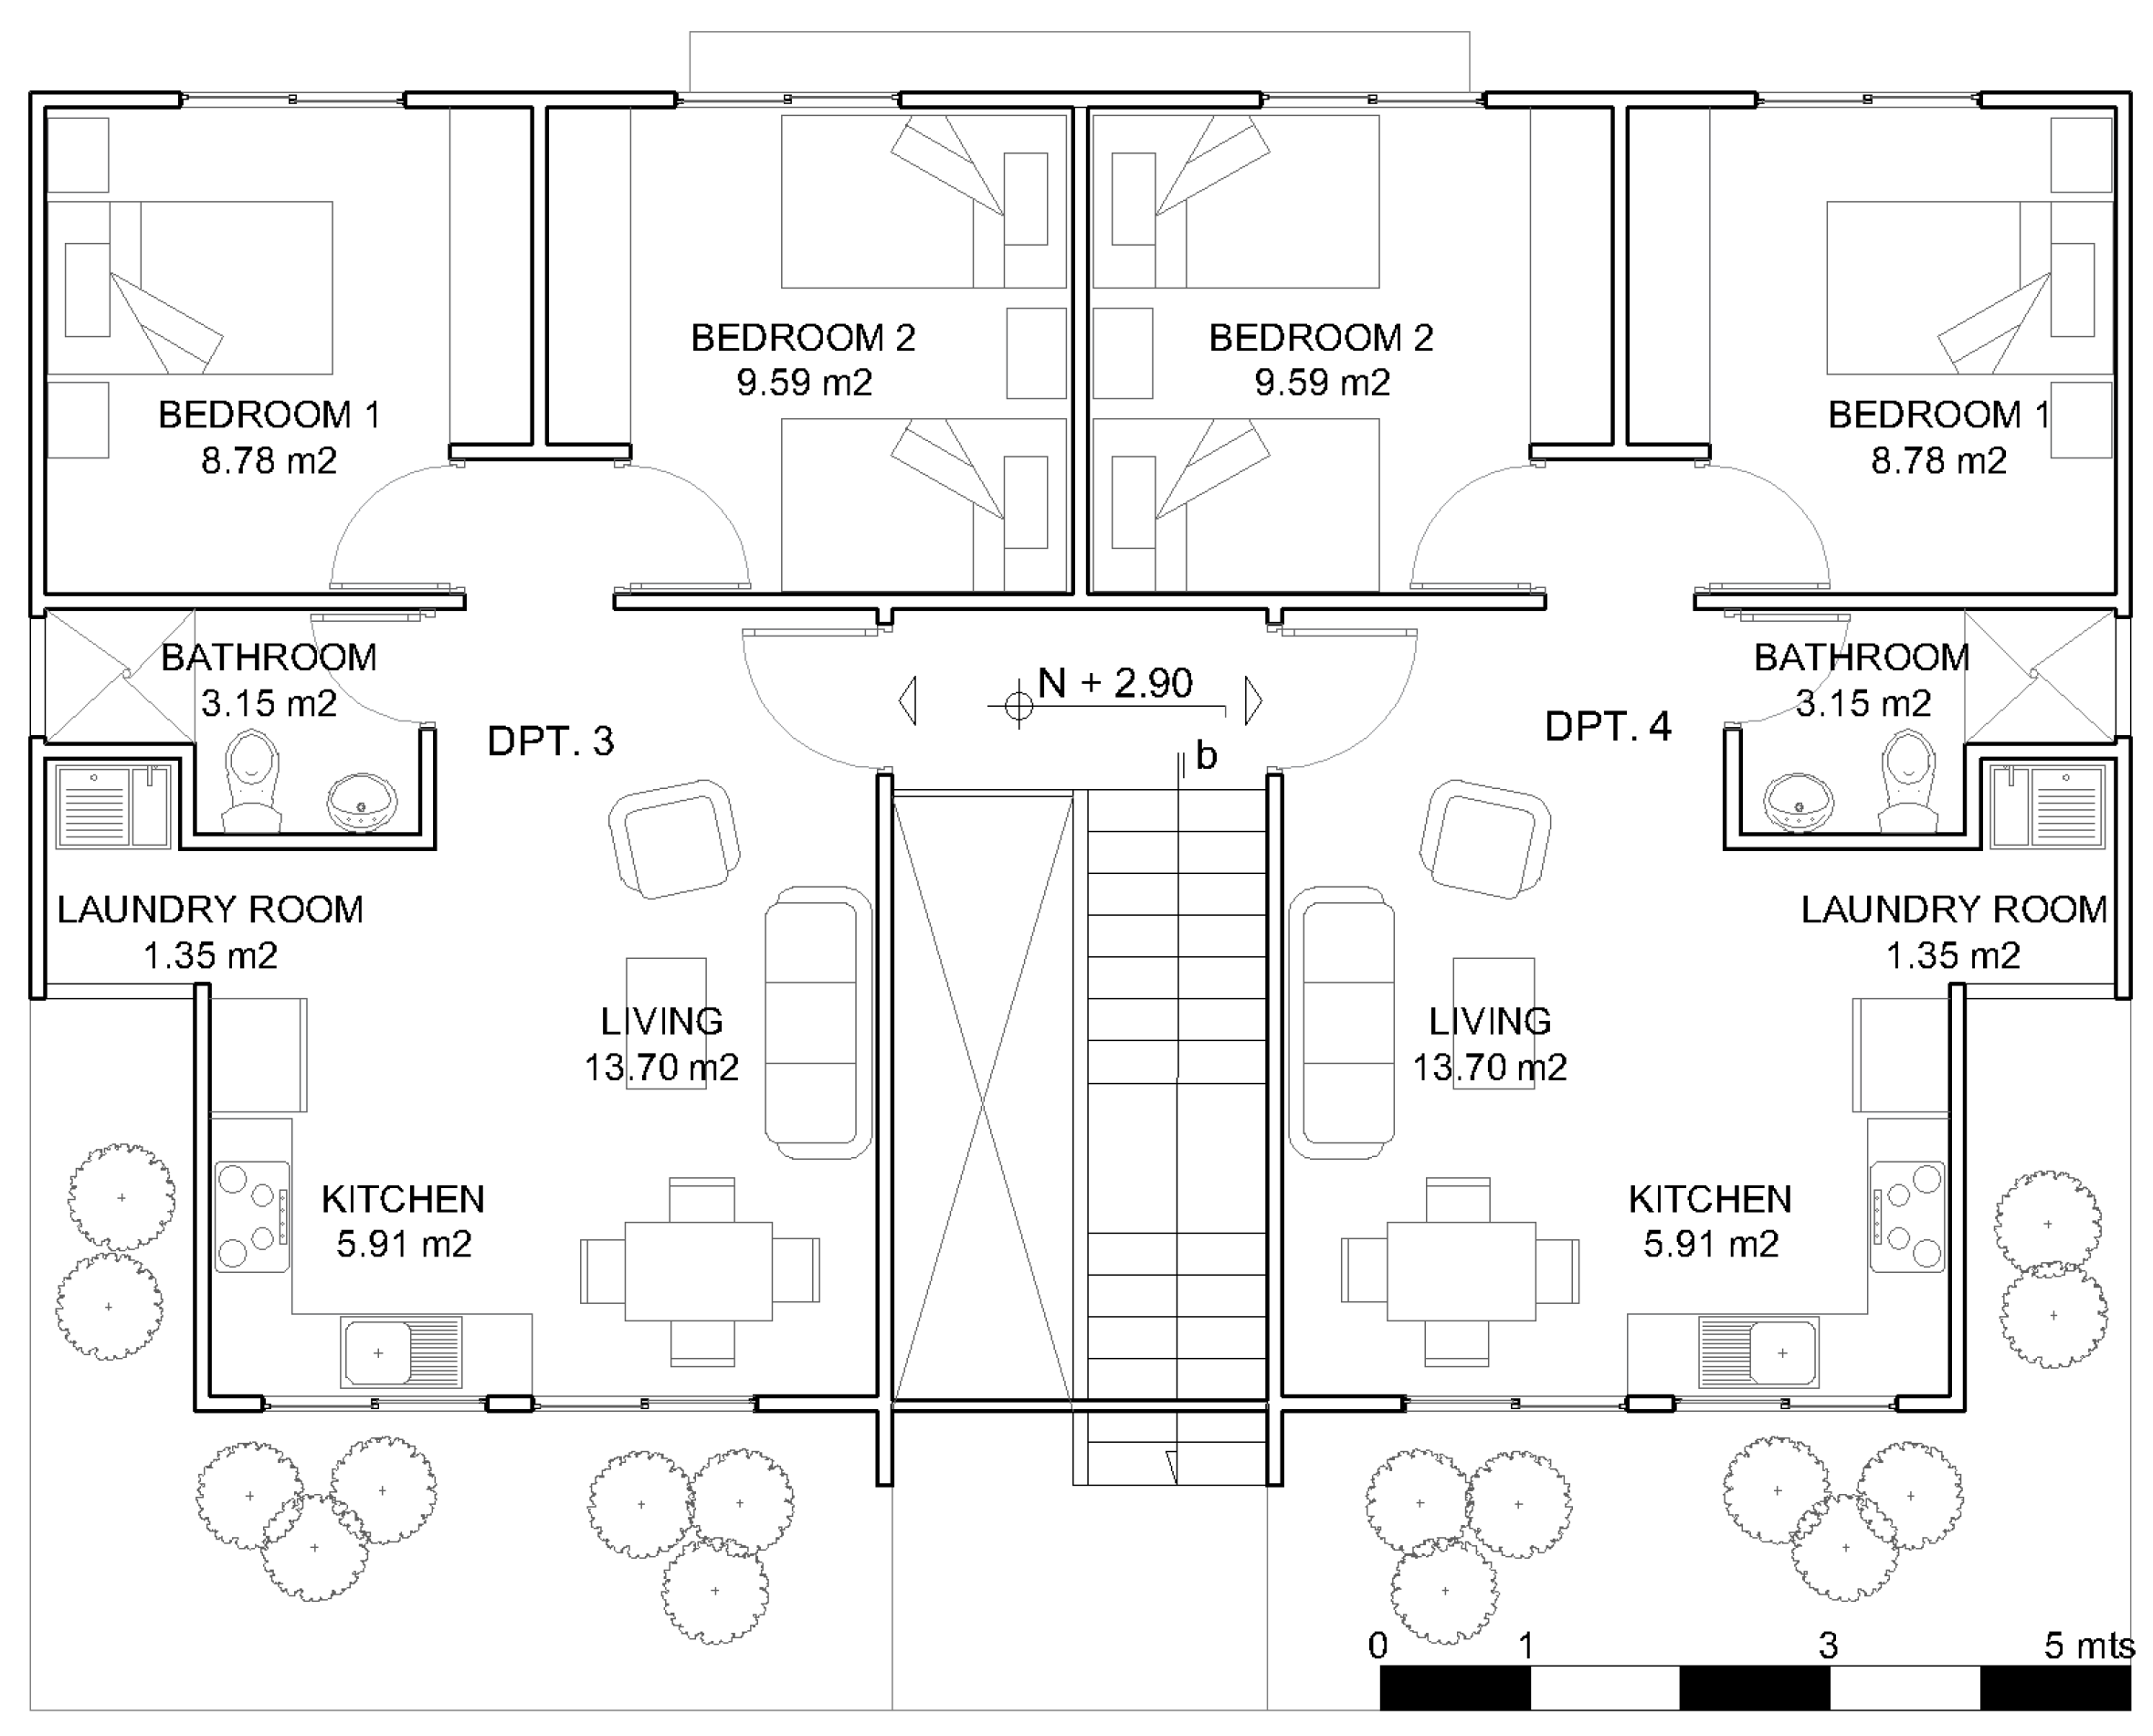
The block that was studied is part of the social housing programme implemented in Ecuador. The programme is called Casa para Todos. The block corresponds to 4D multi-family dwellings and is made up by four dwellings: two on the ground floor (
Figure 2) and two on the symmetrical upper floor (
Figure 3). Each dwelling is divided into two bedrooms, one bathroom, one kitchen, and one living-dining room, constituting 52 m
2 of the built area.
The main structure of the dwelling block, whose wall thermal transmittance is described in
Table 4, is based on reinforced concrete bearing walls of 10 cm of thickness. Its indoor cladding consists of a plaster levelling layer and plastic paint, and the outdoor cladding has a plastic paint finish.
The floor has a reinforced concrete foundation with a 10 cm thickness and a cladding composed of ceramic pieces. The roof is based on metallic plates with a 4 mm thickness, and 5 mm of polyurethane insulation at the interior. The exterior finishing work comprises both aluminium without a thermal bridge break and one transparent glass pane of 4 mm of thickness. Moreover, the block has metallic access doors and indoor drum type wooden doors.
2.2. Methods
After presenting the case study, design determinants or usage profiles are considered. The occupancy of each dwelling has been established for four people, from which 100% are in the dwelling from 7:00 p.m. to 06:00 a.m., 25% between 06:01 a.m. and 02:00 p.m., and 75% in the remaining time zone. Natural ventilation provided by opening windows is differentiated between warm climate zones with the same pattern throughout the year and the mild zone whose pattern changes according to the month (
Table 5).
Comfort temperature ranges between 20 and 25 °C have been established for the Af, Aw and BSh zones, and between 20 and 24 °C for the Cfb zone, following the recommendations by the National Institute of Energy Efficiency and Renewable Energy [
28], which indicates that the comfort temperature range between 18 and 23 °C is acceptable in winter, and between 22 and 26 °C in summer; however, there is no distinction between winter and summer when it is considered that the main temperature variation takes place between the day and night for each climate zone.
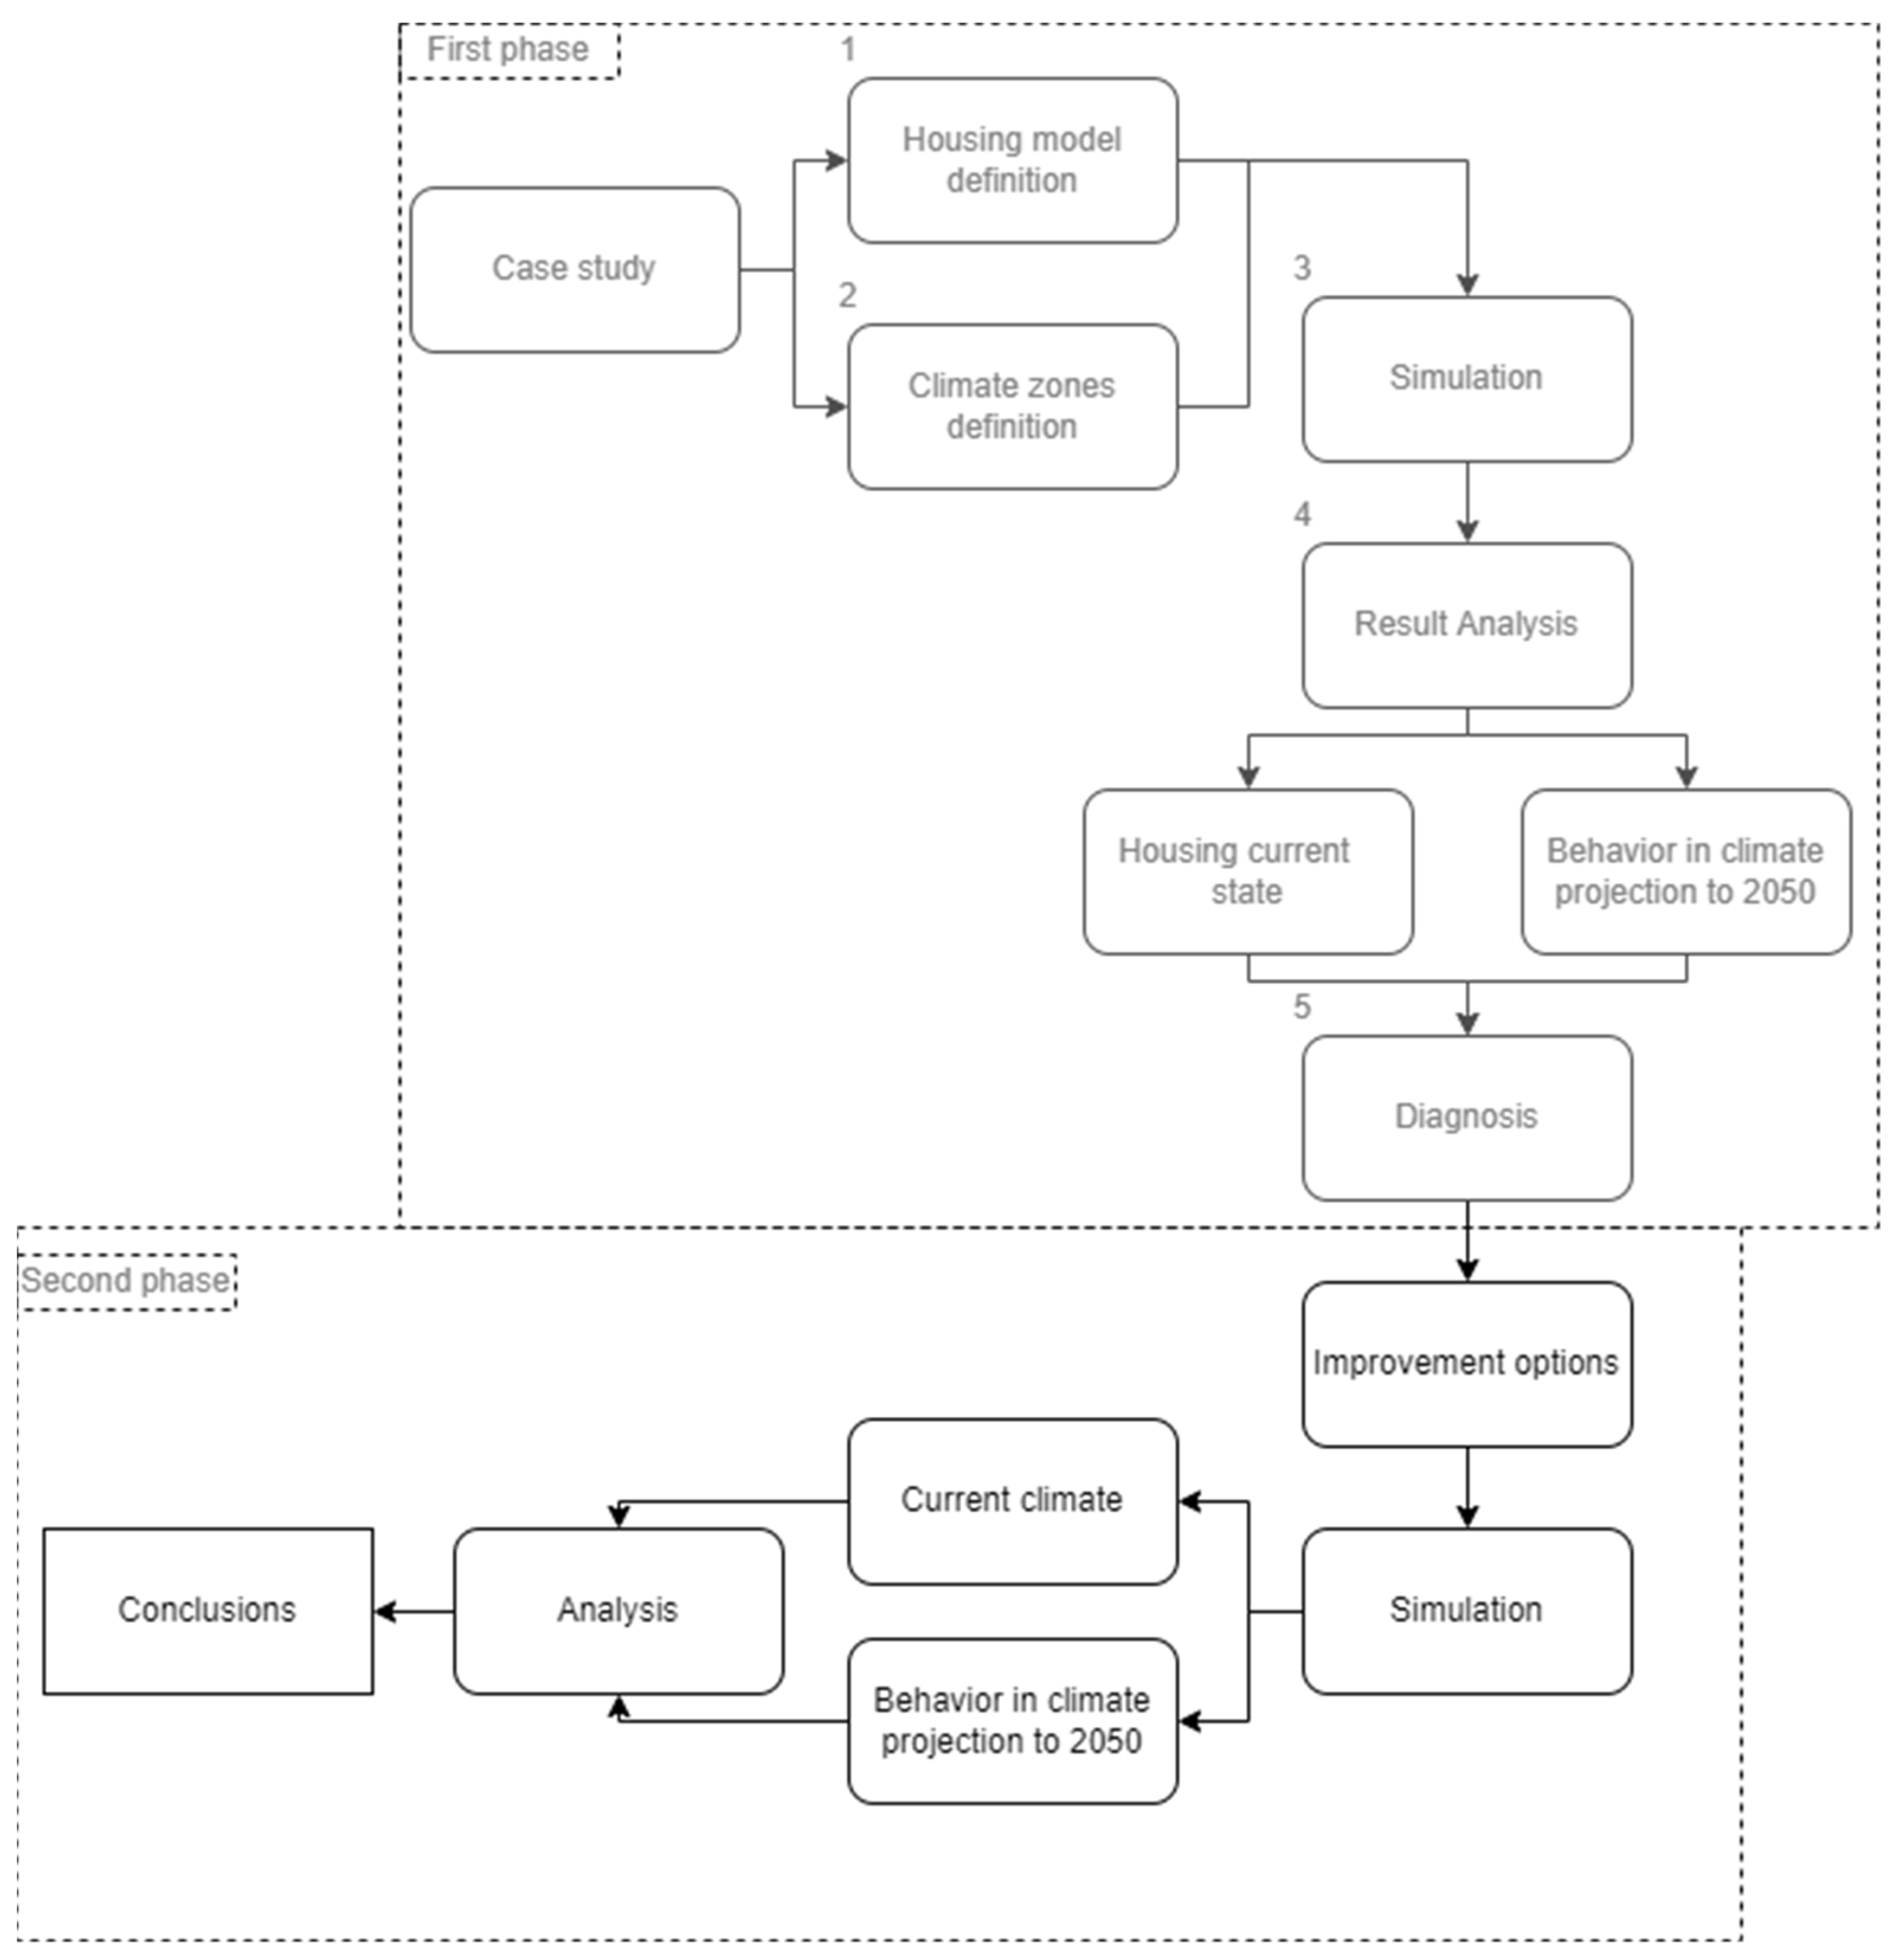
As previously mentioned, this study has a first phase (
Figure 4) that diagnoses the dwelling operation in the various climate zones in 2020 and its projection to 2050 [
26]. Thus, this study analyses the improvement options in the building envelope following the same system of the first phase (
Figure 4). The first phase consisted of defining the model to establish the parameters of the building in which the occupancy and ventilation profiles are described, as well as the climate zone with the corresponding file. After defining and including all these parameters, the results were simulated and analysed in the current climate scenario and its projection to 2050. This process is repeated with each option, and results are then compared. A total of 56 simulations were performed to describe each scenario according to the improvement solutions proposed.
Based on the results of the first phase [
26], which have been the basis for this study, the building envelope was modified, and each variation was simulated in the various climate zones for the current situation and the projection to 2050 by using the climate files obtained by interpolating data using the Meteonorm computer software. Simulations were performed in the zones according to the first problem detected in the initial diagnosis included in the first phase, in which three climate projection scenarios (A2, B1, and A1B) were used, as they were the most used methods to perform simulations. For this reason, these scenarios have also been used in the second phase to facilitate the comparison of the results of both phases. To project the improvement options, only the B1 scenario was used, because it presented intermediate results in each diagnosis simulation of the first phase [
26].
Table 6 includes the simulated improvement measures and the climate zones where they have been studied. All options are described in detail below and have been chosen according to the national documents’ recommendations [
28,
29], the materials available in the local market [
30], and the results obtained in the diagnosis of the first phase.
Option 1.
The current roof of the dwelling has been replaced by a sandwich roof with insulation of 60.00 mm of polyurethane, recovered by a sheet metal of 2.50 mm in the exterior and of 2.00 mm in the interior as this roof is easily acquired in the Ecuadorian market, and according to the manufacturer’s data, its thermal transmittance is 0.36 W/(m2k) and its weight is 11.80 Kg/m2.
Option 2.
The transparent glass with a 4.00 mm thickness has been replaced by a low-emissive double glass with a 3 mm thickness and air gap, with a thermal transmittance of 1.8 W/(m2K), whose specifications are based on the availability of the material in Ecuador. The goal of this measure is to reduce the thermal transmittance of glasses, so it has been applied only to dwellings in the BSh, Af, and Aw zones.
Option 3.
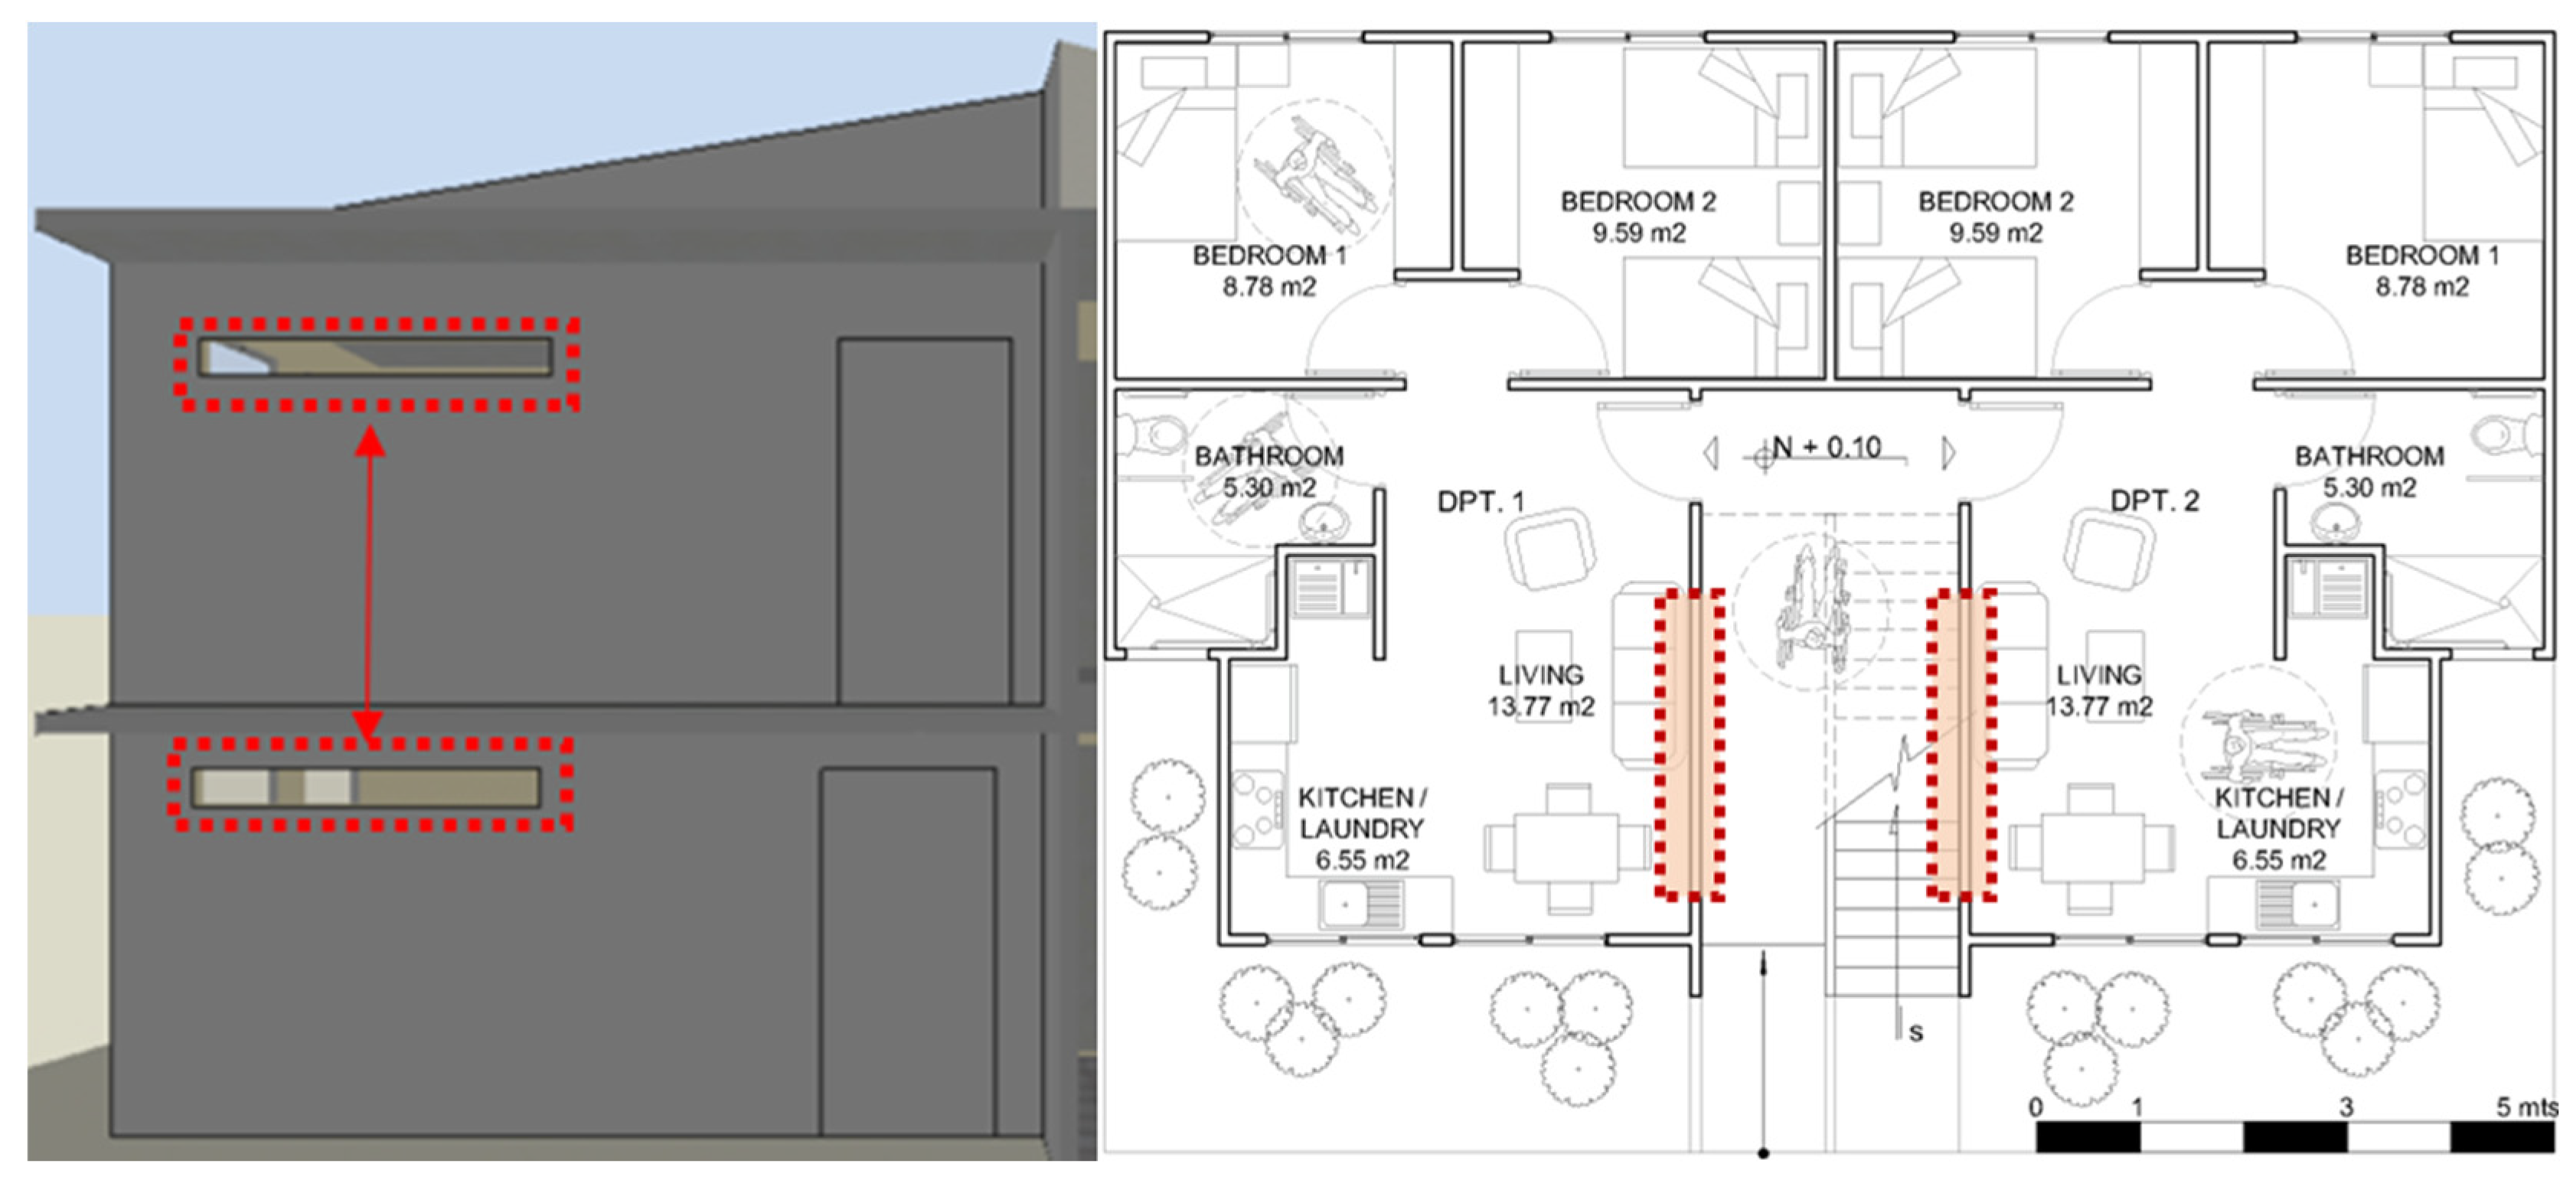
This option considers opening holes of 3.00 × 0.40 m starting at a height of 2.00 m in walls in contact with the common area (
Figure 5). These openings will connect the living-dining room to ease the air circulation and thus cool the dwelling. This has been considered to improve the crossing of air in the living room, as the window openings are on the same plane (front facade), and so this natural movement of air was not being used. Therefore, this change has been applied only in one climate zone, BSh of the city of Portoviejo, as its situation is the most critical regarding the hours within the comfort range. In addition, an attempt is made to recreate the characteristics of the vernacular dwellings located in this climatic zone.
Option 4.
This option consists in placing insulation in the interior side of the wall with a double layer of 8 mm of polyurethane, a total of 16 mm, and then covering it with a plaster finish, which would be the same finish of the current dwelling, reaching a thermal transmittance of 6.23 W/(m2K) in comparison with the 10.37 W/(m2K) that corresponds to the existing proposal. The type of insulation and thickness has been chosen based on the availability of the materials in Ecuador. The dwelling’s performance has been studied with this option only in the climate zones whose diagnosis results were the most extreme, Cfb and Bsh, which correspond to the coldest and the warmest climates, respectively.
Option 5.
The roof has been elevated 0.50 m over the current height of the block to generate a ventilated air gap. This option has been studied in the climate zones for which the heat transfer should be reduced in the upper floor (BSh, Af, and Aw).
Option 6.
This option combines Option 5 with overhangs of 0.50 m on the windows of each dwelling. The size of each overhang has been chosen according to the variation of the angle of the sun’s projection of shadows on the windows. This option has been studied in the warmest climate zones (BSh, Af, and Aw) as the goal was to reduce heat gains.
Option 7.
Based on the results of the initial diagnosis, this option has been considered for the warmest zone (BSh) by combining Options 2 and 6, that is, replacing the original glass with low-emissive glass, elevating the roof 50 cm, and placing overhangs on the windows.
3. Results
The result of the first phase of this study [
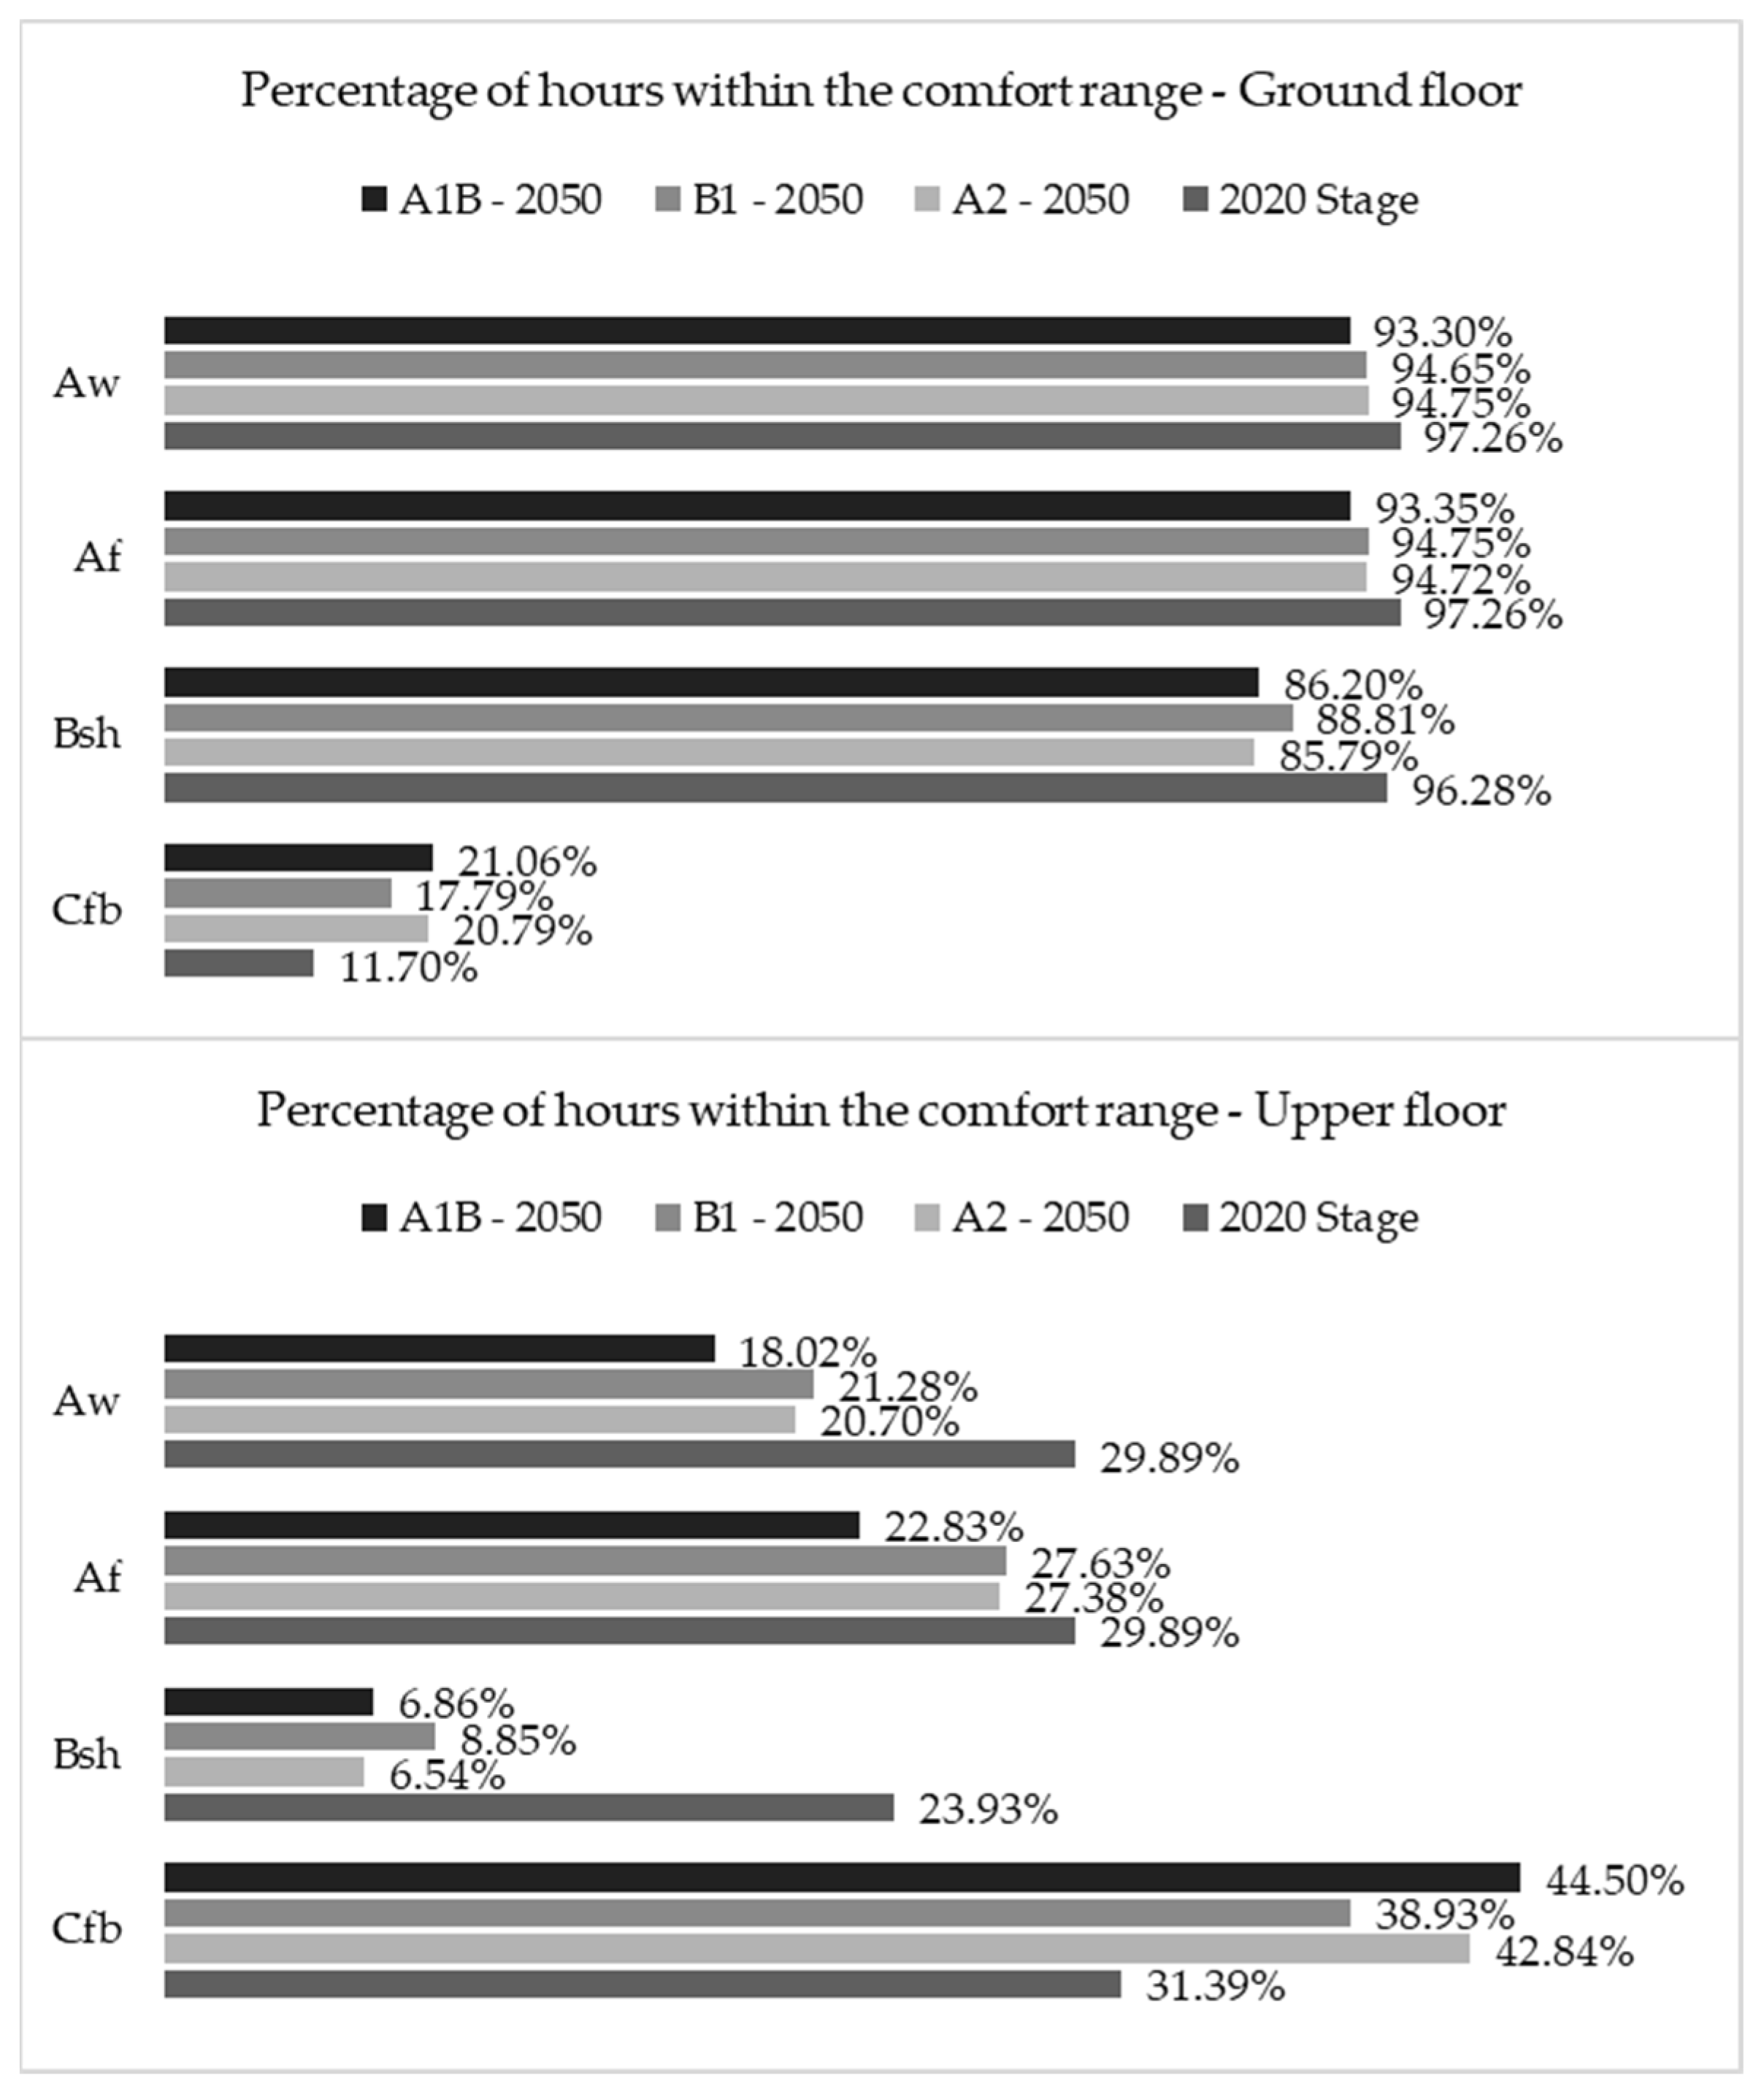
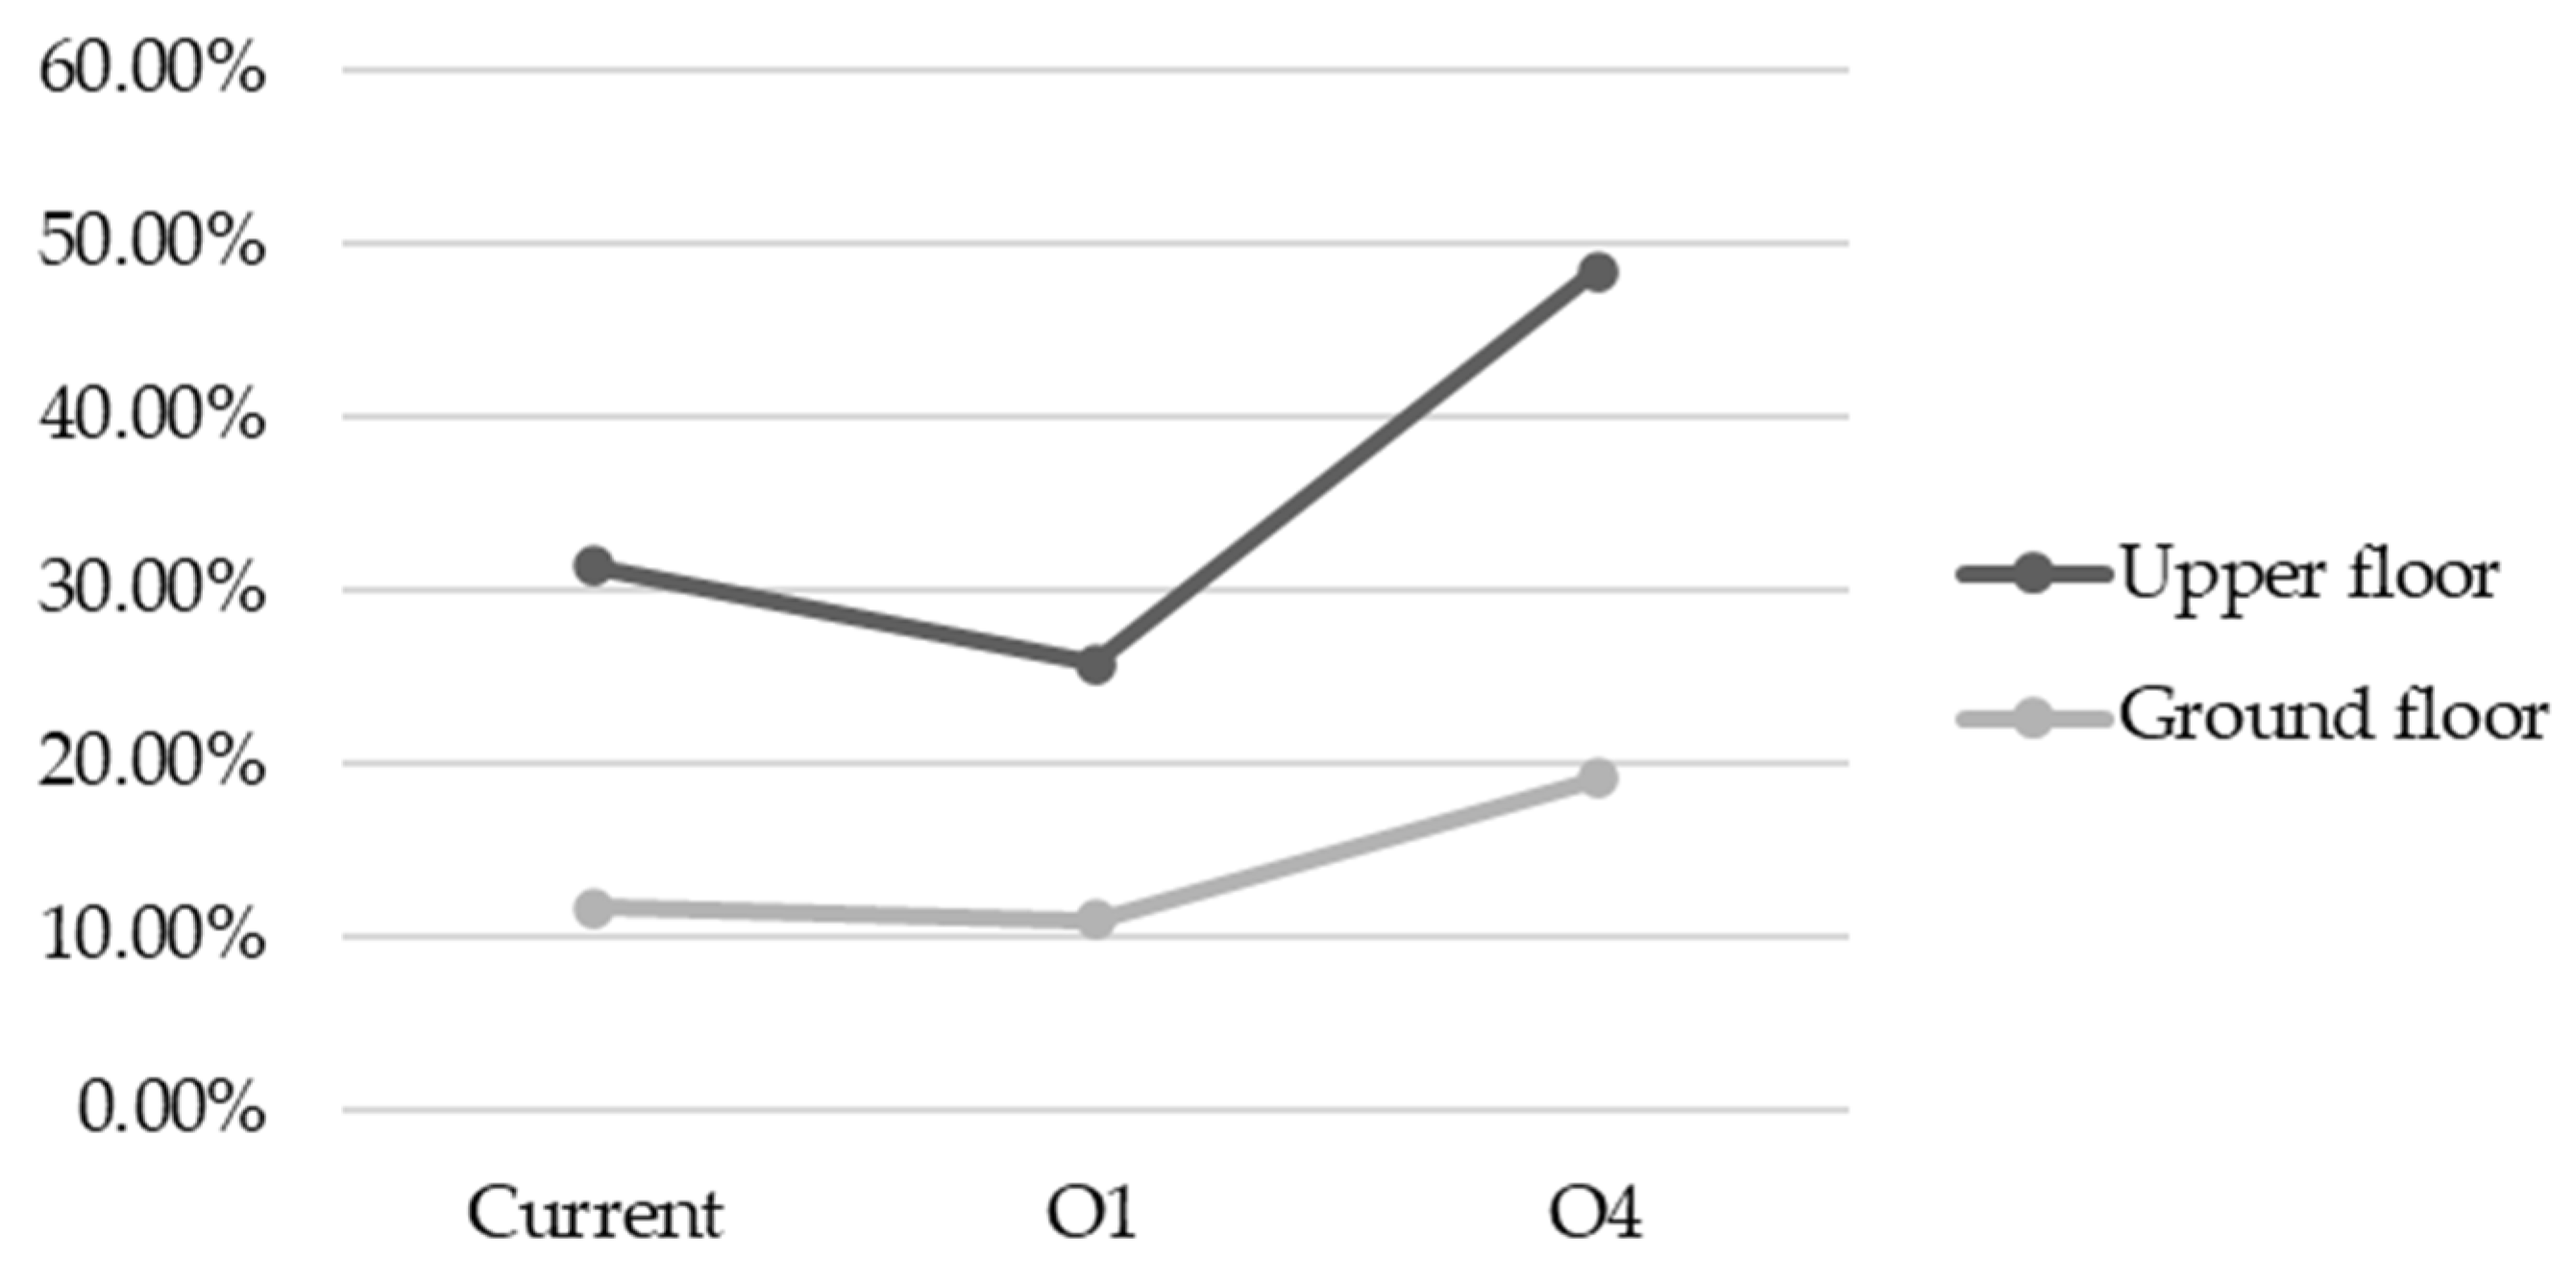
26] determined that there was a greater temperature difference between the dwellings on the ground floor and those on the upper floor, which have fewer comfort hours throughout the year due to the high thermal transmittance of the roof. In the warmest zones (BSh, Aw, and Af), the temperature ranges were comfortable on the ground floor 90% of time, whereas it was reduced to less than 30% on the upper floor. On the contrary, in the Cfb zone, temperatures that were within the comfort range on the ground floor reached less than 12% in comparison with 31% on the upper floor.
As for the projection to 2050, the temperatures inside the dwellings behaved similarly in the three scenarios. The percentages within the comfort ranges were reduced both on the ground and upper floor in the BSh, Aw, and Af zones, whereas this percentage was greater than in the current scenario in the Cfb zone.
Figure 6 shows this comparison, only indicating the results obtained in the first phase that are the basis of this work; it shows the percentages within the comfort range obtained by the simulations of the existing block in 2020 and with 2050 for the A1, B2, and A1B projections.
The results obtained by analysing each improvement option are described below. These options were simulated in the current scenario and in the projection to 2050 by using the B1 scenario, which as mentioned above, obtained intermediate results in the projections, indicating that this projection has been simulated only in those options with significant results in the current climate situation.
Option 1. Sandwich roof.
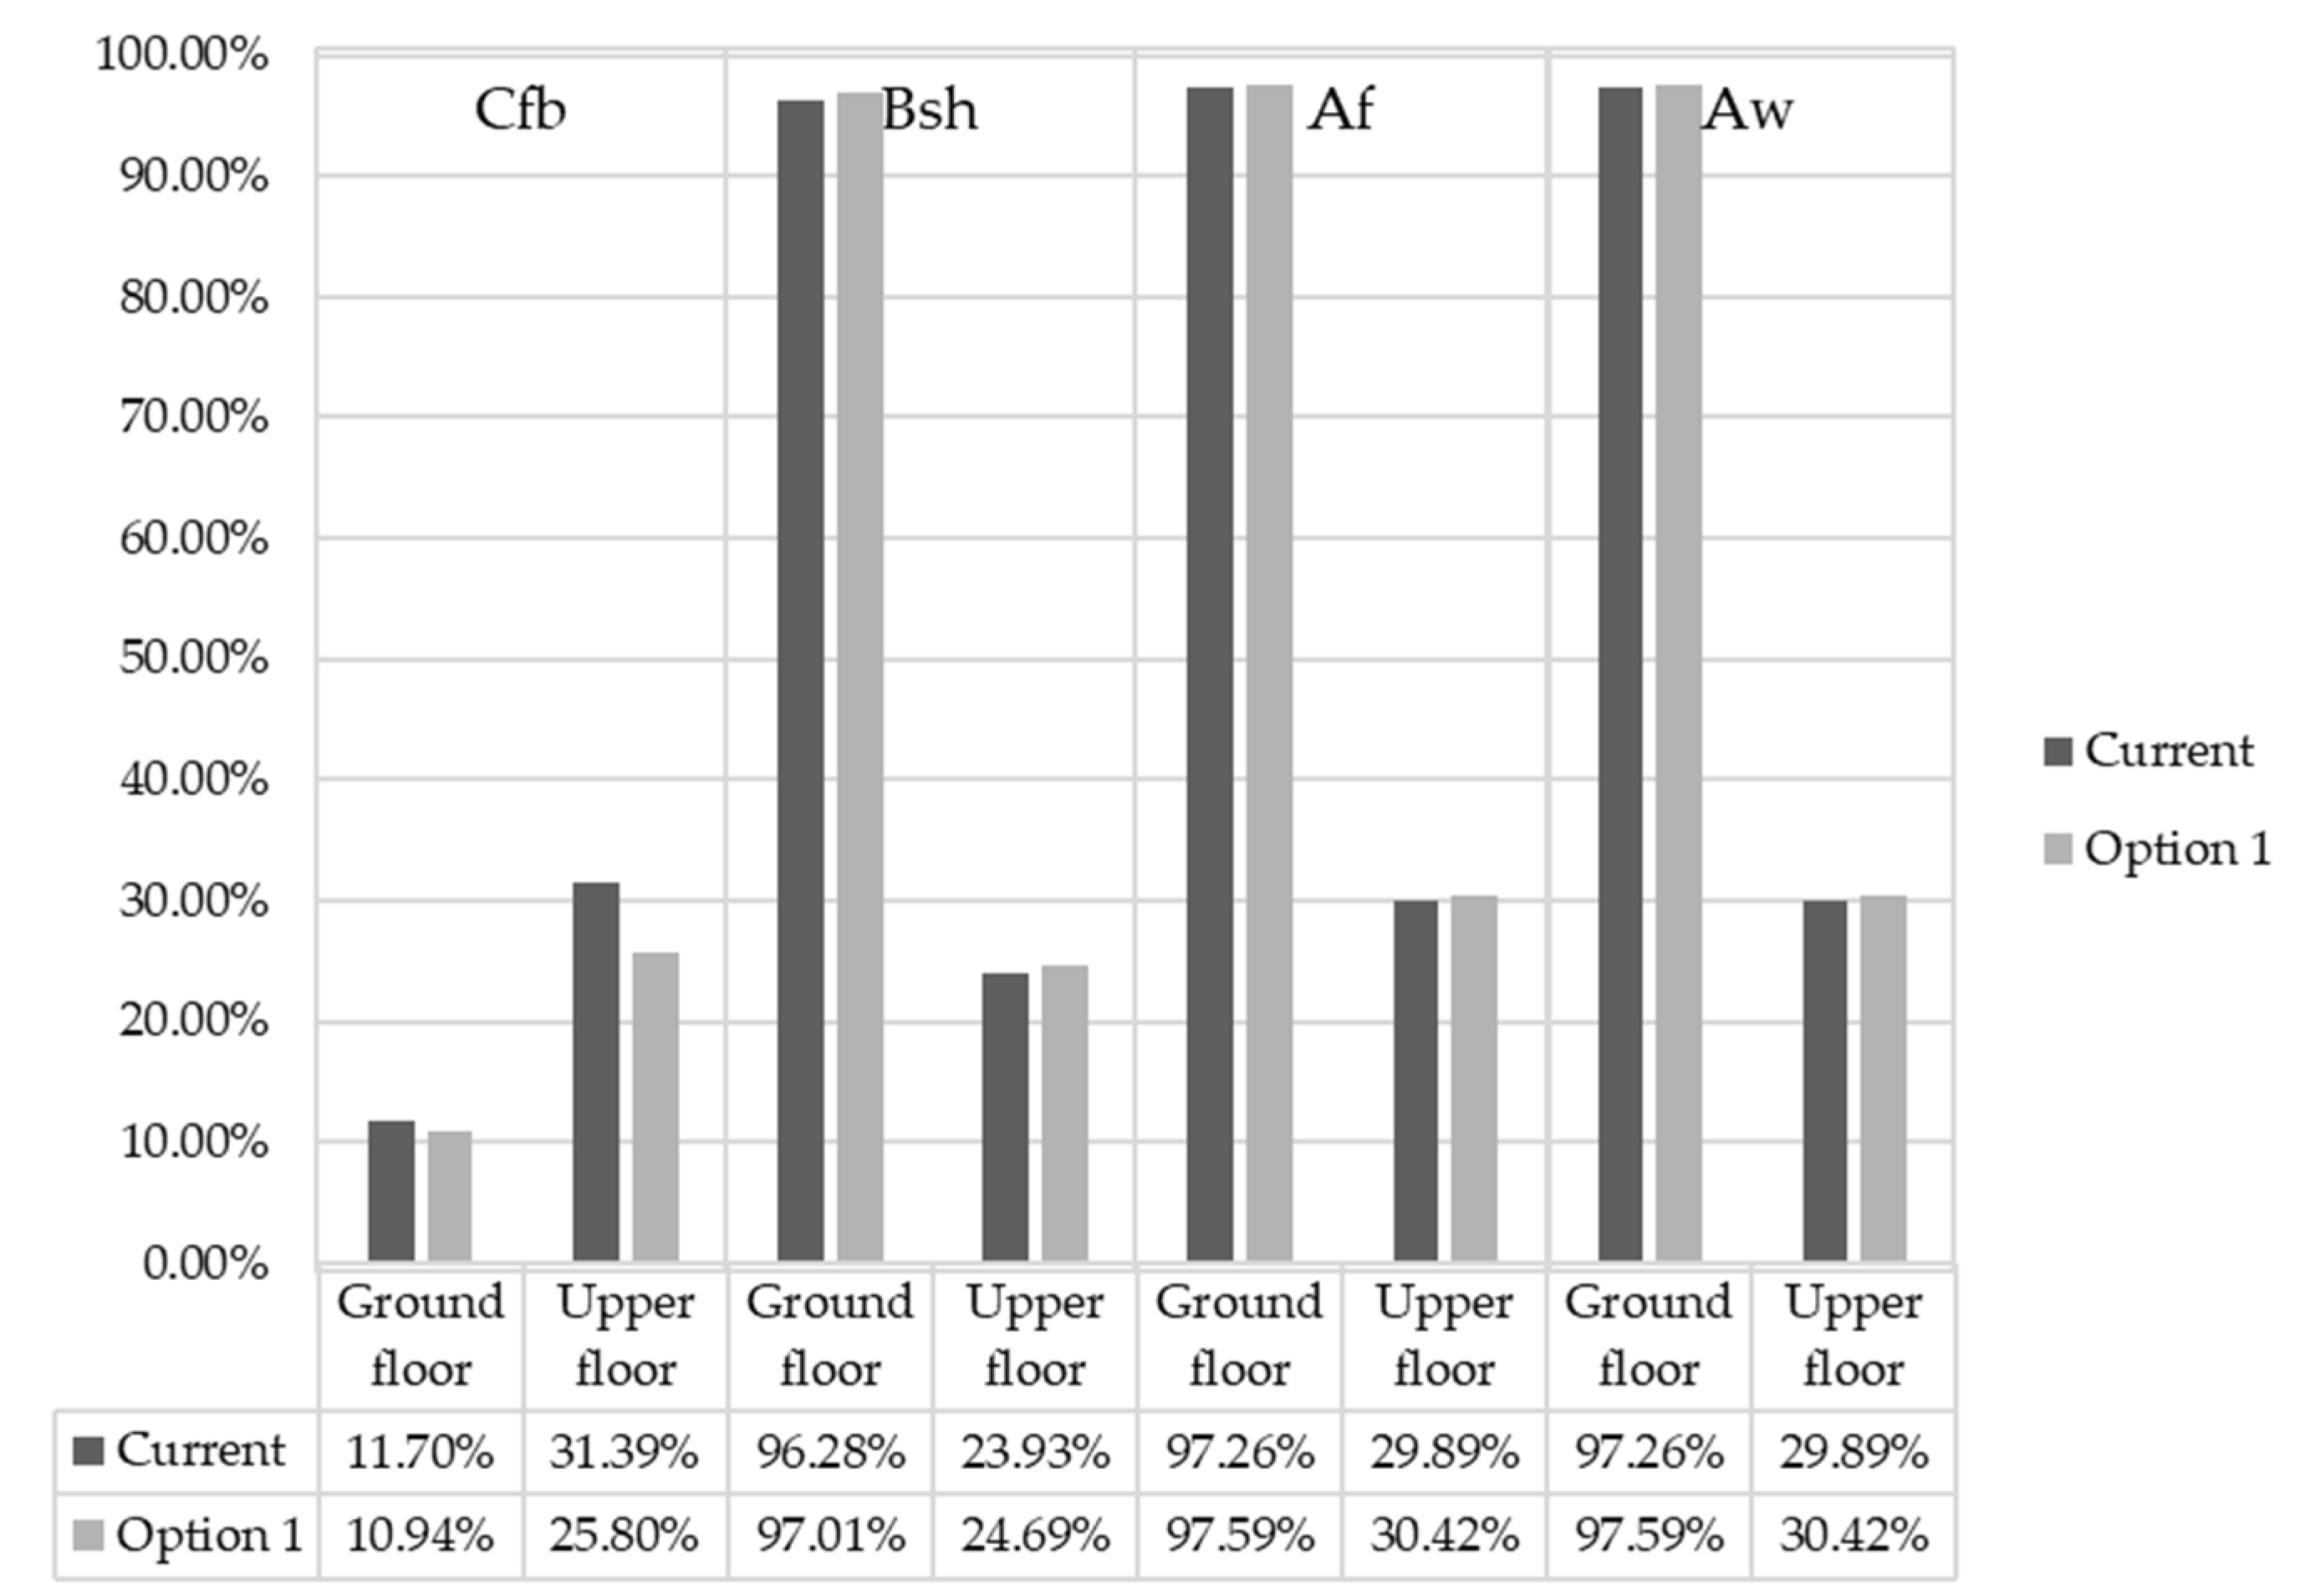
The dwellings in the BSh, Af, and Aw zones slightly improved their thermal comfort by changing the building roof; however, the increase of the percentage of hours within the comfort range was less than 1%. On the other hand, the dwellings in the Cfb zone reduced the percentage more than five points.
Figure 7 shows this comparison. This option was not simulated in the projection to 2050, because in the 2020 climate situation there was a reduction within the comfort ranges for one climate zone and a slight increase (less than 1% in the remaining zones), so this option was rejected.
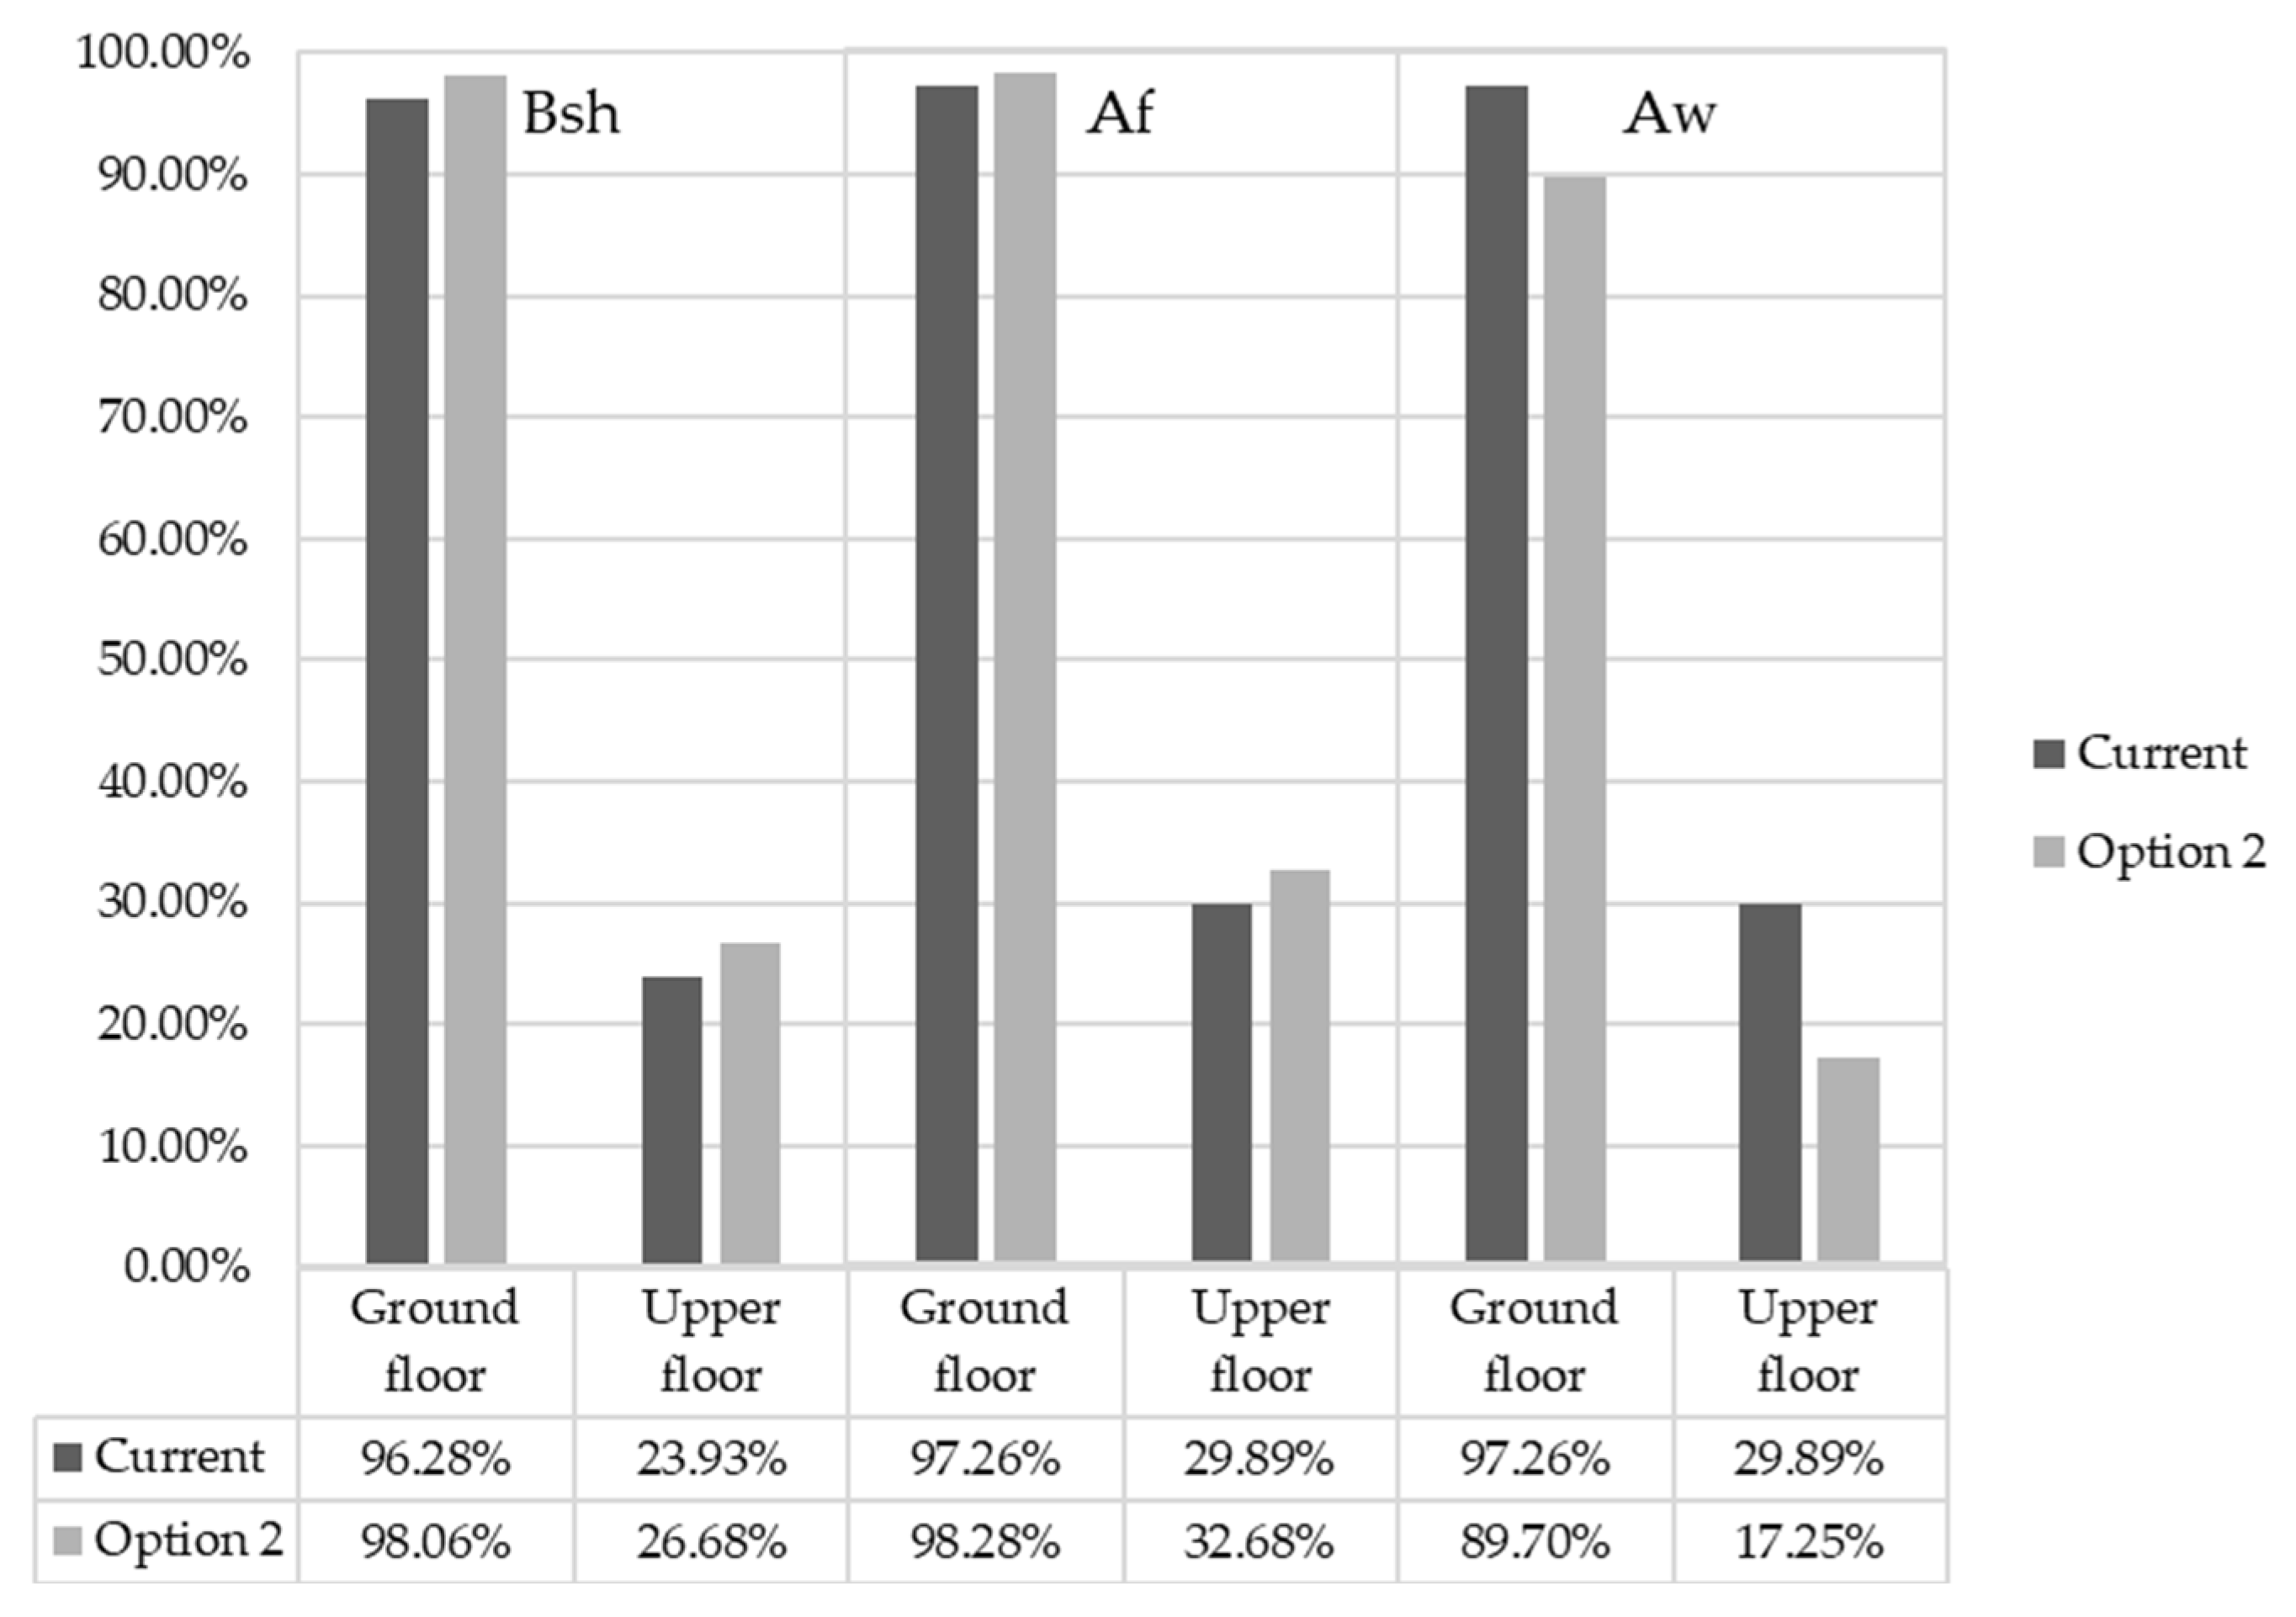
Option 2. Glass replacement.
The percentage of hours within the comfort range established for this study was increased by replacing the type of glass in all the windows of the block. However, this improvement was not very effective as it did not exceed three points in the BSh and Af zones. On the contrary, in the Aw zone, the hours within the comfort range were reduced by around 10%, as shown in
Figure 8. This option was not simulated in the projection to 2050, because in the 2020 climate situation there was a reduction within the comfort ranges for one climate zone, so this option was directly rejected.
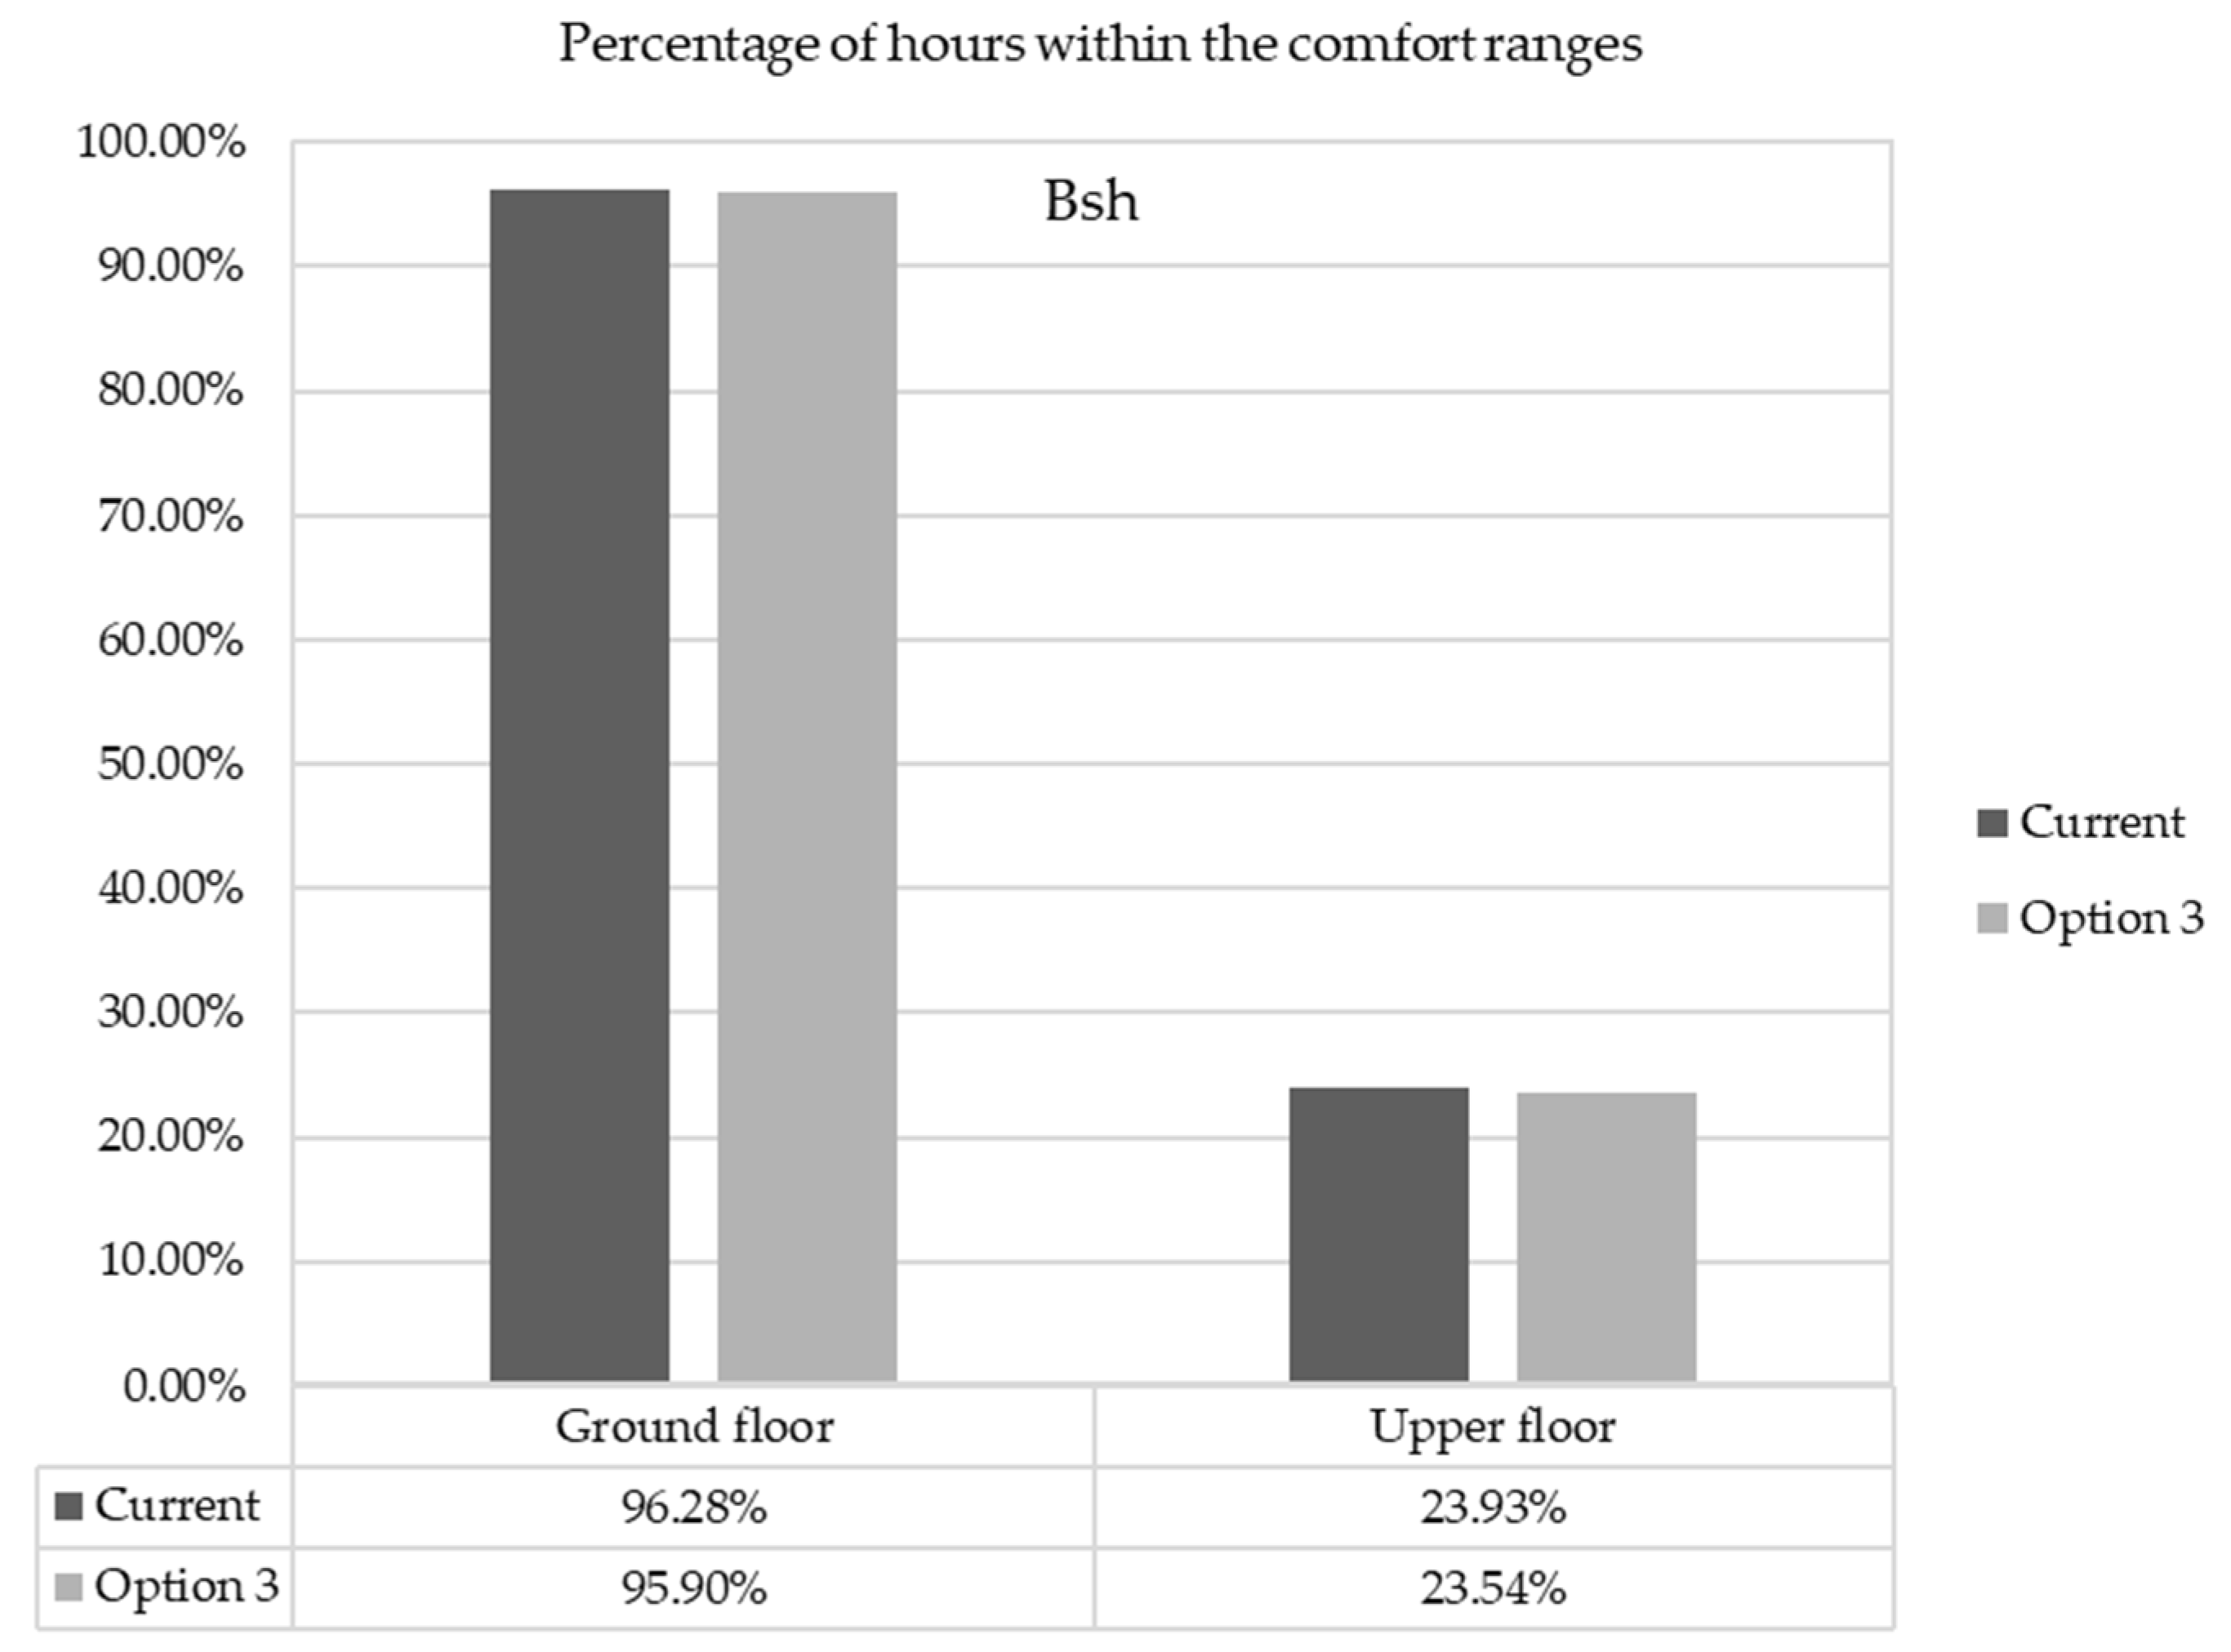
Option 3. Opening holes in the walls.
As for the simulation in the BSh zone that entailed opening holes in the lounge-dining rooms, the result was negative, because the hours within the comfort ranges were reduced by almost 0.50%, as shown in
Figure 9. The reason for this was that the floor–roof height of the dwellings was not enough to contribute to air movement. This option was not simulated in the projection to 2050, because in the 2020 climate situation there was a reduction within the comfort ranges.
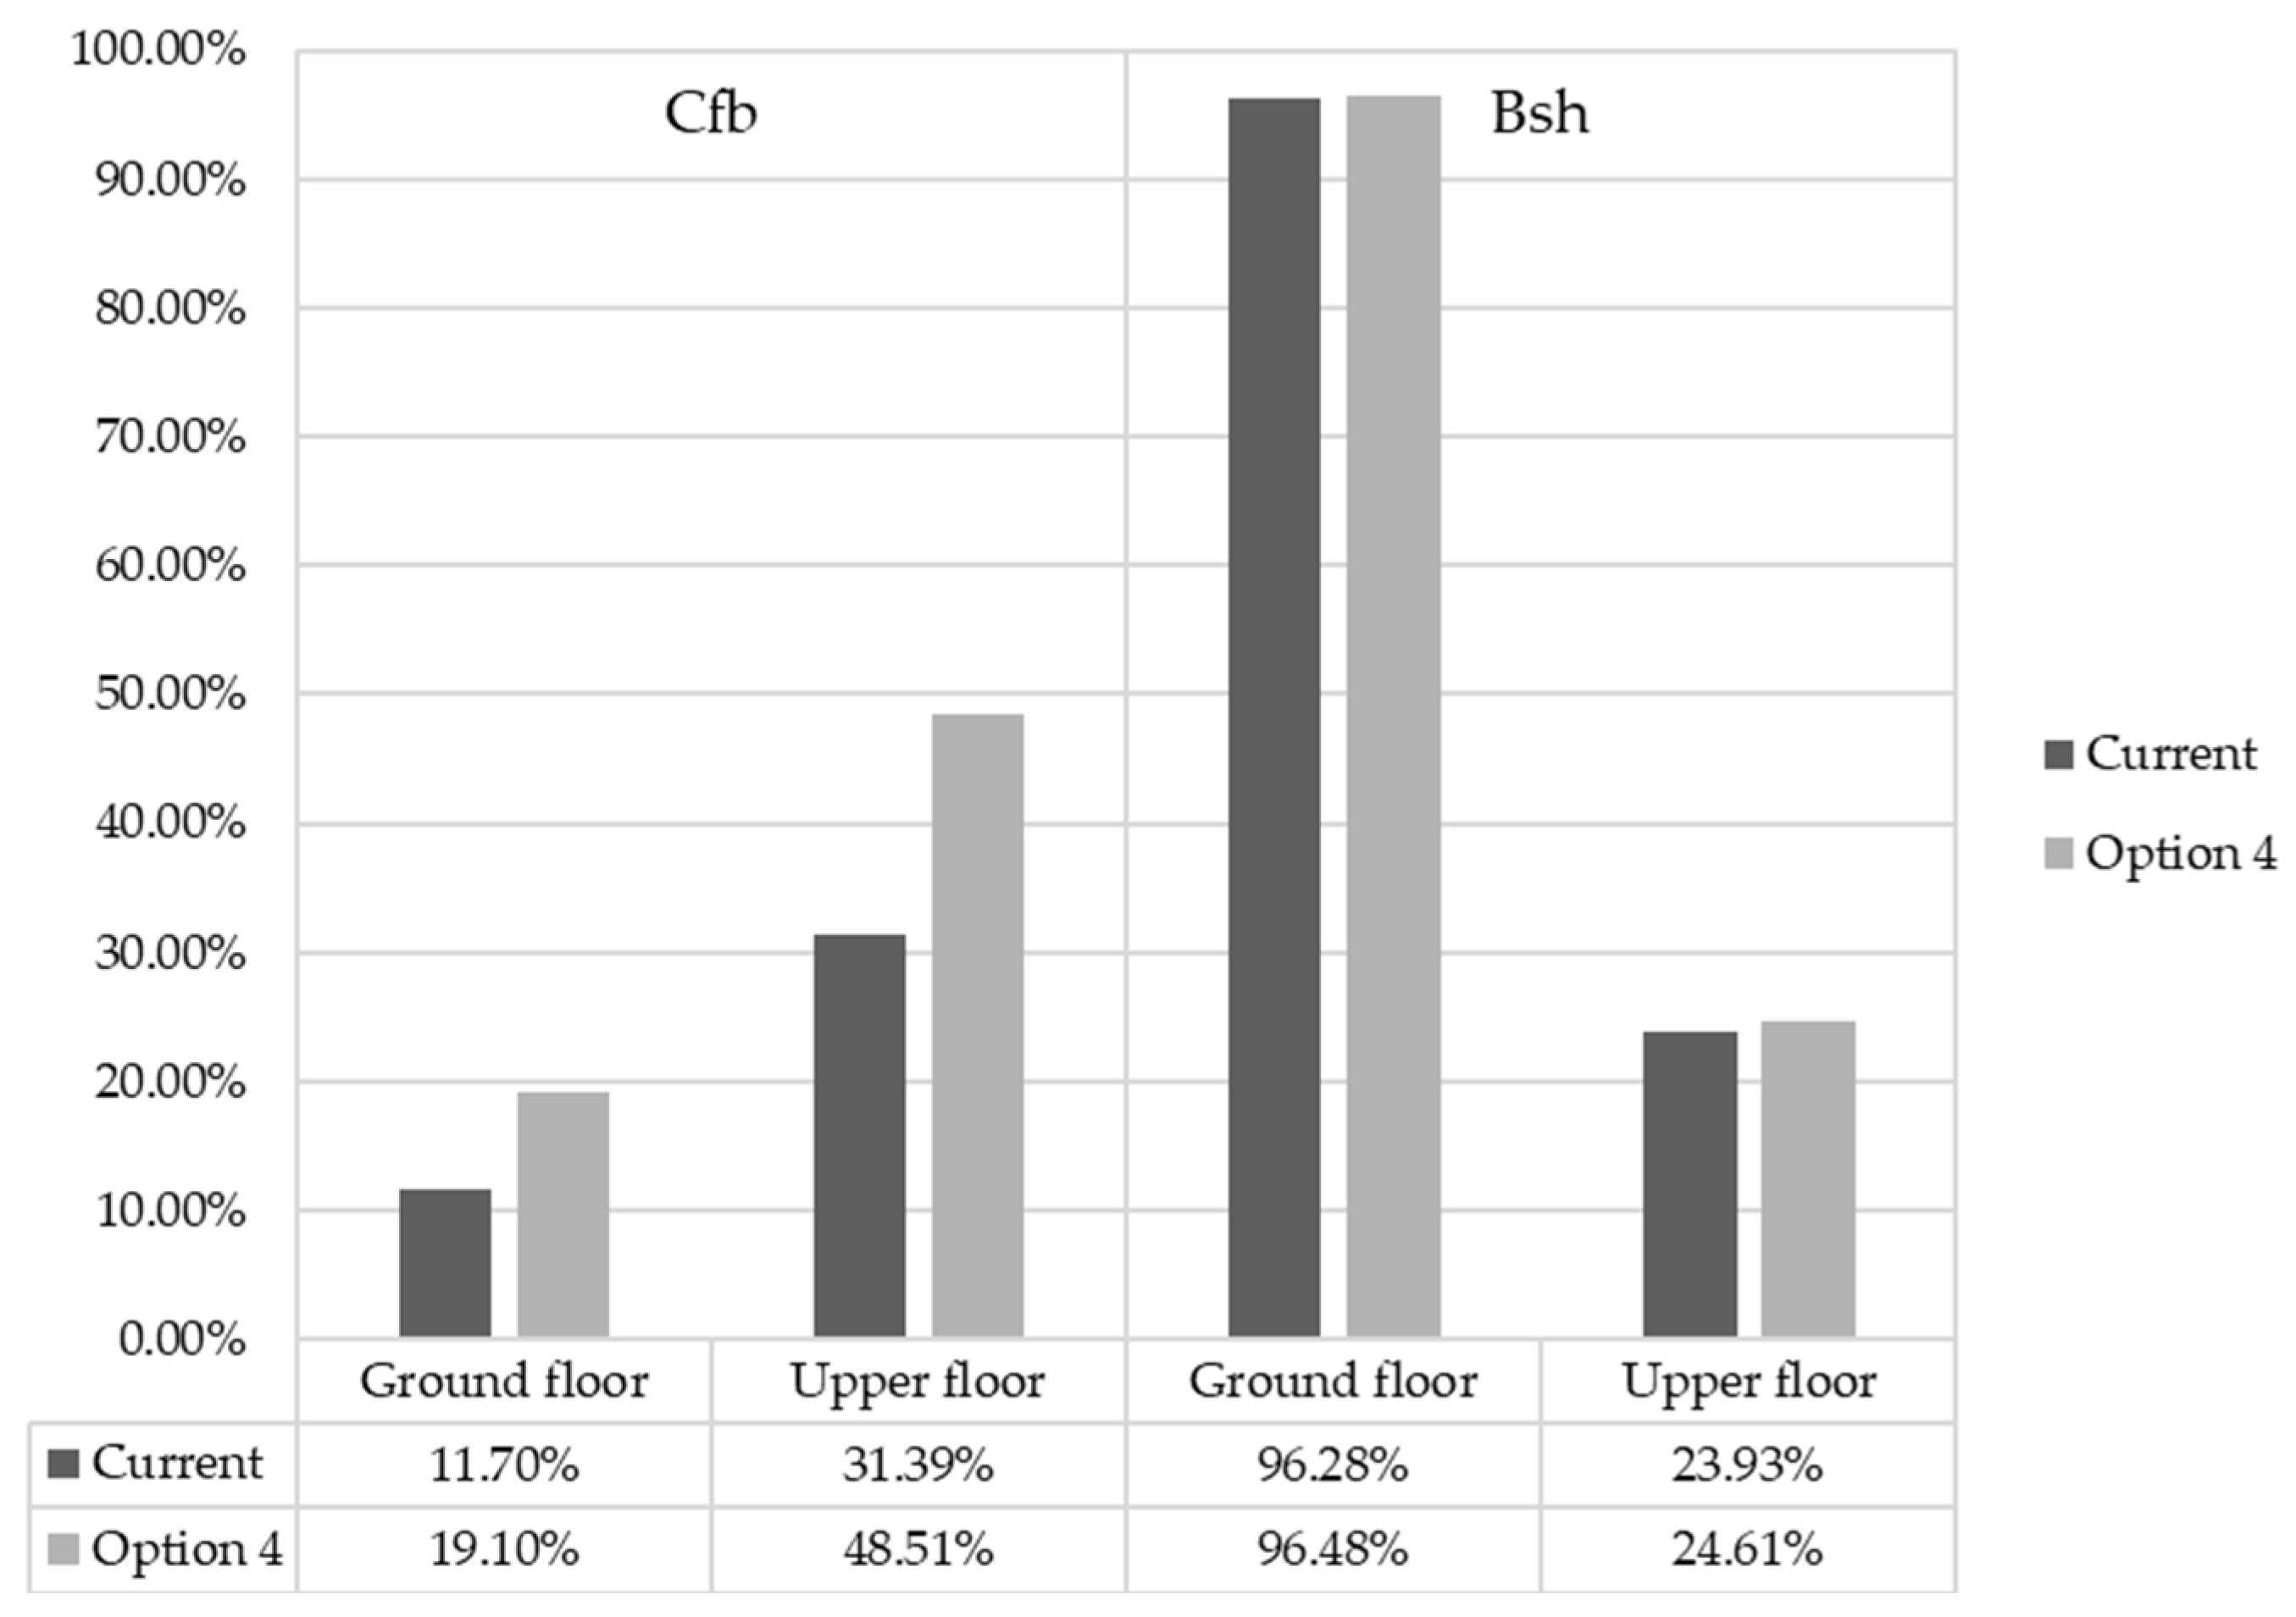
Option 4. Wall insulation.
This modification was simulated in two climate zones, in the current scenario and in the projection to 2050. The comfort inside the dwellings in both climate zones was improved in the current scenario. This improvement was clearer in the Cfb zone, where percentages within the comfort ranges were increased by more than 7% on the ground floor and 17% on the upper floor. On the other hand, this increase did not exceed 1% in the BSh zone, as shown in
Figure 10.
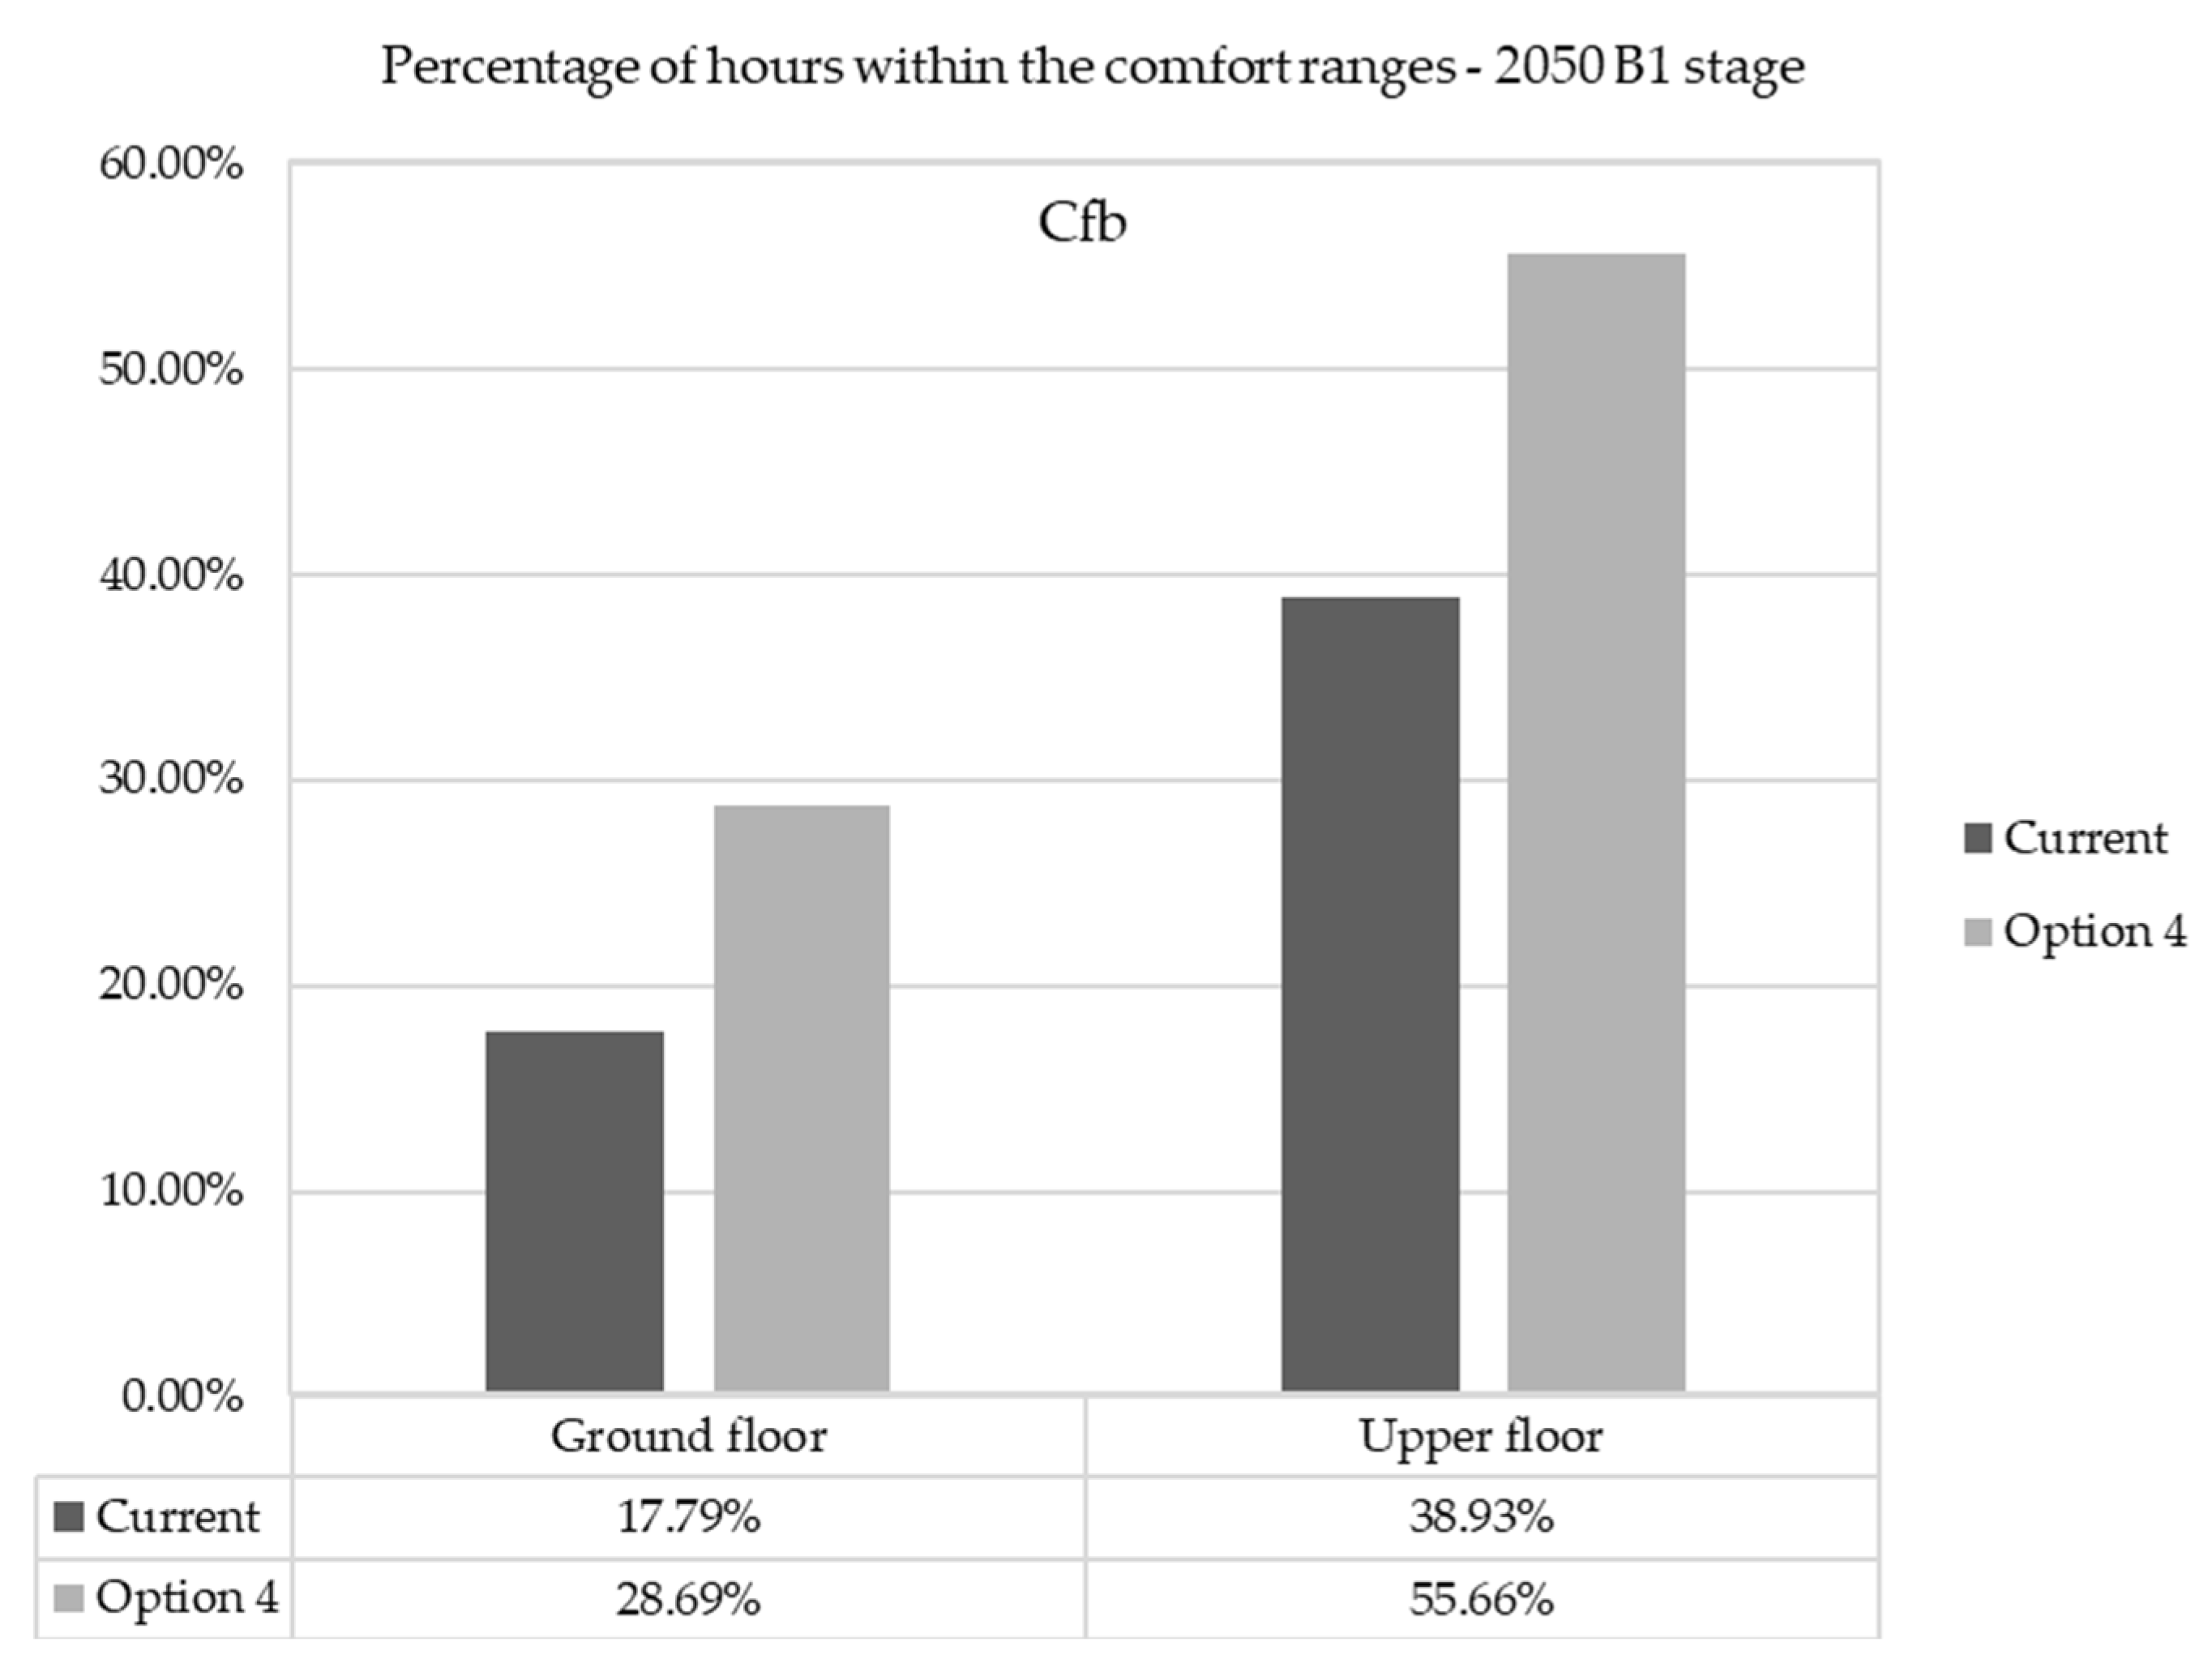
As for the B1 scenario of the projection to 2050, the hours within the comfort range were improved by insulating the walls, with almost 11% hours of comfort on the ground floor and more than 16% on the upper floor in the Cfb zone (
Figure 11), where climate change also contributed to the indoor comfort of these dwellings as the temperatures increased.
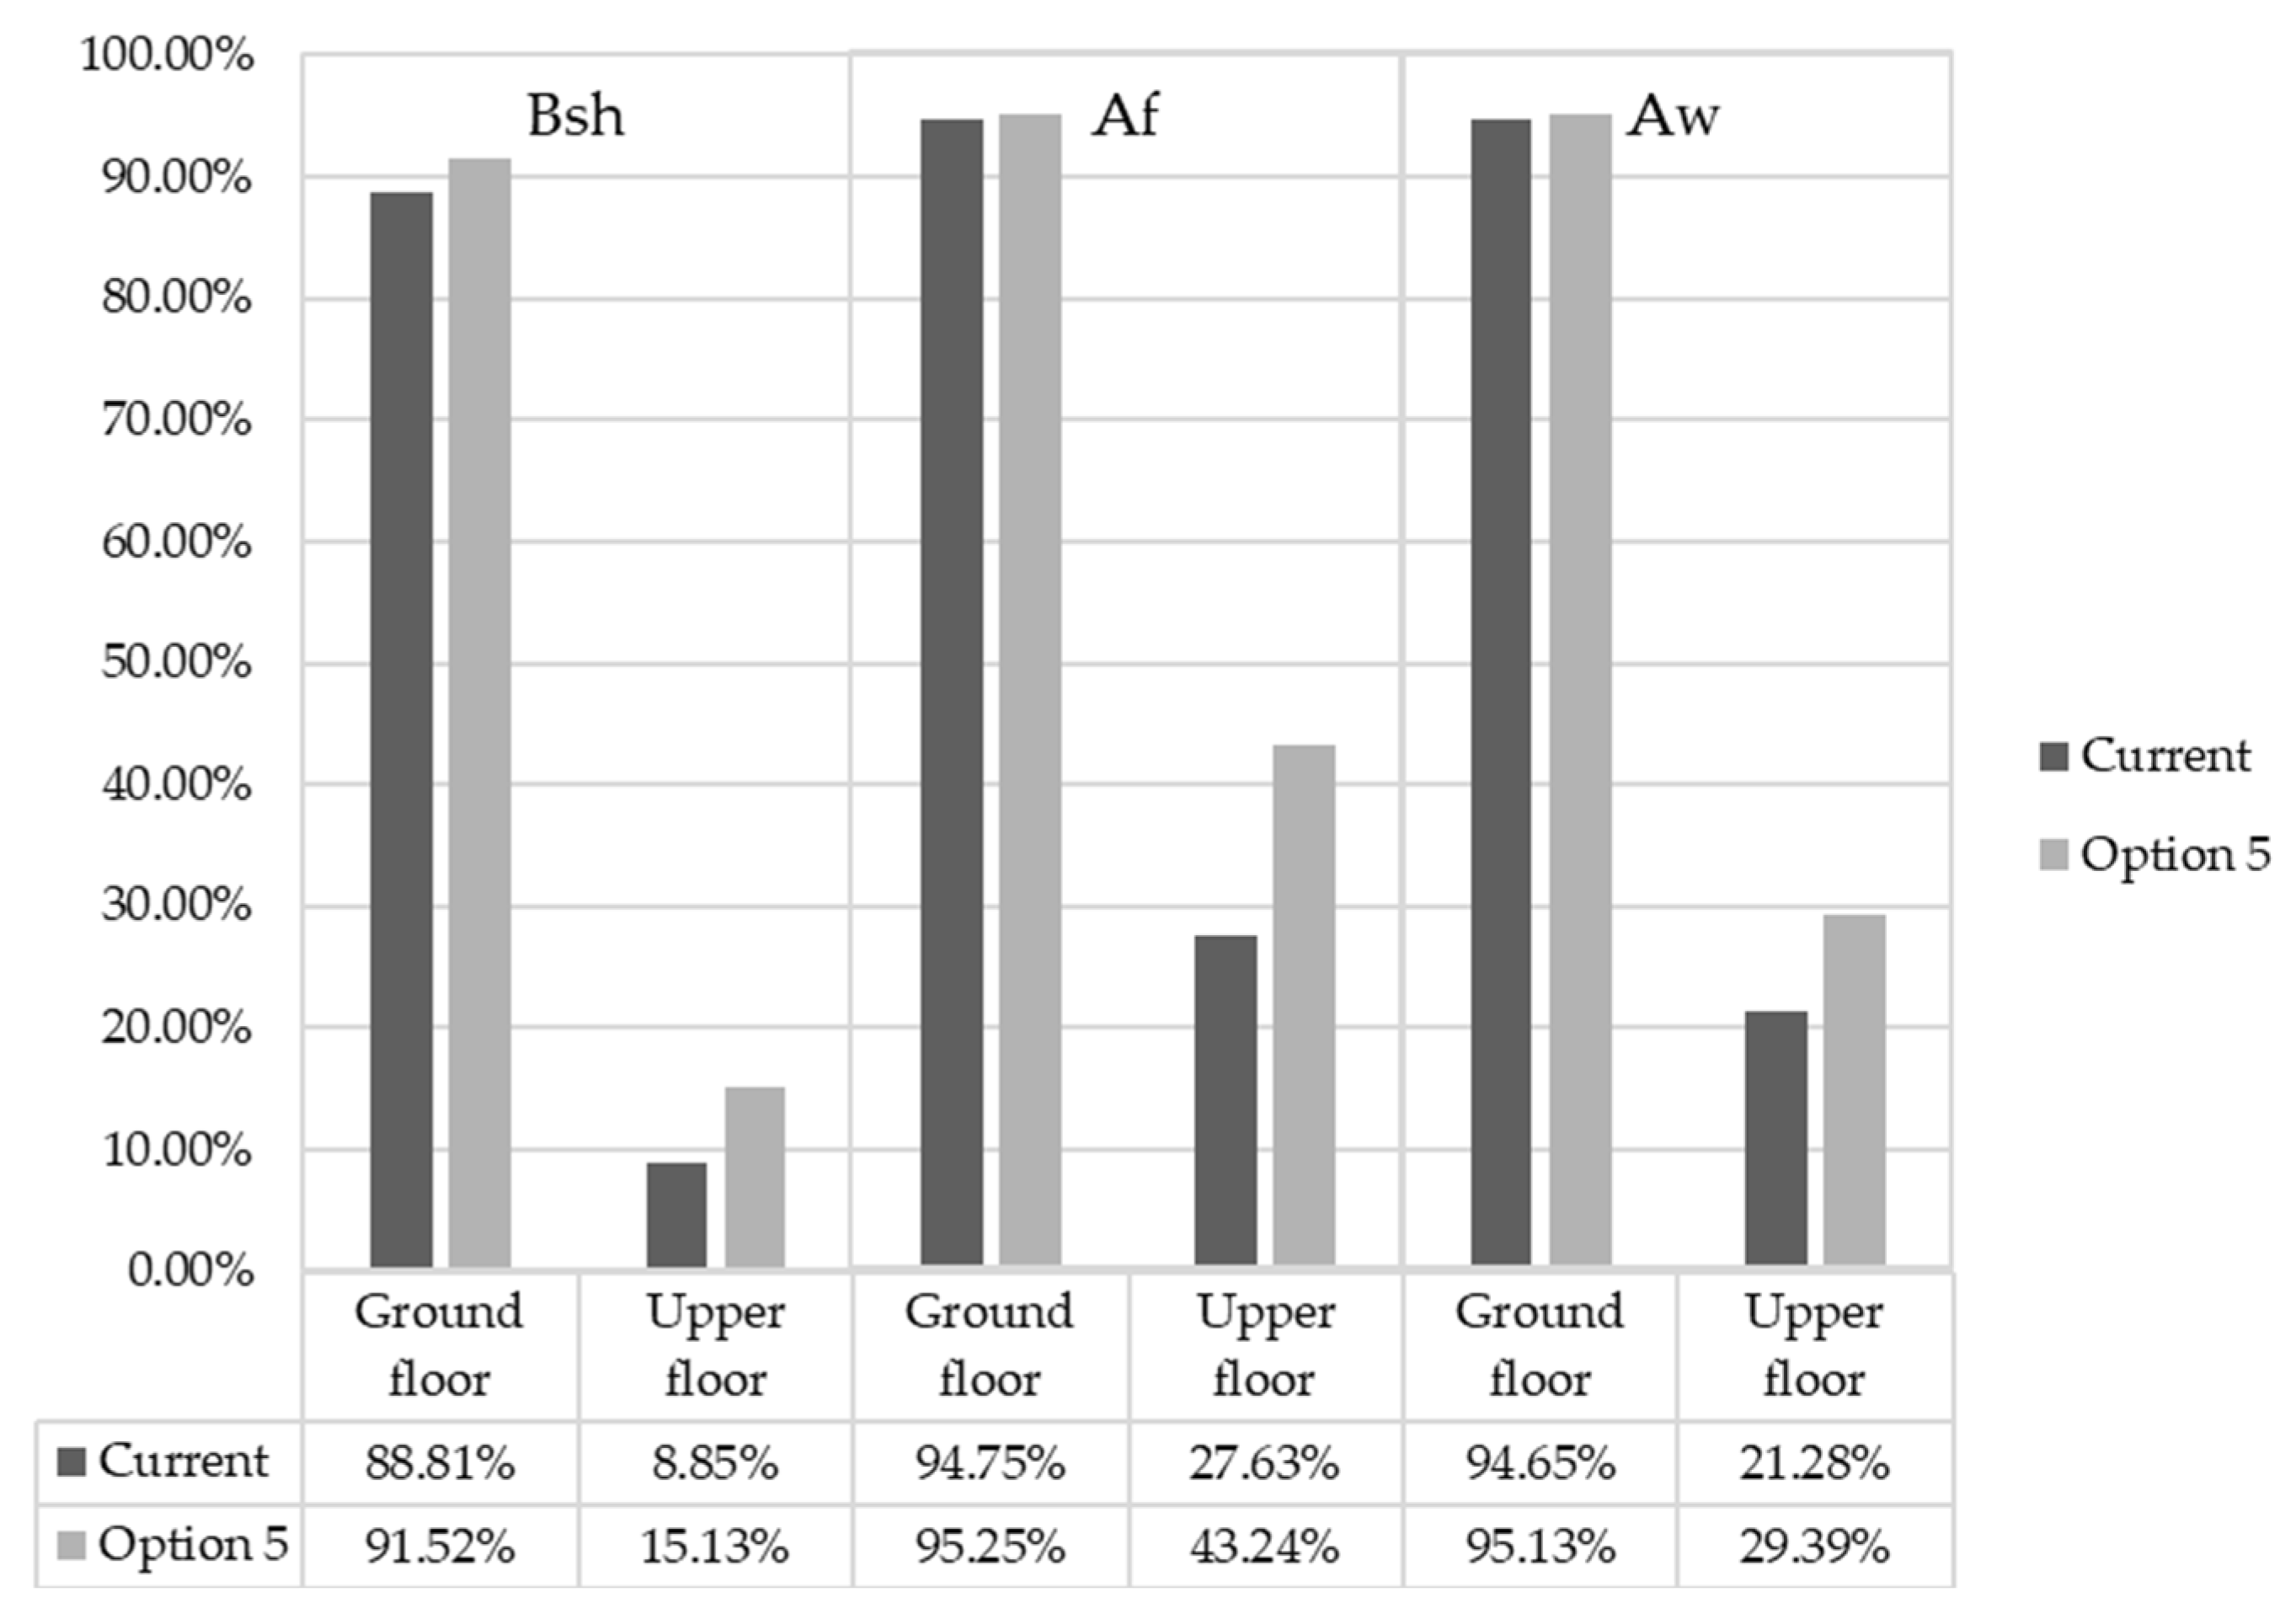
Option 5. Air gap ventilated by elevating the roof.
This option was simulated in the warmest zones (BSh, Af, and Aw), where the dwellings’ performance on the ground floor was favourable, around 97% within the comfort ranges, so the percentages on the ground floor were similar to the improvement applied. The optimization was significant on the upper floor, where it was increased by 18.5% in the Af zone, 12.5% in the Aw zone, and 16.2% in the BSh zone, although the BSh zone presented again the most unfavourable situation as only 40% of the temperatures within the comfort ranges were calculated throughout the year, despite the improvement method applied, as shown in
Figure 12.
As for the results of the 2050 climate projection, the zone with the least variation in the performance to 2020 was Af, which reduced the comfort time by 5%, whereas the Aw zone lost 13% and the BSh zone lost 25%. Nevertheless, this percentage would still be greater than that obtained by users with the original design after applying this change in the dwelling block, as shown in
Figure 13.
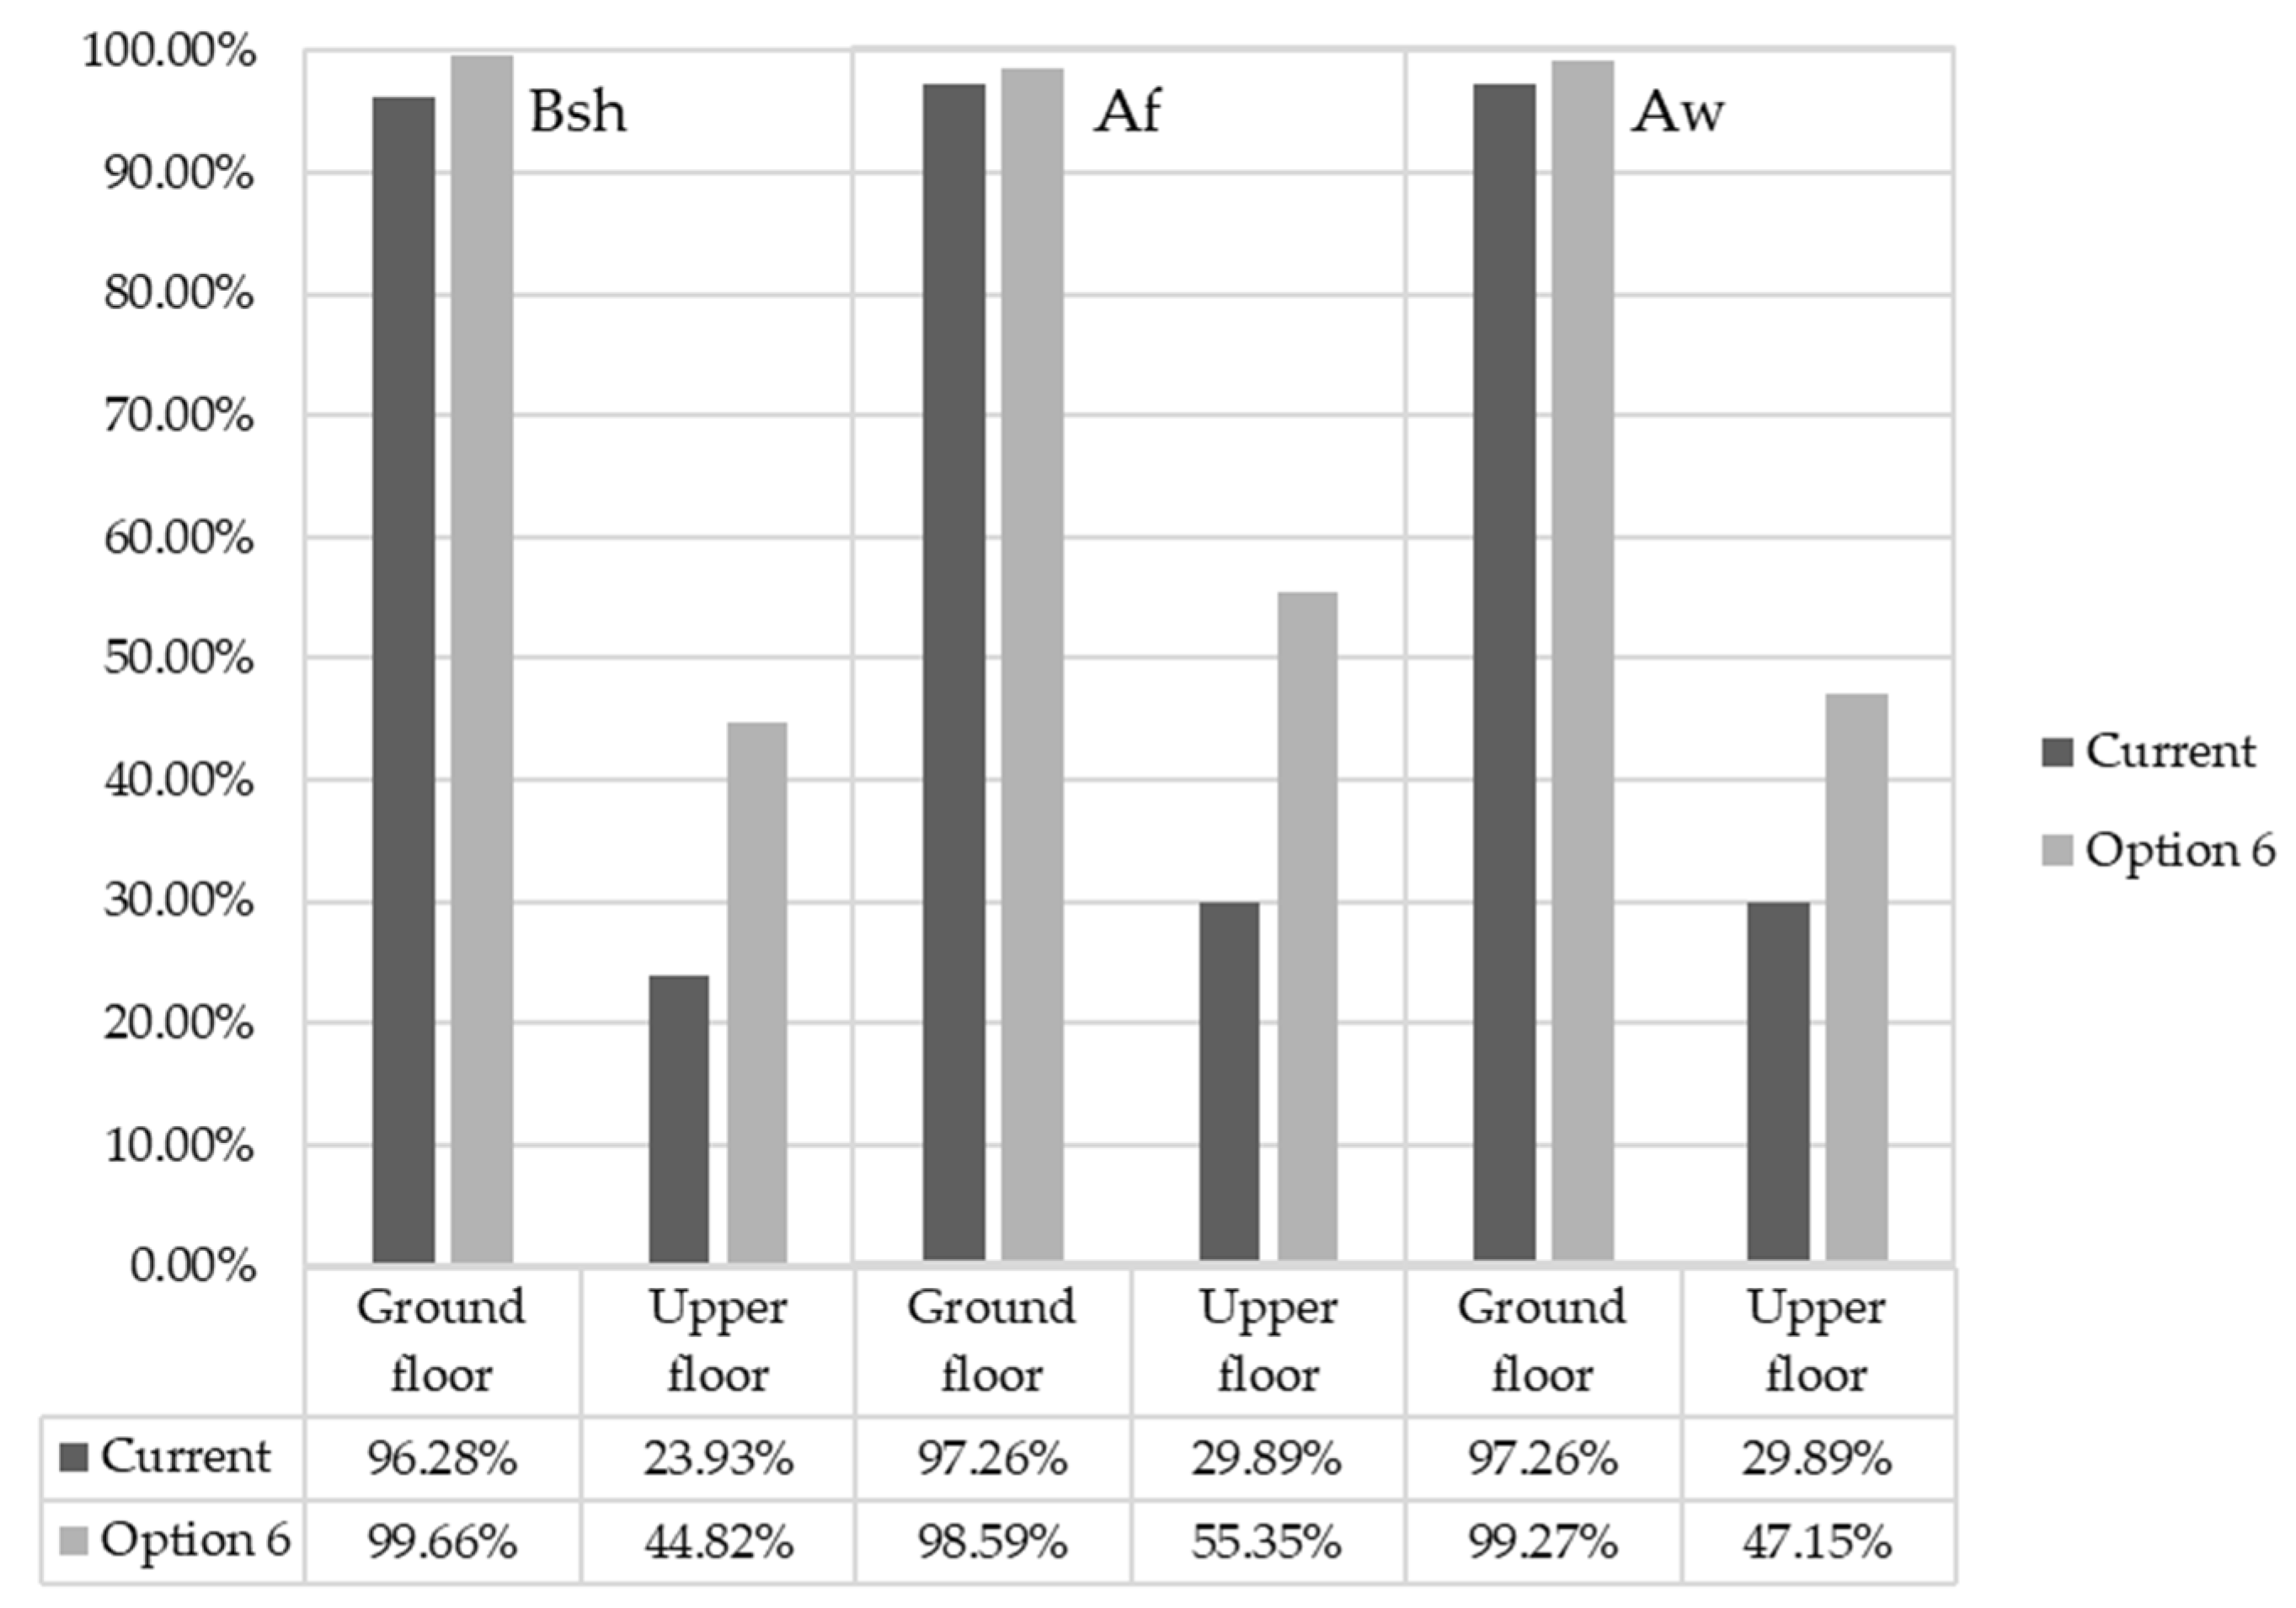
Option 6. Air gap ventilated by elevating the roof + overhangs on windows.
For the current climate scenario described in
Figure 14, the most favourable zone with this option was Af, in which the percentage of hours within the comfort range for the upper floor increased greater than 25%. The situation was similar in the BSh zone, with an increase greater than 20%, and 17.26% in the Aw zone.
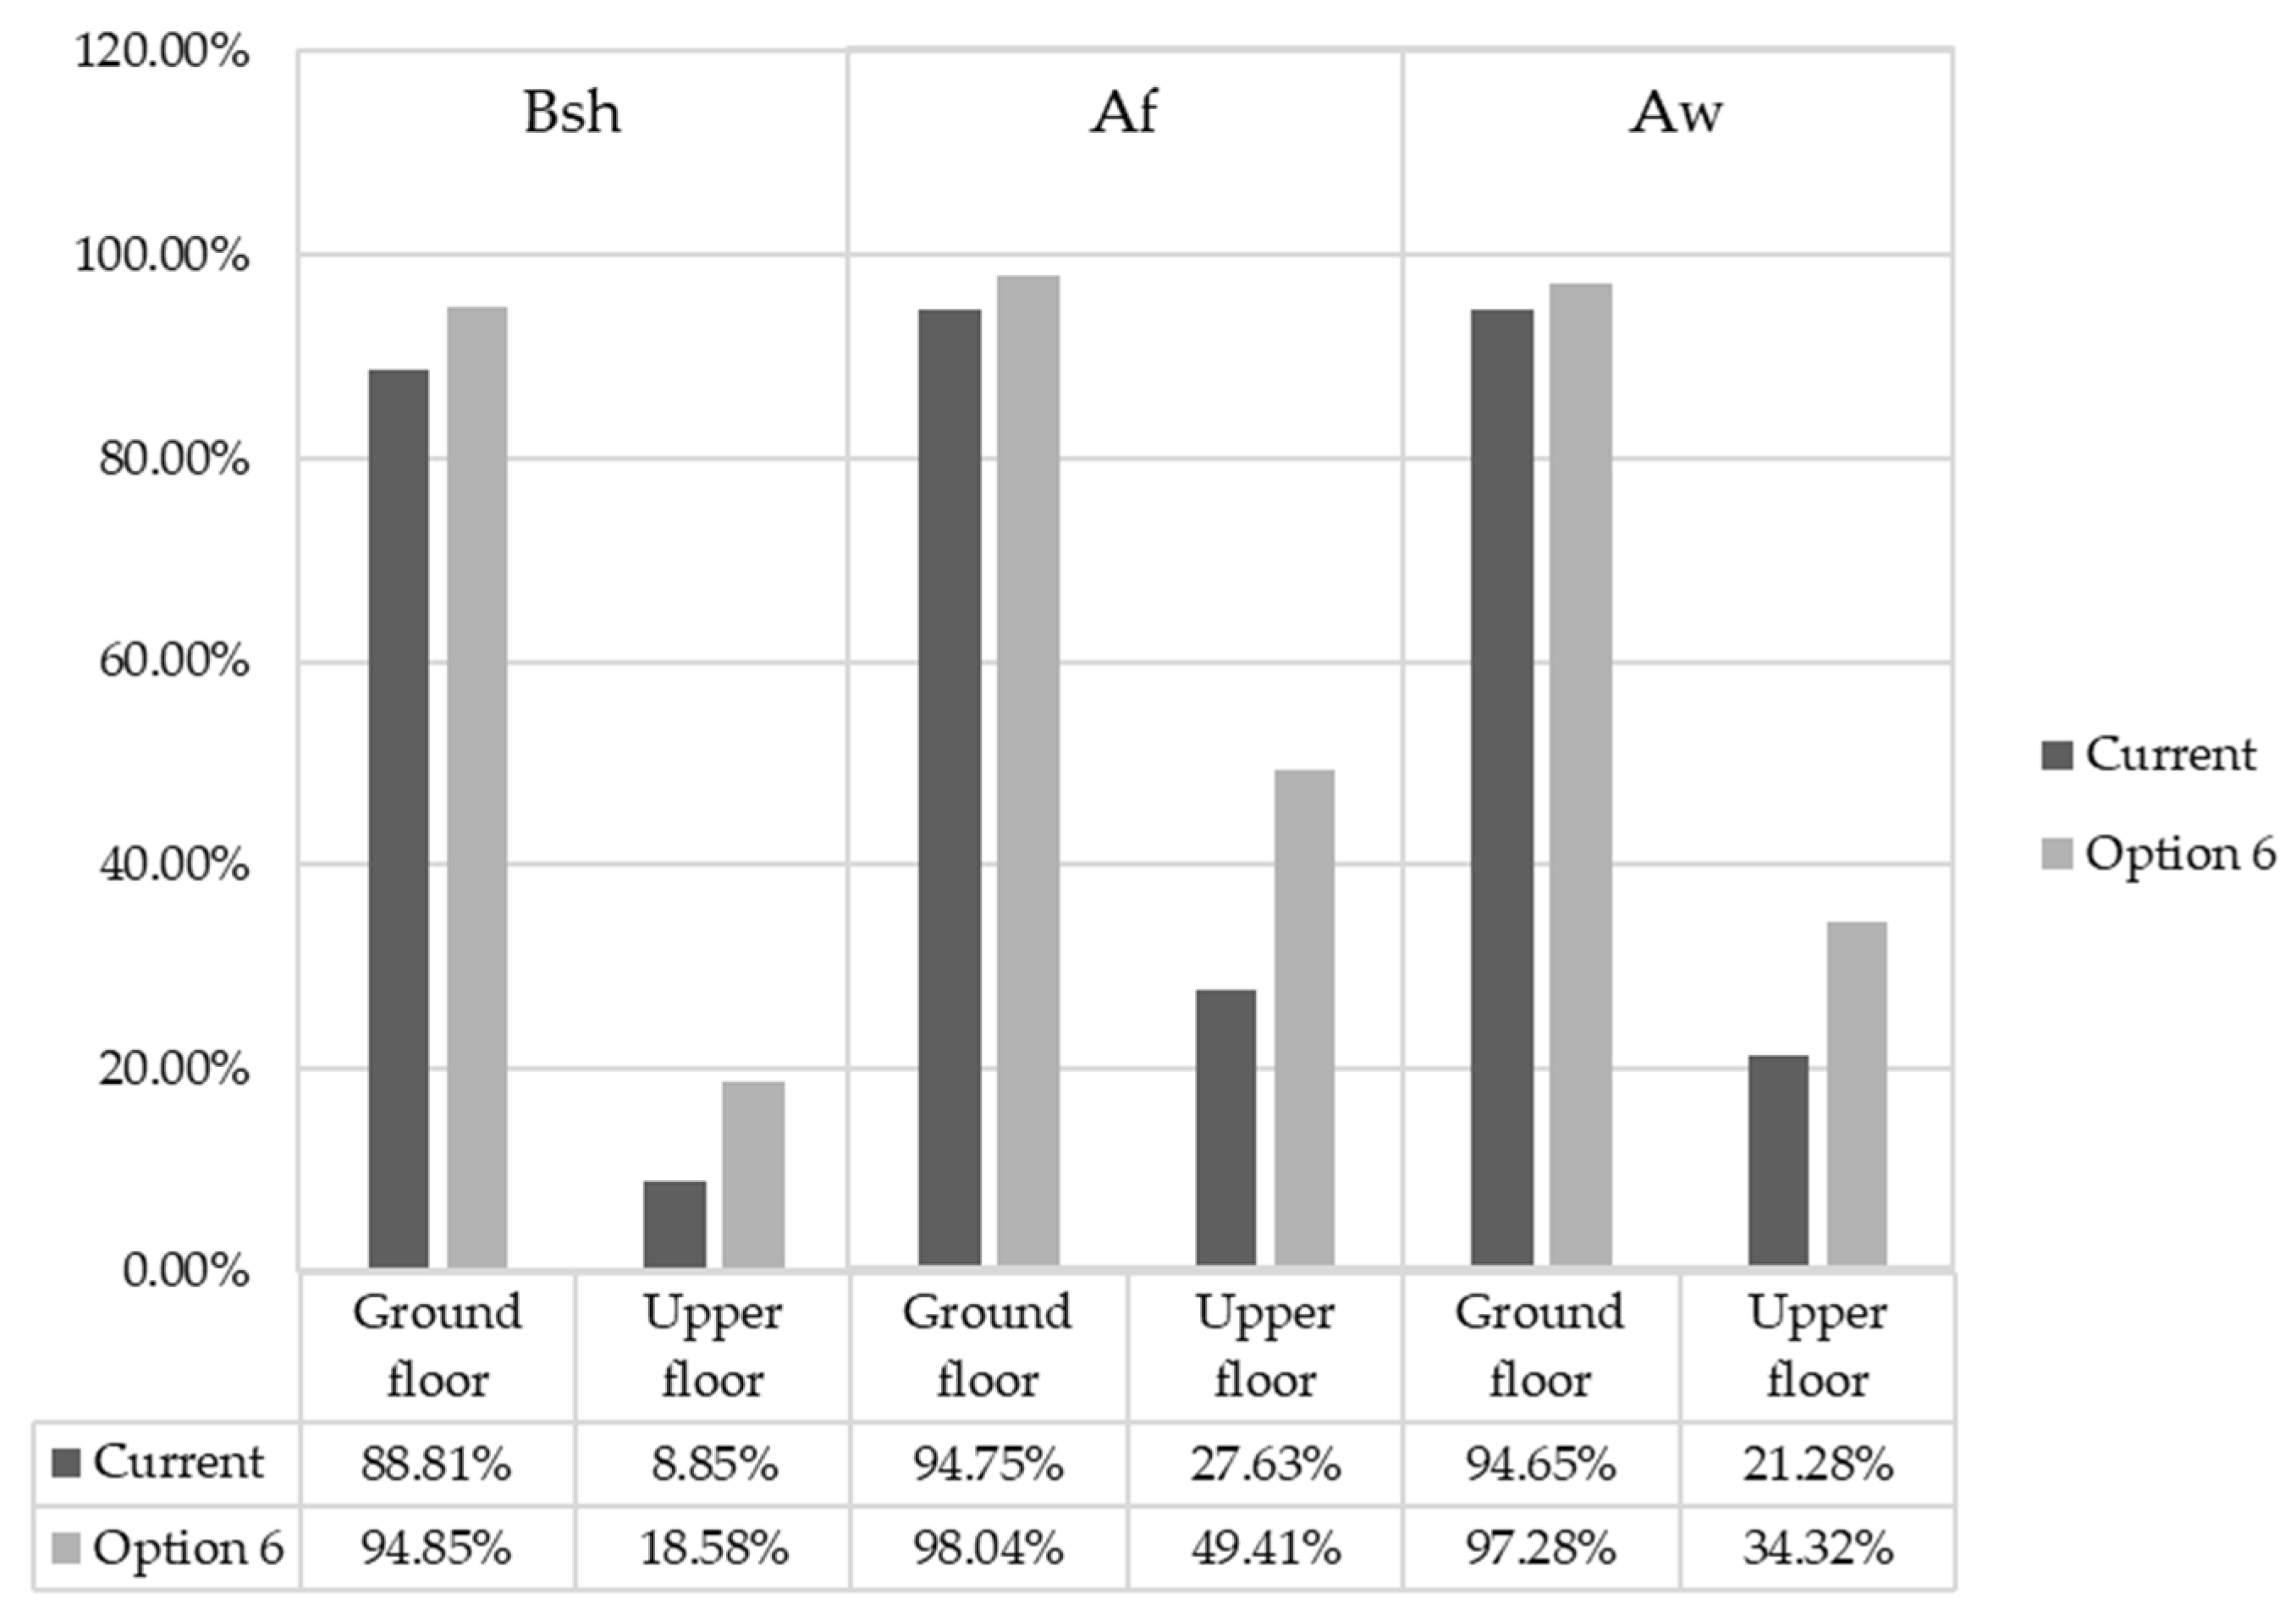
In the situation projected to 2050, the dwellings of the Af zone kept their temperature within the comfort ranges close to 50% of the time. The most unfavourable situation took place in the dwellings of the BSh zone, whose average was less than 19% within the temperature ranges, although it was still 10 points over the results of the dwelling with its original design, as shown in
Figure 15.
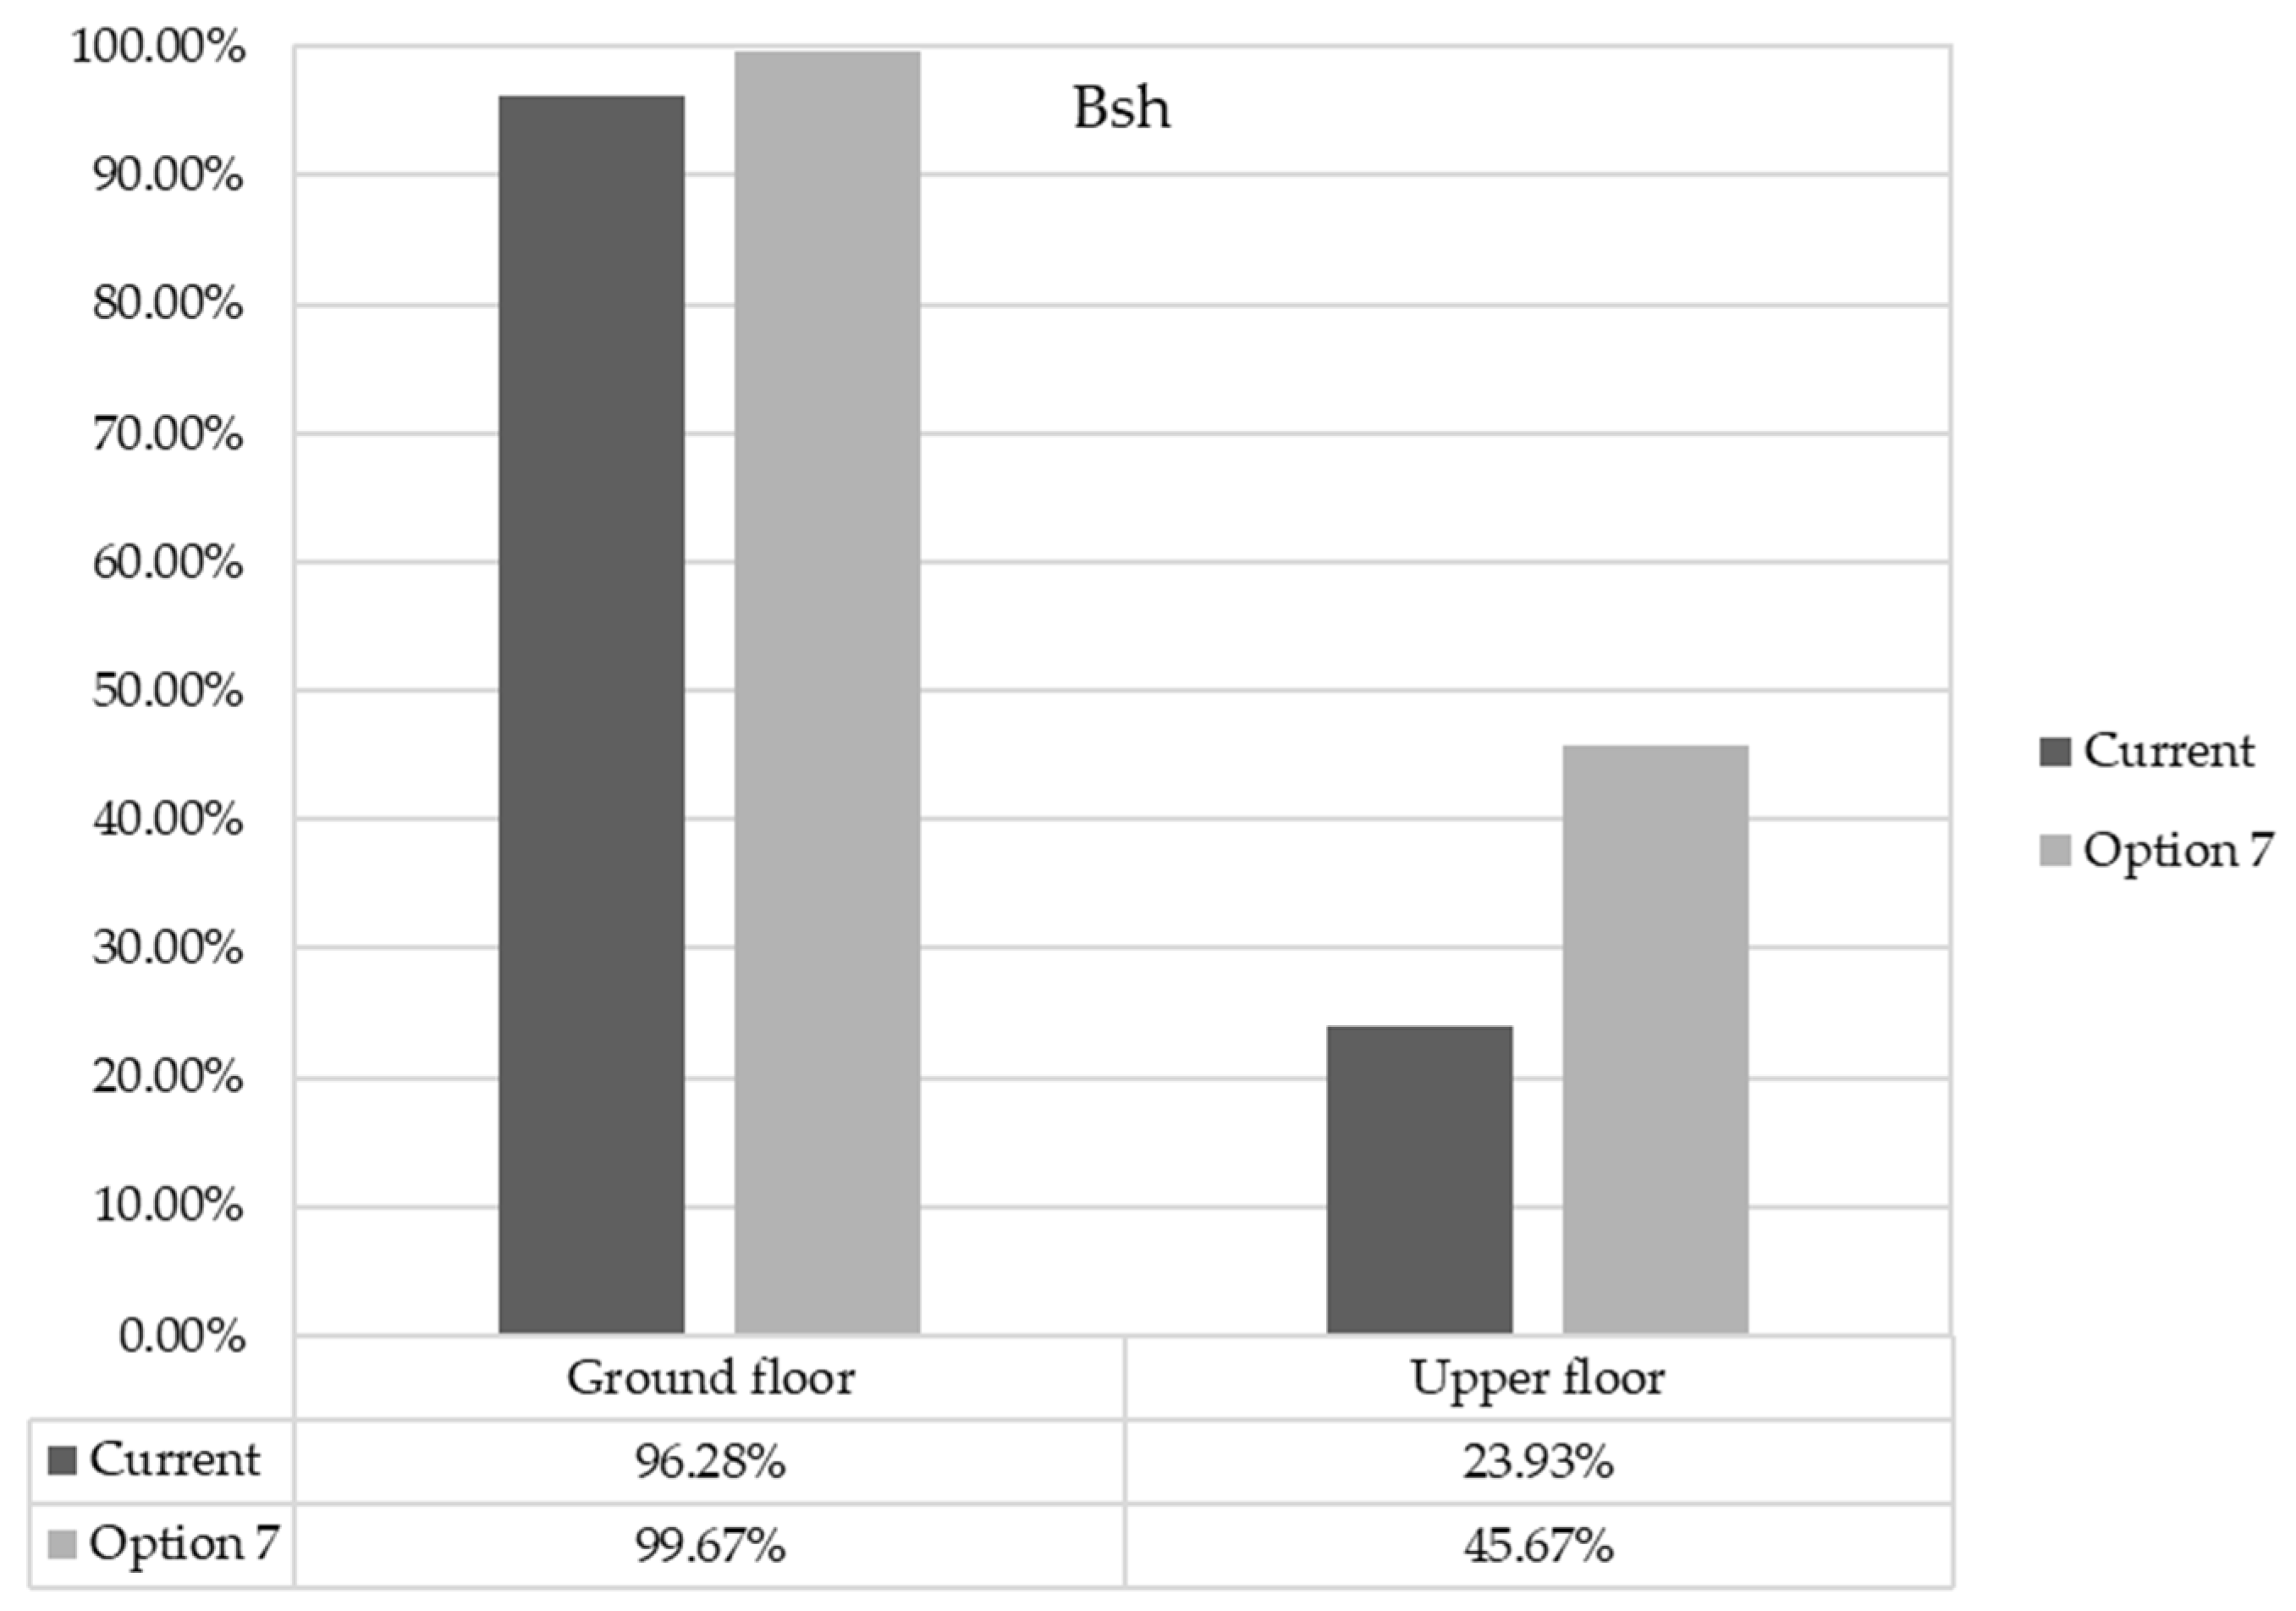
Option 7. Air gap ventilated by elevating the roof + overhangs on windows + low-emissive glass.
This option was simulated in the most unfavourable climate zone (BSh), and the result showed that in the current situation, with the change in the dwelling block, there was an increase of the hours within the comfort range by 21.7% on the upper floor, whereas the ground floor achieved almost 100% comfort, as shown in
Figure 16.
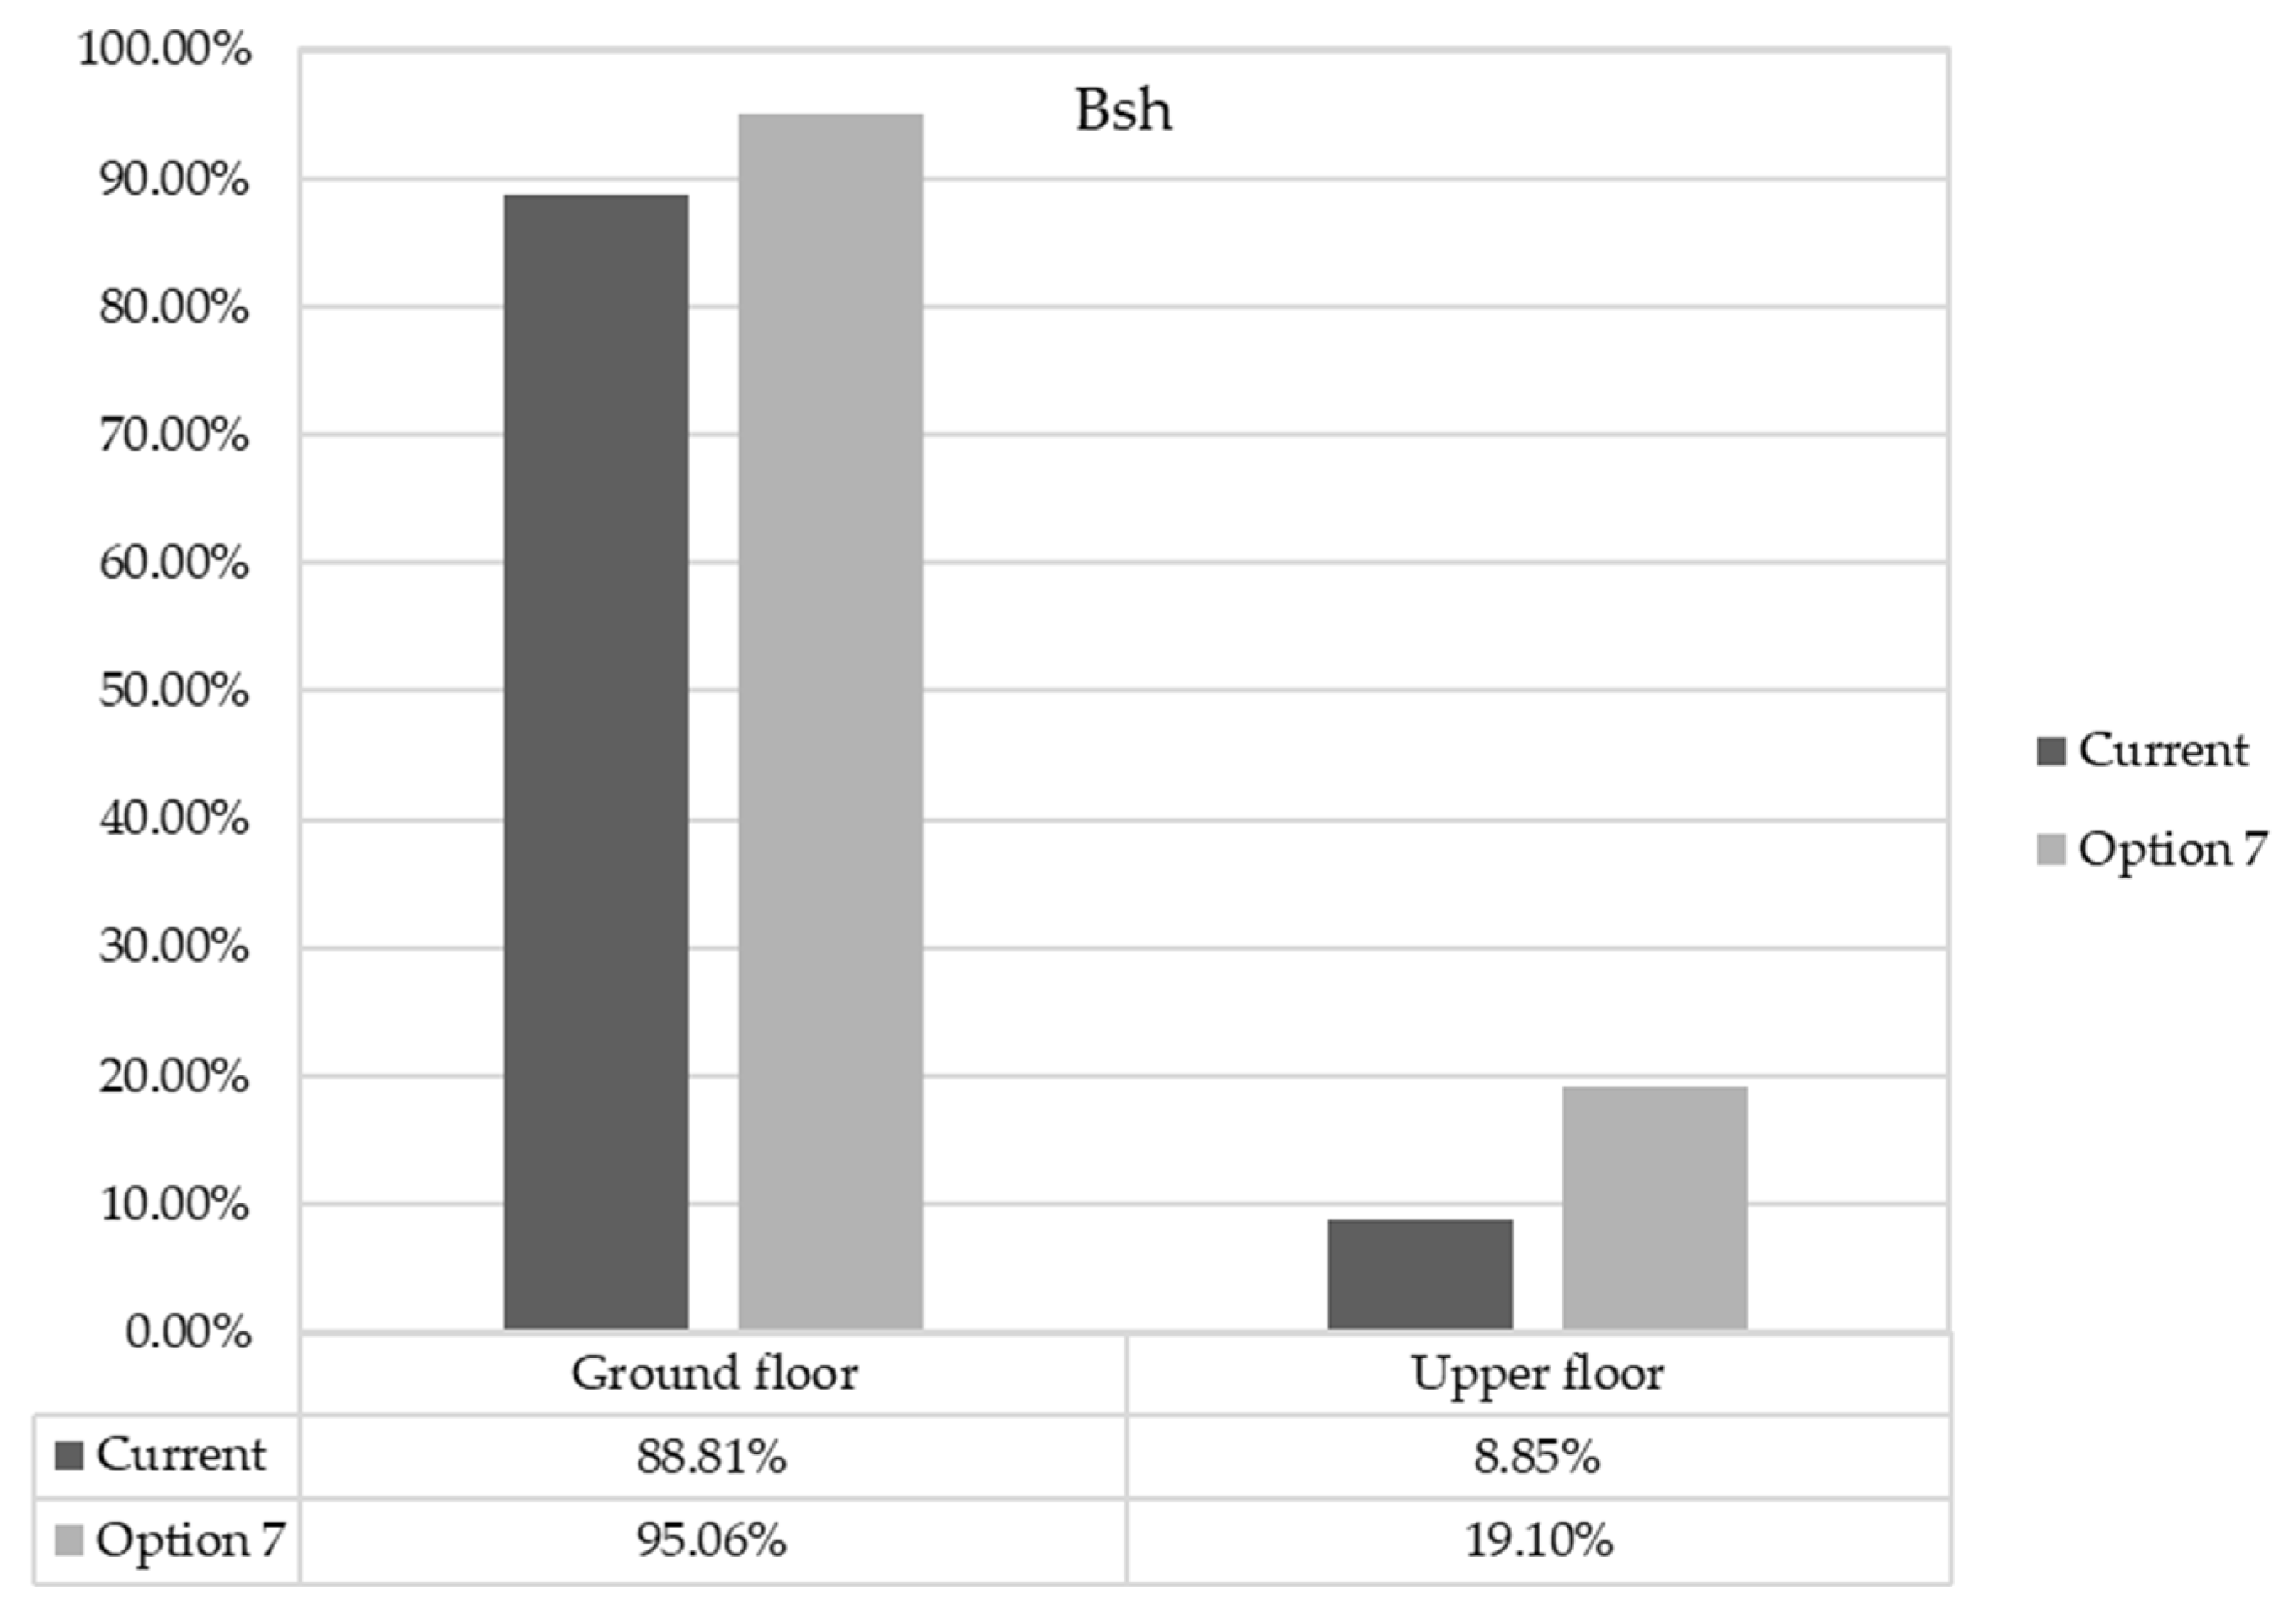
Whereas in the projection to 2050, the comfort percentage was reduced by up to 19.1% of the hours within the ranges on the upper floor, 10 points more than the dwelling with the original design, as shown in
Figure 17.
4. Discussion
In the current climate situation, the dwellings that least presented indoor temperatures within the comfort ranges were those located in the Cfb zone, particularly the dwellings on the upper floor. After comparing the simulations (
Figure 18), the most useful measure was Option 4 (wall insulation), although it did not exceed 20% of the time within the comfort ranges.
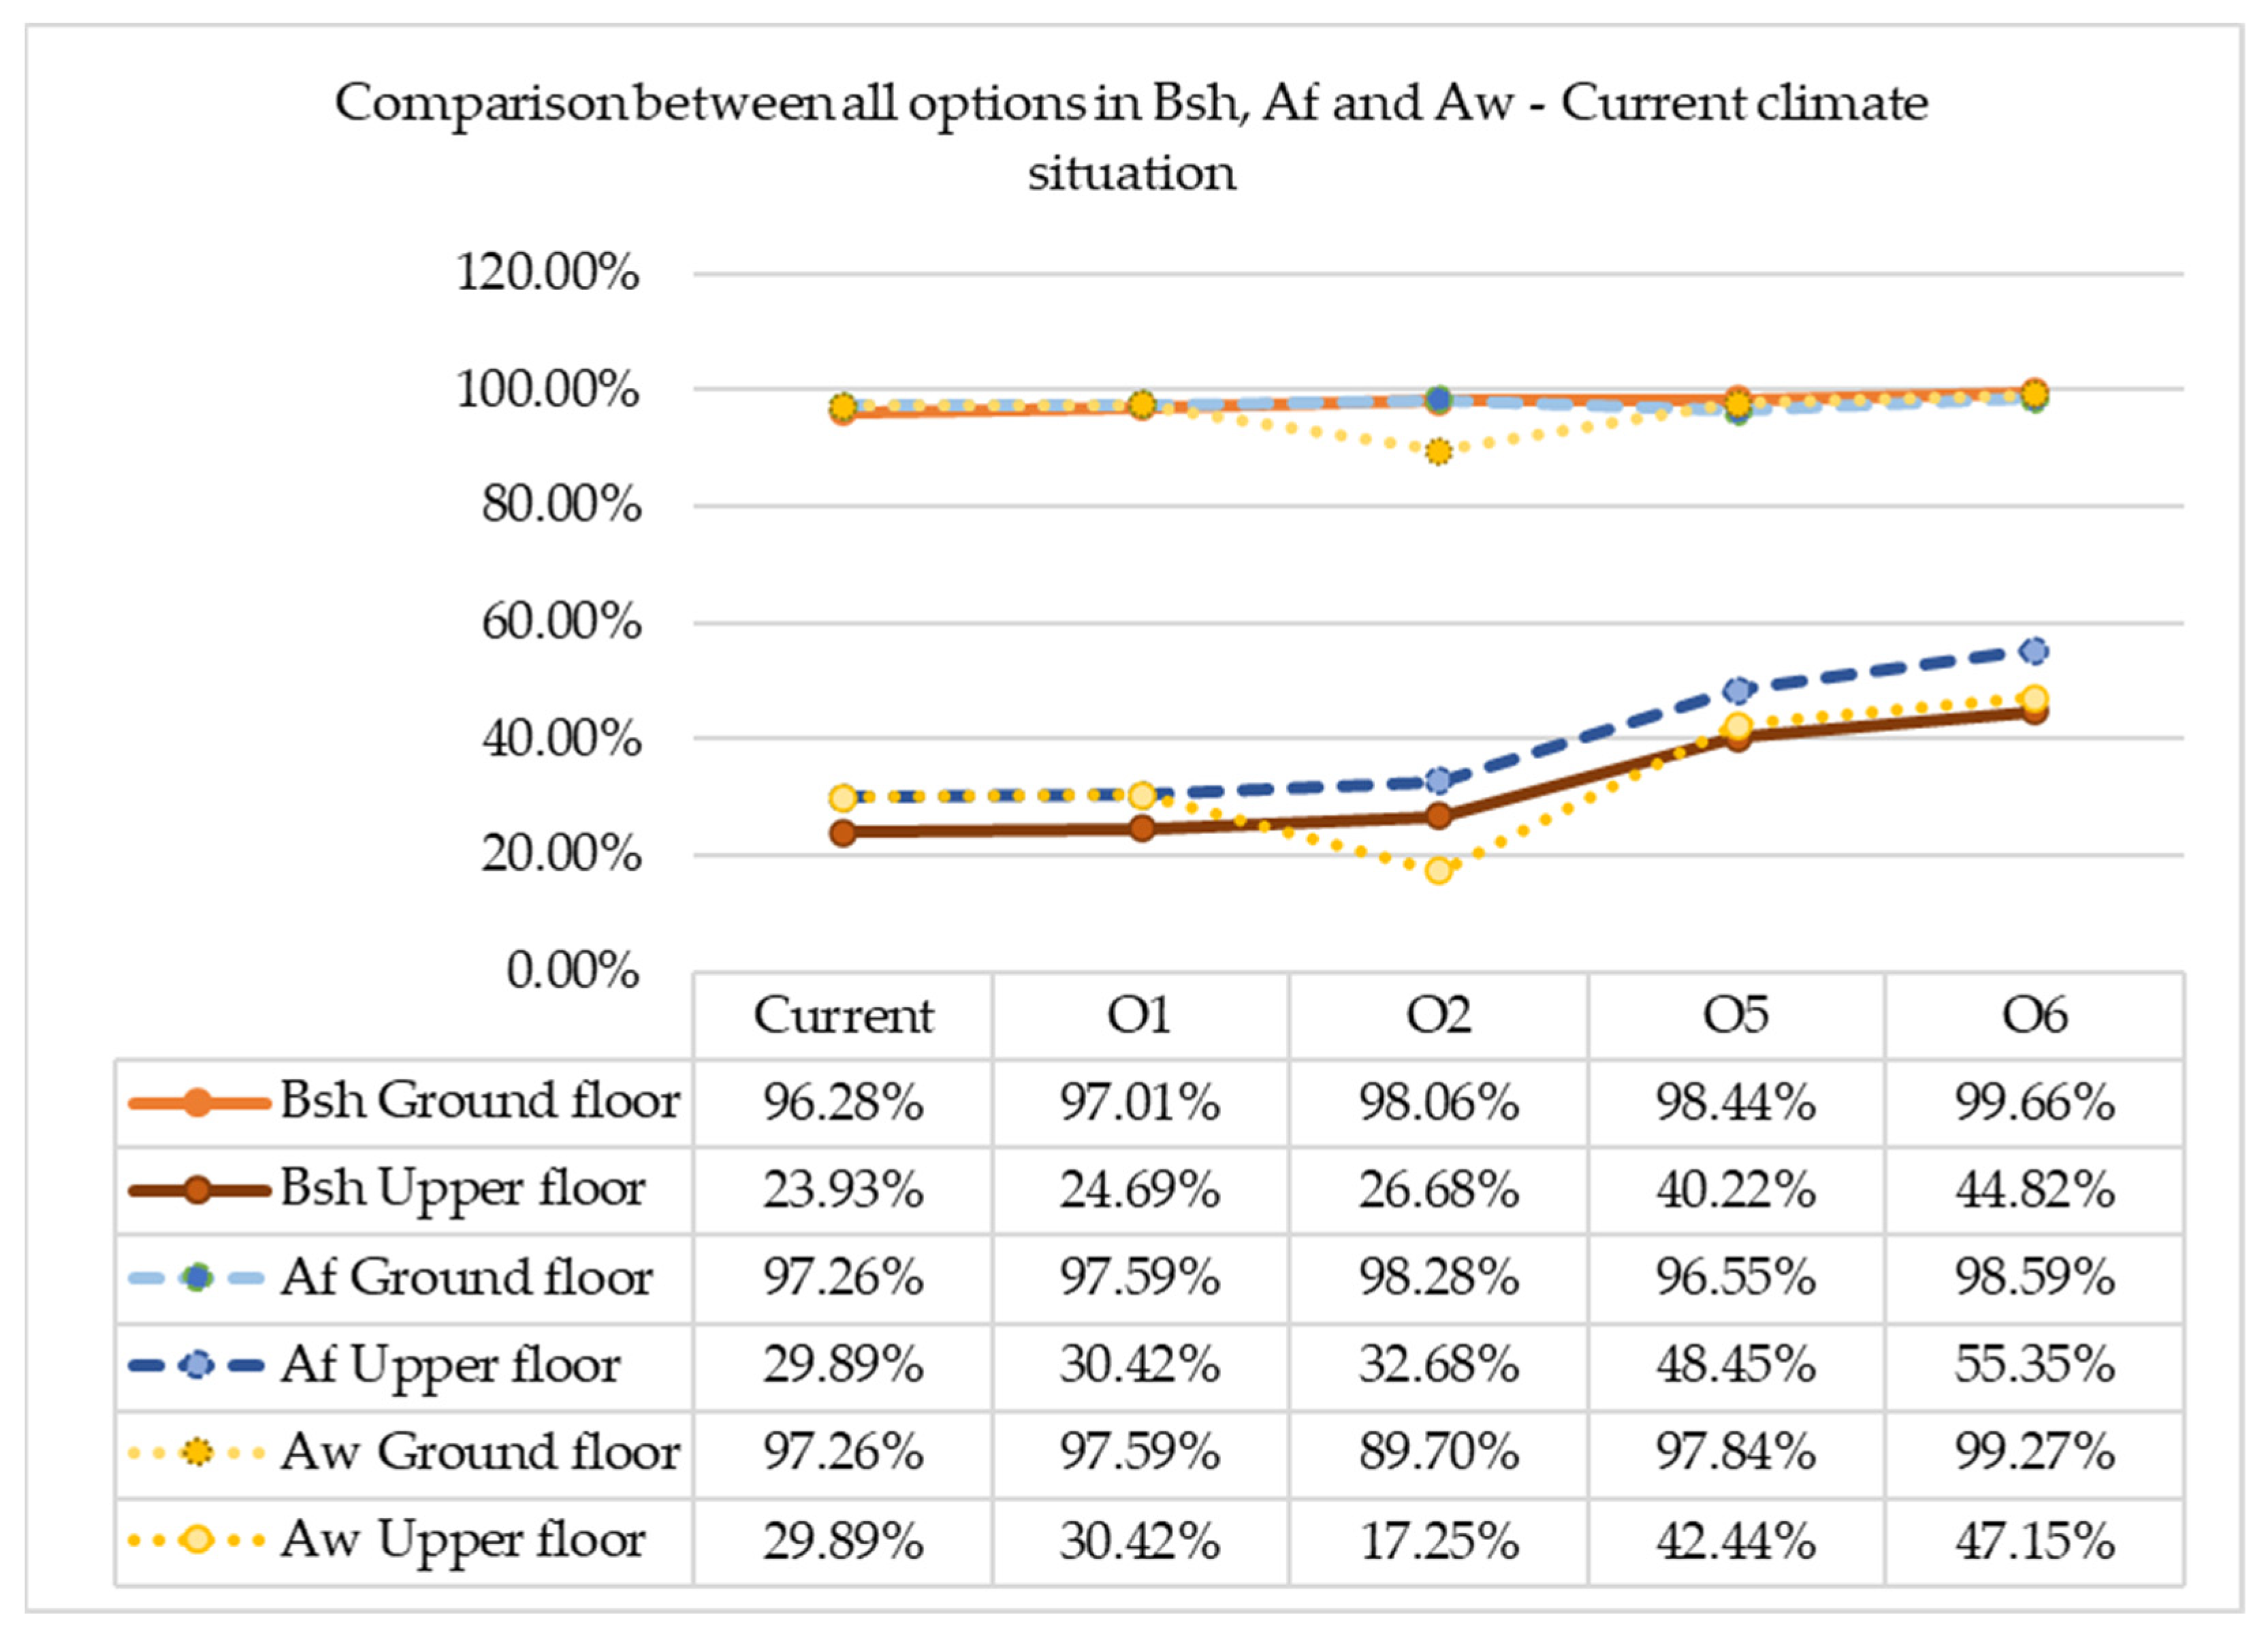
As for the dwellings of the warmest climate zones, the problem continued in the upper floors. Likewise, Option 2 was detrimental to the Aw zone and slightly increased comfort in the BSh and Af zones (
Figure 19). Option 6 was the most favourable as it combined an air gap in the ventilated roof and overhangs on windows, although this option did not achieve 50% of the time within the comfort ranges in the upper floor of the dwellings in the BSh zone.
Moreover, dwellings on the ground floor in the BSh, Af, and Aw zones presented more than 96% of the time within the comfort ranges, so improvements could be applied only to dwellings on the upper floor. Option 6 could be applied, but the overhangs would only be implemented on the windows on the upper floor.
The BSh, Aw, and Af zones have different climate characteristics, but the thermal comfort performance of the dwellings was similar, thereby contrasting with the performance of the same building in the Cfb zone. According to the various simulations, only one option cannot be chosen to be applied to all climate zones. Each dwelling should have specific components that meet the climate characteristics of the zone to implement, as shown in
Table 7, as the options provide different responses to cold and warm climates, although the results were similar in the BSh, Af, and Aw zones. This observation agrees with other authors who have analysed social housing in the region, who also determined that dwellings do not operate in the same way in the various climate zones, with the main disadvantage being the type of material chosen for their envelope. For instance, in the results demonstrated by Pérez [
31] through studies carried out in homes located in the Costa, Sierra, and Amazonia regions, which resulted in high levels of discomfort at the half-day hours in the Coast and Amazonia regions due to the high temperatures, while in the evening hours the temperatures were low for the Sierra, and demanded a lot of energy for cooling and heating systems according to each region. Likewise, Mendoza and Ortega [
32] indicated similar results, also emphasizing that there are other topics of study in this type of housing that involve natural lighting and ventilation profiles. Moreover, in other countries with similar climates, the results showed the same problem regarding social housing’s thermal comfort, as Giraldo et al. [
33] indicated in Colombia, in the case of Cali, where they concluded that the homes that were studied required better thermal insulation since the energy consumption dedicated to air conditioning was greater than 35%. Thus, Quispe et al. [
34] in Peru, in the case of high and cold areas of Puna, indicated that the lack of thermal insulation and the poor use of the solar factor translated into heat losses and the need to use active systems for heating that increase the energy poverty of the families in the area. Thus, in other areas, similar studies can be observed, such as the case of Mendoza in Argentina with the research by Balter et al. [
35] whose housing building simulation results determined that an average of 1751 kWh are needed for cooling, whereas by performing improvements of the ventilated facades and roofs this consumption can be reduced by more than 30%. With this, it is evident that one of the main problems of housing in the region is the quality of the envelope that generally lacks insulation.
On the other hand, comparisons between other regions on Earth have been studied, such as the case of Italy, with the studies of Mancini and Basso [
36], who studied homes in Milan, Florence, Rome, and Naples, using simulations in several scenarios that concluded that the greater energy consumption of the homes in the region was due to heating systems; therefore, with climate change, these consumptions could be reduced by up to 20%. Furthermore, there is the case of the study of homes in southern Spain by Calama-Gonzalez et al. [
37], where problems of overheating and overcooling are often experienced. After implementing improvements in the exterior walls, roofs, and windows, a reduction of between 10 and 20% of consumption was achieved for both cases in Seville and another 20% and 24% for Cadiz. Another example is the case of Portsmouth, in the United Kingdom, wherein Aragon et al. [
38] indicated that the main problem of the homes that were studied was the high consumption of energy for heating, and that even when implementing improvements in the building envelope, it is still necessary to use active heating systems to maintain the recommended thermal comfort.
With all this evidence considered, it is evident that by implementing improvements in the building envelope, the energy consumption is reduced to maintain the interior temperatures within the comfort ranges; however, these solutions are not universal, as they will depend on the location and climate of the house. Thus, the requirements of a house in South America are very different from those in Northern Europe. Additionally, climate change could produce a beneficial effect for the coldest climate regions, but a large problem for warmest ones.
5. Conclusions
When we compare the results obtained between the simulations of the block in its original design in the 2020 climatic situation, it is evident that the ground floor rooms of the BSh, Af, and Aw zones remain over 96% within the comfort ranges; however, after applying the options described, it is clear that any action that improves the interior temperature of the upper floor rooms will also improve the thermal comfort on the ground floor, reaching more than 99% of the time within the comfort ranges with option 6, or 3.5% more than the results of the house in its original version. When comparing the results with the climate projection to 2050, it is clear that for the same case, the houses on the ground floor reduce 5% of the time within the comfort range.
On the ground floor, the block in its original design does not reach 30% within the comfort range for the case of the blocks located in Af and Aw, and less than 24% for BSh. When the simulation was performed with option 6, these percentages increase 17% in Aw, more than 20% in BSh, and 25.5% in Af.
In the Cfb zone, it was observed that by implementing option 4, insulation in the vertical enclosure, it is possible to increase more than 7% of the time within the comfort ranges on the ground floor compared to the result of the original house in 2020, and almost 11% in the projection to 2050.
For the upper floor of the houses in Cfb, when option 4 is applied, the results increase 7.5% for the climate situations in 2020 and 2050.
Changing the components of the envelope could improve or reduce the percentages within the comfort ranges of the dwellings studied in each climate zone.
Seven improvement options have been presented, but the results were not completely favourable, as the situation of the dwellings on the upper floor in the BSh, Aw, and Af zones was critical.
The dwellings on the ground floor in the Cfb zone obtained the lowest percentage within the comfort ranges both in the current situation and the projected situation that applied improvement options to the envelope, so a further study could focus on greater changes in the envelope of the block.
In the BSh, Af, and Aw zones, the high temperatures could be reduced with elements that regulate the solar factor on windows, thus contributing to the air circulation, as the results obtained with Option 6 show. However, the disparity between the upper and ground floor of those zones is maintained.
The dwelling performances on the ground floor of the BSh, Af, and Aw zones are high even without improvements, so improvements could be made only for the dwellings on the upper floor, as indicated in the discussion of the results. As it has been discussed, option 6, which entails an air gap ventilated by elevating the roof in addition to overhangs on the windows that could be used in the roof and windows on the upper floor, reduced the costs of a complete action in the envelope and presented favourable results for the four dwellings of the block, and maintained the materials available in the local market.
The results show that there is not a single option, and the specific climate conditions of each zone should be considered before building future dwellings alongside considering the use of easily available materials and traditional solutions that avoid the building costs, as the existing alternatives are disproportionately high.


 ,
, 


