

Automatic Detection of Pedestrian Crosswalk with Faster R-CNN and YOLOv7


Abstract
:1. Introduction
2. Related Work
- (i)
- Two-direction object detection based on Faster R-CNN and YOLOv7 is used for the first time in the evaluation of the detection of pedestrian crosswalks.
- (ii)
- The two-way crosswalk detection will serve as a valuable groundwork for infrastructure planning and inspiration to other researchers. Additionally, the road network dataset utilized in this study is open to all readers and will offer significant support to fellow researchers, as collecting such data can be a challenging task.
- (iii)
- Traffic safety will be ensured by completing the pedestrian crosswalk detection process, which is the first stage of the warning system for vehicle drivers, disabled individuals, phone-addicted pedestrians, cyclists, and other micro-mobility vehicle drivers.
- (iv)
- The completion of the first phase of the warning system will be an important milestone for users of road networks. The high-accuracy detection process established in this study will further the goal of autonomy and is expected to make a substantial contribution to its success.
3. Network Architecture
Base Models
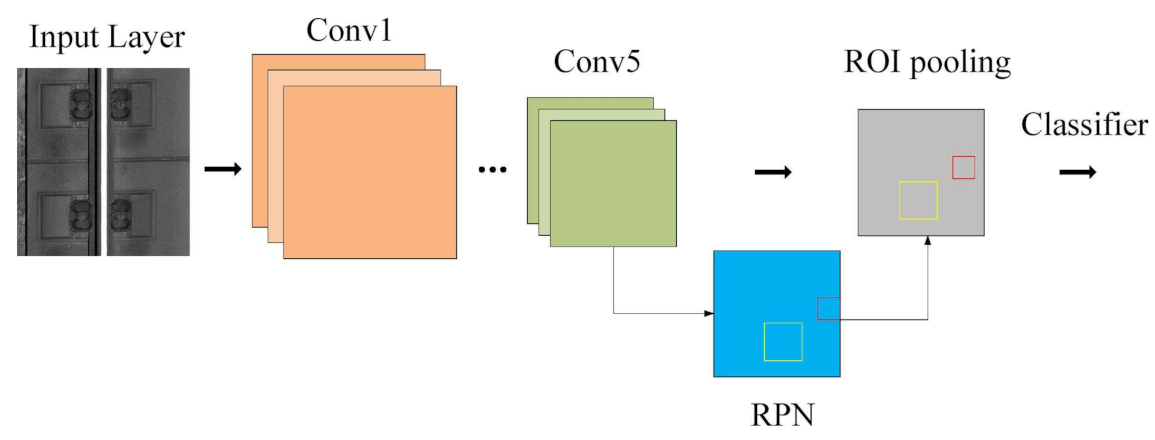
- i.
- The entire input image is ensured as an input to the convolutional layers of Faster R-CNN to produce a feature map.
- ii.
- Then, to identify the region proposals on the feature map, a region proposal network is used to predict the region proposals.
- iii.
- Selected anchor boxes and the feature maps computed by the initial CNN model together are fed to the RoI pooling layer for reshaping, and the output of the RoI pooling layer is fed into the FC layers for final classification and bounding box regression.
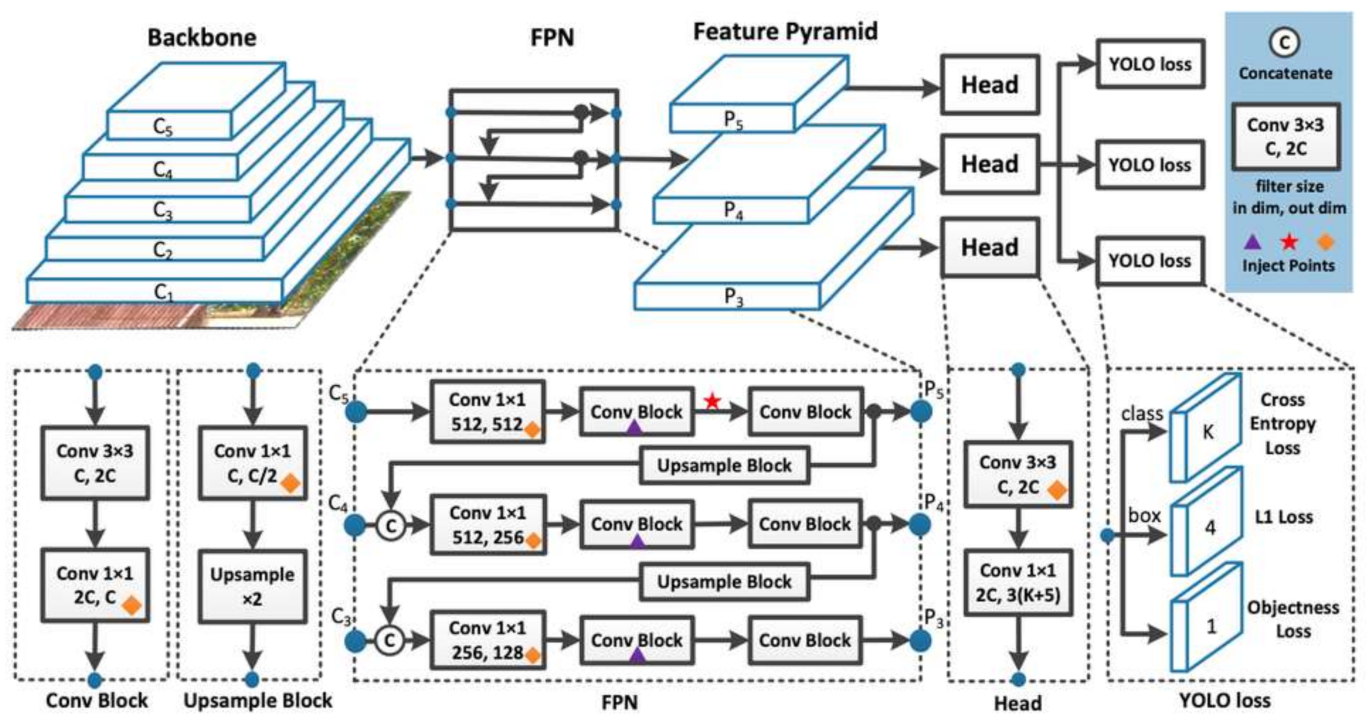
- i.
- It resizes the input image before going through the convolutional network.
- ii.
- A 1 × 1 convolution is first applied to reduce the number of channels, which is then followed by a 3 × 3 convolution to generate an output.
- iii.
- Some additional techniques, such as batch normalization and dropout, regularize the model and prevent it from overfitting.
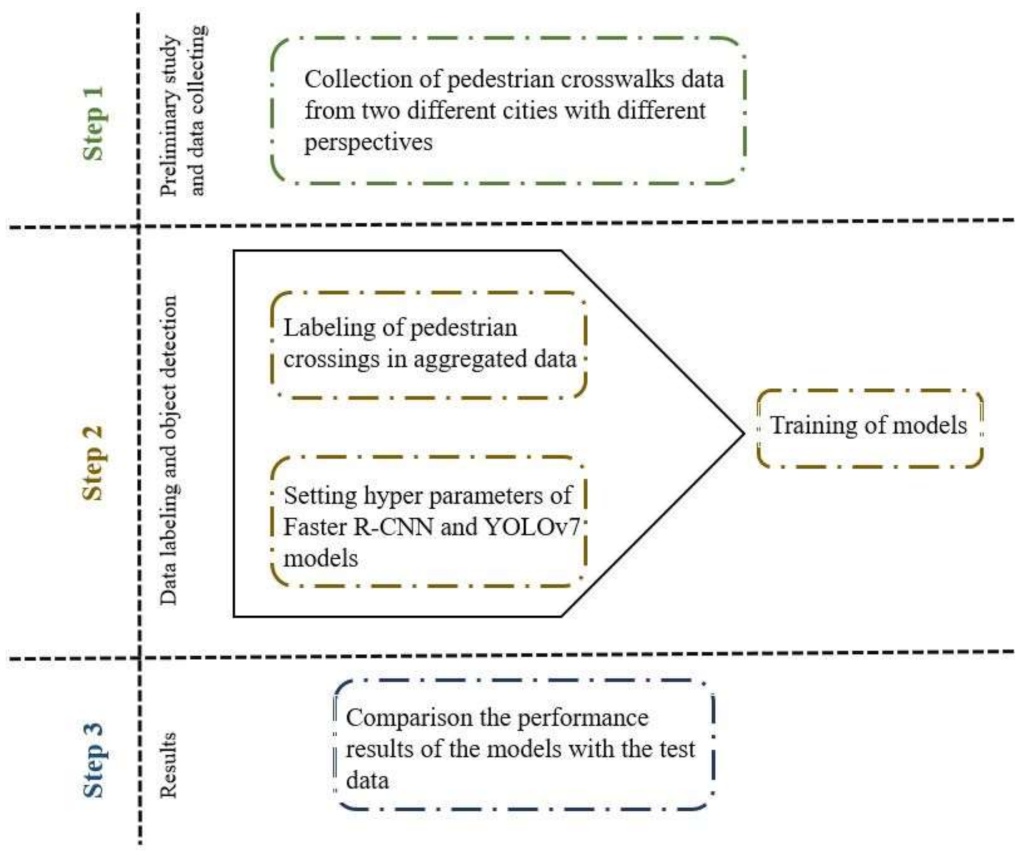
4. Methodology and Dataset
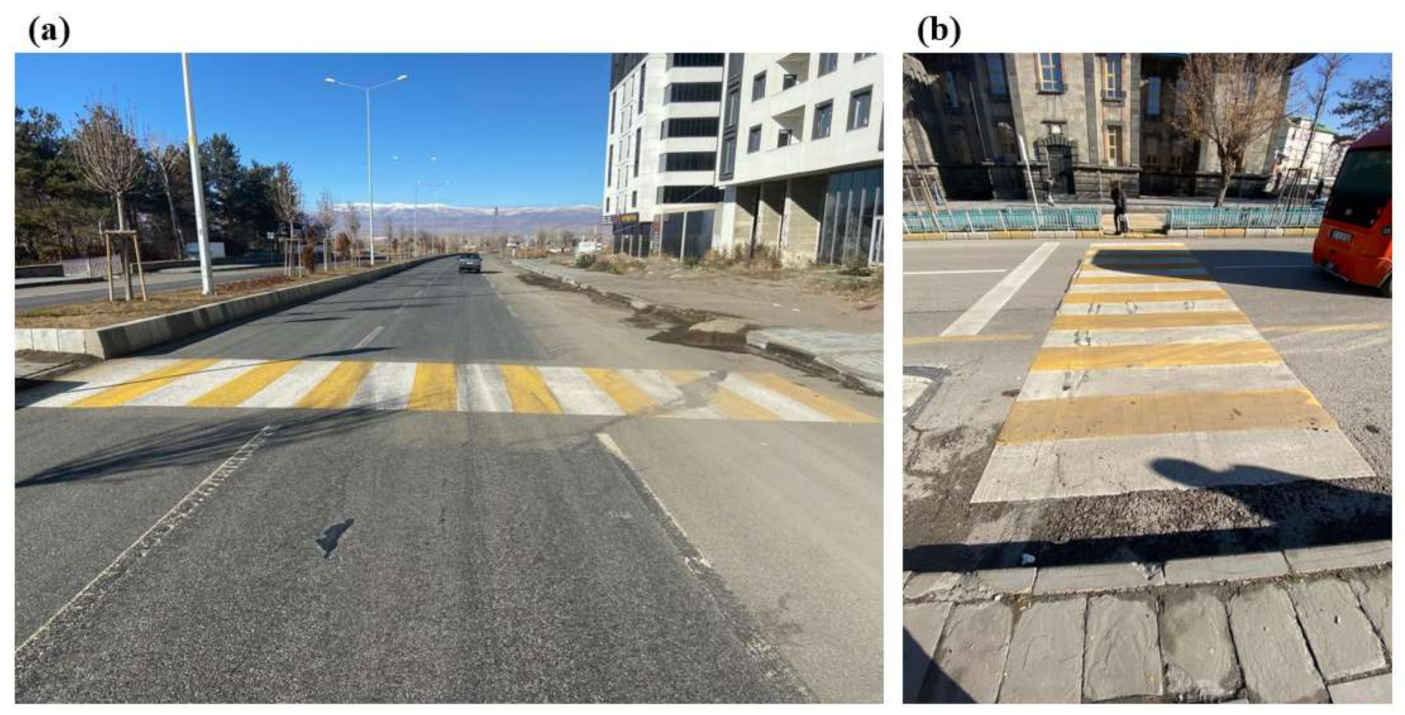
4.1. Data Exploration and Splits
4.2. Data Augmentation
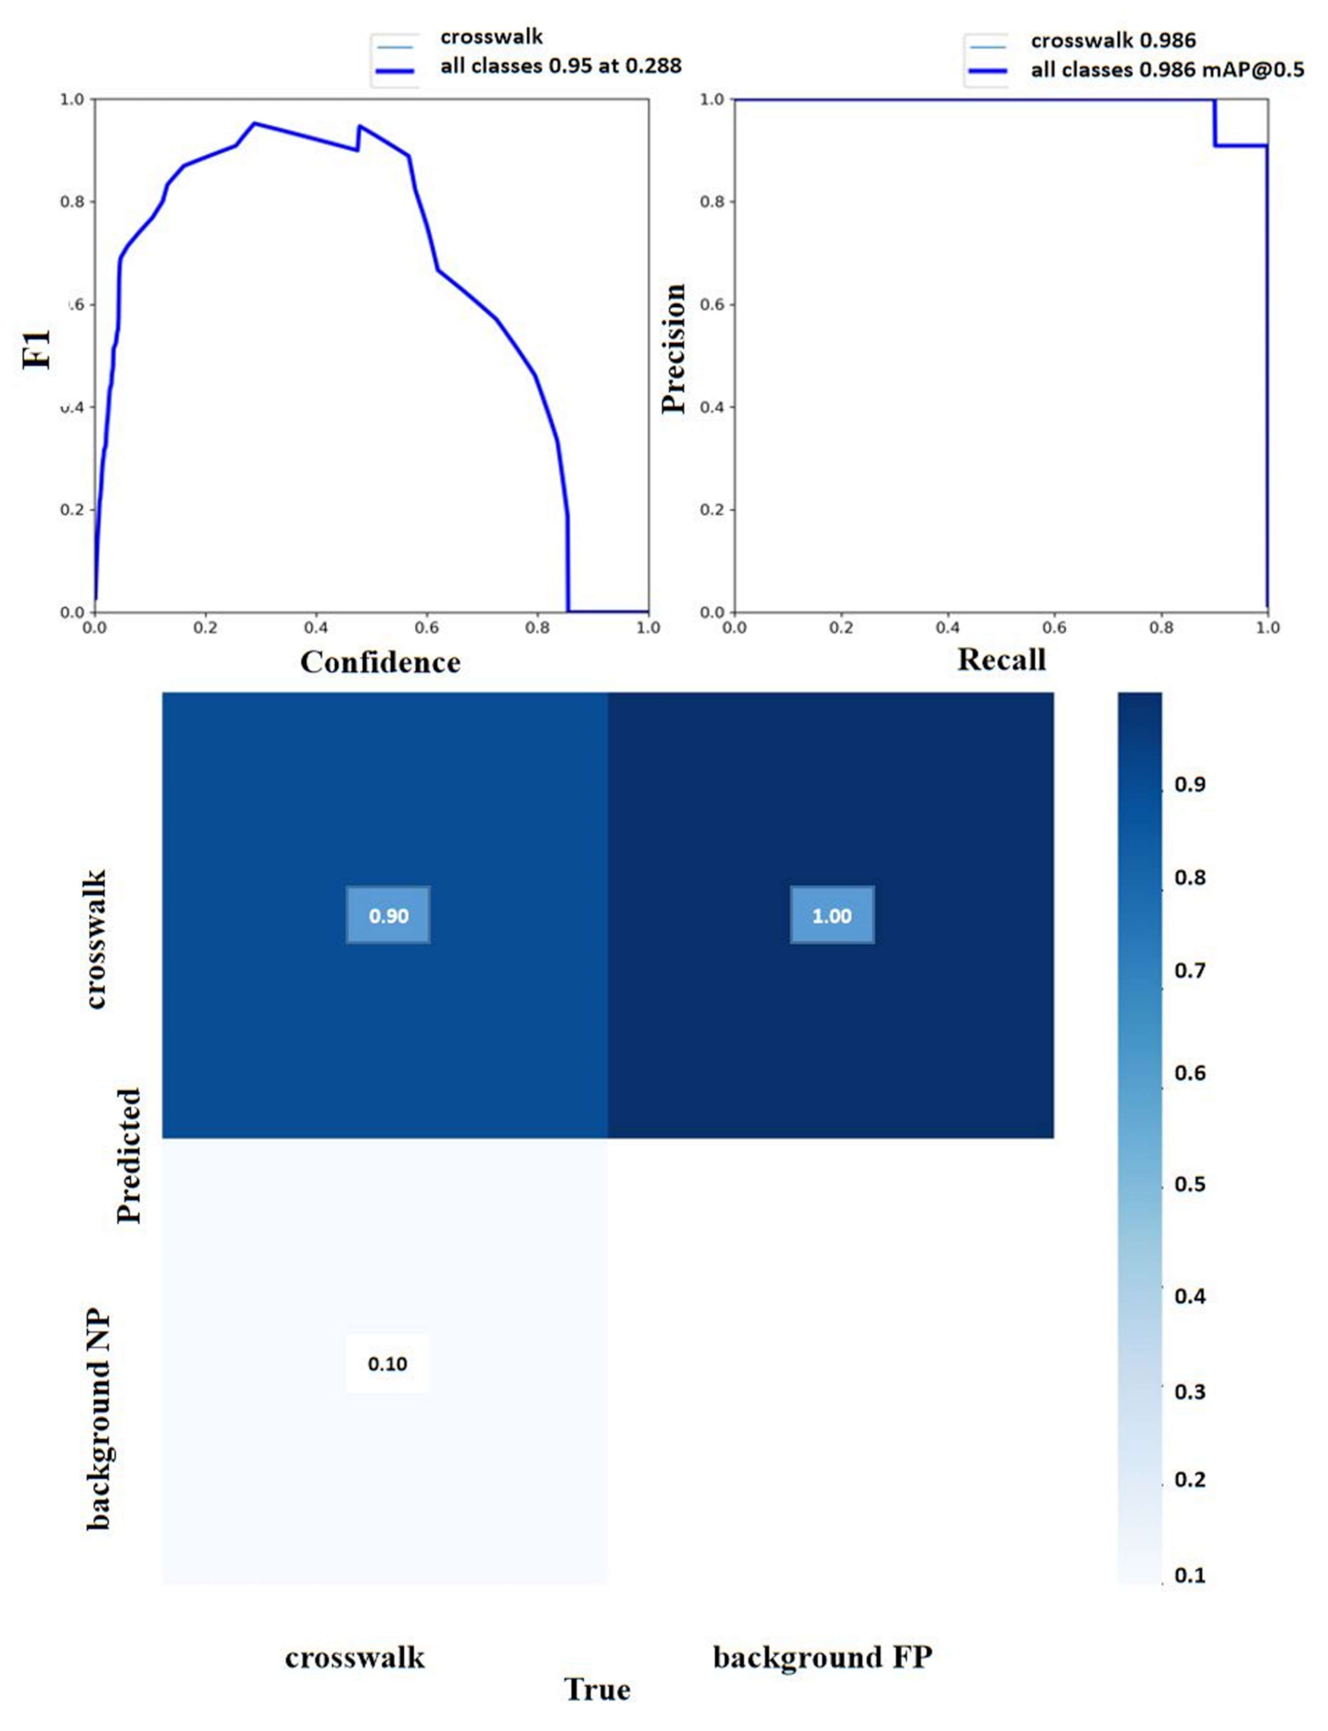
4.3. Evaluation
- (i)
- (ii)
- The predicted label matches the actual label. In this case, if IoU ≥ 0.5, then it is a match, and it is not otherwise.
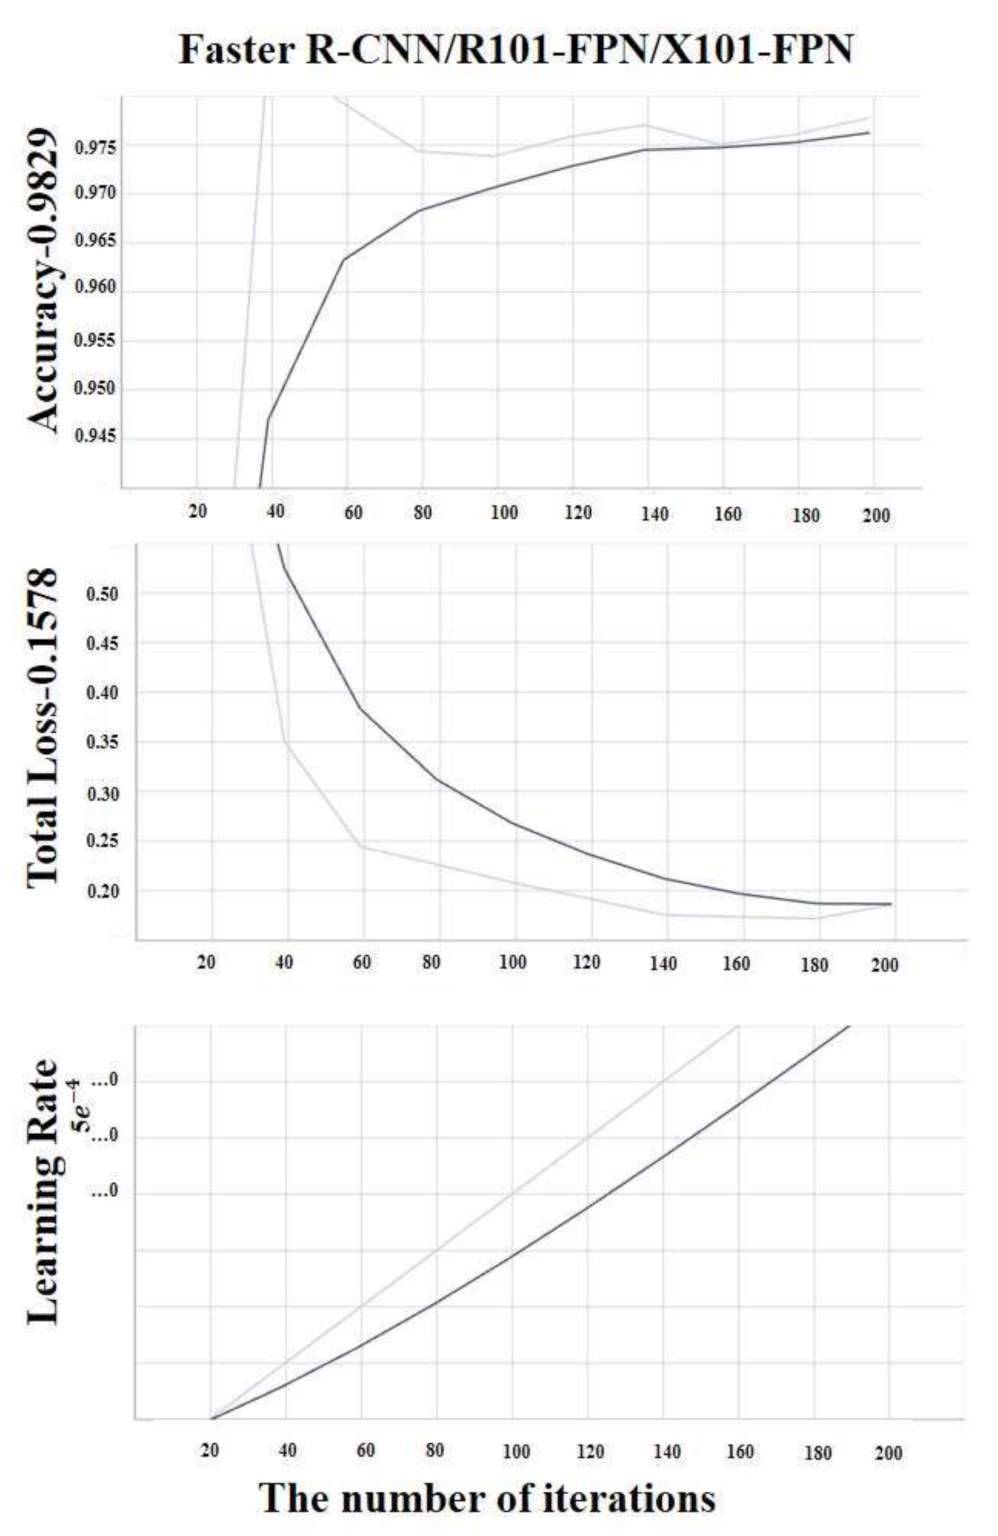
4.4. Training Details
5. Result and Discussion
6. Conclusions
Author Contributions
Funding
Data Availability Statement
Acknowledgments
Conflicts of Interest
References
- Adanu, E.K.; Jones, S. Effects of Human-Centered Factors on Crash Injury Severities. J. Adv. Transp. 2017, 2017, 1208170. [Google Scholar] [CrossRef]
- World Health Organization (WHO). Global Status Report on Road Safety; World Health Organization (WHO): Geneva, Switzerland, 2018. [Google Scholar]
- 2019 Pedestrian Priority Traffic Year and Traffic Week. Available online: https://www.icisleri.gov.tr/illeridaresi/2019-yaya-oncelikli-trafik-yili-ve-trafik-haftasi (accessed on 2 December 2020).
- Russell, B.C.; Torralba, A.; Murphy, K.P.; Freeman, W.T. LabelMe: A Database and Web-Based Tool for Image Annotation. Available online: http://labelme2.csail.mit.edu/Release3.0/index.php (accessed on 10 January 2023).
- Roboflow Give Your Software the Sense of Sight. Available online: https://roboflow.com/ (accessed on 6 October 2022).
- Wang, C.; Bochkovskiy, A.; Liao, H.M. YOLOv7: Trainable bag-of-freebies sets new state-of-the-art for real-time object detectors. Comput. Vis. Pattern Recognit. 2022, 1–15. [Google Scholar] [CrossRef]
- Ren, S.; He, K.; Girshick, R.; Sun, J. Faster R-CNN: Towards Real-Time Object Detection with Region Proposal Networks. IEEE Trans. Pattern Anal. Mach. Intell. 2017, 39, 1137–1149. [Google Scholar] [CrossRef] [PubMed]
- Zaidi, S.S.A.; Ansari, M.S.; Aslam, A.; Kanwal, N.; Asghar, M.; Lee, B. A survey of modern deep learning based object detection models. Digit. Signal Process. A Rev. J. 2022, 126, 103514. [Google Scholar] [CrossRef]
- Se, S. Zebra-crossing Detection for the Partially Sighted. In Proceedings of the IEEE Conference on Computer Vision and Pattern Recognition. CVPR 2000 (Cat. No.PR00662), Hilton Head, SC, USA, 15 June 2000; IEEE: Piscataway Township, NJ, USA, 2002. [Google Scholar] [CrossRef]
- Xin, H.; Qian, L. An Improved Method of Zebra Crossing Detection based on Bipolarity. Sci.-Eng. 2018, 34, 202–205. [Google Scholar]
- Uddin, M.S.; Shioyama, T. Bipolarity and Projective Invariant-Based Zebra-Crossing Detection for the Visually Impaired. In Proceedings of the 2005 IEEE Computer Society Conference on Computer Vision and Pattern Recognition (CVPR’05)-Workshops, San Diego, CA, USA, 20–26 June 2005; IEEE: San Diego, CA, USA, 2005. [Google Scholar]
- Cheng, R.; Wang, K.; Yang, K.; Long, N.; Hu, W.; Chen, H.; Bai, J.; Liu, D. Crosswalk navigation for people with visual impairments on a wearable device. J. Electron. Imaging 2017, 26, 053025. [Google Scholar] [CrossRef]
- Chen, N.; Hong, F.; Bai, B. Zebra crossing recognition method based on edge feature and Hough transform. J. Zhejiang Univ. Sci. Technol. 2019, 6, 476–483. [Google Scholar]
- Cao, Z.; Xu, X.; Hu, B.; Zhou, M. Rapid Detection of Blind Roads and Crosswalks by Using a Lightweight Semantic Segmentation Network. IEEE Trans. Intell. Transp. Syst. 2021, 22, 6188–6197. [Google Scholar] [CrossRef]
- Ma, Y.; Gu, X.; Zhang, W.; Hu, S.; Liu, H.; Zhao, J.; Chen, S. Evaluating the effectiveness of crosswalk tactile paving on street-crossing behavior: A field trial study for people with visual impairment. Accid. Anal. Prev. 2021, 163, 106420. [Google Scholar] [CrossRef]
- Romić, K.; Galić, I.; Leventić, H.; Habijan, M. Pedestrian Crosswalk Detection Using a Column and Row Structure Analysis in Assistance Systems for the Visually Impaired. Acta Polytech. Hung. 2021, 18, 25–45. [Google Scholar] [CrossRef]
- Tian, S.; Zheng, M.; Zou, W.; Li, X.; Zhang, L. Dynamic Crosswalk Scene Understanding for the Visually Impaired. IEEE Trans. Neural Syst. Rehabil. Eng. 2021, 29, 1478–1486. [Google Scholar] [CrossRef] [PubMed]
- Tümen, V.; Ergen, B. Intersections and crosswalk detection using deep learning and image processing techniques. Phys. A Stat. Mech. Its Appl. 2020, 543, 123510. [Google Scholar] [CrossRef]
- Dow, C.; Lee, L.; Huy, N.H.; Wang, K. A Human Recognition System for Pedestrian Crosswalk. Commun. Comput. Inf. Sci. 2018, 852, 443–447. [Google Scholar] [CrossRef]
- Alemdar, K.D.; Kaya, Ö.; Çodur, M.Y. A GIS and microsimulation-based MCDA approach for evaluation of pedestrian crossings. Accid. Anal. Prev. 2020, 148, 105771. [Google Scholar] [CrossRef] [PubMed]
- Karaman, A.; Karaboga, D.; Pacal, I.; Akay, B.; Basturk, A.; Nalbantoglu, U.; Coskun, S.; Sahin, O. Hyper-parameter optimization of deep learning architectures using artificial bee colony (ABC) algorithm for high performance real-time automatic colorectal cancer (CRC) polyp detection. Appl. Intell. 2022, 1–18. [Google Scholar] [CrossRef]
- Yung, N.D.T.; Wong, W.K.; Juwono, F.H.; Sim, Z.A. Safety Helmet Detection Using Deep Learning: Implementation and Comparative Study Using YOLOv5, YOLOv6, and YOLOv7. In Proceedings of the International Conference on Green Energy, Computing and Sustainable Technology (GECOST), Miri Sarawak, Malaysia, 26–28 October 2022. [Google Scholar] [CrossRef]
- Van Der Horst, B.B.; Lindenbergh, R.C.; Puister, S.W.J. Mobile laser scan data for road surface damage detection. Int. Arch. Photogramm. Remote Sens. Spat. Inf. Sci.-ISPRS Arch. 2019, 42, 1141–1148. [Google Scholar] [CrossRef]
- Pandey, A.K.; Palade, V.; Iqbal, R.; Maniak, T.; Karyotis, C.; Akuma, S. Convolution neural networks for pothole detection of critical road infrastructure. Comput. Electr. Eng. 2022, 99, 107725. [Google Scholar] [CrossRef]
- Dang, F.; Chen, D.; Lu, Y.; Li, Z. YOLOWeeds: A novel benchmark of YOLO object detectors for multi-class weed detection in cotton production systems. Comput. Electron. Agric. 2023, 205, 107655. [Google Scholar] [CrossRef]
- Wu, D.; Jiang, S.; Zhao, E.; Liu, Y.; Zhu, H.; Wang, W.; Wang, R. Detection of Camellia oleifera Fruit in Complex Scenes by Using YOLOv7 and Data Augmentation. Appl. Sci. 2022, 12, 11318. [Google Scholar] [CrossRef]
- Zenebe, Y.A.; Xiaoyu, L.; Chao, W.; Yi, W.; Endris, H.A.; Fanose, M.N. Towards Automatic 2D Materials Detection Using YOLOv7. In Proceedings of the 19th International Computer Conference on Wavelet Active Media Technology and Information Processing (ICCWAMTIP), Chengdu, China, 16 December 2022. [Google Scholar] [CrossRef]
- Kamboj, A.; Powar, N. Safety Helmet Detection in Industrial Environment using Deep Learning. The 9th International Conference on Information Technology Convergence and Services (ITCSE 2020), Zurich, Switzerland, 21–22 November 2020; pp. 197–208. [Google Scholar] [CrossRef]
- Huang, L.; Fu, Q.; He, M.; Jiang, D.; Hao, Z. Detection algorithm of safety helmet wearing based on deep learning. Concurr. Comput. Pract. Exp. 2021, 33, 1–14. [Google Scholar] [CrossRef]
- Li, Y.; Wei, H.; Han, Z.; Huang, J.; Wang, W. Deep Learning-Based Safety Helmet Detection in Engineering Management Based on Convolutional Neural Networks. Adv. Civ. Eng. 2020, 2020, 9703560. [Google Scholar] [CrossRef]
- Long, X.; Cui, W.; Zheng, Z. Safety helmet wearing detection based on deep learning. In Proceedings of the 2019 IEEE 3rd Information Technology Networking, Electronic and Automation Control Conference, ITNEC 2019, Chengdu, China, 15–17 March 2019; pp. 2495–2499. [Google Scholar] [CrossRef]
- Chen, K.; Yan, G.; Zhang, M.; Xiao, Z.; Wang, Q. Safety Helmet Detection Based on YOLOv7. ACM Int. Conf. Proceeding Ser. 2022, 31, 6–11. [Google Scholar] [CrossRef]
- Jiang, K.; Xie, T.; Yan, R.; Wen, X.; Li, D.; Jiang, H.; Jiang, N.; Feng, L.; Duan, X.; Wang, J. An Attention Mechanism-Improved YOLOv7 Object Detection Algorithm for Hemp Duck Count Estimation. Agriculture 2022, 12, 1659. [Google Scholar] [CrossRef]
- Liu, S.; Wang, Y.; Yu, Q.; Liu, H.; Peng, Z. CEAM-YOLOv7: Improved YOLOv7 Based on Channel Expansion and Attention Mechanism for Driver Distraction Behavior Detection. IEEE Access 2022, 10, 129116–129124. [Google Scholar] [CrossRef]
- Al-Smadi, Y.; Alauthman, M.; Al-Qerem, A.; Aldweesh, A.; Quaddoura, R.; Aburub, F.; Mansour, K.; Alhmiedat, T. Early Wildfire Smoke Detection Using Different YOLO Models. Machines 2023, 11, 246. [Google Scholar] [CrossRef]
- Ghourabi, M.; Mourad-Chehade, F.; Chkeir, A. Eye Recognition by YOLO for Inner Canthus Temperature Detection in the Elderly Using a Transfer Learning Approach. Sensors 2023, 23, 1851. [Google Scholar] [CrossRef]
- Zhou, Q.; Liu, H.; Qiu, Y.; Zheng, W. Object Detection for Construction Waste Based on an Improved YOLOv5 Model. Sustainability 2023, 15, 681. [Google Scholar] [CrossRef]
- Wang, Y.; Fu, B.; Fu, L.; Xia, C. In Situ Sea Cucumber Detection across Multiple Underwater Scenes Based on Convolutional Neural Networks and Image Enhancements. Sensors 2023, 23, 2037. [Google Scholar] [CrossRef]
- Patel, K.; Bhatt, C.; Mazzeo, P.L. Improved Ship Detection Algorithm from Satellite Images Using YOLOv7 and Graph Neural Network. Algorithms 2022, 15, 473. [Google Scholar] [CrossRef]
- Chen, J.; Liu, H.; Zhang, Y.; Zhang, D.; Ouyang, H.; Chen, X. A Multiscale Lightweight and Efficient Model Based on YOLOv7: Applied to Citrus Orchard. Plants 2022, 11, 3260. [Google Scholar] [CrossRef]
- Common Object in Context. Available online: https://cocodataset.org/#overview (accessed on 30 January 2022).
- Girshick, R. Fast R-CNN. In Proceedings of the IEEE International Conference on Computer Vision 2015, Santiago, Chile, 7–13 December 2015; pp. 1440–1448. [Google Scholar] [CrossRef]
- Hui, J. SSD Object Detection: Single Shot MultiBox Detector for Real-Time Processing. Available online: https://jonathan-hui.medium.com/ssd-object-detection-single-shot-multibox-detector-for-real-time-processing-9bd8deac0e06 (accessed on 4 January 2022).
- Global Road Damage Detection Challenge 2020. Available online: https://rdd2020.sekilab.global/ (accessed on 13 January 2022).
- Wu, Y.; Kirillov, A.; Massa, F.; Lo, W.-Y.; Girshick, R. Facebook AI Research-FAIR. Available online: https://paperswithcode.com/lib/detectron2 (accessed on 12 October 2022).
- Girshick, R.; Radosavovic, I.; Gkioxari, G.; He, K. Facebookresearch/Detectron2. Available online: https://github.com/facebookresearch/detectron2/blob/main/MODEL_ZOO.md (accessed on 10 November 2022).
- Lin, T.-Y.; Dollar, P.; Ross, G.; He, K.; Hariharan, B. Feature Pyramid Networks for Object Detection. Comput. Vis. Pattern Recognit. 2016, 2117–2125. [Google Scholar] [CrossRef]
- Sultana, F.; Sufian, A.; Dutta, P. A review of object detection models based on convolutional neural network. Comput. Vis. Pattern Recognit. 2019, 1157, 1–16. [Google Scholar] [CrossRef]
- Bai, T.; Yang, J.; Xu, G.; Yao, D. An optimized railway fastener detection method based on modified Faster R-CNN. Meas. J. Int. Meas. Confed. 2021, 182, 109742. [Google Scholar] [CrossRef]
- FAIR Meta AI. Available online: https://ai.facebook.com/tools/detectron2/ (accessed on 1 December 2022).
- Wang, C.; Bochkovskiy, A.; Liao, H.M. GitHub/WongKinYiu /yolov7. Available online: https://github.com/WongKinYiu/yolov7 (accessed on 10 August 2022).
- Arya, D.; Maeda, H.; Ghosh, S.K.; Toshniwal, D.; Mraz, A.; Kashiyama, T.; Sekimoto, Y. Transfer Learning-based Road Damage Detection for Multiple Countries. Comput. Vis. Pattern Recognit. 2020, 16. [Google Scholar] [CrossRef]
- Quintana, M.; Torres, J.; Menéndez, J.M. A Simplified Computer Vision System for Road Surface Inspection and Maintenance. IEEE Trans. Intell. Transp. Syst. 2016, 17, 608–619. [Google Scholar] [CrossRef]
- Arya, D.; Maeda, H.; Kumar Ghosh, S.; Toshniwal, D.; Omata, H.; Kashiyama, T.; Sekimoto, Y. Global Road Damage Detection: State-of-the-art Solutions. In Proceedings of the 2020 IEEE International Conference on Big Data (Big Data), Atlanta, GA, USA, 10–13 December 2020; pp. 5533–5539. [Google Scholar]
- Pham, V.; Pham, C.; Dang, T. Road Damage Detection and Classification with Detectron2 and Faster R-CNN. In Proceedings of the 2020 IEEE International Conference on Big Data (Big Data) 2020, Atlanta, GA, USA, 10–13 December 2020; pp. 5592–5601. [Google Scholar] [CrossRef]


| Models | Batch Size | Learning Rate (LR) | Multiplicative Factor of LR Decay (Gamma) | Period of LR Decay (Step Size) | Number of Iterations | Workers | Number of Classes |
|---|---|---|---|---|---|---|---|
| X101-FPN | 8 | 0.001 | 0.05 | 500 | 200 | 2 | 1 |
| R101-FPN |
| Model | Initial Learning Rate | Batch Size | Momentum | Weight Decay | Total Epochs |
|---|---|---|---|---|---|
| YOLOv7 | 0.01 | 8 | 0.8 | 0.0005 | 30 |
Disclaimer/Publisher’s Note: The statements, opinions and data contained in all publications are solely those of the individual author(s) and contributor(s) and not of MDPI and/or the editor(s). MDPI and/or the editor(s) disclaim responsibility for any injury to people or property resulting from any ideas, methods, instructions or products referred to in the content. |
© 2023 by the authors. Licensee MDPI, Basel, Switzerland. This article is an open access article distributed under the terms and conditions of the Creative Commons Attribution (CC BY) license (https://creativecommons.org/licenses/by/4.0/).
Share and Cite
Kaya, Ö.; Çodur, M.Y.; Mustafaraj, E. Automatic Detection of Pedestrian Crosswalk with Faster R-CNN and YOLOv7. Buildings 2023, 13, 1070. https://doi.org/10.3390/buildings13041070
Kaya Ö, Çodur MY, Mustafaraj E. Automatic Detection of Pedestrian Crosswalk with Faster R-CNN and YOLOv7. Buildings. 2023; 13(4):1070. https://doi.org/10.3390/buildings13041070
Chicago/Turabian StyleKaya, Ömer, Muhammed Yasin Çodur, and Enea Mustafaraj. 2023. "Automatic Detection of Pedestrian Crosswalk with Faster R-CNN and YOLOv7" Buildings 13, no. 4: 1070. https://doi.org/10.3390/buildings13041070