Article

Identification of Simulated Damage in Prestressed Anchorage Using Admittance-Based Active Sensing Technique

by
Chi-Thien Nguyen
1,2,
Thanh-Truong Nguyen
2,3,
Trung-Hau Nguyen
2,4,
Ba-Tung Le
1,2,
Tran-De-Nhat Truong
1,2,
Duc-Duy Ho
1,2,* and
Thanh-Canh Huynh
5,6,*
1
Faculty of Civil Engineering, Ho Chi Minh City University of Technology (HCMUT), 268 Ly Thuong Kiet, District 10, Ho Chi Minh City 700000, Vietnam
2
Vietnam National University Ho Chi Minh City (VNU-HCM), Linh Trung Ward, Thu Duc City, Ho Chi Minh City 700000, Vietnam
3
Industrial Maintenance Training Center, Ho Chi Minh City University of Technology (HCMUT), 268 Ly Thuong Kiet Street, District 10, Ho Chi Minh City 700000, Vietnam
4
Faculty of Applied Science, Ho Chi Minh City University of Technology (HCMUT), 268 Ly Thuong Kiet, District 10, Ho Chi Minh City 700000, Vietnam
5
Institute of Research and Development, Duy Tan University, Danang 550000, Vietnam
6
Faculty of Civil Engineering, Duy Tan University, Danang 550000, Vietnam
*
Authors to whom correspondence should be addressed.
Buildings 2023, 13(4), 1068; https://doi.org/10.3390/buildings13041068
Submission received: 17 March 2023 / Revised: 31 March 2023 / Accepted: 17 April 2023 / Published: 18 April 2023

Abstract

:
This study examined the feasibility of the admittance-based method for detecting simulated damage in the bearing plate of a prestressed anchorage. The proposed method utilized the PZT (lead zirconate titanate) interface technique to acquire a strong admittance response from the anchorage. Firstly, the numerical feasibility of the method was demonstrated by detecting the presence of fatigue cracks and preload changes in a fixed–fixed beam-like structure. Next, the experimental verification was carried out using a lab-scale prestressed anchorage model. A PZT interface prototype was designed and surface-mounted on the bearing plate. The admittance response of the PZT interface was measured before and after the simulated damage cases of the bearing plate. Afterwards, a statistical damage metric, root-mean-square deviation (RMSD) was used to quantify the change in the admittance spectrum and identify the damage’s presence. It was shown that the experimental admittance response was consistent with the numerical simulation result in the same effective frequency band. Both the numerical and experimental results showed clear shifts in the admittance spectrum due to structural damage. The simulated damages in the bearing plate were successfully identified by the RMSD evaluation metric.

1. Introduction

Structural health monitoring (SHM) is an important field involving using sensors and damage identification algorithms to assess the condition of civil, mechanical, and aerospace structures over time [1,2,3,4,5]. The admittance (or impedance)-based damage detection technique has emerged as a promising approach among different SHM technologies due to its ability to detect minor changes in the physical properties of a structure, enabling early damage detection and potentially preventing catastrophic failure [6,7,8]. The admittance-based technique works on the principle that mechanical changes in a structure due to damage would result in changes in its electromechanical properties, such as admittance response. The technique is cost-efficient because of the adoption of low-cost transducers such as PZT (lead zirconate titanate) and the availability of low-cost admittance analyzers [9,10,11,12].
The admittance-based technique has been extensively studied for SHM of various engineering structures [13,14,15,16,17]. For instance, Giurgiutiu and Zagrai [18] demonstrated its effectiveness in detecting fatigue cracks in thin plate-like and aerospace structures. They developed statistical damage metrics and a probabilistic neural network to assess incipient damage by classifying the high-frequency impedance spectrum [18]. Karayannis et al. [19] used the technique for detecting flexural damage stages in the lower part of the mid-span area of a simply supported reinforced concrete beam. Their study showed that the frequency selection greatly influenced the damage detection capacity and that flexural damage in the transducer near field was detected with higher overall sensitivity. Kim et al. [17] evaluated the effectiveness of the technique for detecting defects in an adhesive joint used in composite materials. The study showed that the impedances of the joint were modified by the defects, allowing for the evaluation of its strength degradation. These studies demonstrated the versatility of the admittance-based technique for detecting different types of damage in various engineering structures.
In recent years, the admittance-based technique has gained popularity for the SHM of prestressed anchorage [20,21,22]. The changes in the mechanical impedance of the bearing plate or anchor head are utilized as indicators for the identification of prestress loss or deterioration in the anchorage system [21,23,24]. Kim et al. [25] attached the piezoelectric transducer to the bearing plate of a prestressed concrete girder and detected the loss of prestress force by monitoring changes in the impedance response. Their study showed that the frequency band sensitive to the prestress force was within 800–1000 kHz [25]. Min et al. [21] monitored the mechanical impedance of the anchor head and bearing plate to predict the remaining tensions in a prestressed steel frame. Huynh and Kim [26] developed the so-called “mountable PZT interface” as a resonance-enhanced piezoelectric device for prestress force monitoring using mechanical impedance responses. Dang et al. [22] proposed using multiple PZT interfaces to detect a loose strand in a multi-strand anchorage system. Nguyen et al. [27] quantitatively estimated the prestress force in a prestressed reinforced concrete girder using a convolutional neural network. The aforementioned studies validated the great potential of the admittance-based technique as an effective means of monitoring the structural integrity of prestressed concrete structures.
As a critical subsystem in prestressed structures, the anchorage is likely to experience failure due to many factors, such as corrosion and fatigue [23,28,29,30]. However, most of the previous studies have focused on monitoring the prestress force using the admittance-based technique. In this study, we examined the feasibility of the admittance-based technique for detecting simulated damage in the bearing plate of a prestressed reinforced concrete anchorage. A PZT interface as a resonance-enhanced piezoelectric device was designed and used to acquire a strong admittance response from the anchorage. Firstly, a finite element model of a fixed–fixed beam-like structure instrumented with a PZT interface was simulated. The numerical feasibility of the method was demonstrated by detecting the preload change and the presence of fatigue cracks in the beam. Secondly, the experiment was conducted on a lab-scale prestressed anchorage model to test the performance of the proposed method. A PZT interface prototype was manufactured and mounted on the surface of the bearing plate. Two testing scenarios were investigated, including the simulated damages close to and distant from the interface. The admittance response of the PZT interface was measured before and after the damages. To identify the simulated damages in the anchorage, a statistical damage evaluation metric was used to estimate the change in the admittance spectrum. Finally, the damage sensitivity across different frequency bands was compared to determine the optimal band for damage assessment in the tested prestressed anchorage.

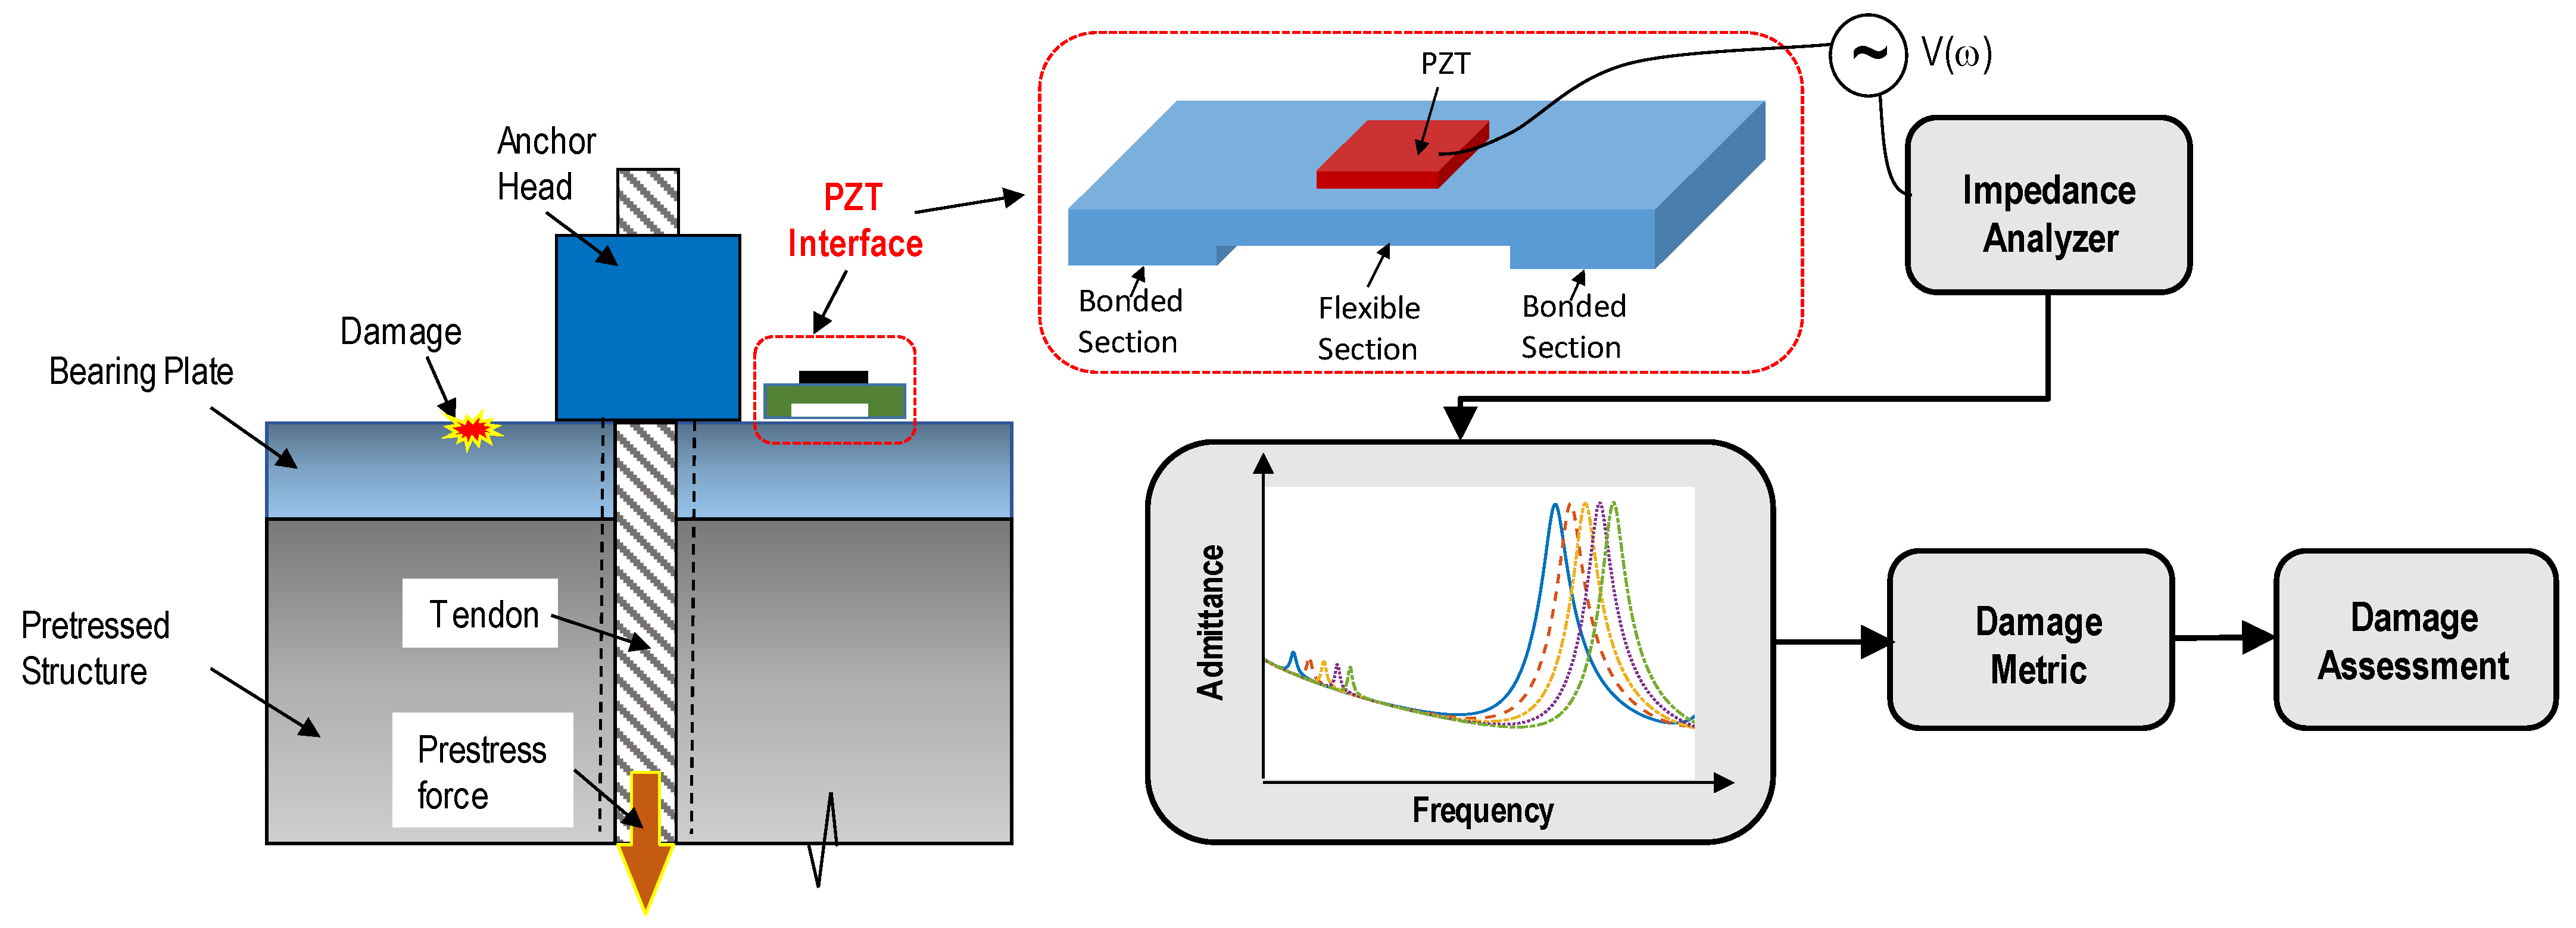
2. Admittance-Based Active Sensing Technique

2.1. Admittance Monitoring Using Resonance-Enhanced Piezoelectric Device

The schematic of the admittance-based technique for crack detection in a prestressed anchorage is illustrated in Figure 1. This technique relies on measuring the changes in the mechanical impedance of an anchorage caused by damage [31,32]. To apply the technique, a piezoelectric device is bonded to the bearing plate of a prestressed anchorage. Afterwards, the admittance response of the anchorage is periodically measured in a predefined frequency band using an impedance analyzer. Next, statistical damage metrics are computed to estimate changes in the admittance spectrum. Finally, the structural integrity of the anchorage is then assessed using the calculated damage metrics.
The frequency band used for damage detection should have strong resonant peaks containing rich structural properties information [33]. However, this frequency range varies with the local dynamic characteristics of the target structure [24]. To ensure the consistency of measured admittance responses, the resonance-enhanced technique using the PZT interface device is applied to the admittance monitoring process. The device prototype is presented in Figure 1, following the previous studies [26,34]. The interface structure consists of two outer bonded parts and a central part that remains un-bonded and contains a PZT transducer. The outer bonded components allow for the simple installation and removal of the interface from the host prestressed anchorage. Meanwhile, the middle section is designed as a flexural segment, which can produce strong vibrational responses when the PZT is excited. By adjusting the structural and geometrical properties of the flexural section, it is possible to produce admittance signals in any targeted frequency ranges [35]. Numerical simulations are often used to determine the effective frequency band of the PZT interface before actual admittance measurements [36,37].

2.2. Admittance Response of the PZT Interface-Anchorage System

It is worth noting that the PZT interface-based admittance monitoring technique was first proposed in [26] for tendon-anchorage subsystems. The detailed theoretical background of the technique with the validated modal superposition can be found in [38]. Therefore, in this section, we briefly present important equations to explain the admittance response of the PZT interface-anchorage system and to show the feasibility of damage detection using this technique.
To record the admittance response, the PZT patch of the device is excited by a harmonic voltage V(ω) using an impedance analyzer. As a piezoelectric material, the PZT can produce an electrical charge in response to a mechanical force or vice versa. Thus, the voltage applied to the PZT patch causes a mechanical deformation as a result of the inverse piezoelectric effect. This deformation, in turn, generates a force F(ω) that excites the structure. The interaction between the piezoelectric interface and the anchorage can be modeled as a two-degree-of-freedom (2-dof) system, as presented in the previous studies [6,39].
It is supposed that the interface body’s dynamic properties include the mass (mi), stiffness parameter (ki), and damping coefficient (ci). Additionally, the prestressed anchorage’s dynamic properties consist of the mass (ms), the stiffness parameter (ks), and the damping coefficient (cs). During the piezoelectric excitation of the PZT, there are couplings between the PZT transducer and the interface and between the interface and the prestressed anchorage. The equivalent mechanical impedance of the interface-anchorage subsystem Z ¯ ( ω ) related to such coupling responses can be computed using the 2-dof model [38], as follows:
Z ¯ ( ω ) = K 11 ( ω ) K 22 ( ω ) K 12 2 ( ω ) i ω K 22 ( ω )
In Equation (1), the symbol i stands for the imaginary unit; ω denotes the scanned frequency; the terms [Kmn(ω)], where m, n = 1, 2 are the “dynamic stiffness” terms and can be computed as:
K 11 ( ω ) K 12 ( ω ) K 12 ( ω ) K 22 ( ω ) = ω 2 m i + i ω c i + k i i ω c i k i i ω c i k i ω 2 m s + i ω ( c i + c s ) + ( k i + k s )
The admittance response of the 2-dof system is determined as a joint function of the mechanical impedance of both the prestressed anchorage ( Z ¯ ( ω ) ) and the PZT transducer ( Z a ( ω ) ) [32], expressed as follows:
Y ( ω ) = I ( ω ) V ( ω ) = i ω w a l a t a ε ^ 33 T 1 Z a ( ω ) / Z ¯ s ( ω ) + 1 d 3 x 2 Y ^ x x E
In Equation (3), Y ^ x x E represents the complex Young’s modulus of the PZT patch under a zero electric field; ε ^ x x T stands for the complex dielectric constant under zero stress; d3x denotes the piezoelectric coupling constant in the x-direction under zero stress; and wa, la, and ta indicate the width, length, and thickness of the transducer, respectively.
From Equation (1) and Equation (3), it is shown that the change in the mechanical properties (ms, cs, ks) of the monitored anchorage would result in the alternation in the admittance response of the interface device. Therefore, any damage (i.e., crack or corrosion) to the anchorage can be detected by quantifying the admittance change. To detect early-stage structural damage effectively, the admittance responses should be measured in the effective high-frequency range of strong resonances. The short wavelengths generated at high frequencies can enhance the damage detectability of the technique [32].

2.3. Damage Evaluation Approach
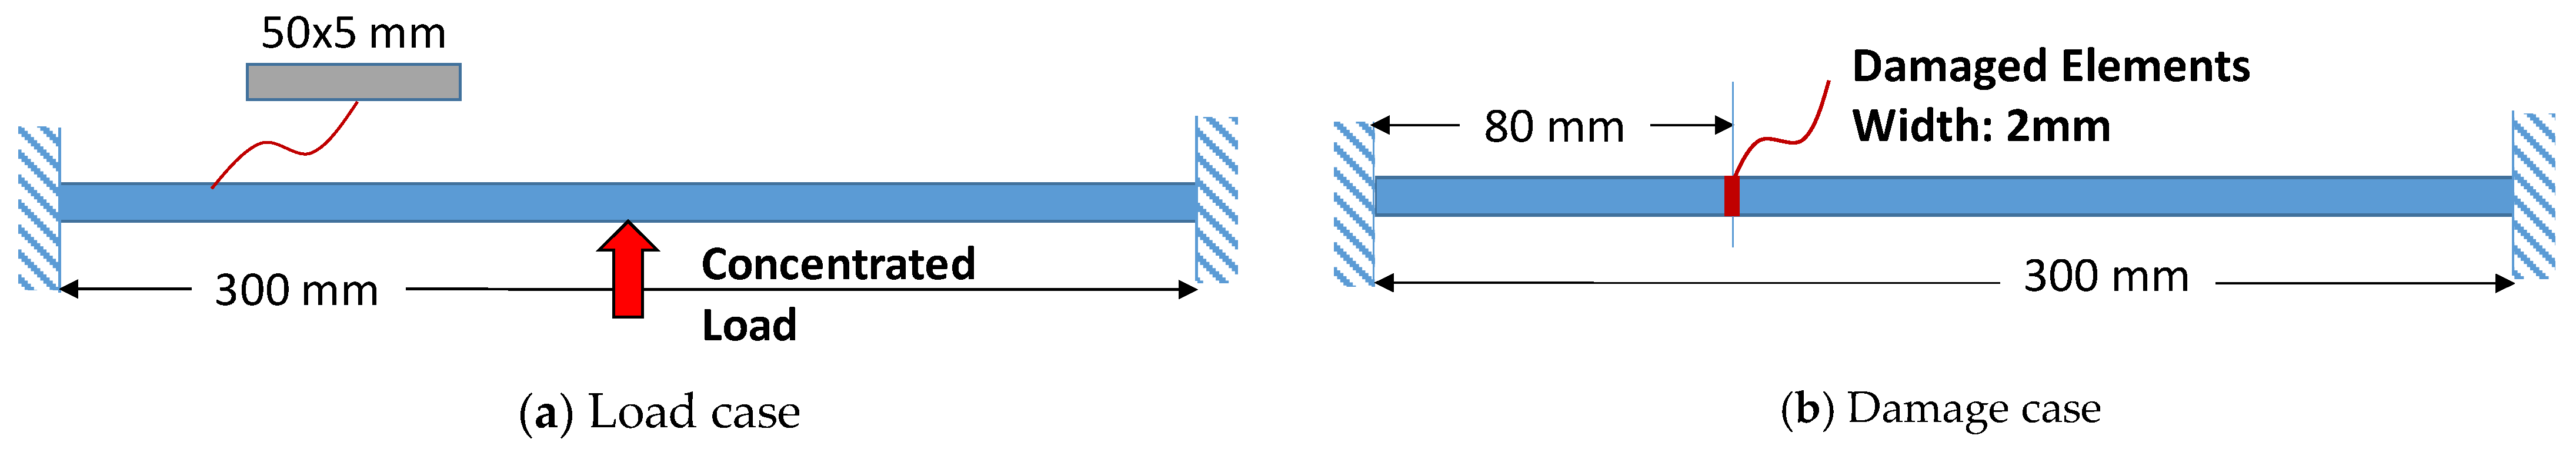
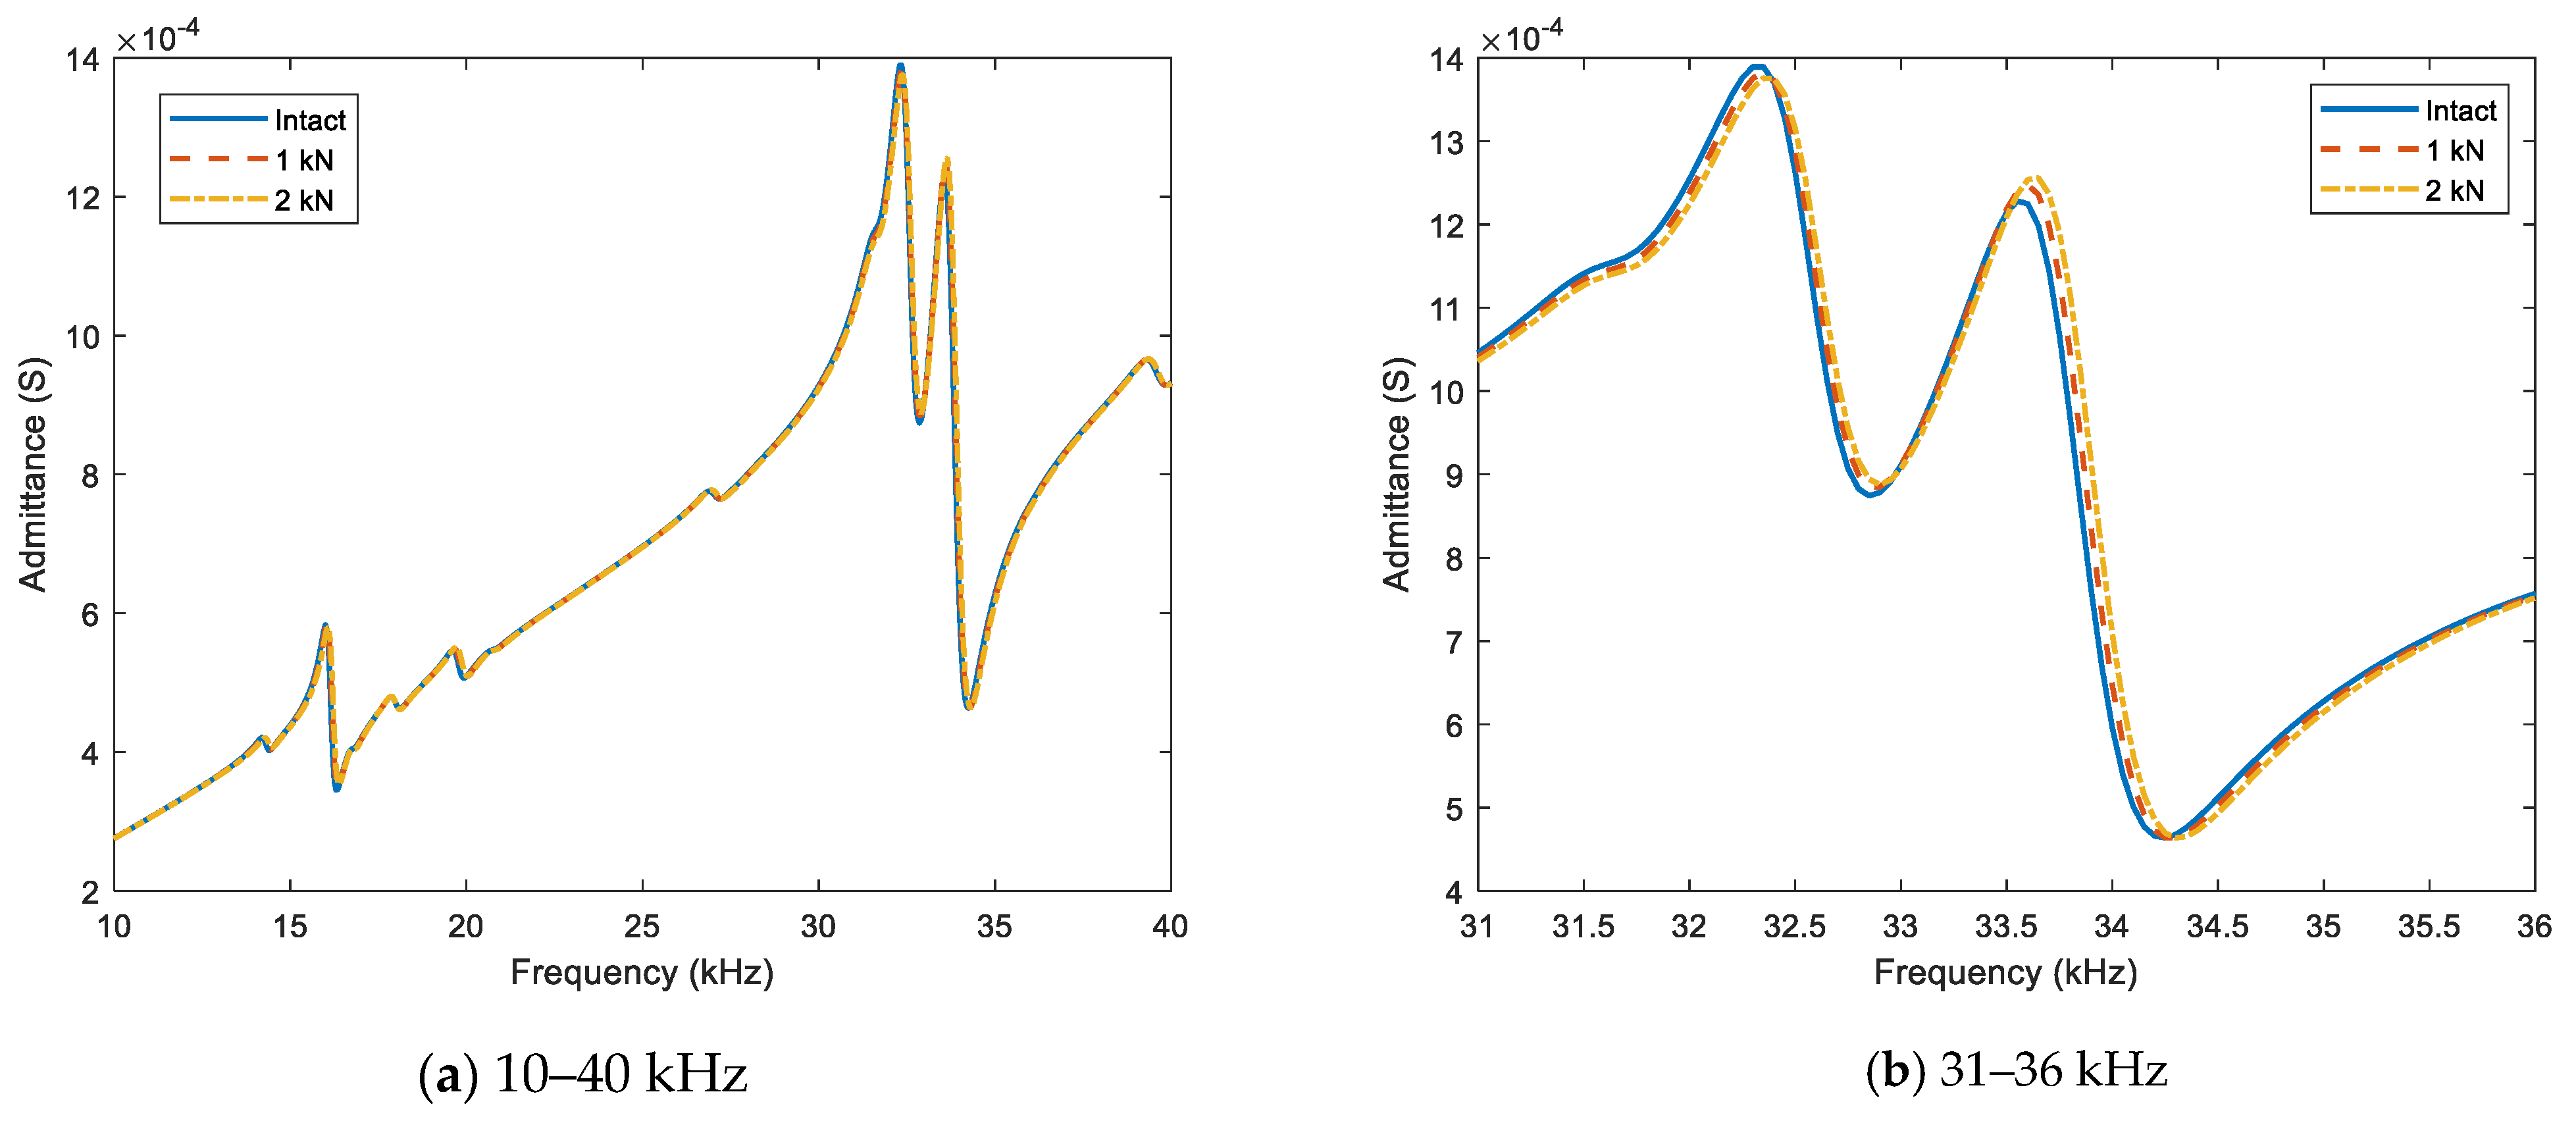
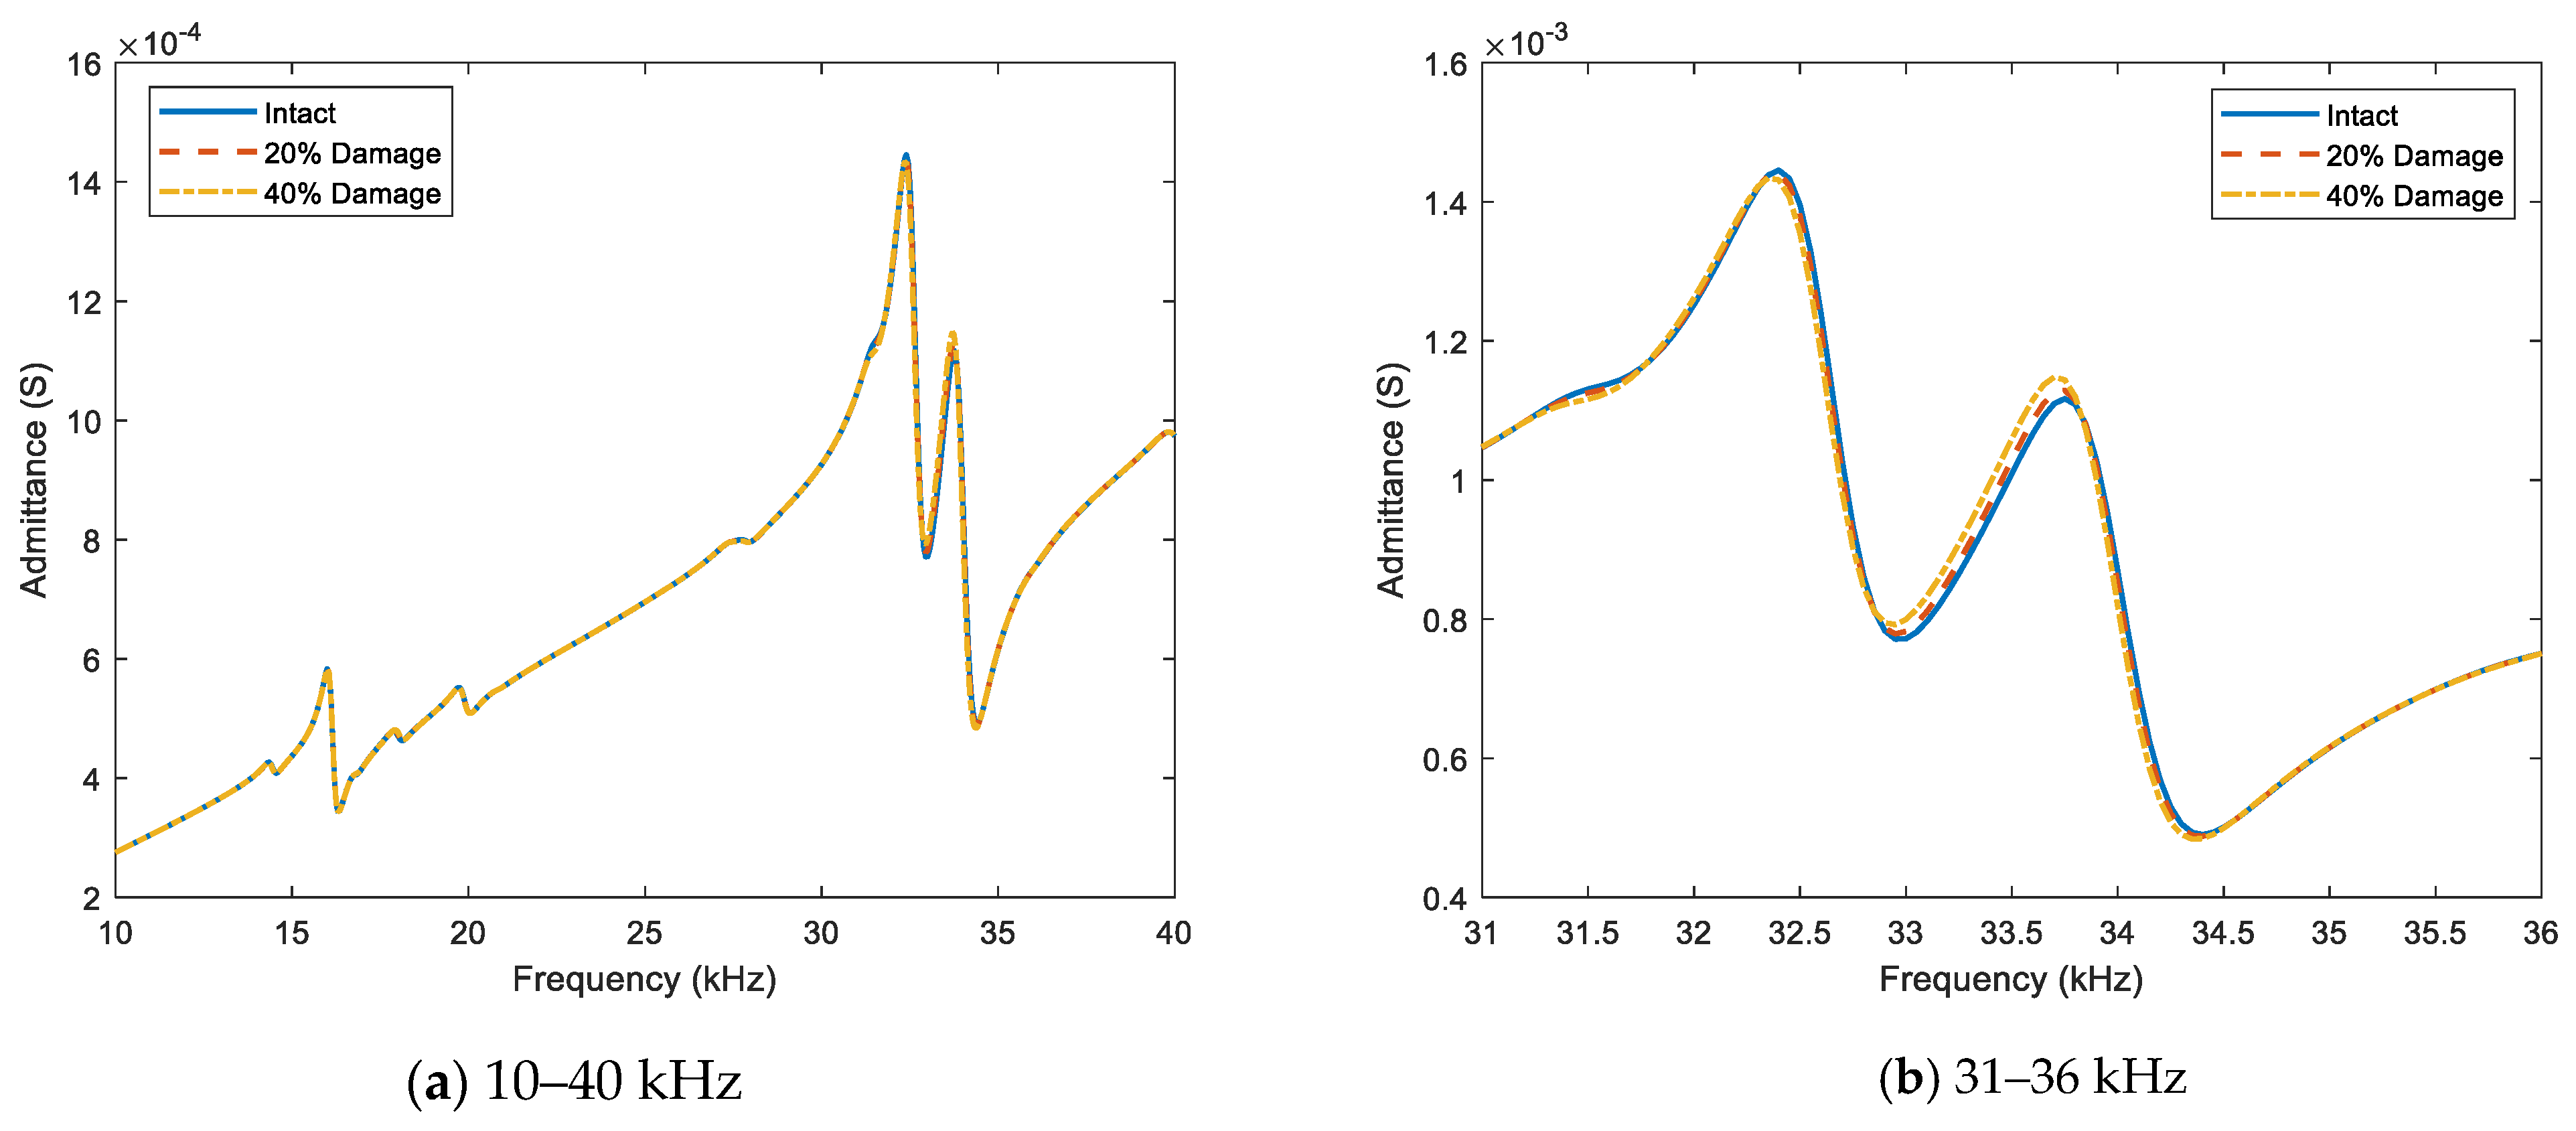
As a commonly used damage metric, root-mean-square deviation (RMSD) was selected to quantify the admittance change and to detect structural damage in a prestressed anchorage. According to the references [7,40], the RMSD metric can be obtained by the following expression:
R M S D = i = 1 N [ Z * ( ω i ) Z ( ω i ) ] 2 / i = 1 N [ Z ( ω i ) ] 2
where Z ( ω i ) represents the admittance signature at the healthy state for the ith frequency, Z * ( ω i ) stands for the admittance signature at the unknown state, and n indicates the number of scanned frequencies. Z ¯ and Z ¯ * represent, respectively, the means of the admittance signatures, and σ Z and σ Z * are the standard deviations.
The RMSD value equal to 0 implies no damage, whereas a value greater than 0 indicates damage. Nonetheless, uncertainties in experimentation and the environment may produce a non-zero damage metric even though there is no damage. To account for such uncertain conditions, control chart analysis is often used for damage classification [41]. In the control chart analysis, it is essential to determine the threshold for signaling an alarm. In this study, the alarming threshold is determined through the upper control limit (UCL) equation, as follows:
U C L = μ + 3 σ
in which μ stands for the mean of the damage metric dataset at the reference condition, and σ presents the corresponding standard deviation. This threshold is often referred to as the “three-sigma rule”, which suggests that nearly all values within a normal distribution fall within three standard deviations of the mean. The UCL is defined as three standard deviations from the mean, which represents a confidence level of 99.7%.
The UCL calculation process is described in three stages: (1) n admittance signals are recorded at the reference condition; (2) the RMSD damage metric for n admittance signals are calculated, and a set of damage indices is obtained; and (3) the UCL is computed using Equation (5). When the magnitude of the RMSD metric surpasses the control limit UCL, an alarm is triggered, indicating that damage has occurred. Conversely, if the magnitude of the damage indices does not exceed the control limit UCL, there is no damage.

3. Numerical Study

3.1. Finite Element Model

We conducted numerical simulations to examine the feasibility of using the admittance response of the piezoelectric interface for identifying load changes and cracks. To simplify the model, we selected a fixed–fixed beam as the host structure, as illustrated in Figure 2. The beam had a uniform cross-section of 50 × 5 mm and a length of 300 mm. To simulate the effect of loading on the admittance response, we placed a concentrated load at the midpoint of the beam, as shown in Figure 2a. We sequentially investigated three levels of the concentrated load P = 0 (i.e., the intact case), 1 kN, and 2 kN. In the next simulation, we introduced a crack into the beam at a distance of 80 mm from the left end, as shown in Figure 2b. The crack had a width of 2 mm and was simulated by reducing the Young’s modulus of the damaged elements. We simulated three crack cases, including the intact case, 20% stiffness loss, and 40% stiffness loss.
To accurately simulate the piezoelectric effects of the PZT-anchorage subsystem, it was essential to consider both the electrical and mechanical physics that occurred simultaneously during the excitation of the PZT transducer. We used the COMSOL Multiphysics software to model the admittance response of the PZT interface–host beam system. The software has shown its robust modelling capabilities for simulating the piezoelectric effects, as demonstrated in the previous studies [15,42,43]. The modeling method of the admittance response in this study precisely followed the validated procedure presented in previous studies [44,45,46]. Figure 3a displays a finite element model of the beam instrumented by a PZT interface at the center, developed in the COMSOL software. The interface device comprises two bonded sections measuring 35 × 33 × 5 mm, a flexible section measuring 30 × 33 × 4 mm, and a mounted PZT transducer measuring 20 × 20 × 0.51 mm at the center. The interface body and the host beam were made of aluminum, having the mechanical properties listed in Table 1 [24]. The PZT transducer was added using the piezoelectric material PZT-5A, with the properties listed in Table 2 [24]. To obtain the admittance responses through simulation, a harmonic voltage excitation with a magnitude of 1 V was applied to the top surface of the PZT transducer, while the bottom surface was connected to the ground electrode.
Figure 3b displays a mesh of the finite element model, utilizing hexahedral solid elements with eight nodes. The PZT transducer was meshed with a finer mesh to ensure an accurate simulation of the stress wave. In the COMSOL software, two modules, namely Solid Mechanics and Piezoelectric Devices, were coupled to simulate the admittance response of the piezoelectric interface. The x-directional displacement of the structure under loading is shown in Figure 3c. It is shown that the PZT interface deforms along with the deformation of the beam. Notably, the magnitude of the stress field is significant near the two ends of the PZT interface. Figure 3d displays the piezoelectric deformation of the structure when the PZT patch is excited. The interface was strongly coupled with the beam during the piezoelectric excitation.

3.2. Numerical Admittance Response

The numerical analysis of the admittance response of the piezoelectric interface was conducted within a frequency band of 10–40 kHz. Figure 4 illustrates the response under increasing loading (P = 0–2 kN with 1 kN increments). As shown in Figure 4a, several resonant peaks were observed within the examined frequency range, indicating strong coupling responses between the piezoelectric device and the host beam. Figure 4b illustrates a narrow frequency band of 31–36 kHz with resonant peaks. The admittance signature shifted to the right due to an increased applied load, implying an enhancement of the host beam’s modal stiffness. Figure 5a presents the admittance response in the 10–40 kHz range under different damage severities of the crack. The narrow frequency band of 31–36 kHz with resonant peaks is depicted in Figure 5b. It is observed that the admittance signature shifted to the left due to a decrease in the Young’s modulus of the damaged elements, suggesting a reduction in the modal stiffness of the system.
The RMSD metric was computed for both loading and damage cases. The entire frequency range of 10–40 kHz was used to calculate the metric, and the results are displayed in Figure 6a and Figure 6b, respectively. It is shown that the RMSD metric was almost zero for the intact case but significant for the damage and the applied load cases. The metric increased with the severity of the damage or the applied load. It is shown that the stress change and the presence of a crack in the host beam can be detected based on the evolution of the RMSD metric.

4. Experimental Study

4.1. Experimental Setup
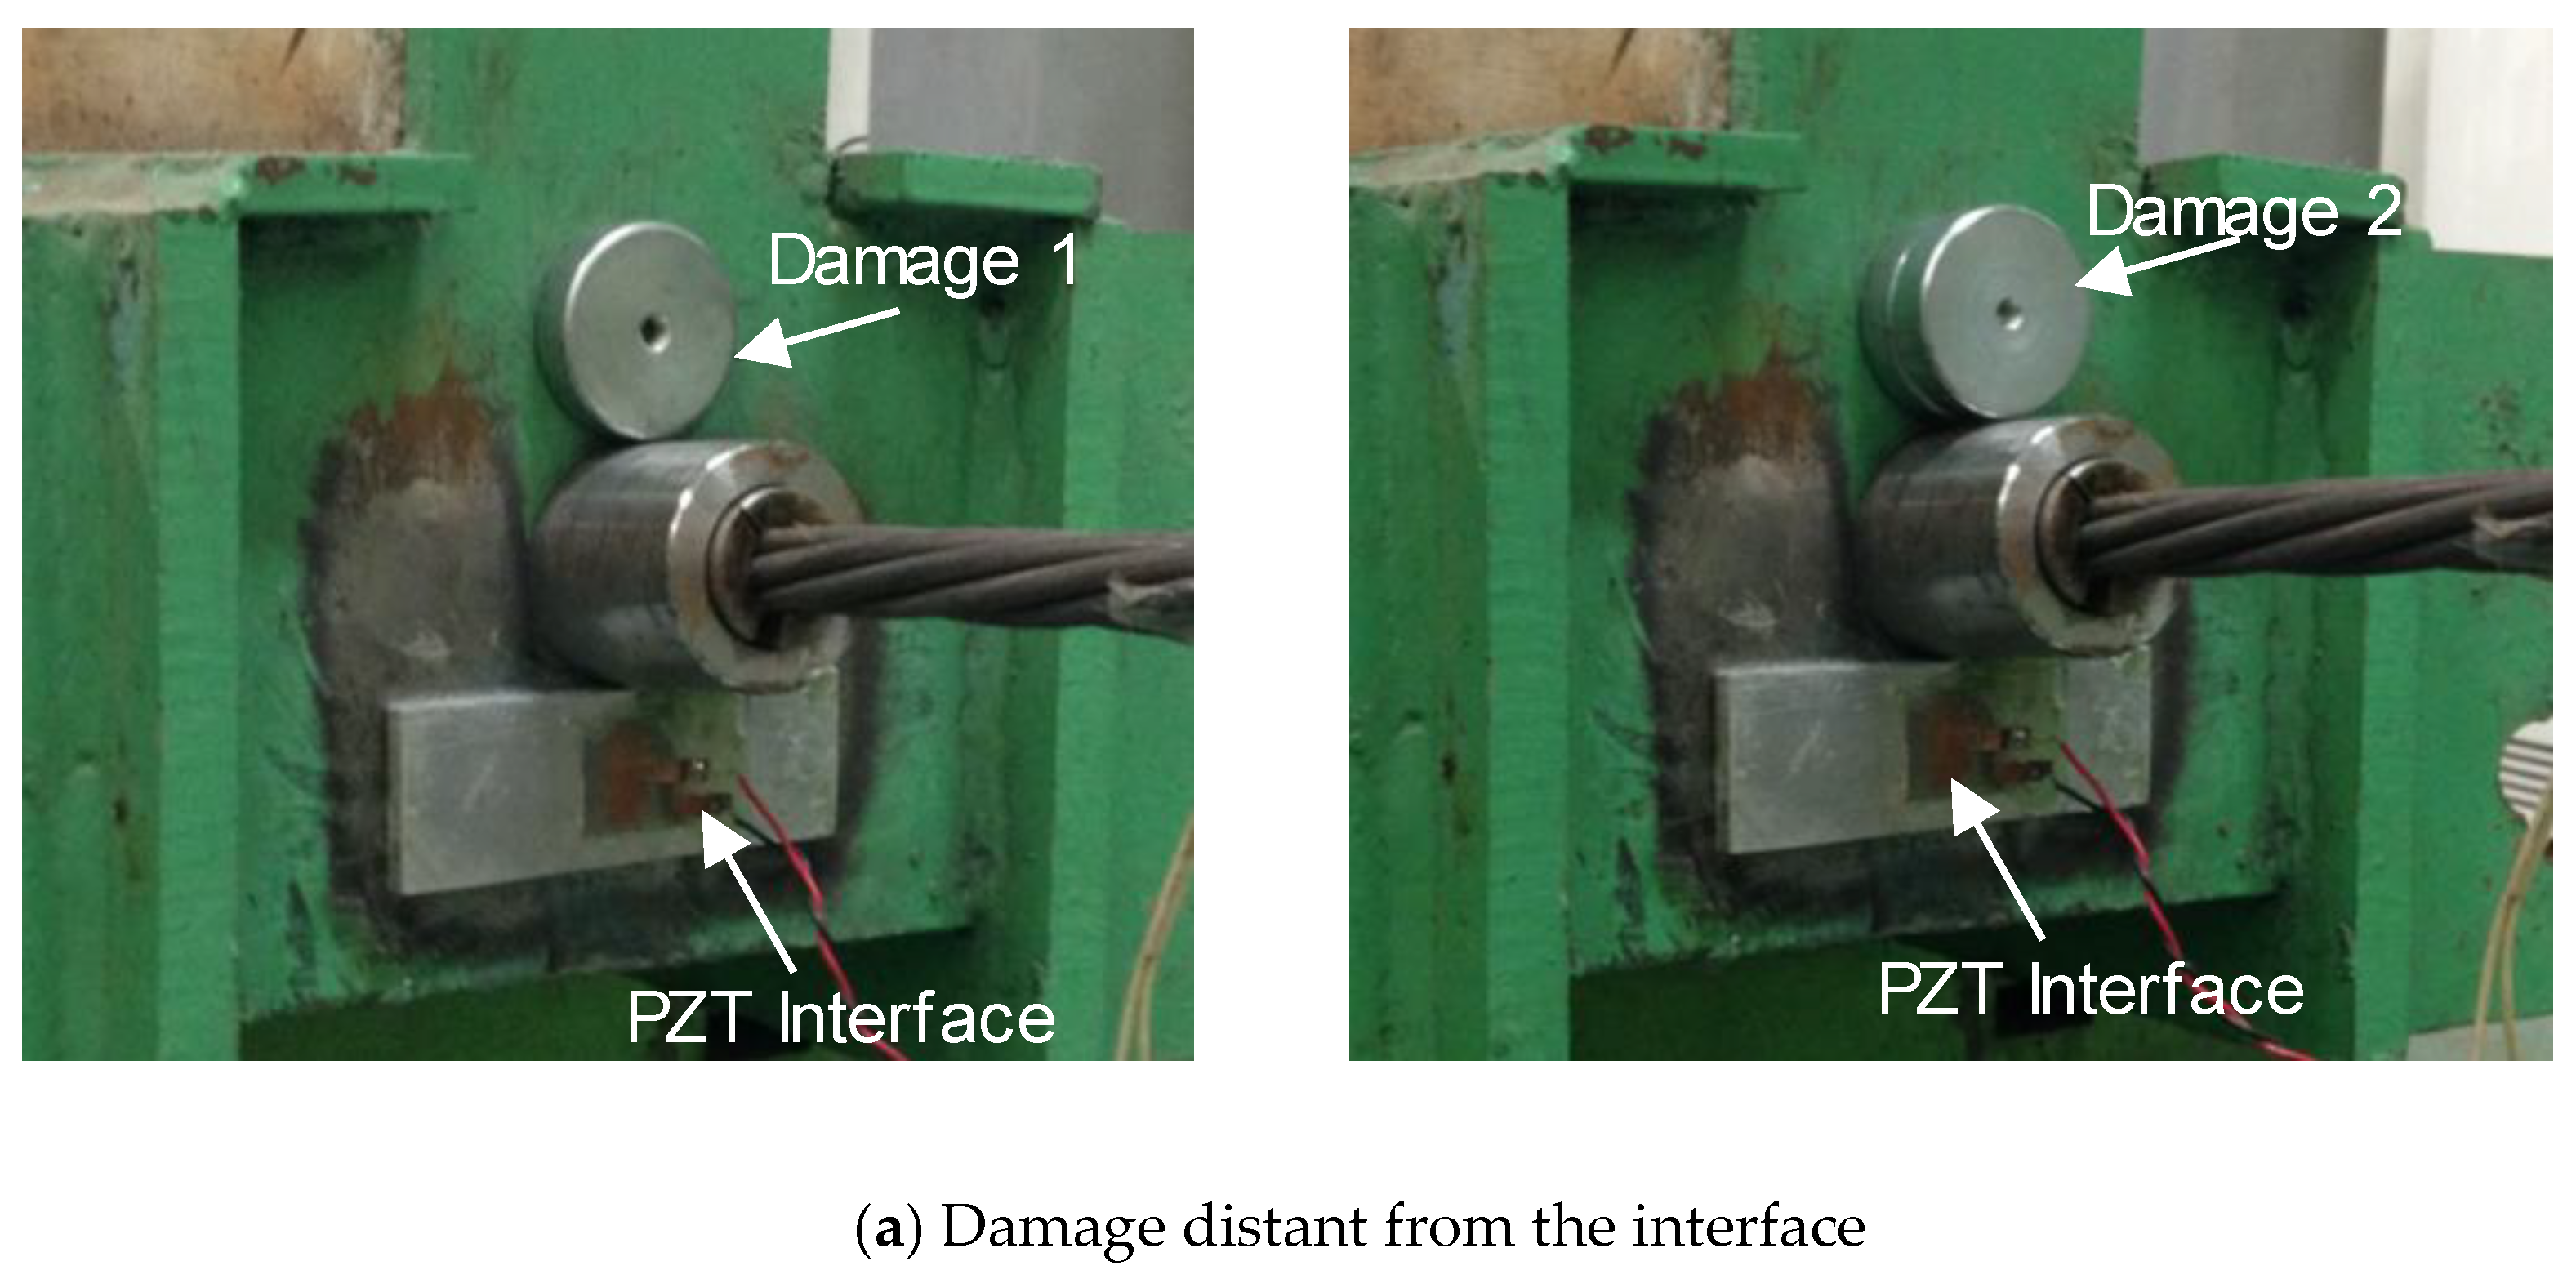
4.1.1. Test Setup

The purpose of this experiment was to test the effectiveness of the admittance-based crack detection method in a lab-scale anchorage system. The test structure, shown in Figure 7a, was an anchorage of a prestressed reinforced concrete beam, being 6.4 m long with a T-shaped cross-section. As designed in the previous study [27], the beam had a compressive strength of 23.6 MPa and a mass density of about 2400 kg/m3. The beam was prestressed using a 7-wire steel strand with a nominal diameter of 15.2 mm and a tensile strength of 260 kN. A prestress load of 14 tons was introduced into the beam using a double acting cylinder hydraulic jack (model: DRW-50150, capacity 50 ton, manufactured by Shinjin Hydrotec) and a pump (model: DP-A, capacity 700 kg/cm2). More information about the geometrical parameters and structural properties of the tested beam can be found in [27].
A PZT interface was fabricated by a CNC (computer numerical controlled) milling machine with a tolerance ± 0.04 mm. The geometrical and piezoelectric properties of the fabricated device were the same as those simulated in Section 3. The device was located just below the anchor head, as shown in Figure 7a. The PZT transducer was connected to a commercial impedance analyzer, HIOKI 3532, which applied a harmonic voltage of 1V amplitude to the transducer. The admittance response was then recorded by the analyzer and, finally, visualized on a computer, as illustrated in Figure 7a.
The admittance response was recorded before and after structural damage using a swept frequency range of 10-40 kHz (501 swept points), identified from the numerical simulation in Section 3. The HIOKI-3532 analyzer was set to repeatedly measure the admittance response of the transducer five times per run, with a sampling rate of 200 Hz and a measurement time of 5ms. The laboratory temperature was closely monitored and maintained at a stable level throughout the experiment to eliminate any potential influence of temperature on the measured admittance response of the piezoelectric device.

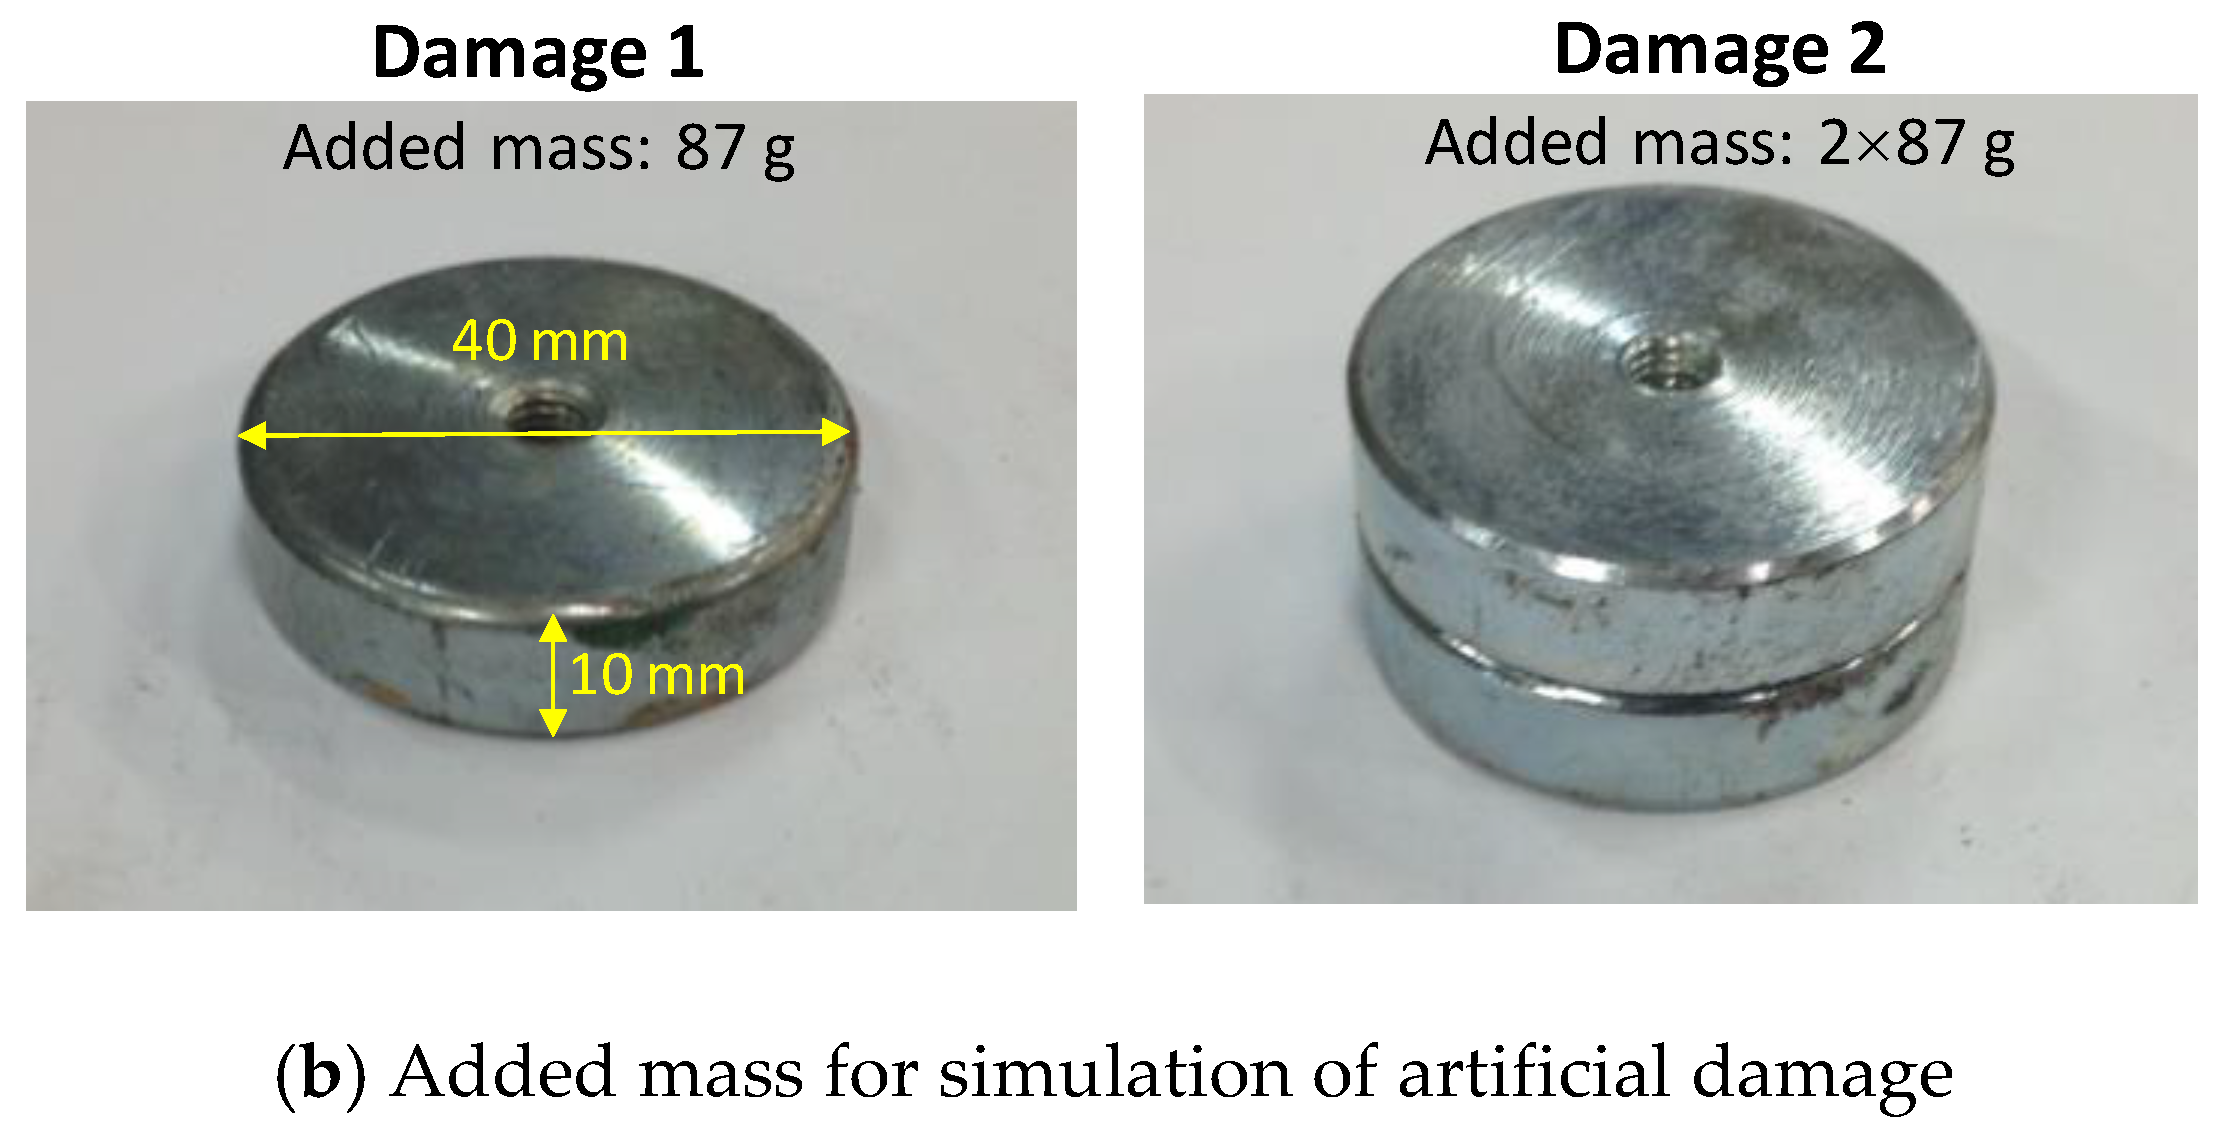
4.1.2. Test Scenarios

A damage simulation technique using adding masses was adopted to simulate the structural damage in the anchorage. This technique can physically model the stiffness loss in the anchorage resulting from crack or corrosion damage without damaging the test structure [25,47,48]. Figure 7b shows the added masses used in this experiment. A single mass block has a cylindrical shape with a height of 10mm and a diameter of 40 mm. Damage 1 used a single mass block with a weight of 87 g, while Damage 2 used two mass blocks with a total weight of 174 g. The masses were magnetically attached to the bearing plate’s surface of the tested anchorage, as shown in Figure 8.
Two testing scenarios were simulated. In the first scenario, the masses were placed right above the anchor head to simulate Damage 1 and Damage 2, as shown in Figure 8a. It was noted that the interface was placed below the anchor head. The center-to-center distance between the transducer and the damage was 102 mm. This test aimed to examine the detectability of the PZT interface for distant damage when the wave propagation was scattered by the anchor head. In the second scenario, the masses were placed at the right side of the anchor head, close to the bonded section of the piezoelectric interface. Damage 1 and Damage 2 were simulated, as shown in Figure 8b. The center-to-center horizontal and vertical distances between the transducer and the damages were 33 mm and 40 mm, respectively. In the second scenario, it was noted that the space between the transducer and the damage had no obstacles.

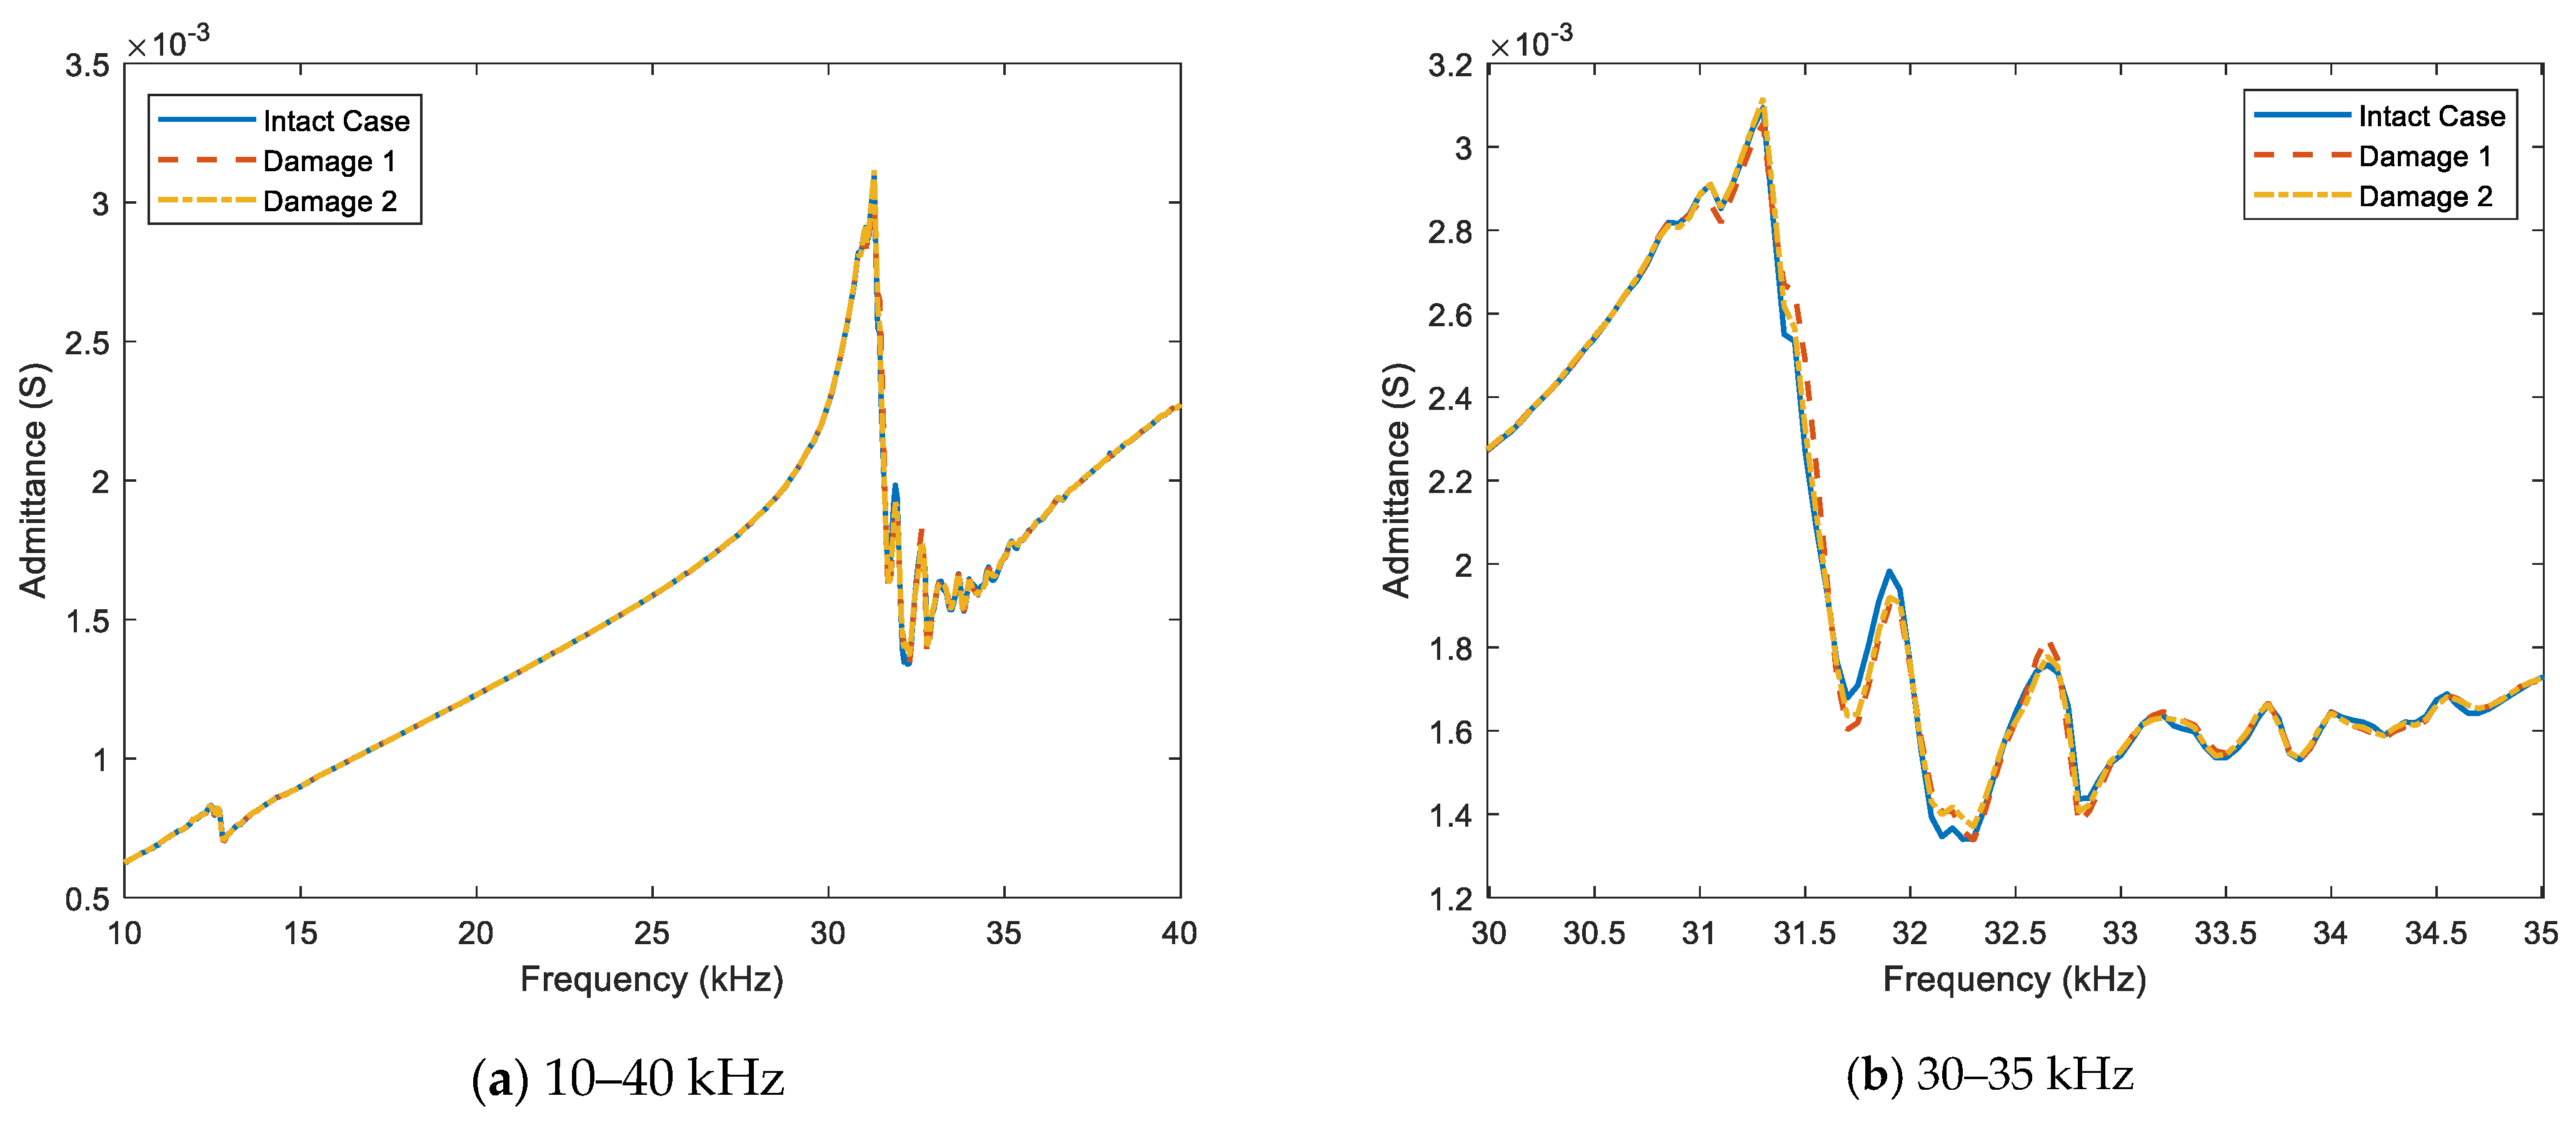
4.2. Experimental Admittance Responses

Figure 9a shows the absolute value of the admittance response of the piezoelectric device under the first testing scenario. The effective frequency band and the curve pattern of the admittance response were quite similar between the simulation and the experiment. As identified in Section 3 through numerical simulations, the effective frequency band of the interface device was found to be 10–40 kHz with strong admittance resonances. In the experimental test, we observed similar strong resonances in the admittance spectrum of 10–40 kHz. Although there were some discrepancies in the admittance magnitude, the admittance response in the 30–35 kHz range in Figure 9b was well consistent with the simulated response in Figure 5b. The admittance response was slightly changed due to the damage. This was expected, since the damage was distant from the transducer, causing the elastic wave generated by the transducer to be heavily scattered by the anchor block.
Figure 10a displays the absolute value of the admittance response of the PZT interface under the second testing scenario. As shown in Figure 10b, the admittance response in the frequency band of 30–35 kHz shifted to the left due to the damage, resulting from the reduction in modal stiffness. This experimental observation was consistent with the numerical simulation results. As compared to the result in Figure 9b, the admittance response in Figure 10b exhibited considerable changes due to the damage. This was expected, as the damage in the second test scenario was closer to the PZT interface, and there was no obstacle between the damage and the transducer, enabling the generated elastic wave to easily propagate to the damage’s position with less attenuation and greater sensitivity. The admittance shift was found to increase with damage severity. These experimental results confirmed the reliability of the numerical simulation results in Section 3, and the use of the PZT interface technique ensured the consistency of the measured admittance responses, regardless of the target structure.

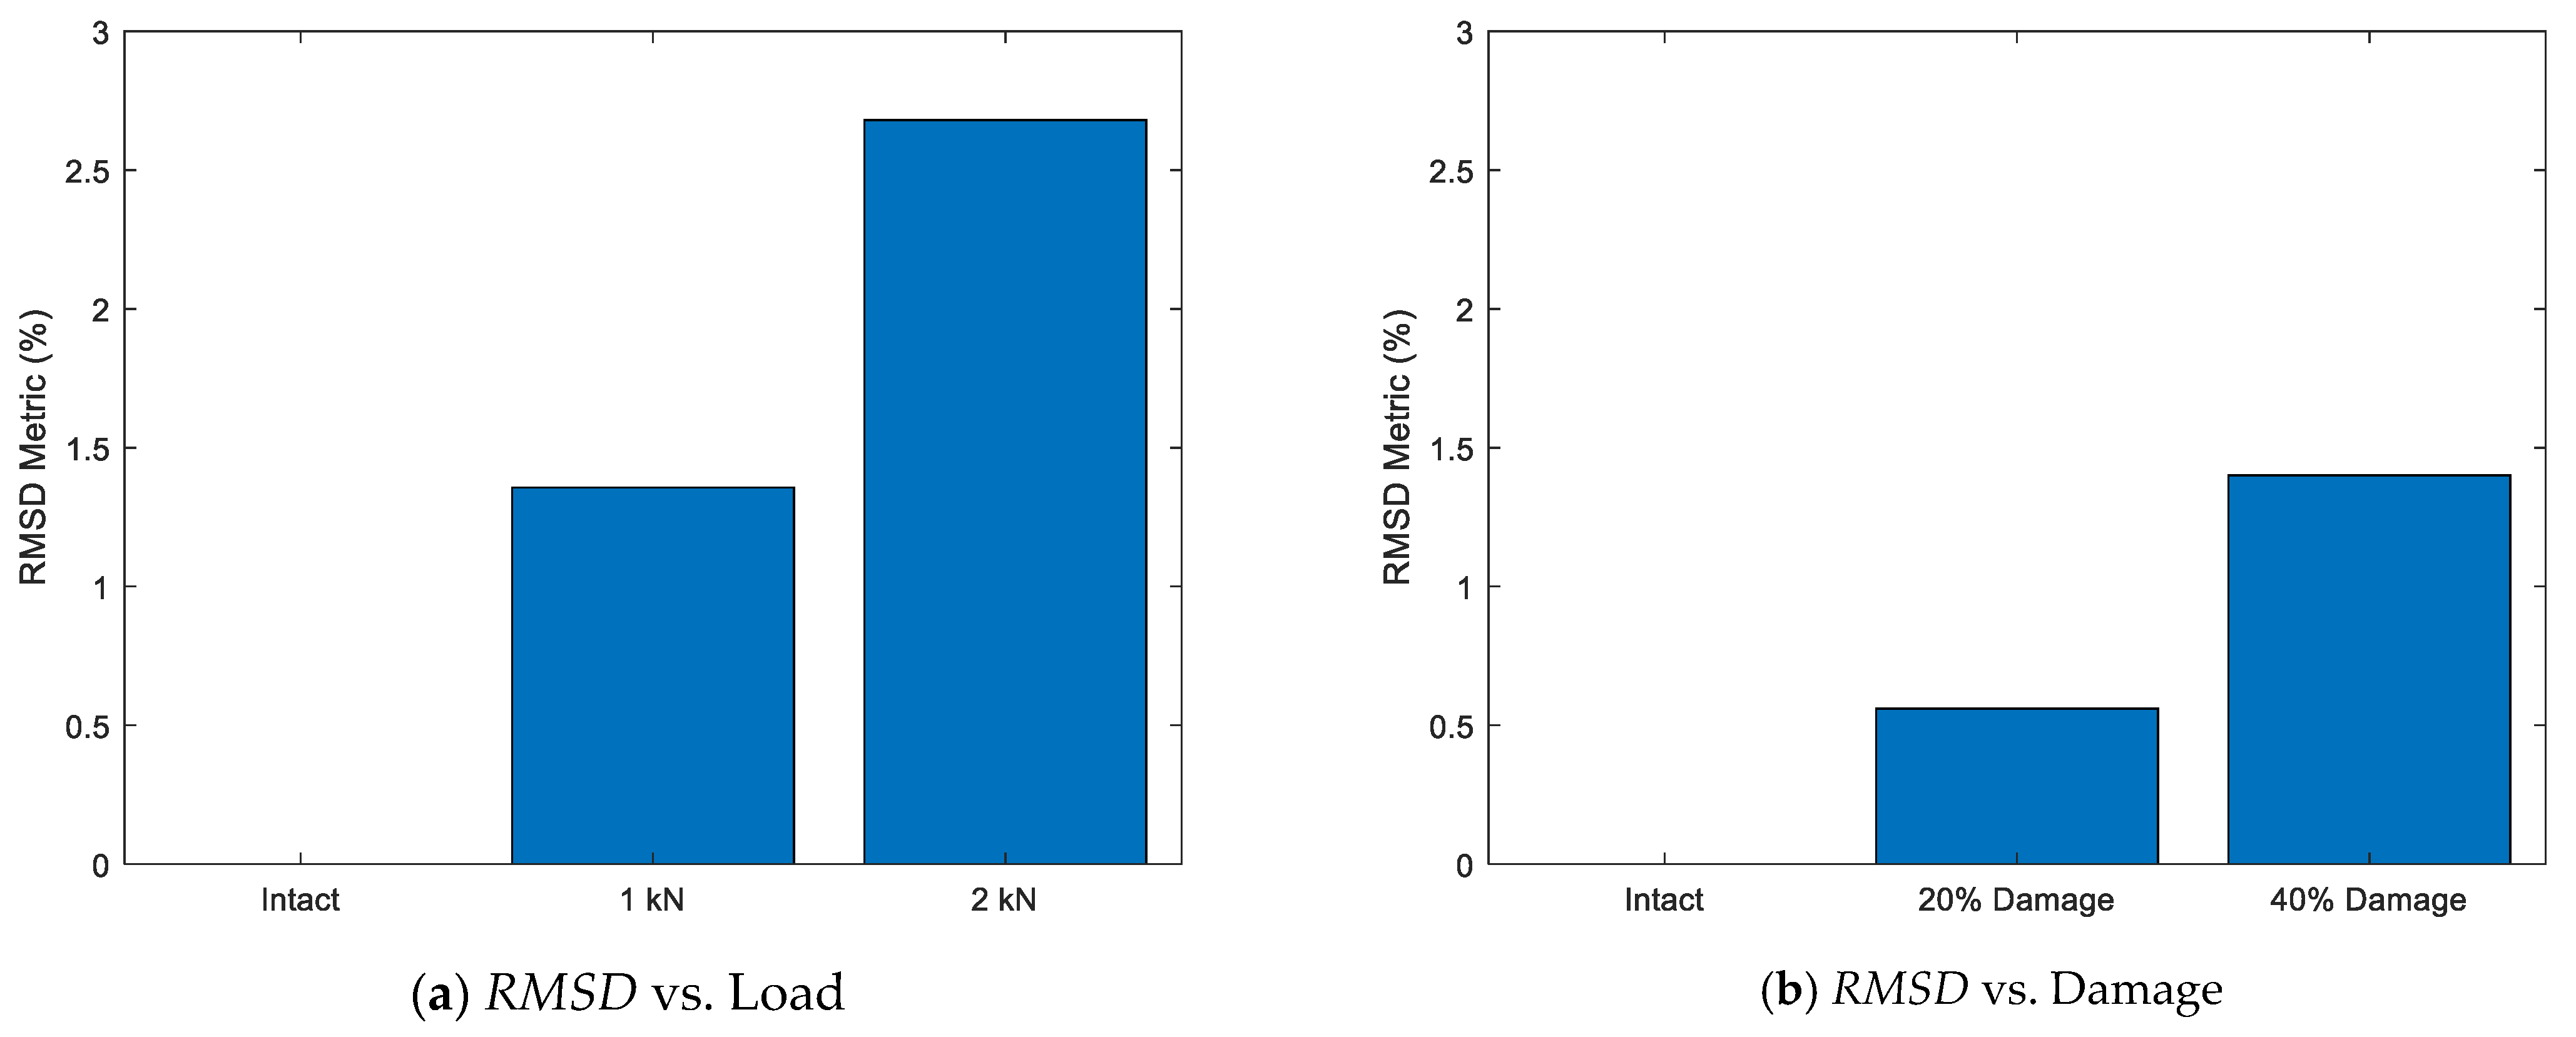
4.3. Damage Detection Using Admittance Response

To detect structural damage in the anchorage, we computed the RMSD metric and UCL threshold. We assessed three frequency bands: 10–40 kHz (whole examined band), 10–15 kHz (the first resonant zone), and 30–35 kHz (the second resonant zone). The results of the first testing scenario are presented in Figure 11a–c. The intact case showed negligible RMSD values that were below the UCL thresholds, while the damage cases showed significant RMSD values above the thresholds, indicating the successful detection of damage. Under Damage 1, both 10–40 kHz and 30–35 kHz displayed a substantial increase in the RMSD metric, while Damage 2 caused a sharp decrease in the metric. The 10–15 kHz band had a lower RMSD magnitude but exhibited a linear change in the RMSD with damage severity.
The results for the second testing scenario for the same three frequency ranges are shown in Figure 12a–c. Similar to the first scenario, the intact case showed negligible RMSD values, while the damage cases showed significant values above the UCL thresholds, indicating successful damage detection. In contrast to the distant damage case in the first scenario, both 10–40 kHz and 30–35 kHz showed linear changes in the RMSD metric for the second scenario. The RMSD of the 10–15 kHz band showed an increase under Damage 1 but a slight reduction under Damage 2.
To identify the optimal frequency range for damage assessment in the bearing plate of the anchorage, we investigated six frequency bands, including Range 1 (10–15 kHz), Range 2 (15–20 kHz), Range 3 (20–25 kHz), Range 4 (25–30 kHz), Range 5 (30–35 kHz), and Range 6 (35–40 kHz). The RMSD metric corresponding to each frequency sub-band is plotted in Figure 13. Each frequency band exhibited different sensitivities to structural damage, with all except Range 1 (10-15 kHz) displaying linear changes in the RMSD metric with damage severity. Based on the magnitude of the RMSD metric, we concluded that the 30–35 kHz frequency band was optimal for the damage assessment of the bearing plate.

5. Summary and Conclusions

This study aimed to evaluate the feasibility of the admittance-based method for detecting simulated damage in the bearing plate of a prestressed anchorage. To secure the repeatability of the admittance response acquired from the anchorage, we utilized the PZT interface technique. We assessed both the numerical and experimental feasibility of the method. In the numerical simulation, we successfully detected fatigue cracks and preload changes in a beam-like structure using the method. In the experimental evaluation, we assessed added mass to simulate crack/corrosion-type damage in the bearing plate of a lab-scale prestressed anchorage model. We tested two scenarios, one with damage close to the interface and one with damage distant from the interface. The admittance response was measured before and after the damage, and the RMSD metric was used to quantify the change in the admittance spectrum. Finally, we compared the damage metric of different frequency bands to determine an optimal band for simulated damage assessment in the tested anchorage.
From the numerical simulation and the experimental evaluation in this study, the following concluding remarks can be drawn, as follows: (i) The study demonstrated that strong resonances were observed in both numerical and experimental admittance signatures in the effective frequency band 10–40 kHz, with identical curve patterns. (ii) The admittance response shifted to the right when the structure gained stiffness and to the left as the structure was damaged (i.e., stiffness loss), as shown by the numerical results. (iii) The experimental results indicated that the admittance response shifted to the left due to the simulated damage, with higher sensitivity to the damage close to the interface device. (iv) The RMSD of the band 30–35 kHz showed a linear change with the damage severity and was the most sensitive to damage, thereby making it the optimal band for assessing damage in the bearing plate of a prestressed anchorage.
Based on these findings, the proposed admittance-based method, coupled with a resonance-enhanced piezoelectric device, appears to be a promising method for detecting simulated damage in the bearing plate of a prestressed anchorage. This preliminary study lays a foundation for further applications of the admittance-based technique for SHM of prestressed anchorages. In future studies, the admittance-based method will be evaluated for damage detection in real-world prestressed anchorage structures under more complex conditions. Additionally, there is a need to conduct long-term monitoring to track the progression of damage. Moreover, the effectiveness of the admittance-based method in detecting more realistic types of damage, such as corrosion and cracks, will also be examined.

Author Contributions

Conceptualization, T.-C.H. and D.-D.H.; methodology, T.-C.H., D.-D.H. and C.-T.N.; validation, T.-C.H., D.-D.H., C.-T.N. and T.-T.N.; formal analysis, T.-C.H., T.-H.N., T.-D.-N.T., B.-T.L. and T.-T.N.; writing—original draft preparation, T.-C.H., D.-D.H., C.-T.N. and T.-T.N.; writing—review and editing, T.-C.H., T.-T.N. and D.-D.H. All authors have read and agreed to the published version of the manuscript.

Funding

This research received no external funding.

Data Availability Statement

The data are available upon request.

Acknowledgments

We acknowledge Ho Chi Minh City University of Technology (HCMUT), VNU-HCM for supporting this study.

Conflicts of Interest

The authors declare no conflict of interest.

References

  1. Brownjohn, J.M.W. Structural health monitoring of civil infrastructure. Philos. Trans. R. Soc. A Math. Phys. Eng. Sci. 2007, 365, 589–622. [Google Scholar] [CrossRef] [PubMed]
  2. Yuan, F.-G.; Zargar, S.A.; Chen, Q.; Wang, S. Machine learning for structural health monitoring: Challenges and opportunities. SPIE Smart Struct. Nondestruct. Eval. 2020, 11379, 1137903. [Google Scholar] [CrossRef]
  3. Nellen, P.M.; Broennimann, R.; Frank, A.; Mauron, P.; Sennhauser, U.J. Structurally embedded fiber Bragg gratings: Civil engineering applications. Fiber Opt. Sens. Technol. Appl. 1999, 3860, 44–54. [Google Scholar] [CrossRef]
  4. Mitra, M.; Gopalakrishnan, S. Guided wave based structural health monitoring: A review. Smart Mater. Struct. 2016, 25, 53001. [Google Scholar] [CrossRef]
  5. Remennikov, A.M.; Kaewunruen, S. Determination of Prestressing Force in Railway Concrete Sleepers Using Dynamic Relaxation Technique. J. Perform. Constr. Facil. 2015, 29, 4014134. [Google Scholar] [CrossRef]
  6. Park, S.; Yun, C.; Inman, D.J. Structural health monitoring using electro-mechanical impedance sensors. Fatigue Fract. Eng. Mater. Struct. 2008, 31, 714–724. [Google Scholar] [CrossRef]
  7. Na, W.S.; Baek, J. A Review of the Piezoelectric Electromechanical Impedance Based Structural Health Monitoring Technique for Engineering Structures. Sensors 2018, 18, 1307. [Google Scholar] [CrossRef]
  8. Le, T.-C.; Luu, T.-H.; Nguyen, H.-P.; Nguyen, T.-H.; Ho, D.-D.; Huynh, T.-C. Piezoelectric Impedance-Based Structural Health Monitoring of Wind Turbine Structures: Current Status and Future Perspectives. Energies 2022, 15, 5459. [Google Scholar] [CrossRef]
  9. Park, S.; Shin, H.-H.; Yun, C.-B. Wireless impedance sensor nodes for functions of structural damage identification and sensor self-diagnosis. Smart Mater. Struct. 2009, 18, 55001. [Google Scholar] [CrossRef]
  10. Overly, T.G.S.; Park, G.; Farinholt, K.M.; Farrar, C.R. Development of an extremely compact impedance-based wireless sensing device. Smart Mater. Struct. 2008, 17, 65011. [Google Scholar] [CrossRef]
  11. Perera, R.; Pérez, A.; García-Diéguez, M.; Zapico-Valle, J.L. Active Wireless System for Structural Health Monitoring Applications. Sensors 2017, 17, 2880. [Google Scholar] [CrossRef] [PubMed]
  12. Pham, Q.-Q.; Ta, Q.-B.; Park, J.-H.; Kim, J.-T. Raspberry Pi Platform Wireless Sensor Node for Low-Frequency Impedance Responses of PZT Interface. Sensors 2022, 22, 9592. [Google Scholar] [CrossRef] [PubMed]
  13. Tseng, K.K.; Wang, L. Smart piezoelectric transducers for in situ health monitoring of concrete. Smart Mater. Struct. 2004, 13, 1017. [Google Scholar] [CrossRef]
  14. Park, S.; Yun, C.-B.; Roh, Y.; Lee, J.-J. Health monitoring of steel structures using impedance of thickness modes at PZT patches. Smart Struct. Syst. 2005, 1, 339–353. [Google Scholar] [CrossRef]
  15. Dang, N.-L.; Huynh, T.-C.; Kim, J.-T. Local Strand-Breakage Detection in Multi-Strand Anchorage System Using an Impedance-Based Stress Monitoring Method—Feasibility Study. Sensors 2019, 19, 1054. [Google Scholar] [CrossRef]
  16. Giurgiutiu, V.; Zagrai, A.; Bao, J.J. Piezoelectric Wafer Embedded Active Sensors for Aging Aircraft Structural Health Monitoring. Struct. Health Monit. 2002, 1, 41–61. [Google Scholar] [CrossRef]
  17. Kim, C.-H.; Choi, J.-H.; Kweon, J.-H. Defect detection in adhesive joints using the impedance method. Compos. Struct. 2015, 120, 183–188. [Google Scholar] [CrossRef]
  18. Giurgiutiu, V.; Zagrai, A. Damage Detection in Thin Plates and Aerospace Structures with the Electro-Mechanical Impedance Method. Struct. Health Monit. 2005, 4, 99–118. [Google Scholar] [CrossRef]
  19. Karayannis, C.G.; Voutetaki, M.E.; Chalioris, C.E.; Providakis, C.P.; Angeli, G.M. Detection of flexural damage stages for RC beams using Piezoelectric sensors (PZT). Smart Struct. Syst. 2015, 15, 997–1018. [Google Scholar] [CrossRef]
  20. Kim, J.-T.; Park, J.-H.; Hong, D.-S.; Cho, H.-M.; Na, W.-B.; Yi, J.-H. Vibration and impedance monitoring for prestress-loss prediction in PSC girder bridges. Smart Struct. Syst. 2009, 5, 81–94. [Google Scholar] [CrossRef]
  21. Min, J.; Yun, C.-B.; Hong, J.-W. An electromechanical impedance-based method for tensile force estimation and damage diagnosis of post-tensioning systems. Smart Struct. Syst. 2016, 17, 107–122. [Google Scholar] [CrossRef]
  22. Dang, N.; Huynh, T.; Pham, Q.; Lee, S.; Kim, J. Damage-sensitive impedance sensor placement on multi-strand anchorage based on local stress variation analysis. Struct. Control Health Monit. 2020, 27. [Google Scholar] [CrossRef]
  23. Nguyen, K.-D.; Kim, J.-T.; Park, Y.-H. Multiscale Structural Health Monitoring of Cable-Anchorage System Using Piezoelectric PZT Sensors. Int. J. Distrib. Sens. Netw. 2013, 9, e2547. [Google Scholar] [CrossRef]
  24. Huynh, T.-C.; Lee, K.-S.; Kim, J.-T. Local dynamic characteristics of PZT impedance interface on tendon anchorage under prestress force variation. Smart Struct. Syst. 2015, 15, 375–393. [Google Scholar] [CrossRef]
  25. Kim, J.-T.; Park, J.-H.; Hong, D.-S.; Park, W.-S. Hybrid health monitoring of prestressed concrete girder bridges by sequential vibration-impedance approaches. Eng. Struct. 2010, 32, 115–128. [Google Scholar] [CrossRef]
  26. Huynh, T.-C.; Kim, J.-T. Impedance-Based Cable Force Monitoring in Tendon-Anchorage Using Portable PZT-Interface Technique. Math. Probl. Eng. 2014, 2014, 784731. [Google Scholar] [CrossRef]
  27. Nguyen, T.-T.; Phan, T.T.V.; Ho, D.-D.; Pradhan, A.M.S.; Huynh, T.-C. Deep learning-based autonomous damage-sensitive feature extraction for impedance-based prestress monitoring. Eng. Struct. 2022, 259, 114172. [Google Scholar] [CrossRef]
  28. Shi, Z.; Sun, Z.; Yang, S.; Zhou, K. Fatigue Performance of Butt-Welded Tensile Plate Cable-Girder Anchorages of Long-Span Cable-Stayed Steel Box Girder Railway Bridges. J. Bridg. Eng. 2021, 26, 4020108. [Google Scholar] [CrossRef]
  29. Wei, X.; Qiang, S. Fatigue performance of anchorage zone for long-span single pylon cable-stayed bridge. J. Southwest Jiaotong Univ. 2011, 46, 940–945. [Google Scholar]
  30. Parvez, A.; Foster, S.J. Fatigue of steel-fibre-reinforced concrete prestressed railway sleepers. Eng. Struct. 2017, 141, 241–250. [Google Scholar] [CrossRef]
  31. Liang, C.; Sun, F.; Rogers, C. Coupled Electro-Mechanical Analysis of Adaptive Material Systems—Determination of the Actuator Power Consumption and System Energy Transfer. J. Intell. Mater. Syst. Struct. 1994, 5, 12–20. [Google Scholar] [CrossRef]
  32. Park, G.; Sohn, H.; Farrar, C.R.; Inman, D.J. Overview of Piezoelectric Impedance-Based Health Monitoring and Path Forward. Shock. Vib. Dig. 2003, 35, 451–463. [Google Scholar] [CrossRef]
  33. Nguyen, K.-D.; Kim, J.-T. Smart PZT-interface for wireless impedance-based prestress-loss monitoring in tendon-anchorage connection. Smart Struct. Syst. 2012, 9, 489–504. [Google Scholar] [CrossRef]
  34. Huynh, T.-C.; Park, Y.-H.; Park, J.-H.; Kim, J.-T. Feasibility Verification of Mountable PZT-Interface for Impedance Monitoring in Tendon-Anchorage. Shock Vib. 2015, 2015, 262975. [Google Scholar] [CrossRef]
  35. Huynh, T.-C.; Kim, J.-T. Quantitative damage identification in tendon anchorage via PZT interface-based impedance monitoring technique. Smart Struct. Syst. 2017, 20, 181–195. [Google Scholar]
  36. Pham, Q.-Q.; Ta, Q.-B.; Kim, J.-T. Capsule-Like Smart Aggregate with Pre-Determined Frequency Range for Impedance-Based Stress Monitoring. Sensors 2023, 23, 434. [Google Scholar] [CrossRef] [PubMed]
  37. Huynh, T.-C.; Dang, N.-L.; Kim, J.-T. Preload Monitoring in Bolted Connection Using Piezoelectric-Based Smart Interface. Sensors 2018, 18, 2766. [Google Scholar] [CrossRef]
  38. Huynh, T.-C.T.; Kim, J.-T. Quantification of temperature effect on impedance monitoring via PZT interface for prestressed tendon anchorage. Smart Mater. Struct. 2017, 26, 125004. [Google Scholar] [CrossRef]
  39. Xu, Y.G.; Liu, G.R. A Modified Electro-Mechanical Impedance Model of Piezoelectric Actuator-Sensors for Debonding Detection of Composite Patches. J. Intell. Mater. Syst. Struct. 2002, 13, 389–396. [Google Scholar] [CrossRef]
  40. Park, G.; Inman, D.J. Structural health monitoring using piezoelectric impedance measurements. Philos. Trans. R. Soc. A Math. Phys. Eng. Sci. 2007, 365, 373–392. [Google Scholar] [CrossRef]
  41. Sohn, H. Effects of environmental and operational variability on structural health monitoring. Philos. Trans. R. Soc. A Math. Phys. Eng. Sci. 2007, 365, 539–560. [Google Scholar] [CrossRef] [PubMed]
  42. Uddin, M.N.; Islam, M.S.; Sampe, J.; Ali, S.H.M.; Bhuyan, M.S. Design and simulation of piezoelectric cantilever beam based on mechanical vibration for energy harvesting application. In Proceedings of the 2016 International Conference on Innovations in Science, Engineering and Technology (ICISET), Dhaka, Bangladesh, 28–29 October 2016. [Google Scholar]
  43. Mansoor, M.B.; Köble, S.; Wong, T.W.; Woias, P.; Goldschmidtböing, F. Design, Characterization and Sensitivity Analysis of a Piezoelectric Ceramic/Metal Composite Transducer. Micromachines 2017, 8, 271. [Google Scholar] [CrossRef] [PubMed]
  44. Nguyen, T.-T.; Ho, D.-D.; Huynh, T.-C. Electromechanical impedance-based prestress force prediction method using resonant frequency shifts and finite element modelling. Dev. Built Environ. 2022, 12, 100089. [Google Scholar] [CrossRef]
  45. Nguyen, T.-H.; Phan, T.T.V.; Le, T.-C.; Ho, D.-D.; Huynh, T.-C. Numerical Simulation of Single-Point Mount PZT-Interface for Admittance-Based Anchor Force Monitoring. Buildings 2021, 11, 550. [Google Scholar] [CrossRef]
  46. Le, B.-T.; Nguyen, T.-T.; Truong, T.-D.-N.; Nguyen, C.-T.; Phan, T.T.V.; Ho, D.D.; Huynh, T.-C. Crack Detection in Bearing Plate of Prestressed Anchorage Using Electromechanical Impedance Technique: A Numerical Investigation. Buildings 2023, 13, 1008. [Google Scholar] [CrossRef]
  47. Behmanesh, I.; Moaveni, B. Probabilistic identification of simulated damage on the Dowling Hall footbridge through Bayesian finite element model updating. Struct. Control Health Monit. 2015, 22, 463–483. [Google Scholar] [CrossRef]
  48. Rajendran, P.; Srinivasan, S.M. Identification of Added Mass in the Composite Plate Structure Based on Wavelet Packet Transform. Strain 2016, 52, 14–25. [Google Scholar] [CrossRef]
Figure 1. The admittance-based active sensing technique for damage monitoring of prestressed anchorage.
Buildings 13 01068 g001
Figure 2. The target beam-like structure under loading and damage cases (unit: mm).
Buildings 13 01068 g002
Figure 3. The finite element model of the fixed–fixed beam-like structure instrumented with a PZT interface at the center.
Buildings 13 01068 g003
Figure 4. Numerical admittance responses under ascending loading.
Buildings 13 01068 g004
Figure 5. Numerical admittance responses under reduced stiffness of damaged beam element.
Buildings 13 01068 g005
Figure 6. RMSD metric of numerical admittance responses under loading and damage cases.
Buildings 13 01068 g006
Figure 7. Experimental setup.
Buildings 13 01068 g007aBuildings 13 01068 g007b
Figure 8. Simulation of damage scenarios in the prestressed anchorage.
Buildings 13 01068 g008aBuildings 13 01068 g008b
Figure 9. Measured admittance responses under damage cases: damage distant from the transducer (the first test scenario).
Buildings 13 01068 g009
Figure 10. Measured admittance responses under damage cases: damage close to the transducer (the second test scenario).
Buildings 13 01068 g010
Figure 11. RMSD metric of measured admittance response under damage cases: damage distant from the transducer (the first test scenario).
Buildings 13 01068 g011
Figure 12. RMSD metric of measured admittance response under damage cases: damage close to the transducer (the second test scenario).
Buildings 13 01068 g012
Figure 13. Selection of the frequency range for damage assessment.
Buildings 13 01068 g013
Table 1. Mechanical properties of the interface and the host beam.
ParametersThe Interface Body and the Beam Structure
Young’s modulus, E (GPa)70
Poisson’s ratio, υ0.33
Mass density, ρ (kg/m3)2700
Damping loss factor, η0.02
Table 2. Piezoelectric properties of the PZT-5A transducer.
ParametersValue
Elastic compliance,
s i j k l E (m2/N)
16.4 5.74 7.22 0 0 0 5.74 16.4 7.22 0 0 0 7.22 7.22 18.8 0 0 0 0 0 0 47.5 0 0 0 0 0 0 47.5 0 0 0 0 0 0 44.3 × 10 12
Dielectric coupling constant, d k i j (C/N) 0 0 171 0 0 171 0 0 374 0 584 0 584 0 0 0 0 0 × 10 12
Permittivity, ε j k T (Farad/m) 1730 0 0 0 1730 0 0 0 1700 × 8.854 × 10 12
Mass density, ρ (kg/m3)7750
Damping loss factor, η0.005
Dielectric loss factor, δ0.015
Disclaimer/Publisher’s Note: The statements, opinions and data contained in all publications are solely those of the individual author(s) and contributor(s) and not of MDPI and/or the editor(s). MDPI and/or the editor(s) disclaim responsibility for any injury to people or property resulting from any ideas, methods, instructions or products referred to in the content.

