1. Introduction
Population growth and global industrialization have generated a large amount of waste around the world, and the construction industry produces a lot. CDW production has generated a negative impact on the environment and a social problem in communities. Most CDW materials come from the demolition and rehabilitation of existing buildings [
1], representing a significant percentage of the solid wastes generated annually worldwide [
2]—approximately 60% [
3]. In Hong Kong, it is estimated that 38% of waste or approximately 6408 tons is produced by construction and demolition per year [
1]. In Australia, of the 32.4 megatons of solid waste generated per year, 42% corresponds to CDW materials [
4]. In accordance with [
3], CDW materials represent 50% of waste in the UK and 30% in the USA. In the European Union, CDW represents from 25% to 34% of solid waste [
5,
6,
7]. In Colombia, CDW production is more than 22 million t [
8].
In many countries, the final disposal of these materials is still mainly in landfills [
9]. This generates great environmental impacts that have been verified in different ways. For example, life cycle analysis (LCA) has shown that landfill disposal generates a greater environmental impact than recycling or reusing CDW materials [
10]. Due to a higher awareness, the levels of impacts caused, and increasingly demanding regulations, various strategies are being implemented to reduce waste generation and allow reuse. CDW material reuse has been promoted in construction, and high use levels have been achieved in some countries. In Australia, 57% of CDW materials are recycled [
4], and over 90% has been achieved in Europe [
10].
In Colombia, population growth in urban zones has generated high CDW production. It is estimated that most CDW is disposed in landfills. Due to construction and demolition waste impacts, management and demolition construction were regulated in 2017, establishing 2% CDW material reutilization as a minimum goal per year, which was to increase 2% each year until reaching at least 30%.
This has led to the promotion of industrial and commercial CDW reuse, especially as aggregates such as hydraulic concrete. However, other CDW materials, such as brick, ceramic tile, and excavation soils, are used a little. In CDW reuse processes, in the literature, there are efforts to incorporate CDW into conventional construction processes. Significant advances have been made in the use of CDW in applications such as recycled aggregate concrete production [
6,
11,
12,
13,
14], recycled aggregate mortar production [
10,
15,
16,
17,
18,
19], pavement production [
20,
21] and geotechnical applications [
7,
22,
23,
24]. In general, these works have given promising results according to aggregate quality and the production processes they implemented [
15]. Regarding road construction materials, it has been established that after a simple crushing process, they can be used alone or as mixed granular materials. In this sense, CDW mixtures as granular base materials’ behavior has been identified, and a big concrete waste volume is used [
9,
25,
26]. However, high brick residue content deteriorates CDW performance and cannot be used as a granular base, but it is possible to use it as a subbase material [
27,
28] or as a stabilized base [
29,
30]. In any case, CDW material use minimizes the arrival of CDW to landfills and virgin material uses for road construction, considering that road construction is responsible for 30% of greenhouse gas emissions and 25% of fossil fuel consumption [
31,
32]. A pavement material construction life cycle evaluation is essential to make decisions in different construction stages [
33].
In many countries, bricks represent a high percentage of CDW [
34]; for example, in Spain these materials represent 54% [
30], and in the UE countries, it is estimated that masonry waste represents between 8% and 54% [
35]. Due their poor mechanical characteristics, it is not feasible to incorporate such waste in building materials in construction, but it has several applications in road construction. The potential to use bricks in road construction has been evidenced, and various applications have been evaluated [
25,
26,
29,
36,
37], including CDW mixtures and soil as compacted granular material [
25,
26,
28,
38,
39] and CDW mixtures and Portland-cement-stabilized soils [
9,
29].
In this work, CDW materials (brick and ceramic tile) and soil mixture laboratory evaluations are presented: testing of silty soil and CDW mixture behavior with variable particle sizes ranging from 0.075 to 19 mm through compaction tests, CBR values, and dynamic triaxial tests considering CDW/soil ratios of 0%, 10%, 20%, 30%, 40%, 50%, 60% and 70%. We also present a proposal for improved CDW–soil use.
2. CDW Pavement Application
The lower performance of brick and ceramic tile CDW is related to particle shape and composition. According to published results, CDW with high brick and ceramic tile content can present brittleness problems due to the flattened shape of the particles, and it is common to have higher flatness and elongation rates at up to 50% total sample volume [
40]. Other important factors include the specifications for materials used in pavement construction, and that the CDW does not comply with the wear on the Los Angeles Abrasion Testing Machine, as shown by [
40].
In [
22], the authors compared the behavior of recycled aggregate and natural added aggregate soil. The residue mixture had more than 90% concrete and ceramic brick; some had more than 95% concrete aggregate. They concluded that residue water absorption was greater, because original CDW materials have high absorption capabilities, like clay bricks, similarly to other works [
40]. Absorption values found varied from 1.6% to 5.0% for natural aggregates and reached up to 15% for the aggregate from waste. Density also varies depending on the material, decreasing depending on the content of the materials such as brick and ceramic tile. Values up to 1300 kg/m
3 were found, which were lower than the conventional density of an aggregate, whose values are close to 2600 kg/m
3. It could also be observed that optimum moisture content increased the CDW content; concurrently, maximum dry density decreased and the CBR value increased. Few investigations have been conducted with ceramic tile residues. In [
25] the authors used a mixture of ceramic tile residue and a silty clay soil mixture as a subgrade for pavements. The results show that as ceramic tile residue was added, the CBR value increased, and unconsolidated compressive strength decreased. Additionally, they found that maximum dry density increased and the optimum humidity of the test material decreased.
It has been proven that although brick and ceramic tile mixtures improve some characteristics of materials, it is impossible to use them as structural materials in pavements, but they could be implemented as subgrade improvement materials. However, brick and ceramic CDW is appropriate to use as a road construction material. Nevertheless, there is not a lot of information available to determine appropriate contents and performance levels.
3. Materials and Methods
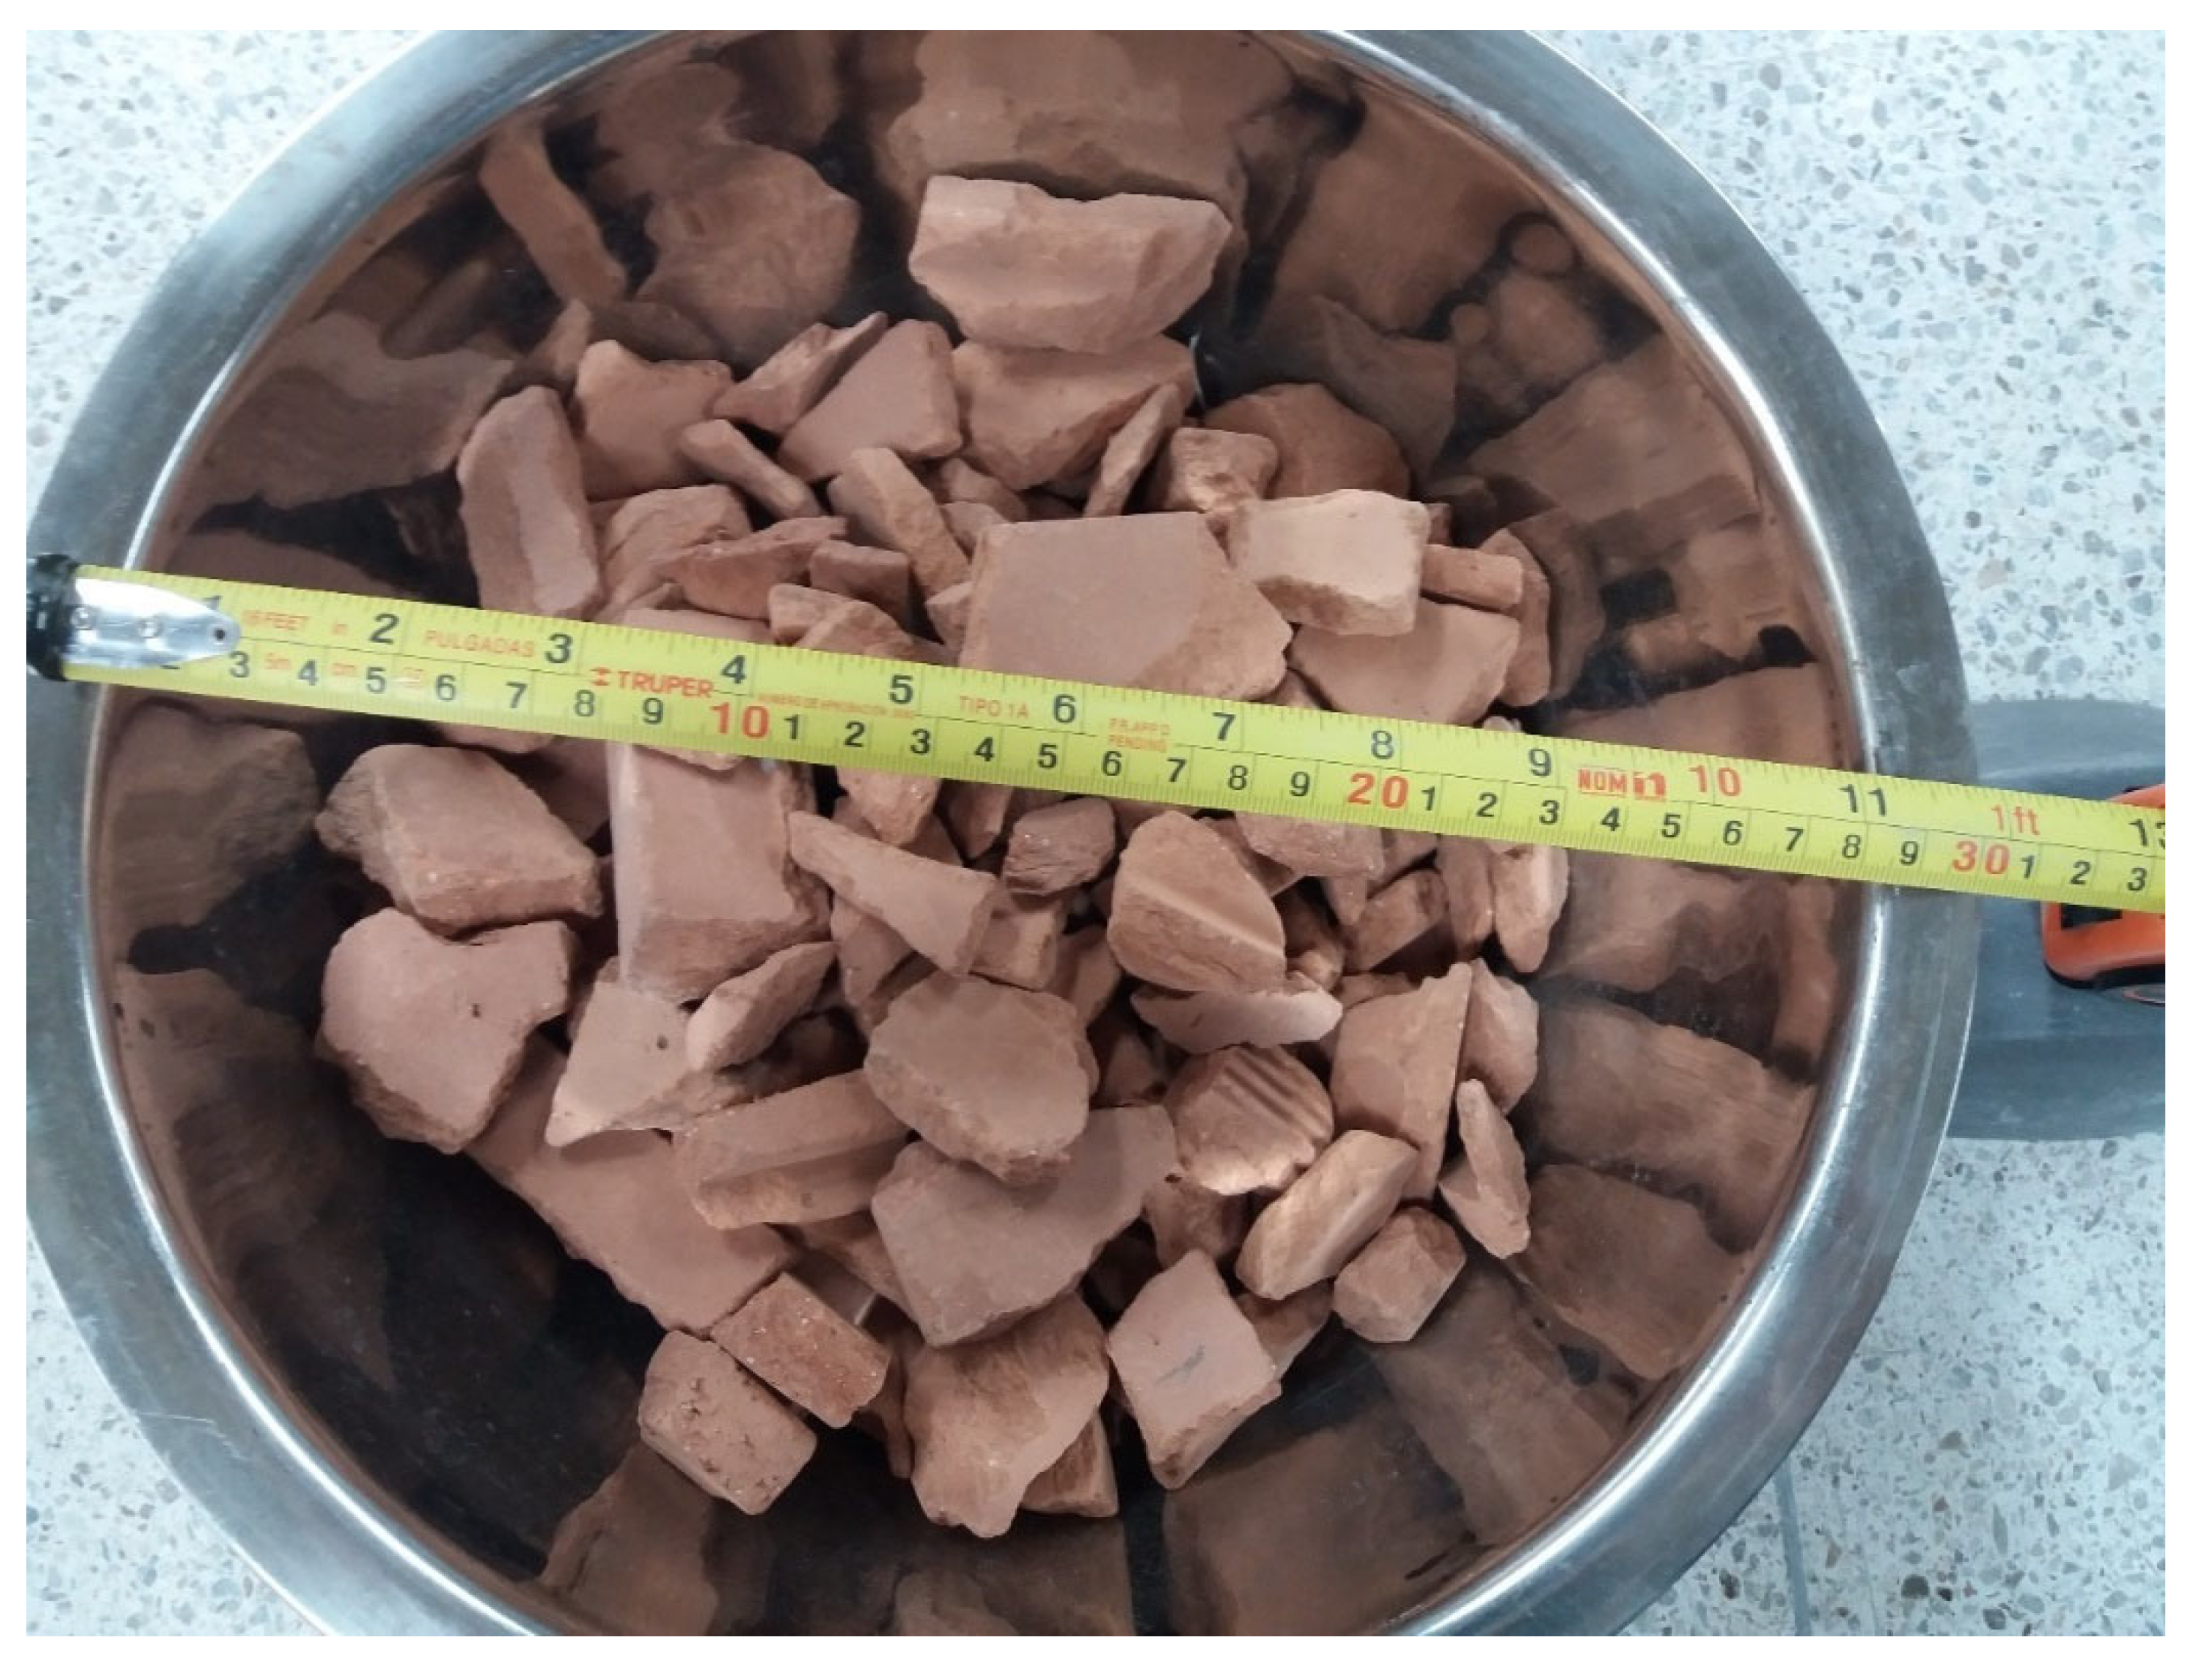
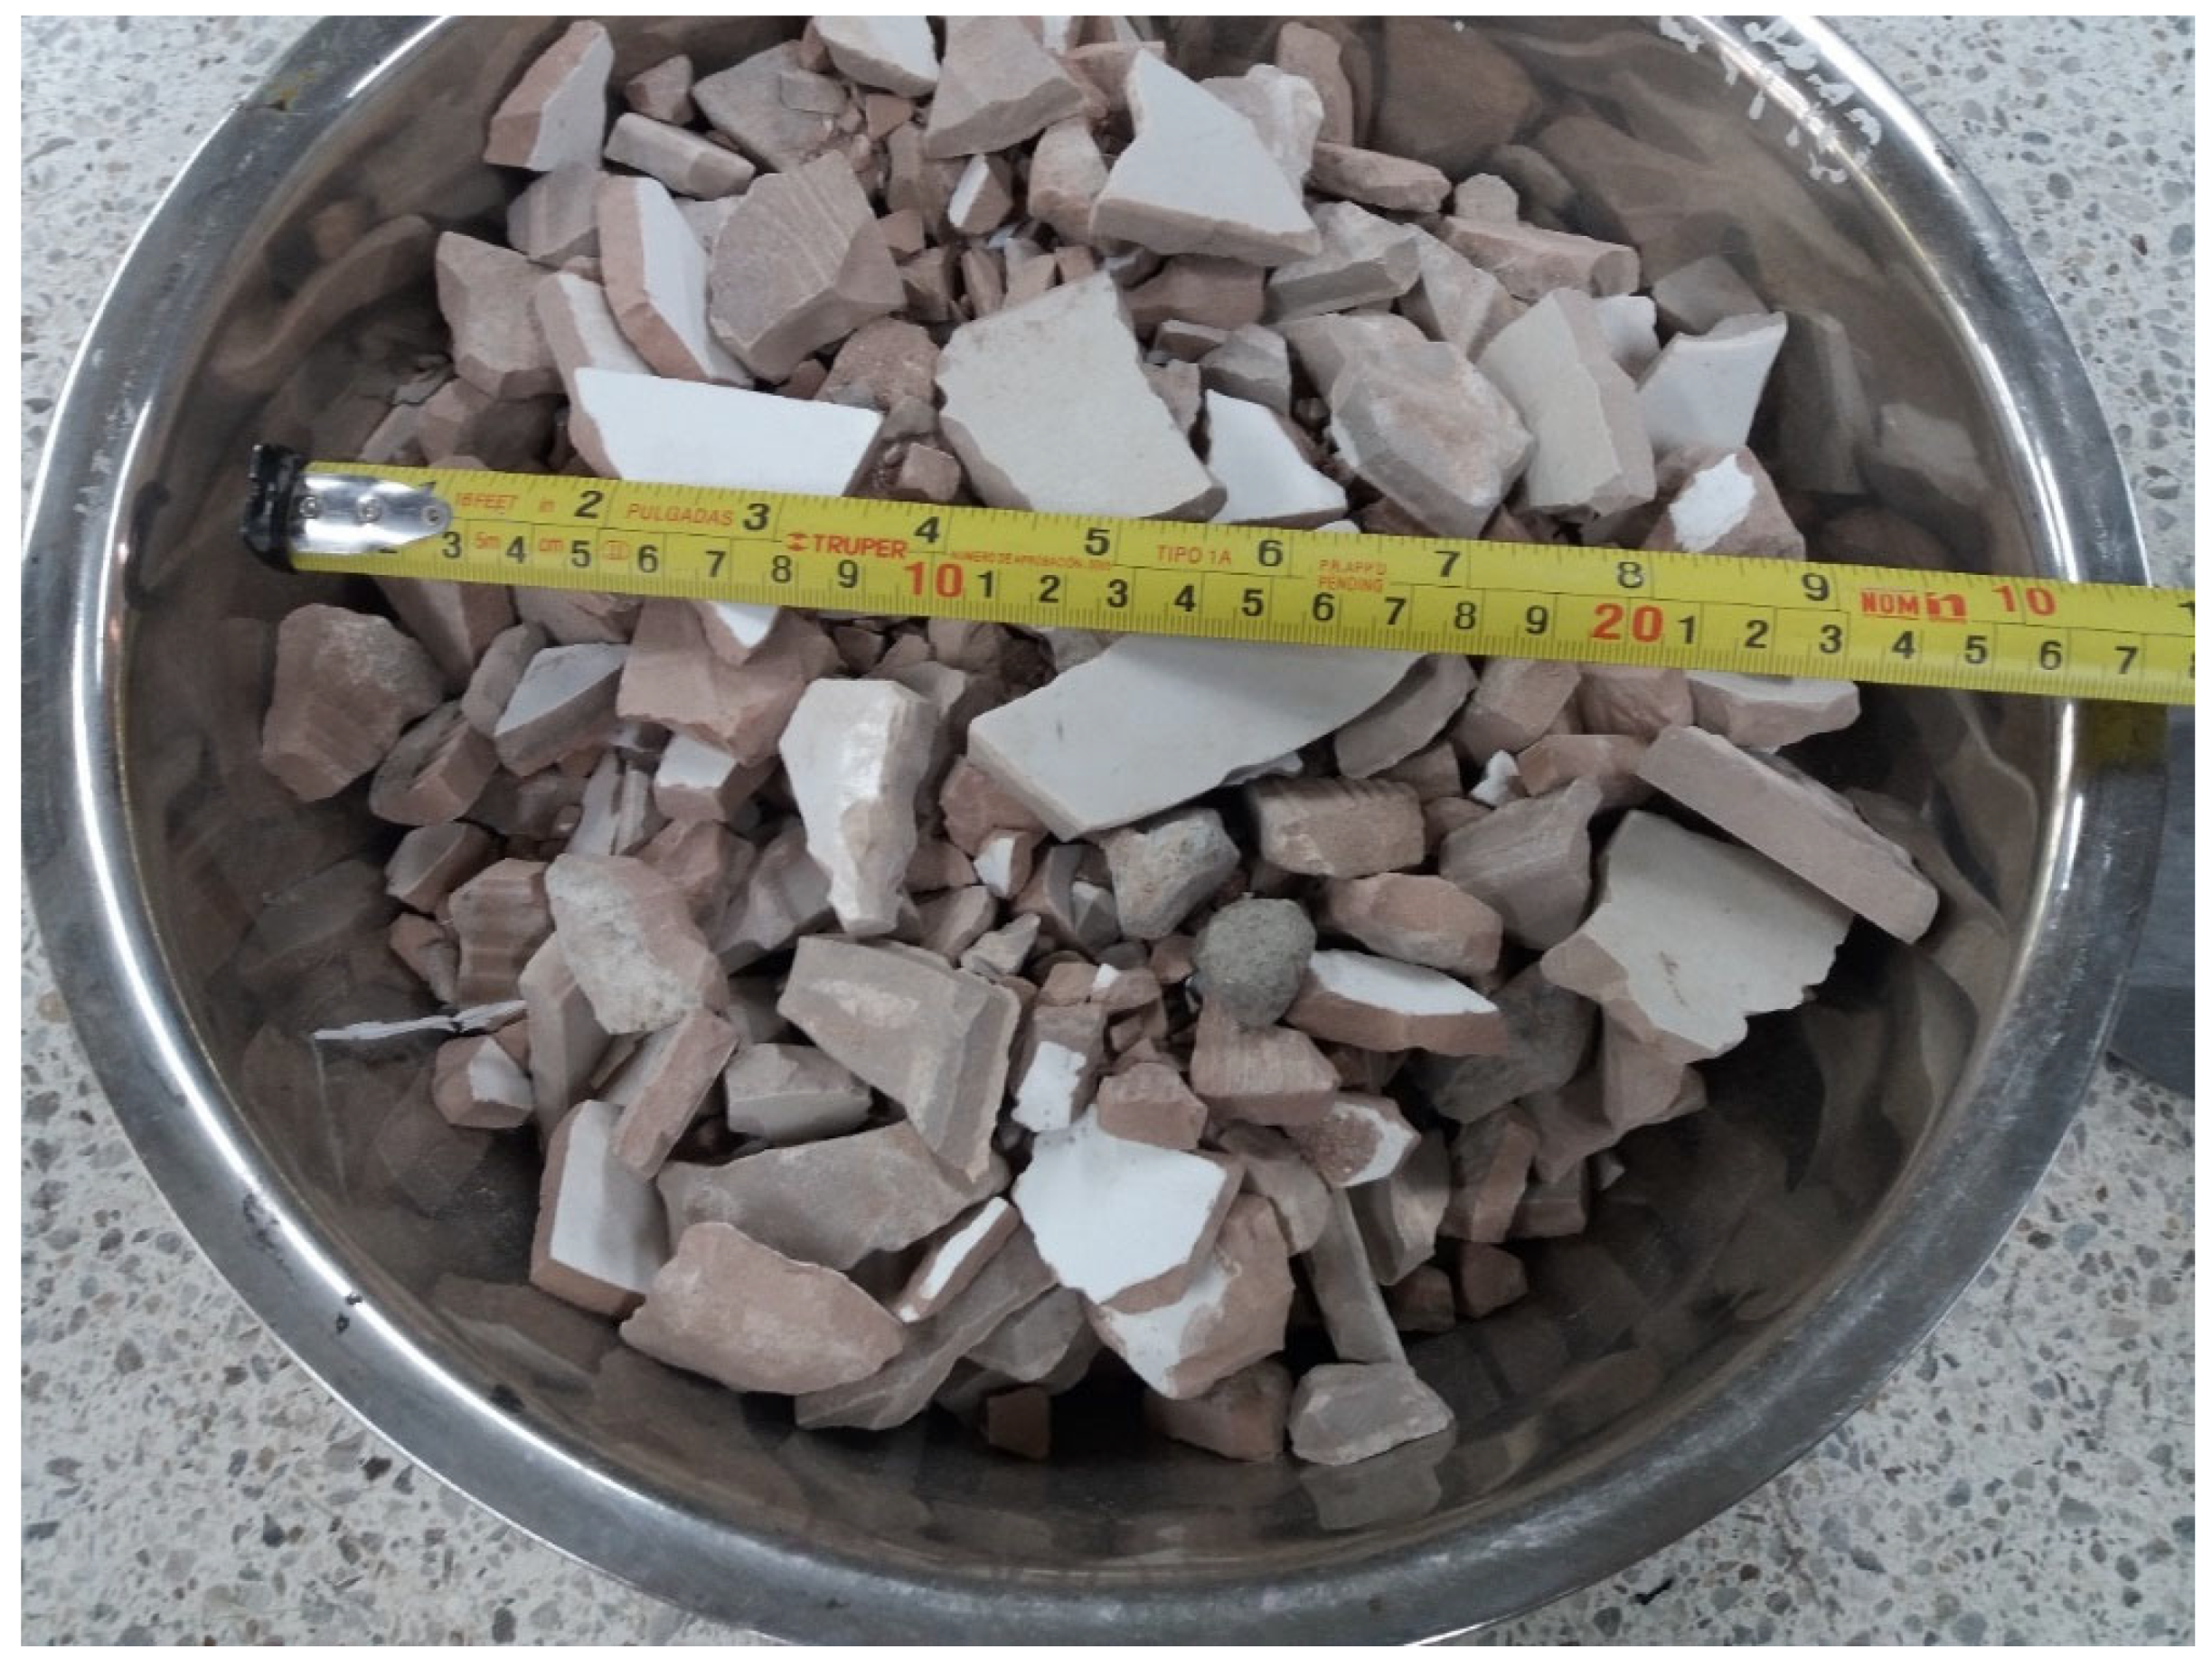
Brick and ceramic tile residues were selected from construction sites and were modified by a primary crushing process, obtaining elongated rectangular or cone shape particles with sizes ranging from 19 to 25 mm. (
Figure 1 and
Figure 2). Masonry waste is an aggregate from Castilian brick produced in industrial plants in the region, and ceramic tile waste includes ceramic fragments from floors and porcelain tile.
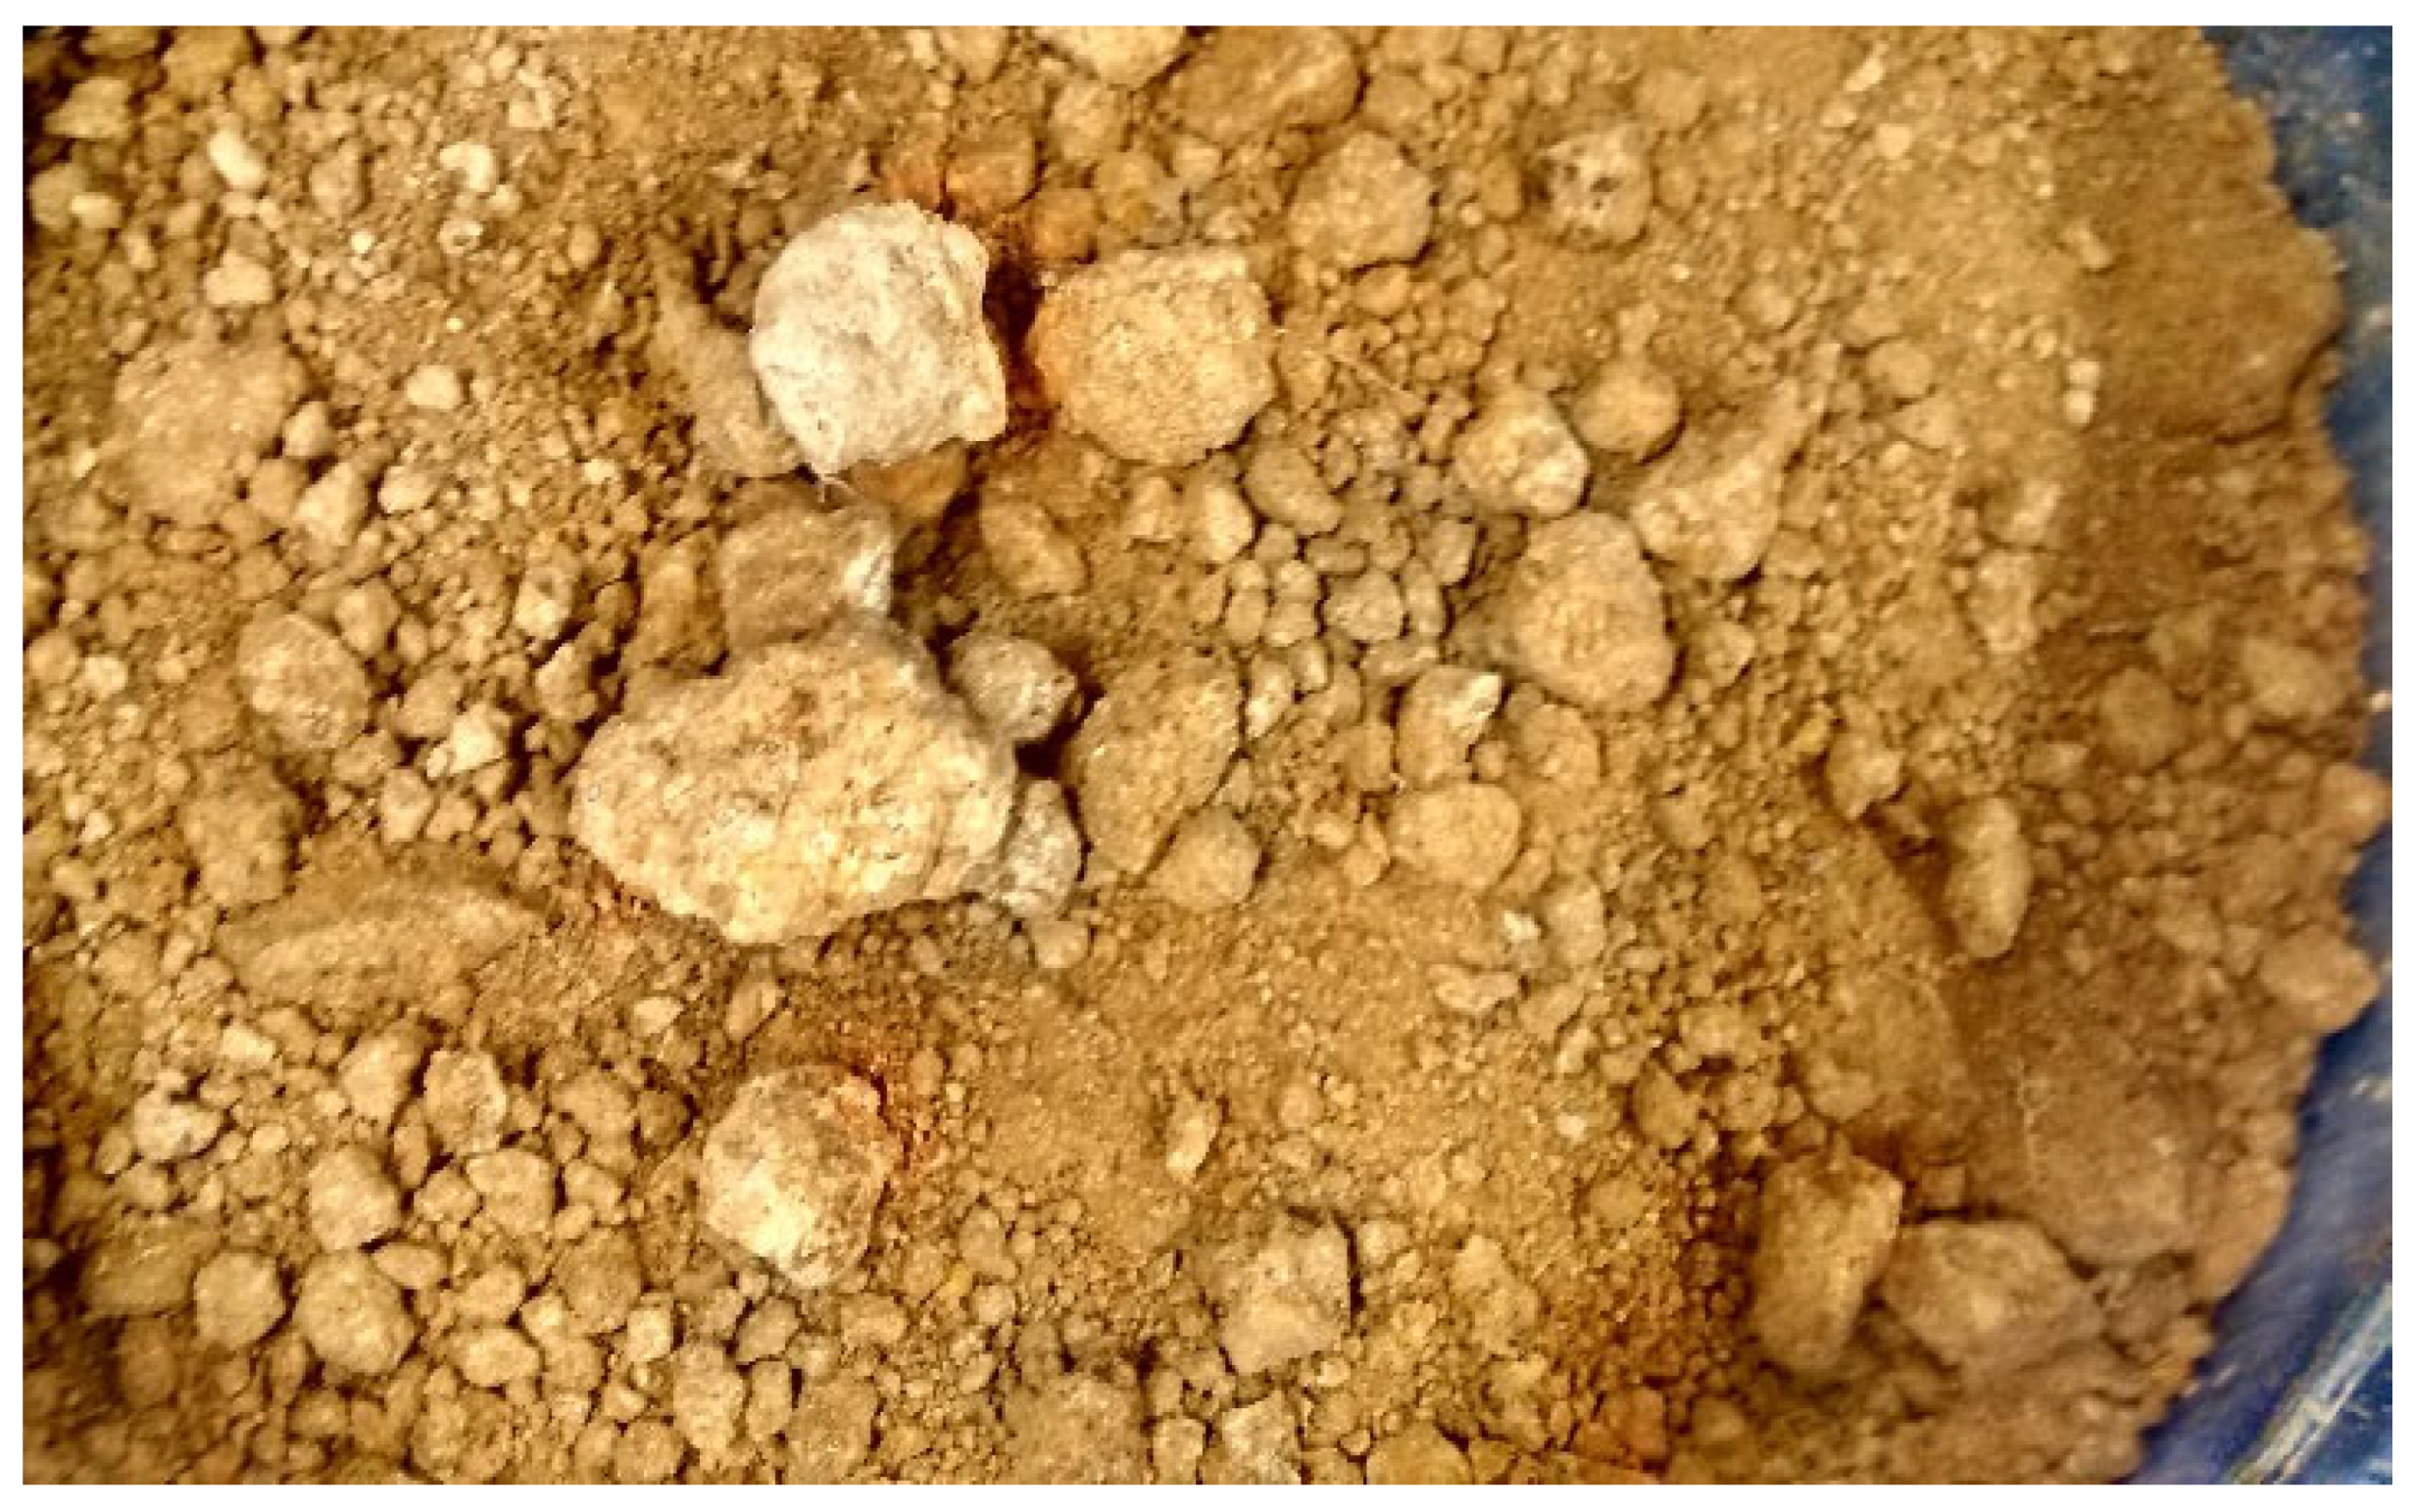
For this research, 200 kg samples of each CDW type were used and naturally dried. Then, they were homogenized and cracked in a granulometry physical characterization process that included specific density, density loss, water absorption, and sieve 200 passes. As a matrix of test bodies and a comparison base of the results, a fine granular soil composed of rock fragments, minerals, and clay was selected (
Figure 3). The soil was characterized, and the results are shown in
Table 1. In
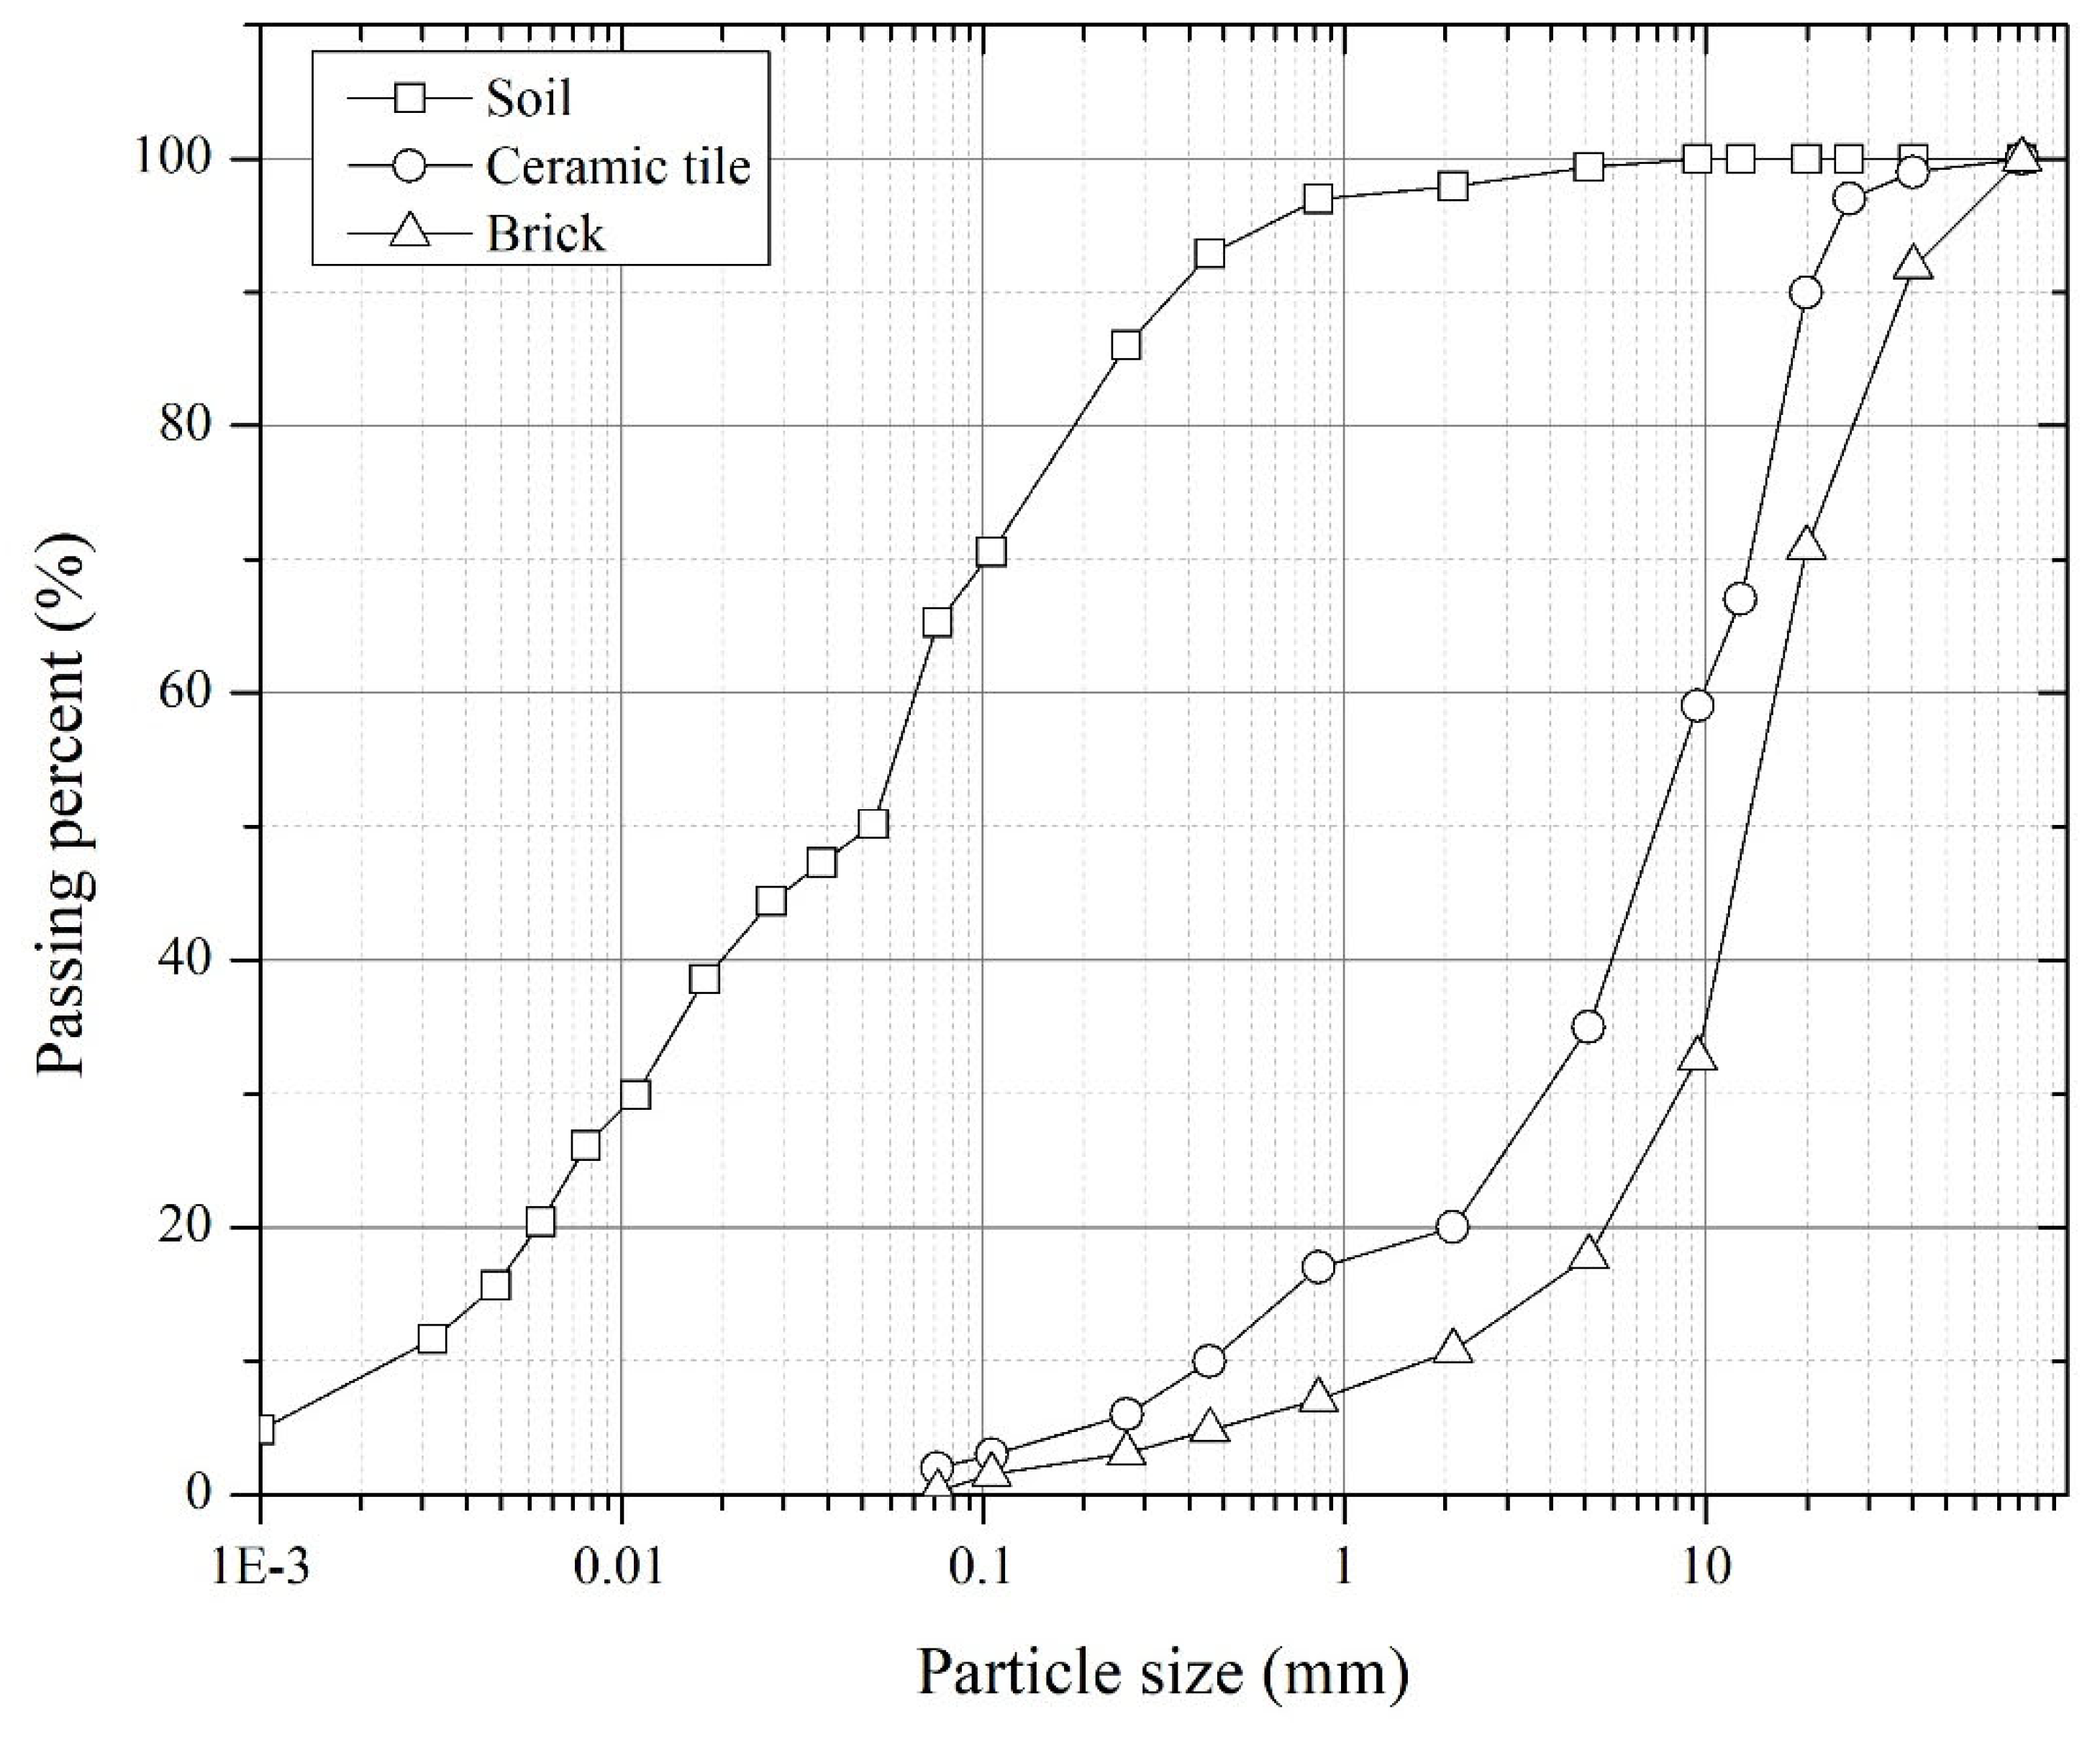
Figure 4, the granulometric curves of the three materials made with the ASTM D-422 (AASHTO T 27-88) test are presented, and in
Table 2, the physical characteristics of the thickest residue fraction of the residues is shown—that is, the main characteristics that affect the prepared mixture’s behavior. A soil modified Proctor compaction test was conducted too.
To identify brick and ceramic tile CDW effects on soil mixture strength, an experimental process was followed that involved adding different ratios of CDW material, and they were mixed with fine granular silt-type soil. A CBR test measured the effects. CDW was obtained from building construction projects located in the Metropolitan Area of Valle de Aburrá (Antioquia, Colombia) with similar characteristics—that is, more than 20-floor towers with similar housing units, mixed construction systems, and common building finishes. The residues were prepared and characterized as follows:
Soil samples were taken.
Ground brick and ceramic fragments to obtain a maximum 19 mm particle size.
Determination of particle size distribution (ASTMD422, D1140), specific density, and absorption (ASTMC 128-04).
Brick material was calcined clay from the geological formation called Stock de Altavista, located in west of Metropolitan Area of Valle de Aburrá (Antioquia, Colombia). Ceramic samples from floors were Columbian porcelain and ceramics.
The soil was residual sandy silt, derived from diorites and characterized by granulometry tests (ASTMD422, D1140) and Atterberg limits (ASTMD4318).
A factorial experimental design was proposed to evaluate the effect of CDW as a stabilizer. CDW content and type were defined as influential factors through ten (10) combinations, and CBR value was established as a control variable between nature and stabilized soils.
For the design, a repetition was considered for each combination, to have support in the strength data obtained and more information that would allow the possibility to estimate if the differences observed in the original and replicated design were statistically significant. The randomness in the conditions established for each soil according to each variable allow one to guarantee independence in error trends and avoid biased information, seeking normal data distribution.
Finally, the results showed in
Table 3 guaranteed the statistical independence relationship between CDW type and CDW content factors. Thus, those values were used in bricks and ceramic tiles' RCD mixtures elaboration.
A compaction test (ASTM D1557) and a CBR test (ASTM 1883) were performed for each soil and CDW combination. In the CBR test, the specimens were compacted until they reached the maximum dry density of the modified Proctor test (ASTM D1557) in optimum humidity conditions.
Then, CBR tests were conducted for the CDW bricks with waste contents of 15%, 30%, 70%, and 75%. Additionally, dynamic triaxial tests were conducted to determine the resilient moduli of the materials. Finally, regarding mixture characterization, CDW soils were incorporated in thickness designs of pavement structures.
4. Results and Discussion
Regarding the physical characteristics and the granulometric curves of the two materials used as additions to the soil mixture, different characteristics were observed, such as absorption and physical wear of the ceramic tile waste in the Los Angeles Abrasion Test having values half as high as those obtained for the brick residue, mainly due to the difference in the production process.
4.1. Compaction of Soil Mixtures and CDW
Following the proposed objective—seeking to determine the behavior of waste mixture soils—we created mixtures with different CDW proportions. With these mixtures, compaction tests were performed: Proctor normal ASTM D-698, Proctor modified (ASTM D-1557), and CBR tests (ASTM D-1883–AASHTO T-193). Resilient modulus tests (ASTM D-4123) were also conducted, and the results were compared with those obtained for the soil without CDW.
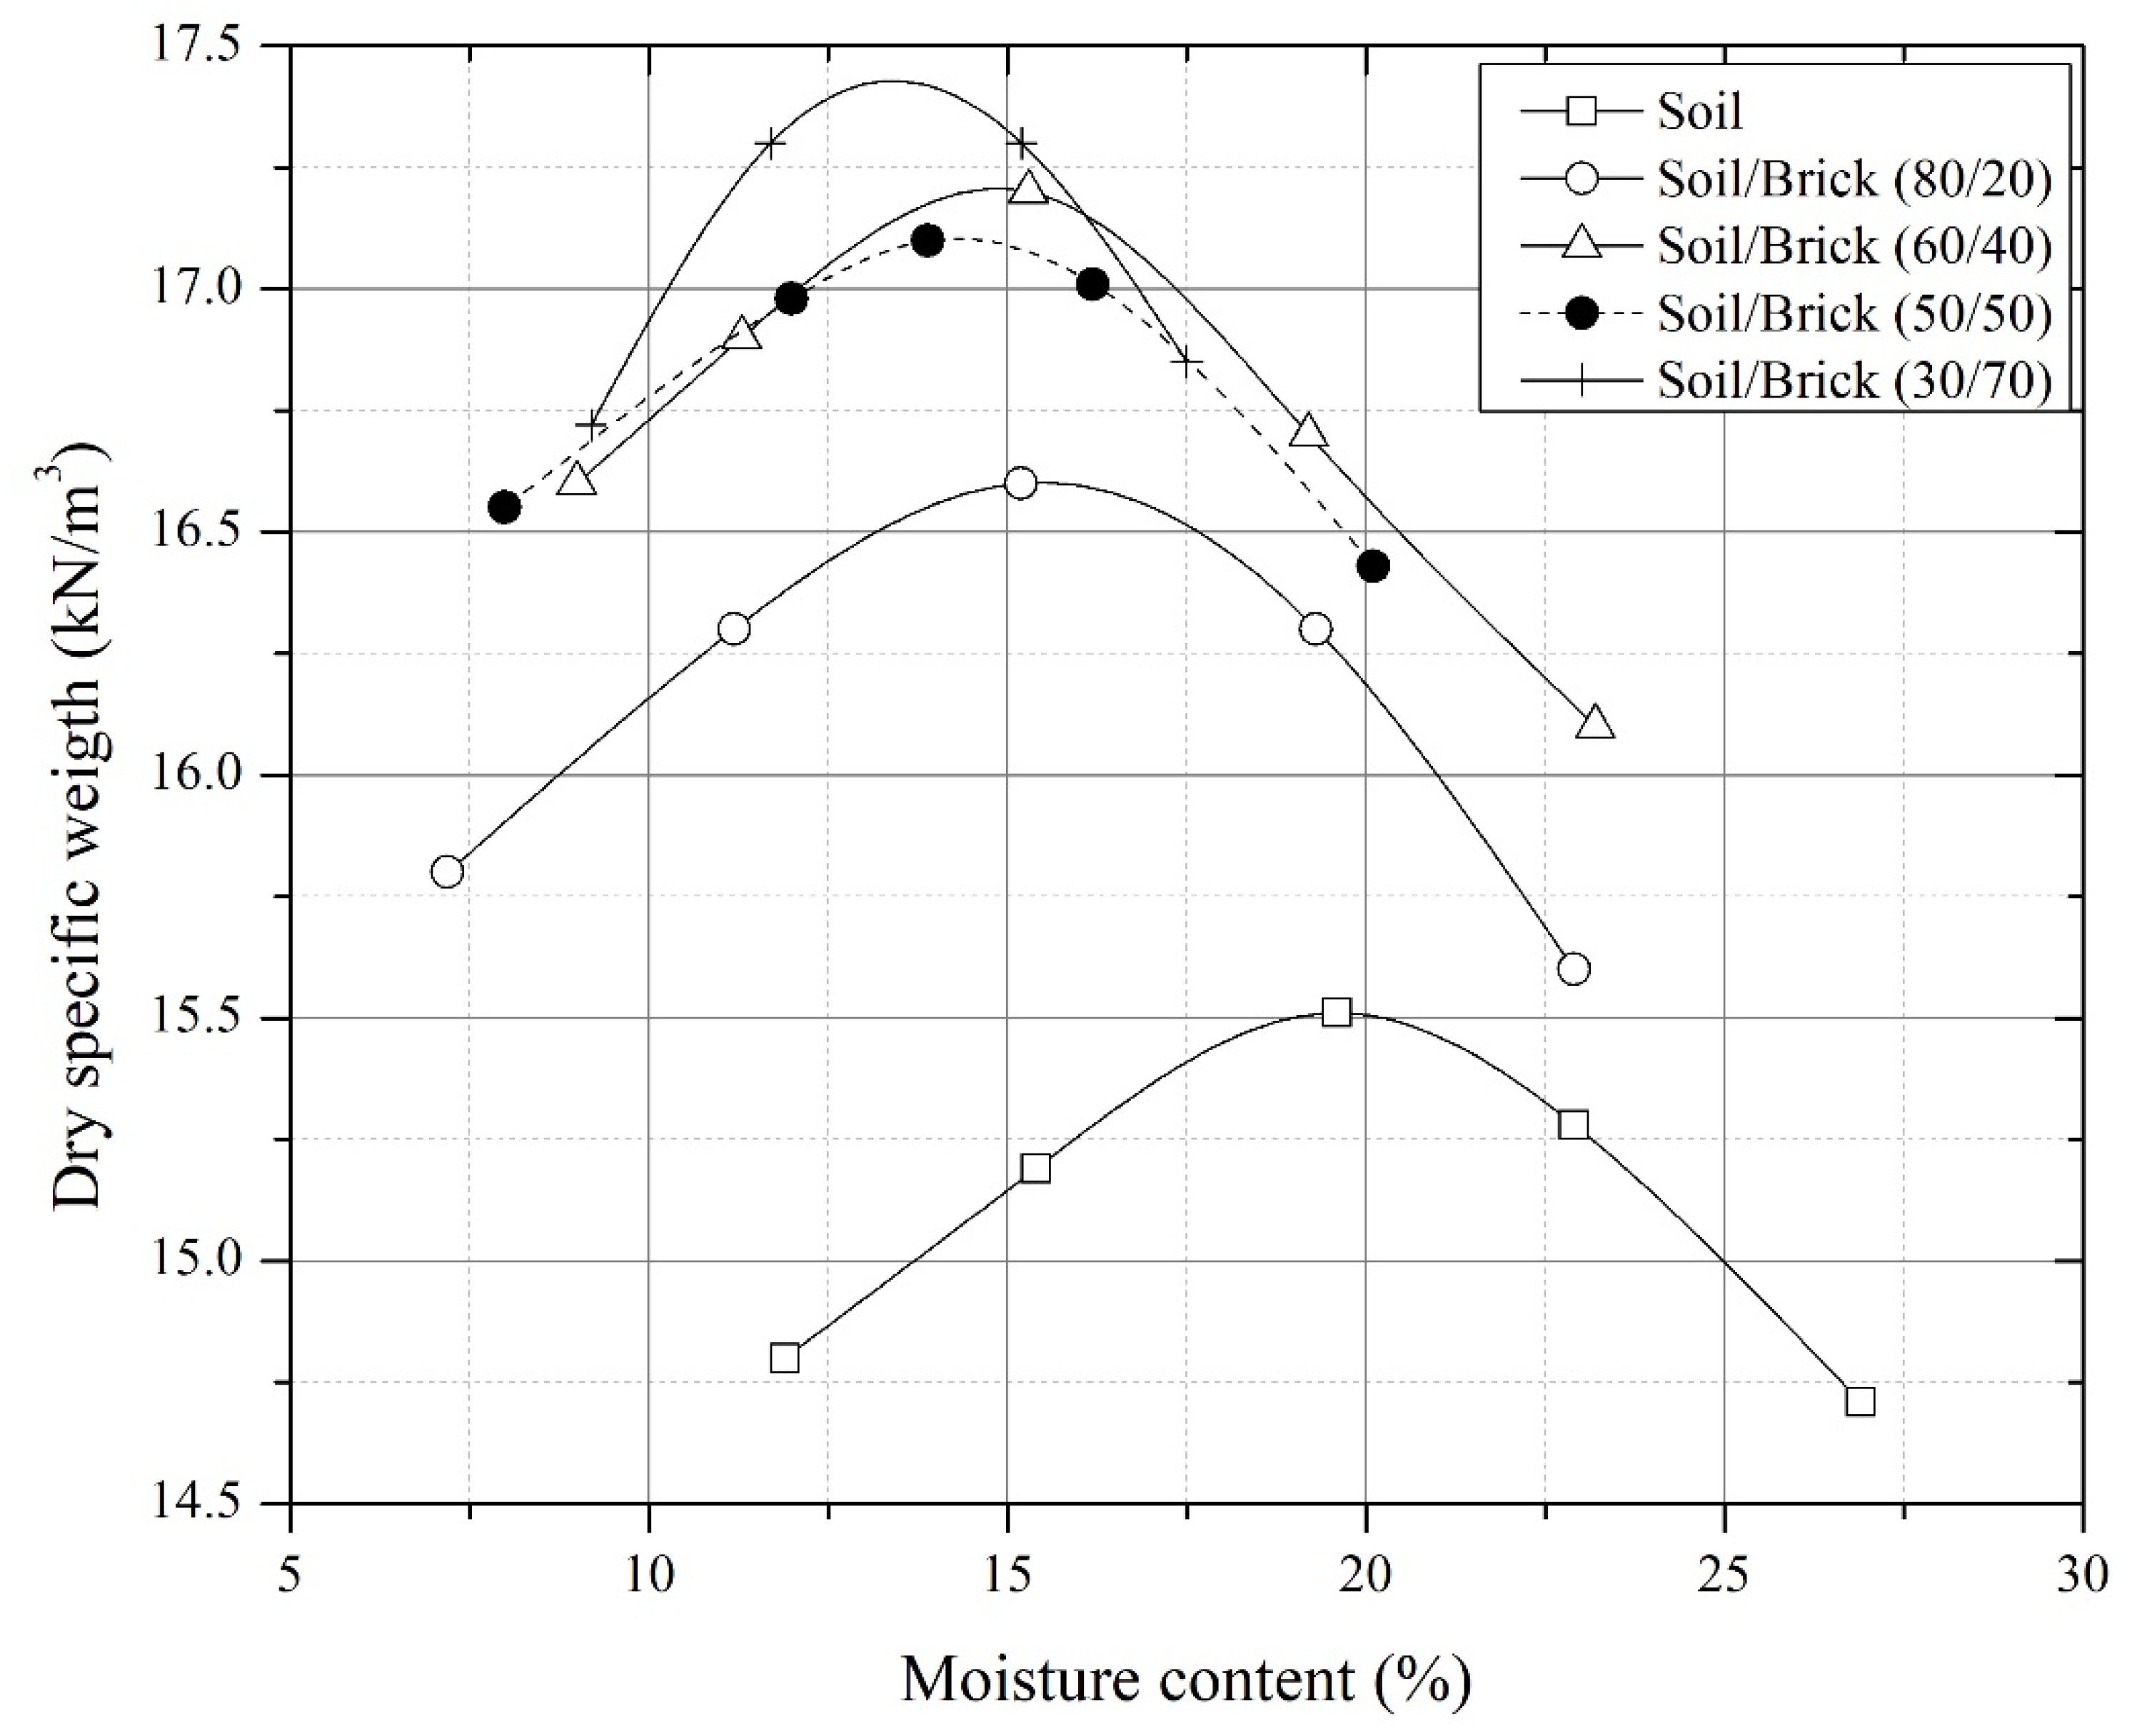
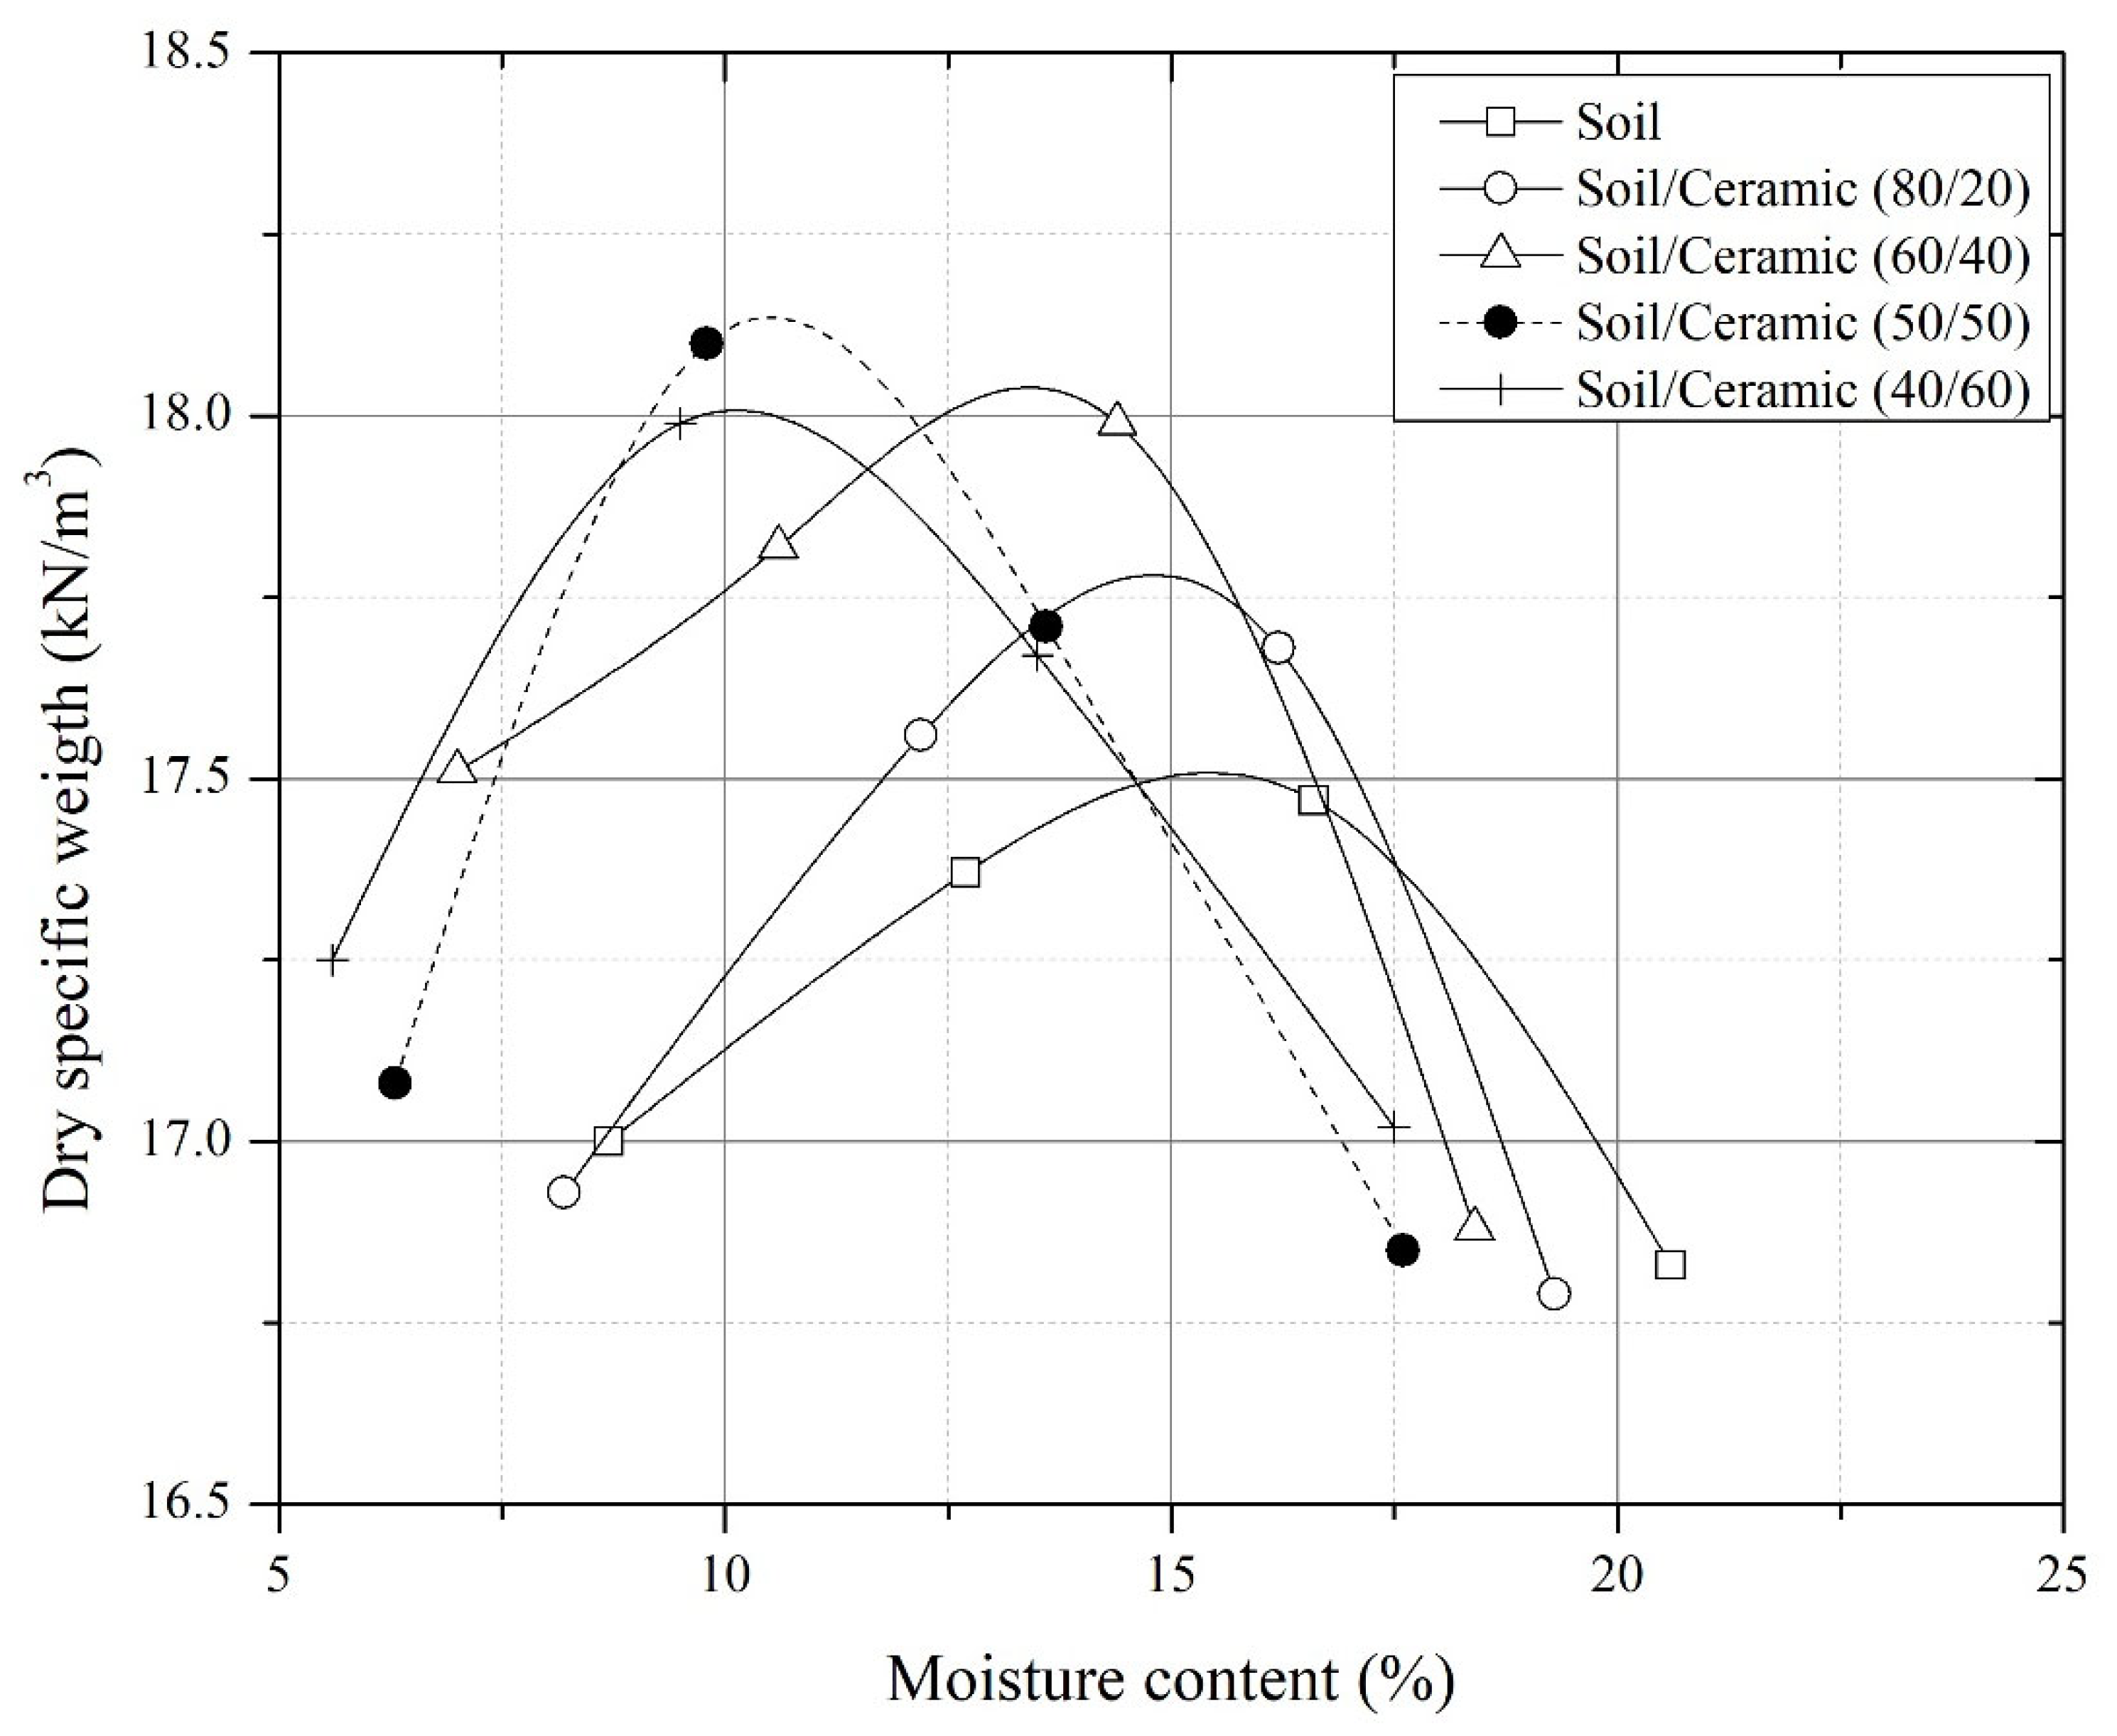
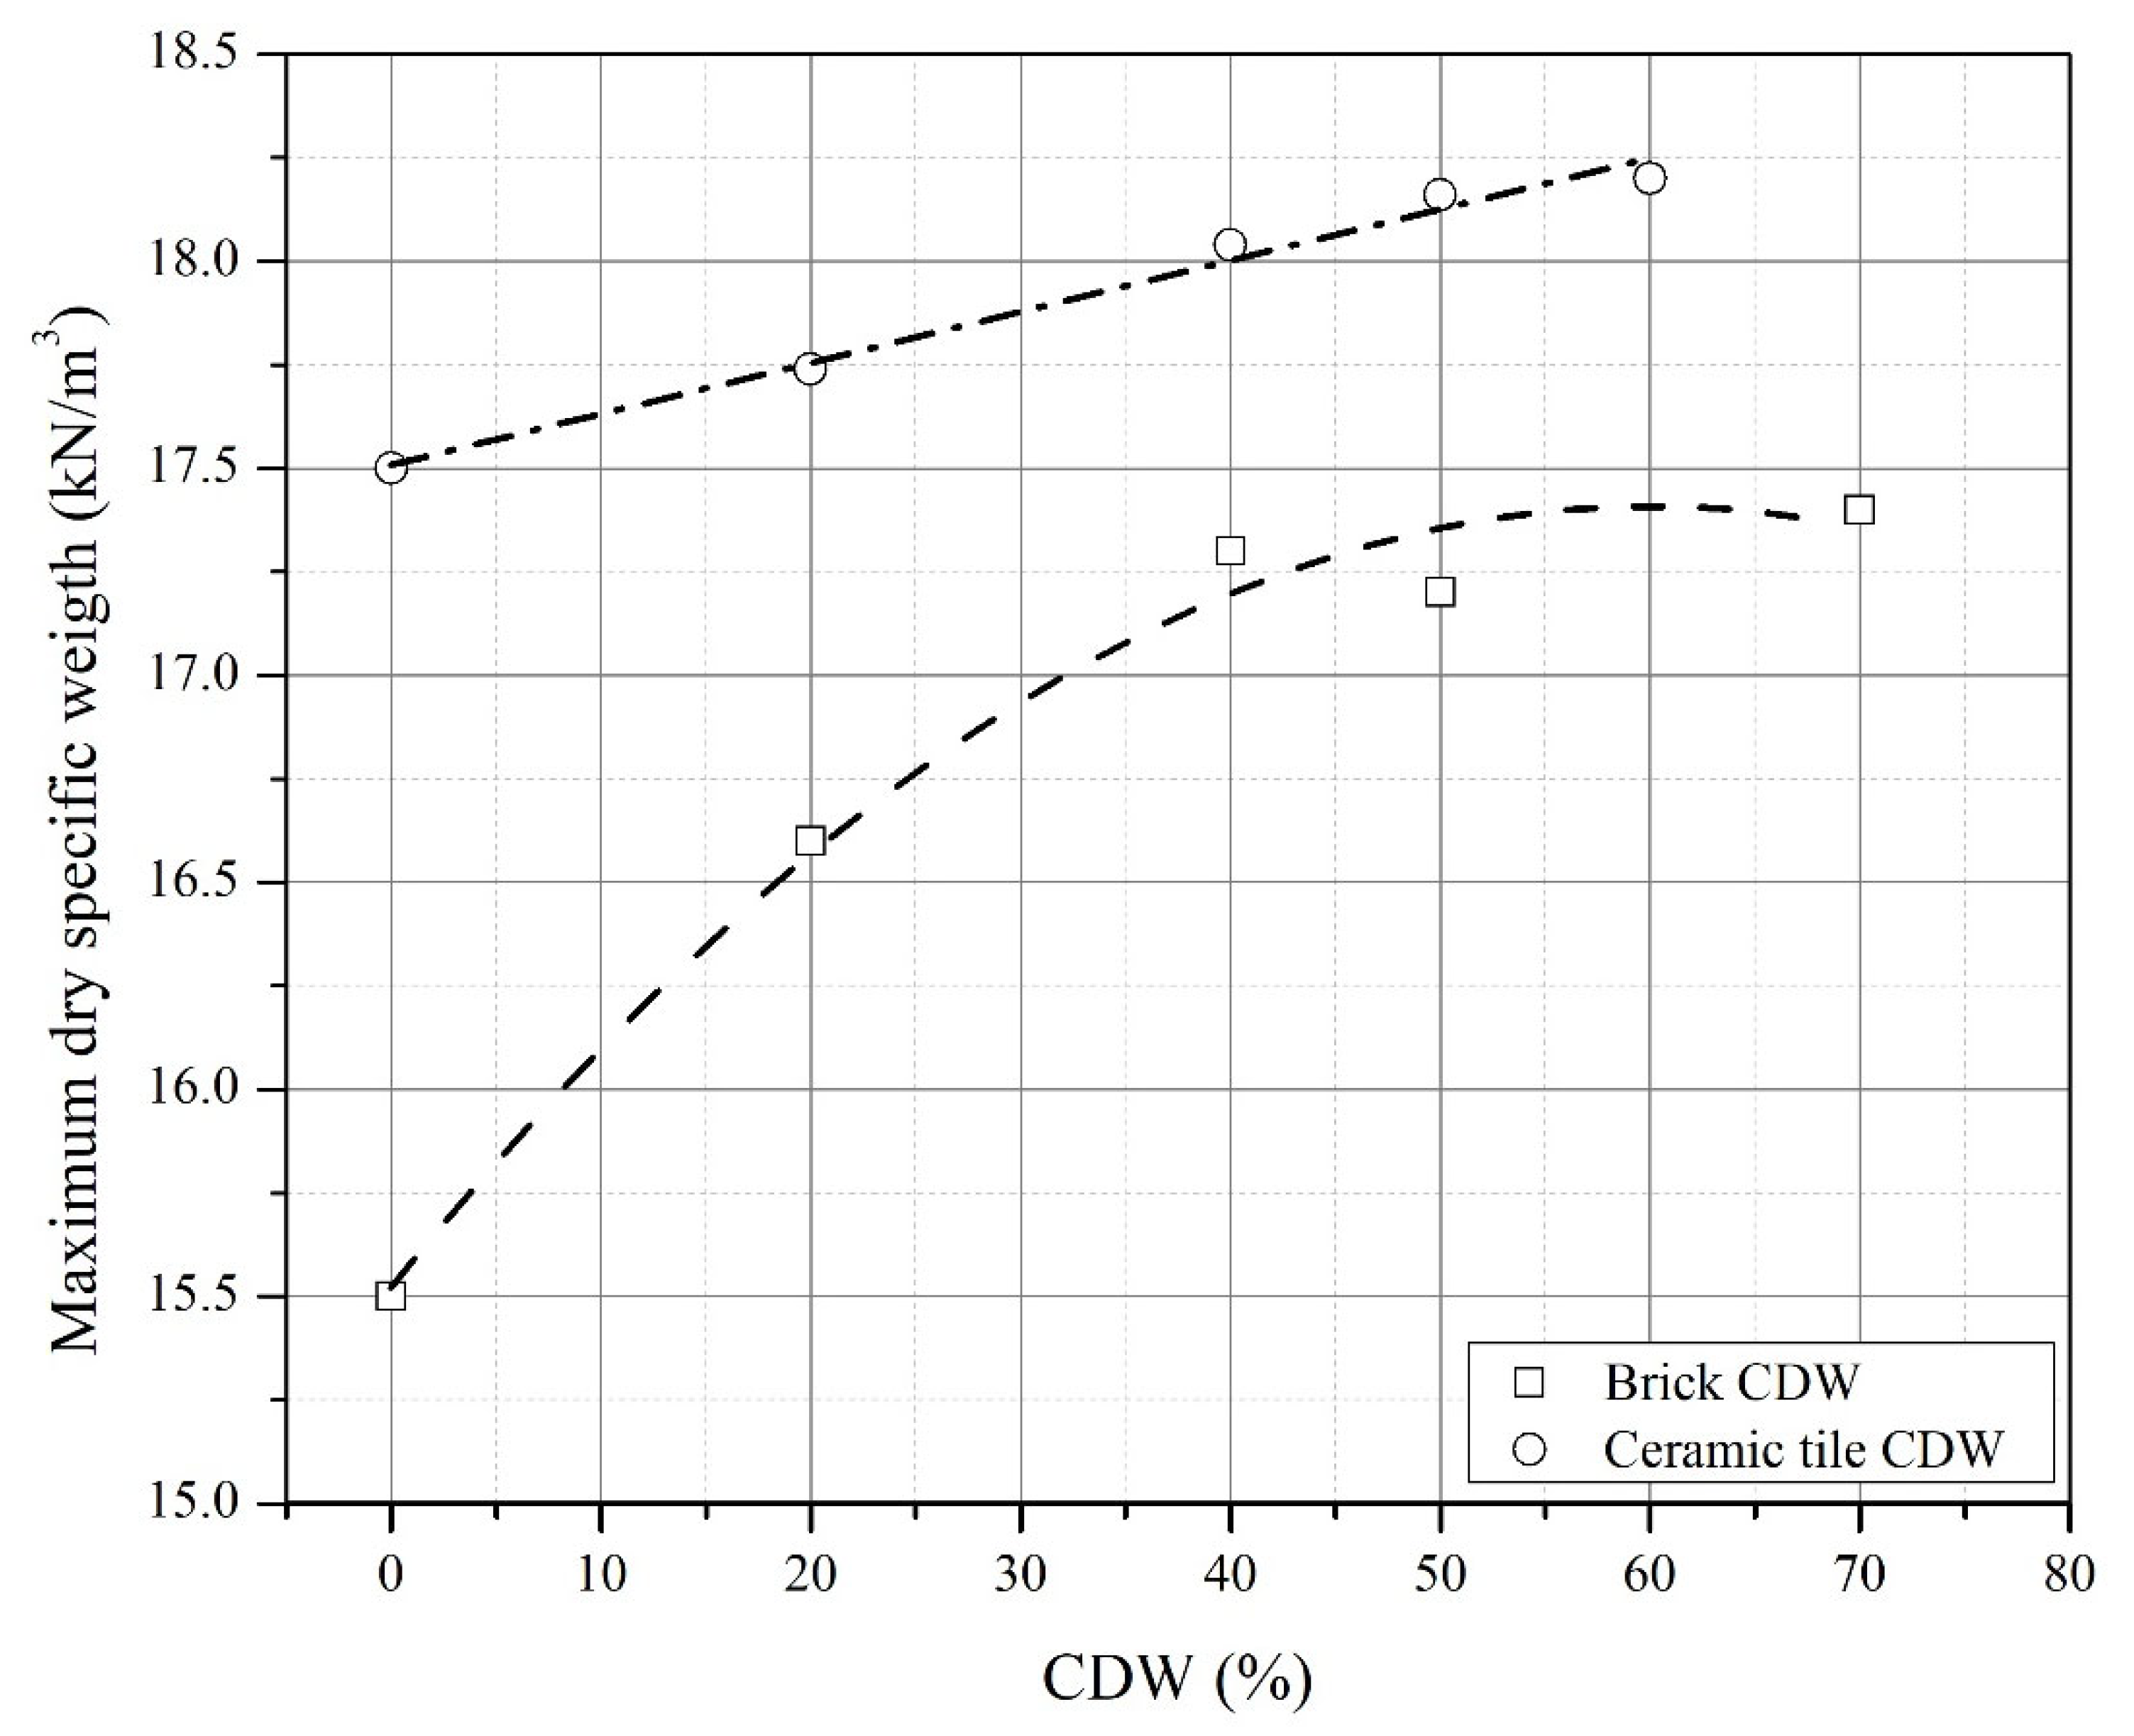
To evaluate the CDW’s influence in the compaction degree of the material, several modified Proctor tests were conducted considering the soil/CDW ratios shown in
Table 4, thereby finding the maximum unit weight and optimal moisture of modified Proctor tests for mixtures of different CDW and soil, which are shown in (
Figure 5 and
Figure 6). The results showed that more CDW content increased the maximum dry unit weight (
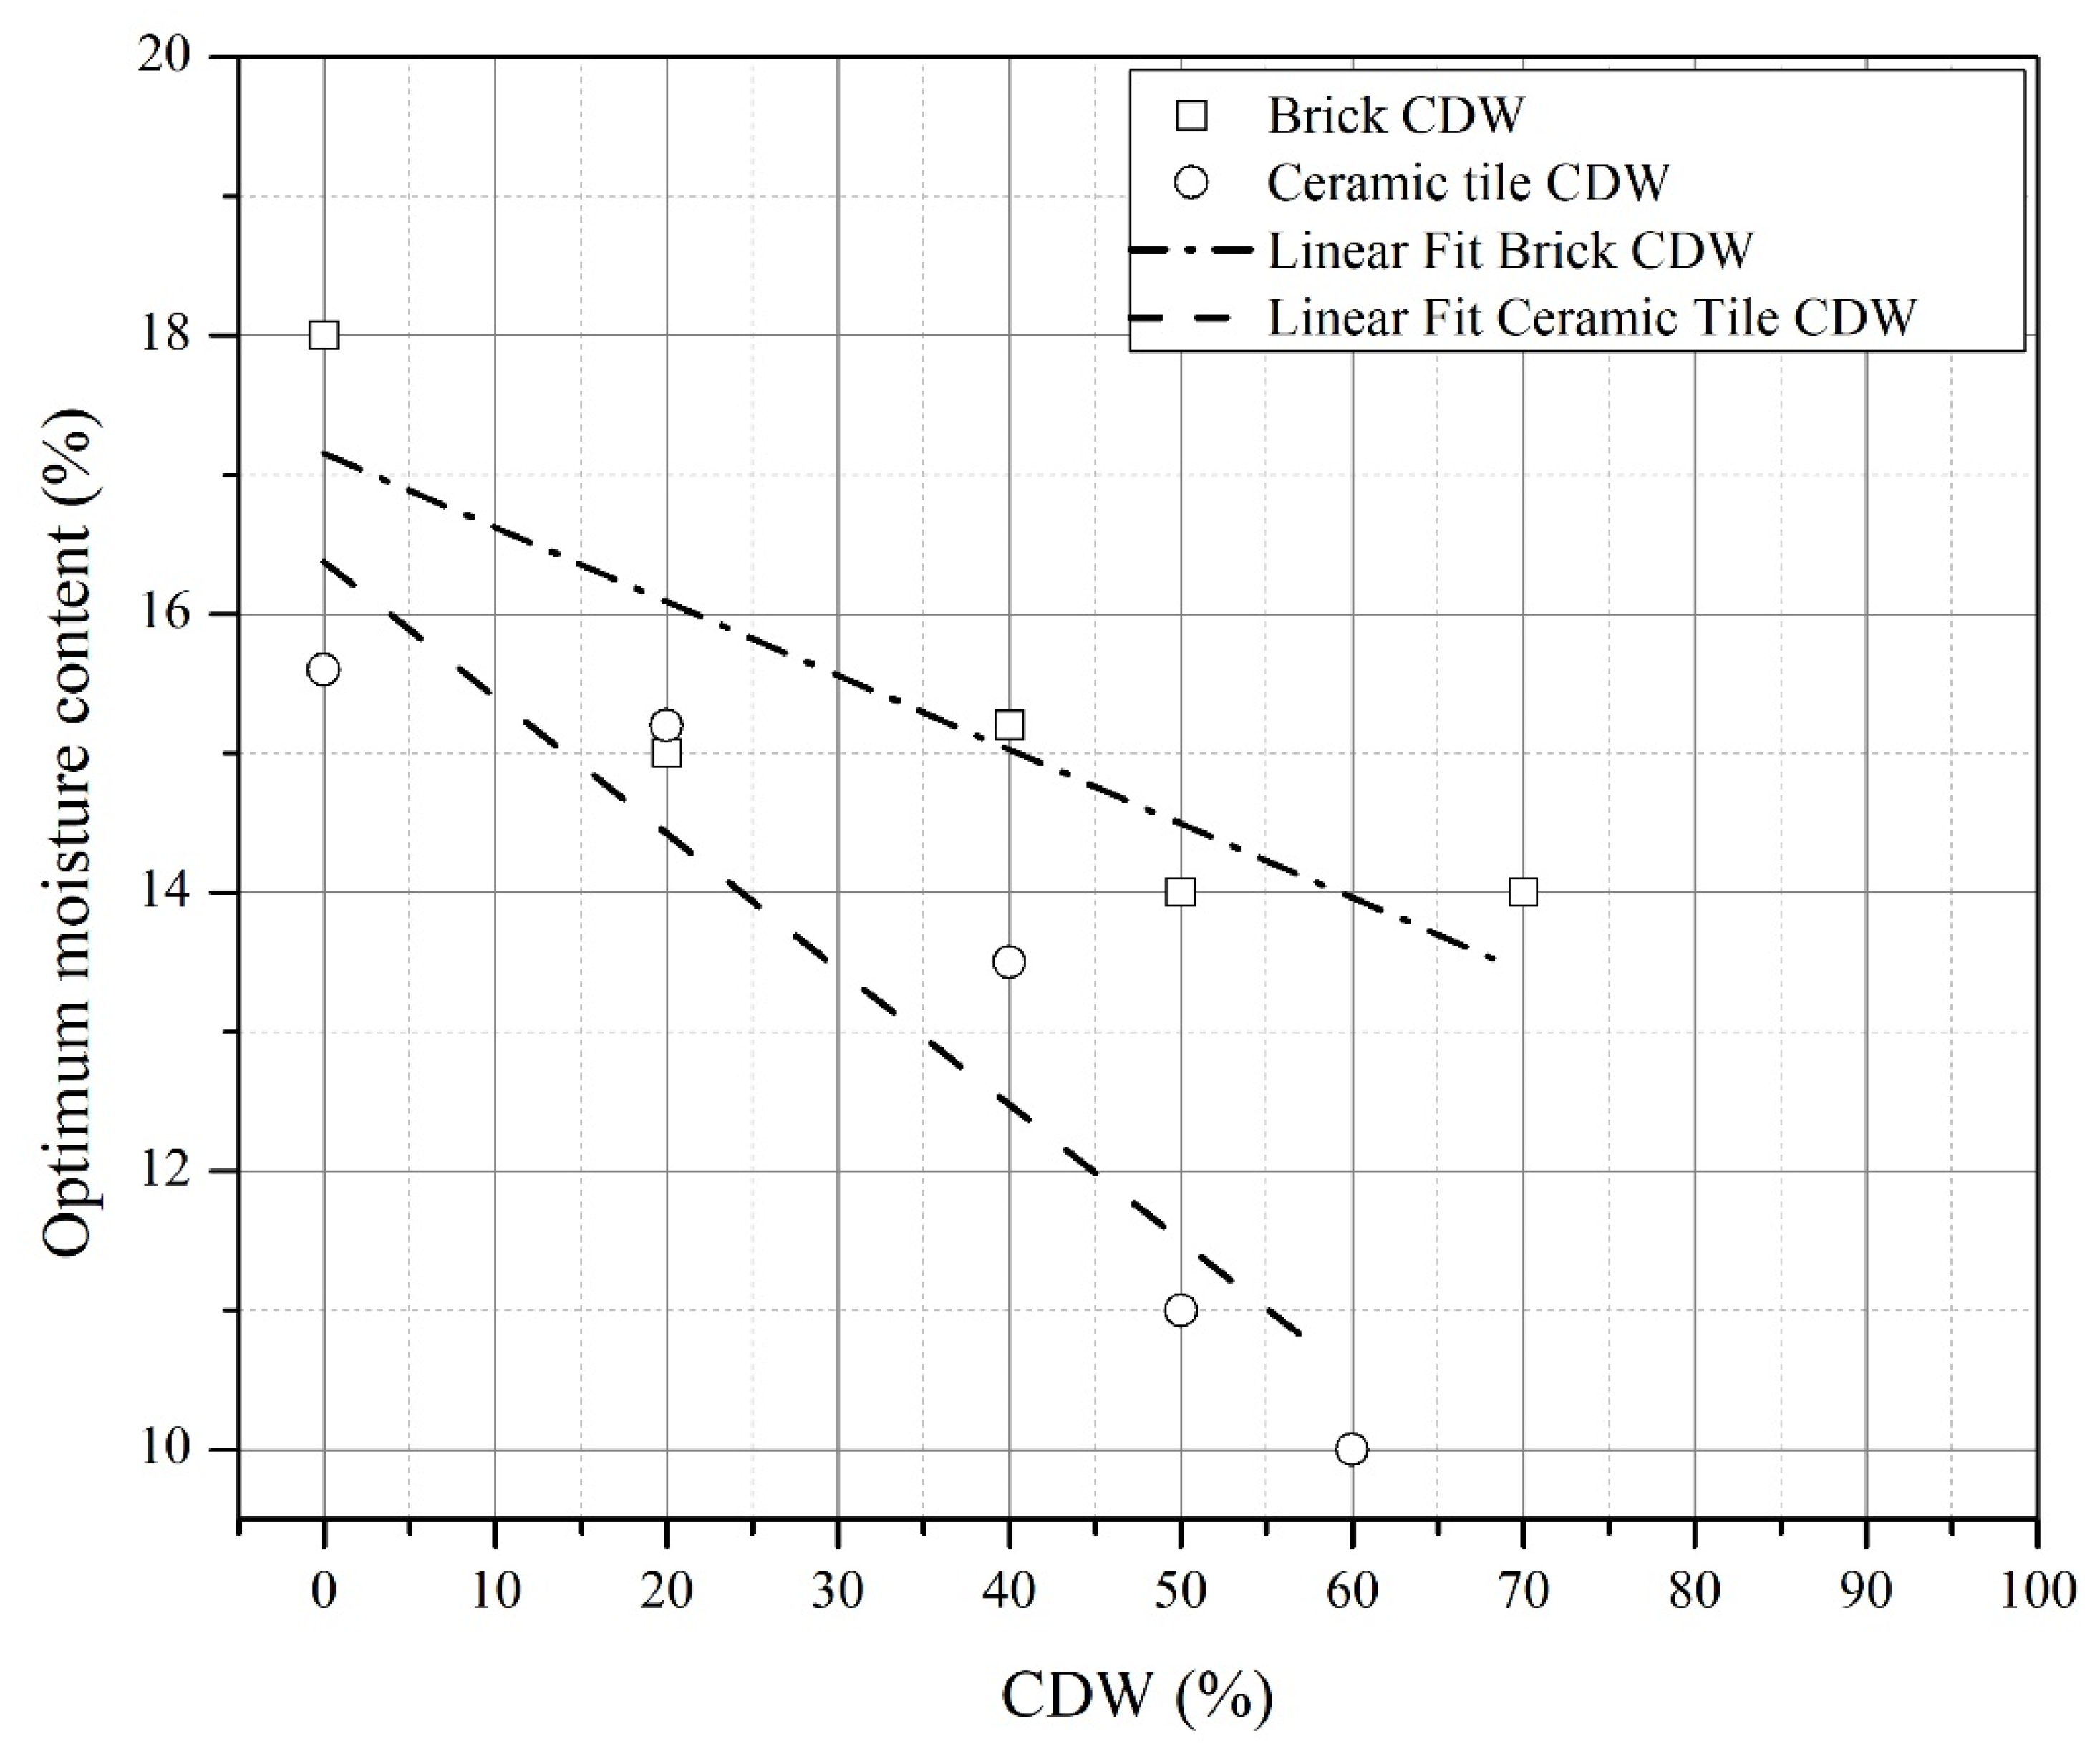
Figure 7) and the optimum moisture content decreased (
Figure 8).
To evaluate the influences of the variables, an ANOVA analysis was performed. Assumptions of independence and normality were verified, and p-values were defined. The null hypothesis consisted in that the stabilizing material factors and addition percentage have no effect on the maximum dry density and optimal humidity response variables. For a significance level α = 0.05 and associated confidence β = 95%, if the p-value is less than α, the null hypothesis is rejected.
According to the p-values obtained in the ANOVA analysis, stabilizer type has a considerable effect on density variation. An increase by 9.5% approximately occurred with ceramic-tile CDW compared to brick CDW. Stabilizer addition was also significant for optimum humidity, tending to decrease its value as the dosage increased. Stabilizer type was also influential on the optimal humidity, presenting an average decrease of 20% when ceramic-tile CDW was added, compared to the use of brick CDW.
These results are consistent with those found for clay and ceramic tile waste mixtures, recycled concrete aggregates (RCA), recycled asphalt concrete fragments (DAP), and natural aggregates (NA) reported by [
25,
26,
39]. They reported that optimal humidity decreases and maximum density increases when the CDW percentage increases. The relationship between these two variables can be observed by the significant decreases in optimum humidity and increases in maximum dry density until 40% waste content. For amounts from 40% to 70%, the results are similar.
4.2. CBR Tests of Soil Mixtures and CDW
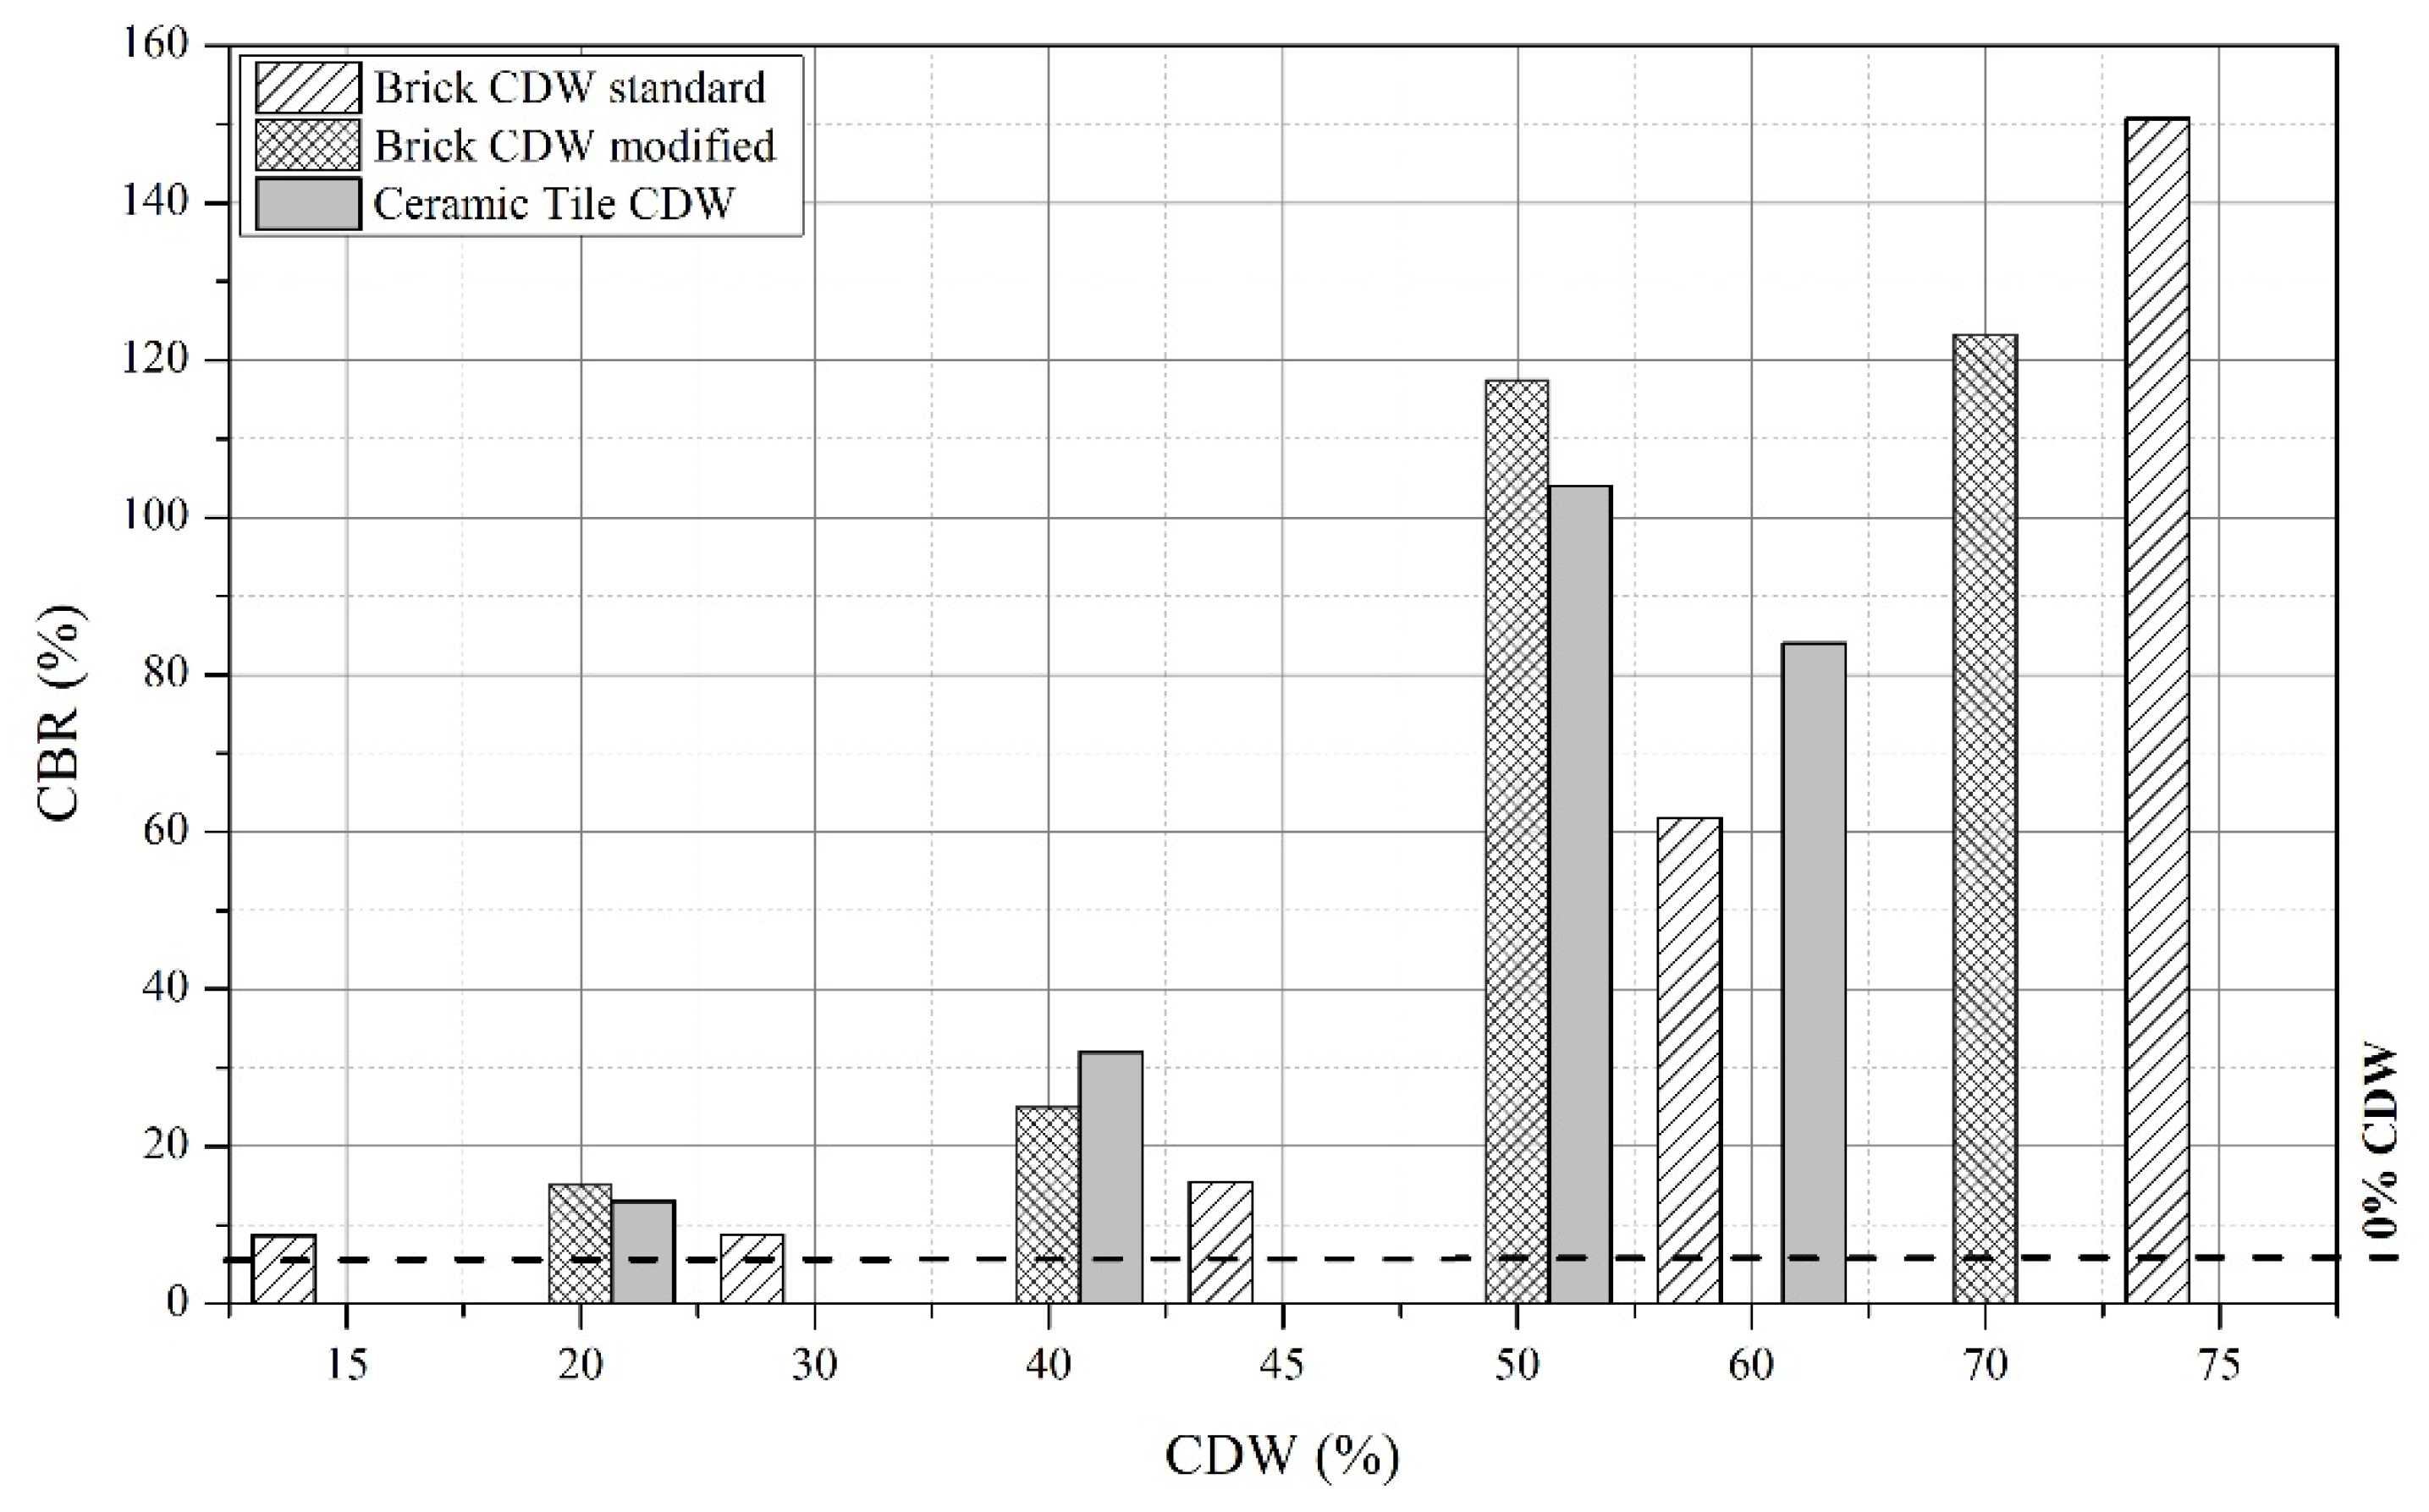
Based on the compaction results, samples were prepared for CBR with the amounts shown in
Table 5. Brick CDW samples with two compaction energies were prepared. The first corresponded to normal energy and the other to modified Proctor energy. For ceramic-tile CDW, only modified energy was used. The preparation followed ASTM D-1883 and ASTM D-1557. CBR values are presented in
Table 6 and
Figure 9. CBR tests were also conducted with brick CDW and 5% Portland cement addition.
The results show a tendency for CBR values to grow with CDW content, exponentially. At low CDW content, CBR values gradually increased as the fine material was being replaced by the granular material. Subsequently, strength increased, and therefore, the CBR value was accelerated due to granular material predominance in the mixture. The increase in CBR value was related to the dry unit weight increase in the compacted material that was identified in the compaction tests. In
Figure 9, a CBR value increase from 2.23% to 120% was observed when 70% of CDW was added. However, the addition of 40% CDW already contributed an important value of more than 1000% in soil CBR increase, one of the most important variables in pavement design. From the results of the ANOVA analysis, it was observed that the stabilizer type and the additional percentage were influential on CBR percentage. In both cases, when CDW was added, that value increased. However, despite a CBR percentage increase with both stabilizer types, it was found that this increase was much greater when using ceramic-tile CDW, with a 60% average compared to the floor with brick CDW.
CBR tests were also conducted with 5% cement addition, showing that there was a great influence of the cementing material on the support relationship. Cement addition increases the CBR value by 4000%. Therefore, cement addition was not varied in the mixtures studied.
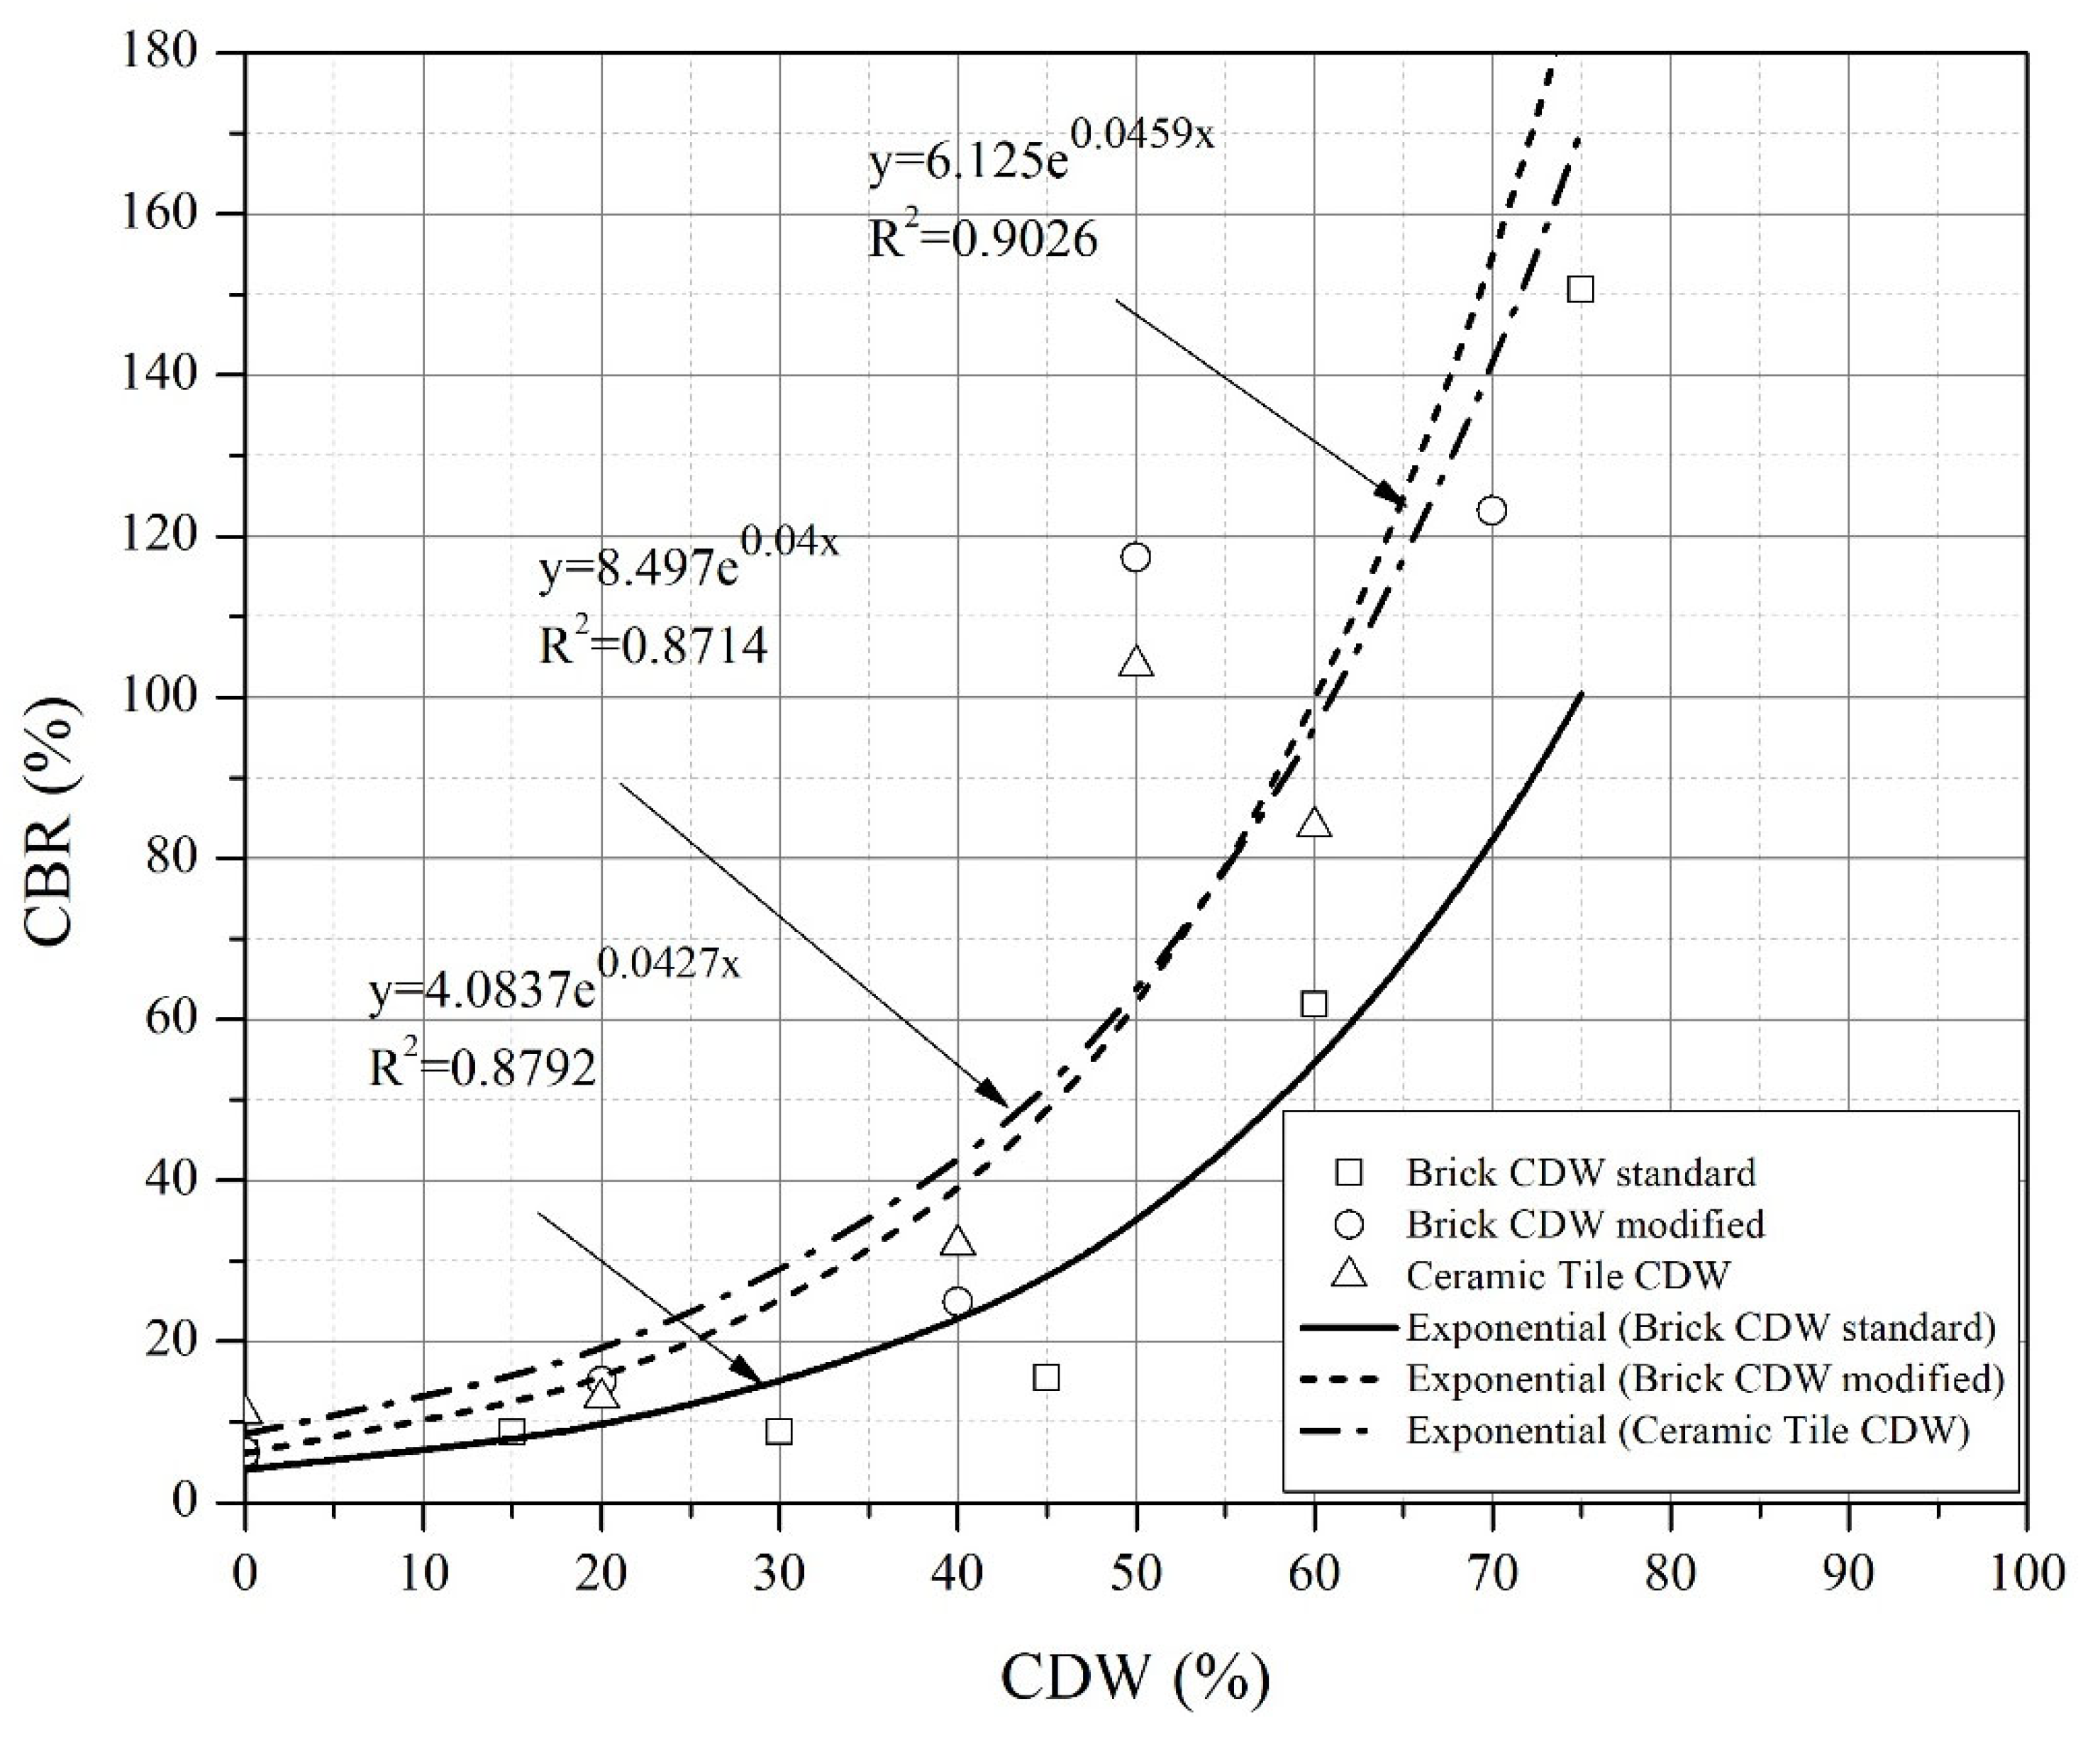
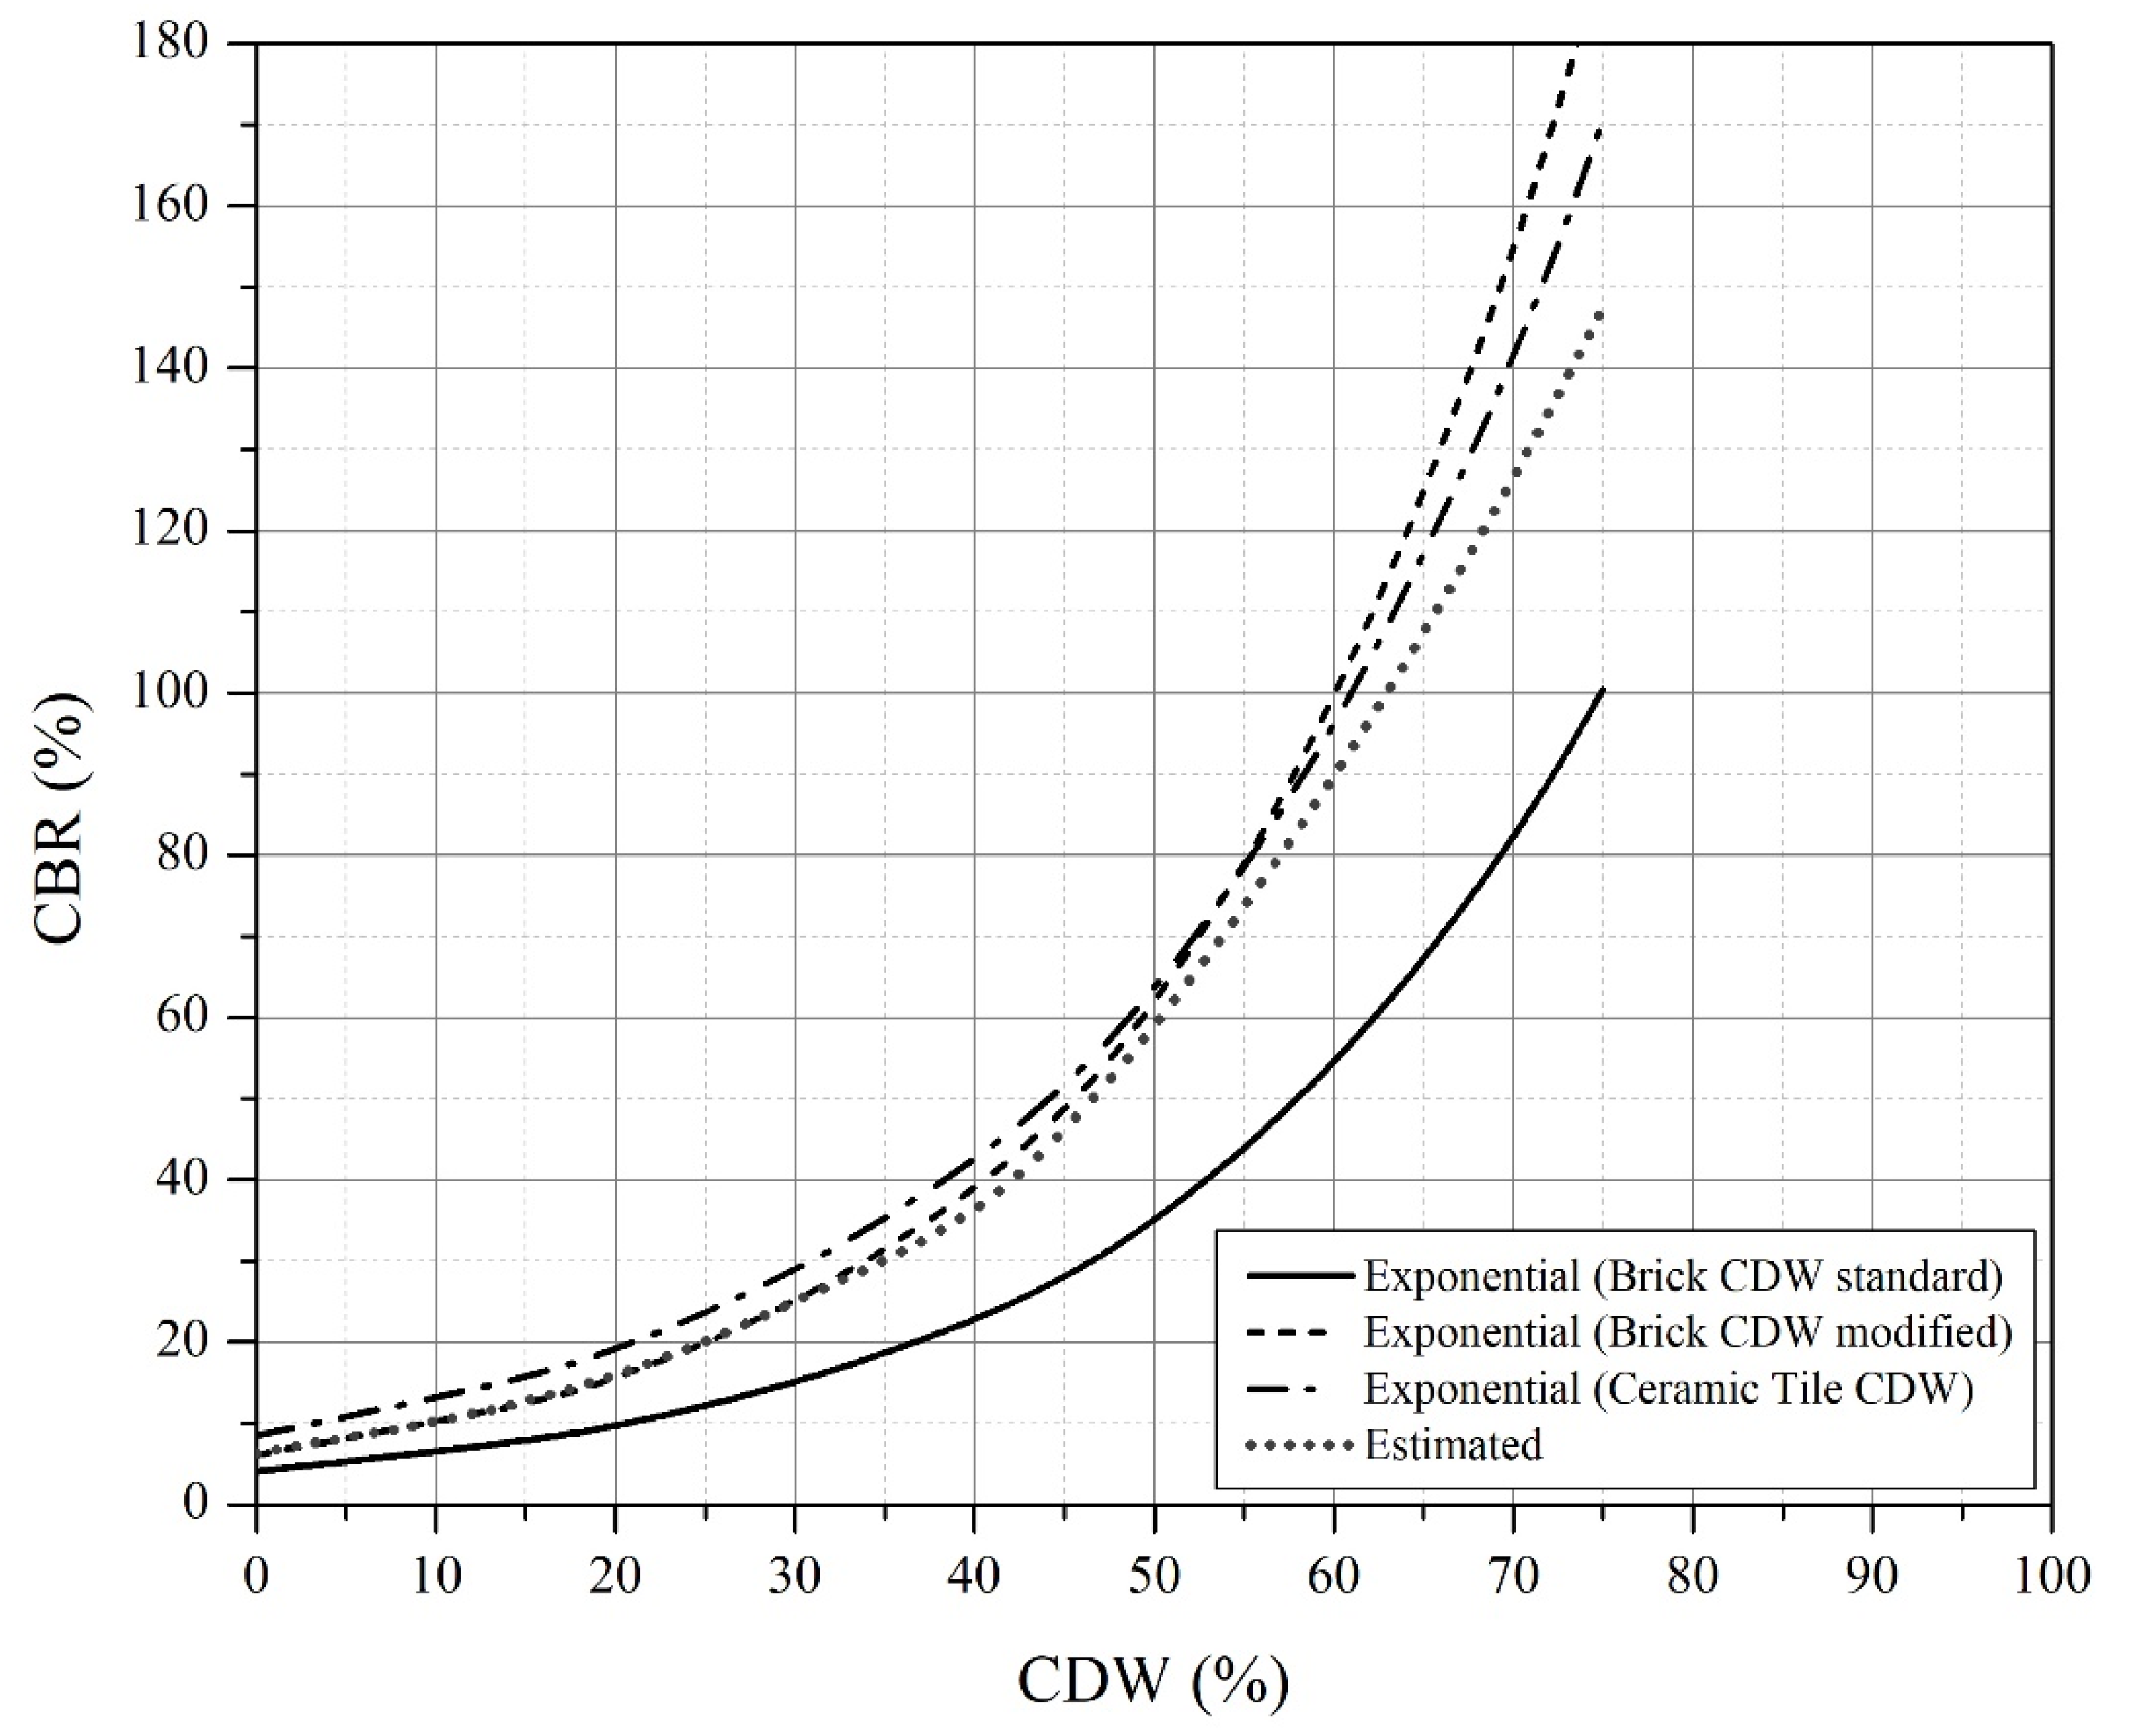
According to the results observed in
Figure 9, a correlation between CBR values and CDW content was established. Thus, a regression analysis was performed, and the best fit functions between brick CDW and ceramic-tile CDW were exponential curves, as shown in
Figure 10, with correlation coefficients greater than 0.7, and this shows that there was a positive correlation between CBR values and the CDW content in the mix. A hypothesis test showed, with a confidence level of 0.05, that a correlation between CBR value and CDW content did not exist. It was observed that materials compacted with normal energy may present lower CBR values, but they also have good correlations.
The trends in different samples are similar, and we are looking for a pavement sizing formula that would better approximate the data found. CBR values for compacted-brick CDW with normal energy were taken and divided into two groups, corresponding to CDW percentages lower and higher than 40%. With these results, an exponential trend was obtained for values less than 40% and a potential for CDW values greater than 40%. The equations obtained for each relation are as follows:
where CDW is the residue content in percent. These equations have 0.98 and 0.99 correlation coefficients, respectively, and provide good CBR value estimates in compacted materials with modified Proctor energy, as shown in
Figure 11.
4.3. Resilient Modulus of Soil Mixtures and CDW
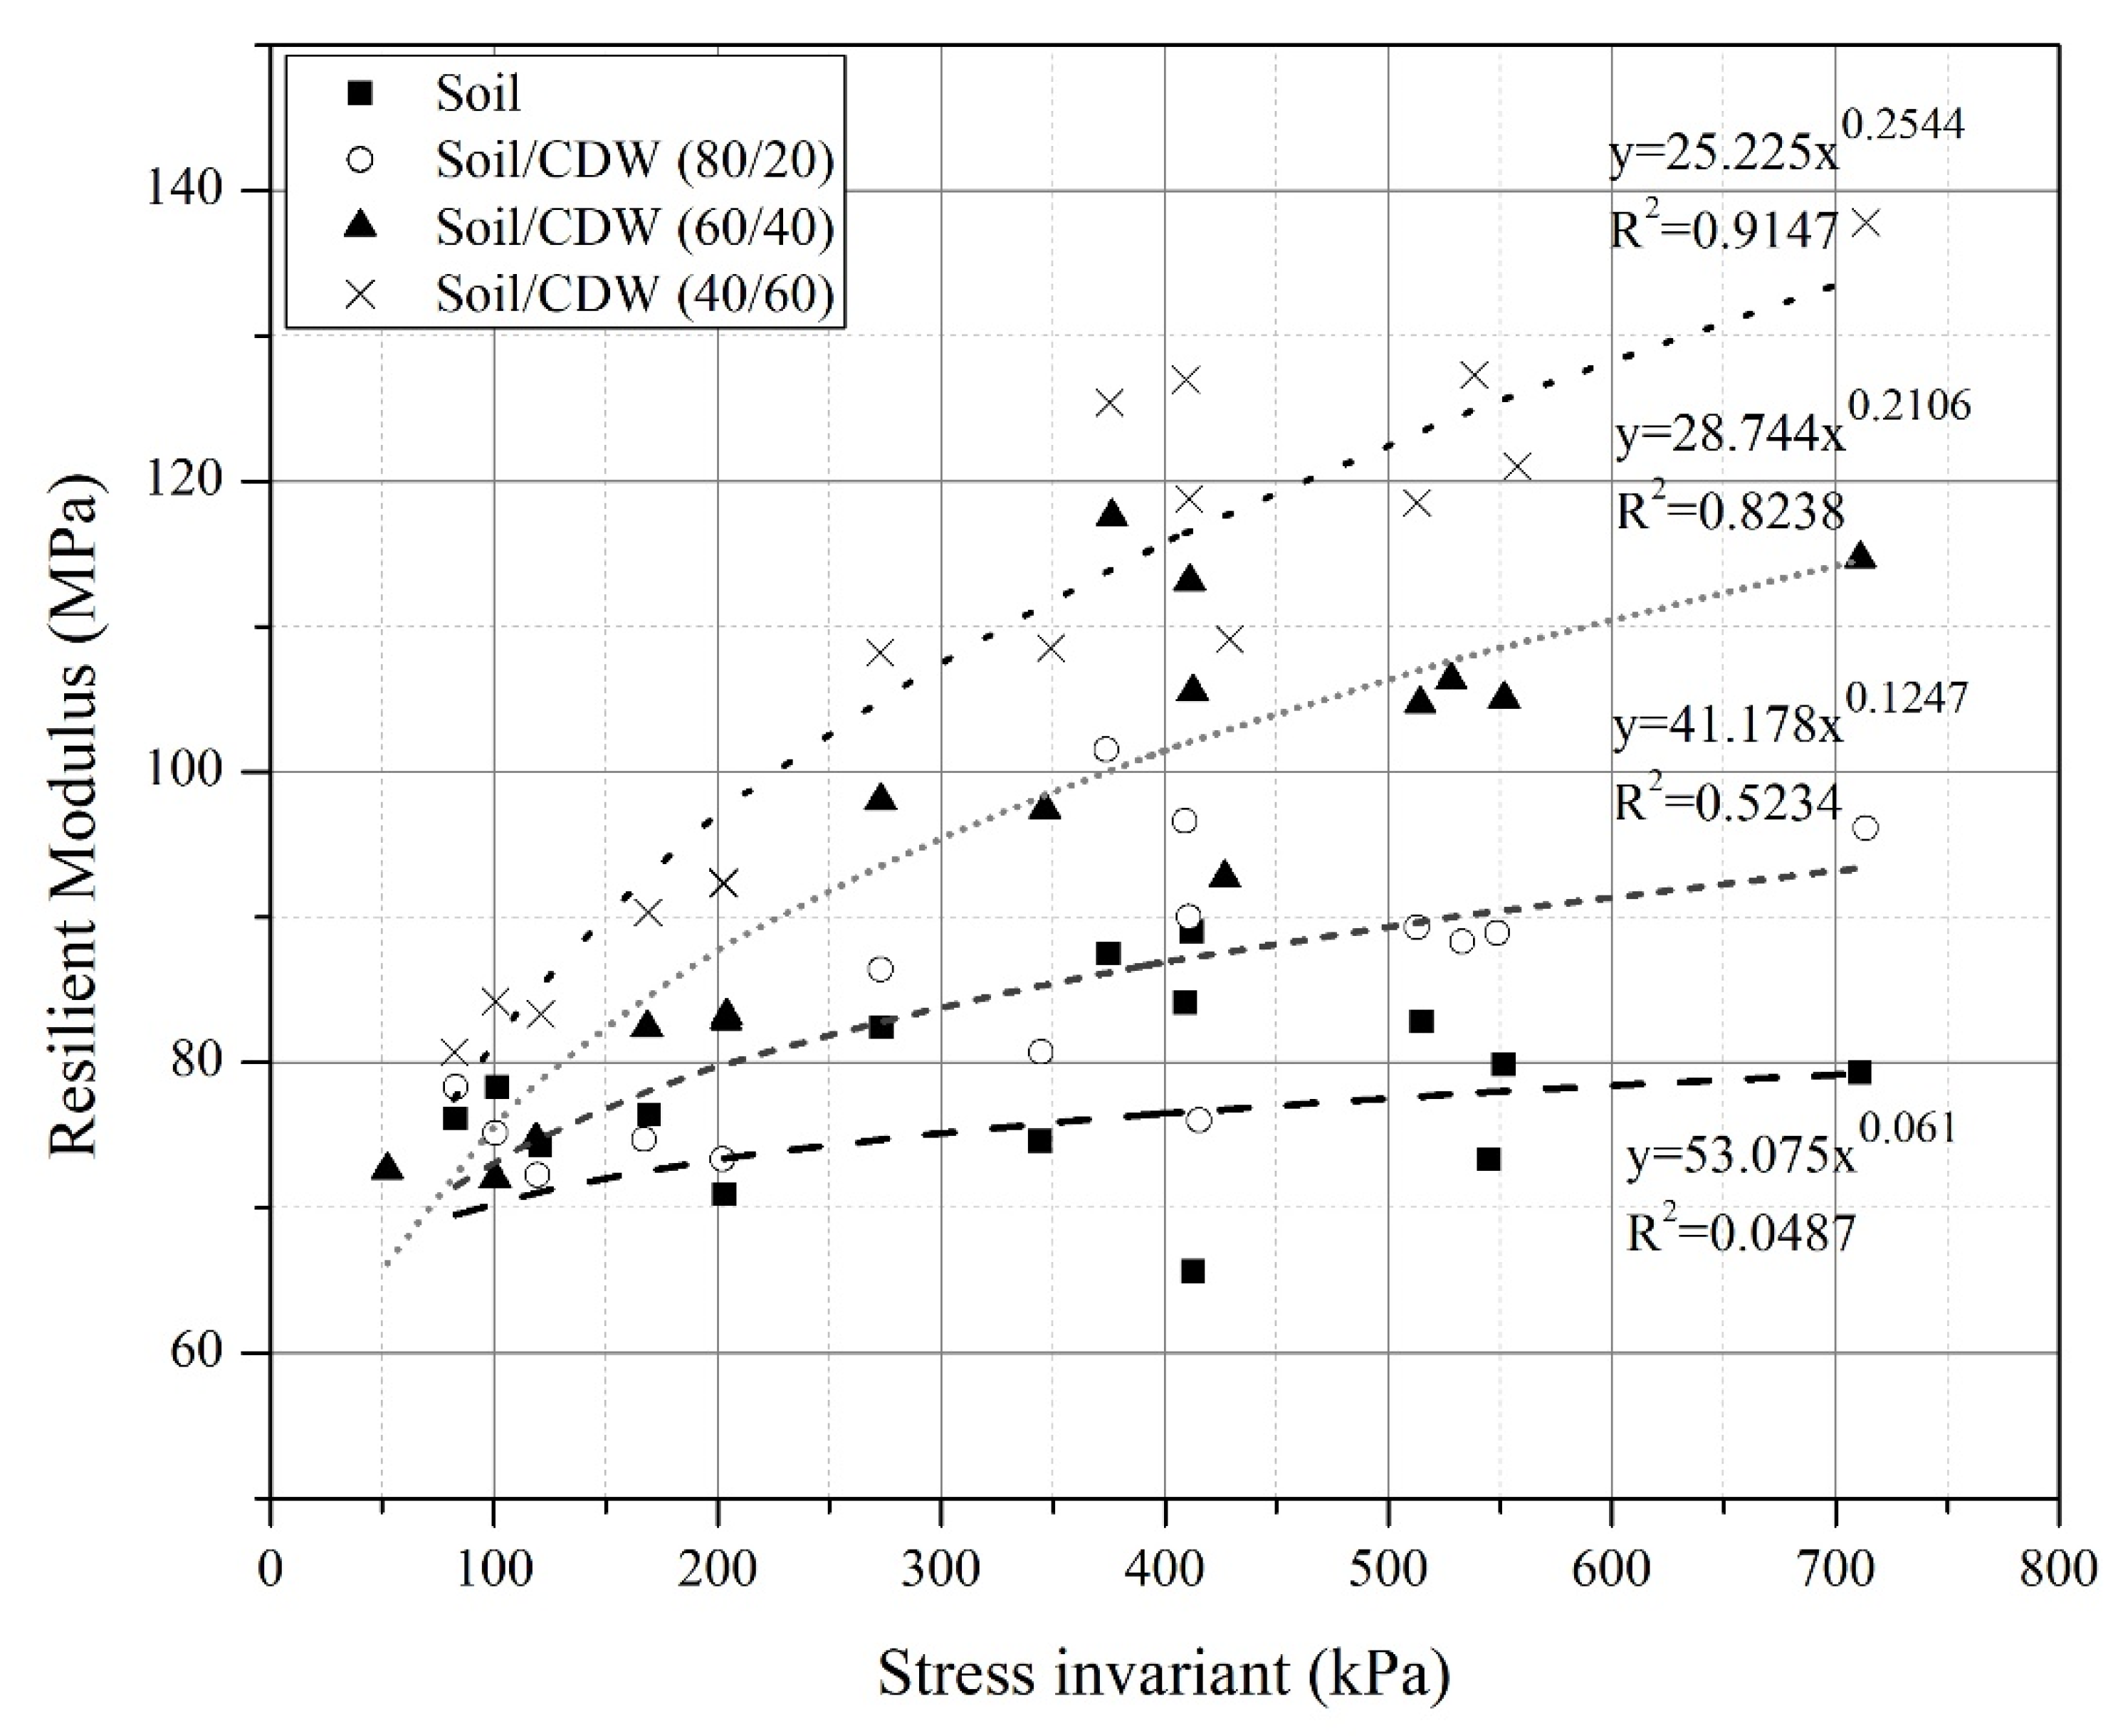
The evaluation of the resilient modulus (RM) was conducted on samples made with brick CDW. Four resilient modulus tests were conducted with residual soil and brick CDW mixtures. As can be seen in
Figure 12, the resilient moduli of the mixtures tended to increase with CWD addition and load cycles, for average values between 70 and 100 MPa. This indicates that CDW addition generated an improvement in the behavior of soil under long-term cyclical loads.
Regarding RM, the results showed an increasing trend with the CDW content. At low CDW contents, the RM increases gradually, as the fine material is being replaced by the granular material. We observed how the modulus increases from a silty soil value of 75 to 100 MPa approximately when the CDW content is 60%.
Figure 12 shows that RM increases more significantly with confinement efforts as the CDW content increases. This trend is consistent with results reported in technical literature by various authors [
28,
40,
41,
42,
43]. They showed that granular base materials have RM values ranging from 213 to 300 MPa and a granular base of about 132 MPa. Another important aspect of the behavior shown in
Figure 12 is that the adjustment of the power curve improves as the CDW content increases because the material becomes more granular. This indicates that the behavior of the material becomes more similar to that of granular bases, presenting correlation coefficient values of around 0.95 [
44]. According to the results presented by [
43], the resilient modulus decreased as base and subbase materials were mixed with increasing percentages of CDW content, and with 60%, the material behaves just like a granular subbase.
4.4. Thickness of Pavement Structure Evaluation
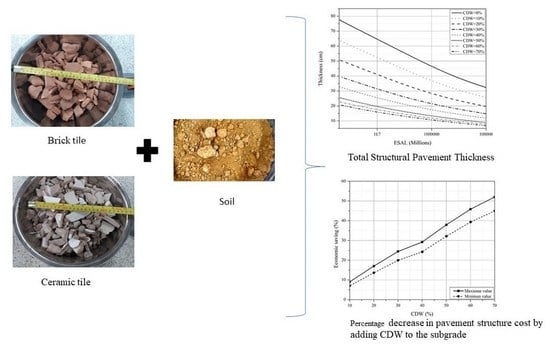
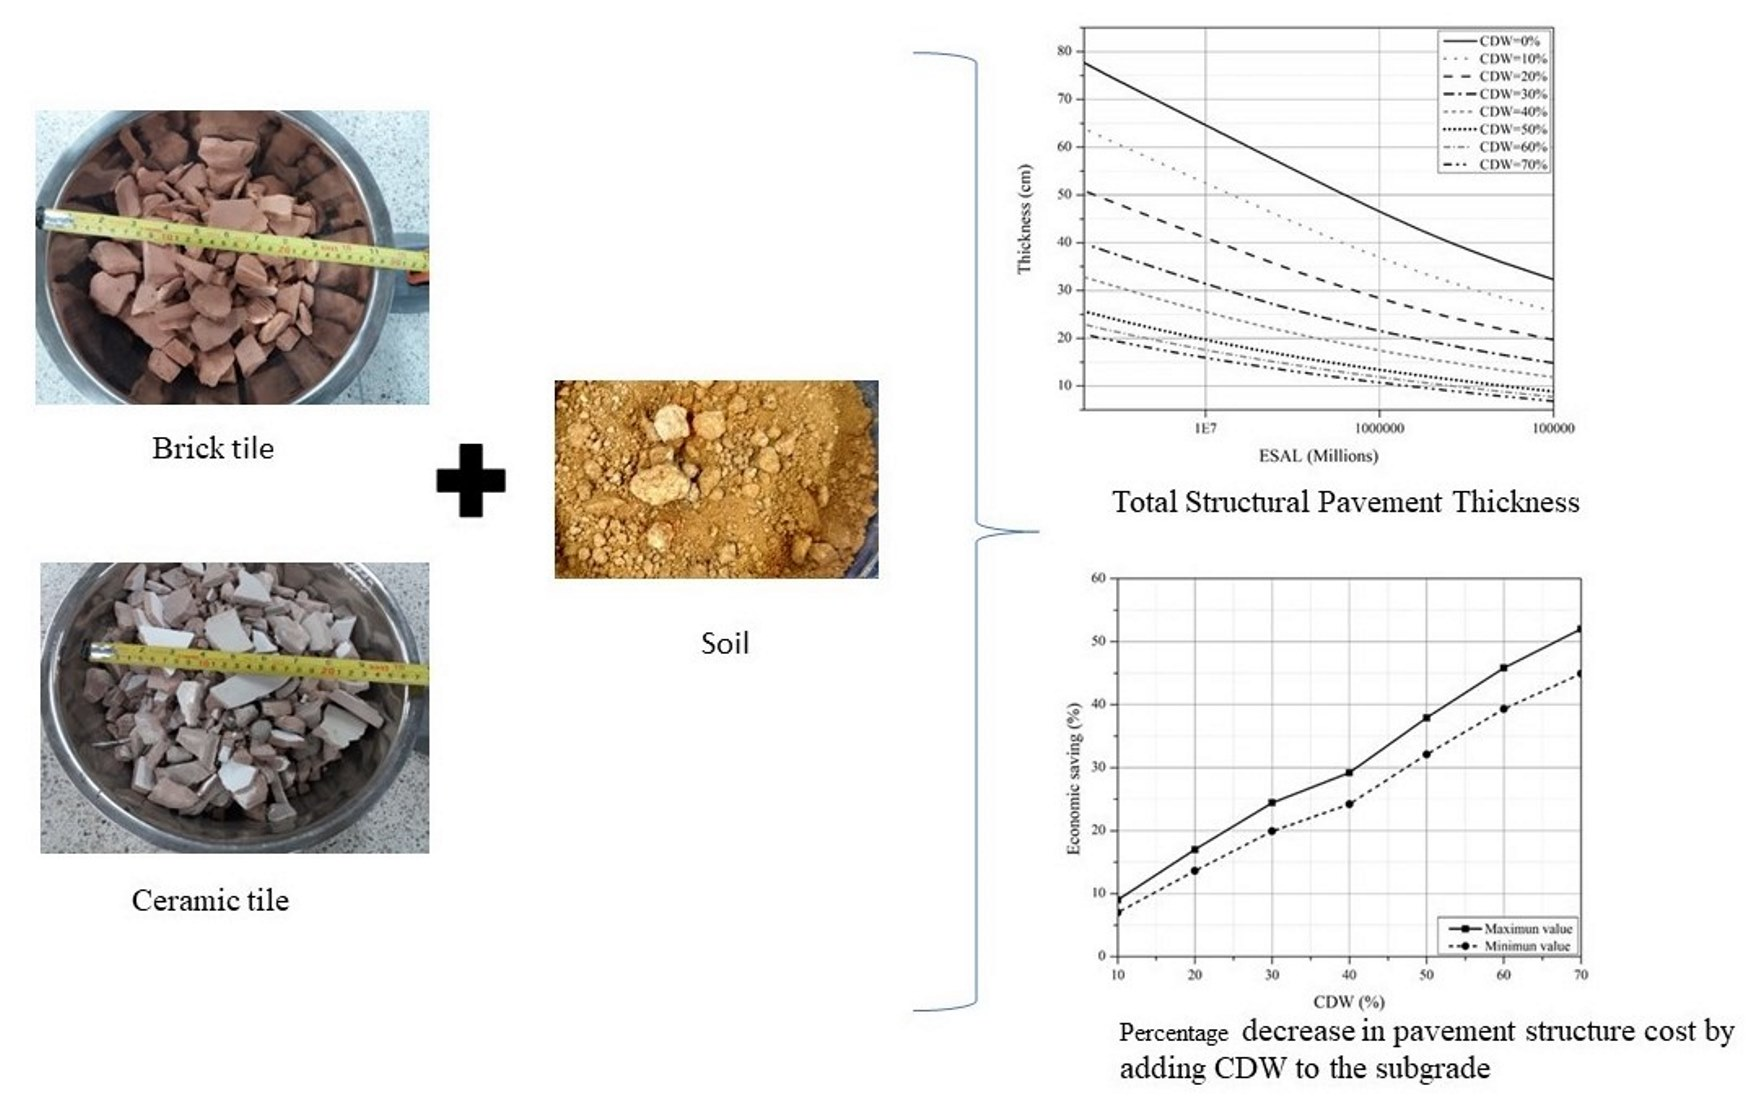
A CBR value increase in these mixes presents an opportunity to use CDW content as a subgrade improvement material, which can lead to thinner, and therefore, more economical pavement structures. This has direct implications for road construction costs, since it is possible to reduce structural thickness layers by improving the subgrade, without jeopardizing their operation or durability.
A parametric analysis was performed when designing the thickness of a pavement structure and calculating CDW content. Using the design parameters in
Table 7, 4000 flexible pavement structures were calculated, using the AASHTO-93 method, to evaluate the subgrade’s impact on soil improvement, and the CDW content’s influence on the structural thickness variations of a conventional structural configuration: granular subbase, granular base, and asphalt layer, according to the design parameters established in
Table 7.
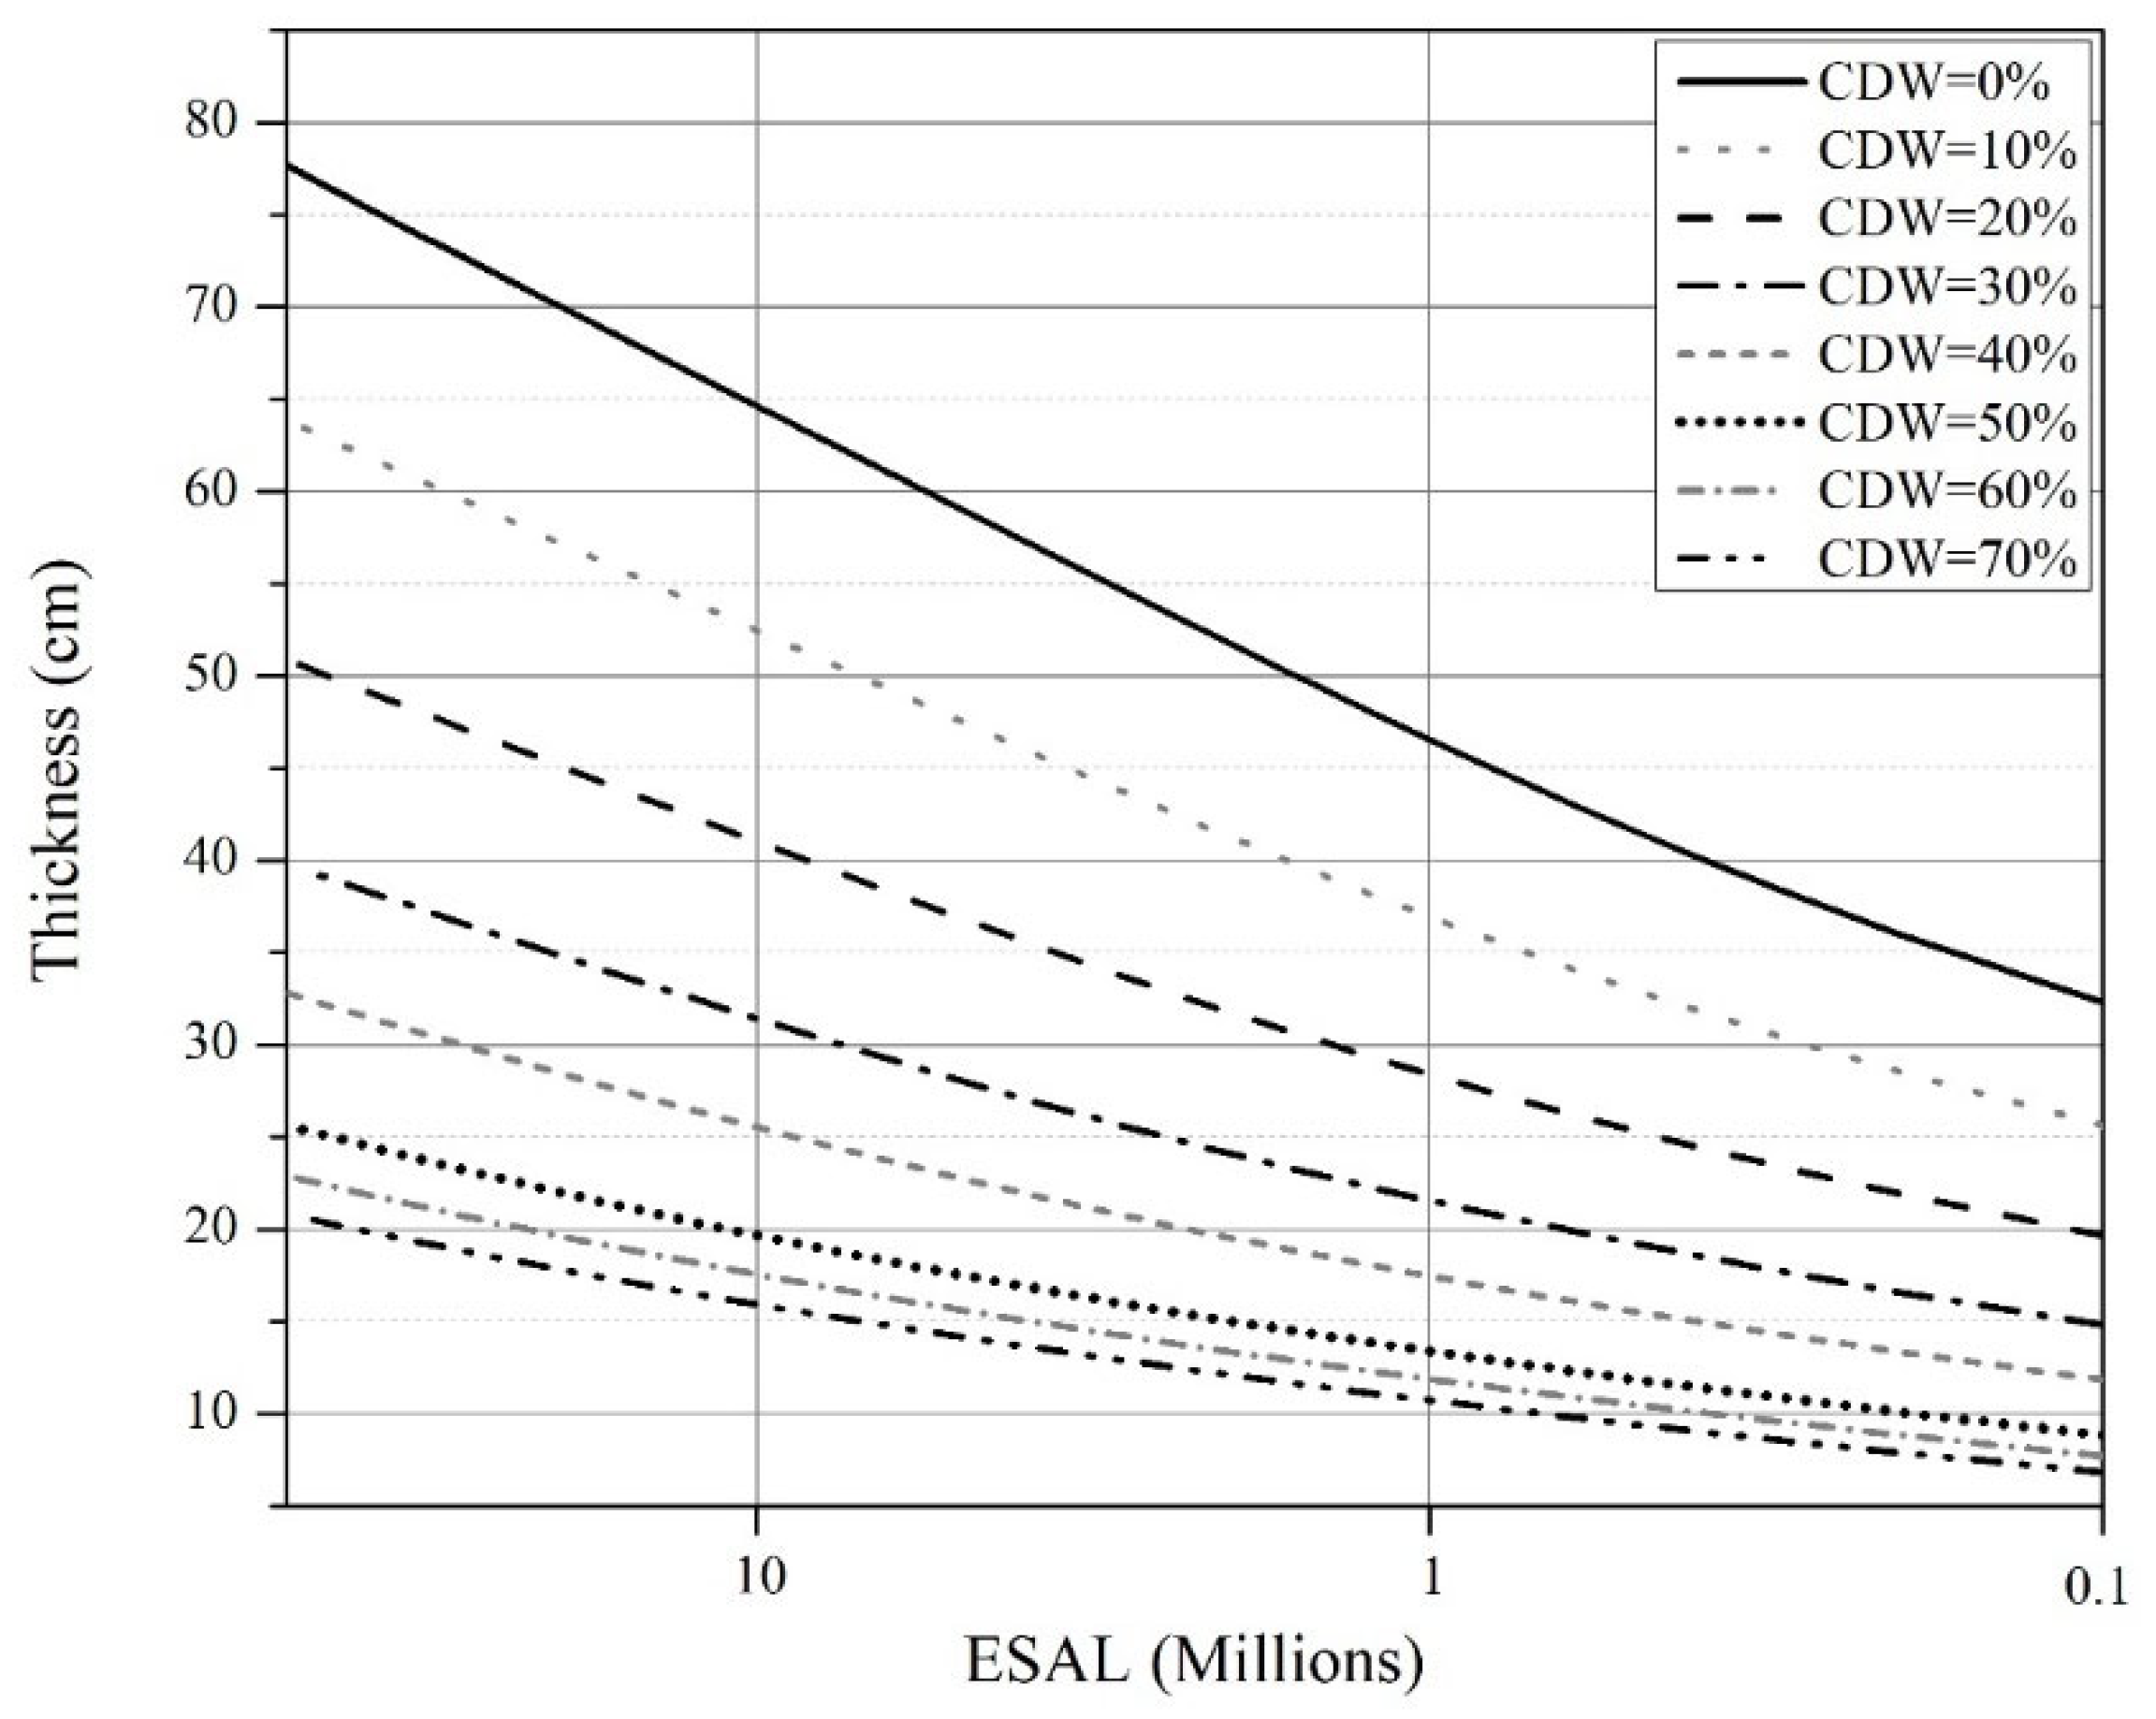
In
Figure 13, the thicknesses of structures with improved subgrade were compared among the different percentages of CDW content, while considering the structure of natural soil. Progressive decreases in thickness occurred as CDW content was increased up to 70%. For contents greater than 50%, the decrease in total structural thickness was not significant.
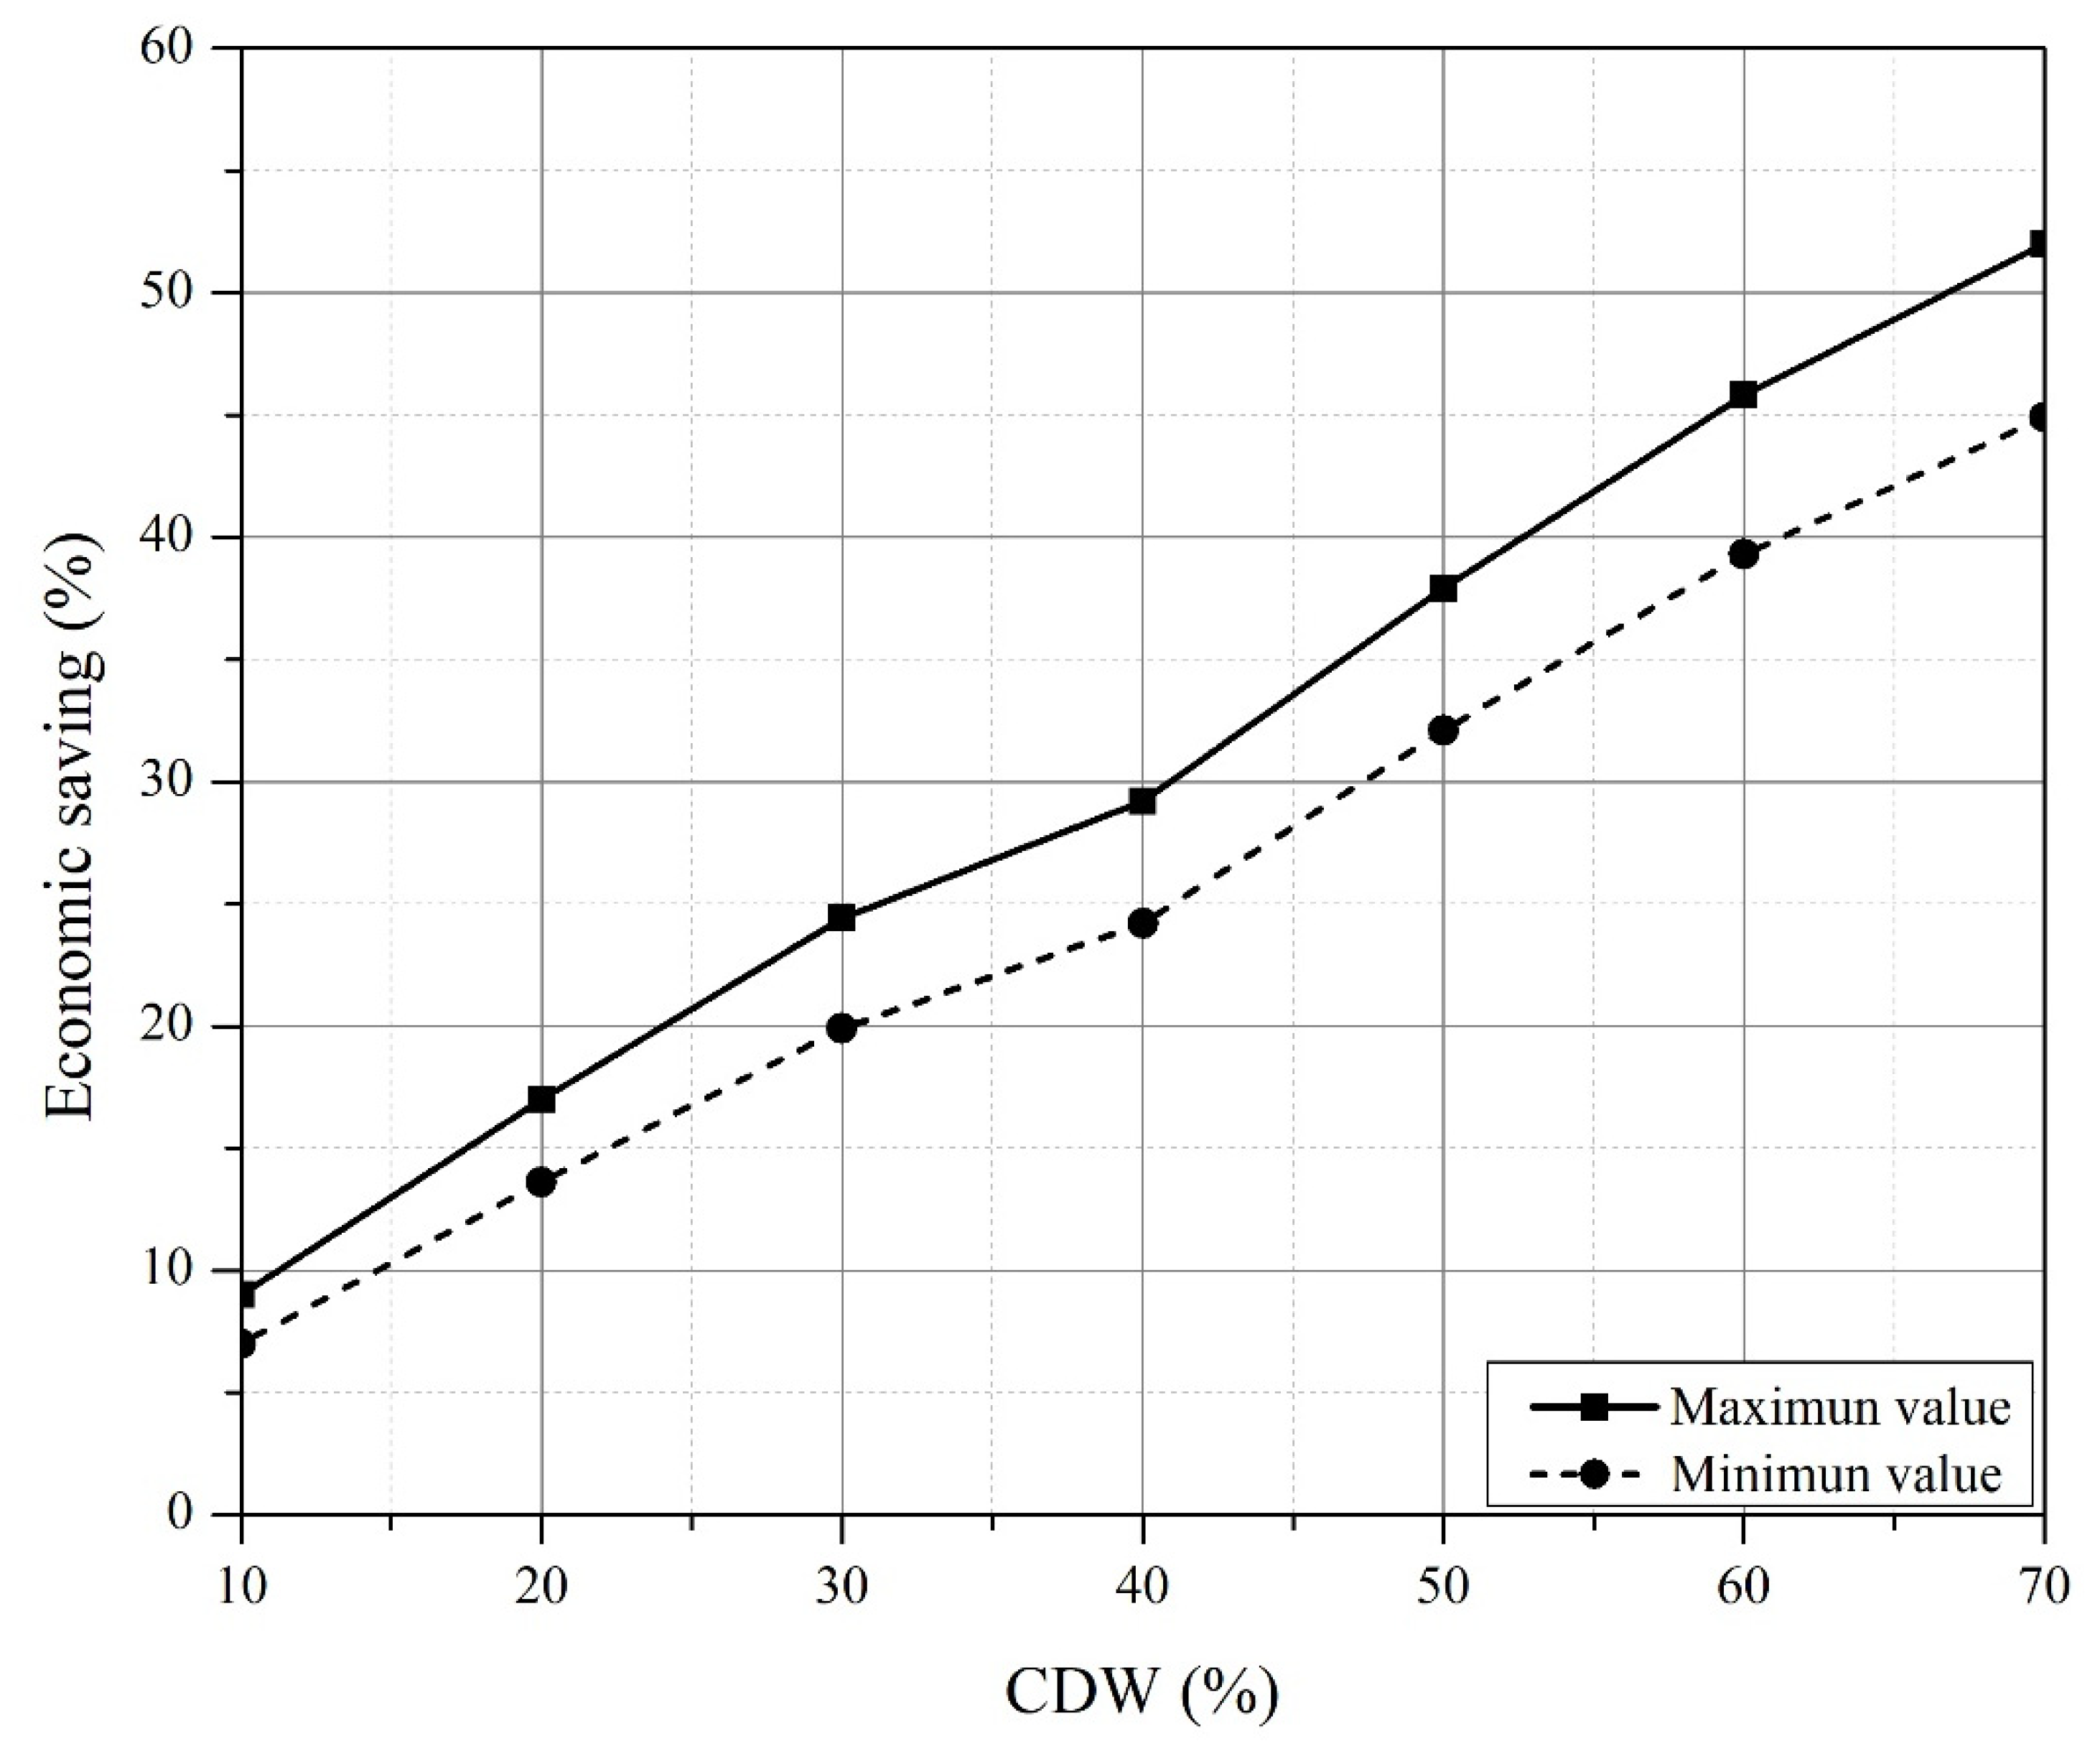
Figure 14 showed how the cost associated with the materials of the structures progressively decreased when CDW content increased, with values from 7% to 52%. The granular sub-base thickness progressively decreased till CDW contents of 30%, which was associated with a subgrade strength greater than the resilient modulus of the granular sub-base. Therefore, it is not required for higher CDW contents. Granular base thickness was reduced with CDW contents from 30% to 50%, and the resistance of the soil exceeded the mechanical conditions of the material, so that stabilized subgrade with higher CDW contents did not require the incorporation of a granular layer. Asphalt concrete layer thickness began to decrease for CDW contents above 40%, reaching reductions of up to 30%.
Although the increase in CDW percentage progressively decreased structural pavement thicknesses to obtain higher mechanical strength conditions that suppress the implementation of granular materials. The structural behavior of the pavement during the design period depends on conditions in addition to the ground strength. Physical and geotechnical characteristics such as hardness, durability, cleanliness, and the geometry of the particle associated with granular materials (bases and sub-bases) are integrated into the mechanical behavior to guarantee structure durability. Therefore, the structures that linked layers of granular materials present greater reliability in complying with the pavement design period before failure—that is, pavement configurations associated with CDW content up to 40%. For higher CDW contents, where pavements composed exclusively of asphalt were obtained, complying with all the indicated conditions cannot be guaranteed; even more so, its durability in the design period cannot be guaranteed. These results show a trend comparable with results by [
25,
26] who found that with a 150 mm layer of a mixture of clay and CDW from 5 to 30%, reductions from 40 to 130 mm were obtained. However, the decrease in thickness was greater in this research.
In
Figure 15, the change in the mechanical behavior of the stabilized soil, for CDW contents higher than 40%, considerably modified the variation in the required granular base thickness. The change induced in the soil strength made it possible that for values surpassing 50%, the granular base could be suppressed. For higher CDW values, asphalt layer thickness began to decrease, and this generated low exchange rates regarding thickness, but high regarding associated costs.
5. Conclusions
Soil and material mixtures from crushed brick or ceramic tile, studied in this work, presented mechanical characteristics that made them applicable as materials for subgrade improvement in pavement construction. They provide a technically viable alternative for CDW reuse in engineering projects and allow lower structural pavement layer thickness.
Soil and CDW mixtures became more manageable as the CDW content increased. This was observed in the increase in the maximum dry density and an optimum compaction moisture decrease. This allows the compaction process to be more efficient, and layers of material with greater rigidity and strength can be obtained. However, for CDW contents greater than 30%, no appreciable changes in density or moisture content were observed, and this is because it is considered that to improve the manageability of silty soils. Note that 30% of CDW is the optimal content of added material.
The strength and stiffness of soil and CDW mixtures increase with CDW content. It is observed that the strength given by the CBR values increased gradually to contents of about 40%, and for higher values it grew exponentially. The RM of these mixtures presented significant increases for all the contents of CDW evaluated, and with contents of 60%, the resilient modulus was close to the values required for granular subbases.
Considering the pavement configuration analyzed (granular subbase, granular base, and asphalt layer), CDW content from 0 to 30% decreased the granular subbase thickness until excluding it; from 30% to 50%, the thickness of the granular base decreased; and for CDW content greater than 50%, granular materials were not required, because the mechanical soil strength was greater. The CDW subgrade addition in soil implied a pavement cost reduction from 7% to 52%. However, the structural behavior of the asphalt layer in the improved soil does not guarantee the durability of the pavement and the fulfillment of its service life, since it does not incorporate essential geotechnical conditions, including hardness, durability, cleanliness, and geometry of the pavement particles.
Given the need to guarantee physical and geotechnical conditions other than the strength to obtain the useful life of the pavement. The most suitable structures to be implemented in construction processes were those whose foundation soil has CDW contents of up to 40% because they preserve a reliable interface of improved subgrade, granular material, and asphalt layer, considering the conception and structural scope of the design method.


