
Experimental and Numerical Analysis of Reinforced Concrete Columns under Lateral Impact Loading
Abstract
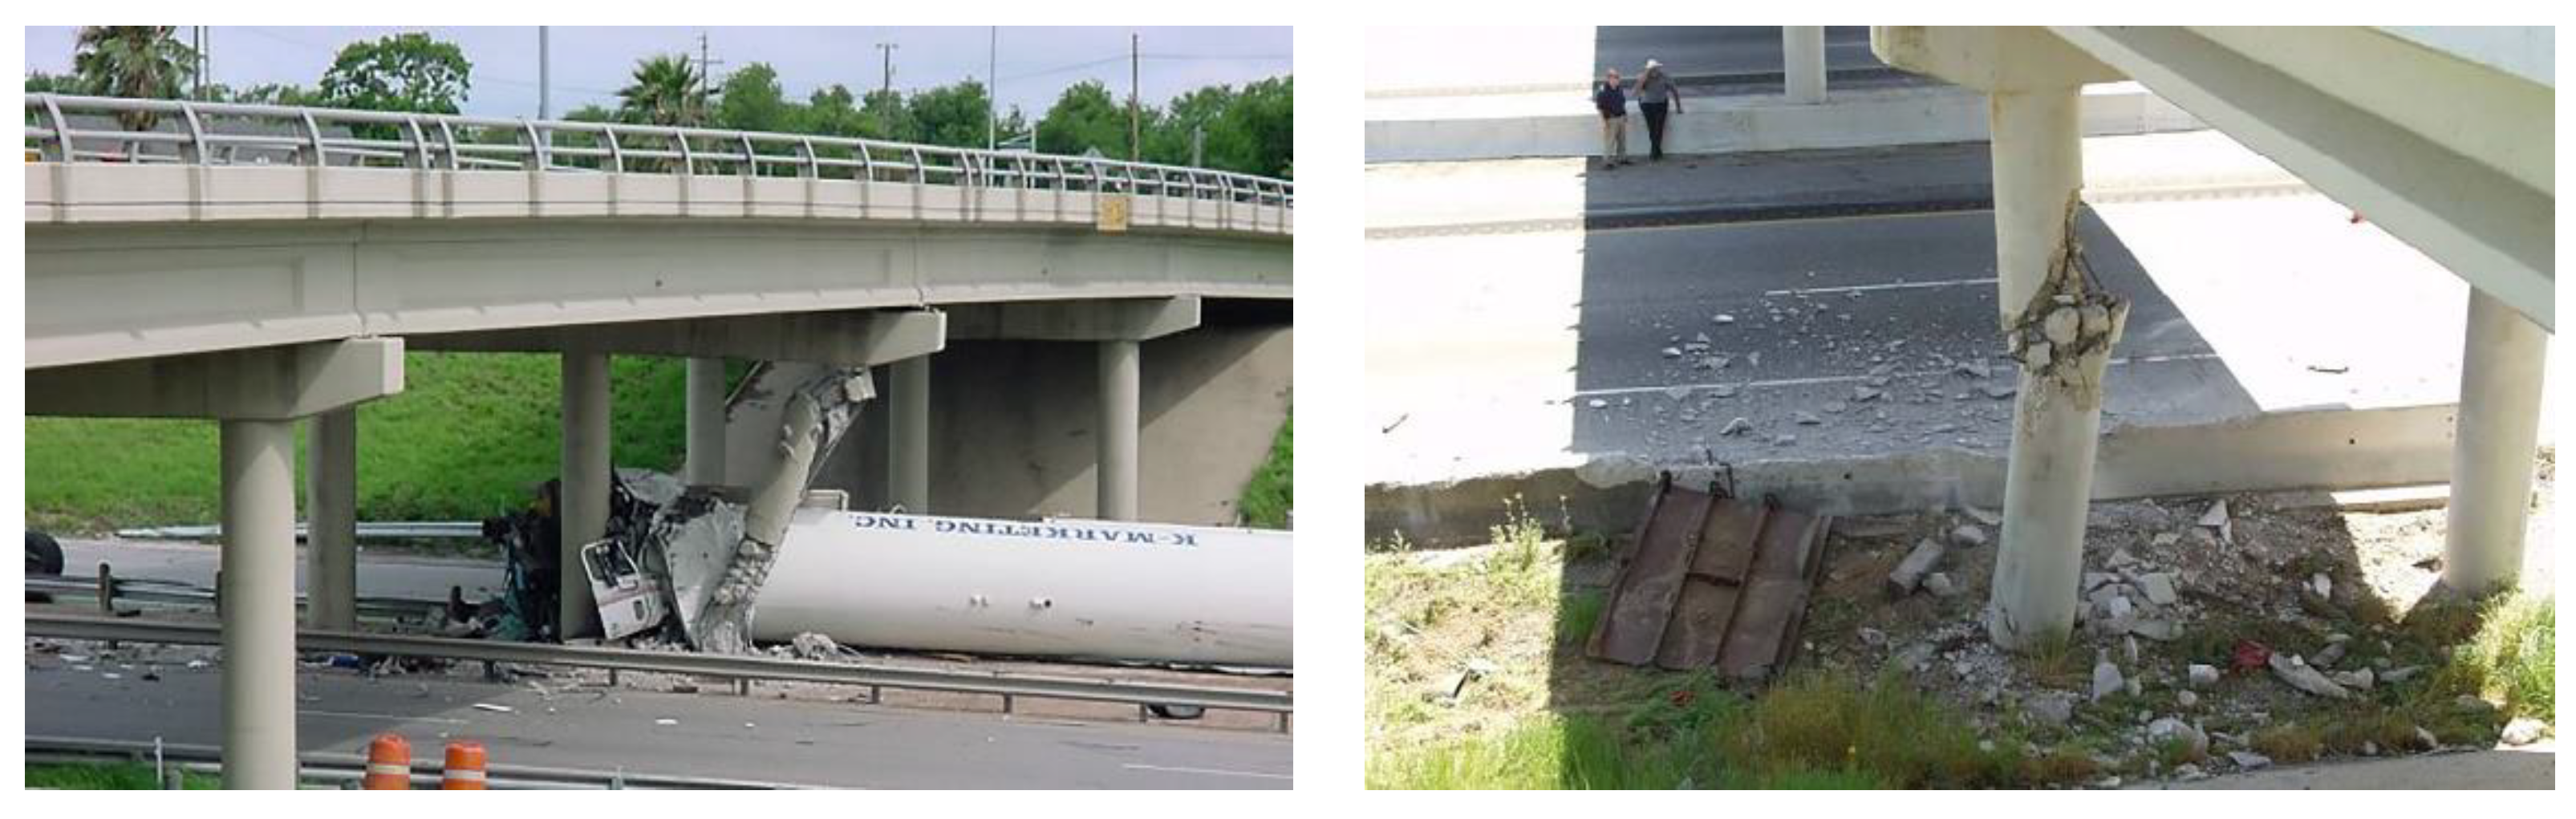
:1. Introduction
2. Impact Test
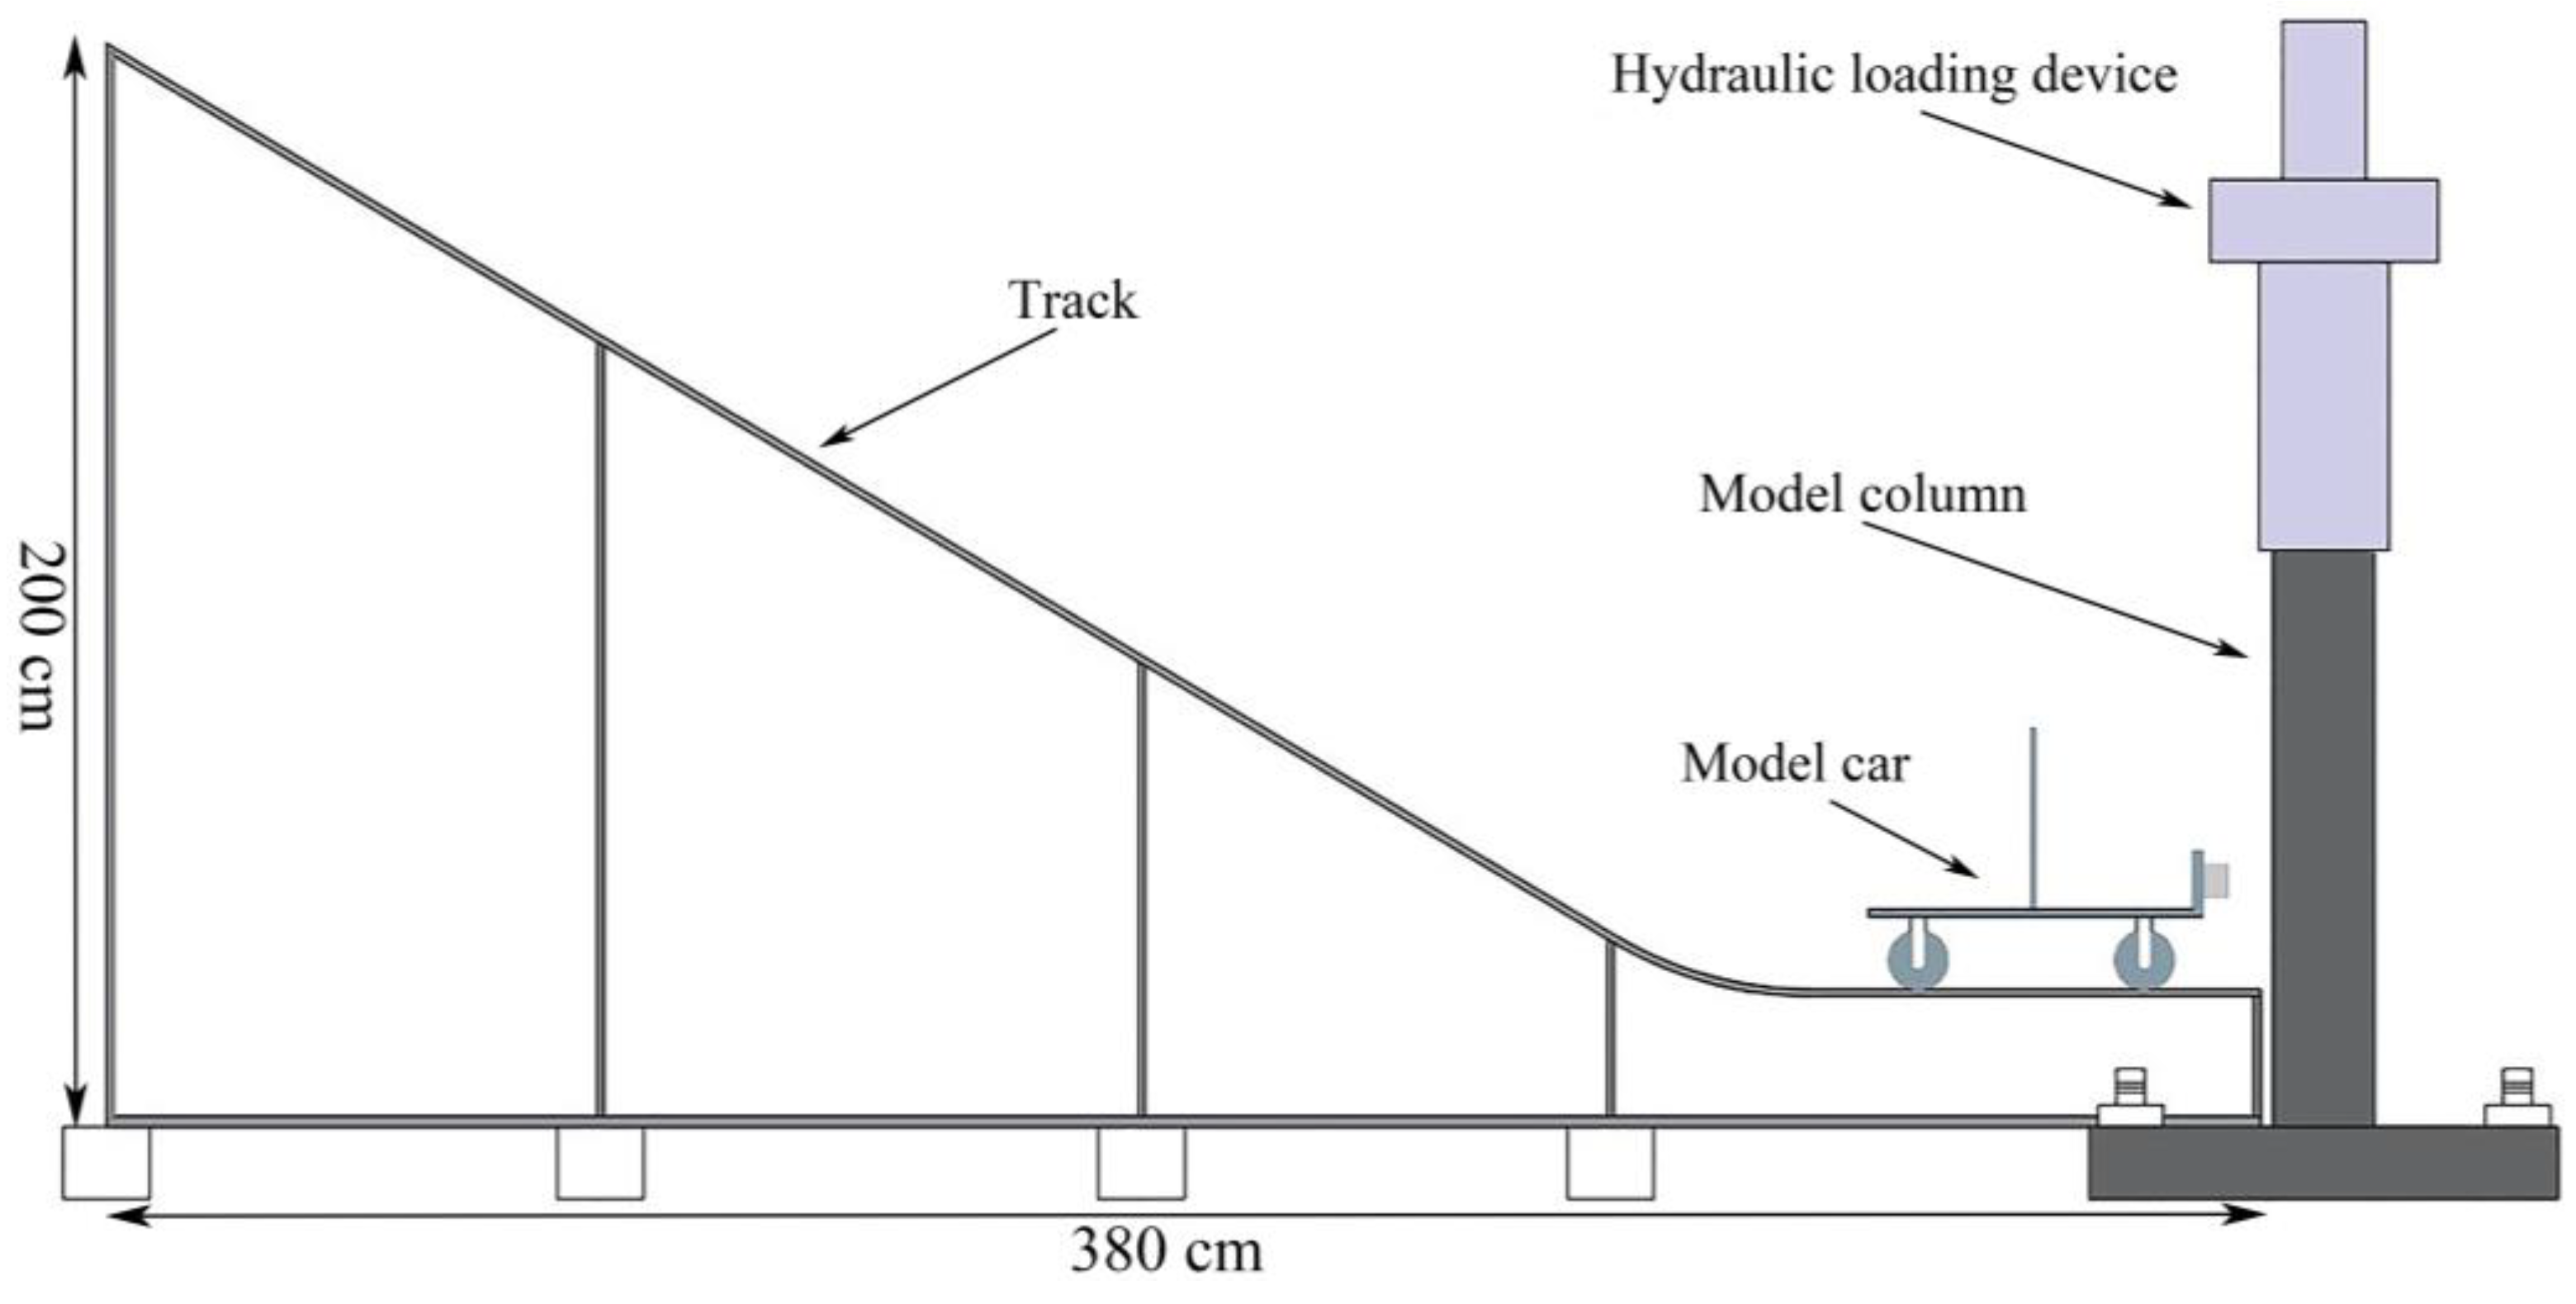
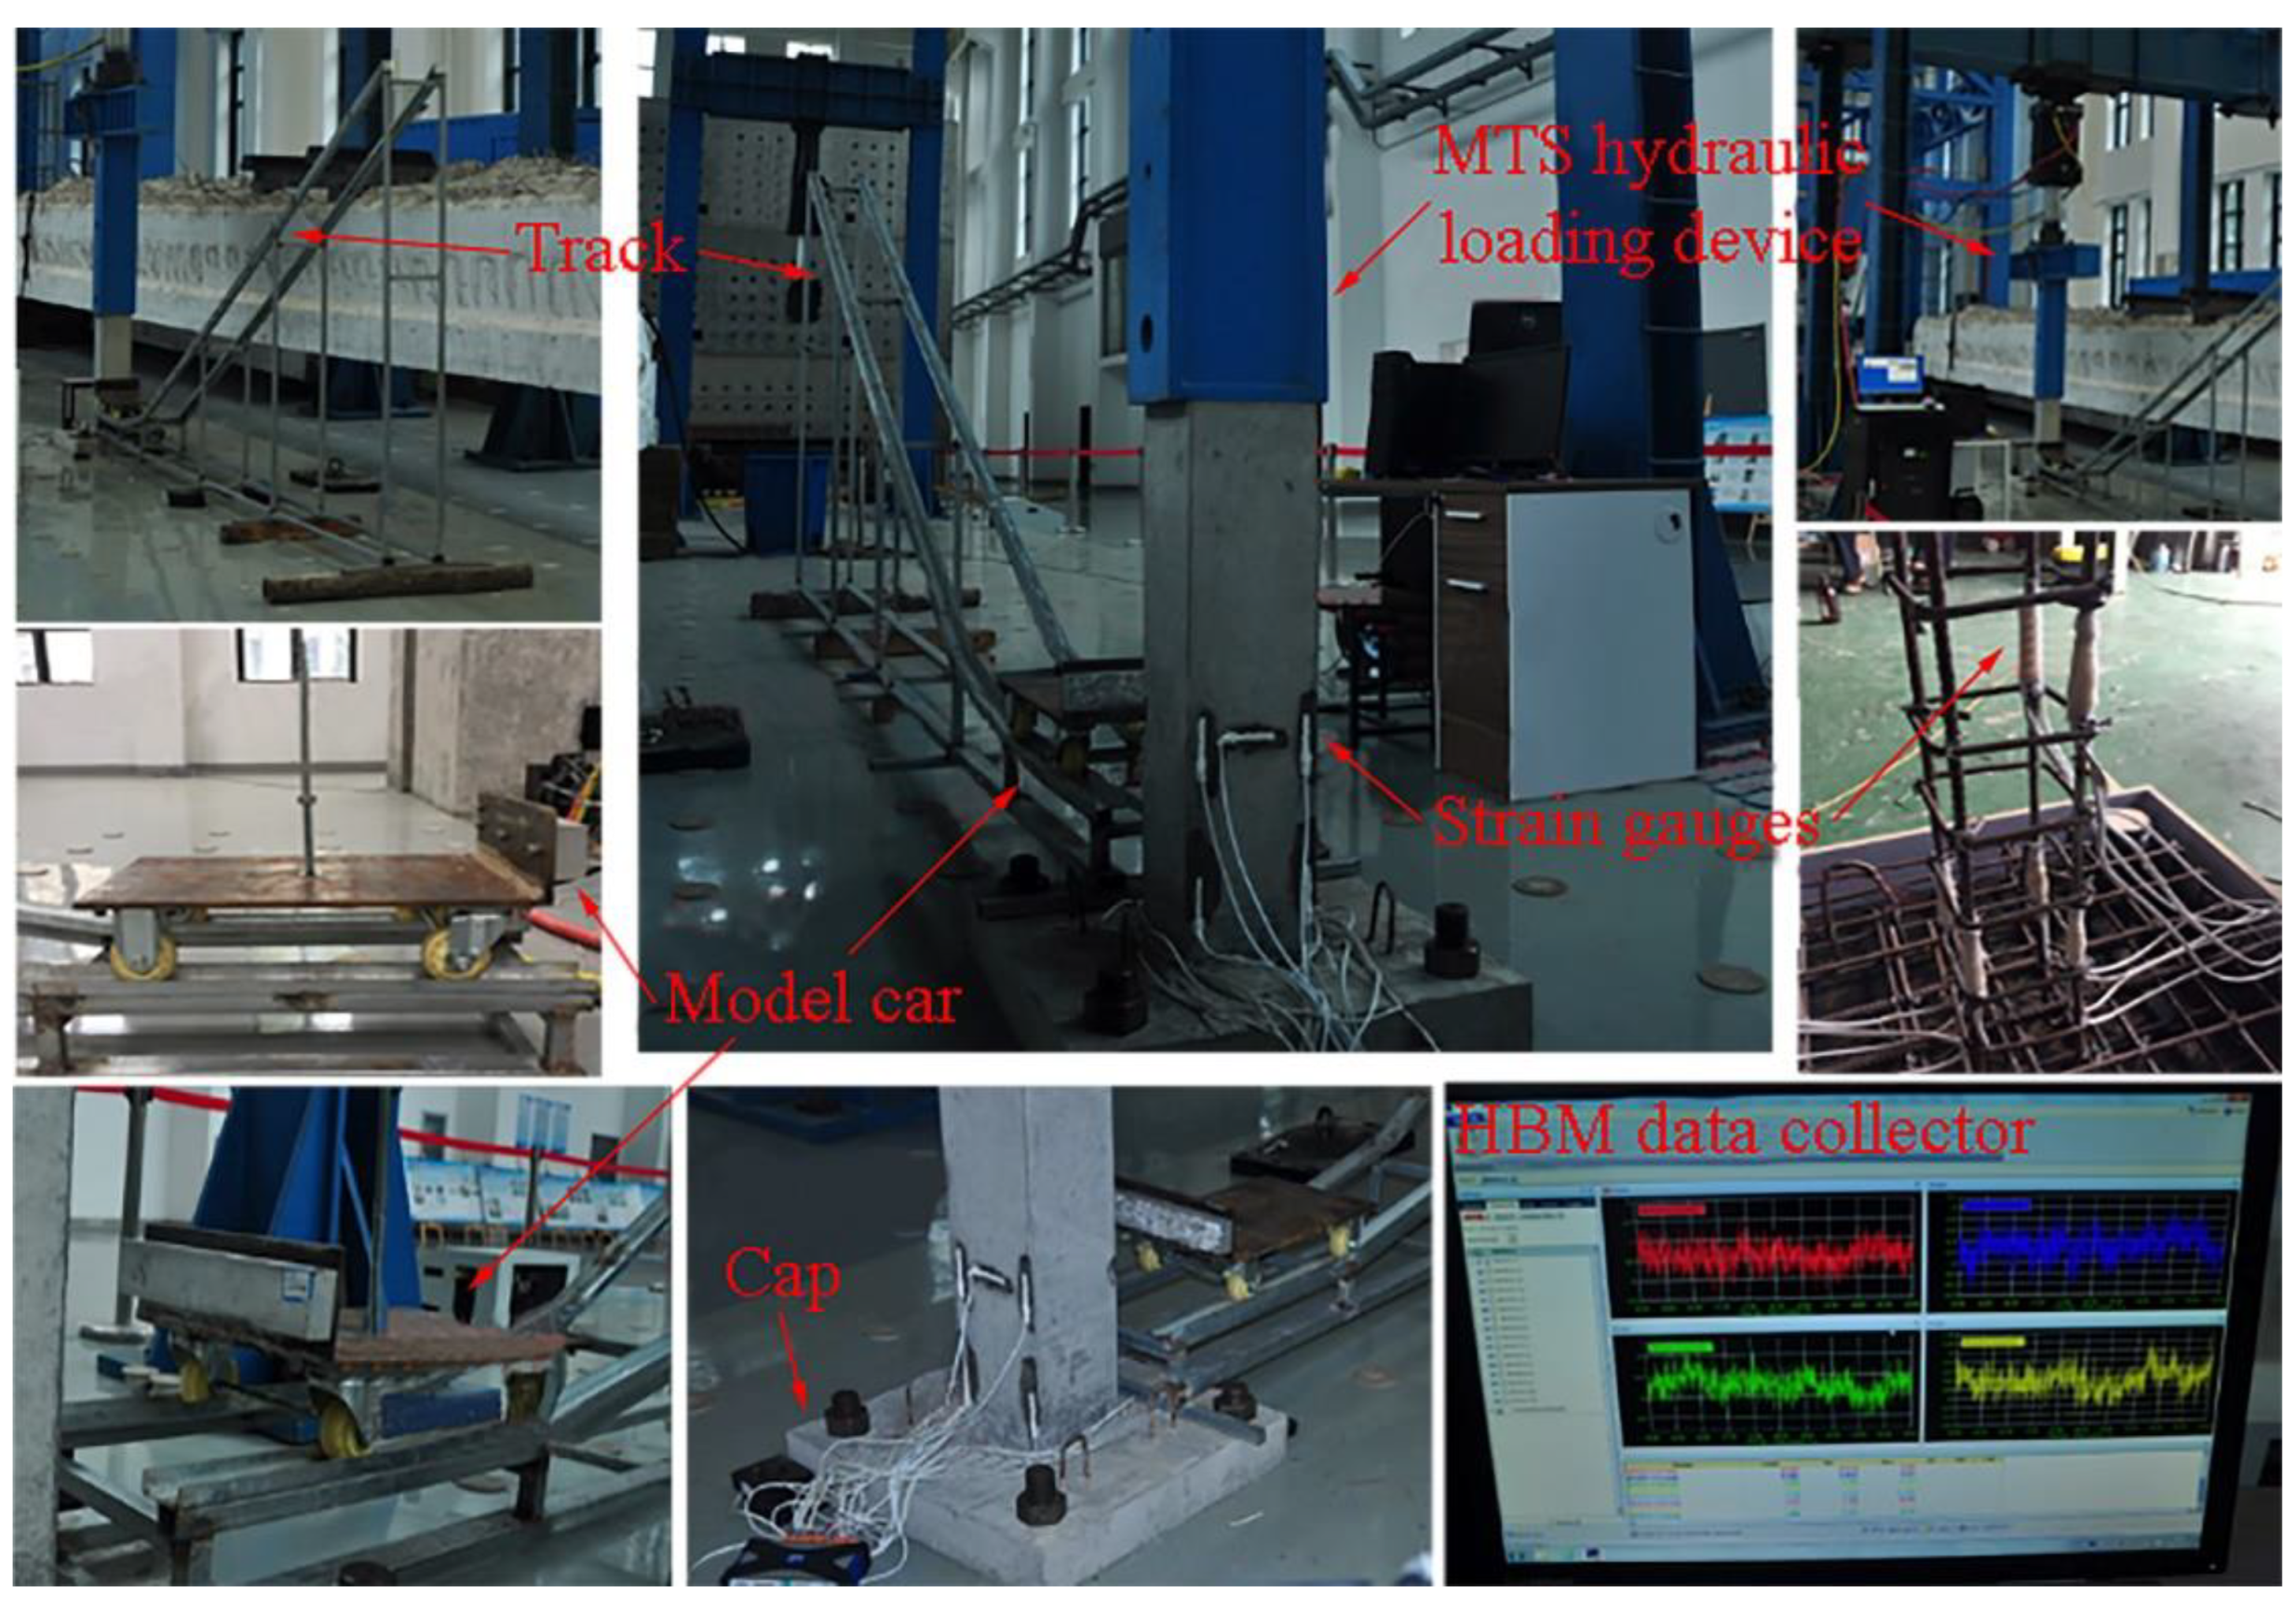
2.1. Experimental Facility
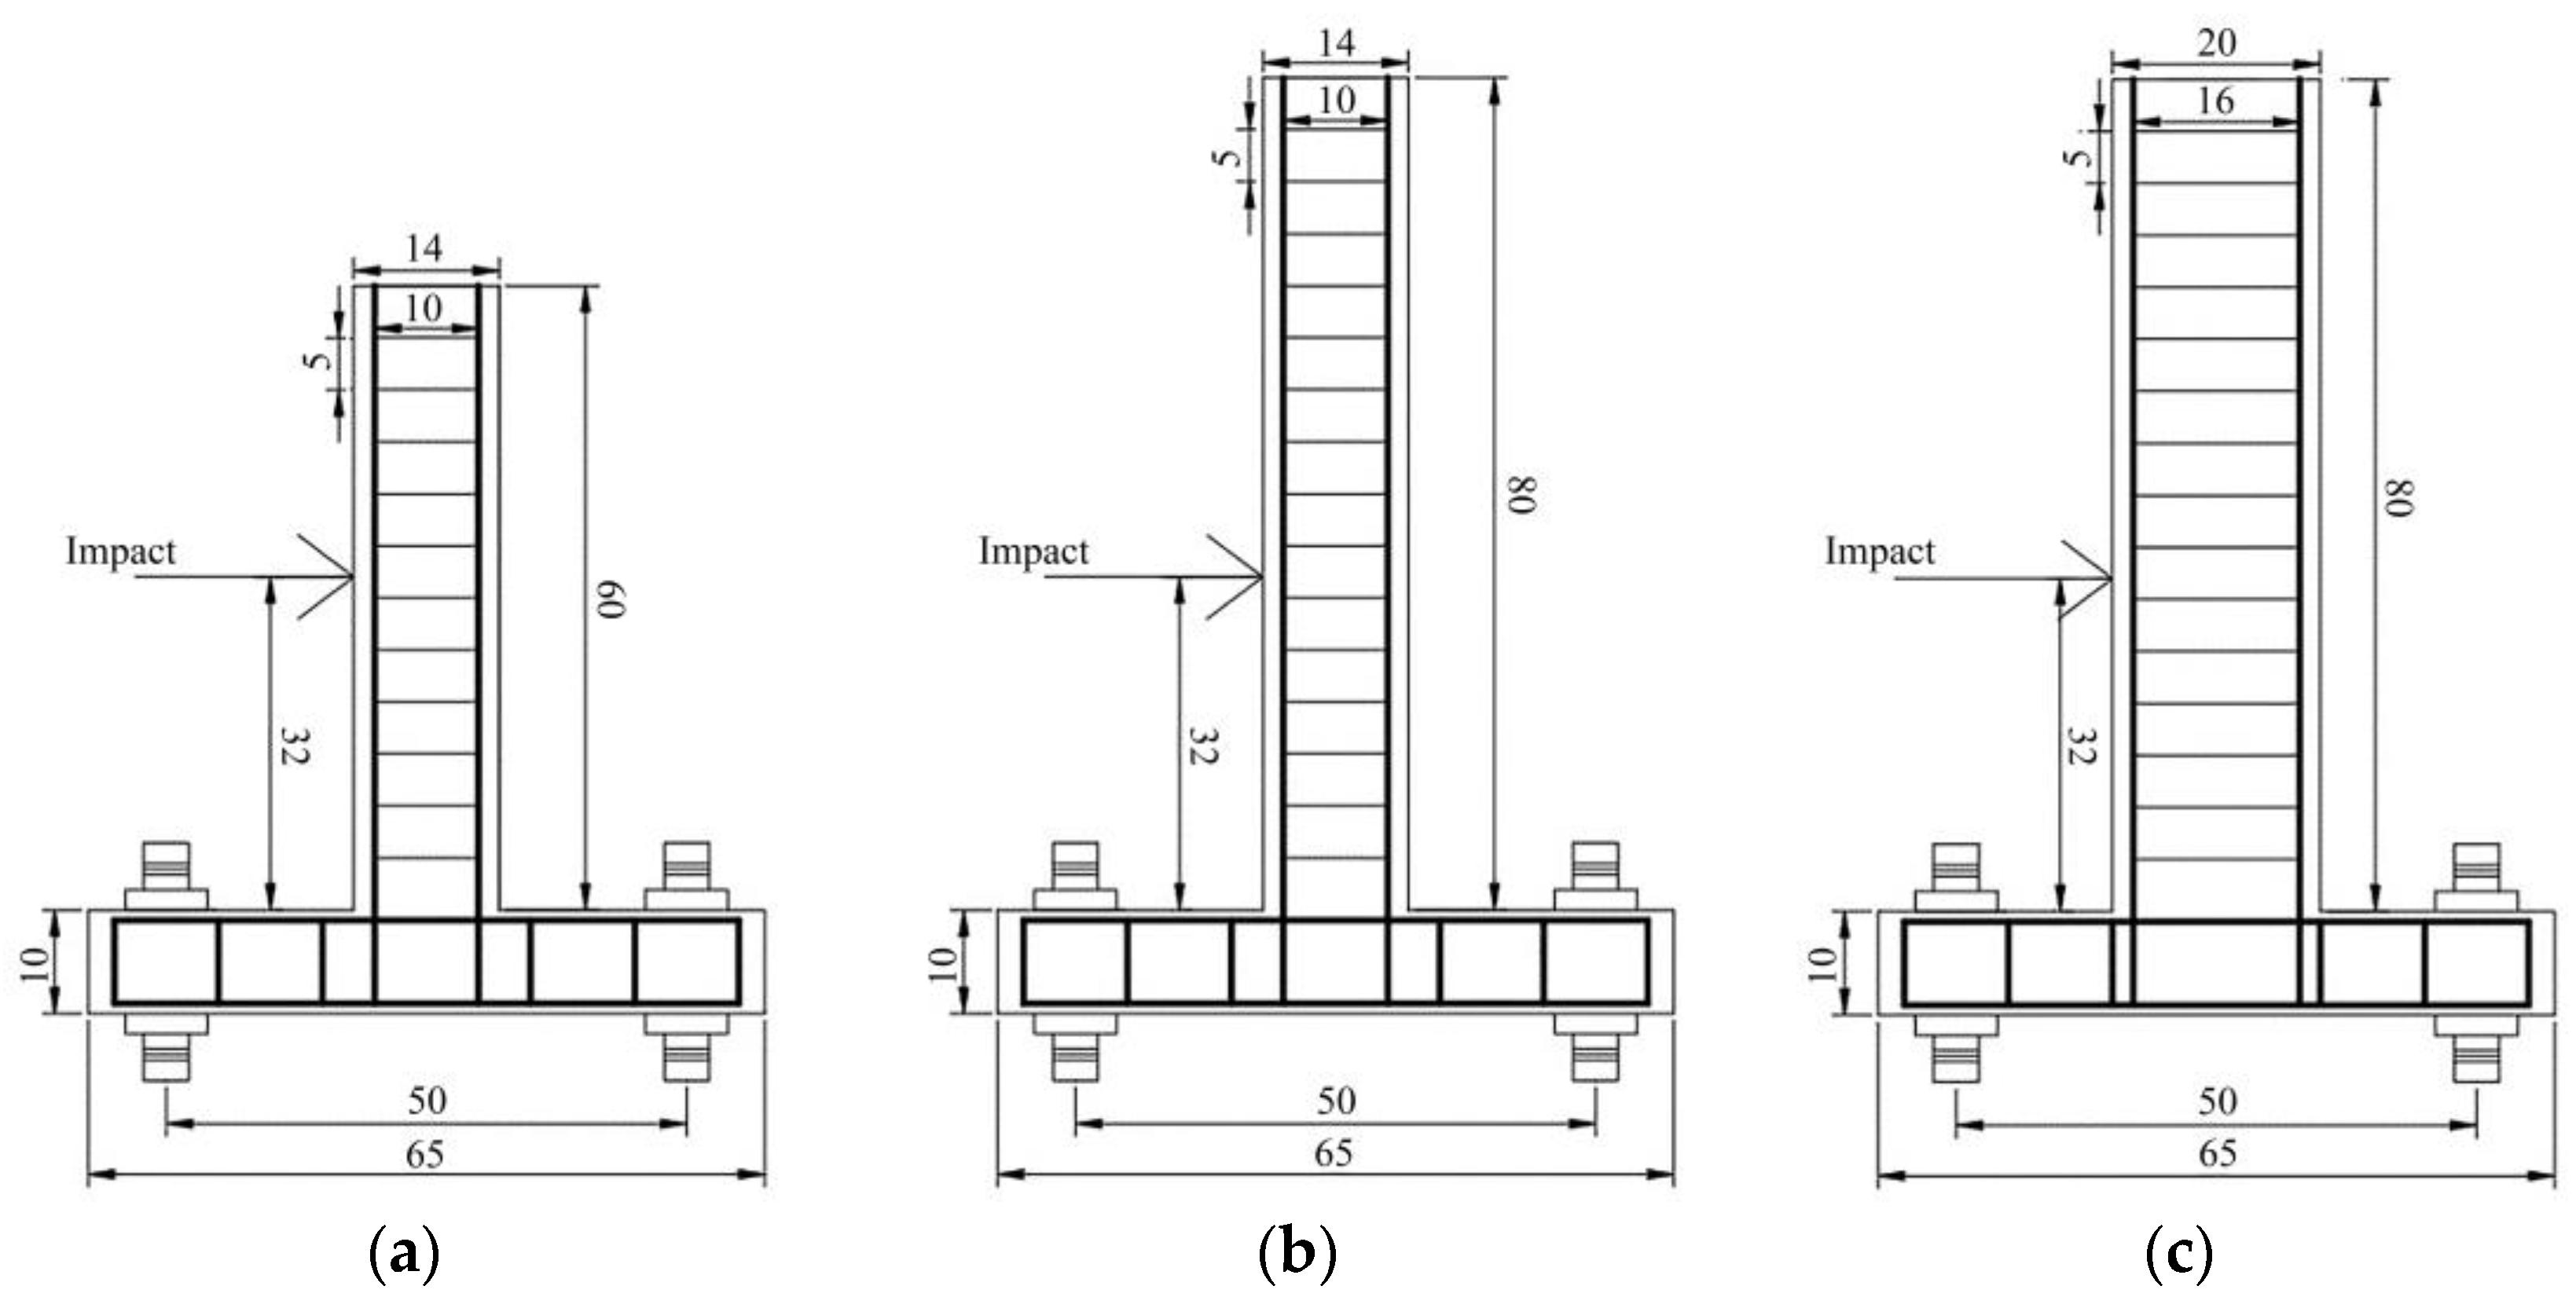
2.2. Reinforced Concrete Column Specimens
2.3. Experimental Procedure
3. Results of the Impact Test
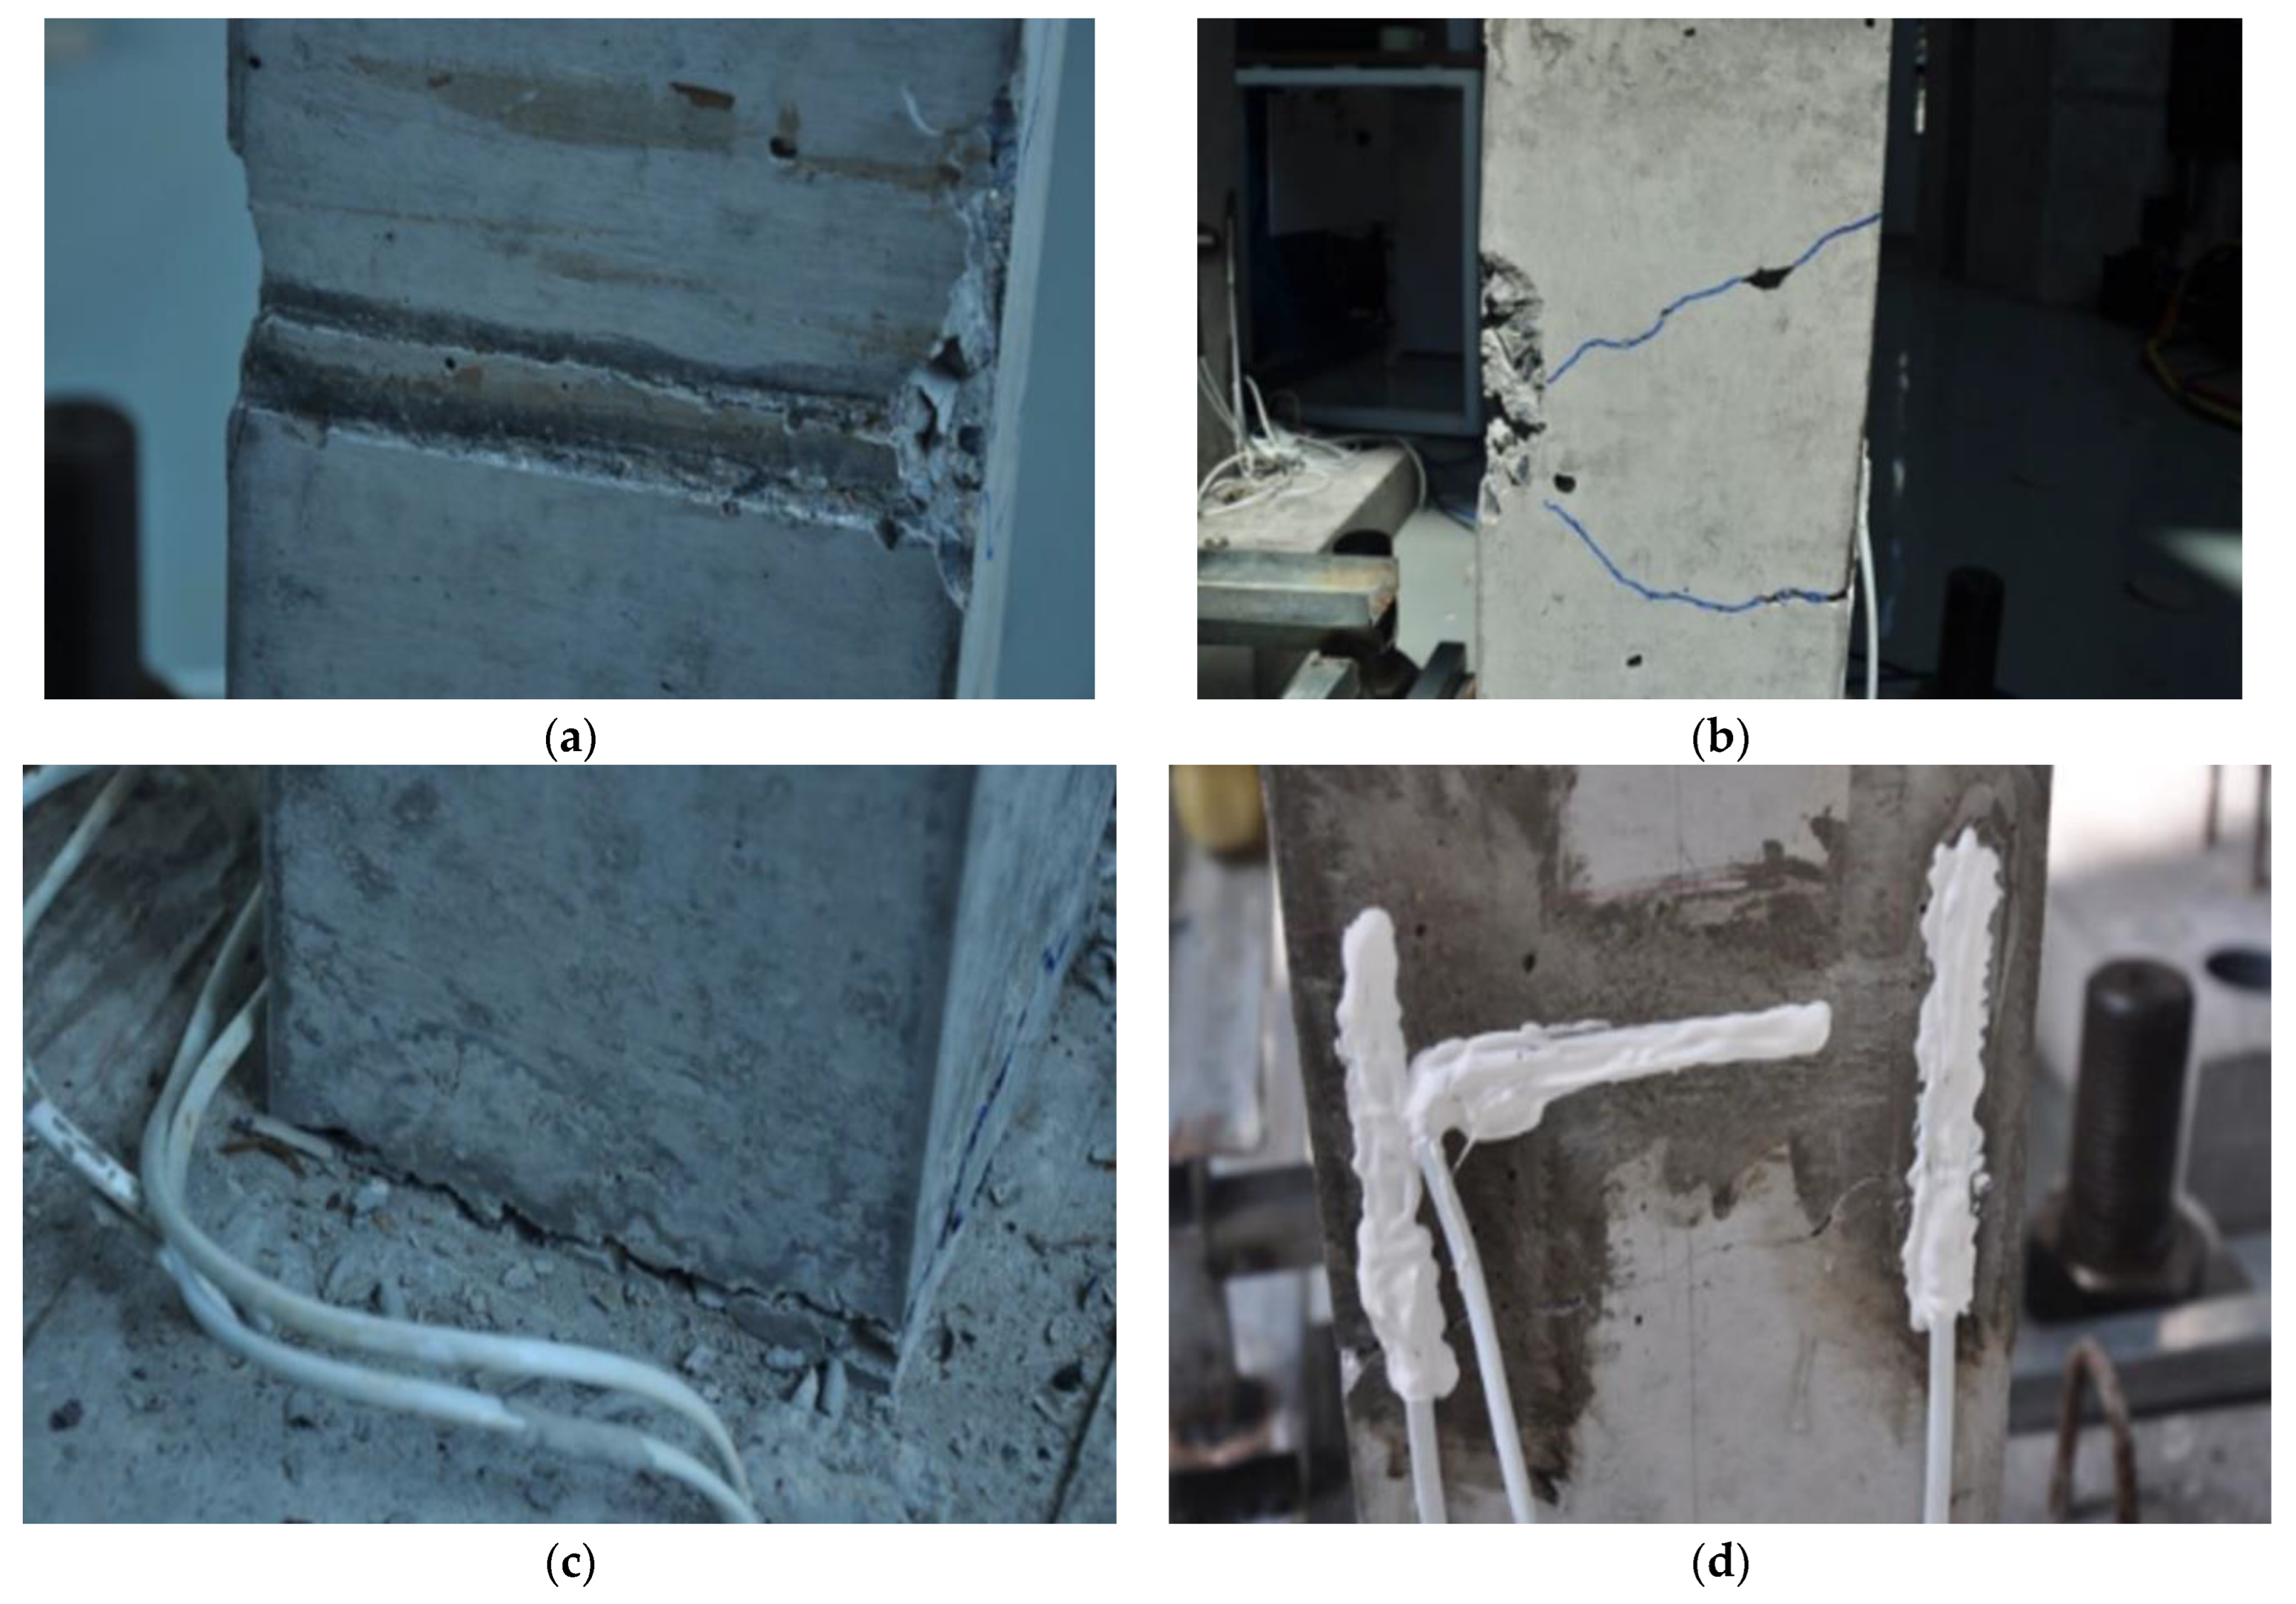
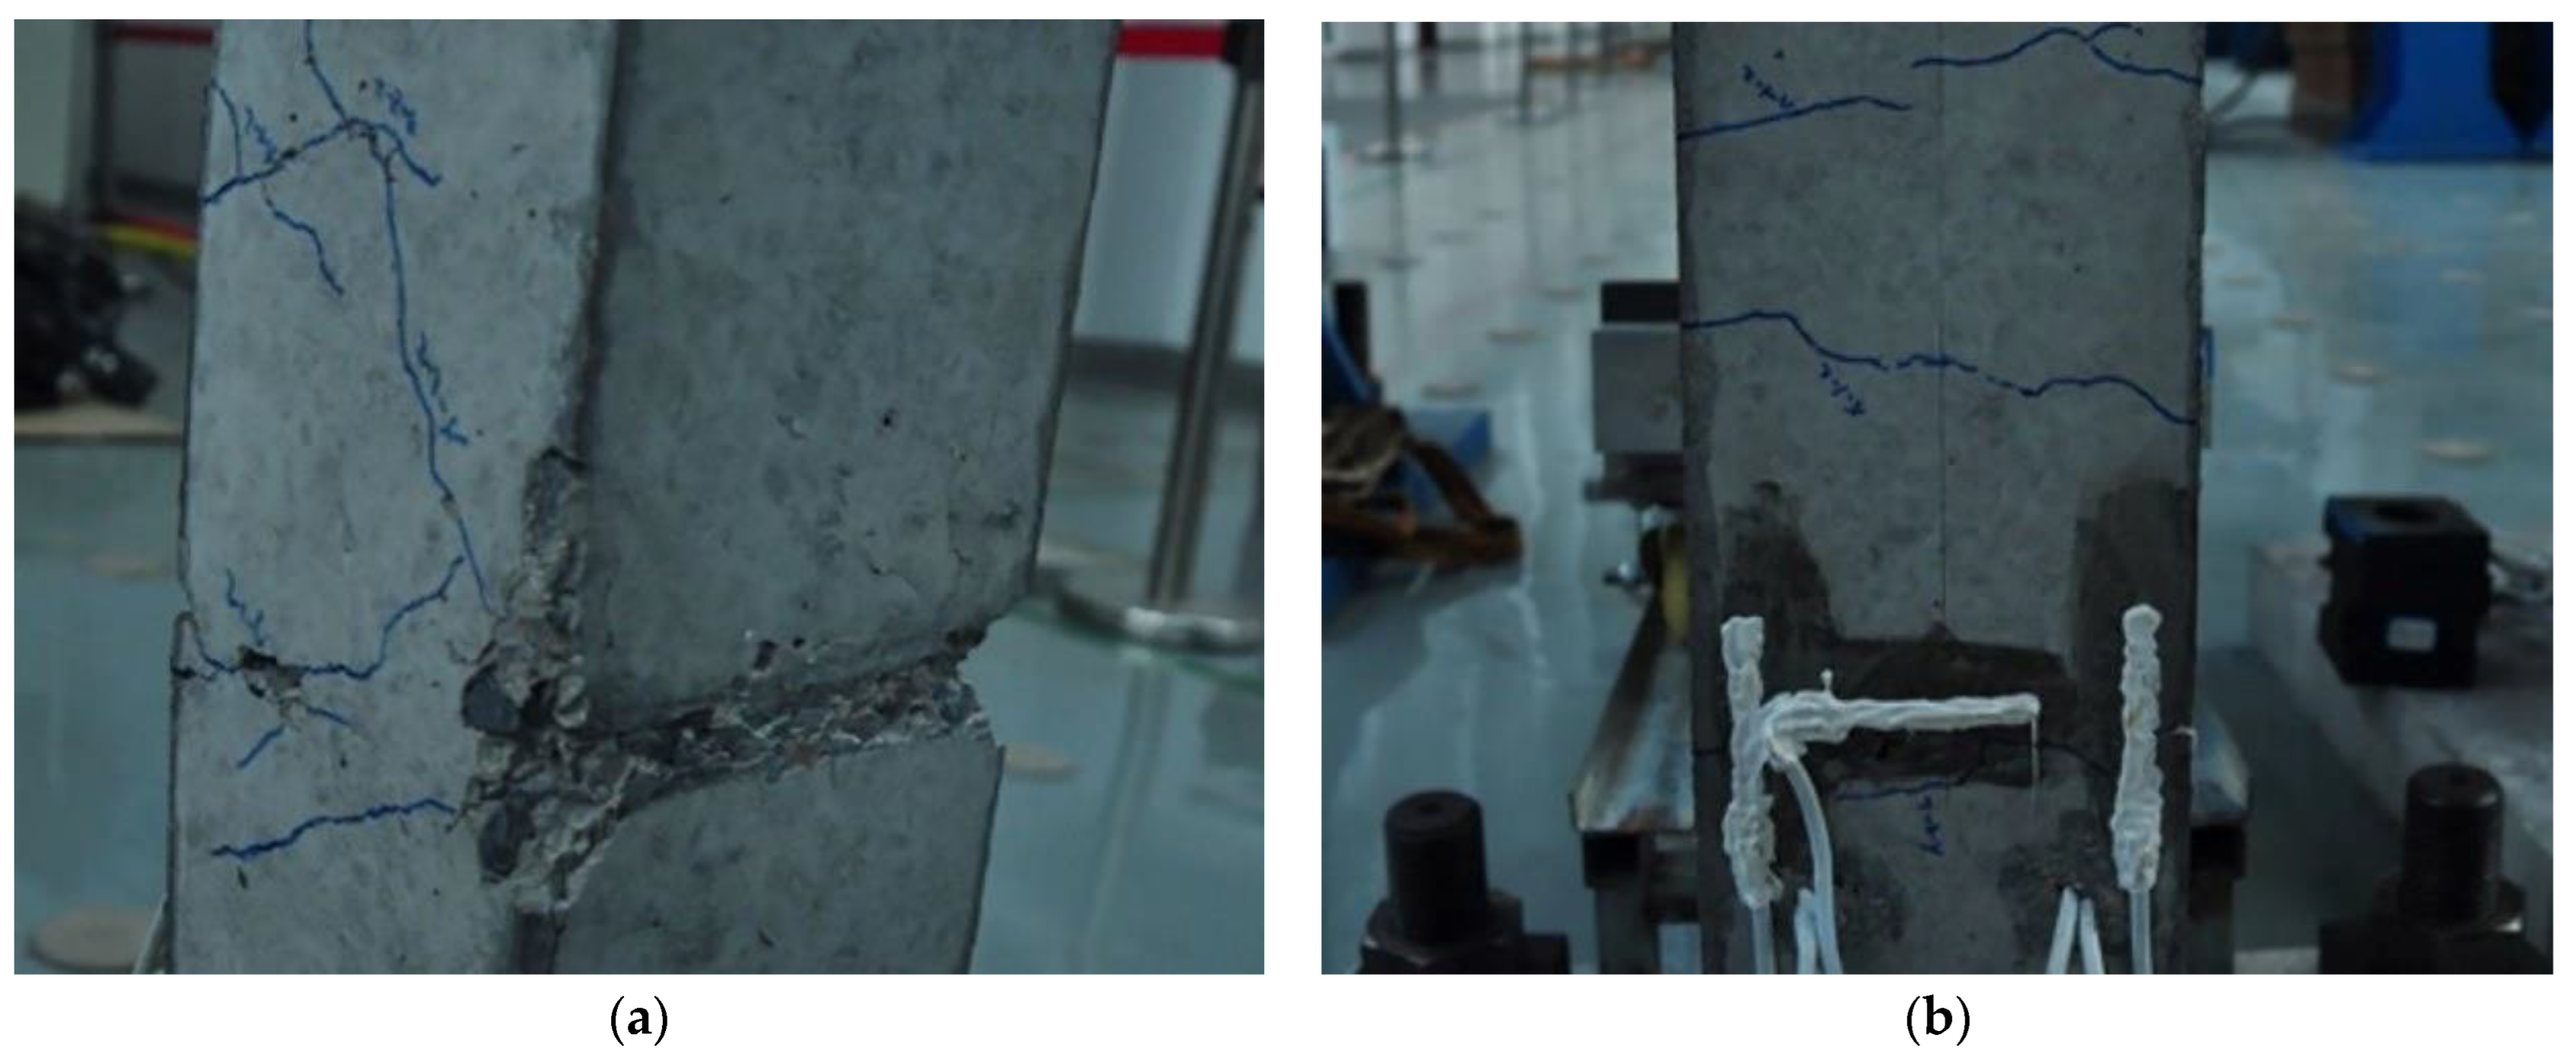
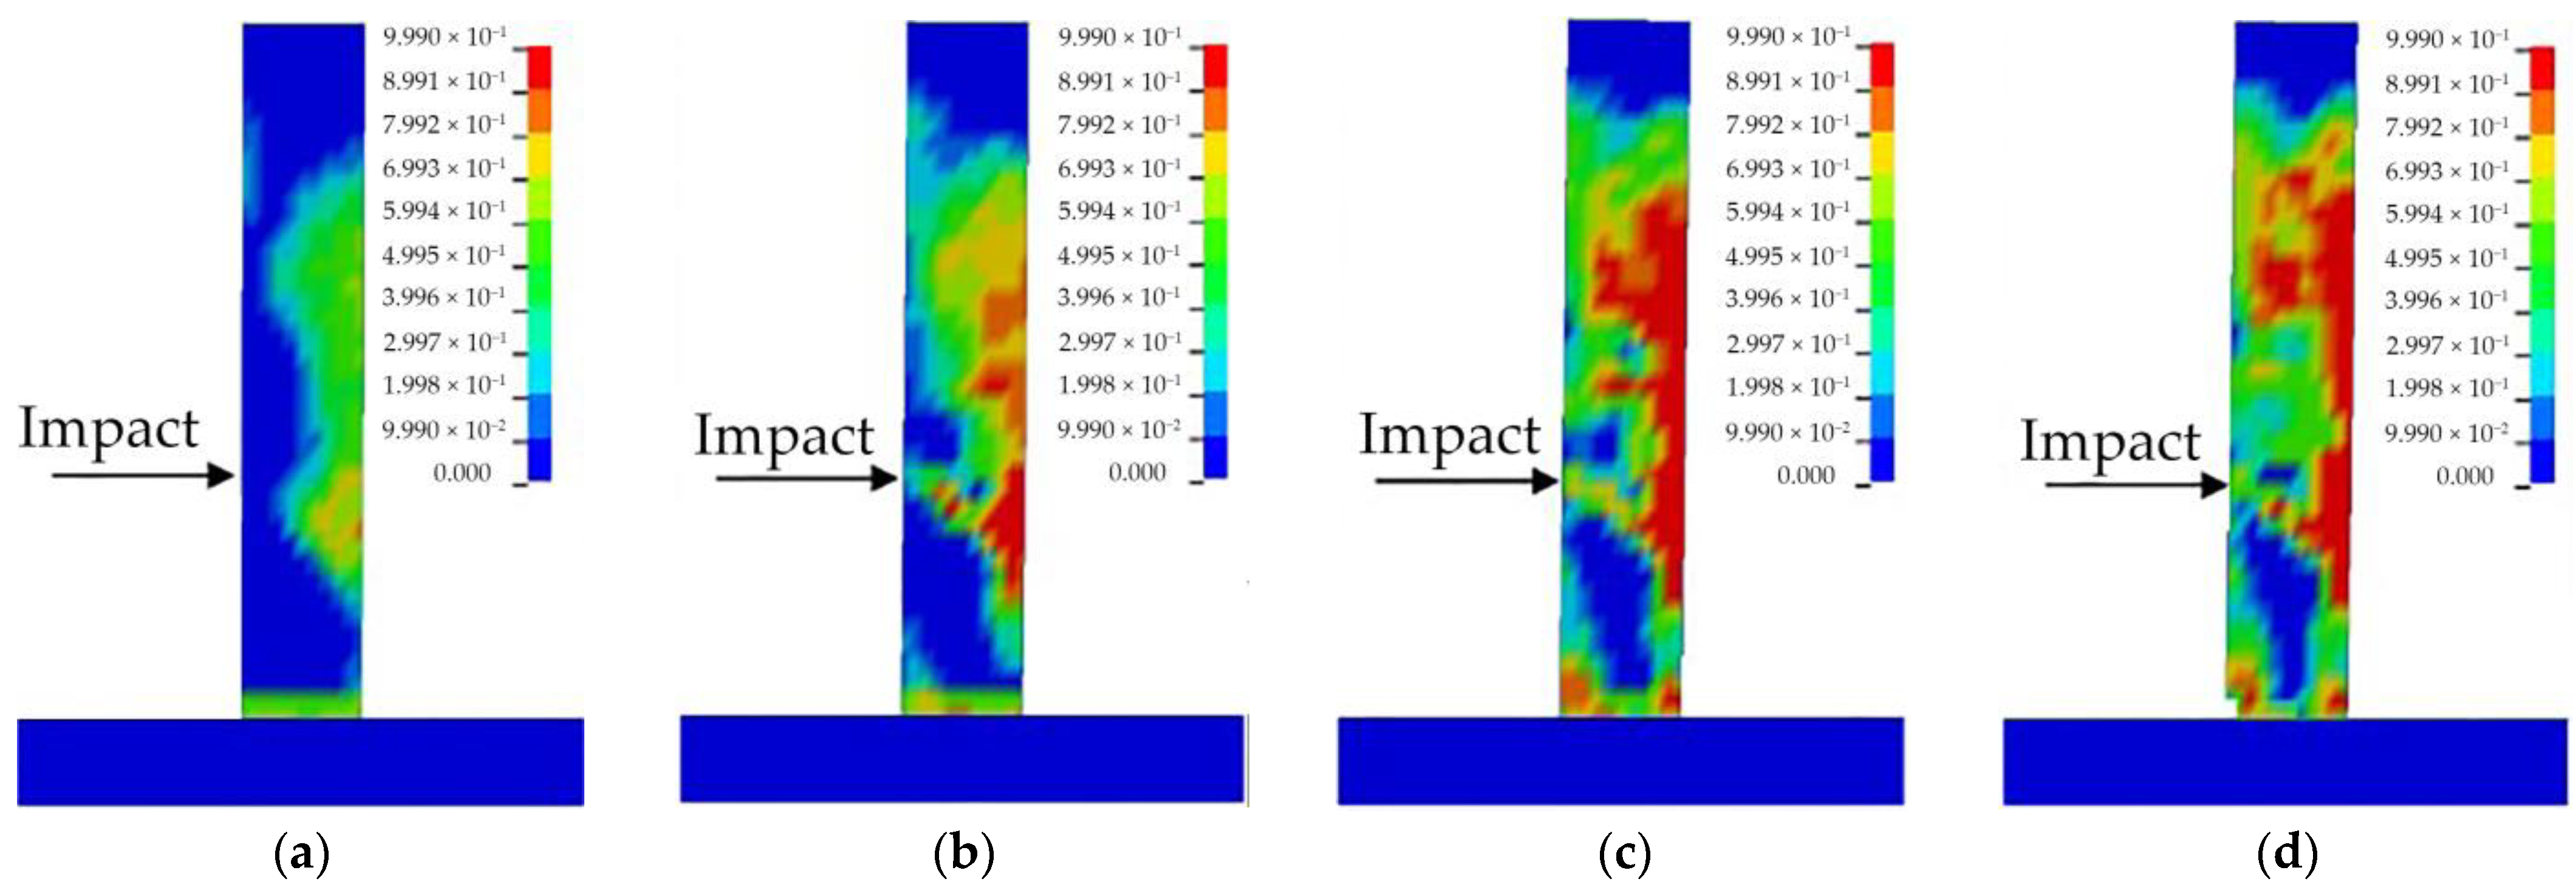
3.1. Failure Mode
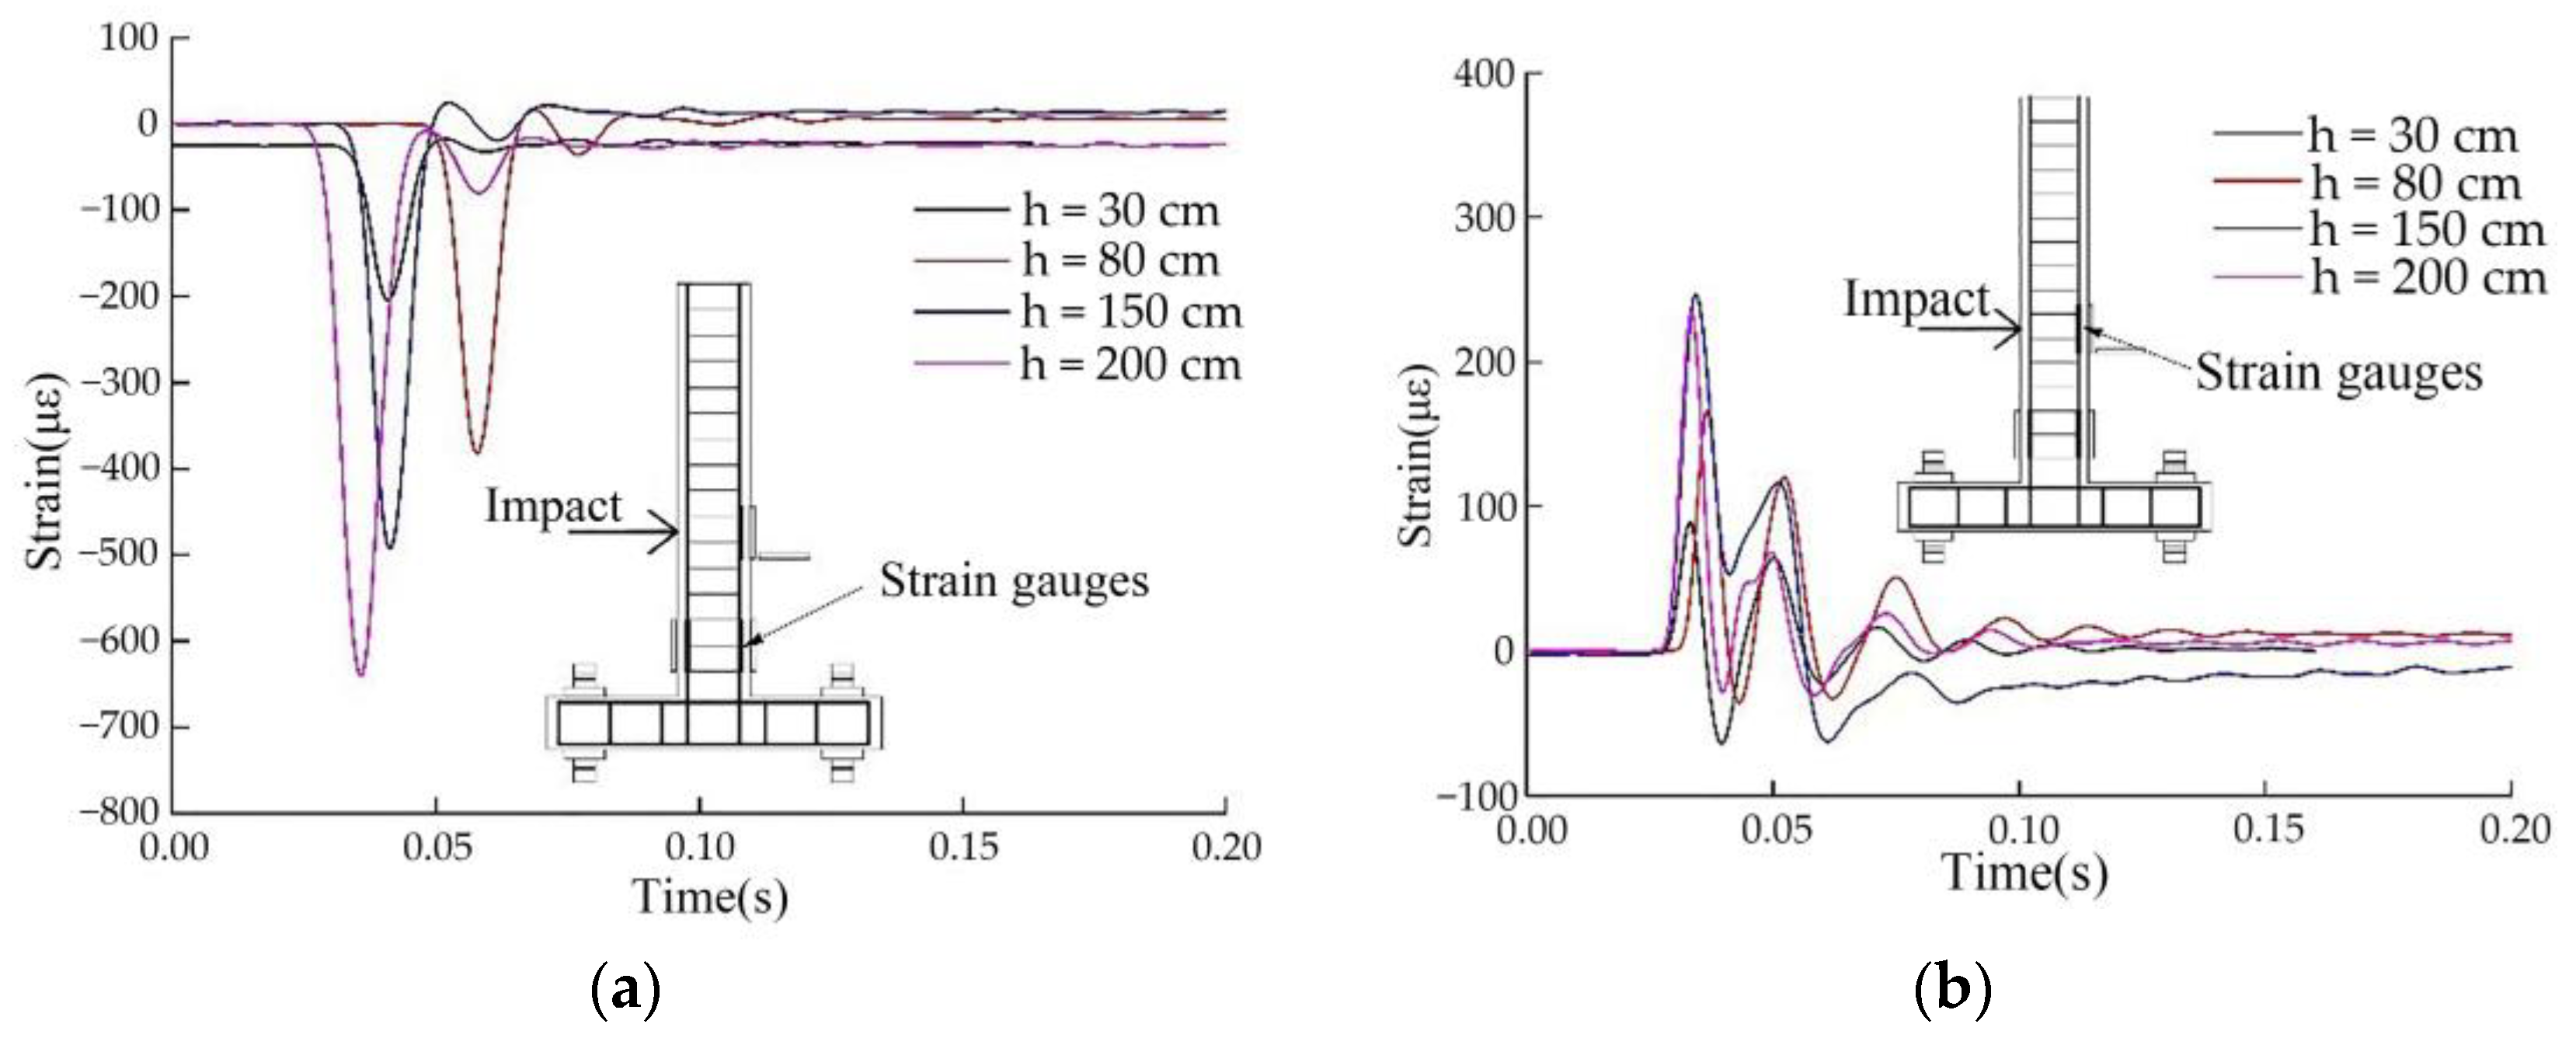
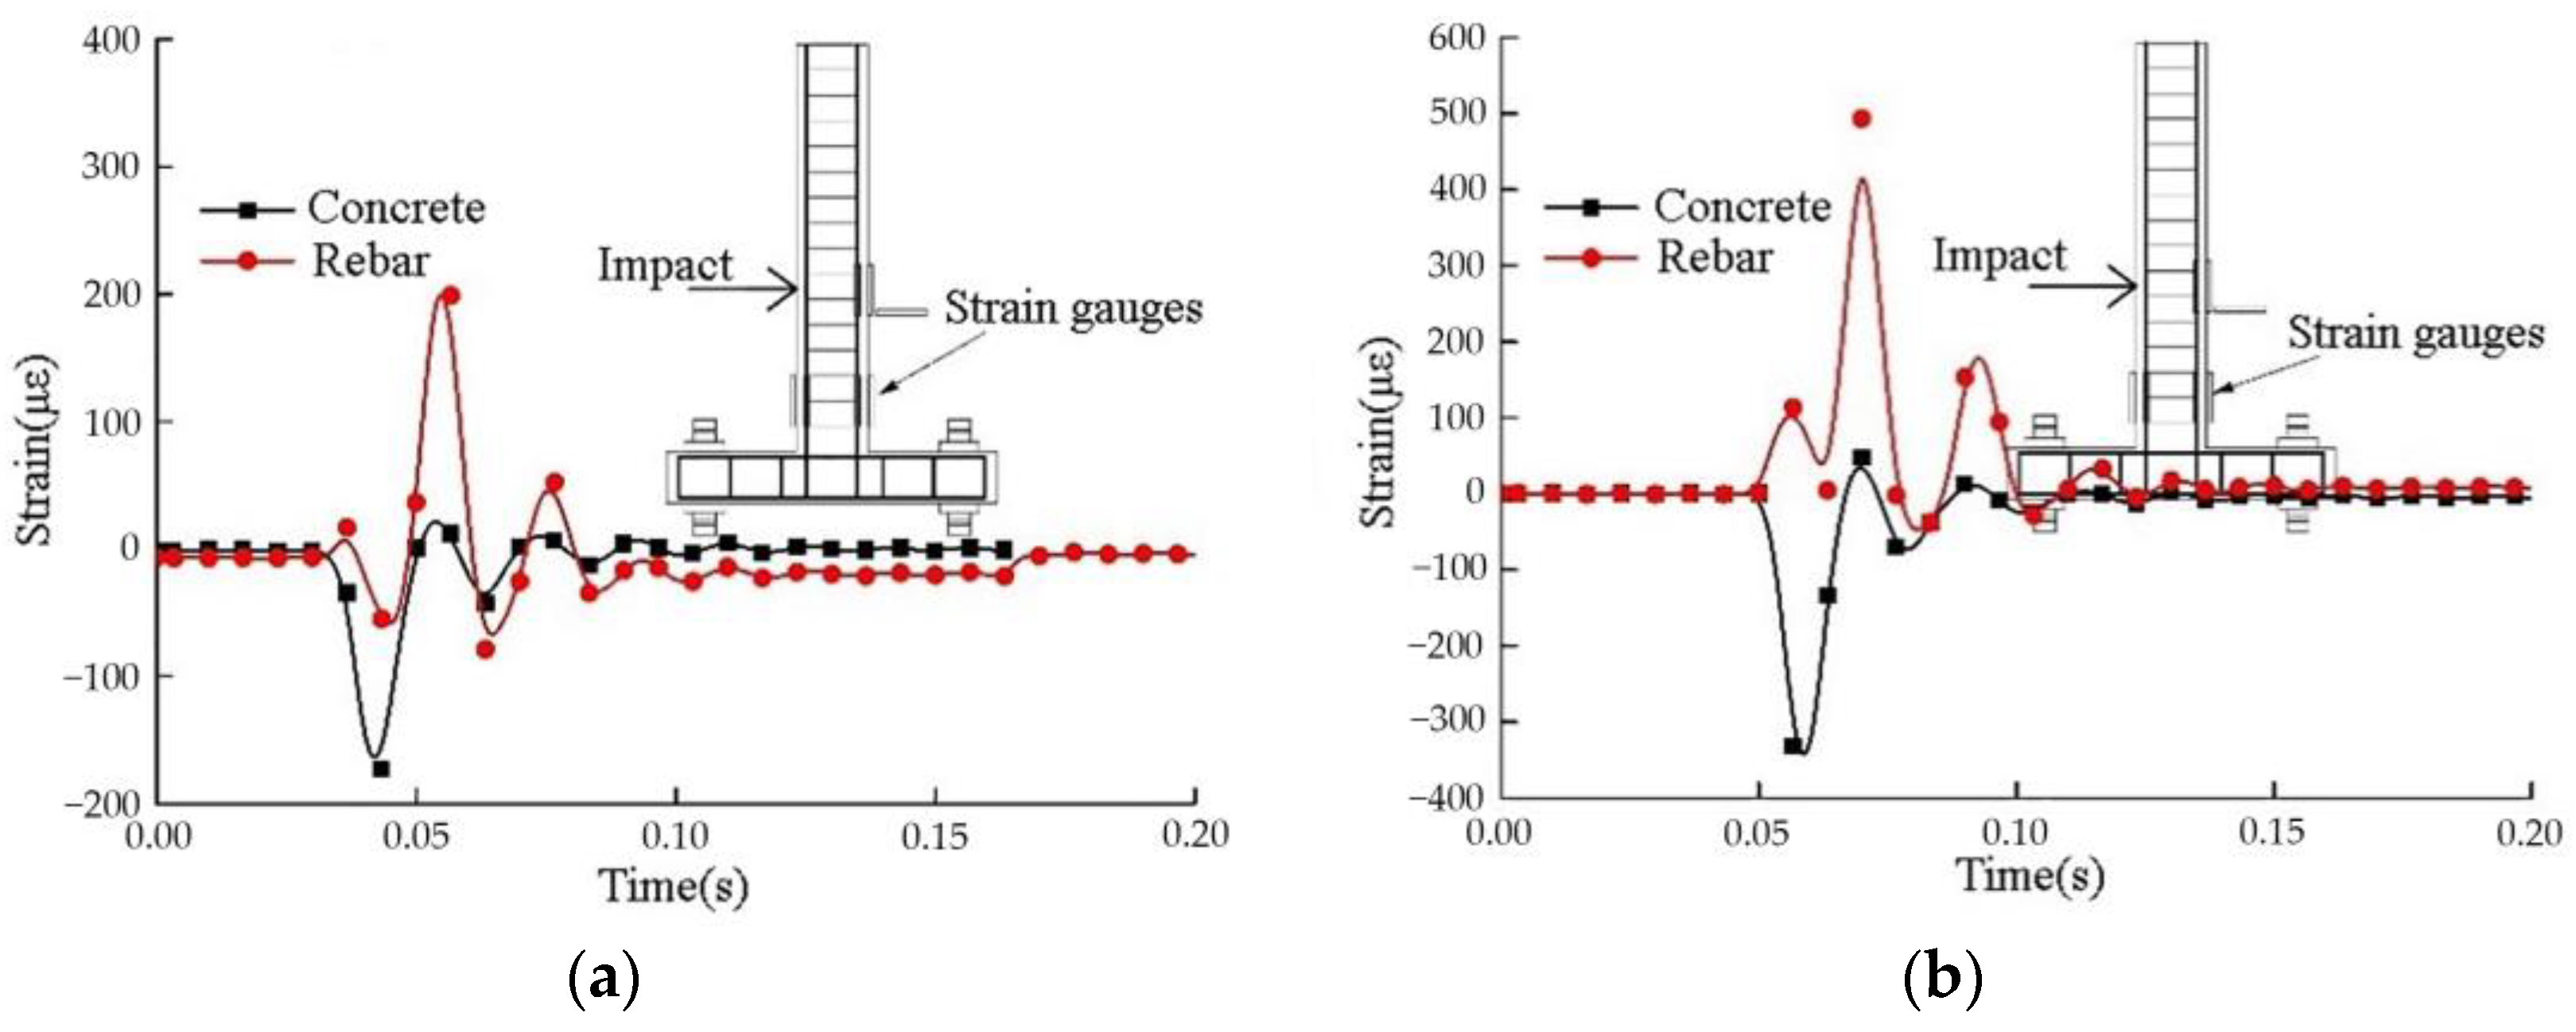
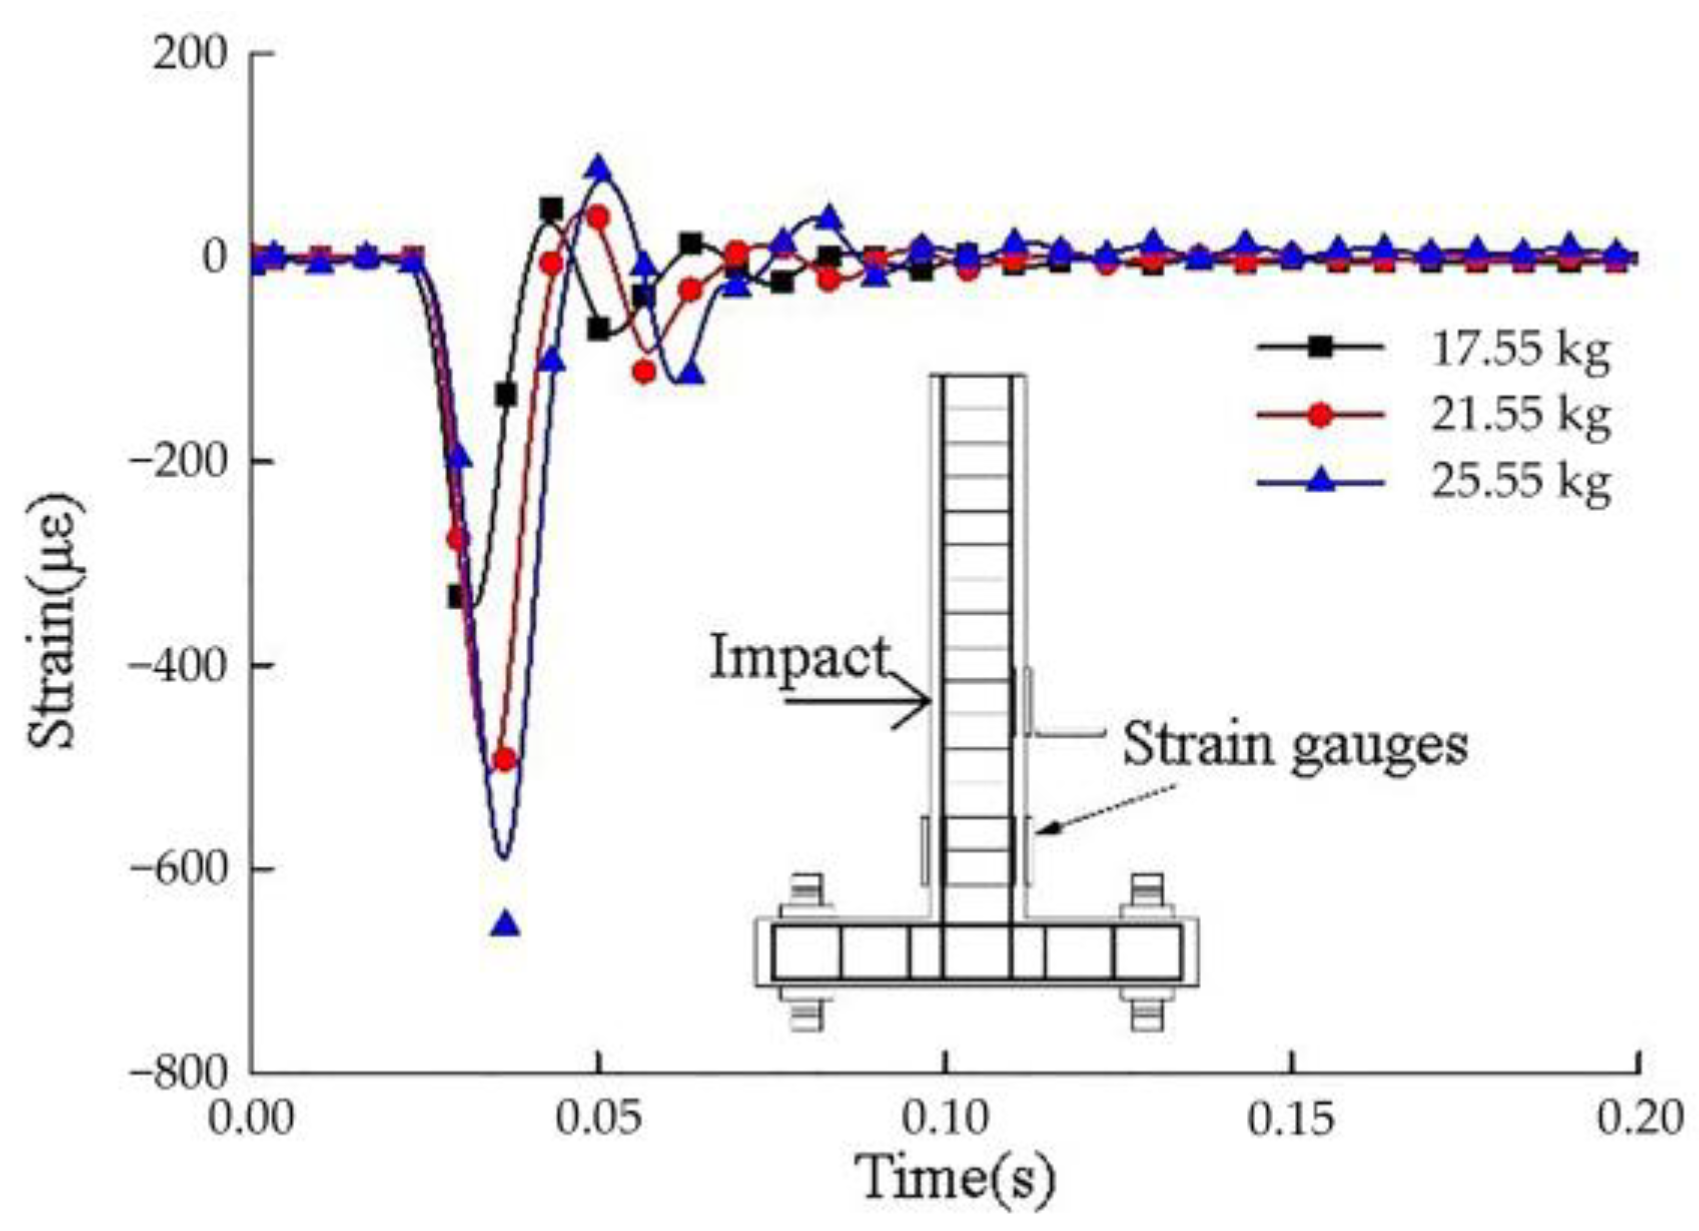
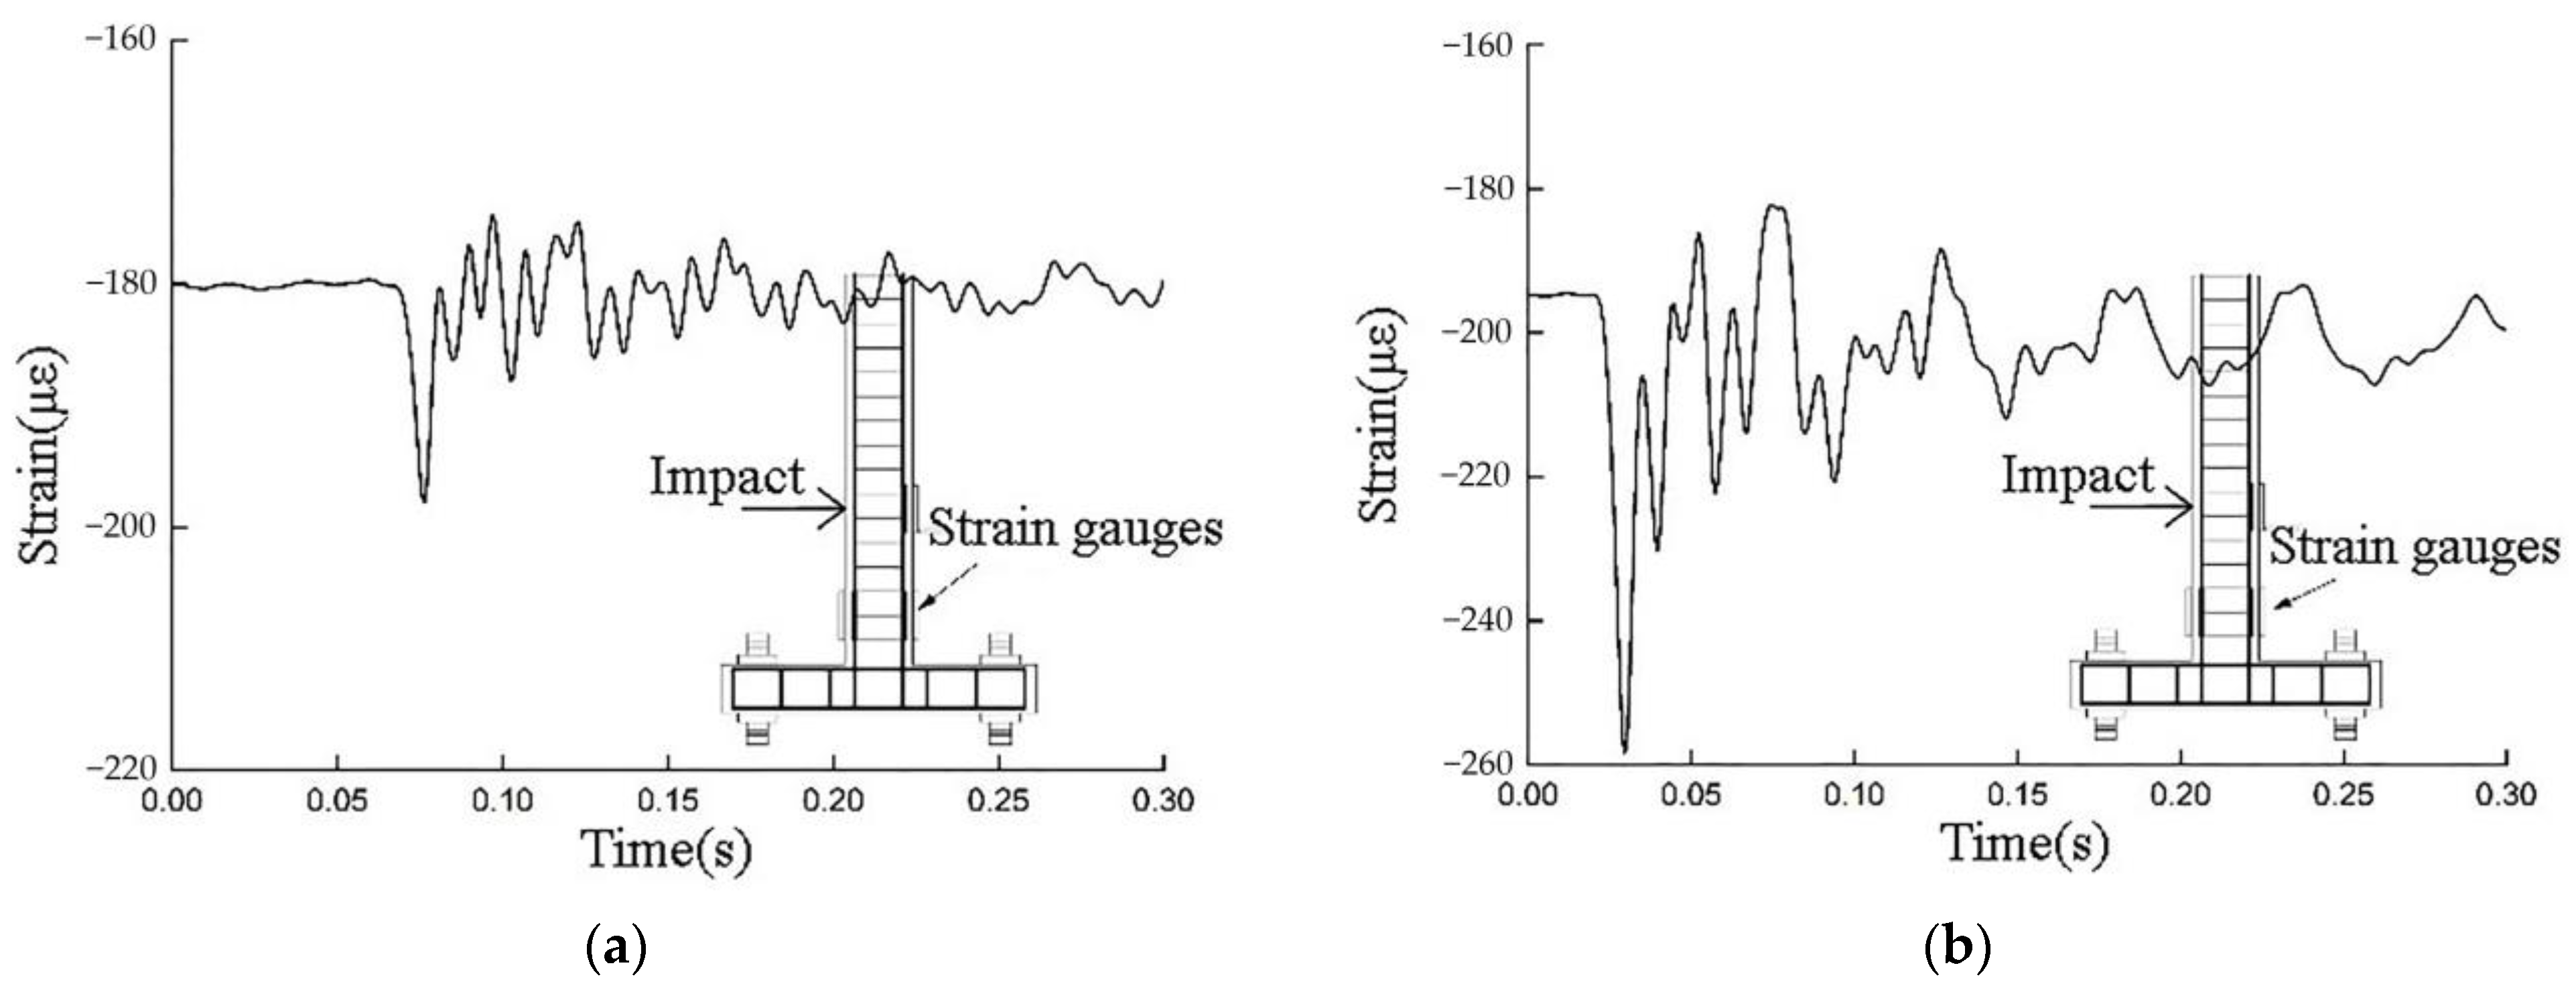
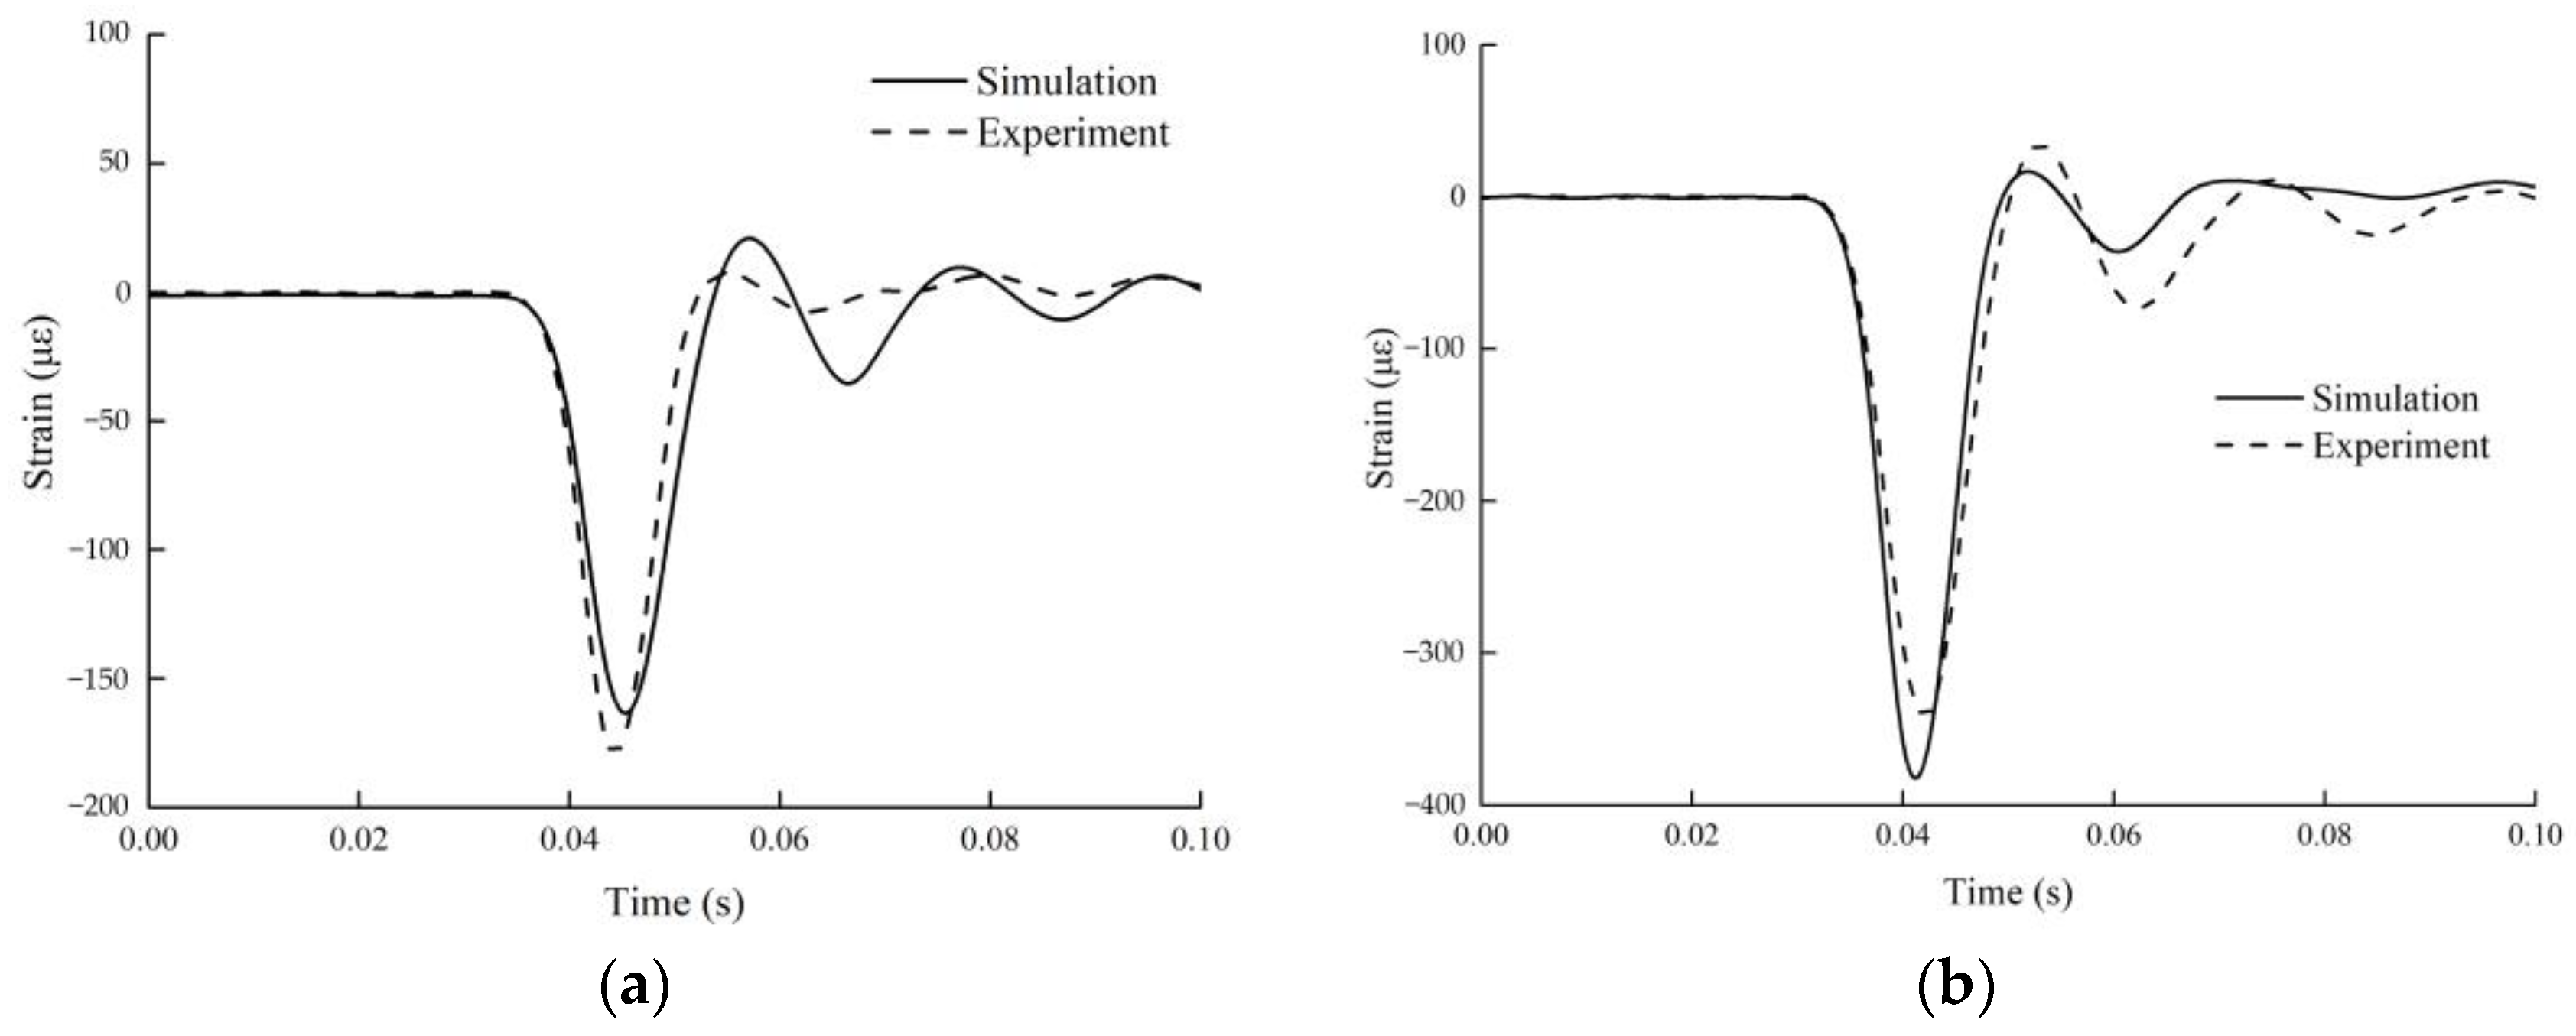
3.2. Strain Response
4. Nonlinear Numerical Simulation
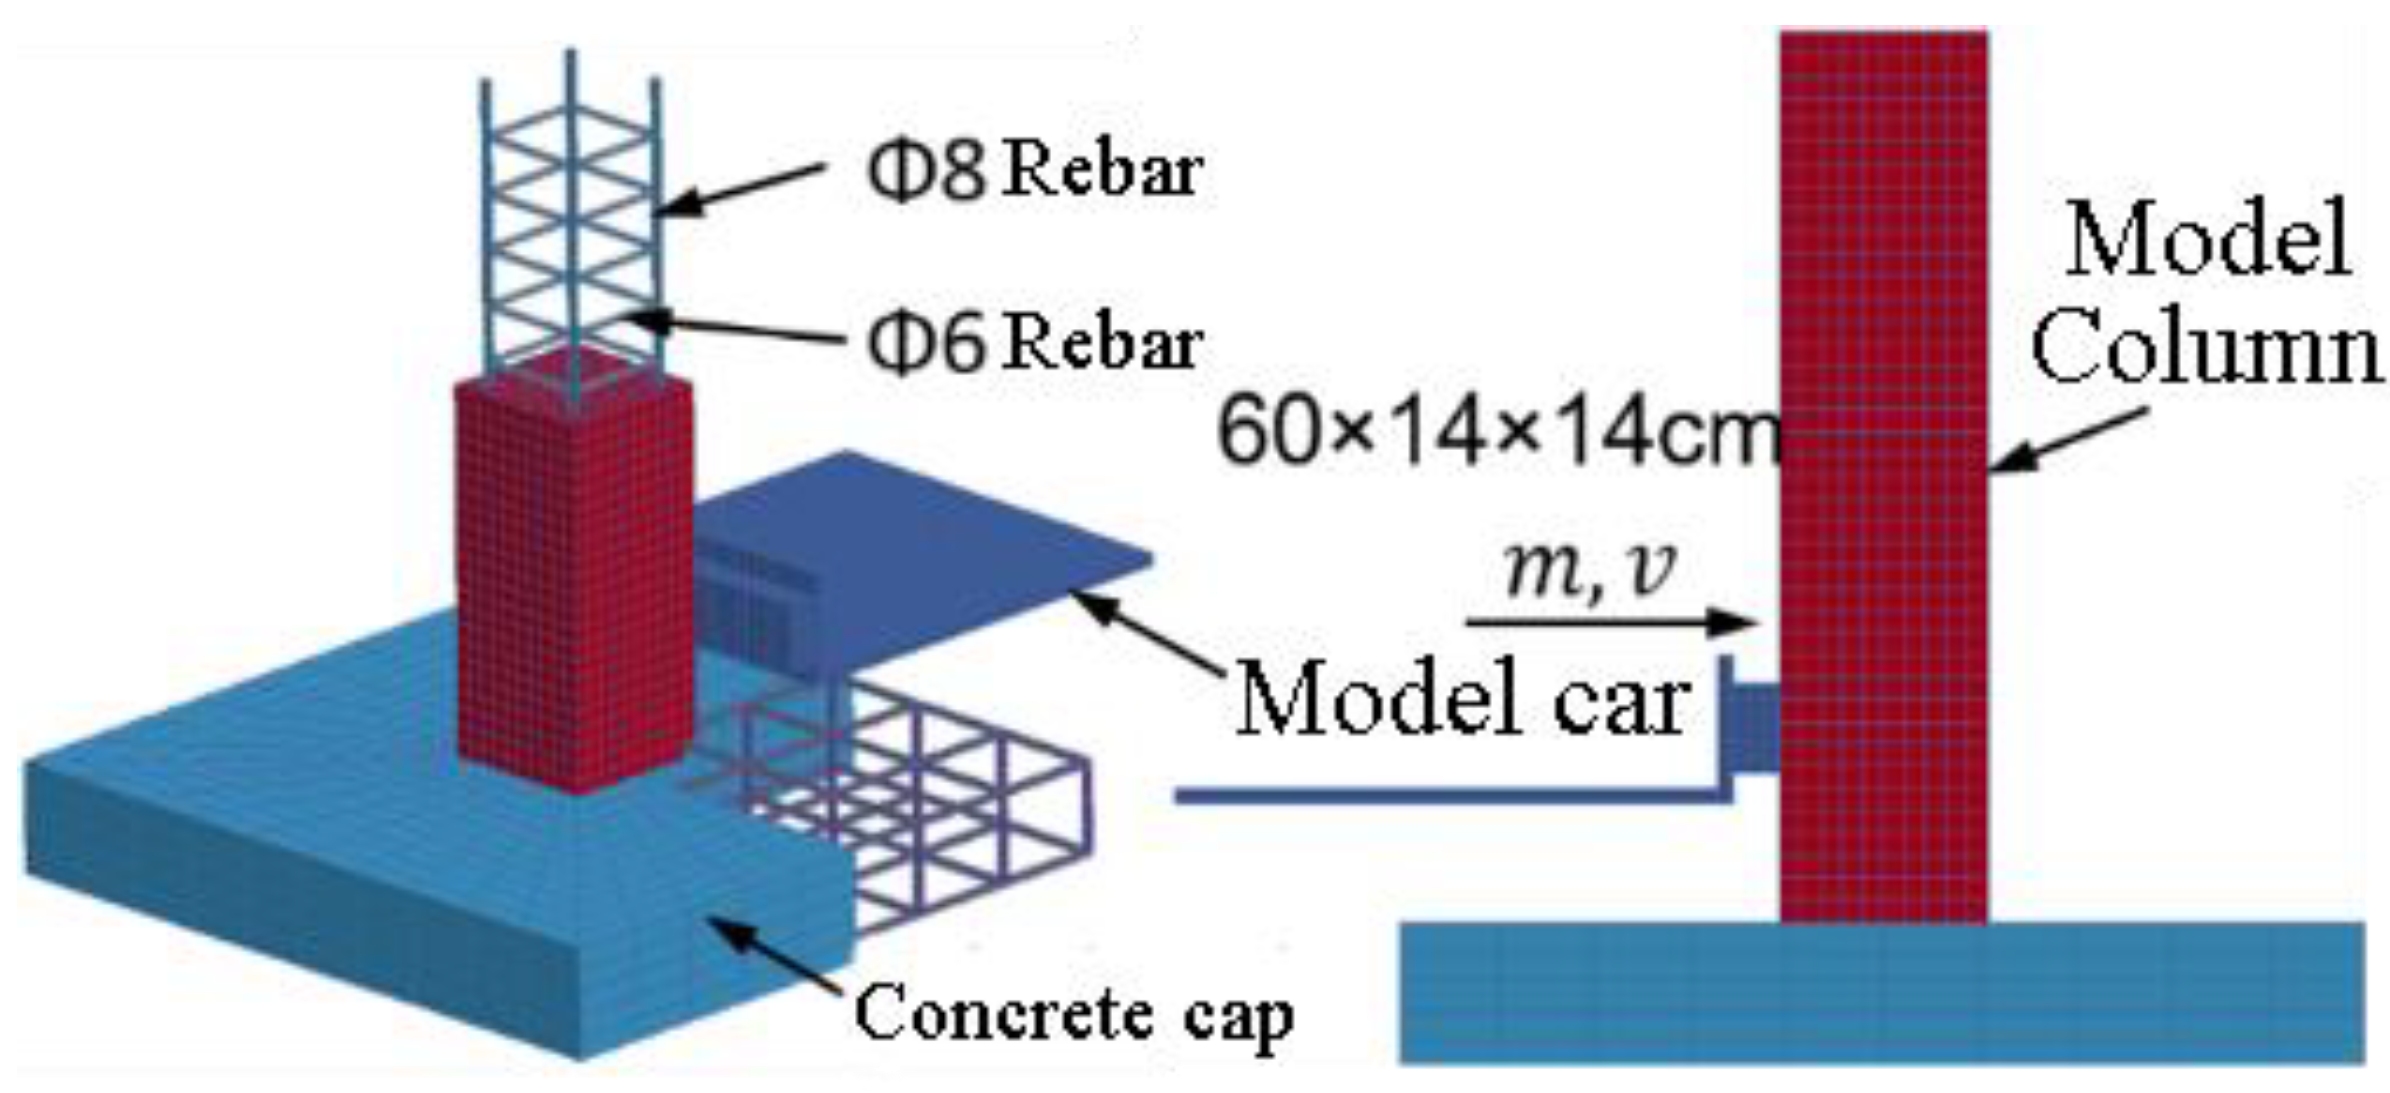
4.1. Finite Element Model
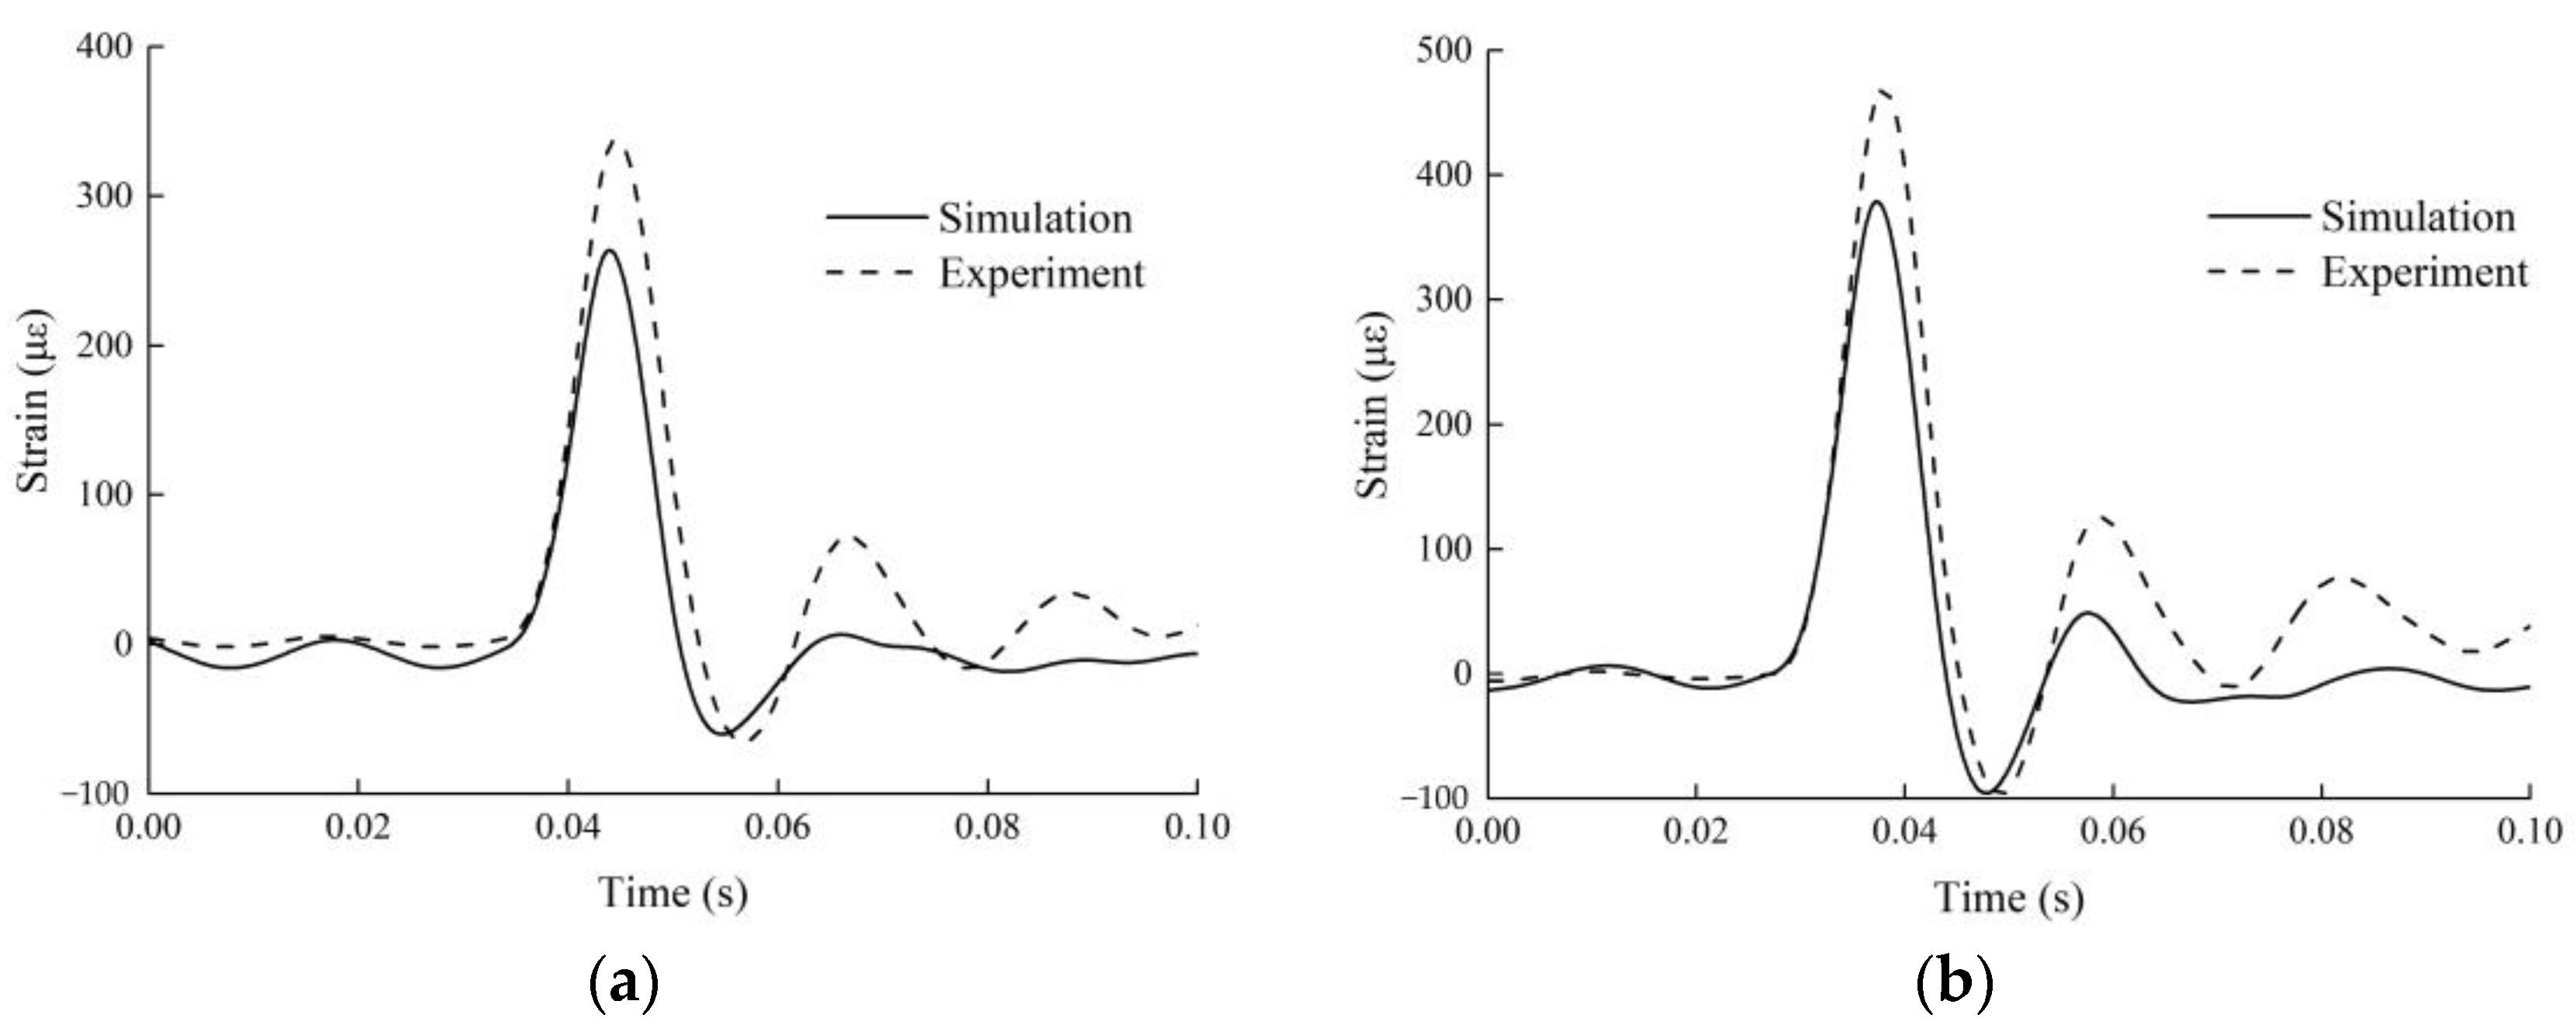
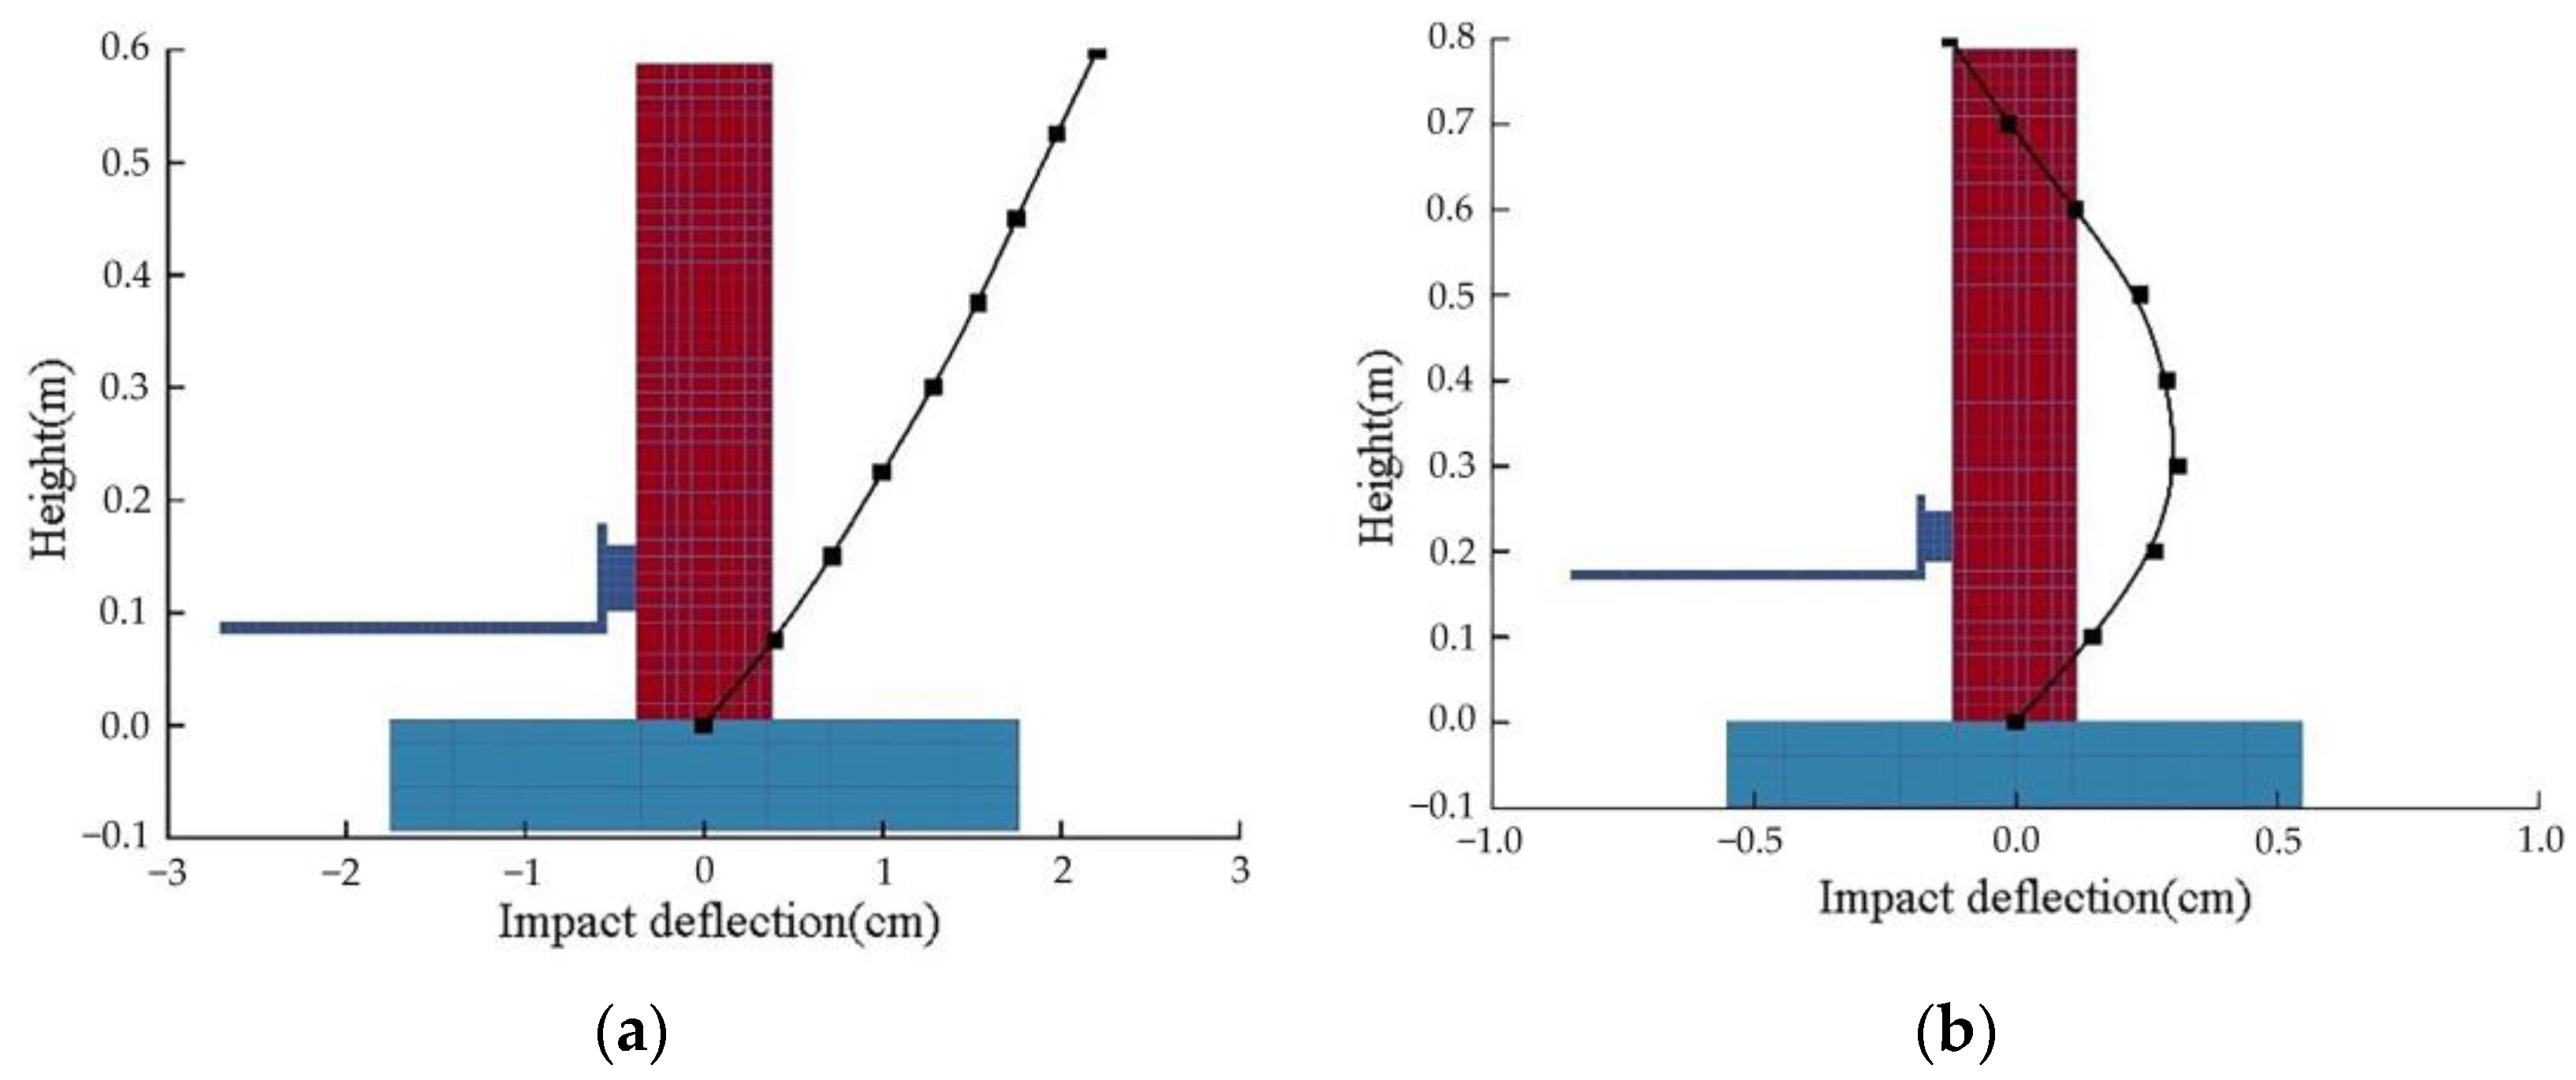
4.2. Results and Discussions
5. Parametric Analysis
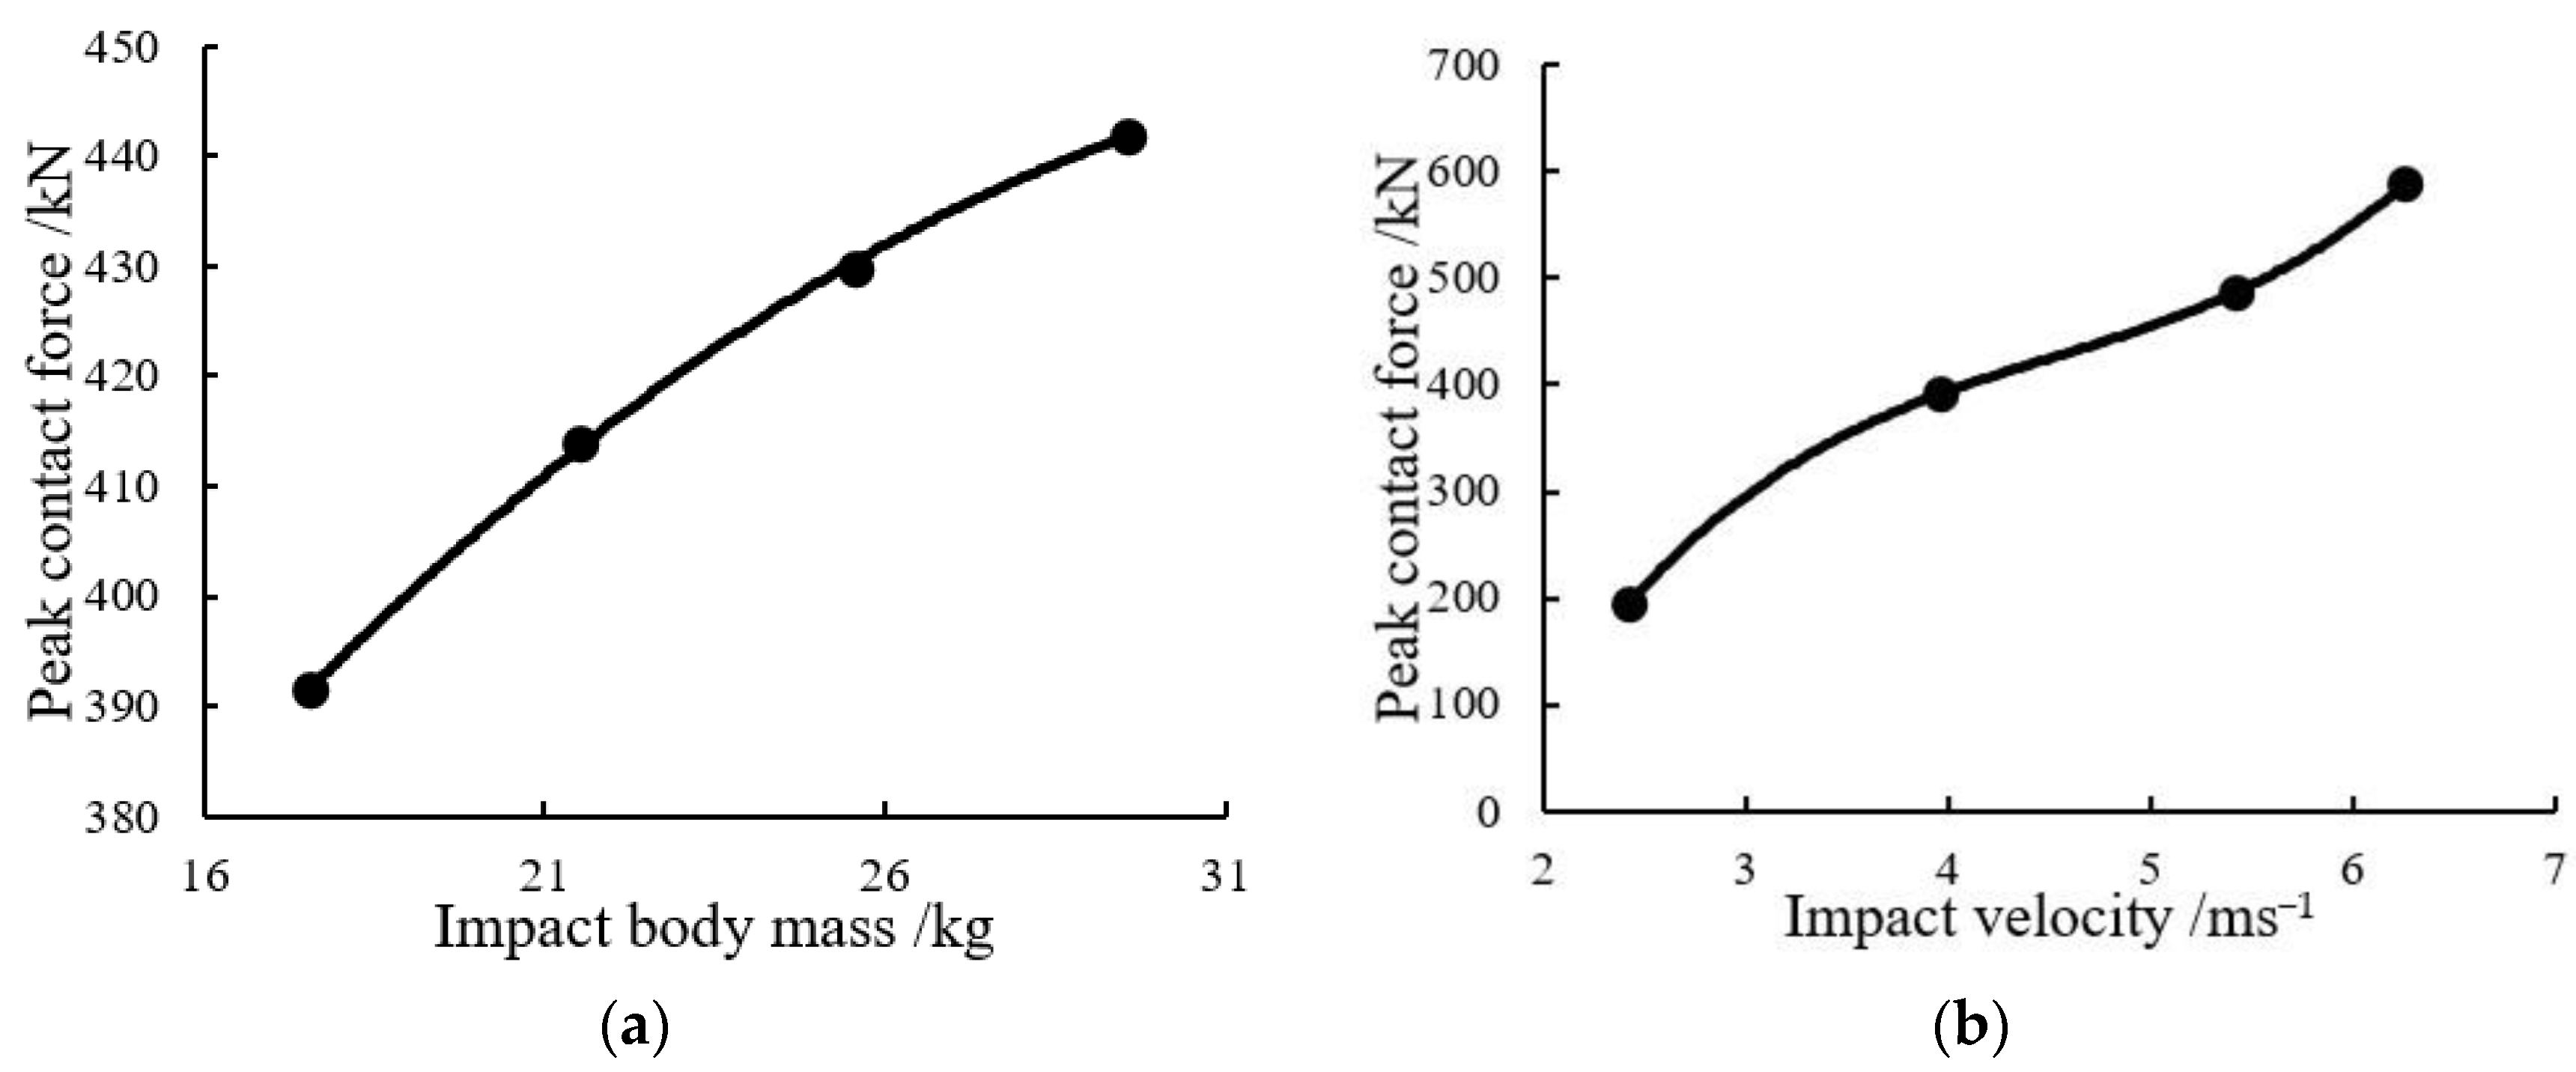
5.1. Effect of Impact Energy
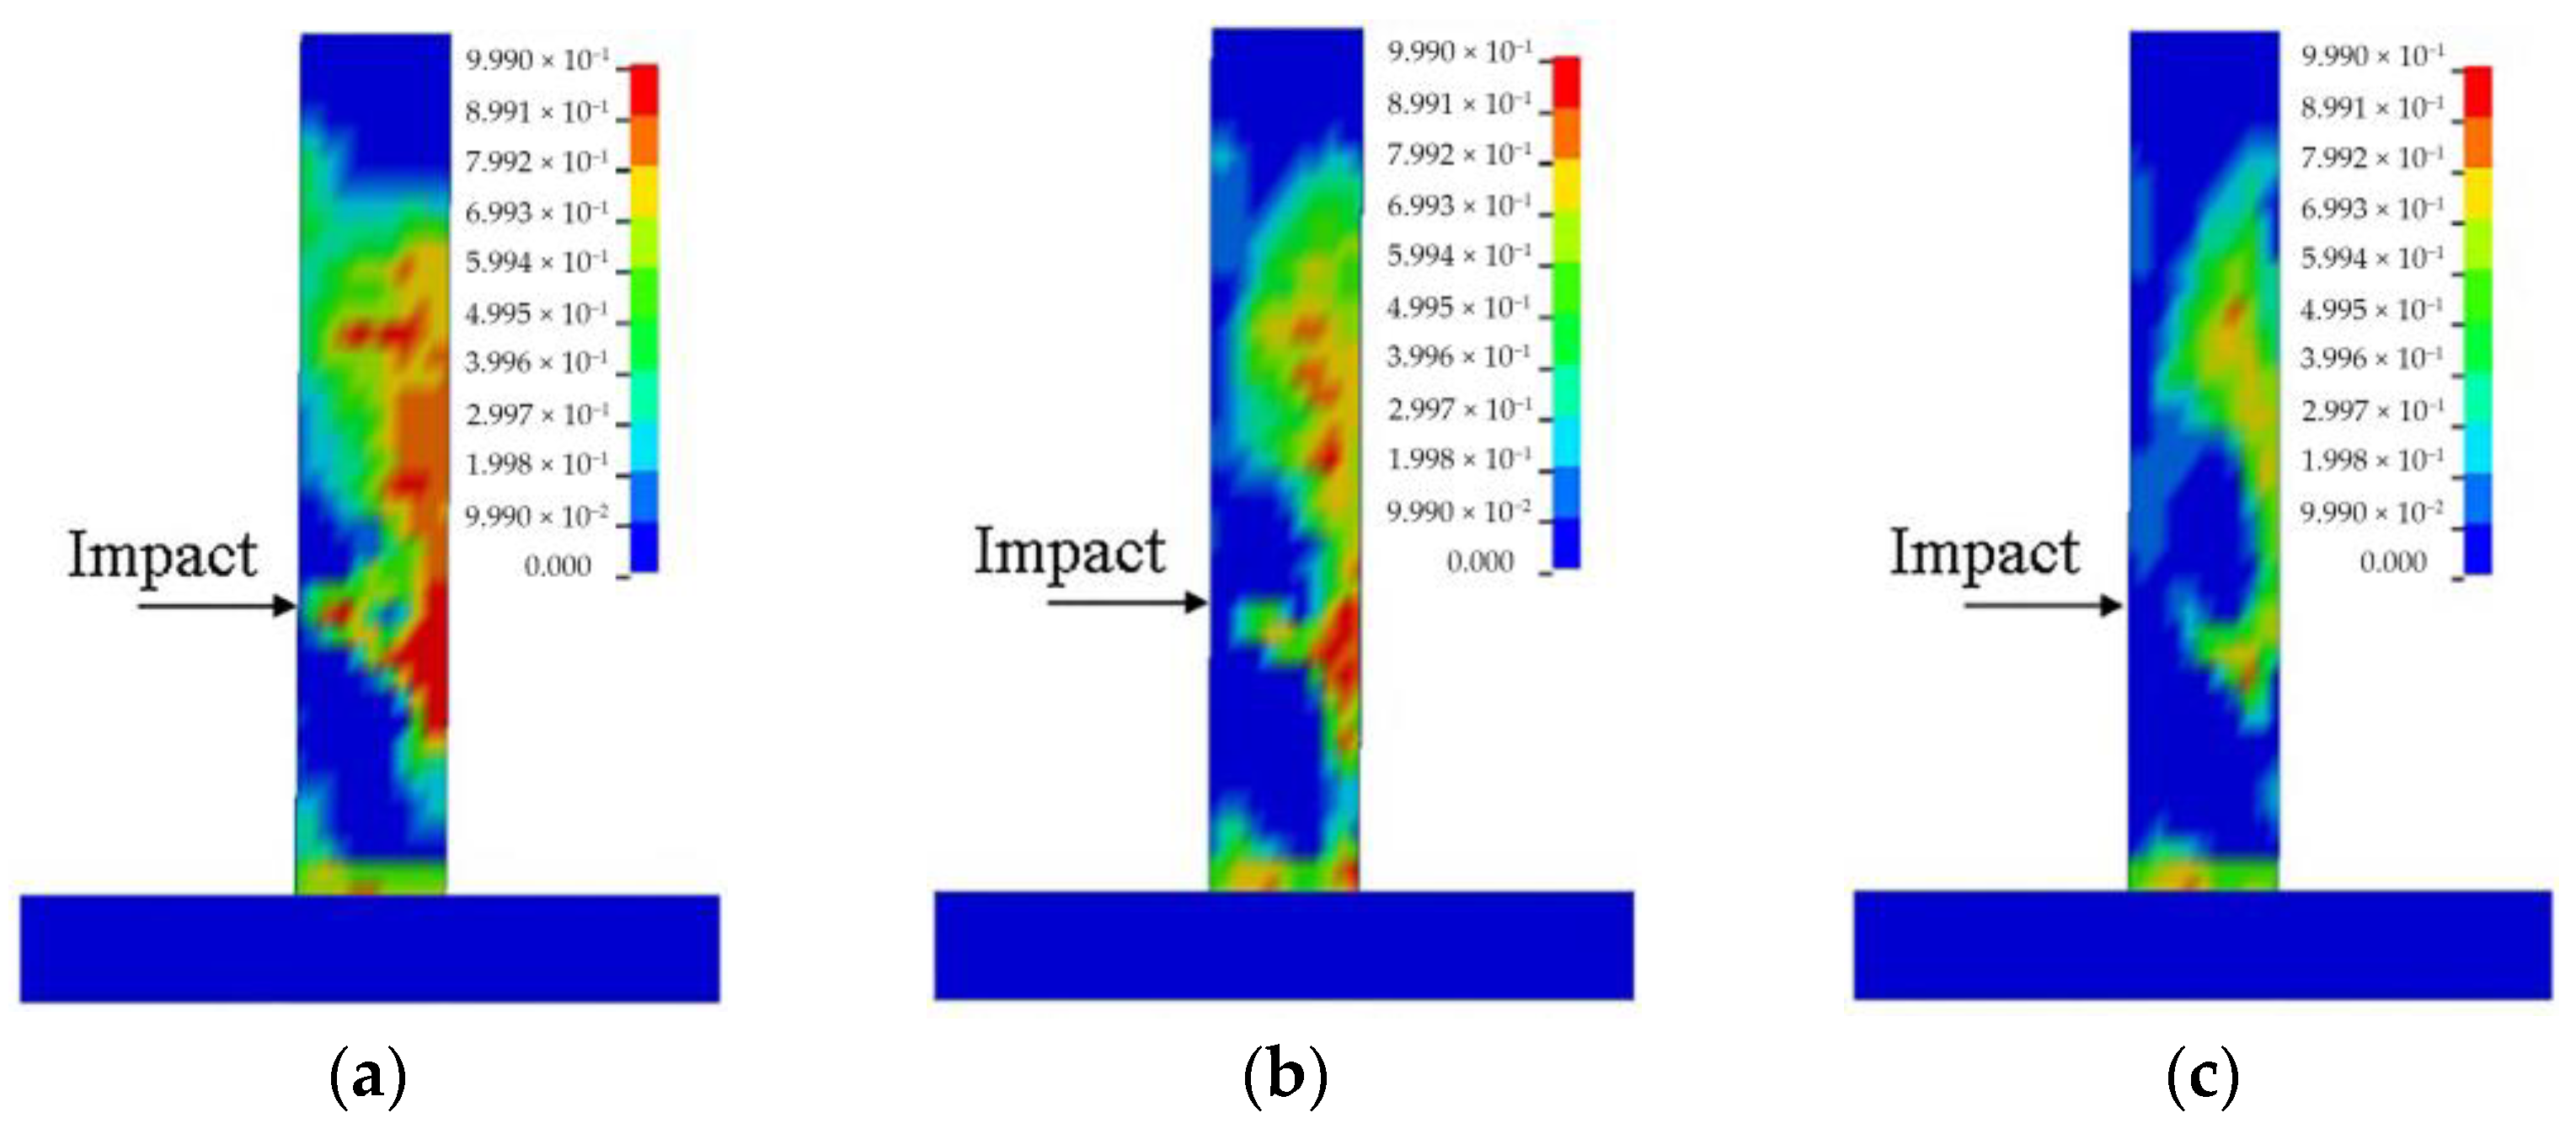
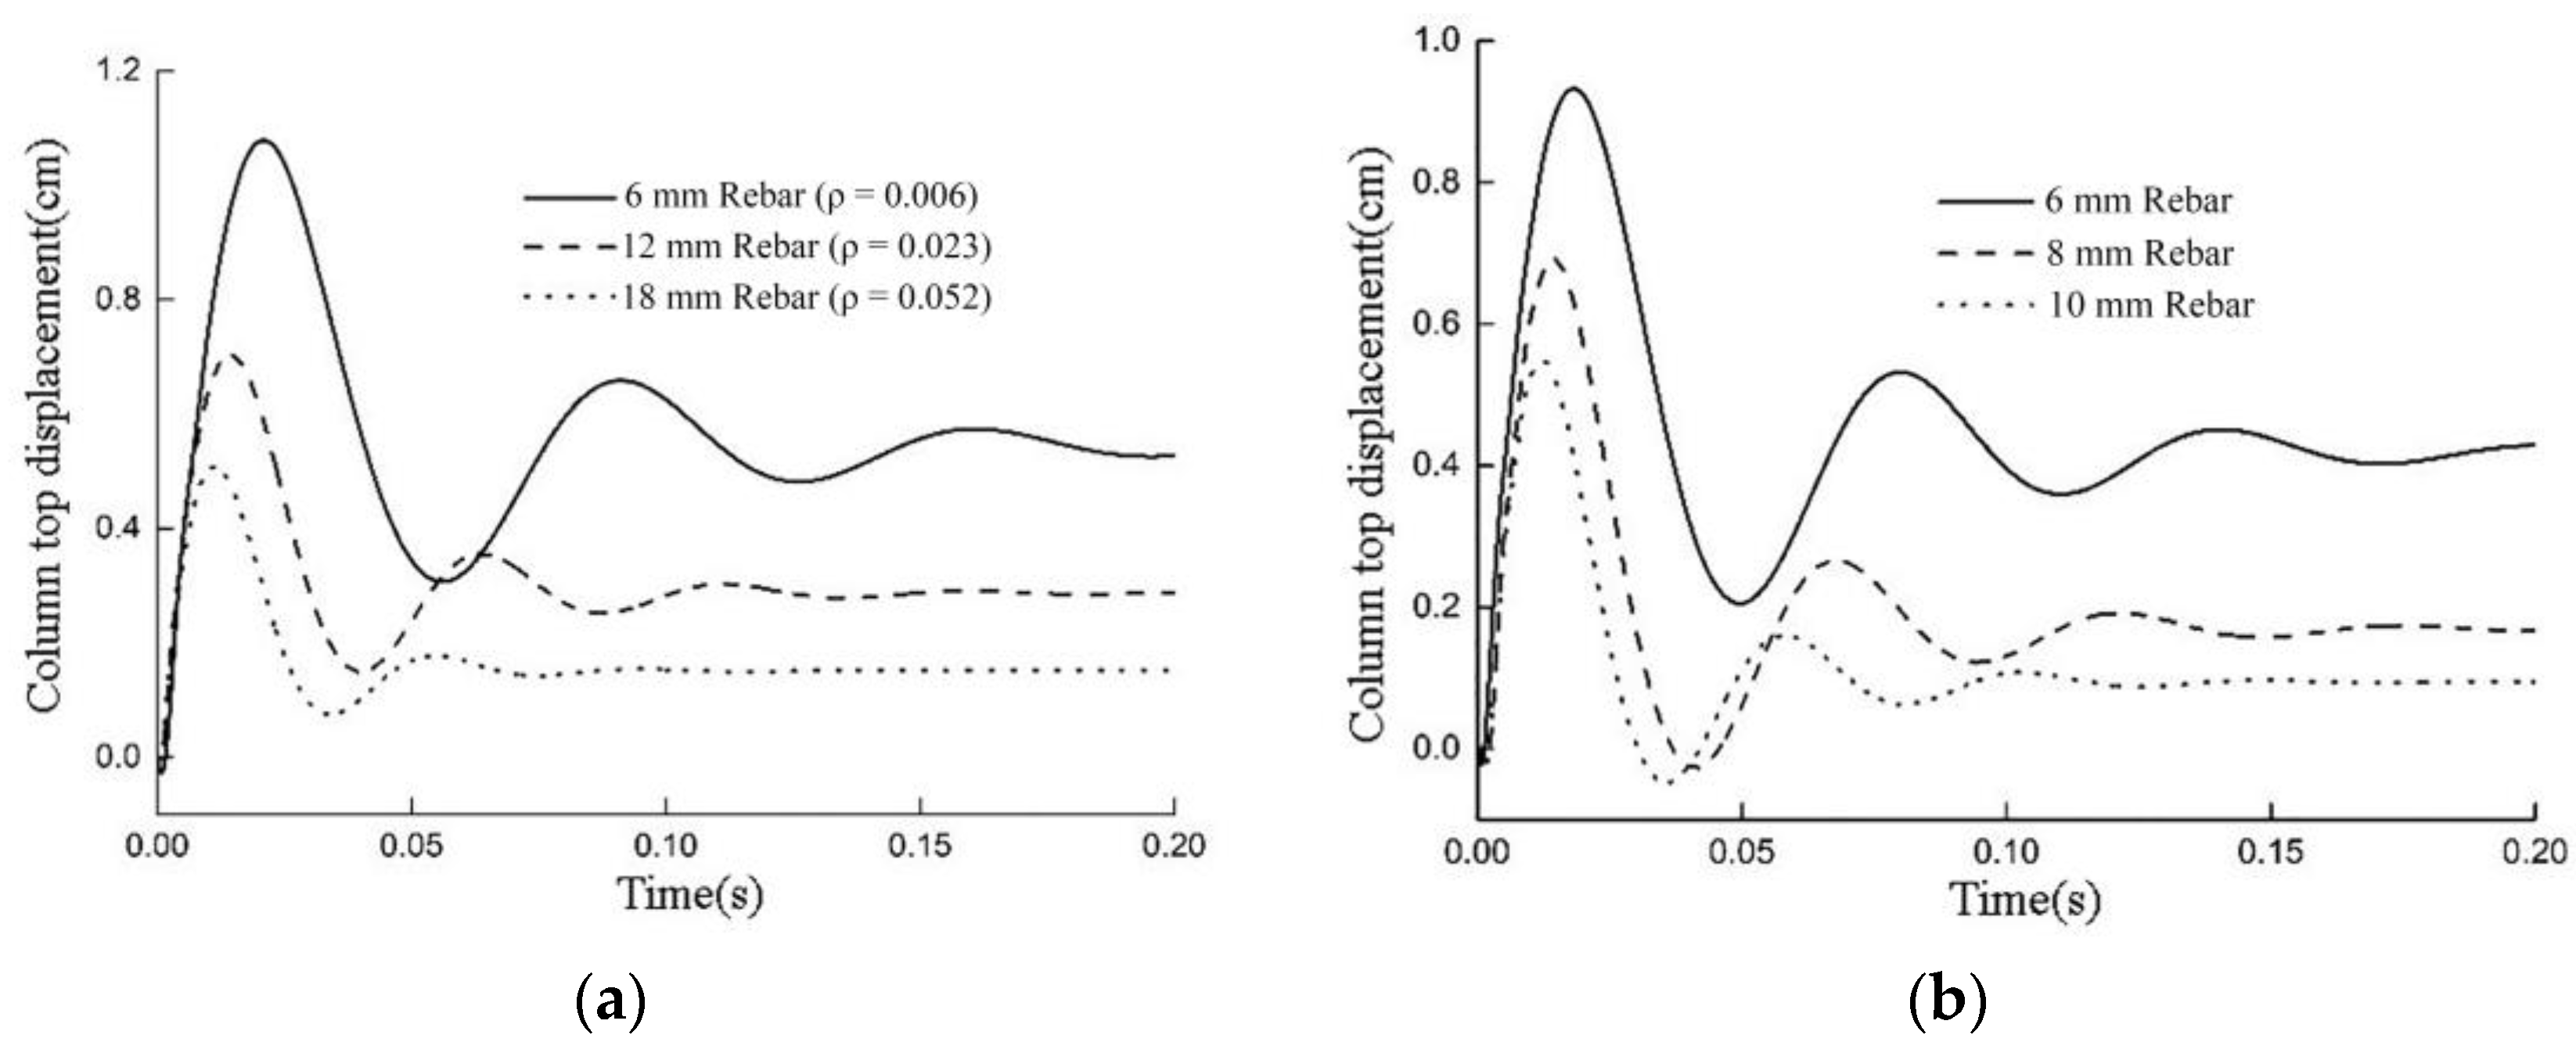
5.2. Effect of Reinforcement Ratio
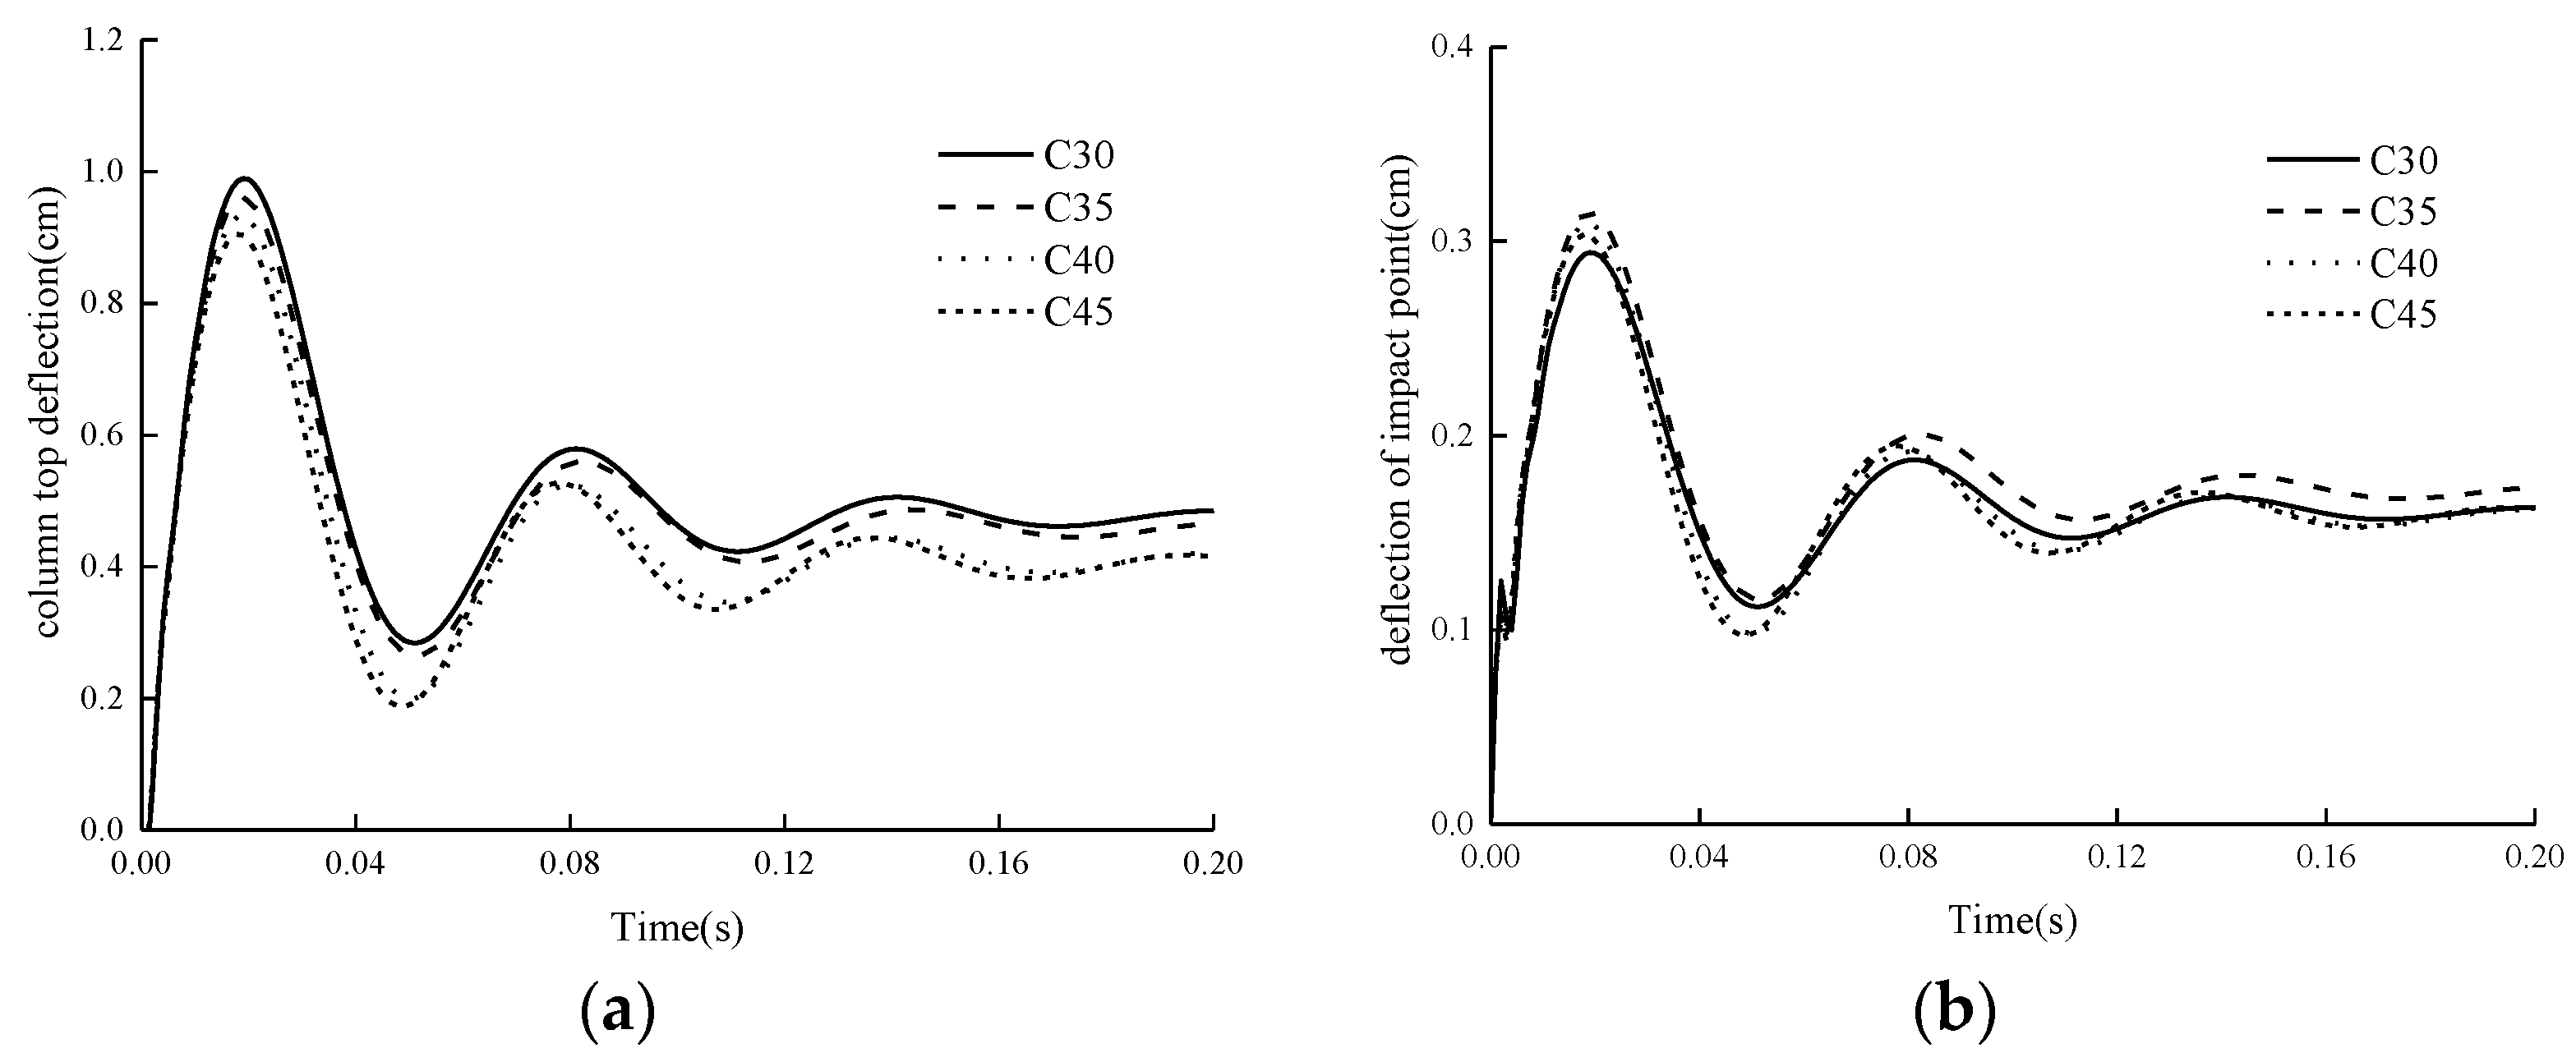
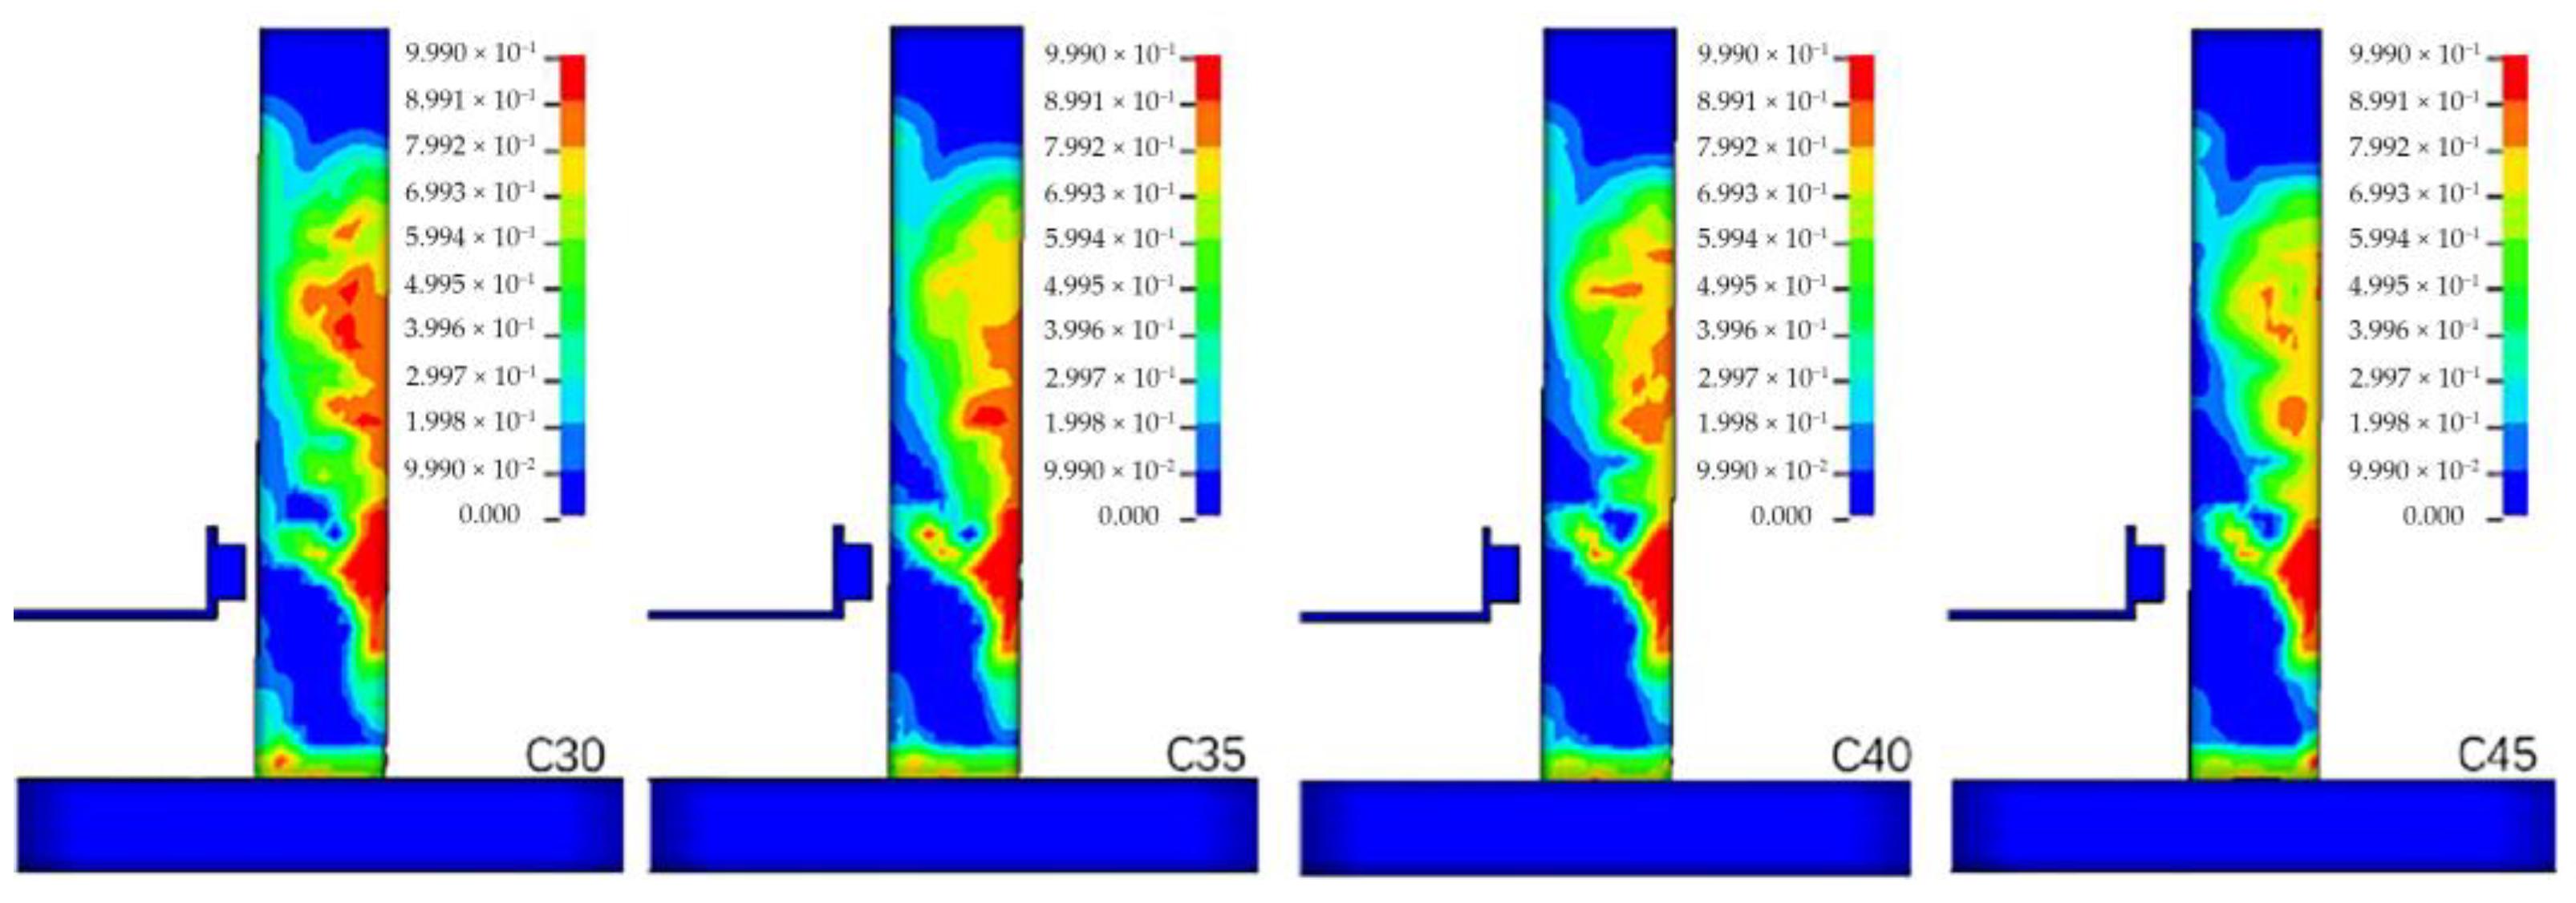
5.3. Effect of Concrete Strength Grade
5.4. Effect of Slenderness Ratio
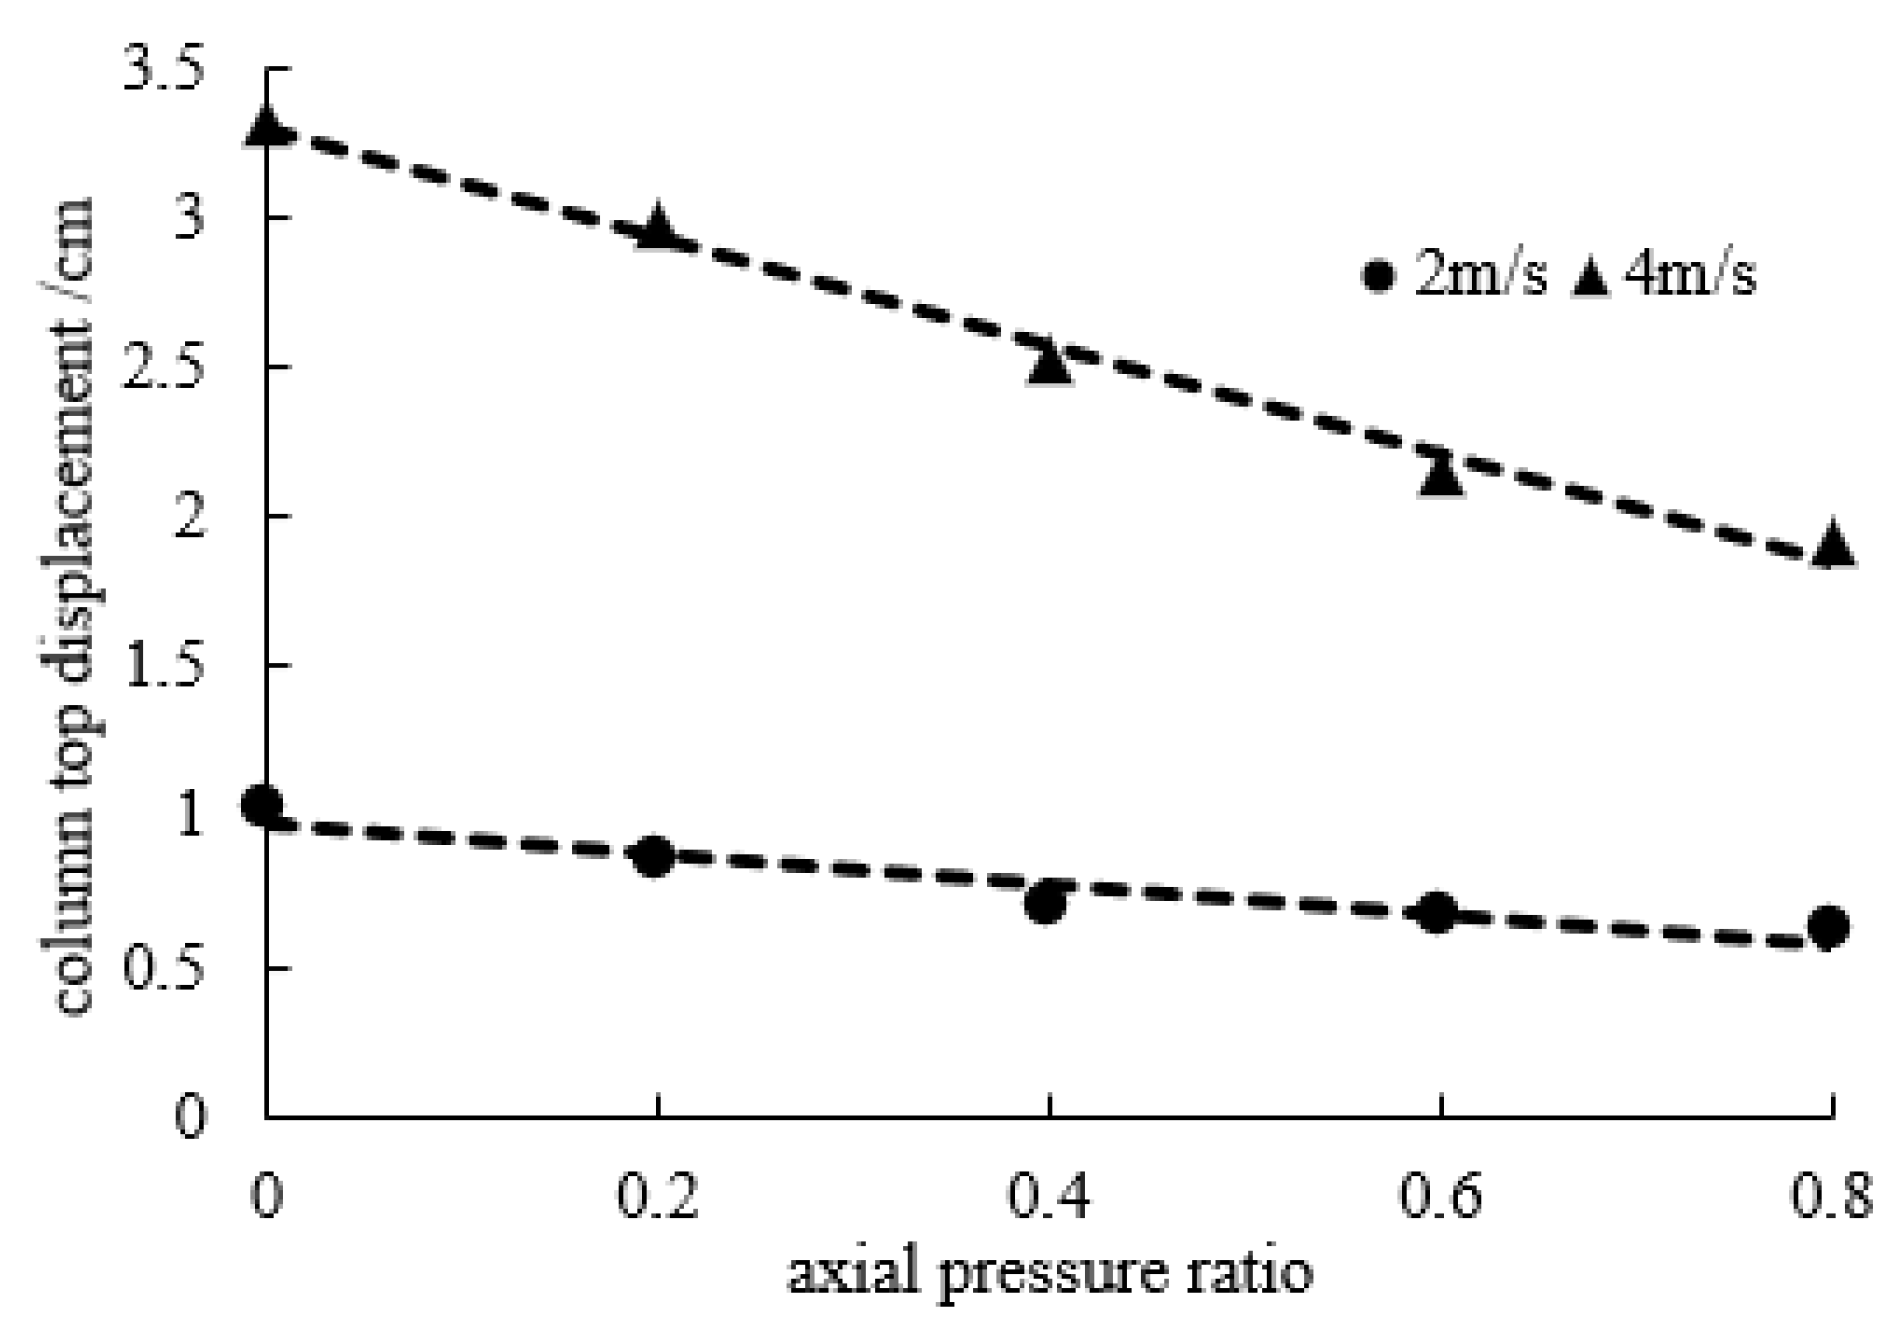
5.5. Effect of Axial Compression Ratio
6. Conclusions
Author Contributions
Funding
Data Availability Statement
Conflicts of Interest
References
- Buth, C.E.; Williams, W.F.; Brackin, M.S.; Lord, D.; Geedipally, S.R.; Abu-Odeh, A.Y. Analysis of Large Truck Collisions with Bridge Piers: Phase 1, Report of Guidelines for Designing Bridge Piers and Abutments for Vehicle Collisions; Texas Transportation Institute: College Station, TX, USA, 2010. [Google Scholar]
- Lu, Y.E.; Zhang, L.M. Progressive collapse of a drilled-shaft bridge foundation under vessel impact. Ocean. Eng. 2013, 66, 101–112. [Google Scholar] [CrossRef]
- Abrams, D.A. Effect of rate of application of load on the compressive strength of concrete. Proc. ASTM 1956, 17, 364–377. [Google Scholar]
- Hughes, B.P.; Watson, A.J. Compressive strength and ultimate strain of concrete under impact loading. Mag. Concr. Res. 1978, 30, 189–199. [Google Scholar] [CrossRef]
- John, R.; Shah, S.P. Effects of high strength and rate of loading on fracture parameters of concrete. In Fracture of Concrete and Rock, Proceedings of the SEM-RILEM International Conference, Houston, TX, USA, 17–19 June 1987; Springer: New York, NY, USA, 1987; pp. 35–52. [Google Scholar]
- Ross, C.A.; Thompson, P.Y.; Tedesco, J.W. Split-Hopkinson pressure-bar tests on concrete and mortar in tension and compression. ACI Mater. J. 1989, 86, 475–481. [Google Scholar]
- Bischoff, P.H.; Perry, S.H. Compressive behaviour of concrete at high strain rates. RIELM Mater. Struct. 1991, 24, 425–450. [Google Scholar] [CrossRef]
- Bazant, Z.P.; Gu, W.H.; Faber, K.T. Softening reversal and other effects of a change in loading rate on fracture of concrete. ACI Mater. J. 1995, 92, 3–9. [Google Scholar]
- Kishi, N.; Mikami, H.; Matsuoka, K.G.; Ando, T. Impact behavior of shear-failure-type RC beams without shear rebar. Int. J. Impact Eng. 2002, 27, 955–968. [Google Scholar] [CrossRef]
- Fujikake, K.; Li, B.; Soeun, S. Impact response of reinforced concrete beam and its analytical evaluation. J. Struct. Eng. 2009, 135, 938. [Google Scholar] [CrossRef]
- Pham, T.M.; Hao, H. Plastic hinges and inertia forces in RC beams under impact loads. Int. J. Impact Eng. 2017, 103, 1–11. [Google Scholar] [CrossRef] [Green Version]
- Jahami, A.; Temsah, Y.; Khatib, J.; Sonebi, M. Rehabilitation of reinforced concrete slabs damaged by impact loading using swimmers as shear reinforcement. Mater. Today Proc. 2022, 58, 1251–1257. [Google Scholar] [CrossRef]
- Mingyang, W.; Derong, W.; Chunming, S. A calculation method of reinforced concrete beam under low velocity impact. Acta Armamentarii 2006, 27, 399–405. [Google Scholar]
- Jiang, H.; Wang, X.; He, S. Numerical simulation of impact tests on reinforced concrete beams. Mater. Des. 2012, 39, 111–120. [Google Scholar] [CrossRef]
- Thilakarathna, H.M.I.; Thambiratnam, D.P.; Dhanasekar, M.; Perera, N. Numerical simulation of axially loaded concrete columns under transverse impact and vulnerability assessment. Int. J. Impact Eng. 2010, 37, 1100–1112. [Google Scholar] [CrossRef] [Green Version]
- Li, T.; Cong, Z.; Hao, W.; Xinhua, F. Dynamic response and failure modes of RC columns under impact. Eng. Mech. 2013, 30, 150–155. [Google Scholar]
- Bertrand, D.; Kassem, F.; Delhomme, F.; Limam, A. Reliability analysis of an RC member impacted by a rockfall using a nonlinear SDOF model. Eng. Struct. 2015, 89, 93–102. [Google Scholar] [CrossRef]
- Cai, J.; Ye, J.B.; Chen, Q.J.; Liu, X.; Wang, Y.Q. Dynamic behaviour of axially-loaded RC columns under horizontal impact loading. Eng. Struct. 2018, 168, 684–697. [Google Scholar] [CrossRef]
- Zhang, X.; Hao, H.; Li, C.; Van Do, T. Experimental study on the behavior of precast segmental column with domed shear key and un-bonded Post-Tensioning tendon under impact loading. Eng. Struct. 2018, 173, 589–605. [Google Scholar] [CrossRef]
- Fan, W.; Liu, B.; Huang, X.; Sun, Y. Efficient modeling of flexural and shear behaviors in reinforced concrete beams and columns subjected to low-velocity impact loading. Eng. Struct. 2019, 195, 22–50. [Google Scholar] [CrossRef]
- Yilmaz, T.; Kiraç, N.; Anil, Ö. Experimental investigation of axially loaded reinforced concrete square column subjected to lateral low-velocity impact loading. Struct. Concr. 2019, 20, 1358–1378. [Google Scholar] [CrossRef]
- Zhao, W.; Qian, J. Resistance mechanism and reliability analysis of reinforced concrete columns subjected to lateral impact. Int. J. Impact Eng. 2020, 136, 103413. [Google Scholar] [CrossRef]
- Murray, Y.D.; Abu-Odeh, A.Y.; Bligh, R.P. Evaluation of LS-DYNA Concrete Material Model 159; Federal Highway Administration, Office of Research, Development, and Technology: Washington, DC, USA, 2007. [Google Scholar]
- Halquist, J. LS-DYNA Keyword User’s Manual, Version 971; Livermore Software Technology Corporation: Livermore, CA, USA, 2007. [Google Scholar]
- Kong, X.; Fang, Q.; Wu, H.; Peng, Y. Numerical predictions of cratering and scabbing in concrete slabs subjected to projectile impact using a modified version of HJC material model. Int. J. Impact Eng. 2016, 95, 61–71. [Google Scholar] [CrossRef]
- Cowper, G.R.; Symonds, P.S. Strain-Hardening and Strain-Rate Effects in the Impact Loading of Cantilever Beams; Brown University: Providence, RI, USA, 1957. [Google Scholar]
- Chu, L.M.; Zhang, L.M. Centrifuge modeling of ship impact loads on bridge pile foundations. J. Geotech. Geoenviron. Eng. 2011, 137, 405–420. [Google Scholar] [CrossRef]
- He, S.; Wang, X. Experimental study on lateral impact resistance of reinforced concrete columns with axial compression ratio. J. Hebei Polytech. Univ. (Nat. Sci. Ed.) 2011, 33, 117–121. [Google Scholar]
- Wang, H. Experimental study on shear behavior of reinforced concrete short columns under compression and bending. J. Xi’an Univ. Archit. Technol. (Nat. Sci. Ed.) 1989, 1, 76–84. [Google Scholar]
- Zhou, X. Research on Restoring Force Characteristics of Reinforced Concrete Shear Failure Column under Bending and Shearing. J. Xi’an Univ. Archit. Technol. (Nat. Sci. Ed.) 1992, 3, 235–242. [Google Scholar]


| Column Number | Test Number | Impact Mass (kg) | Drop Heights (cm) | Axial Pressure |
|---|---|---|---|---|
| C_1 | 1-1 | 17.55 | 30, 80, 150, 200 | None |
| 1-2 | 21.55 | 30, 80, 150, 200 | None | |
| 1-3 | 25.55 | 30, 80, 150, 200 | None | |
| C_2 | 2-1 | 17.55 | 30, 80, 150, 200 | None |
| 2-2 | 21.55 | 30, 80, 150, 200 | None | |
| 2-3 | 25.55 | 30, 80, 150, 200 | None | |
| C_3 | 3-1 | 17.55 | 30, 80, 150, 200 | None |
| 3-2 | 17.55 | 30, 80, 150, 200 | 20% Pu | |
| 3-3 | 17.55 | 30, 80, 150, 200 | 40% Pu | |
| 3-4 | 17.55 | 30, 80, 150, 200 | 60% Pu | |
| 3-5 | 17.55 | 30, 80, 150, 200 | 80% Pu |
Disclaimer/Publisher’s Note: The statements, opinions and data contained in all publications are solely those of the individual author(s) and contributor(s) and not of MDPI and/or the editor(s). MDPI and/or the editor(s) disclaim responsibility for any injury to people or property resulting from any ideas, methods, instructions or products referred to in the content. |
© 2023 by the authors. Licensee MDPI, Basel, Switzerland. This article is an open access article distributed under the terms and conditions of the Creative Commons Attribution (CC BY) license (https://creativecommons.org/licenses/by/4.0/).
Share and Cite
Chen, A.; Liu, Y.; Ma, R.; Zhou, X. Experimental and Numerical Analysis of Reinforced Concrete Columns under Lateral Impact Loading. Buildings 2023, 13, 708. https://doi.org/10.3390/buildings13030708
Chen A, Liu Y, Ma R, Zhou X. Experimental and Numerical Analysis of Reinforced Concrete Columns under Lateral Impact Loading. Buildings. 2023; 13(3):708. https://doi.org/10.3390/buildings13030708
Chicago/Turabian StyleChen, Airong, Yanjie Liu, Rujin Ma, and Xiaoyu Zhou. 2023. "Experimental and Numerical Analysis of Reinforced Concrete Columns under Lateral Impact Loading" Buildings 13, no. 3: 708. https://doi.org/10.3390/buildings13030708