1. Introduction
This work contains and expands the findings presented at the 10th ReUSO Documentation, Restoration and Reuse of Heritage Congress (Porto, Portugal, 2022) [
1].
The characterisation of the seismic vulnerability of large groups of buildings is a challenging task in which material and human resources must be optimised to obtain reliable information in a reasonable amount of time. Despite several simplified approaches that have been found suitable for assessing the seismic vulnerability of historical constructions, many of them require a customised approach regarding structural surveying instead of applying more generalised characterisations. For example, the analysis of mechanisms of collapse [
2] requires detailed knowledge of the structure, the retrofitting and strengthening actions. This approach may not be suitable for obtaining information from large sets of constructions in which access is not always granted. The use of numerical models (e.g., BIM, HBIM and FMA models) is suitable when the mechanical characterisation of the components and materials is reasonably well defined [
3,
4]. Nevertheless, these approaches can be found limited when such characterisation is not reliable or available. Some other simplified approaches are centred on offering a partial assessment of the buildings, such as the mechanical characterisation of the structural elements. A relevant method in this context is that of the Masonry Quality Index (MQI), which allows a fairly good estimation of the mechanical properties of masonry walls based on a series of features related to the constitution, arrangement and quality of the masonry fabrics well as the components of the system [
5]. Despite their utility, these strategies may not represent the overall behaviour or vulnerability of the structure. Therefore, for achieving a more representative assessment it becomes necessary to perform both comprehensive and straightforward survey strategies that can allow recognising a structure based on a limited (and desirable standardised) set of paramount building features.
This condition is compatible with the implementation of simplified and often parametric approaches, namely based on the material and geometrical properties of structures. These strategies, widely discussed by Nurullah et al. [
6], are relatively easy to implement if such characterisation is based on classifying features (i.e., categorising features within a limited range or a discrete number of classes) instead of performing customised surveys. However, it is still common to perform data-acquisition campaigns based on paper datasheets that are later transferred and managed on informatics platforms. Some examples of this approach are given in the Rapid Seismic Vulnerability Assessment developed by Nanda et al. [
7], the survey form for masonry buildings of Guiliani [
8], the model of the Bihar State Disaster Management Authority (India) [
9] or the CARTIS datasheet for the typological characterisation towards seismic risk [
10]. There are territorial-scale applications that have used similar approaches for assessing other types of vulnerabilities, such as the implementation performed by Salvati et al. [
11] for assessing geo-hydrological hazards.
This approach has several advantages because of the relatively small amount of resources that are needed but can become problematic when applied to large-scale samples, such as urban-scale sets of constructions. Furthermore, these problems can be increased when dealing with emergencies, such as post-seismic data acquisition. In this context, the optimisation of these campaigns by using computational resources is a promising alternative. Some relevant examples in this sense are devoted to the automatic characterisation of external features by using machine-learning methods (such as the Vulnerability Analysis and Machine Learning—VULMA—developed by Ruggieri et al. [
12]), or the design of damage functions based on typological categorisations, such as the one designed by Rosti et al. [
13].
The use of digital tools for minimising the bridge between the on-field campaigns and outcomes obtention is still an open field in which a feasible and straightforward workflow could become a valuable resource for implementing large-scale seismic vulnerability assessments even for settlements in which human, computational and material resources are limited. This situation is common in many countries in which masonry buildings are still predominant for satisfying housing needs (e.g., in the Mediterranean region, the Middle East and Latin America) [
14].
Even within the same country, the capacity for assessing building stock after strong seismic events can be very asymmetrical, with notorious differences between big and relatively small human settlements. The 2017 Earthquakes in Mexico are particular examples of how the structural reconnaissance and needed survey almost immediately reached the capital and the surrounding areas [
15,
16], while the information regarding the survey and number of damaged structures was much slower in smaller (often isolated) regions [
17]. This fact invites us to consider how these large-scale assessment approaches can become standardised civil protection procedures for enhancing emergency response and resource management. Despite this work presenting an implementation based on a proactive survey (i.e., for assessing the seismic vulnerability of historical constructions), it becomes important to consider that it can be implemented for performing reactive post-event data acquisition surveys. An easy-to-apply workflow is herein presented, emphasising the suitability and convenience of being implemented with open-source and free tools, facilitating its adoption and replication.
2. The Vulnerability Index-Based Methodology for Assessing the Seismic Vulnerability of Masonry Buildings
Gavarini [
18] states that «…the seismic vulnerability of a building is a quantity associated with its ‘weakness’ in front of earthquakes of a given intensity so that the value of this quantity and the knowledge of seismic hazard allow to evaluate the expected damages from future earthquakes». Determining how to measure this “weakness”, however, is the object of numerous approaches with different levels of complexity and accuracy [
19]. This problem becomes even more complex when dealing with masonry structures, in which the vast variety of materials, typologies and heterogeneity of solutions create difficulty in the adoption of generalised assumptions [
20]. Furthermore, the study of ancient structures adds a significatively large number of uncertainty sources, mostly related to the state of conservation, the presence of different constructive stages and long-term soil-structure interactions.
When dealing with large samples of constructions (e.g., in the context of a Historic Urban Landscape [
21]), it is convenient to use simplified standardised approaches for certain typologies. In the case of masonry constructions, the GNDT-II method has been widely used, calibrated and adapted. The original proposal [
22] considered ten parameters that rule the seismic behaviour of unreinforced masonry buildings. Subsequent calibrations led to the inclusion of additional evaluation parameters keeping, however, the original rationale—each parameter is evaluated through four vulnerability classes corresponding to increasing levels of vulnerability, which are then associated with weights whose value represents the relative significance of that parameter for the global seismic vulnerability of the building [
23]. These parameters comprise a series of qualitative and quantitative descriptors, such as geometrical and material features of the constructions. It is convenient to recall, however, that some of these parameters are meant to be categorised according to expert decisions and may be subjected to some subjective judgements.
The descriptive model used for this workflow (from here named Vulnerability Index-based Methodology or “VIM”) is the calibration used for the city of Atlixco (Puebla, México) of Ramírez Eudave and Ferreira [
16], with a total of 14 parameters (
Table 1).
This methodology allows calculating a vulnerability index (Equation (1)), which, for ease of use, is usually normalised to range from 0 to 100 (Equation (2)). This normalised value can be subsequently used to calculate the vulnerability value
V (Equation (3)), which, in turn, together with the ductility of the structure (
Q) and the macroseismic intensity
IEMS-98 allows for the estimation of a mean damage grade,
, as per Equation (4), considering an adjustment for seismic intensities lower than 7 (Equation (5)). Equations (1)–(5) have been adopted from the experience reported by Ramírez Eudave and Ferreira (2021b).
The mean damage grade is especially significative for establishing a correlation between the macroscopic evidence of damage (based on the presence of cracks, deformations, detachments, etc) and the numeric levels of damage, having comparative (yet relatively subjective) thresholds. A practical systematisation of this methodology is relevant for performing urban-scale assessments and would desirably include the parameters’ acquisition, the data treatment for calculating the vulnerability index and damage grades in the context of a certain seismic event.
3. Geodatabases for Managing the GNDT-II Survey
Using geodatabases is an efficient way of systematising the information related to vulnerability index-based approaches [
24]. These environments facilitate the association of multiple types of data on georeferenced entities (points, lines, polygons, etc.). Hence, these environments are very suitable for capturing, managing and displaying vulnerability-related surveys and outputs. The use of GIS is also very compatible with some other risk-related applications, such as seismic intensity maps and social vulnerability layers of information, becoming an enlargeable and robust base for developments.
A very common free and open-source software for this purpose is QGIS [
25]. This project of the OSGeo Foundation is widely known and used for different purposes, including research. Given its popularity, there is a continuous development of plug-ins and enhancements from independent actors, facilitating a flexible and customisable use of this tool. The high interoperability between QGIS and some commercial software is favoured by the use of open (non-proprietary) standards for data format, such as the GeoPackage (GPKG) format (developed by the Open Geospatial Consortium—OGC).
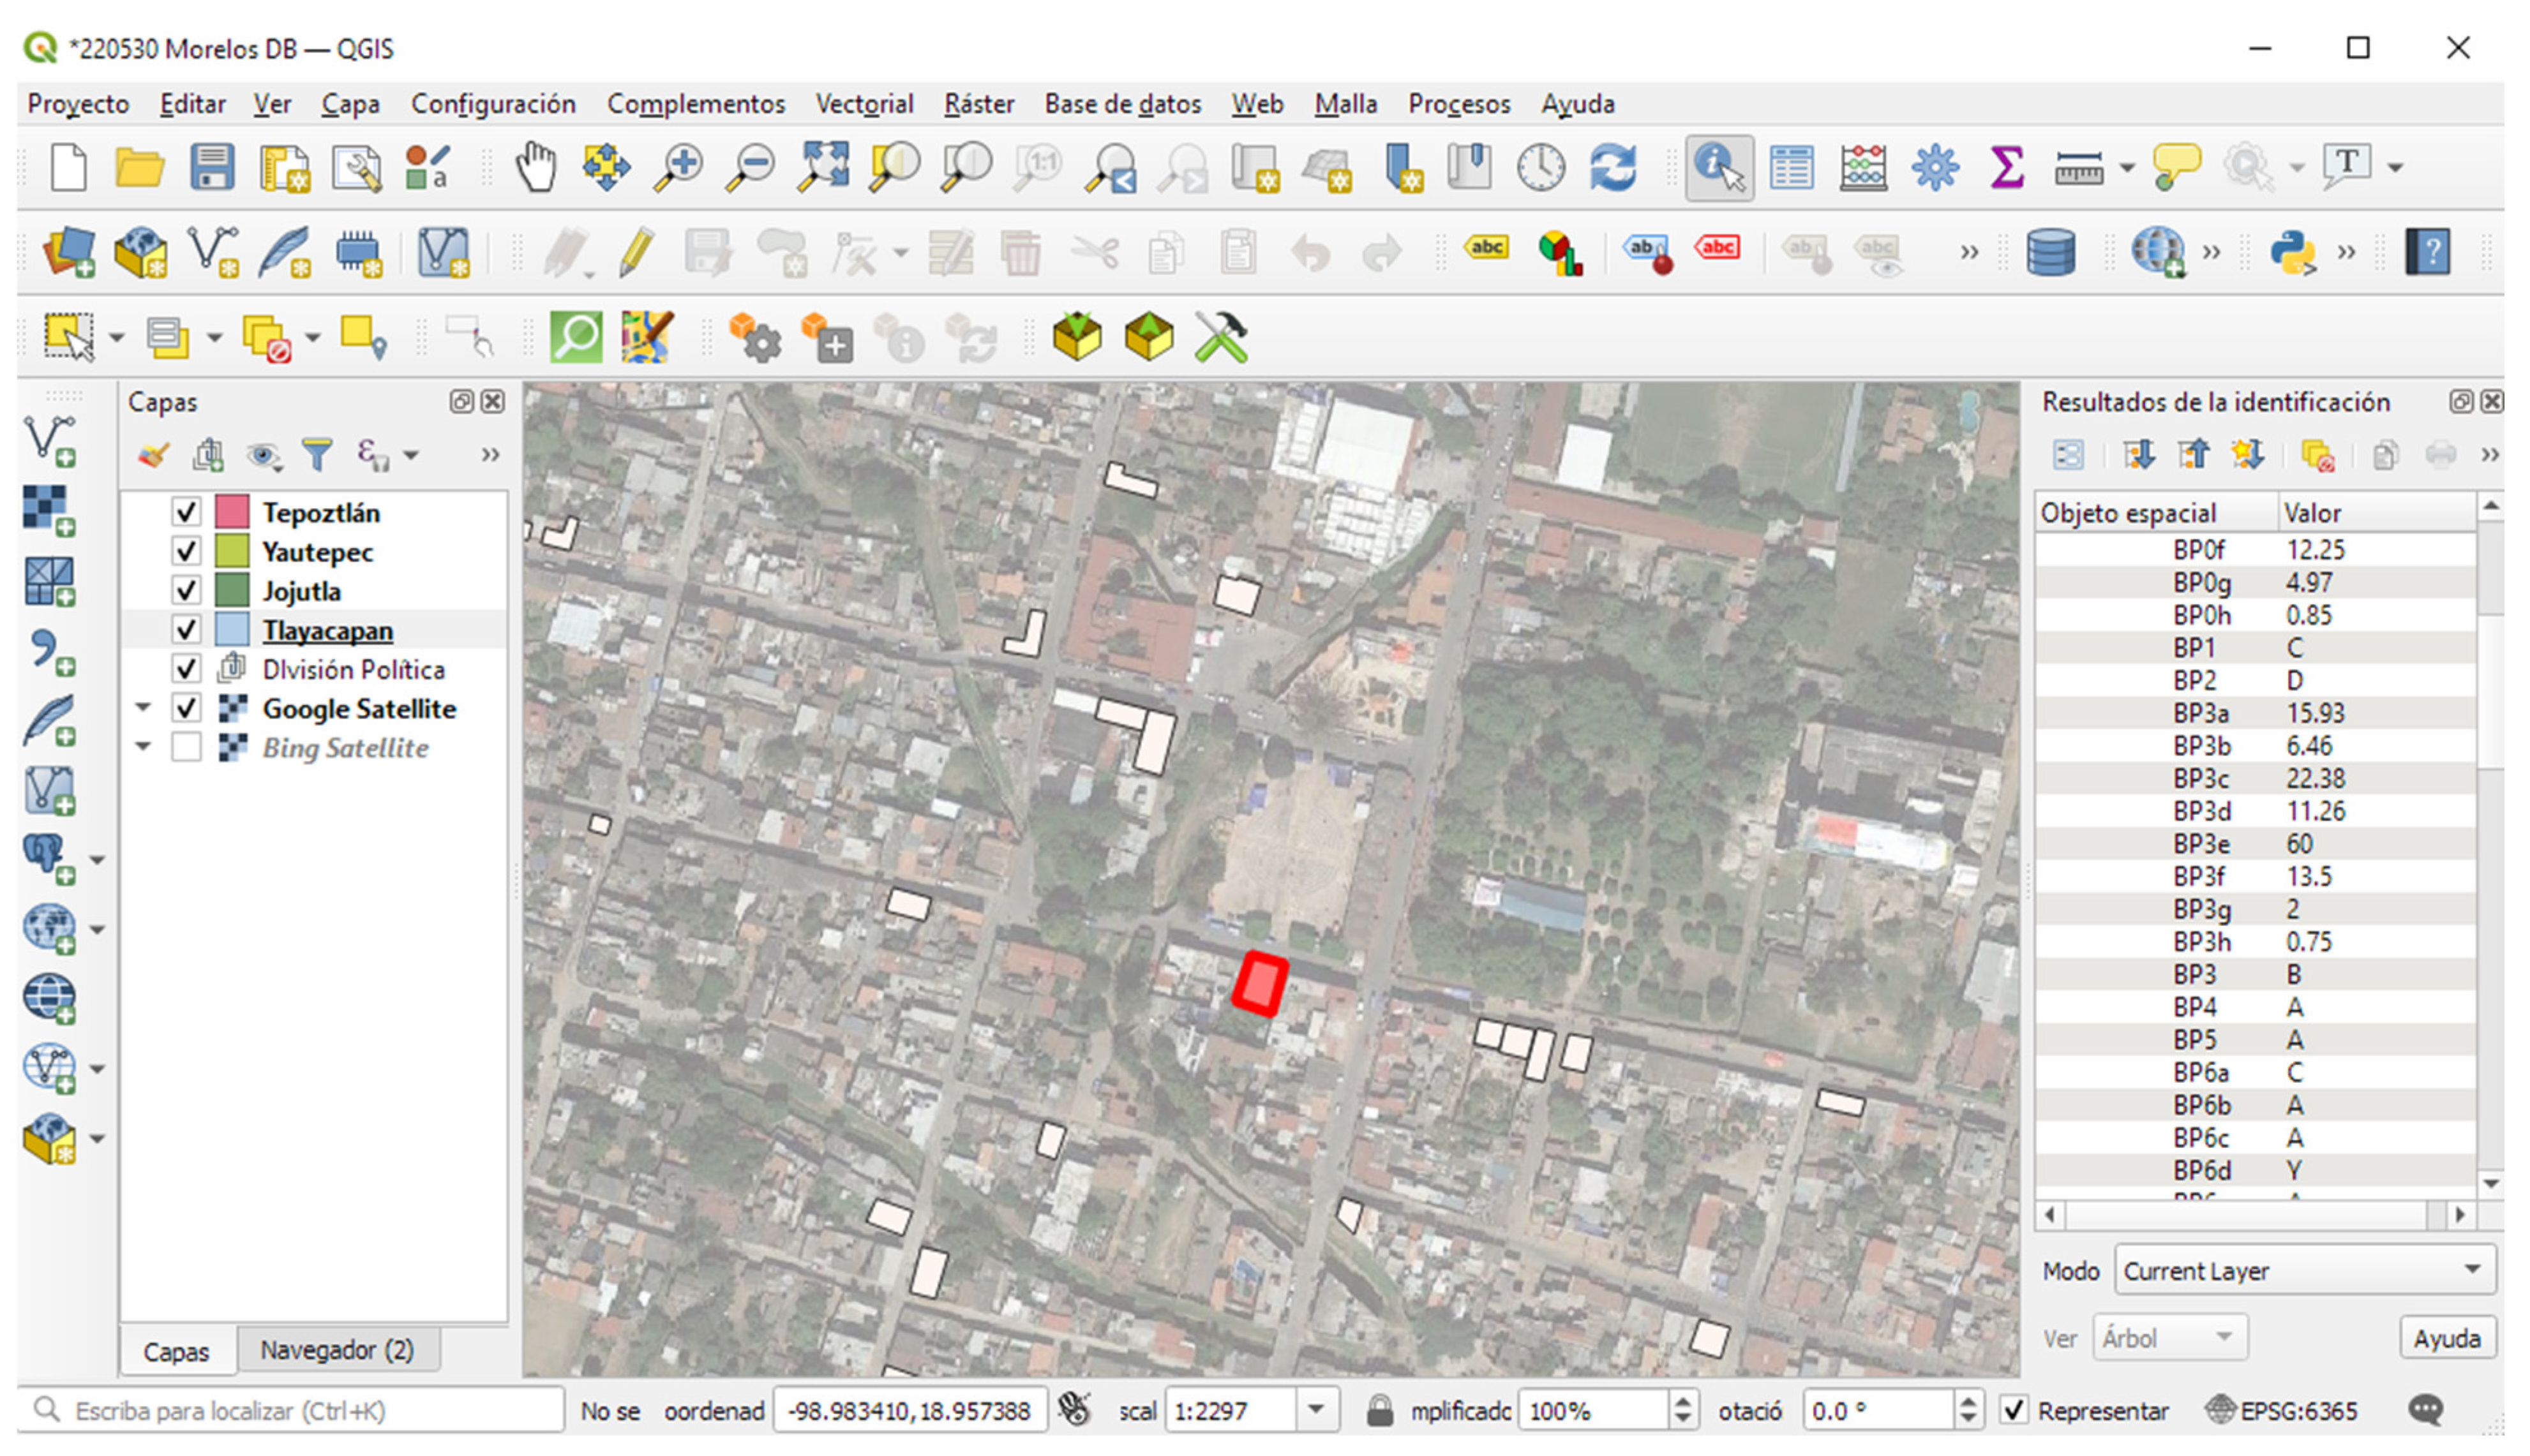
QGIS data organisation depends on managing several layers with geographical and geometrical entities in which every instance is related to several attributes with numeric, alphanumerical, Boolean or other types of data (
Figure 1). This attribute table can contain all the fields needed for performing the VIM approach in direct association with the spatial location of the construction. The setup and replicability of these (and other) customised attribute tables can be guaranteed by developing them by the means of Python-based scripts, that are easily run on a devoted console. These scripts facilitate setting the name of the variable, the type of data and the characteristics that the field can register (length, close lists of options, range of values, etc.).
Since layers can be stored (and managed) as independent GeoPackage files, it is possible to perform both read and write operations externally to the GIS software. It is also possible to publish and consult the layers from remote services, such as online sources. These actions can become very significant when sharing information among numerous stakeholders and professionals that are not familiar with GIS platforms and standards. This is a typical situation when performing risk assessments.
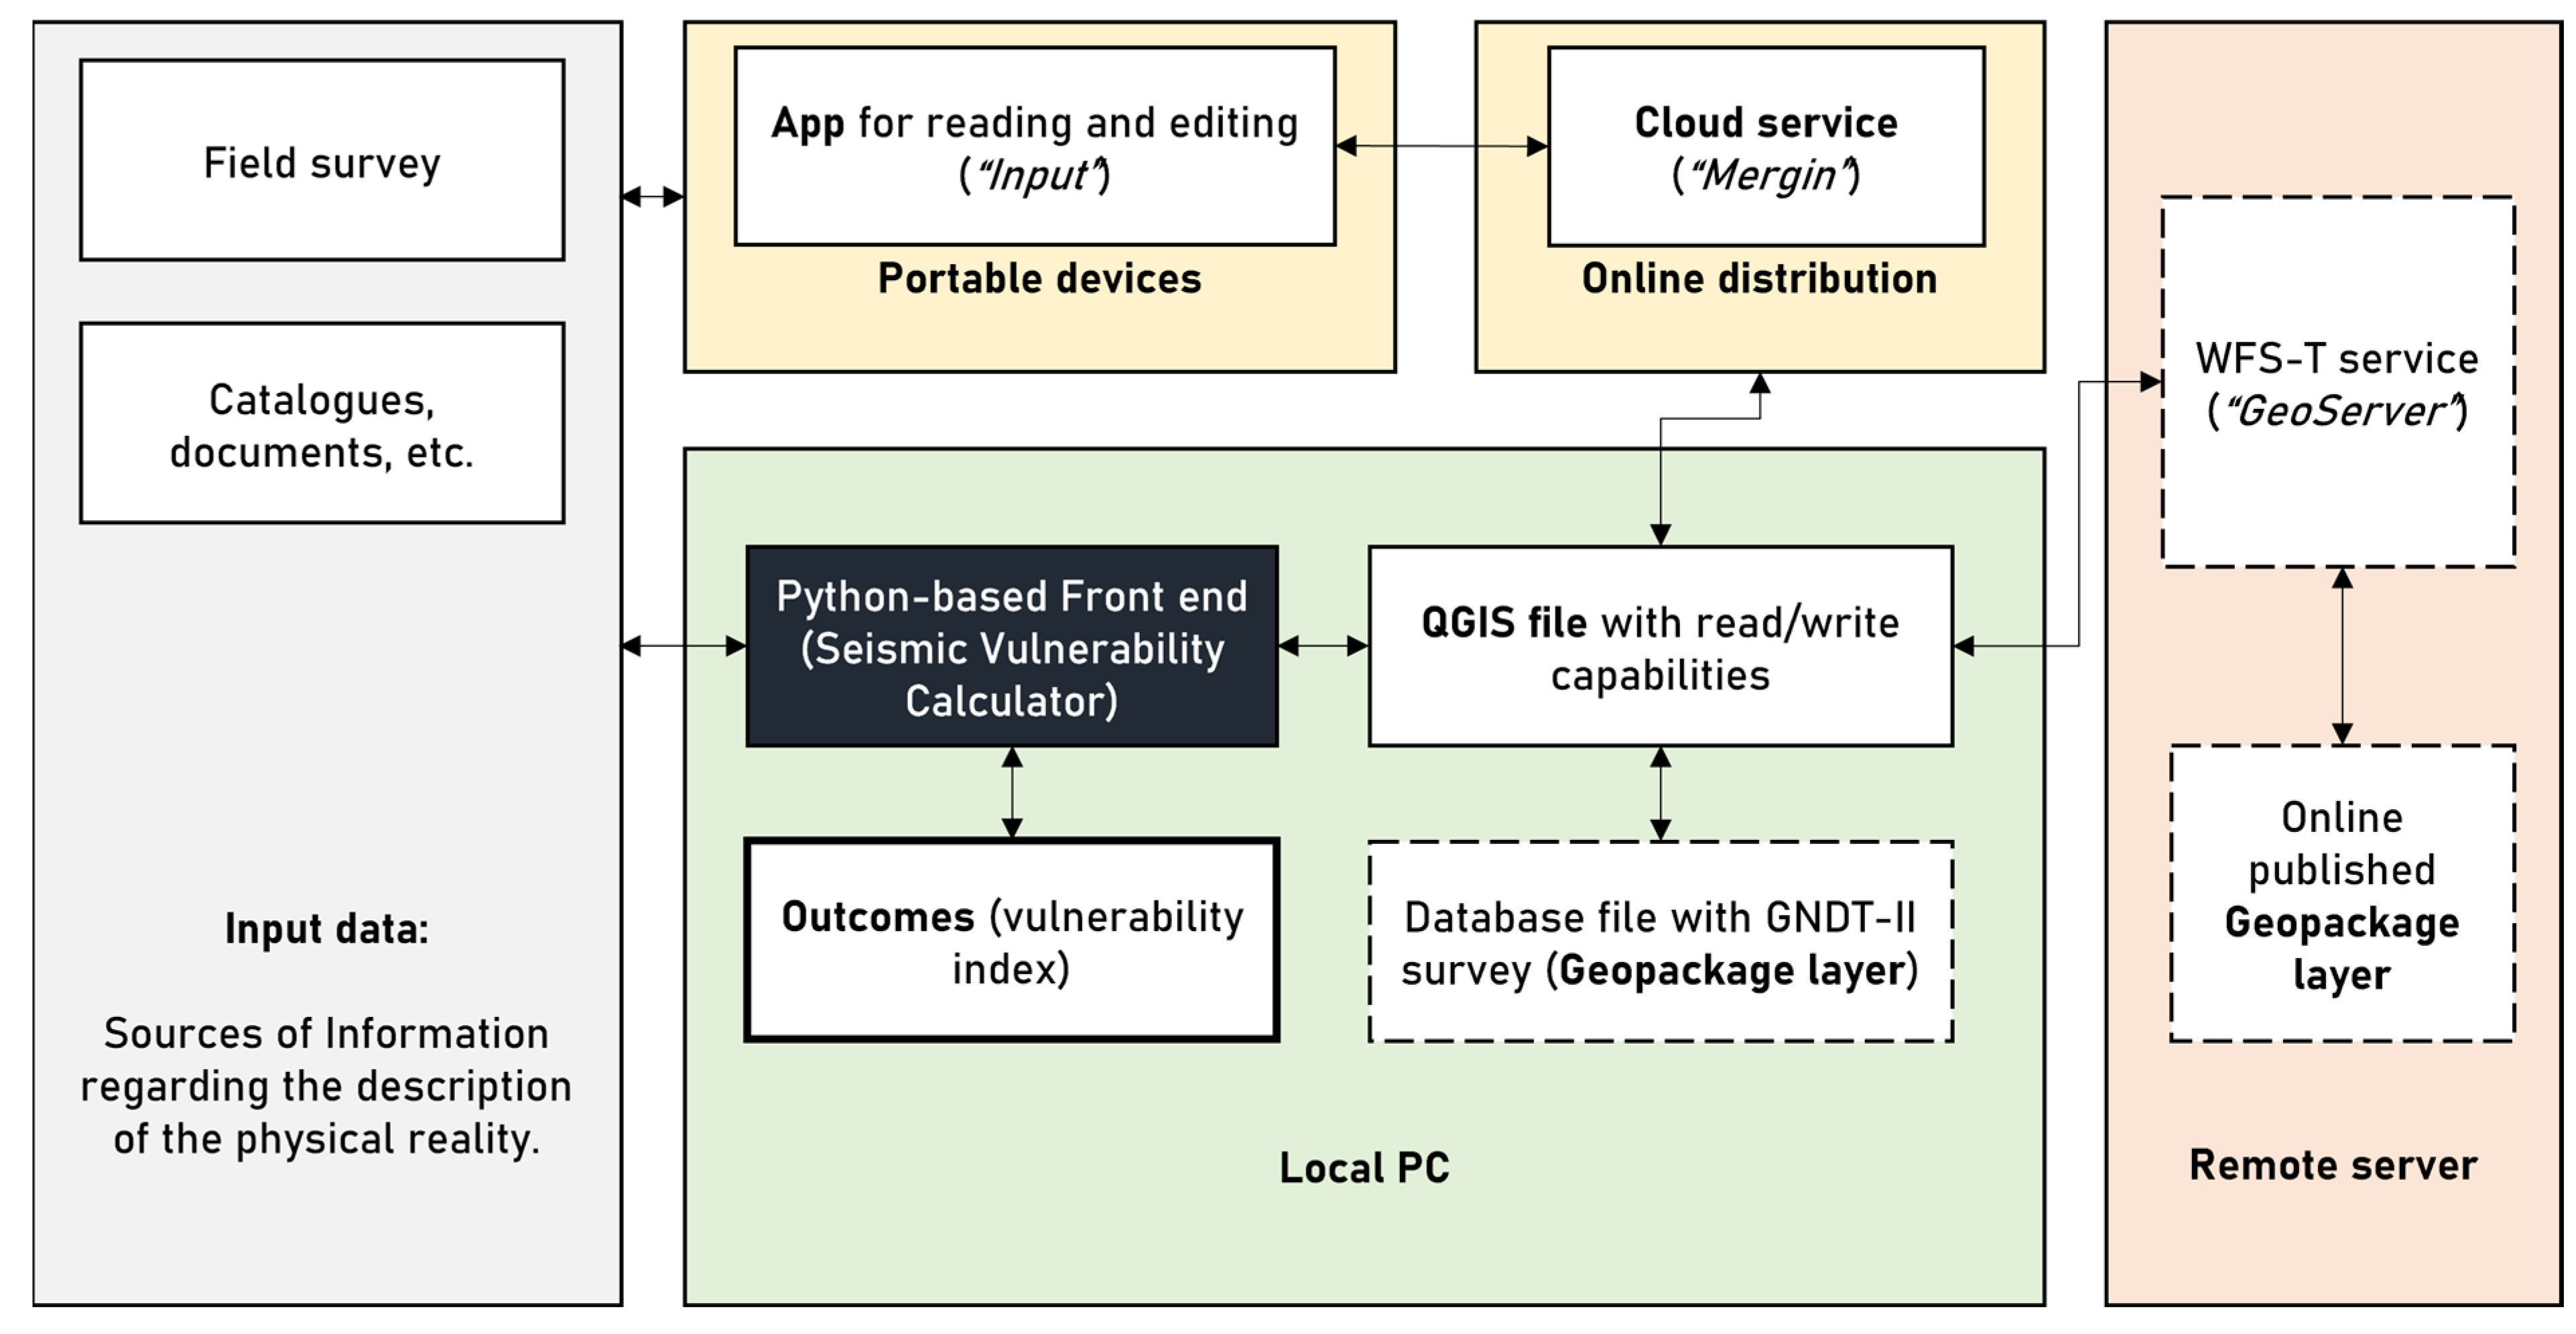
Some of the most relevant capabilities for a VIM-oriented geodatabase are summarised in
Figure 2 and will be discussed in the subsequent sections. The general components of this dataflow are the input data block (the sources from which it is possible to obtain the description of the physical reality), a local PC system in which the GIS environment and the Python language-based front end are executed, a remote server in which the GIS layers can be published and updated from the locally-stored database and, finally, a cloud-based online distribution that allows accessing the database from mobile devices.
It is worth noticing that the core of the dataflow is the Python-based front end since it is an interface for adding and reading data, interacting with the database and calculating the outcomes (vulnerability index, levels of damage, etc.). As explained in the following sections, the GIS environment is mostly used for extending the capabilities of the database by interacting with cloud-based storage (for complying with the survey in situ) and the remote server.
4. Complementary Resources for GIS Data Acquisition and Management
The presented workflow (
Figure 2) schematises the role that some complementary tools can have for complementing the QGIS capabilities as a VIM database, namely for performing read/write operations outside of QGIS software through a front-end software and remote services for hosting GIS layers or QGIS files (WFS-T protocol and MerginMaps services). In the context of the seismic assessment of historical constructions, this workflow is specifically significant for performing large-scale diagnosis by the means of remote access and real-time synchronisation.
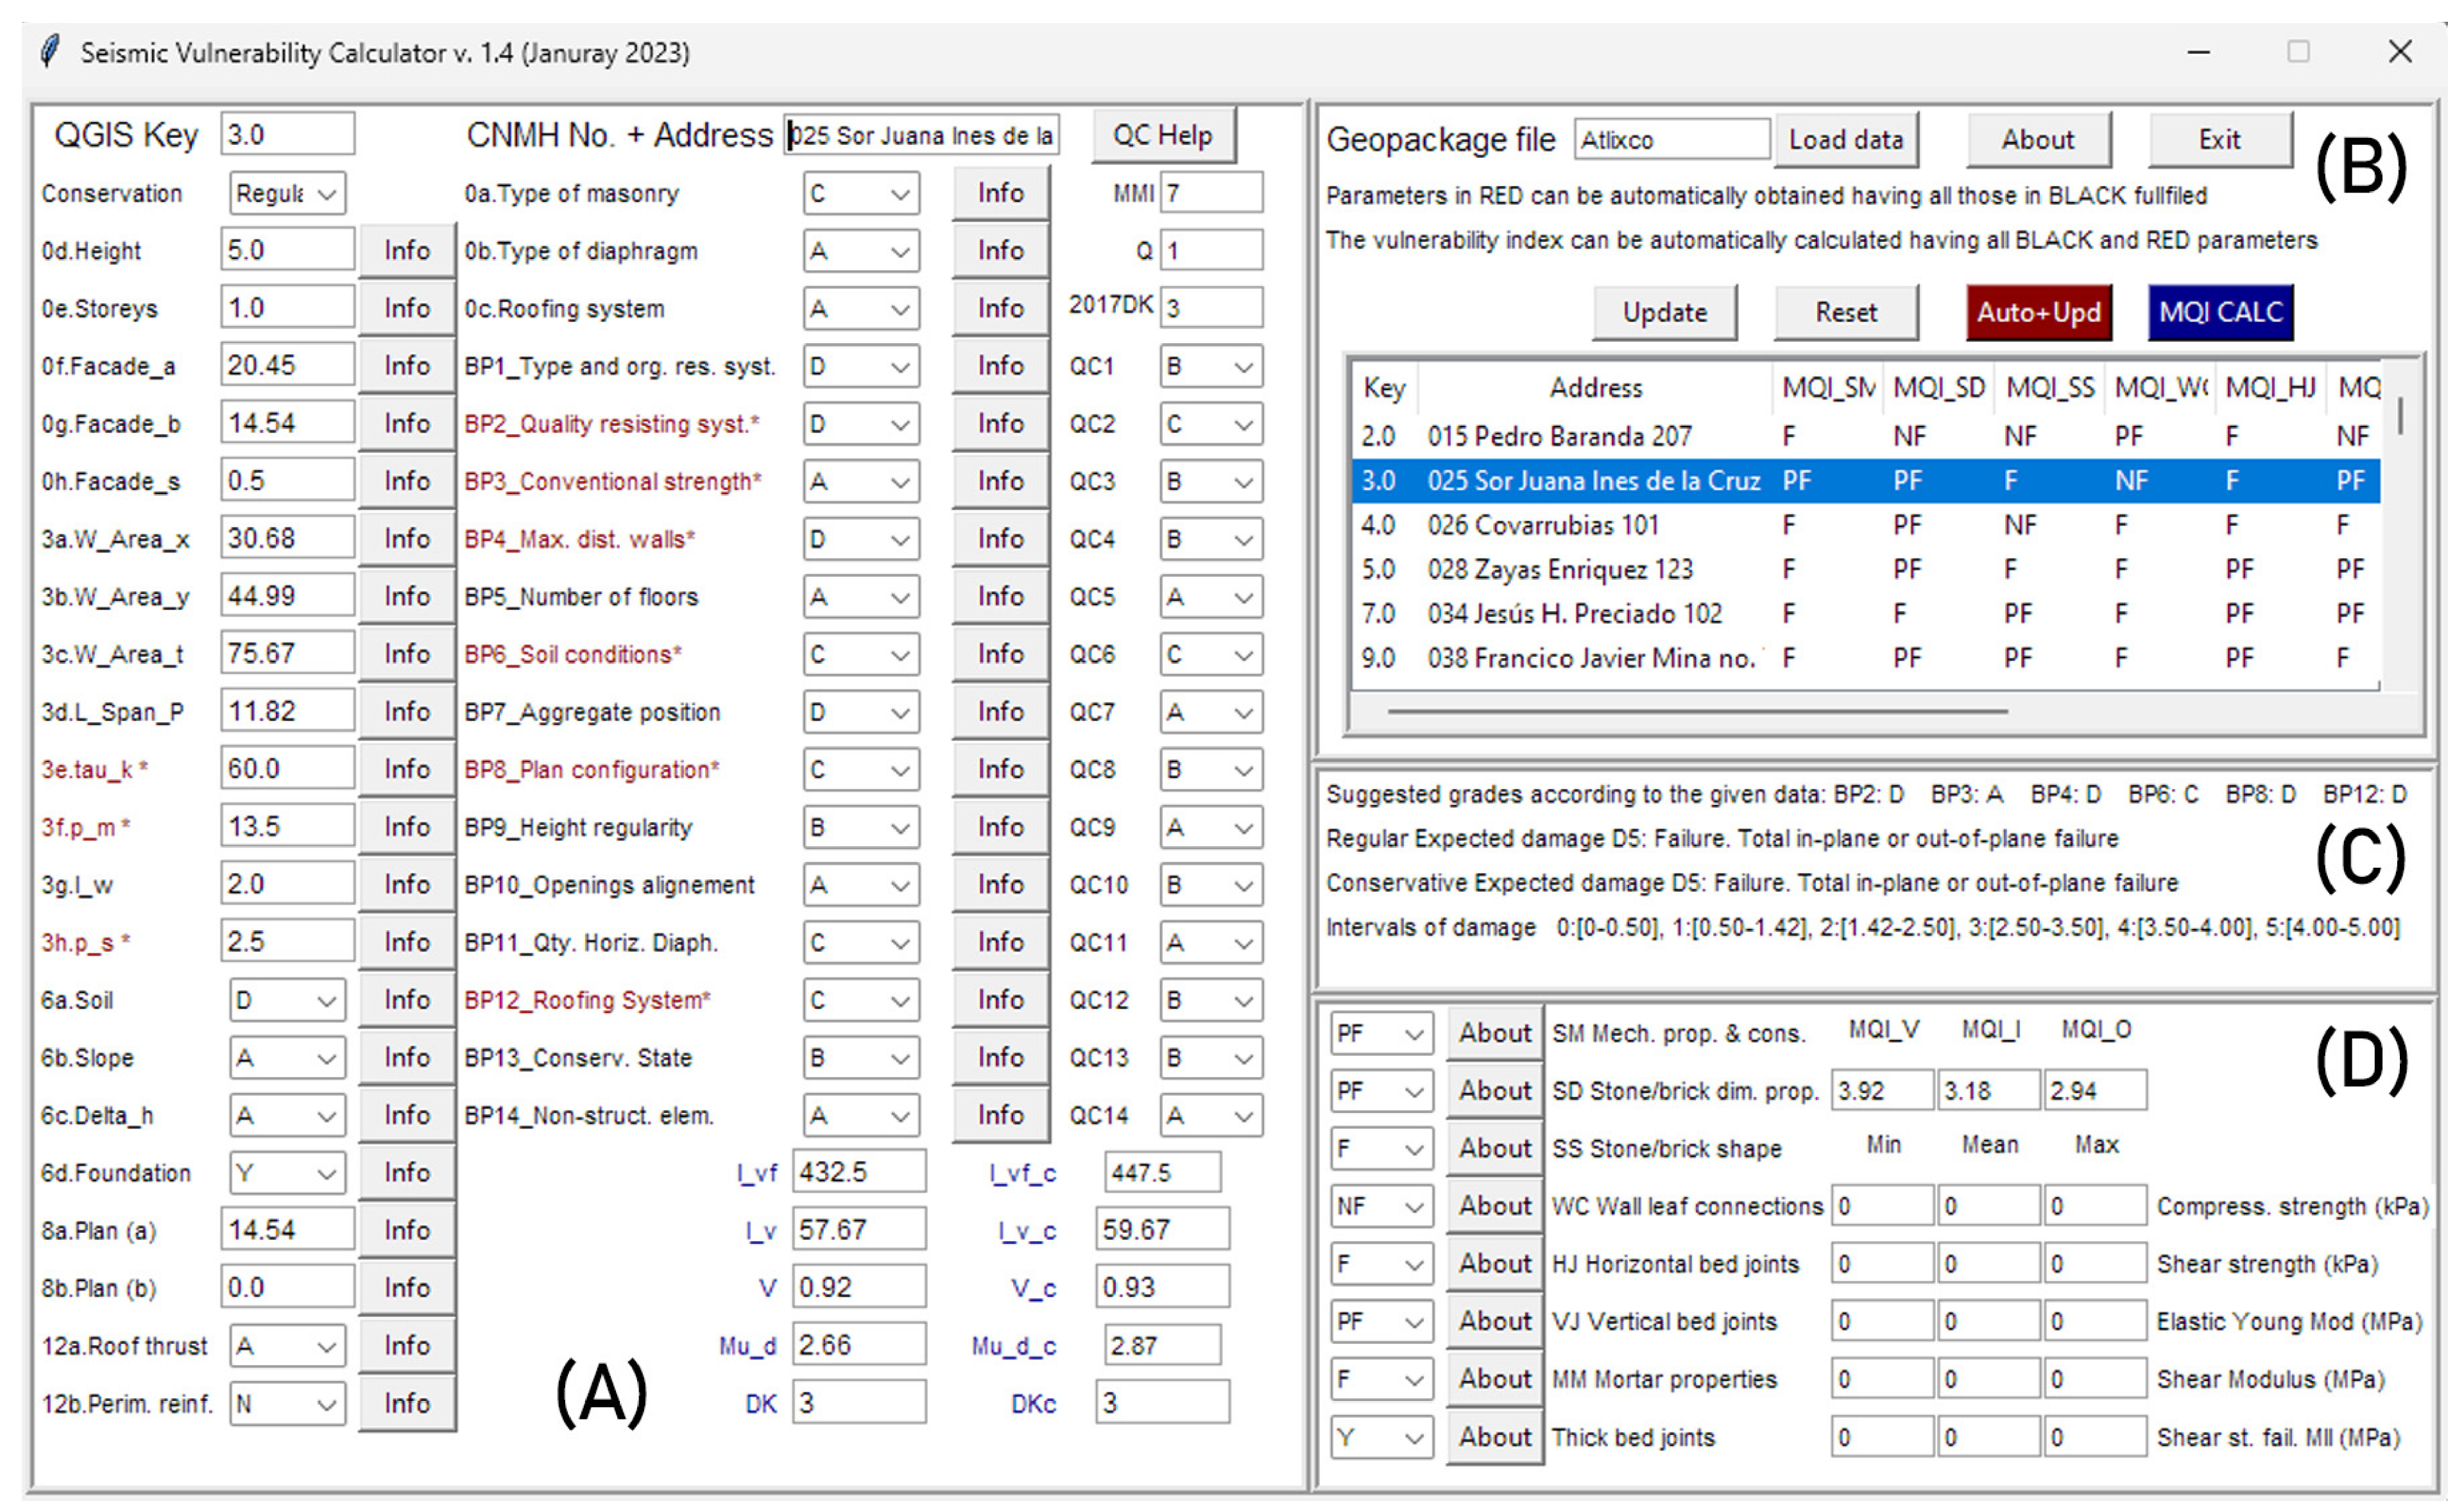
4.1. Front-End (Seismic Vulnerability Calculator) Software
It is always important to consider that many potential actors involved in the field data-acquisition stages could not be familiar with GIS environments and data structures. Therefore, providing a limited but straightforward environment for adding and reading data can represent a valuable strategy for minimising the risk of negatively affecting the subjacent GIS database while providing a robust and safe environment for data reading and writing. In this context, a graphic interface based on Python language can be an appropriate step for easing the interpretation, management, edition, and calculations related to data stored in GIS layers by using a dedicated user interface (
Figure 3).
This program (Seismic Vulnerability Calculator) [
26] permits reading different formats of GIS layers (such as GeoPackage and Shapefile standards) thanks to the use of the Geopandas [
27] library. This library is an adaptation of the Pandas data framework that includes compatibility with geographical features and keeping the integrity of geographical data while working on the attribute table of the layer. The capabilities of the Geopandas library, together with the Graphical User Interface (GUI) package Tkinter [
28], permitted the development of an easy-to-use interface in which all the parameters (and sub-parameters) are displayed for their read, capture and edition.
This interface offers four display modules. The main module (A) includes a box for searching any given entry from the building key and all the parameters and sub-parameters that conform to the vulnerability index method. These sub-parameters comprise the information needed for automatically obtaining the quantitative parameters. All the parameters that are calculated this way are shown in red colour, advising the user. For example, the selection of a type of masonry (“0a. Type of Masonry”) is automatically associated with the “tau_k” characteristic shear strength preloaded in the script. Each parameter is also associated with a series of “Quality Check” (QC) indicators, meant to indicate how certain the surveyor is about the grading process [
29]. This module also offers the vulnerability index and mean damage grades that are obtained given the macroseismic intensity MMI and the ductility factor Q. Furthermore, every parameter is associated with a “More” button that displays an explanatory dialogue for the user to contextualise the magnitudes and characteristics to be surveyed.
The second module (B) has a box for inserting the name of the database to be accessed after pressing the “Load Data” button. This database must be stored in GeoPackage format (with a “.gpkg” extension). Since such type of file can store several layers, this front end was programmed for selecting the layer that is a homonym with the file name. Nevertheless, this programmer’s decision can be easily modified for introducing the name of the layer as well. This database (which has been initially set from the QGIS environment, by using a dedicated Python-based script) contains a series of entries (buildings) and all the corresponding fields shown in the main module (parameters and sub-parameters of the VIM).
A limited selection of the database’s fields is displayed in a table that can be scrolled down. After selecting a register from this table, the controls found in the main module will be set accordingly to the information contained in the respective entry.
Some other relevant actions found in this module are:
- -
“Add New” button. It permits the addition of a new entry into the database. It is important to note that this new entry will not have geometrical or geographical information but can be later associated with a geometrical entity. It is critical to give an unused numerical key for any new entry;
- -
“Update”. This button will overwrite the entry associated with a given key with the data that has been set in the main module;
- -
“Reset”. This action cleans the main module, preparing it for performing writing actions;
- -
“Auto”. Once all the minimum parameters of the main module have been collected (i.e., excluding those in red colour), this button will execute all the calculations needed to obtain the rest of the parameters and, consequently, will calculate the vulnerability index and mean damage grades;
- -
“MQI Calc”. This capability calculates intervals for some mechanical properties of masonry panels by following the masonry quality index [
30]. This calculator is independent of the VIM approach.
The third module (C) gives a short explanation of the results obtained when performing the VIM approach to have an interpretation of the expected damages by using automatically displayed short descriptive sentences based on the calculated levels of damage.
Finally, the fourth module (D) includes both the parameters and results box for the MQI approach. The MQI assessment/evaluation was programmed as part of the survey, but its fulfilment is optional and does not condition the implementation of the VIM approach. It is considered an additional tool for performing quick assessments. The input data for this module is based on the MQI evaluation and the results express the index values for the Vertical (MQI_V), In-Plane (MQI_I) and Out-of-Plane (MQI_O) assessments as well as the intervals for the mechanical properties proposed by Borri et al. [
30].
This software aims to facilitate the VIM processes for any stakeholder regardless of familiarity or knowledge of GIS databases, protecting the integrity of geographical data. This capacity would be especially useful for performing small editions or consults on large databases. The implementation of a small calculator for performing the Masonry Quality Index approach [
30] exemplifies the ability to design more comprehensive and enriched tools in an integrated environment that would embrace the assessment of concrete-based structures as well as other approaches of interest.
4.2. Remote Access and Edition
Even if the database is locally created and stored (in the GIS environment), it becomes convenient to consider some advantages of remotely distributing it. To do so, for example, it may be suitable for disseminating the database among a group of trained professionals for covering different sections of a region while performing field work. This storage makes the database less sensitive to accidental losses due to local device malfunctions (inherently giving redundancy to the files) and facilitates data-sharing processes by the means of peer-to-peer communications (a direct user-to-user interaction) or public publishing.
4.2.1. WFS-T Service
It is important to consider that the use of adequate formats and data standards is key for successfully performing data sharing among different environments. In this sense, geographical databases are the object of several interfaces and frameworks that allow interoperability between different platforms and formats.
The Web Feature Service (WFS) of the Open Geospatial Consortium (OGC) is a standard interface for allowing requests for geographical features on web services based on the Geography Markup Language (GML) standard [
31]. The WFS standard enables the remote storage of GIS databases for being imported and even edited in local GIS platforms [
32]. Some platforms facilitate publishing layers on local or remote hosts. As an example, the
GeoServer open-source service enables interoperability for many standards [
33]. An inherent advantage of this service is its native implementation in numerous QGIS supplements.
GeoServer enables access GIS layers by the means of web browsers but also to query the instances from GIS files as an online resource. This is another feasible strategy for distributing a comprehensive database among several actors that can perform individualised analysis maintaining the integrity of the original database.
WFS was used during the implementation herein presented for executing transactions (queries and updates) on remotely stored spatial data. The request is created for a local client (in this case, the QGIS local environment), so the WFS server reads and executes the request. There are basic operations that any WFS transaction must cover: obtain capabilities (indicate the feature types and the operations that support them), description of the feature type (for describing the structure of the feature type) and retrieving and fetching instantly information and properties upon client’s request.
Additionally, the WFS operations can include the so-called transactional service (WFS-T), composed of operations that modify the features of the original database. Although GeoServer natively runs on a local host address, it can be implemented on a virtual machine to work as a server, which is especially useful when taking advantage of the transactional WFS, which allowed querying and retrieving features with real-time synchronisation with the local QGIS environment.
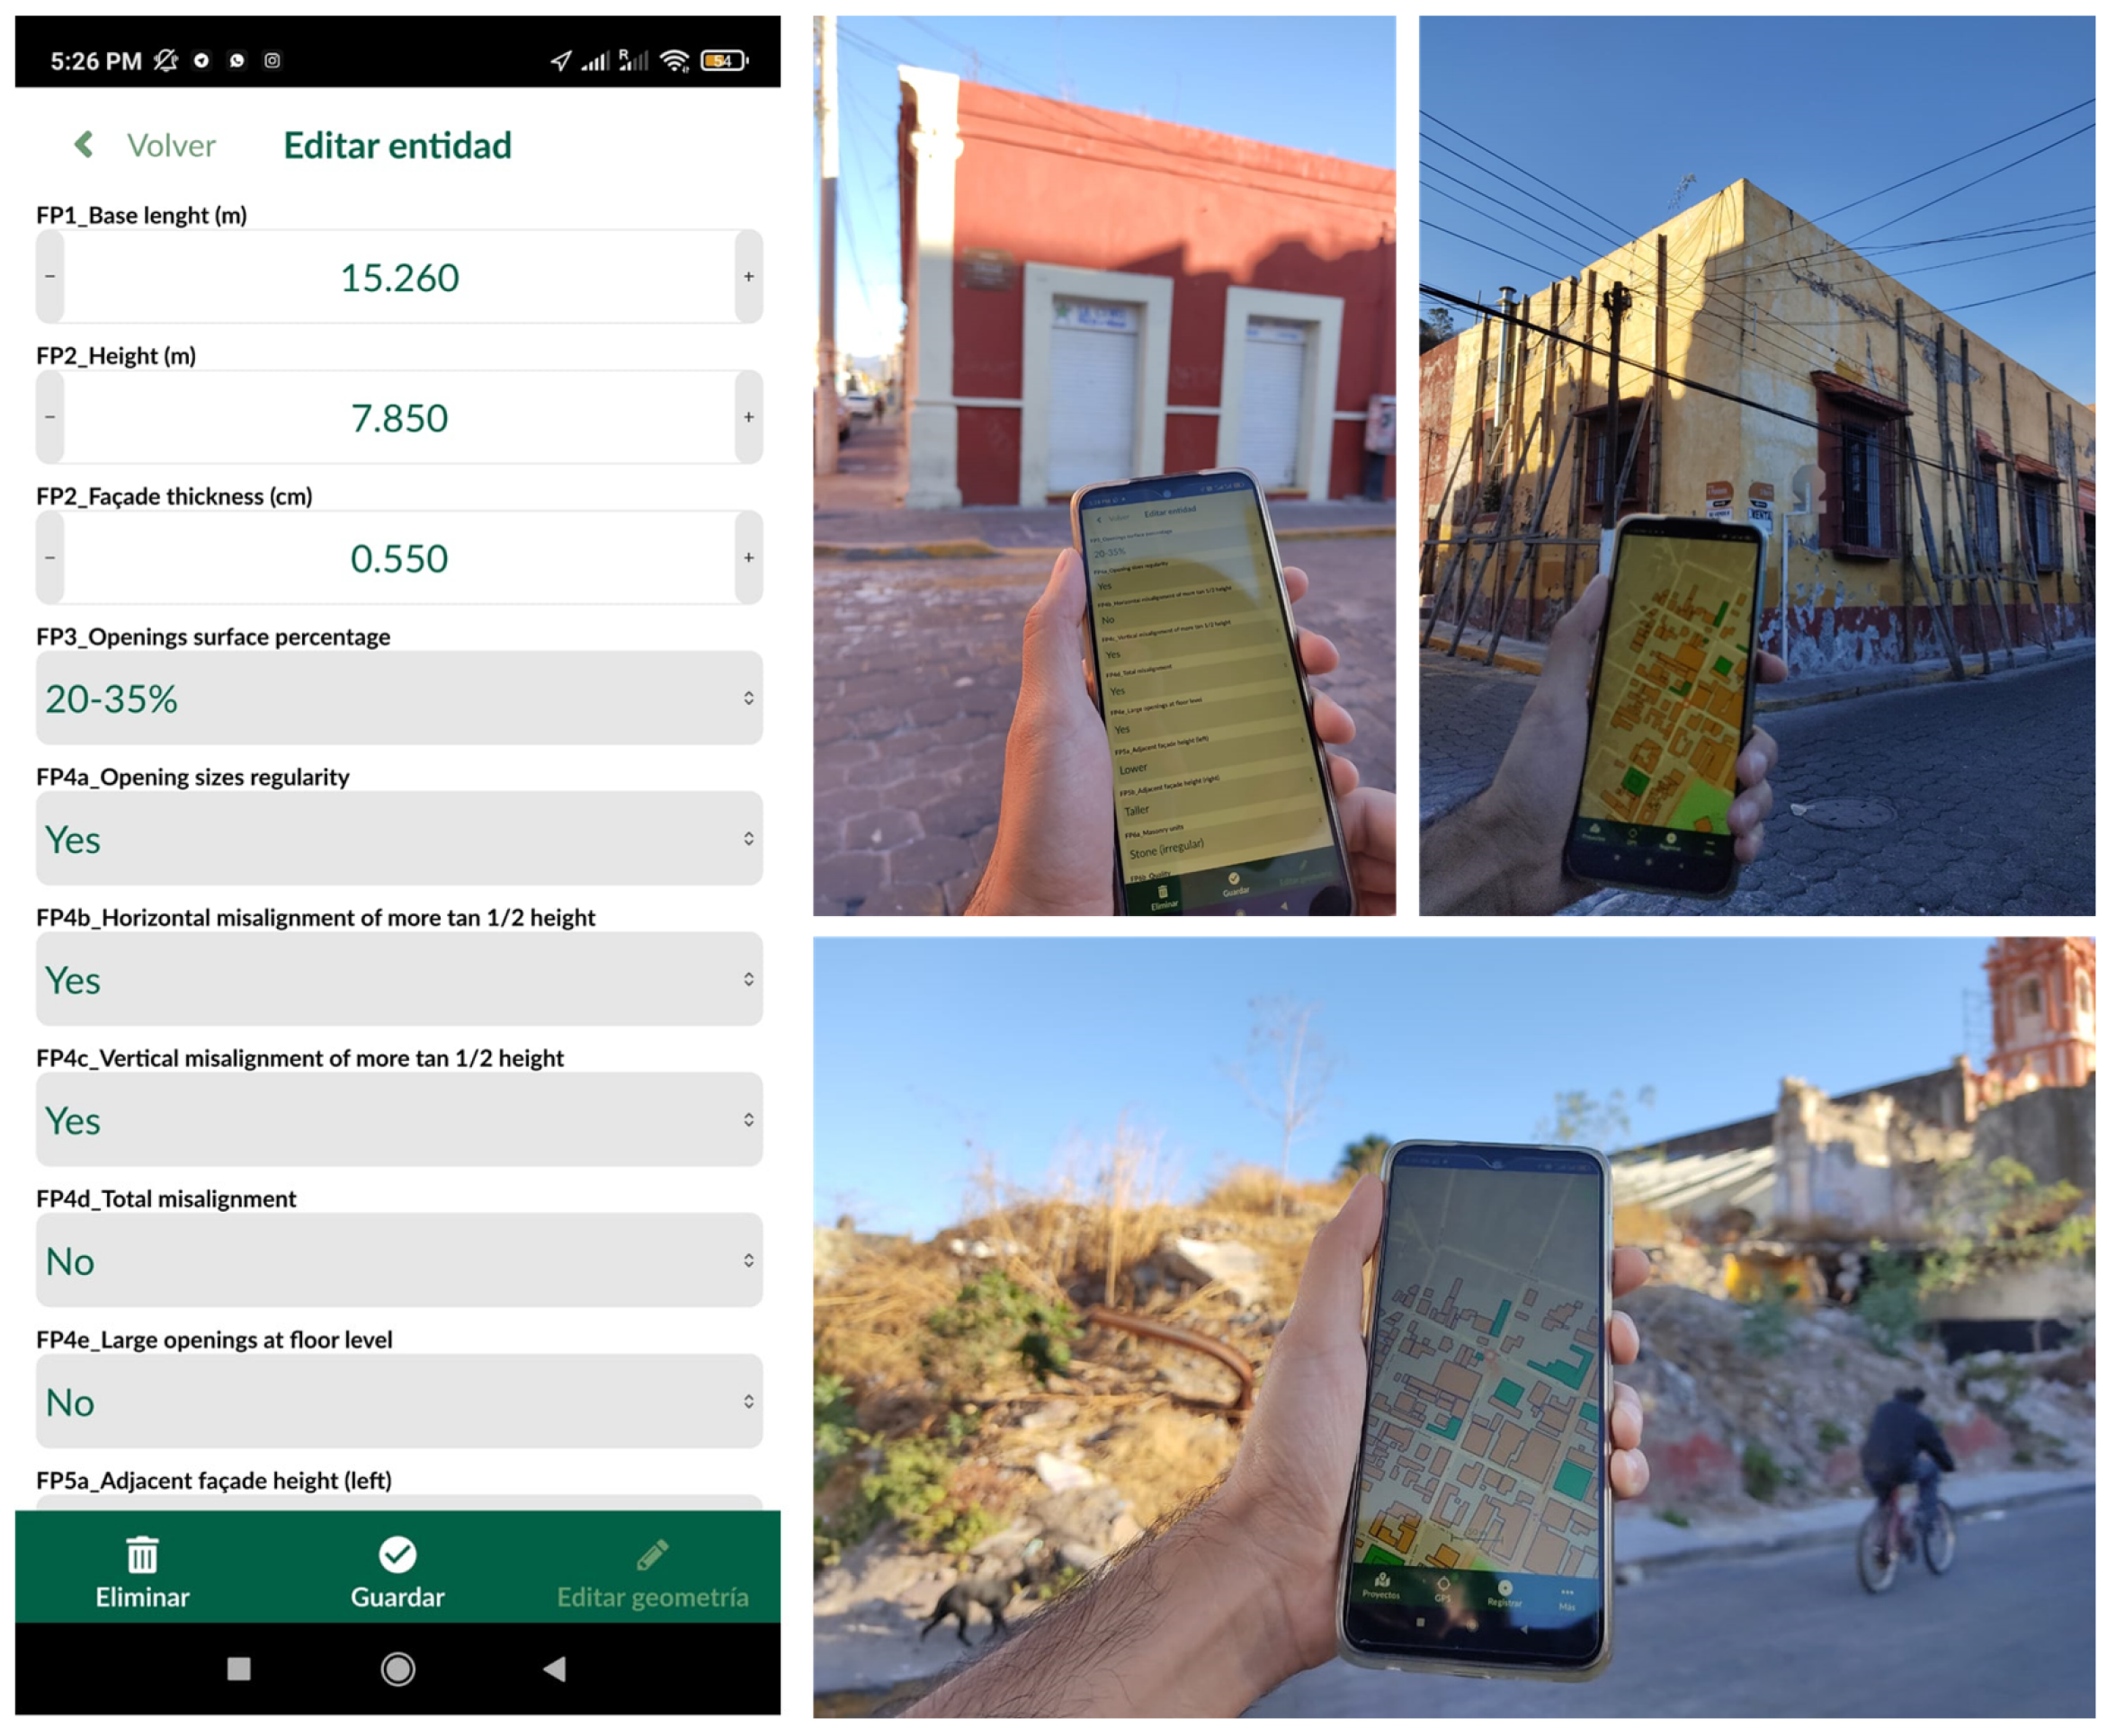
4.2.2. Cloud-Based Distribution for Mobile Devices
Another practical process is distributing GIS files for being consulted and edited on mobile devices. The app QField, for example, facilitates the edition of the attribute table of a GIS file by taking advantage of the geo-localisation of the mobile device [
34]. This app, however, depends on the local storage of the file and implies the upload or download of the file for sharing it. An alternative service is provided by the Mergin [
35] cloud service. This cloud service has been implemented as a plug-in for QGIS and offers free (but limited) cloud-based storage. This storage permits the distribution of a complete functional QGIS file with other users, including the capability of editing the files from portable devices using the free app Input [
36] (
Figure 4).
This app also facilitates the addition of the attribute table and a real-time edition of the geographic layer, offering a convenient real-time synchronisation of the file throughout all devices. This last feature is especially meaningful for distributing files when working on teams and covering large areas. The capability of representing the fields as different types of input widgets (e.g., textboxes, number selections, multiple options, dial bars, checkboxes, etc.) facilitates the usability of this program for any user. Furthermore, it becomes possible to acquire attached fields, such as photographs or videos.
Examples of applications, such as the one described in Ramirez Eudave and Ferreira [
37], have found that the joint use of QGIS-Mergin-Input is a feasible and robust framework for supporting field data acquisition campaigns. The databases distributed by these means, however, can also be shared without edition privileges, which may be significant for sharing information that is produced or managed in a more centralised way.
5. Outcomes and Potential Use for Mitigating Damage and Losses
The data acquisition process for a determinate urban environment may involve many of the strategies described in
Section 4 for achieving the parametric description of all the considered constructions. The calculation of the vulnerability index of the buildings can be easily obtained by using the Seismic Vulnerability Calculator presented in
Section 4.1, including the results in the database as well. The vulnerability index of a set of constructions is easily representable by using straightforward maps from QGIS, for example. These maps represent thresholds for the vulnerability of buildings, intuitively providing a base for identifying the most sensitive elements of a determined city.
The use of the Seismic Vulnerability Calculator software also facilitates the obtention of damage grades for the set of constructions, given a certain macroseismic intensity and the structure’s ductility. This process is intended to be more flexible and direct than operating the QGIS file, for example. The outcomes permit highlighting those constructions that are more likely to fail or suffer damage when facing a certain scenario. This semi-quantitative information is of great value for numerous stakeholders that have a decision tool for prioritising interventions and immediate actions that can also consider some aspects that are not contained in the VIM approach but can be mapped on the GIS database: social vulnerabilities, number of users, economic indicators, cultural values, protection status, etc.
Furthermore, the calculation of damage grades would be the basis for more complex urban-level analysis. It is possible to build a damage curve for the constructions since the levels of damage (
) are a function of the vulnerability (V) and the macroseismic intensity I
EMS-98 as expressed in Equations (4) and (5) (
Section 2).
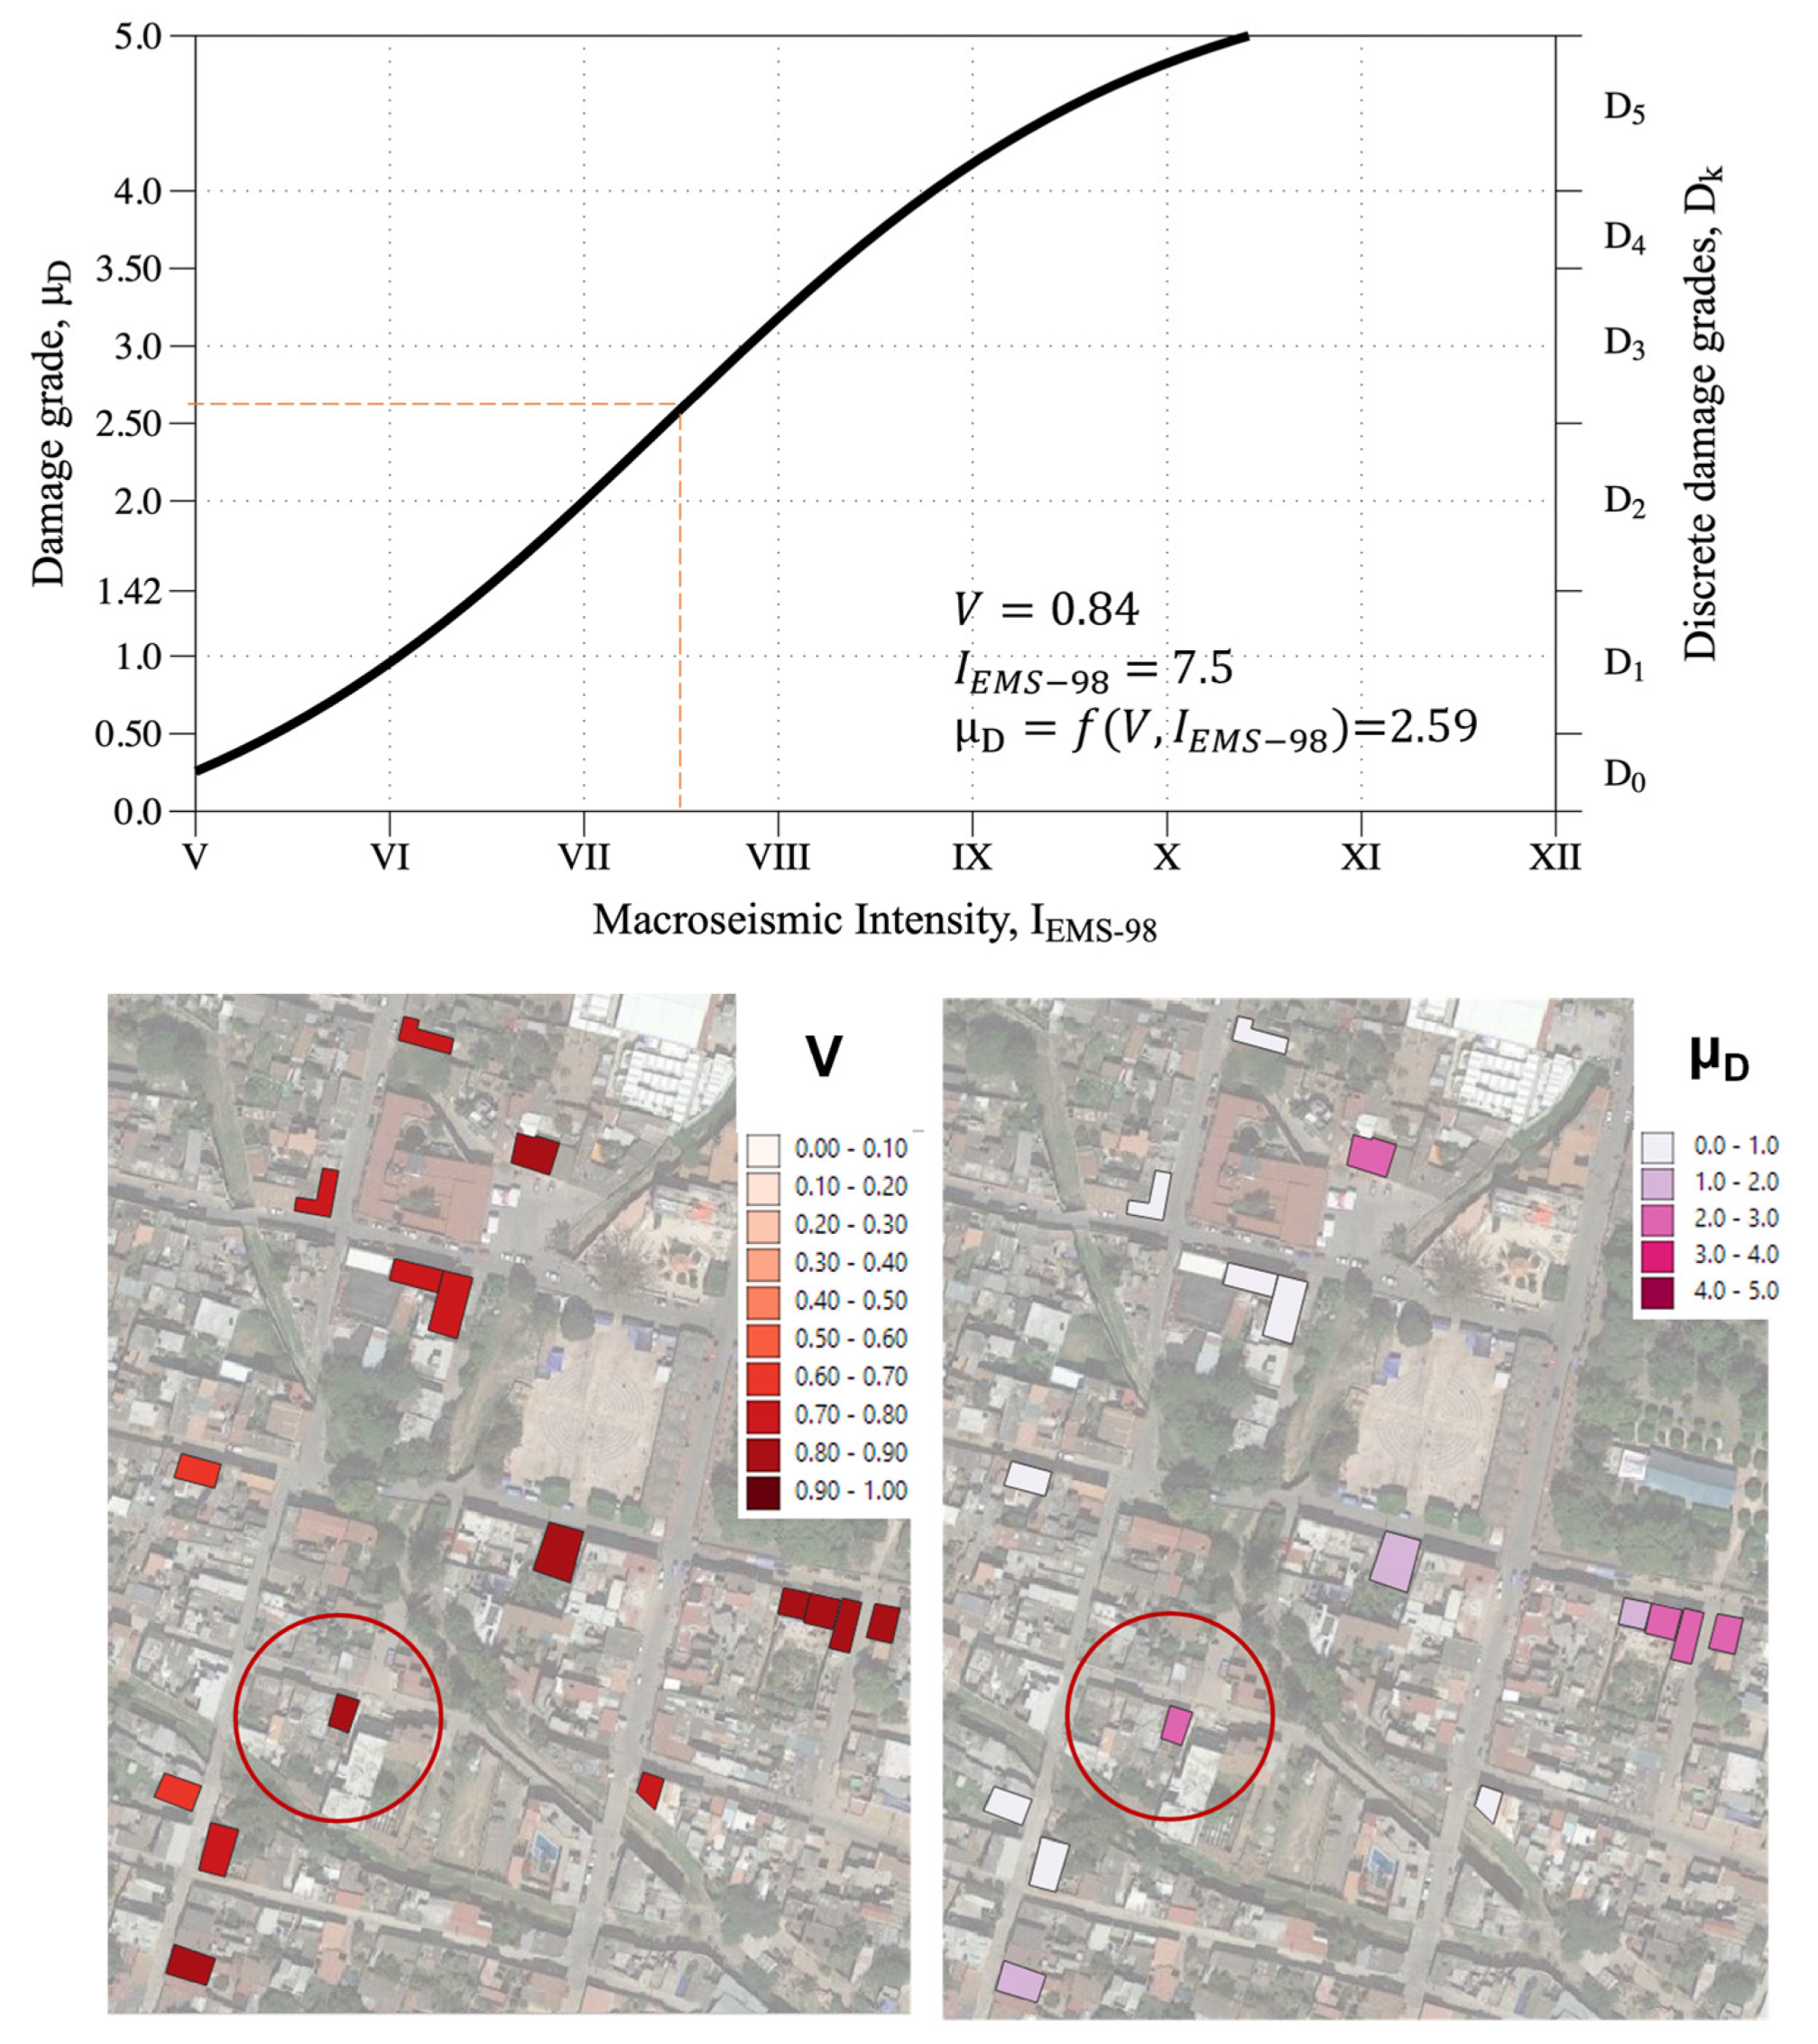
For example,
Figure 5 shows a series of outcomes from a building in the city of Atlixco (Puebla, México). The vulnerability value (V) obtained by the means of the Seismic Vulnerability Calculator is used for feeding Equation (4), which permits the construction of a damage/macroseismic intensity function curve. This analytical value can be displayed in specific maps by using the QGIS environment, facilitating the generation of outcomes in which the level of vulnerability or the level of damage (given a determined macroseismic intensity) is reflected.
Hence, given a certain seismic intensity, it becomes feasible to anticipate levels of damage throughout the sample, identifying which constructions are more likely to have severe damage or even complete failures. The activation of total or partial failures due to out-of-plane mechanisms would imply a partial obstruction of certain streets or communications because of the accumulation of debris, which is relevant for emergency planning actions and evacuation plans.
In addition to collapses, the thresholds of unusability of constructions are relevant indicators for anticipating the loss of urban critical functions (commerce, housing, health, education services, etc.), favouring nominal life estimates based on the return periods associated with certain seismic intensities. Hence, this information is a relevant element for performing long-term urban planning and for anticipating the most vulnerable systems of a certain urban settlement. The risk analysis of the city based on the loss or interruption of some of its functions [
38] is also very compatible with the workflow herein presented.
It is important to recall, however, that the elements considered for this workflow are also intended to offer a flexible and user-friendly environment for updating and/or correcting data, which implies the possibility of having up-to-date outcomes, including updates on the city (for example, when a better knowledge of a certain construction is available) or in the seismic vulnerability approach (for example, when calibrated after a seismic event).
6. Conclusions
This paper discusses the suitability of using a parameter-based seismic vulnerability assessment approach to carry out large-scale vulnerability assessments in the context of historical cities. Furthermore, the feasibility and convenience of implementing the entire workflow on geodatabases are discussed, focusing on the open-source GIS software QGIS. In addition to supporting this implementation, the suitability of using complementary approaches and tools is herein presented and explored.
Firstly, the possibility of developing and implementing a Python-language-based software for reading, managing, and editing GIS layers is explored. This would not only facilitate the management of geodatabases outside of GIS environments but would also offer a user-friendly interface for collecting core and complementary input data for the methodology and a semi-automatic calculator for obtaining the vulnerability index and mean damage grade results.
Secondly, two alternatives for the remote distribution of GIS databases are presented and discussed. The use of the WFS-T protocol is a valuable resource for publishing GIS layers that can be locally consulted and edited. On the other hand, using cloud-based tools opens the possibility of distributing GIS data on several devices with reading and writing privileges. This capability is highly relevant for performing field campaigns involving many actors and can have an almost immediate synchronisation, minimising the time invested in data treatment. Both approaches represent strategies for implementing a free, enlargeable and potentially online system for data acquisition, treatment and representation of the seismic vulnerability of constructions. Some alternatives that are a matter of future research are browser-based front ends for online database services.
Finally, some relevant uses of the outcomes of the VIM–GIS implementation are discussed. The generation of vulnerability maps is a valuable tool for representing the overall vulnerability state of a city or certain regions. Furthermore, the damage curves are the base for anticipating damage and loss scenarios given a determined seismic intensity, which might reasonably impact the design of emergency planning and nominal-life-oriented urban decisions aimed to mitigate the negative impacts of earthquakes.
Author Contributions
Conceptualization, R.R.E., T.M.F. and D.R.; methodology, R.R.E., T.M.F. and D.R.; software, R.R.E.; validation, R.R.E., T.M.F., D.R. and R.V.; formal analysis, R.R.E. and T.M.F.; investigation, R.R.E., D.R. and R.V.; resources, R.R.E., D.R. and R.V.; data curation, R.R.E. and D.R.; writing—original draft preparation, R.R.E.; writing—review and editing, T.M.F., D.R. and R.V.; visualization, R.R.E.; supervision, T.M.F. and D.R.; project administration, T.M.F. All authors have read and agreed to the published version of the manuscript.
Funding
This work was partly financed by FCT/MCTES through national funds (PIDDAC) under the R&D Unit Institute for Sustainability and Innovation in Structural Engineering (ISISE), under reference UIDB/04029/2020. This work is financed by national funds through FCT—Foundation for Science and Technology, under grant agreement PD/BD/150385/2019 attributed to the 1st author.
Data Availability Statement
The datasets generated and analysed during the current study are available from the corresponding author on reasonable request.
Acknowledgments
Special thanks to Héctor Adrián Ramírez for his significant support during the field works performed in the city of Atlixco (Puebla, México).
Conflicts of Interest
The authors declare no conflict of interest.
References
- Ramírez Eudave, R.; Rodrigues, D.S.; Ferreira, T.M.; Romeu, V. Implementing open-source information systems for assessing and managing the seismic vulnerability of historical constructions. X ReUSO Doc. Restor. Reuse Herit. 2022, 1, 597–604. [Google Scholar]
- D’Ayala, D.; Spence, R.; Oliveira, C.; Pomonis, A. Earthquake Loss Estimation for Europe’s Historic Town Centres. Earthq. Spectra 1997, 13, 773–793. [Google Scholar] [CrossRef]
- Turco, M.L.; Caputo, F.; Fusaro, G. From Integrated Survey to the Parametric Modeling of Degradations. A Feasible Workflow. Lect. Notes Comput. Sci. 2016, 10058 LNCS, 579–589. [Google Scholar] [CrossRef]
- Brumana, R.; Ioannides, M.; Previtali, M. Holistic Heritage Building Information Modelling (Hhbim): From Nodes To Hub Networking, Vocabularies And Repositories. ISPRS—Int. Arch. Photogramm. Remote Sens. Spat. Inf. Sci. 2019, XLII-2/W11, 309–316. [Google Scholar] [CrossRef] [Green Version]
- Borri, A.; Corradi, M.; Castori, G.; De Maria, A. A method for the analysis and classification of historic masonry. Bull. Earthq. Eng. 2015, 13, 2647–2665. [Google Scholar] [CrossRef]
- Bektaş, N.; Kegyes-Brassai, O. Conventional RVS Methods for Seismic Risk Assessment for Estimating the Current Situation of Existing Buildings: A State-of-the-Art Review. Sustainability 2022, 14, 2583. [Google Scholar] [CrossRef]
- Nanda, R.P.; Majhi, D.R. Rapid seismic vulnerability assessment of building stocks for developing countries. KSCE J. Civ. Eng. 2014, 18, 2218–2226. [Google Scholar] [CrossRef]
- Giuliani, F. Seismic Risk Management in historic Centres Integrated Large-Scale Modelling for a Scenario-Based Methodology; University of Pisa: Pisa, Italy, 2020. [Google Scholar]
- Seismic vulnerability assessment of buildings of Patna by rapid visual screening. Int. J. Adv. Technol. Eng. Explor. 2022, 9, 86. [CrossRef]
- Zuccaro, G.; Dolce, M.; De Gregorio, D.; Speranza, E.; Moroni, C. La Scheda Cartis Per La Caratterizzazione Tipologico- Strutturale Dei Comparti Urbani Costituiti Da Edifici Ordinari. Valutazione dell’esposizione in analisi di rischio sismico. Gngts 2019, 2016, 281–287. [Google Scholar]
- Salvati, P.; Ardizzone, F.; Cardinali, M.; Fiorucci, F.; Fugnoli, F.; Guzzetti, F.; Marchesini, I.; Rinaldi, G.; Rossi, M.; Santangelo, M.; et al. Acquiring vulnerability indicators to geo-hydrological hazards: An example of mobile phone-based data collection. Int. J. Disaster Risk Reduct. 2021, 55, 102087. [Google Scholar] [CrossRef]
- Ruggieri, S.; Cardellicchio, A.; Leggieri, V.; Uva, G. Machine-learning based vulnerability analysis of existing buildings. Autom. Constr. 2021, 132, 103936. [Google Scholar] [CrossRef]
- Rosti, A.; Rota, M.; Penna, A. Empirical fragility curves for Italian URM buildings. Bull. Earthq. Eng. 2020, 19, 3057–3076. [Google Scholar] [CrossRef]
- United Nation Office for Disaster Risk Reduction. Econimic Losses, Poverty and Disasters. 2017, 5, 1. Available online: https://www.undrr.org/publication/economic-losses-poverty-disasters-1998-2017 (accessed on 15 January 2023).
- Galvis, F.; Miranda, E.; Heresi, P.; Davalos, H.; Silos, J.R. Preliminary Statistics of Collapsed Buildings in Mexico City in the September 19, 2017 Puebla-Morelos Earthquake. 2017. Available online: https://www.researchgate.net/publication/320297374_Preliminary_Statistics_of_Collapsed_Buildings_in_Mexico_City_in_the_September_19_2017_Puebla-Morelos_Earthquake (accessed on 15 January 2023).
- Eudave, R.R.; Ferreira, T.M. On the potential of using the Mexican National Catalogue of Historical Monuments for assessing the seismic vulnerability of existing buildings: A proof-of-concept study. Bull. Earthq. Eng. 2021, 19, 4945–4978. [Google Scholar] [CrossRef]
- Alberto, Y.; Otsubo, M.; Kyokawa, H.; Kiyota, T.; Towhata, I. Reconnaissance of the 2017 Puebla, Mexico earthquake. Soils Found. 2018, 58, 1073–1092. [Google Scholar] [CrossRef]
- Gavarini, C. Seismic risk in historical centers. Soil Dyn. Earthq. Eng. 2001, 21, 459–466. [Google Scholar] [CrossRef]
- Maio, R.; Ferreira, T.M.; Vicente, R. A critical discussion on the earthquake risk mitigation of urban cultural heritage assets. Int. J. Disaster Risk Reduct. 2018, 27, 239–247. [Google Scholar] [CrossRef]
- Roca, P.; Cervera, M.; Gariup, G.; Pelà, L. Structural Analysis of Masonry Historical Constructions. Classical and Advanced Approaches. Arch. Comput. Methods Eng. 2010, 17, 299–325. [Google Scholar] [CrossRef] [Green Version]
- Eudave, R.R.; Ferreira, T. Characterisation of the Historic Urban Landscape through the Aristotelian Four Causes: Towards Comprehensive GIS Databases. Remote Sens. 2021, 13, 1879. [Google Scholar] [CrossRef]
- GNDT-SSN. Gruppo Nazionale per la Difesa dai Terremoti—GNDT-SSN (1994) Scheda di Esposizione e Vulnerabilità e di Rilevamento Danni di Primo e Secondo Livello (Murata e Cemento Armato); Gruppo Nazionale per la Difesa dai Terremoti: Rome, Italy, 1994. [Google Scholar]
- Ferreira, T.M.; Maio, R.; Costa, A.A.; Vicente, R. Seismic vulnerability assessment of stone masonry façade walls: Calibration using fragility-based results and observed damage. Soil Dyn. Earthq. Eng. 2017, 103, 21–37. [Google Scholar] [CrossRef]
- Eudave, R.R.; Ferreira, T.M. On the suitability of a unified GIS-BIM-HBIM framework for cataloguing and assessing vulnerability in Historic Urban Landscapes: A critical review. Int. J. Geogr. Inf. Sci. 2020, 35, 2047–2077. [Google Scholar] [CrossRef]
- QGIS Development Team. QGIS Geographic Information System. 2021. Available online: https://www.qgis.org (accessed on 15 January 2023).
- Ramirez Eudave, R. Seismic Vulnerability Calculator and Database (Software). Guimarães 2022. [Google Scholar] [CrossRef]
- Jordahl, K.; den Bossche, J.V.; Fleischmann, M.; Wasserman, J.; McBride, J.; Gerard, J.; Tratner, J.; Perry, M.; Badaracco, A.G.; Farmer, C.; et al. geopandas/geopandas: v0.8.1. Zenodo 2020. [Google Scholar] [CrossRef]
- Lundh, F. An Introduction to Tkinter. Available online: www.pythonware.com/library/tkinter/introduction/index (accessed on 15 January 2023).
- Eudave, R.R.; Ferreira, T.M.; Vicente, R. Parameter-based seismic vulnerability assessment of Mexican historical buildings: Insights, suitability, and uncertainty treatment. Int. J. Disaster Risk Reduct. 2022, 74, 102909. [Google Scholar] [CrossRef]
- Borri, A.; De Maria, A. Indice di Qualità Muraria (IQM): Correlazione con le caratteristiche meccaniche e livelli di conoscenza Masonry Quality Index (MQI): Correlation with the mechanical characteristics and knowledge levels. Progett. Sismica 2015, 6, 3. [Google Scholar] [CrossRef]
- Zheng, W.; Yin, Z.; Li, X. Seismic Disaster Analyse and Evaluation System Based on OGC Standard. In Proceedings of the 2009 First International Conference on Information Science and Engineering, Nanjing, China, 26–28 December 2009; pp. 2177–2180. [Google Scholar]
- Atzl, C.; Vockner, B.; Mittlboeck, M. Online Visualization of Streaming Data. GI_Forum 2016, 2, 57–66. [Google Scholar] [CrossRef] [Green Version]
- Růžička, J. Comparing speed of Web Map Service with GeoServer on ESRI Shapefile and PostGIS. Geoinformatics FCE CTU 2016, 15, 3–9. [Google Scholar] [CrossRef]
- Ostadabbas, H.; Weippert, H.; Behr, F.-J. Using The Synergy Of Qfield For Collecting Data On-Site And Qgis For Interactive Map Creation By Alkis® Data Extraction And Implementation In Postgresql For Urban Planning Processes. ISPRS—Int. Arch. Photogramm. Remote Sens. Spat. Inf. Sci. 2020, XLIII-B4-2, 679–683. [Google Scholar] [CrossRef]
- Dobias, M.S.; Varga, M.; Petrik, P. lutraconsulting/mergin: 2021.6.1. Zenodo 2021. [Google Scholar] [CrossRef]
- Mizera, T.; Petrik, P.; Dobias, M.; Sklencar, S.; Taskin, E.A.; Belgacem, N.; Varga, M.; Kuhn, M.; Wells, P.; Natsis, S. utraconsulting/input: Release 1.3.0. Zenodo 2022. [Google Scholar] [CrossRef]
- Eudave, R.R.; Ferreira, T.M. Proposal for a suitable workflow for assessing the seismic vulnerability of historical buildings. Atlixco (Puebla, México) as a case study. In Proceedings of the 1st Croatian Conference on Earthquake Engineering—1CroCEE1st Croatian Conference on Earthquake Engineering 1CroCEE, Zagreb, Croat, 22–24 March 2021. [Google Scholar]
- Eudave, R.R.; Ferreira, T.M. Towards a Semi-Quantitative Approach for Assessing Evacuation Scenarios in the Context of Popocatépetl Volcano, México—The Case of San Pedro Tlalmimilulpan. Geohazards 2021, 2, 1–16. [Google Scholar] [CrossRef]
| Disclaimer/Publisher’s Note: The statements, opinions and data contained in all publications are solely those of the individual author(s) and contributor(s) and not of MDPI and/or the editor(s). MDPI and/or the editor(s) disclaim responsibility for any injury to people or property resulting from any ideas, methods, instructions or products referred to in the content. |
© 2023 by the authors. Licensee MDPI, Basel, Switzerland. This article is an open access article distributed under the terms and conditions of the Creative Commons Attribution (CC BY) license (https://creativecommons.org/licenses/by/4.0/).


