Article

Prediction of Rubble-Stone Masonry Walls Response under Axial Compression Using 2D Particle Modelling

by
Nuno Monteiro Azevedo
1,*,†,
Fernando F. S. Pinho
2,†,
Ildi Cismaşiu
2,† and
Murilo Souza
3,†
1
Concrete Dams Department, Laboratório Nacional de Engenharia Civil (LNEC), 1700-066 Lisboa, Portugal
2
CERIS and Department of Civil Engineering, NOVA School of Science and Technology|FCT-NOVA, 2829-516 Caparica, Portugal
3
Department of Civil Engineering, NOVA School of Science and Technology|FCT-NOVA, 2829-516 Caparica, Portugal
*
Author to whom correspondence should be addressed.
These authors contributed equally to this work.
Buildings 2022, 12(8), 1283; https://doi.org/10.3390/buildings12081283
Submission received: 9 July 2022 / Revised: 15 August 2022 / Accepted: 18 August 2022 / Published: 21 August 2022

Abstract

:
To predict the structural behaviour of ancient stone masonry walls is still a challenging task due to their strong heterogeneity. A rubble-stone masonry modeling methodology using a 2D particle model (2D-PM), based on the discrete element method is proposed given its ability to predict crack propagation by taking directly into account the material structure at the grain scale. Rubble-stone (ancient) masonry walls tested experimentally under uniaxial compression loading conditions are numerically evaluated. The stone masonry numerical models are generated from a close mapping process of the stone units and of the mortar surfaces. A calibration procedure for the stone-stone and mortar-mortar contacts based on experimental data is presented. The numerical studies show that the 2D-PM wall models can predict the formation and propagation of cracks, the initial stiffness and the maximum load obtained experimentally in traditional stone masonry walls. To reduce the simulation times, it is shown that the wall lateral numerical model adopting a coarser mortar discretization is a viable option for these walls. The mortar behaviour under compression with lateral confinement is identified as an important micro-parameter, that influences the peak strength and the ductility of rubble-masonry walls under uniaxial loading.

1. Introduction

It is mandatory to understand the structural behaviour of ancient stone masonry in order to properly assess its safety and constructive quality [1,2]. The numerical models adopted in the safety evaluation of these structures must be able to reproduce their complex behaviour under axial and/or transverse, monotonic and/or cyclic loads.
The numerical modelling of ancient stone masonry walls can be performed in macro-scale, by continuous type models [3], or in the micro-modelling of each individual component, by discontinuous models, at the scale of each component [4,5,6]. Discontinuous models can be based on the finite element method (FEM) [4], on the discrete element method (DEM) [5,6] or the combination of both [7,8,9], on the limit analysis [10] and on the discontinuous deformation analysis (DDA) method [11]. Multiscale numerical models that adopt homogenization techniques have also been proposed, where the constitutive model, on a macro scale, is based on a micro scale analysis of a representative volume element (RVE) [12].
In this paper a micro-modelling methodology using a 2D particle model (2D-PM) based on the DEM is adopted [13,14]. In this numerical approach, the constituent elements of the masonry structure (stones and mortar) are understood to be formed by a skeleton of particles of various dimensions in direct contact, with cohesive type connections that allow the skeleton of particles to withstand tensile forces. Recently, a hybrid PM model was proposed that greatly reduces the computation costs [15]. In this hybrid model the stone units, that are expected to remain in the elastic range, are discretized with finite elements [15].
Compared with other micro-modelling approaches, PM models by taking into account the material randomness at the grain scale are able to predict complex macroscopic failure with simple constitutive models, following the physical inter-particle interactions. Due to the fact that they are based on DEM techniques they are suitable for large displacement analysis and cyclic loading. It is known that micro-modelling approaches based on FEM models require complex cohesive contact models, which have convergence difficulties under cycling loading and large displacement [16]. By being based on DEM modelling PM models are also an excellent framework to generate complex numerical models representative of rubble masonry.
PM models have been applied in the modelling of traditional stone masonry walls in order to assess whether they can reproduce the behaviour observed in axial compression loading tests [17] but it has not yet been shown that the PM modelling can be used as a predictive tool on rubble-stone masonry walls built with hydrated air lime mortar [1,2]. For this reason, the main aim of this work is to assess whether the PM models can be adopted as a tool for predicting the structural behaviour of stone masonry elements built with hydrated air lime mortar. With this purpose, the calibration process of the particle model (2D-PM) based on the experimental tests of the stone masonry elements (stone and mortar) was improved with additional experimental testing that was carried out within the framework of this work. In order to further improve the predictive capabilities PM models with a more refined grain structure close to the mortar and stone grain distribution were adopted.
After a brief description of the numerical model and the adopted analysis methodology, the numerical model generation process, representative of the stone masonry structure is described. Then, the experimental tests of the wall specimens that are numerically assessed and the respective results are briefly presented. The calibration process carried out on the properties of the stone-stone and mortar-mortar contacts is presented to obtain an elastic and strength response close to the known stone and mortar experimental results. It is identified that the constitutive contact model adopted under compression has a significant relevance on the wall behaviour contrary to the observed in less heterogeneous materials like normal concrete and rock [13,14].
A good agreement with the known experimental masonry wall behaviour is obtained if a coarser mortar discretization is adopted. This suggests that the mortar uniaxial compressive strength is more influential to the wall compressive strength than the mortar flexure response. The presented numerical results also indicate that it is possible to greatly reduce the simulation times without compromising the quality of the numerical predictions, namely the peak strength, if a lateral wall numerical model adopting a coarser mortar discretization is adopted.
The presented results clearly show that, after a calibration of the contact parameters with known mortar and stone experimental data, it is possible to obtain a good agreement with stone masonry wall behaviour under uniaxial compression, namely elastic response and peak strength. The studies that were carried out clearly indicate that the mortar behaviour under confined compression is the main micro-parameter that influences the peak strength and the ductility of rubble-masonry walls under uniaxial loading. Note that the relevance of this micro-parameter is due to the strong heterogeneity (stiffness, strength) present in rubble-stone masonry where the surrounding stiffer stone units laterally restrain the mortar.

2. Particle Models

2.1. General Formulation

In the 2D-PM model based on DEM, the constituent elements of masonry, stone and mortar structures are discretized with circular particles. Each particle interacts with the neighbouring particles through the contact interfaces. The calculation cycle of a PM algorithm based on DEM consists in the sequential application of two laws: (i) the force displacement law and (ii) the law of motion. The forces acting on each particle are defined based on the contact forces, that are derived from the relative displacements between that particle and the neighbouring particles, at the contact locations. Given the applied forces, the updated particle positions and velocities are defined at each calculation step using Newton’s second law. The equations of motion in each particle, adopting a local non-viscous damping, are given by expressions (1) and (2):
F i ( t ) + F i d ( t ) = m x ¨ i ( t )
M 3 ( t ) + M 3 d ( t ) = I ω ˙ 3 ( t )
where F i ( t ) and M 3 ( t ) correspond, respectively, to the applied force vector and to the applied moment at time t; F i d ( t ) and M 3 d ( t ) correspond, respectively, to the local non-viscous damping force vector and to the local non-viscous damping moment at time t; m and I correspond to the particle’s mass and inertia; x ¨ i is the acceleration, ω ˙ 3 is the angular acceleration of the particle and i = 1 , 2 indicates the global x and y directions. The associated local non-viscous damping force vector and moment are computed by Equations (3) and (4):
F i d ( t ) = β | F i ( t ) | sign ( x ˙ i ( t ) )
M 3 d ( t ) = β | M 3 ( t ) | sign ( ω 3 ( t ) )
where, variable β is the non-viscous local damping coefficient and sign ( x ) is a function that takes the values given in Equation (5):
sign ( x ) = + 1 if x > 0 1 if x < 0 0 if x = 0
The local non-viscous damping is proportional to the magnitude of the total unbalanced force and has the opposite direction of the movement associated to the previous calculation step.
An explicit centred difference scheme is adopted to integrate over time the equation of motion [5,13]. An incremental force-displacement laws is adopted that sets the contact force increments given the contact displacement increments, Equations (6) and (7):
Δ F n [ C ] = k n Δ x n [ C ]
Δ F s [ C ] = k s Δ x s [ C ]
where Δ x n [ C ] and Δ x s [ C ] are, respectively, the displacement increments at the contact point on the normal and shear directions, and k n and k s are, respectively, the normal and shear contact stiffness.

2.2. Contact Stiffness and Resistance Models

In the following numerical simulations, the contact stiffness, both in the normal and in the shear directions, are given by the expressions (8) and (9):
k n = E ¯ A c d
k s = α k n
where E ¯ is the modulus of elasticity of the equivalent continuous material; d is the distance between the gravity centres of the particles in contact; A c = h t is the contact area; h is the contact height; t is the thickness of the particle system and α is a factor that relates the normal and the shear contact stiffness. The total contact tensile resistance, F n t , m a x , and the maximum cohesive force C m a x , are given as a function of the maximum tensile stresses, σ n t , c and the maximum cohesion stress, τ c , adopted at the contacts, and by the contact area, A c , according to the expressions (10) and (11):
F n t , m a x = σ n t , c A c
C m a x = τ c A c
In this work, a bilinear softening contact constitutive model is adopted in the normal and shear directions, see Figure 1, that requires the definition of the tensile fracture energy, G f , n , and of the shear fracture energy G f , s .
Figure 1 shows that the maximum tensile contact force and/or maximum shear contact force are reduced based on the current contact damage value. The damage values varies between 0 (without damage) and 1 (cracked contact). A cracked contact is only able to transfer contact forces in compression under pure friction. A tensile crack is a crack that is occurs in a contact due to tensile/shear damage and a shear crack is a crack that occurs in a contact due to compression/shear damage. As shown in Figure 1 it is possible to adopt under compression a yield plateau for a given maximum compression stress value ( F n c , m a x = σ n c , c A c ), which, as will be shown next, is important to consider due to the heterogeneity present in the old masonry walls built with hydrated air lime mortar.

2.3. Generation of the Numerical Models

The numerical modelling of a stone masonry structure using the 2D-PM model takes place through the generation of a particle system for each element that reproduces the stones, and through the generation of another particle system inside the elements that represent the mortar. After knowing the arrangement and the geometry of the stones in the masonry wall, Figure 2a, the space corresponding to the interior of each stone unit is discretized with particles, Figure 2b.
Following, the space corresponding to the external domain of each stone, which corresponds to the laying mortar, is discretized, Figure 2c. The contacts between particles are defined based on the Voronoi-Laguerre tessellation of the gravity centres of each particle [13]. Thus, despite adopting particles with circular geometry, a polygonal geometry is incorporated in an approximate way, allowing, when compared to traditional 2D-PM models, a better performance [13].

2.4. Model Parameters and Calibration Requirements

At the contact level, it is necessary to define seven parameters associated to the elastic and to the strength properties. The elastic response is related to the (1) Young’s modulus of the equivalent continuous material, E ¯ , and to the (2) stiffness factor, α , that relates the shear stiffness and normal stiffness. Regarding the strength parameters, it is necessary to define the (3) maximum tensile stress σ n t , m a x , the (4) maximum cohesion stress τ s , m a x , the (5) friction coefficient μ c , the (6) tensile G f , n and (7) shear G f , s fracture energies. If a yield plateau is adopted under compression the maximum compression stress value σ n c , c also needs to be defined.
In addition to elastic and strength parameters, there are other parameters associated to the particle system that need to be defined for each constituent element of the masonry, namely the maximum diameter, the minimum diameter and their distribution. Ideally, the adopted numerical particle size distribution should be as close as possible to the grain distribution of the material that is being modelled.
Given that the elastic and strength contact PM properties cannot be devised through analytical expressions, these properties need to be previously calibrated based on experimental results for each material to be modelled. In general, uniaxial compression, uniaxial tensile, splitting or bending tests are adopted, see Section 2.
When compared with a micro-modelling approach based on the FEM, the need to carry out a previous calibration procedure is one of the main disadvantages of PM models. Nevertheless, it is known that the cyclic cohesive contact models, such as the model proposed in [18], experience convergence problems upon a large number of cycles or large displacements [16]. Further, within a FEM approach it is difficult to devise a robust macroscopic constitutive law that reproduces the masonry wall behaviour for different loading conditions, even if a significant number of parameters are adopted. PM models based on DEM techniques are known to be suitable for large displacement analysis and cyclic loading. Also, with PM models the development of cracks and failure surfaces occurs as the simulations progresses due to its discrete nature. These advantages in our point of view compensate the need for calibration of the PM parameters under simple tests.

3. Experimental Work

3.1. Rubble-Stone Masonry Specimens

The development of the numerical models presented in this research is based on the experimental work carried out by Pinho [1], in which the mechanical strength of several rubble-stone masonry specimens was quantified, before and after the application of different strengthening solutions, in two testing systems (axial compression and compression-shear tests) developed for this purpose. In this experimental work [1,2,19], 62 masonry specimens (URM specimens) were built by specialized workers, using traditional building materials and construction techniques: 59 specimens (M1 to M59), comprising 75% rubble stone and 25% hydrated air-lime mortar per volume unit of masonry, and the final three specimens (M60 to M62) having only 75% of the mortar of the first ones. The specimens were divided into two groups: specimens numbered from M1 to M20 (named “large specimens”), all being 1.20 m high, 1.20 m wide, and 0.40 m thick for compression and shear load tests and specimens numbered from M21 to M62 (known as “small specimens”), all being 1.20 m high, 0.80 m wide, and 0.40 m thick, for axial compression load tests. The specimens were built on reinforced concrete bases, 0.20 m high, and, on top of the masonry, reinforced concrete lintels, 0.15 m high, were built to distribute the vertical loads.
Geometrical characteristics and views of the specimens are shown in Figure 3.
The air-lime mortar has a volumetric composition of 1:3 (hydrated air-lime: sand), and a water/hydrated air-lime ratio of 1.2. The sand was composed, in equal parts, of river sand and yellow pit sand. The rubble stone blocks were made of limestones (sedimentary rock) that came from the center of Portugal.

3.2. Materials and Specimens’ Properties

The building materials (stones, sands, hydrated air-lime and mortar) were tested to assess several physical, mechanical, and chemical properties. In general, the tests were conducted in accordance with the following standards, although in some cases small adjustments were made.
The limestones have an average volumetric ratio [20] of 0.26 and an average length of 16.7 cm (both values taken from 150 specimens). The open porosity is of 8.1% and the average apparent density of 2491 kg/m3 [21]. The average compressive strength, measured from 14 specimens with nearly 60 × 60 × 60 mm3, prepared and tested according to [22], is 47.8 MPa. Besides these results, six stone specimens with almost 70 × 70 × 70 mm3 were tested within the scope of this work, aiming to obtain the modulus of elasticity in axial compression [22], of 5.89 GPa, required for the numerical analysis. The hydrated air-lime used in the mortar of the rubble-stone masonry specimens [1] is a binder resulting from the decomposition under the temperature effect, of limestones with a percentage of calcium carbonate or calcium and magnesium higher than 95% [23]; according to NP EN 459-1:2011, this hydrated air-lime belongs to class CL90 S. The dimensions of the sands used in the experimental specimens mortar varies between 0.149 mm (minimum dimension of both River sand and Yellow pit sand) and 2.38 mm (maximum dimension of River sand).
Among the mechanical features of the hardened mortar determined in the work of [1], from prismatic samples of 160 × 40 × 40 mm3, the following are used in this work: compressive strength and tensile flexural strength [24] of 0.650 MPa and 0.300 MPa, respectively. Under the scope of this work, additional tests were performed on mortar prismatic samples of 160 × 40 × 40 mm3, and the following results were obtained: compressive strength of 0.633 MPa and modulus of elasticity in axial compression of 74.95 MPa [24].

3.3. Experimental Analysis of the URM Specimens

Two different loading systems were specially designed and built to accomplish the mechanical characterisation of the specimens used in this research [1]: one loading system for axial compression tests on “small specimens” and another one for shear–compression tests on “large specimens” (see Figure 3). The axial compression load was applied monotonically up top failure by a hydraulic cylinder placed between a steel frame and a load-spreading steel beam placed over the wall. The vertical displacements were measured on the top of the walls by two displacement transducers fixed to the concrete base. Vertical displacements are measured on the top of the specimens by two displacement transducers fixed to the concrete base of the specimens. The axial compression tests started about 21 months after the construction of the specimens, with a preliminary test (on M47) that allowed to adjust the thickness to 200 mm and to provision it with reinforcement. Subsequently, three small specimens (M43, M21, and M32), named “reference specimens”, were tested to characterise the masonry and to analyse and compare the performance of different strengthening techniques applied in other masonry specimens [2,25,26,27,28] and for some URM specimens tested later, M9 [29] and M36 [30].
Figure 4 shows the final stages of URM specimens tested under axial compression loading.
Figure 5 presents the force-displacement and the stress–strain diagrams extended up to 75% of the maximum vertical force.
In Table 1 are presented the main experimental results obtained under compression loads of the rubble-stone’s masonry specimens, namely the maximum force ( F m a x ); the maximum compressive strength ( σ c , m a x ); the vertical displacement corresponding to the maximum force ( d v , F m a x ); the vertical extension corresponding to the maximum compressive strength ( ε v , F m a x ); and the secant elasticity modulus (E), calculated for 30% of the maximum force.
The actual maximum force applied to large specimen M9 was 288.4 kN; however, considering that all other specimens in Figure 5 and Table 1 are small specimens, such force was reduced to be equivalent to a small specimen using the ratio 288.4 / 1.5 = 192.2 kN, where 1.5 is the ratio between the cross section areas of large and small specimens (0.48 m2/0.32 m2). According to Table 1, the following average values were obtained as mechanical parameters of the reference (URM) specimens M43, M21, and M32: σ c , m a x = 0.43 MPa; ε v , F m a x = 4.9   and E = 0.305 GPa.
Based on the results of the transverse deformation, obtained on the axial compression test of specimen M32 [1], it was also possible to estimate the Poisson’s coefficient of the masonry of this specimen, given by the ratio between the transverse deformation and the axial deformation, of ν = 0.24 .
The effect of the carbonation depth on the evolution of the traditional stone masonry walls mechanical strength has been studied [2,28], using several stone masonry specimens built in 2002 [1]. However, this effect is not considered in the adopted 2D-PM numerical model, mainly due to the low values of the aging time and due to the typical heterogeneity of this type of masonry.
The experimental results summarized above are mostly used to calibrate the 2D-PM model contact properties and to assess if it is possible to predict the rubble-stone masonry wall response under axial compression with the adopted 2D-PM model methodology.

4. Numerical Modelling

4.1. Model Generation

A 2D-PM numerical model was developed based on the frontal side of specimen M43 with dimensions 1.20 × 0.80 × 0.40 m3 [1]. Figure 6 shows an image of the frontal view of specimen M43 that was used to define the stone contours required to build the 2D-PM model, see Section 2.3.
The 2D-PM numerical model of the lateral sides was also developed in order to assess if the lateral side can also be a valid analysis option, regarding the peak strength. Compared to the frontal models, the lateral models have lower computational demanding given that they require a reduced number of particles and contacts. In future studies it is intended to adopt the lateral numerical models for the assessment of reinforcement solutions.
In the inner discretization of each stone unit, with a global average dimension of 16.7 cm, a PM model with a uniform radius distribution between 0.003 m and 0.005 m was adopted, similar to the study carried out in [17]. For the mortar discretization two different particle discretizations were adopted, a coarser discretization with radius ranging between 0.00714 m and 0.00119 m (m-coarse) and a more refined discretization with radius ranging between 0.002975 m and 0.00119 m (m-refined), which is a better match to the grain distribution of sand adopted in the real mortar mix. The adopted maximum particle radius are obtained from the maximum sand particles dimension used in the mortar in the experimental study.
Figure 7 shows the numerical models that were build form the frontal views of specimen M43 and from the lateral views of specimen M12. An amplified picture of each PM model is also presented, showing the contacts that are present on each model. Regarding the model generation, when compared with a continuum based FE model, a PM model framework by including the possibility to consider new contacts as the calculation progresses greatly eases the generation procedure which is important for rubble masonry due to its heterogeneity.
Table 2 presents for each adopted PM model, the total number of particles adopted in the wall discretization, and the total number of contacts that are adopted, which can be of three types: mortar-mortar (m-m), mortar-stone (m-s) and stone-stone (s-s).

4.2. Parameter Calibration–Uniaxial Testing

The elastic and strength properties of each type of contact present in the wall numerical models were calibrated given the experimental results carried out in [1]. Some additional experimental tests, namely uniaxial compression tests in both stones and mortars units and bending tests only in mortar units, were carried out after the preliminary work presented in [17], as it was identified the need to adopt strength values closer to the mortar and stone units in order to assess the 2D-PM model predictive ability, Table 3.
The contact properties for s-s contacts representing the stones units were calibrated in numerical specimens with dimensions 0.20 m × 0.20 m. The m-m contacts representing the mortar were calibrated adopting numerical models with dimensions 0.04 m × 0.04 m for the uniaxial tests and numerical models with dimensions 0.16 m × 0.04 m for the bending tests. In the mortar numerical tests both geometries match the experimental geometries. As mentioned in Section 4.1 two different particle discretizations were adopted for the mortar, a coarser discretization with radius ranging between 0.00714 m and 0.00119 m (m-coarse) and a more refined discretization with radius ranging between 0.002975 m and 0.00119 m (m-refined), which is a better match to the grain distribution of sand adopted in the real mortar mix. The calibration procedure follows a trial and error approach. The elastic contact properties are initially set in order to match the macroscopic experimental Young modulus and Poisson’s coefficient. Later the strength contact properties are set in order to match the known strength peak values. With PM models an elastic behaviour under compression is usually adopted, but during the numerical simulations that were carried out, high normal contact compression forces were found to occur at some mortar contacts, due to the heterogeneity present in the masonry walls. For this reason a simple model with a yield plateau for a compression stress value of 0.80 MPa was also adopted (yielding). Table 3 shows the elastic and strength macroscopic numerical values after the calibration procedure and the known experimental values. The values between brackets correspond to the macroscopic predictions for the case that an elastic contact model is adopted under compression. As expected, the adopted compression behaviour (yielding for a compression value of 0.80 MPa) does not have a significant influence under bending loading, and even under uniaxial compression, the change in the predicted values is not very meaningful. As it will be shown, the mortar contact model under compression has a strong influence in the rubble walls behaviour under uniaxial compression. It can be seen Table 3b), that with a refined particle assembly, following more closely the real mortar granular distribution, it is possible to predict a macroscopic bending stress within the range of the value obtained experimentally. Due to computational restrictions a more refined particle assembly was not developed, nevertheless the presented results show that the adopted refined mortar assembly already has a numerical behaviour close to the hydrated lime behaviour used in the experimental tests.
The calibrated contact values are presented in Table 4.
For the m-s contact the same properties of the m-m contacts were adopted. The coarse mortar (m-coarse) and the refined mortar (m-refined) particle assemblies have very similar contact elastic and strength properties.
Figure 8 shows the final crack patterns for the coarse (m-coarse) and refined mortar (m-refined) under uniaxial compression and under bending tests for the calibrated contacts values (Table 4). The final crack patterns are the expected failure patterns on each test.
Figure 9 presents the stress-deformation and the force-displacement curves predicted with the calibrated mortar contact properties. It can be observed that the refined mortar has a less brittle behaviour than the coarse mortar in both tests, which is associated with a more pronounced particle heterogeneity. Nevertheless, both mortar numerical models have a very brittle behaviour close to the observed in hydrated air lime mortar.

5. Particle Model Prediction

5.1. Frontal Model

In the numerical tests that are presented, a free rotational upper plate boundary condition was considered, similar to the experimental tests taken as reference [1]. Nevertheless, it is important to mention that the adopted boundary condition at the upper plate (free or non-rotating) have a meaningless effect in the predicted peak strength value and failure mode.
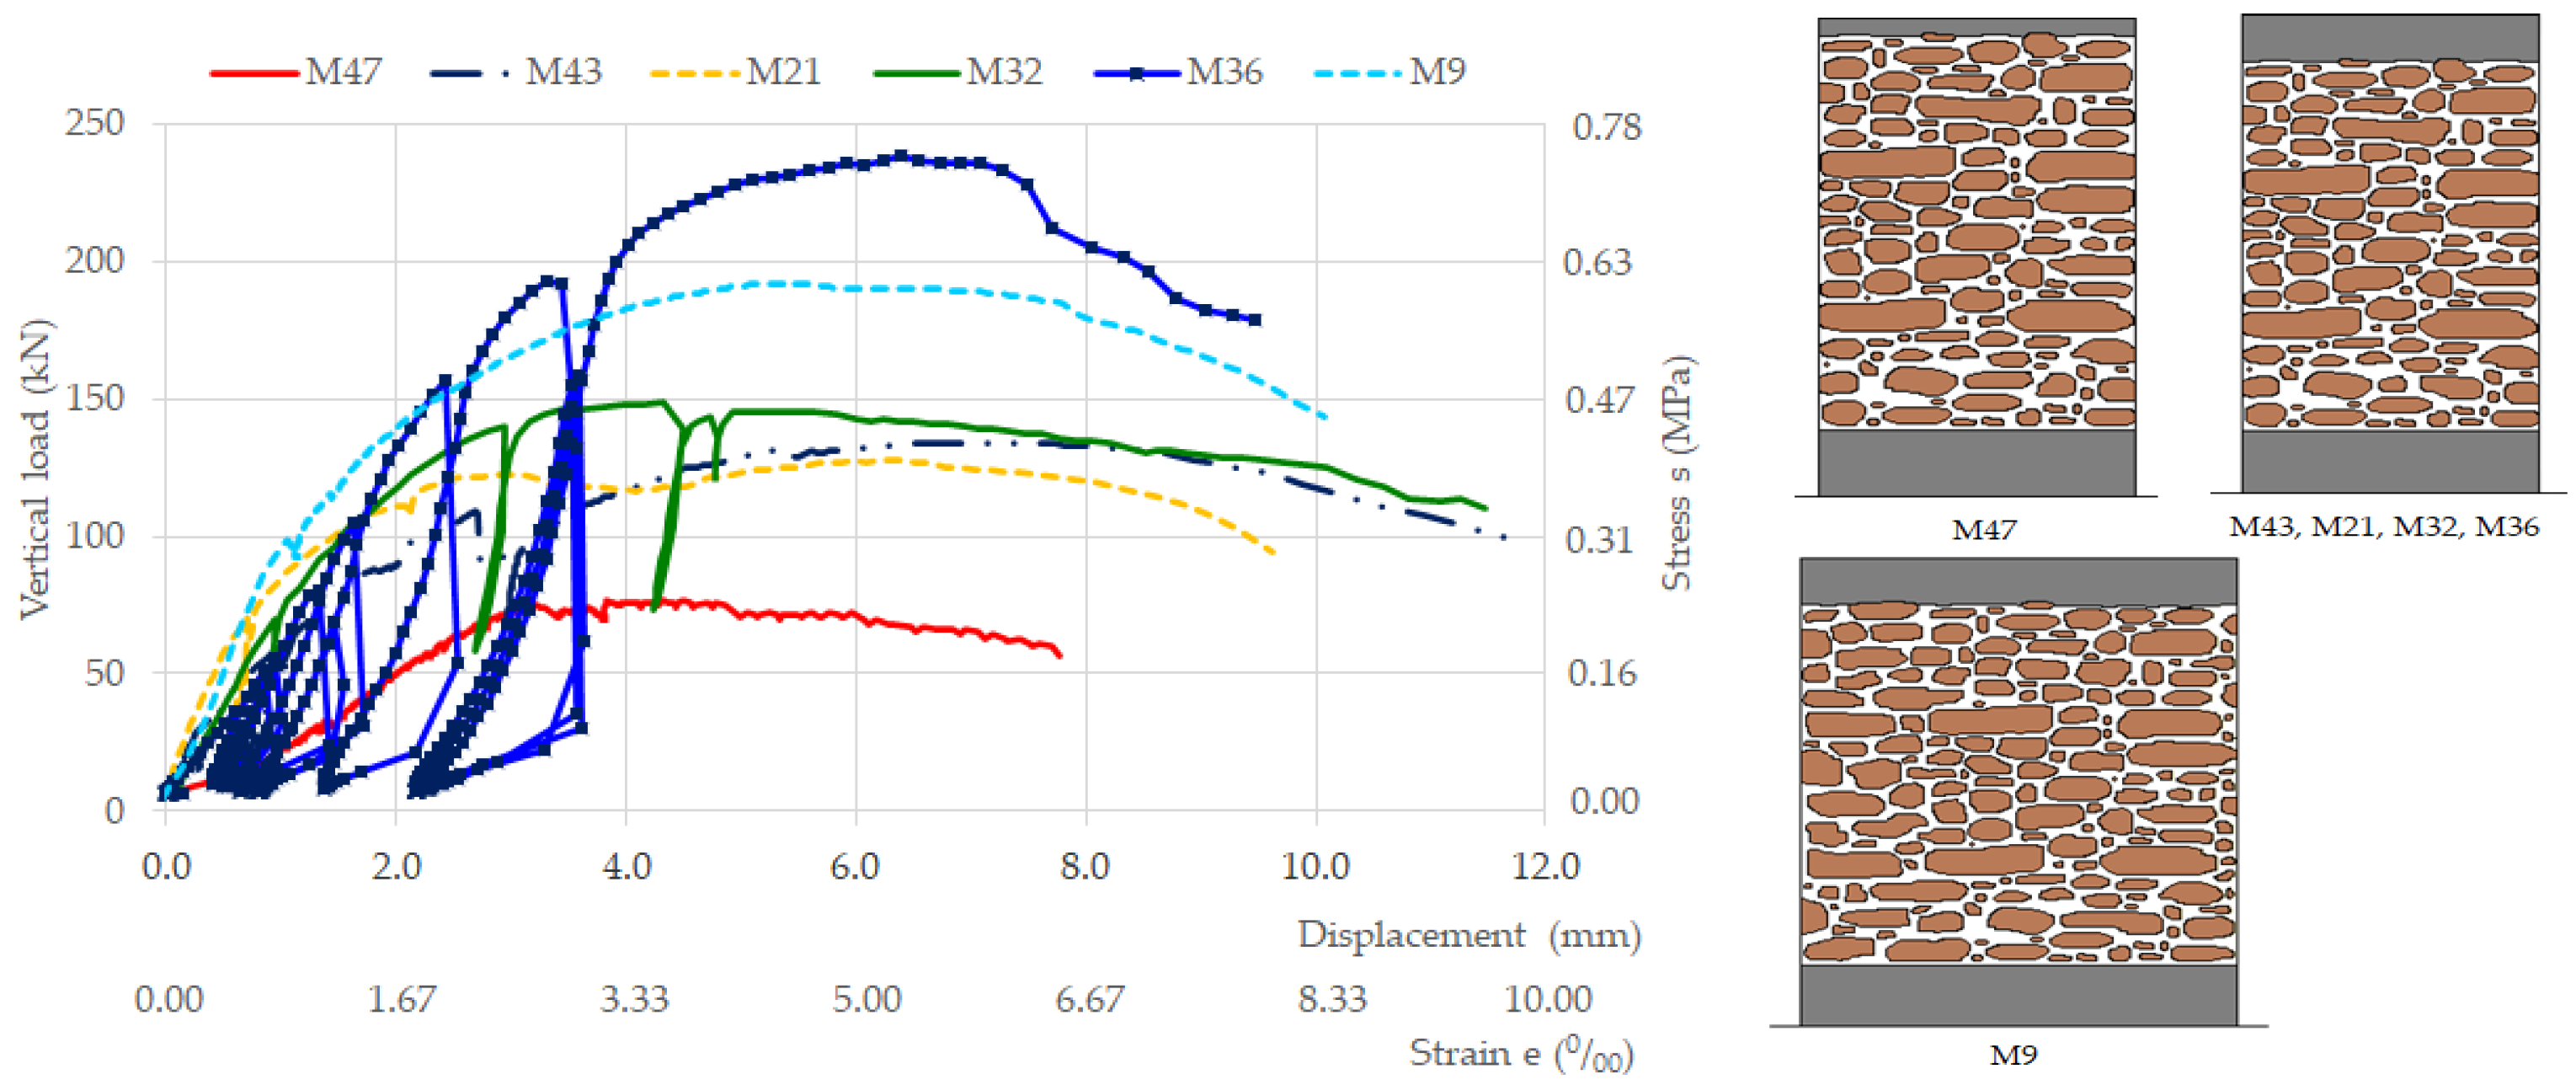
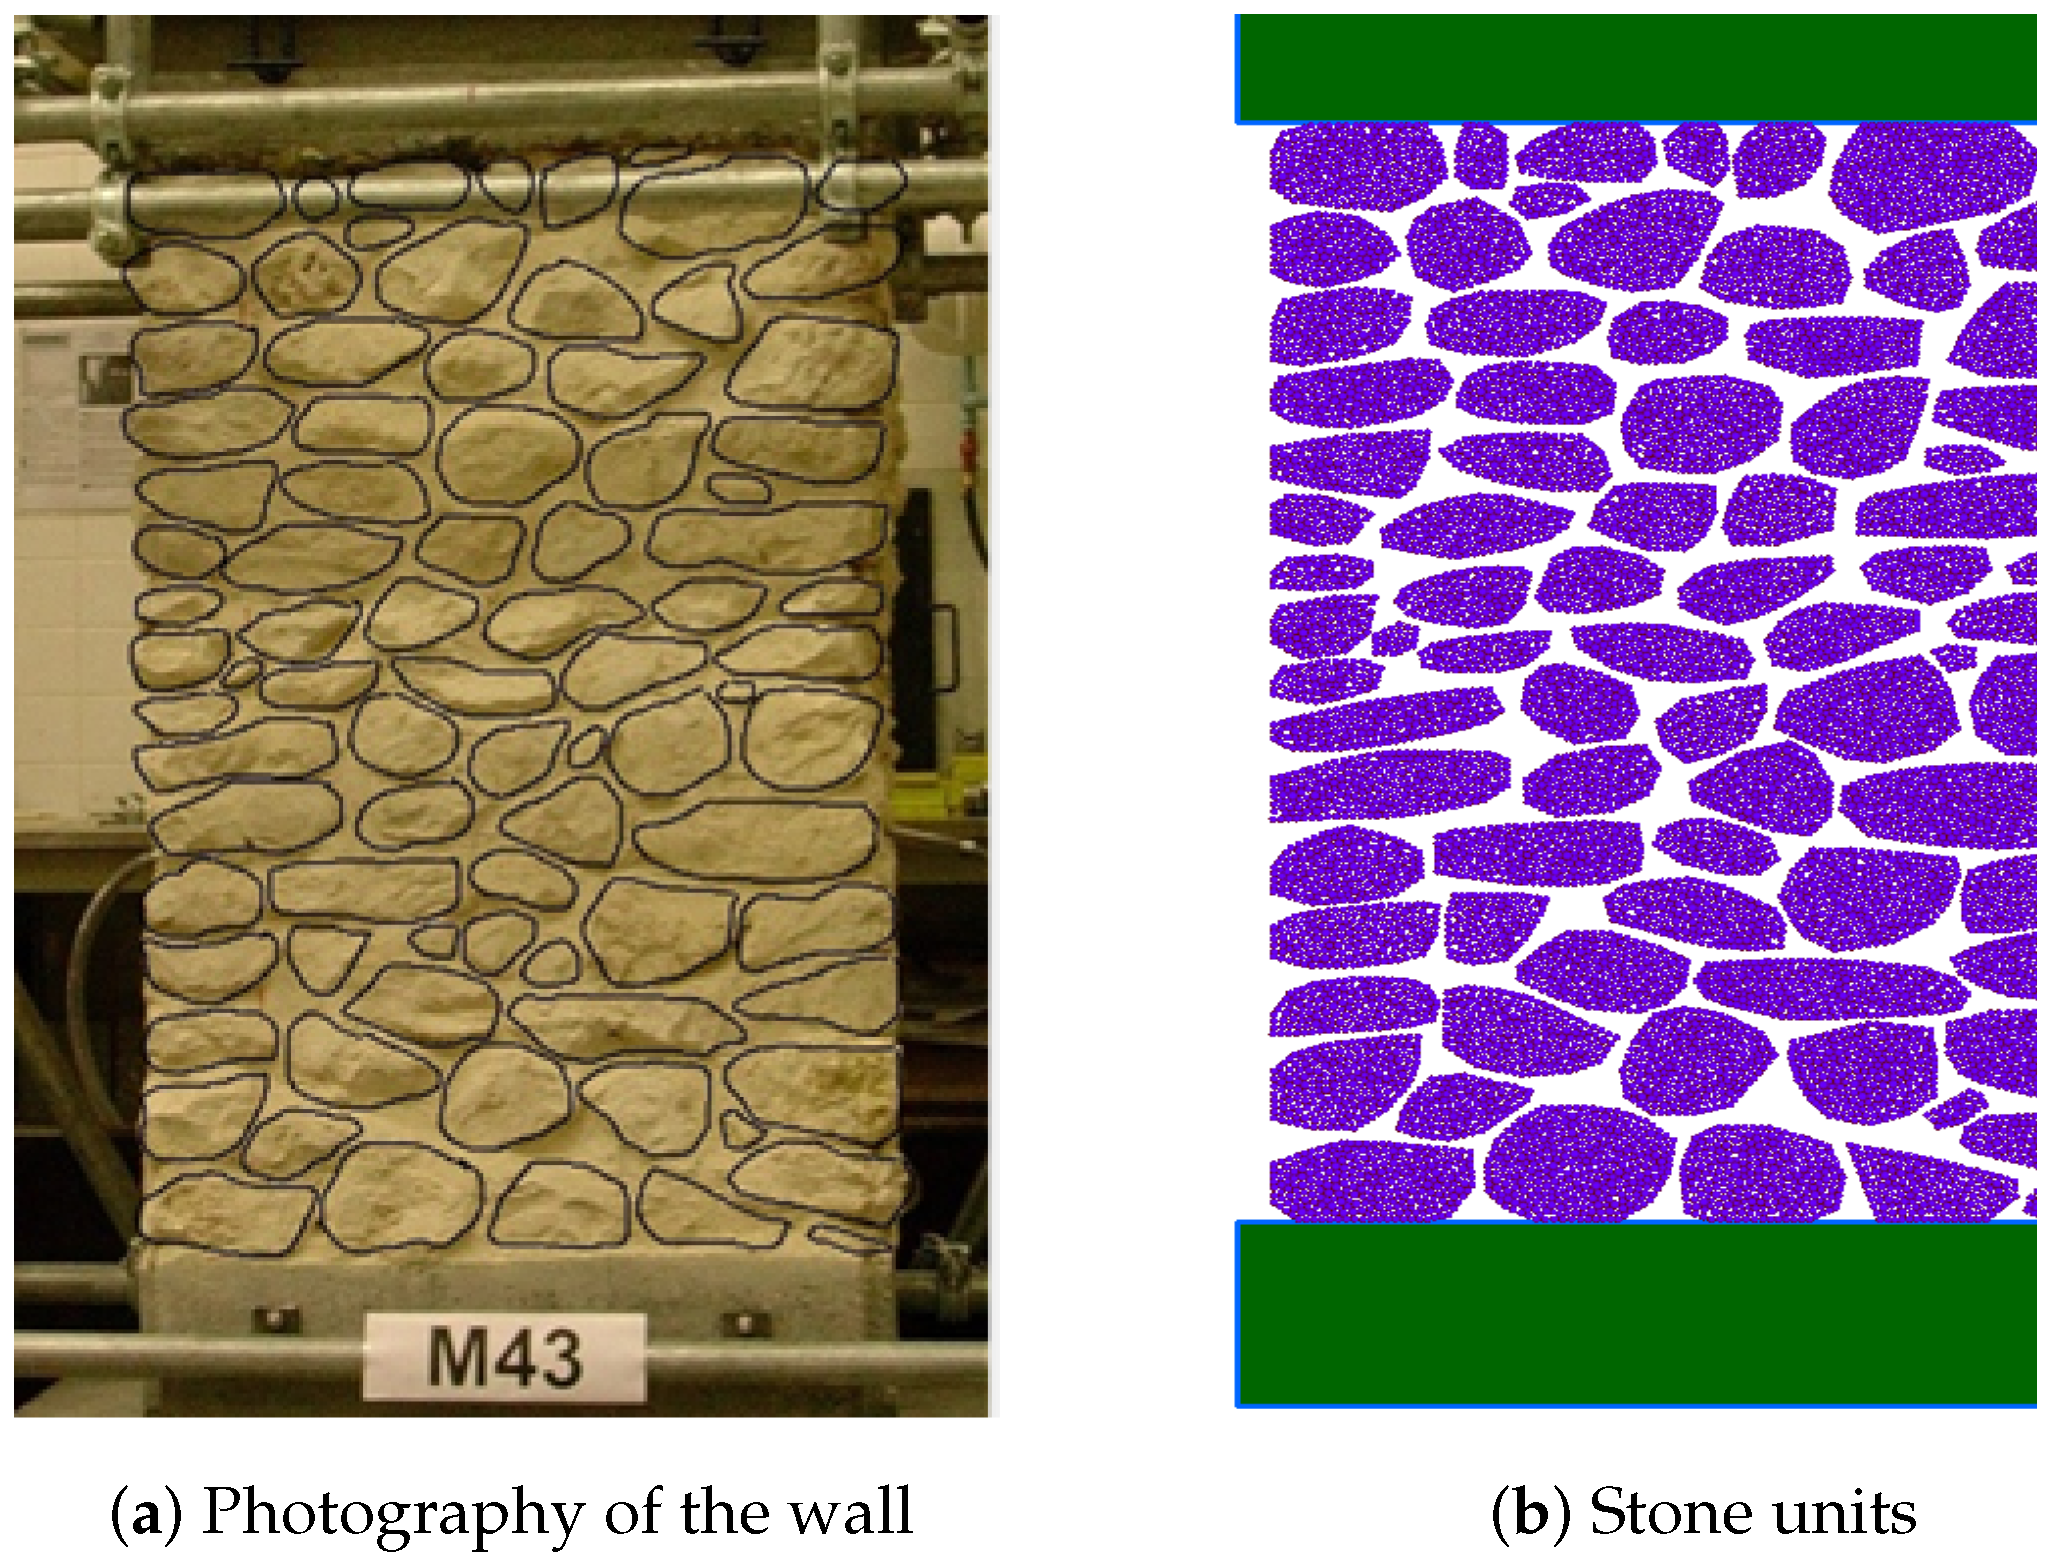
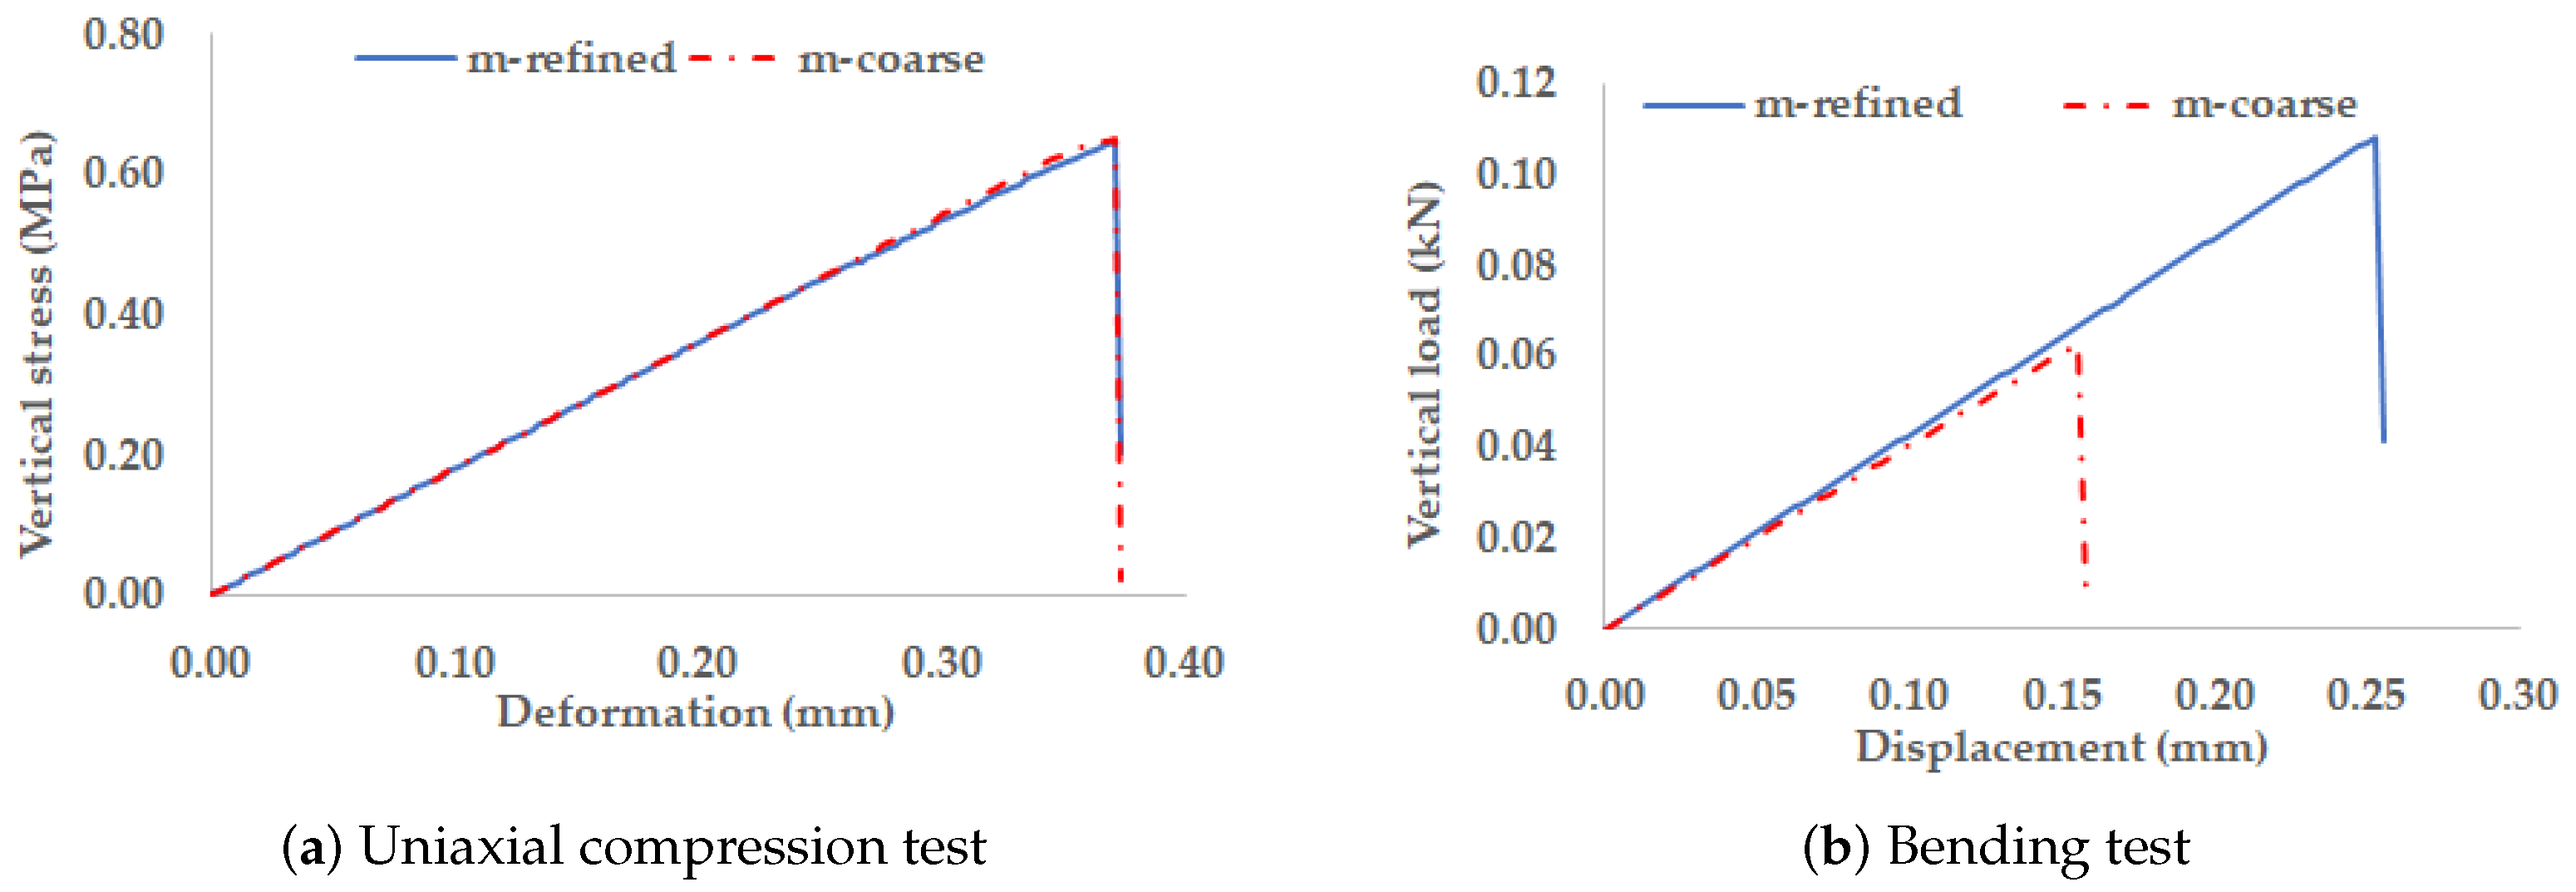
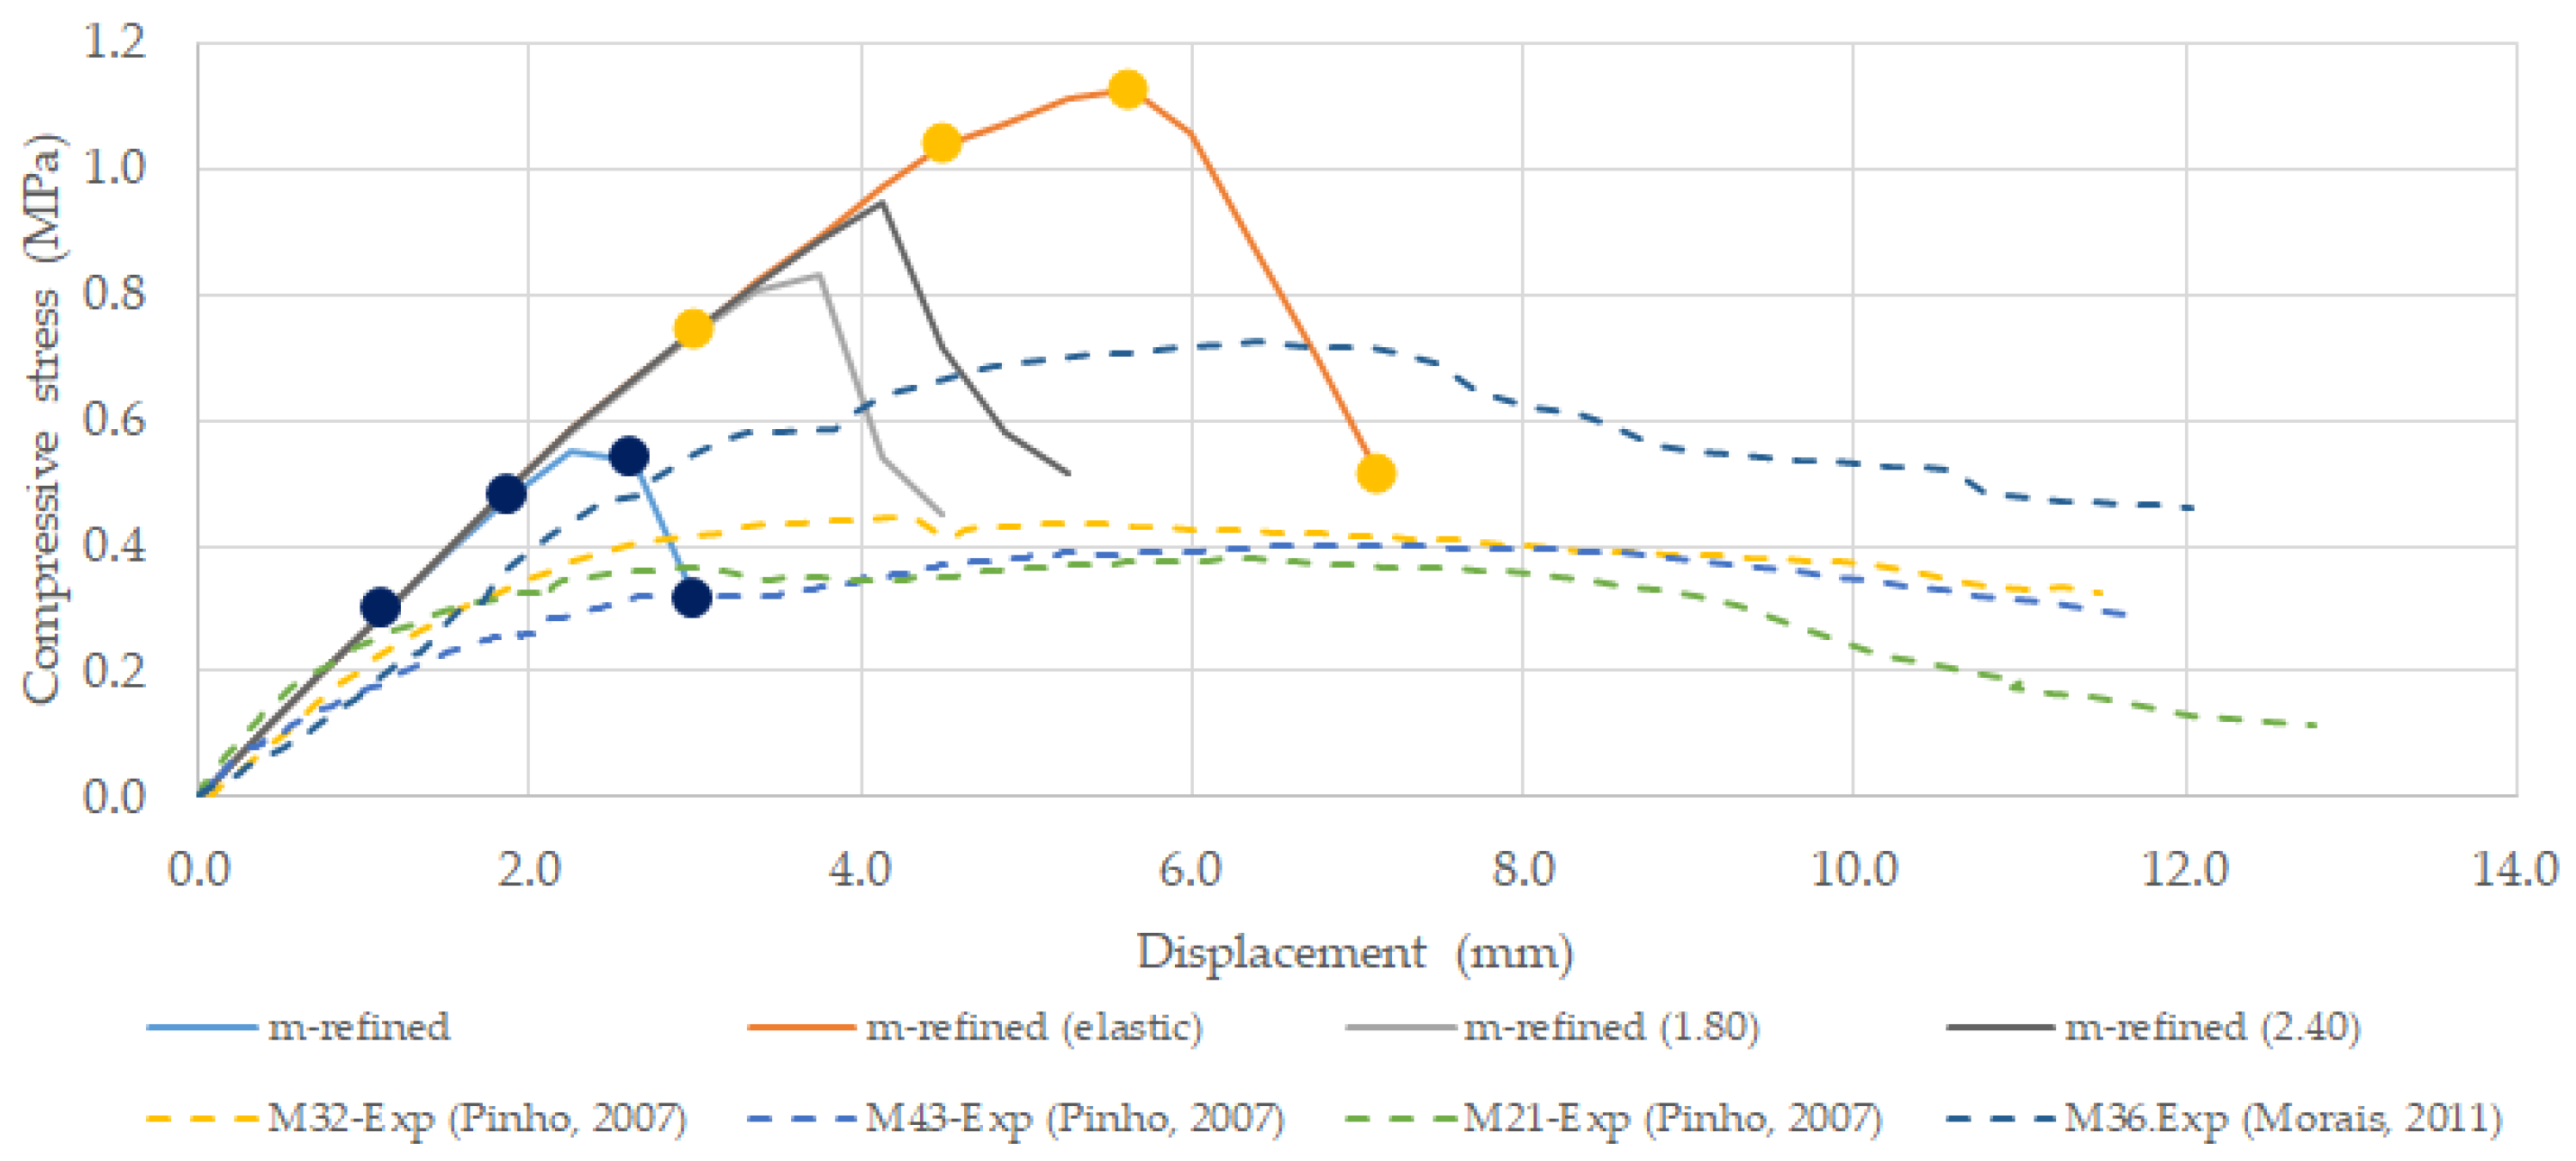
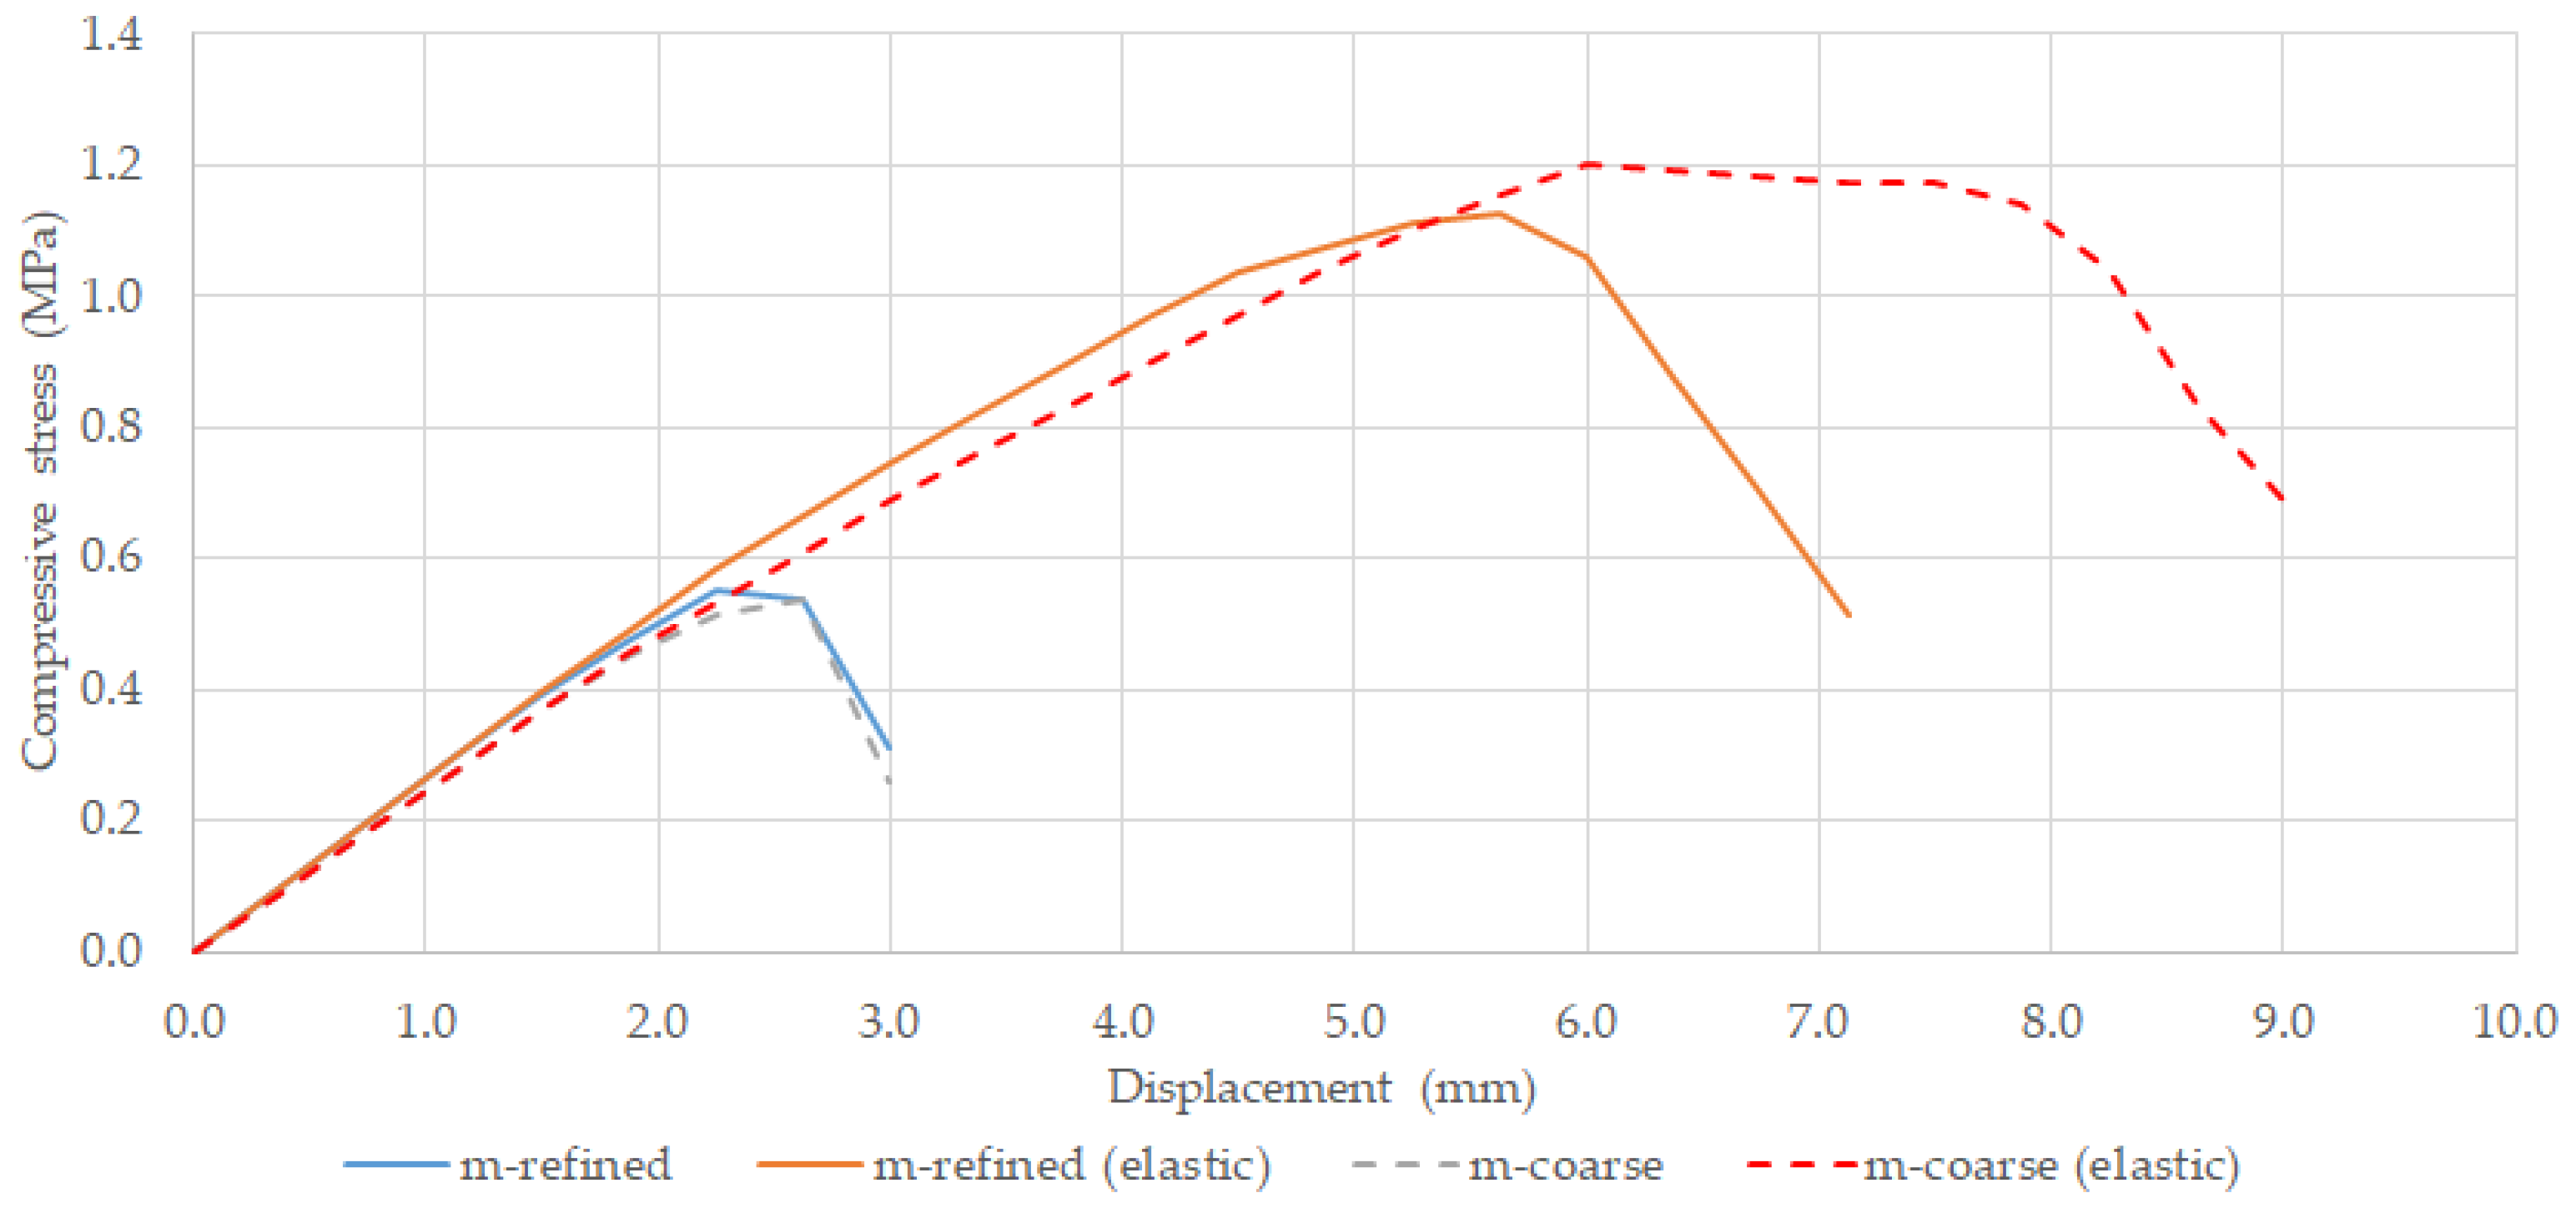
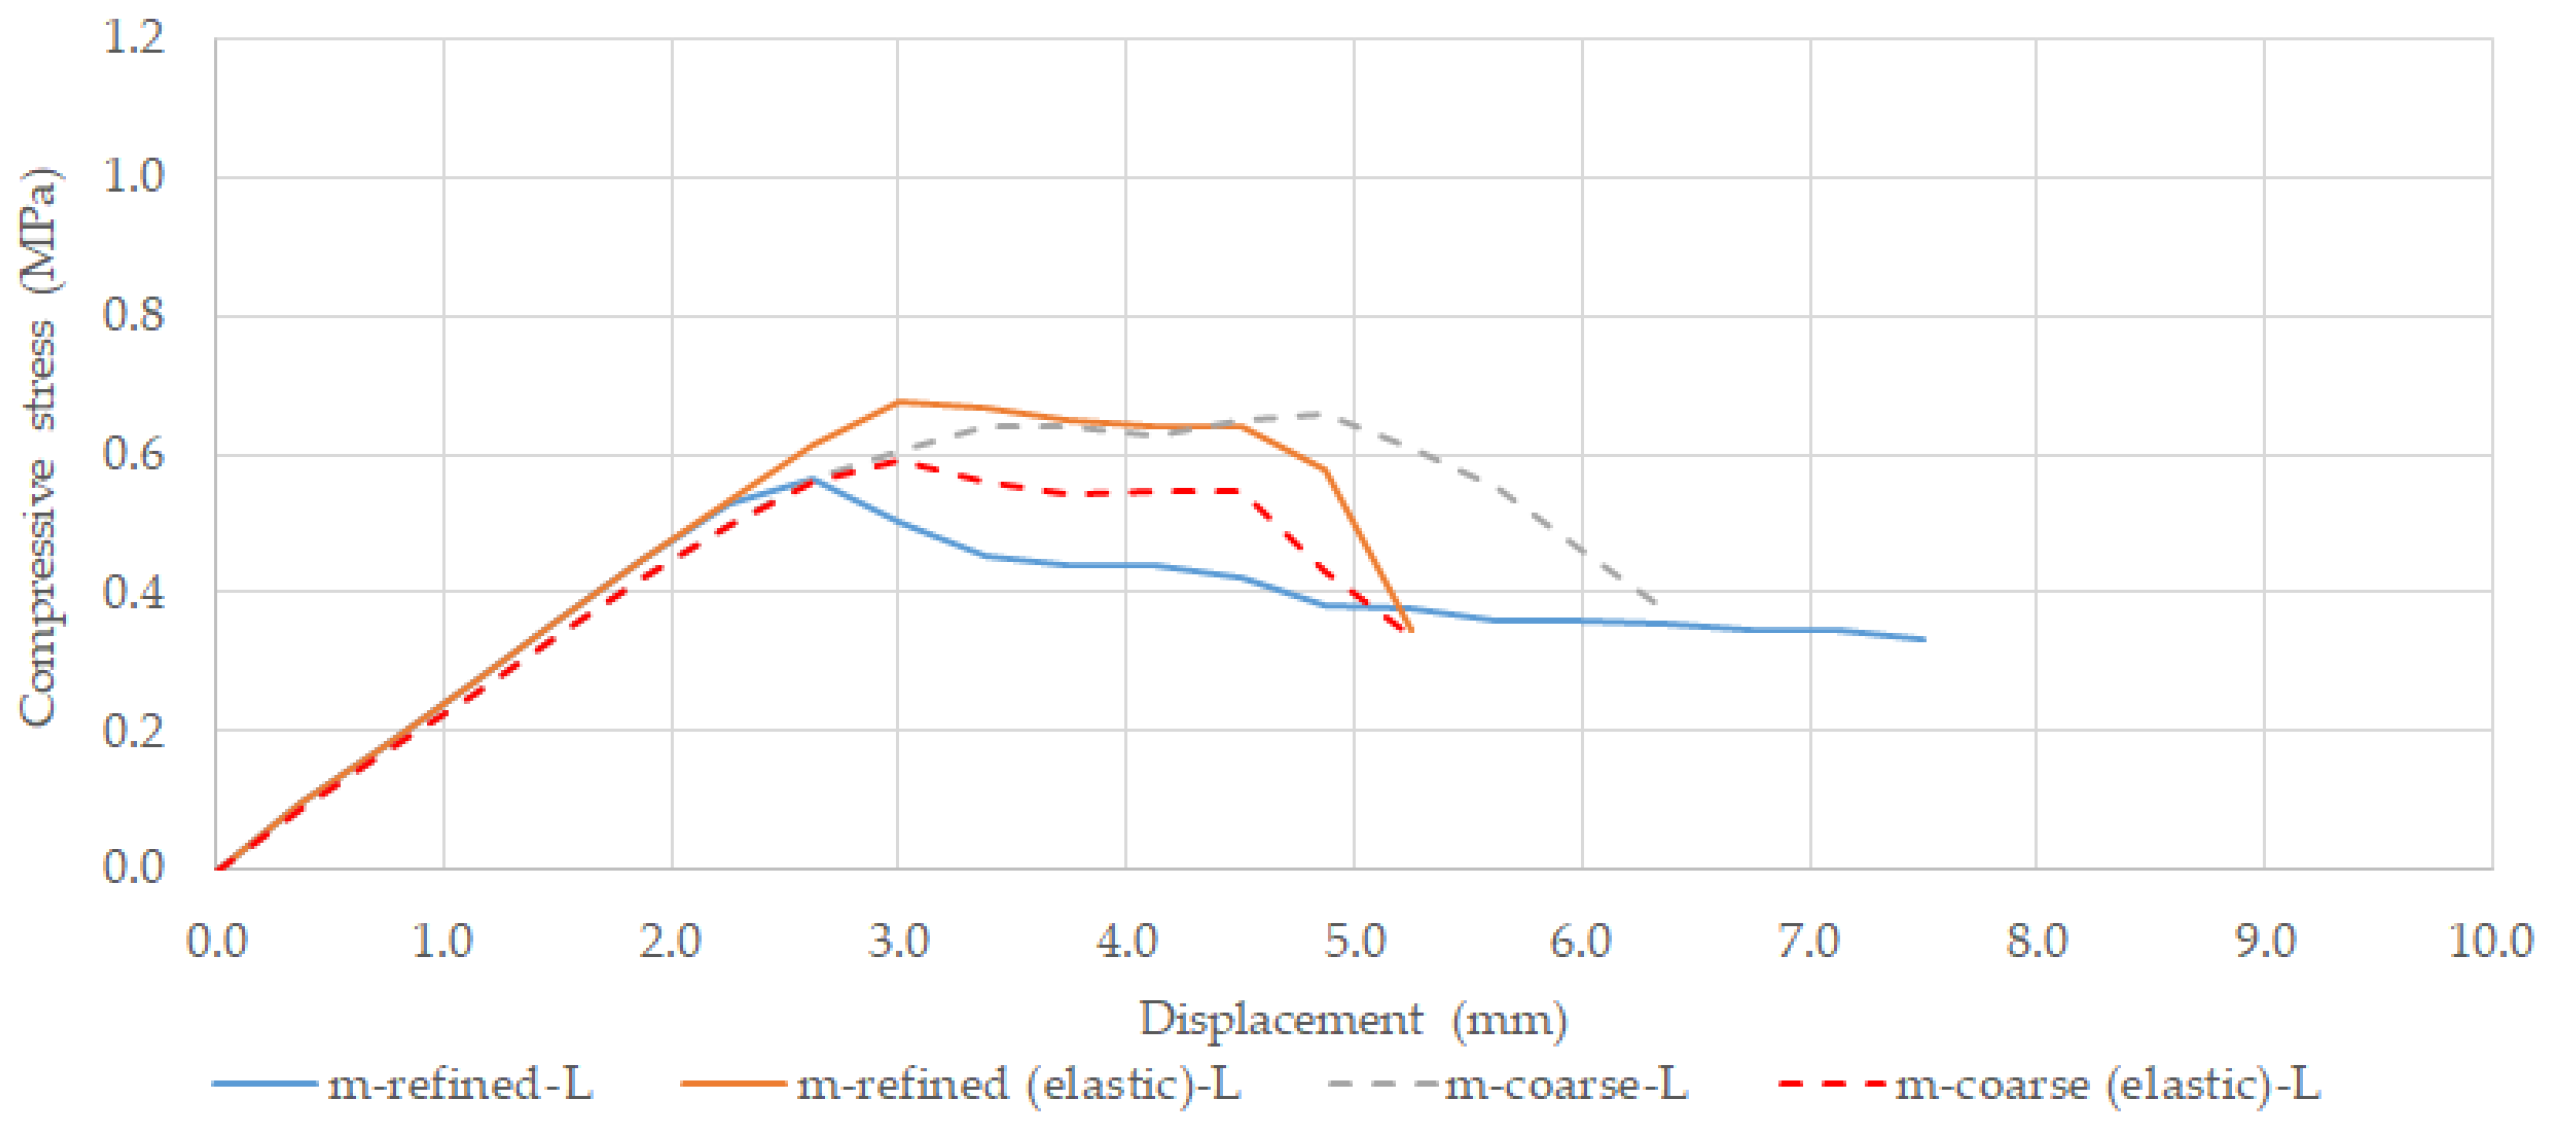
Figure 10 presents the numerical stress-displacement response predictions obtained for the 2D-PM numerical refined particle assembly model (m-refined) that was developed based on the frontal side of specimen M43, with a % of mortar of around 25%. In Figure 10 it is shown the numerical prediction with the calibrated contact constitutive model adopting a yield plateau under uniaxial compression with a maximum value of 0.80 MPa (m-refined), the numerical prediction adopting the traditional elastic behaviour under compression (m-refined (elastic)) [13] and two additional numerical simulations adopting higher uniaxial compression yield values of 1.80 MPa (m-refined (1.40)) and 2.40 MPa (m-refined (2.80)). As pointed out in the calibration section, the mortar adopted in the experimental tests had a maximum uniaxial compression stress of 0.65 MPa. The experimental stress-displacement curves for four wall specimens [2] are also presented in Figure 10.
It can be observed, Figure 10, that it is possible to numerically predict a masonry wall response under uniaxial testing closer to the obtained experimentally, if a parameter calibration is carried out in order to mimic the known experimental behaviour of each wall component, mortar and stone, under uniaxial and bending tests. The m-refined 2D-PM numerical model give a good prediction in terms of initial elastic response and peak strength. Regarding the ductility the m-refined 2D-PM predictions are less ductile that the observed experimental response. It can also be observed that with an elastic contact model under compression, the 2D-PM numerical model predicts a higher peak strength and a less brittle response. This indicates that the mortar response under compression is one of the mechanisms that contribute to a more ductile response under uniaxial compression. The presented numerical results point out that it is important to assess the mortar response under biaxial confinement.
In Table 5 are shown the numerically obtained elastic modulus, peak strength and maximum displacement at peak strength, as well as the average experimental values obtained in [1,30]. The m-refined 2D-PM numerical model is able to predict values closer to the obtained experimentally, namely the peak stress. As mentioned, the ductility measure as the maximum displacement at peak stress is lower. The numerical model with an elastic behaviour under compression predicts a higher peak strength and wall ductility.
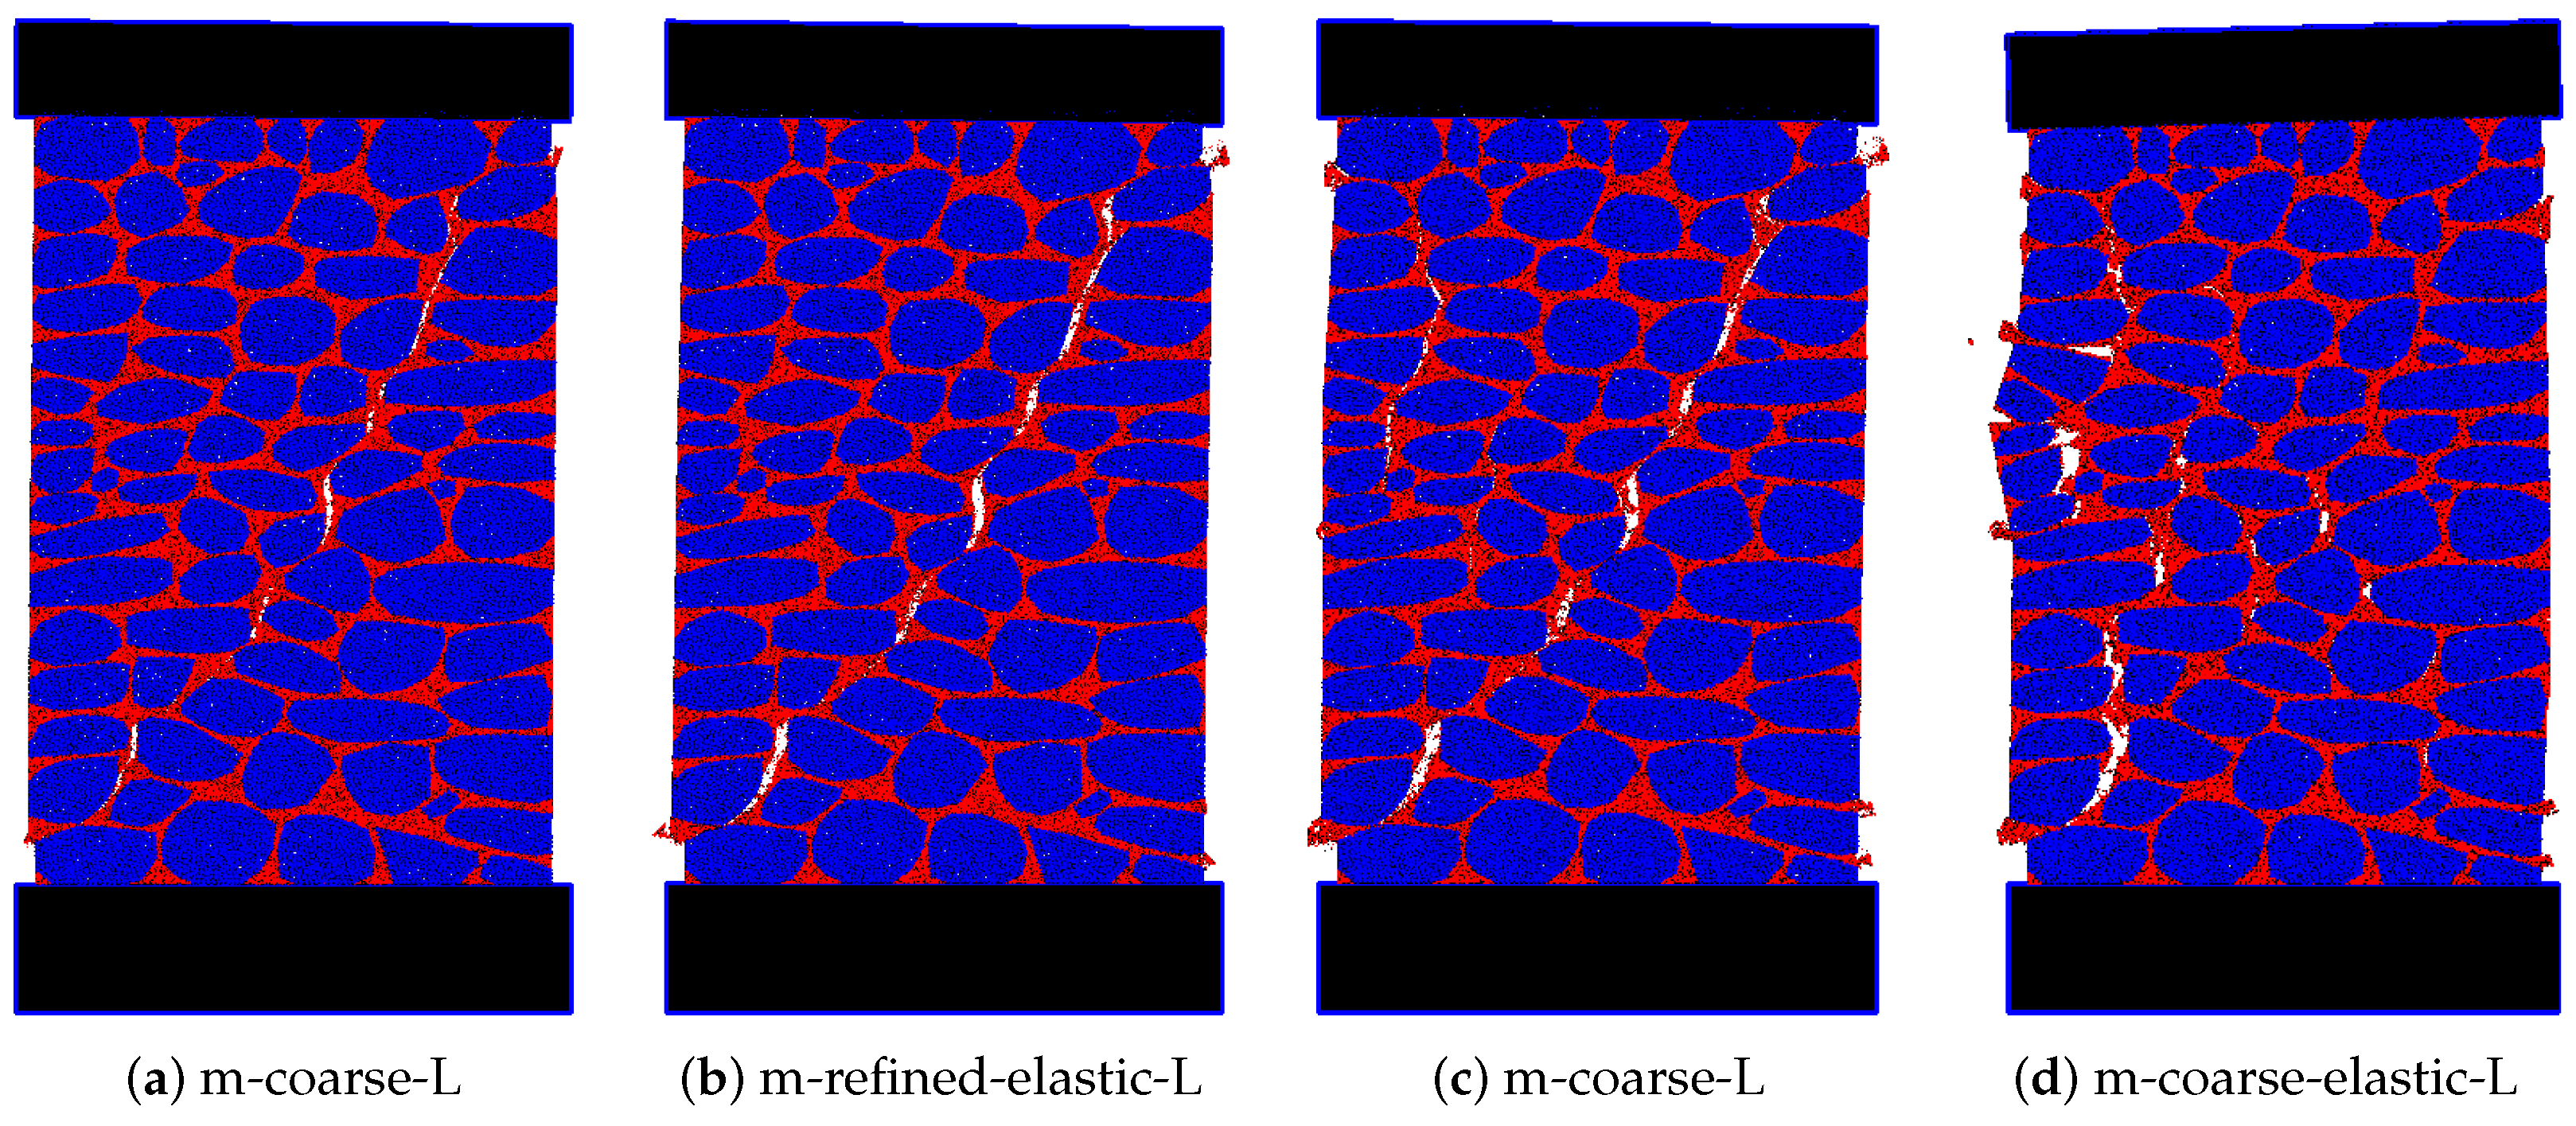
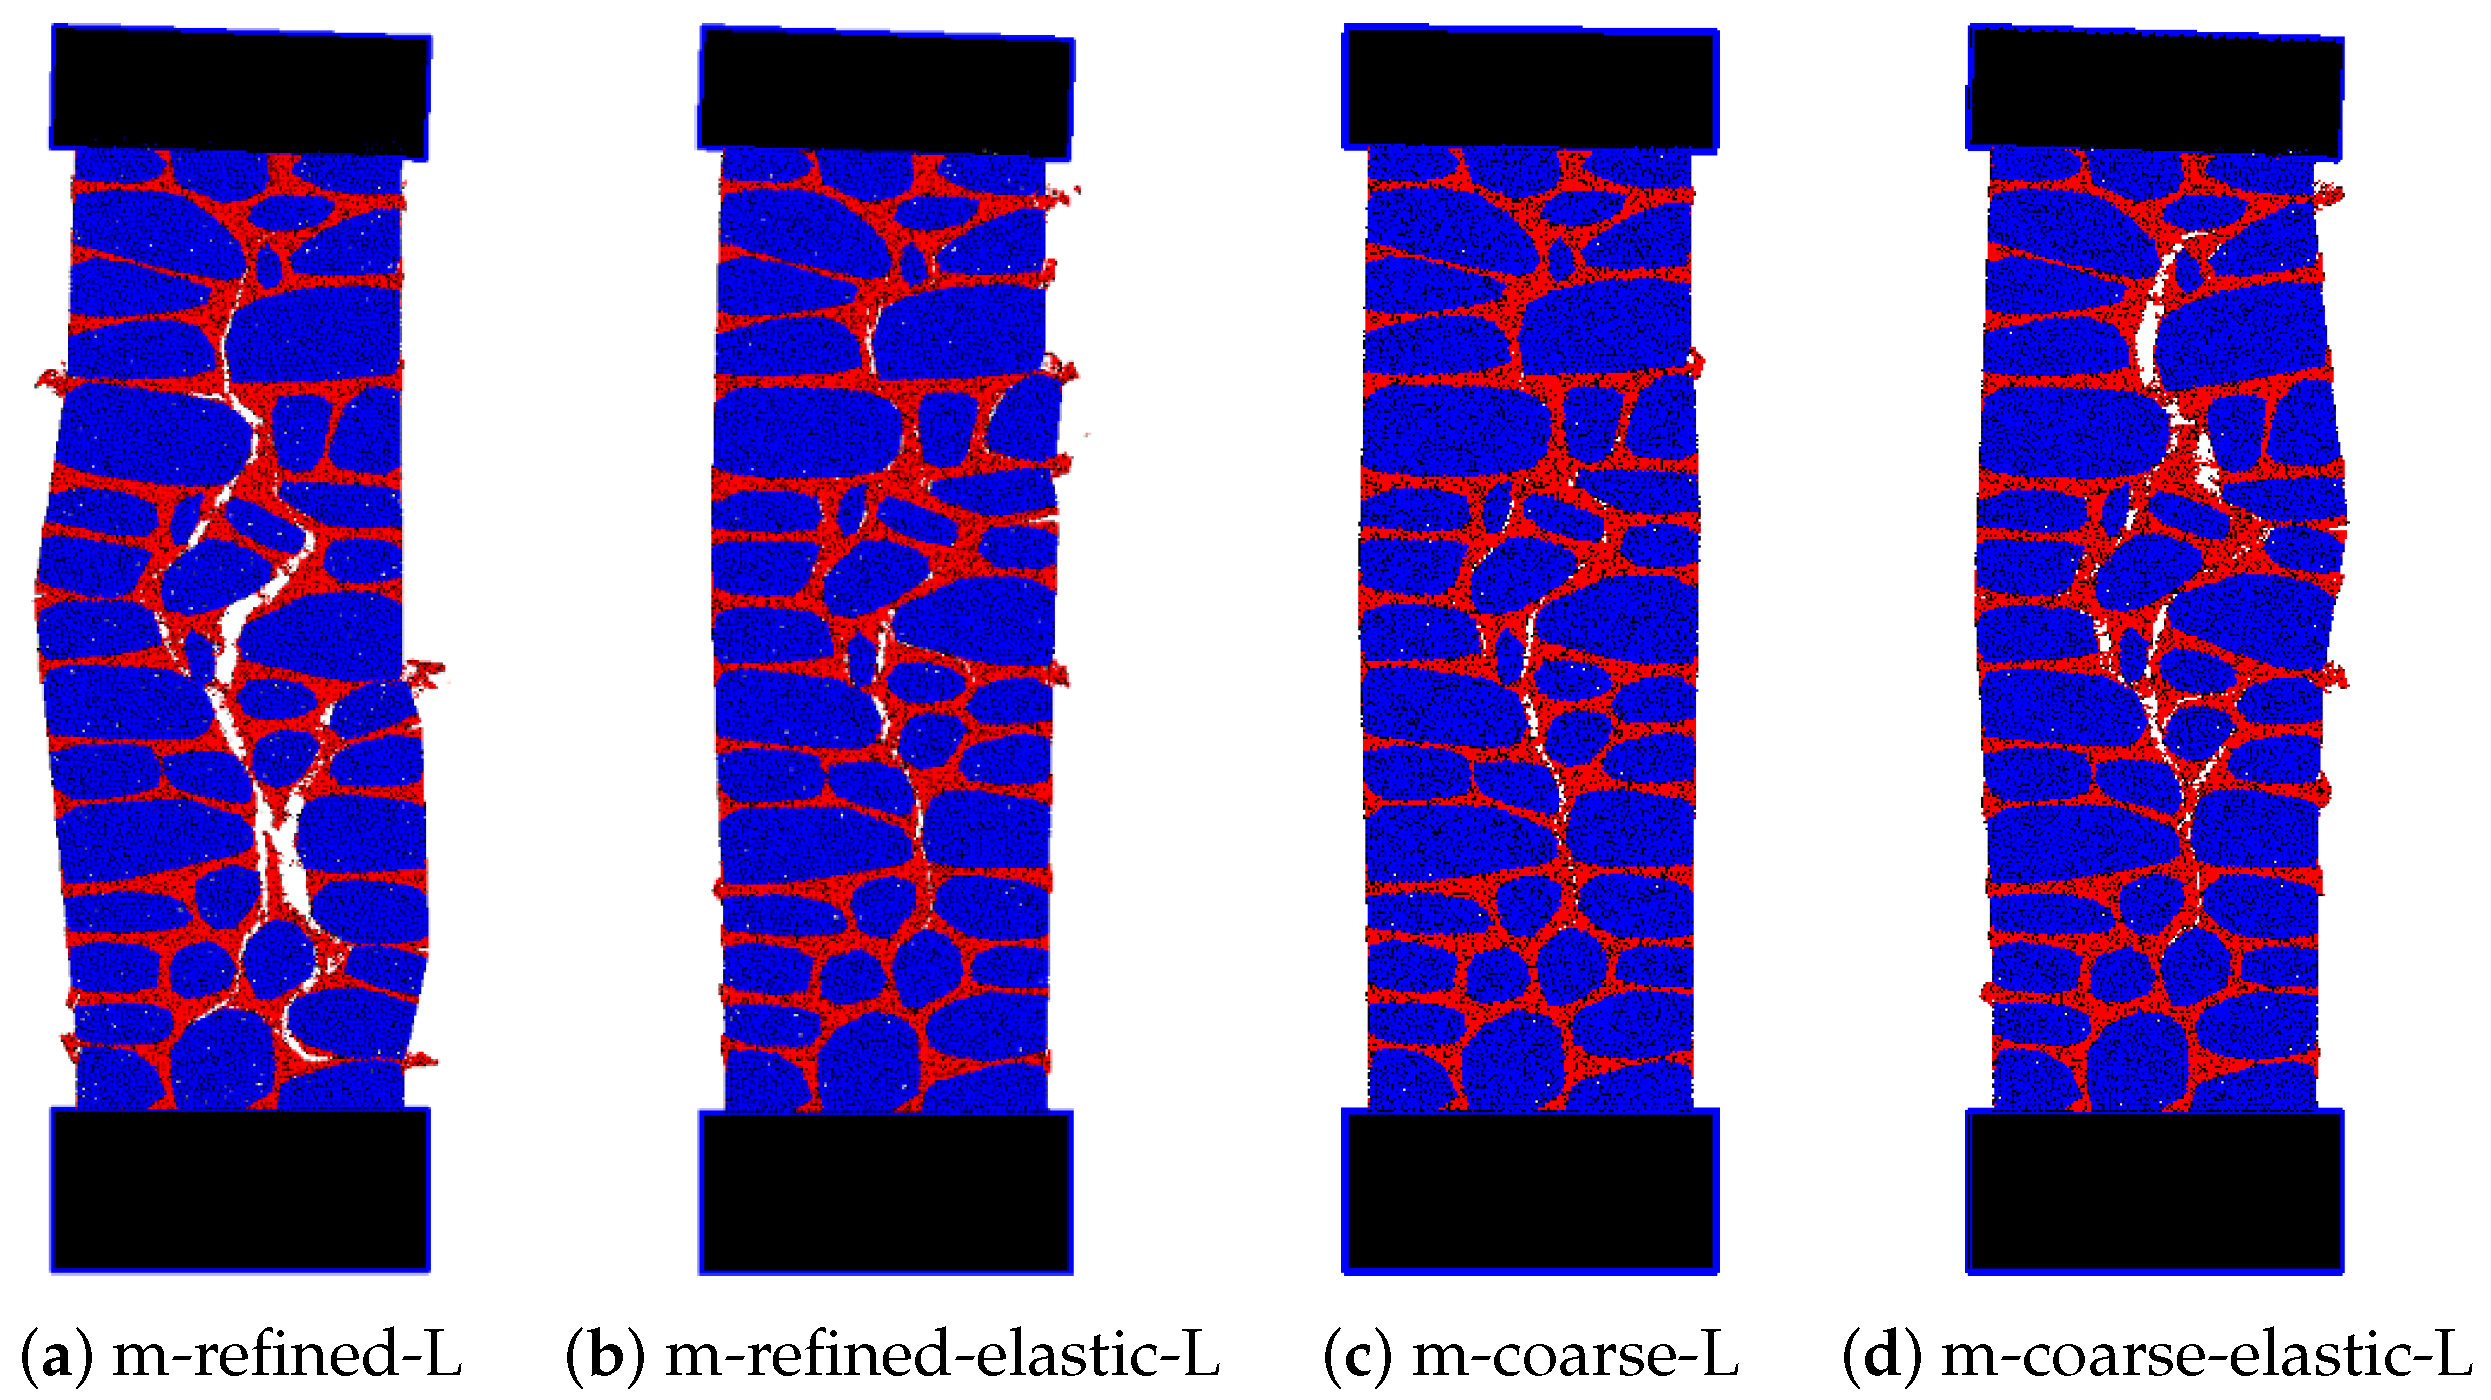
In Figure 11 are shown the final failure models for the frontal numerical 2D-PM models adopting a refined and a coarse mortar particle assembly. It is shown that the numerical models with a maximum yield compressive stress of 0.80 MPa predict a final diagonal cracking for both mortar discretization (m-refined and m-coarse). If an elastic model is adopted under compression a more complex failure mode is obtained for both mortar discretizations: a final crack is formed due to the bending of the wall lateral stone column. As shown in Section 3.3 both numerical predictions are in good agreement with the failure models recorded experimentally [2].
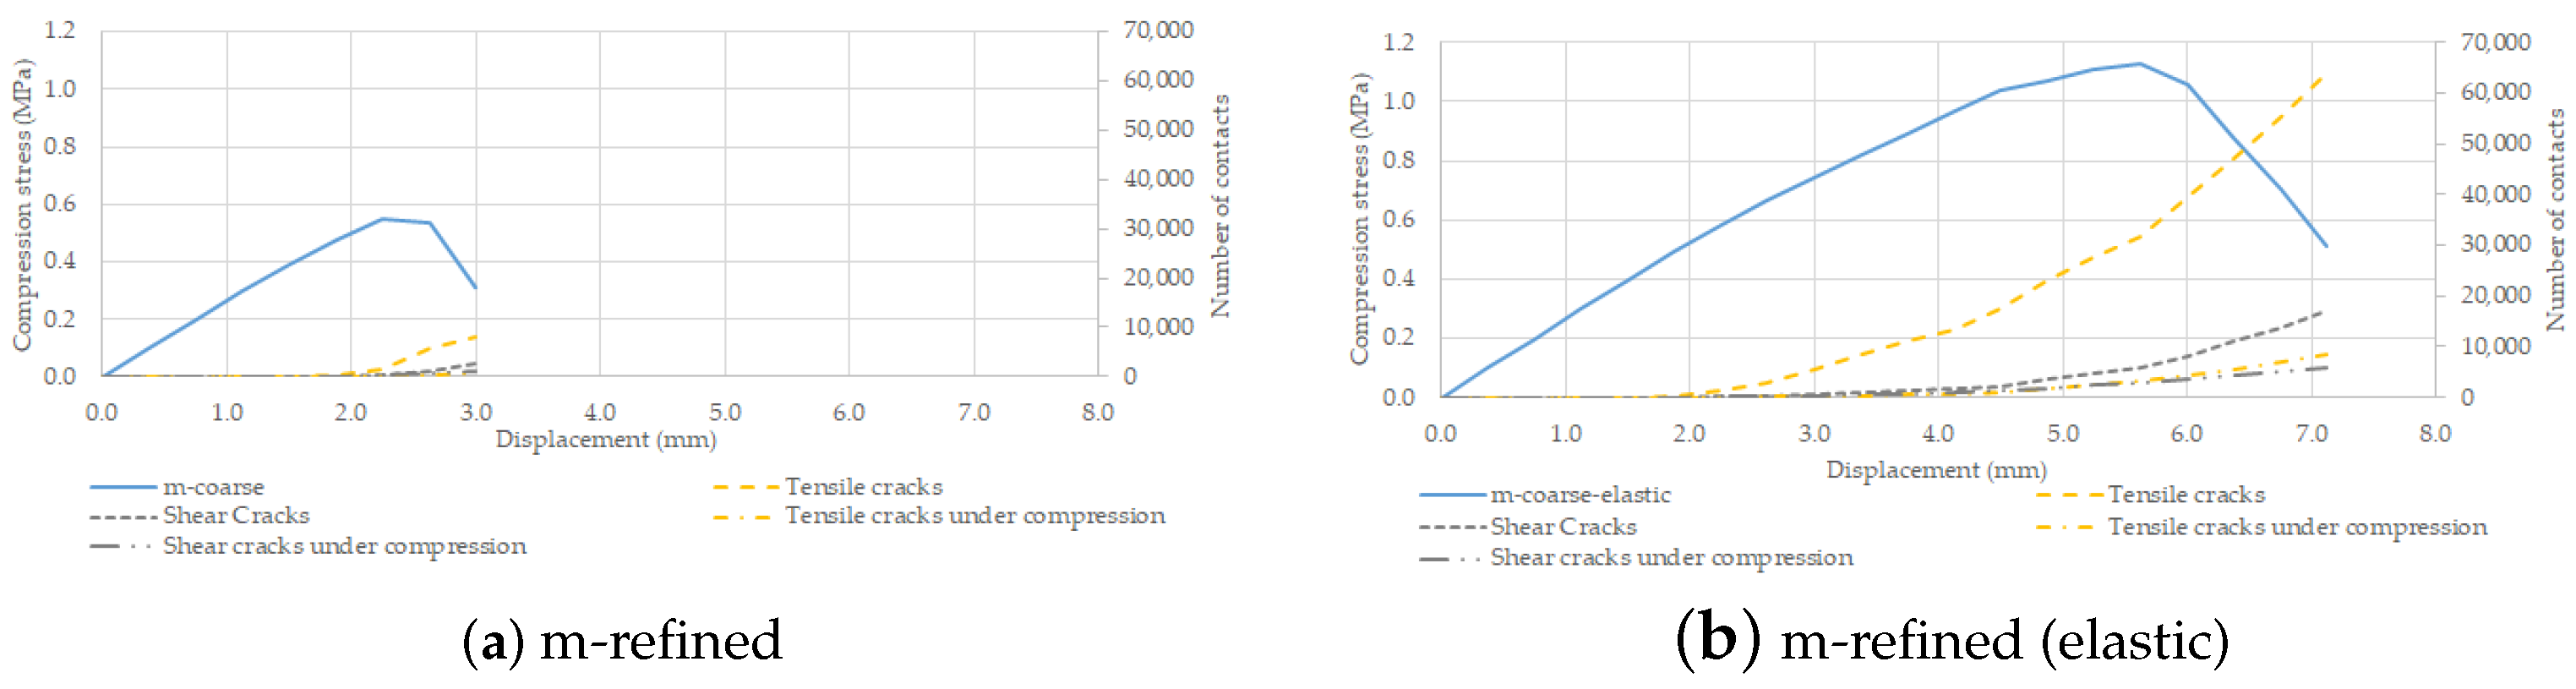
Figure 12 shows the damage evolution throughout the uniaxial compression test for the 2D-PM m-refined model and for the m-refined (elastic) model. Cracking occurs for a load of around 85% of the peak strength in the m-refined model and for around 50% for the m-refined (elastic) model. The cracked contacts are mostly tensile cracks, under tensile/shear loading condition, but a relevant number of cracks under shear/compression also occur in both numerical models. In concrete or rock specimens compression tests [
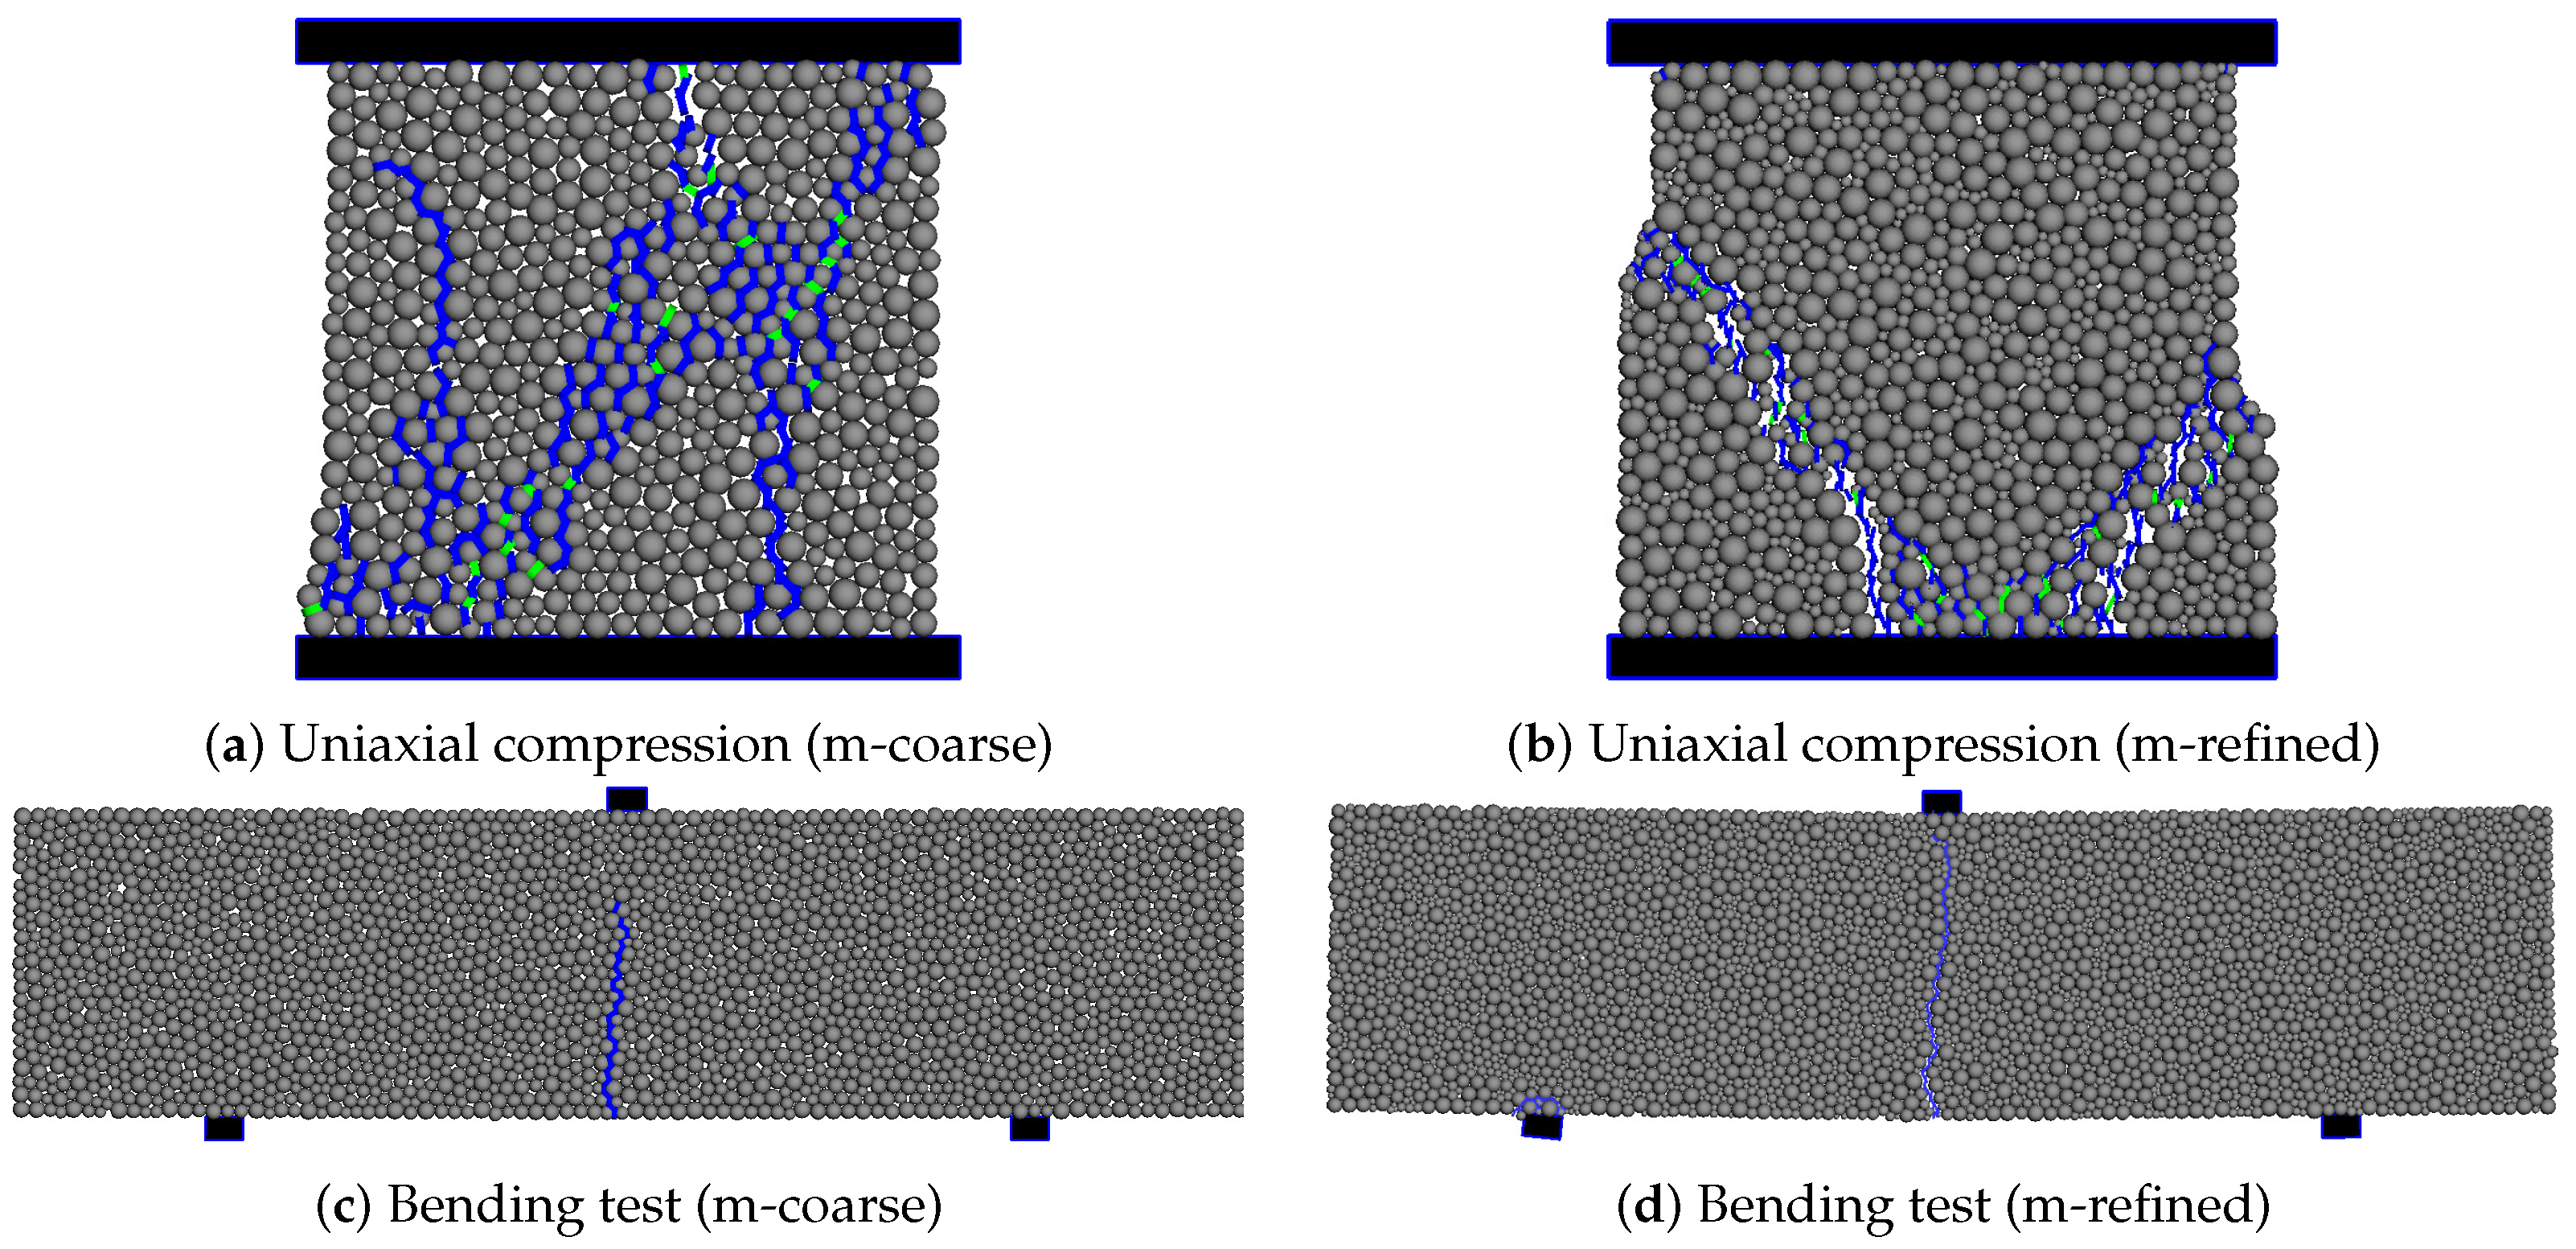
13] crack occur mainly under tensile/shear conditions. The fact that shear cracks occur in the wall numerical models is due to the larger difference in stiffness and strength that occur in the components of masonry wall, when compared to normal concrete (aggregate, cement paste).
As shown in Figure 12, there is a significant number of contacts that cracked under tensile forces, that are found to be under compression at later loading stages. This clearly shows that even if crack occurs, forces can still be transmitted due to the fact that the contacts are later under compression. For example, in a 2D-PM model of a more homogeneous material under uniaxial compression this phenomenon does not occur, see calibration section and [13]. The ductility of the masonry walls is clearly associated to these contacts that work under compression in pure friction. These results also reinforce the relevance of further understanding mortar behaviour under biaxial compression. When an elastic behaviour is adopted under compression, for the m-m and m-s contacts, the 2D-PM model predicts an increase in the ductility and peak strength. Table 6 presents the maximum compression stress at contacts for the m-refined (elastic) model at different loading stages.
As shown in Table 6, high contact compressive stress values are predicted clearly indicating that for this type of walls, more complex behaviour under compression need to be taken into account for the mortar. The contact constitutive model should not only consider yielding as adopted in this work but also softening and stiffening under uniaxial compression/shear [31].
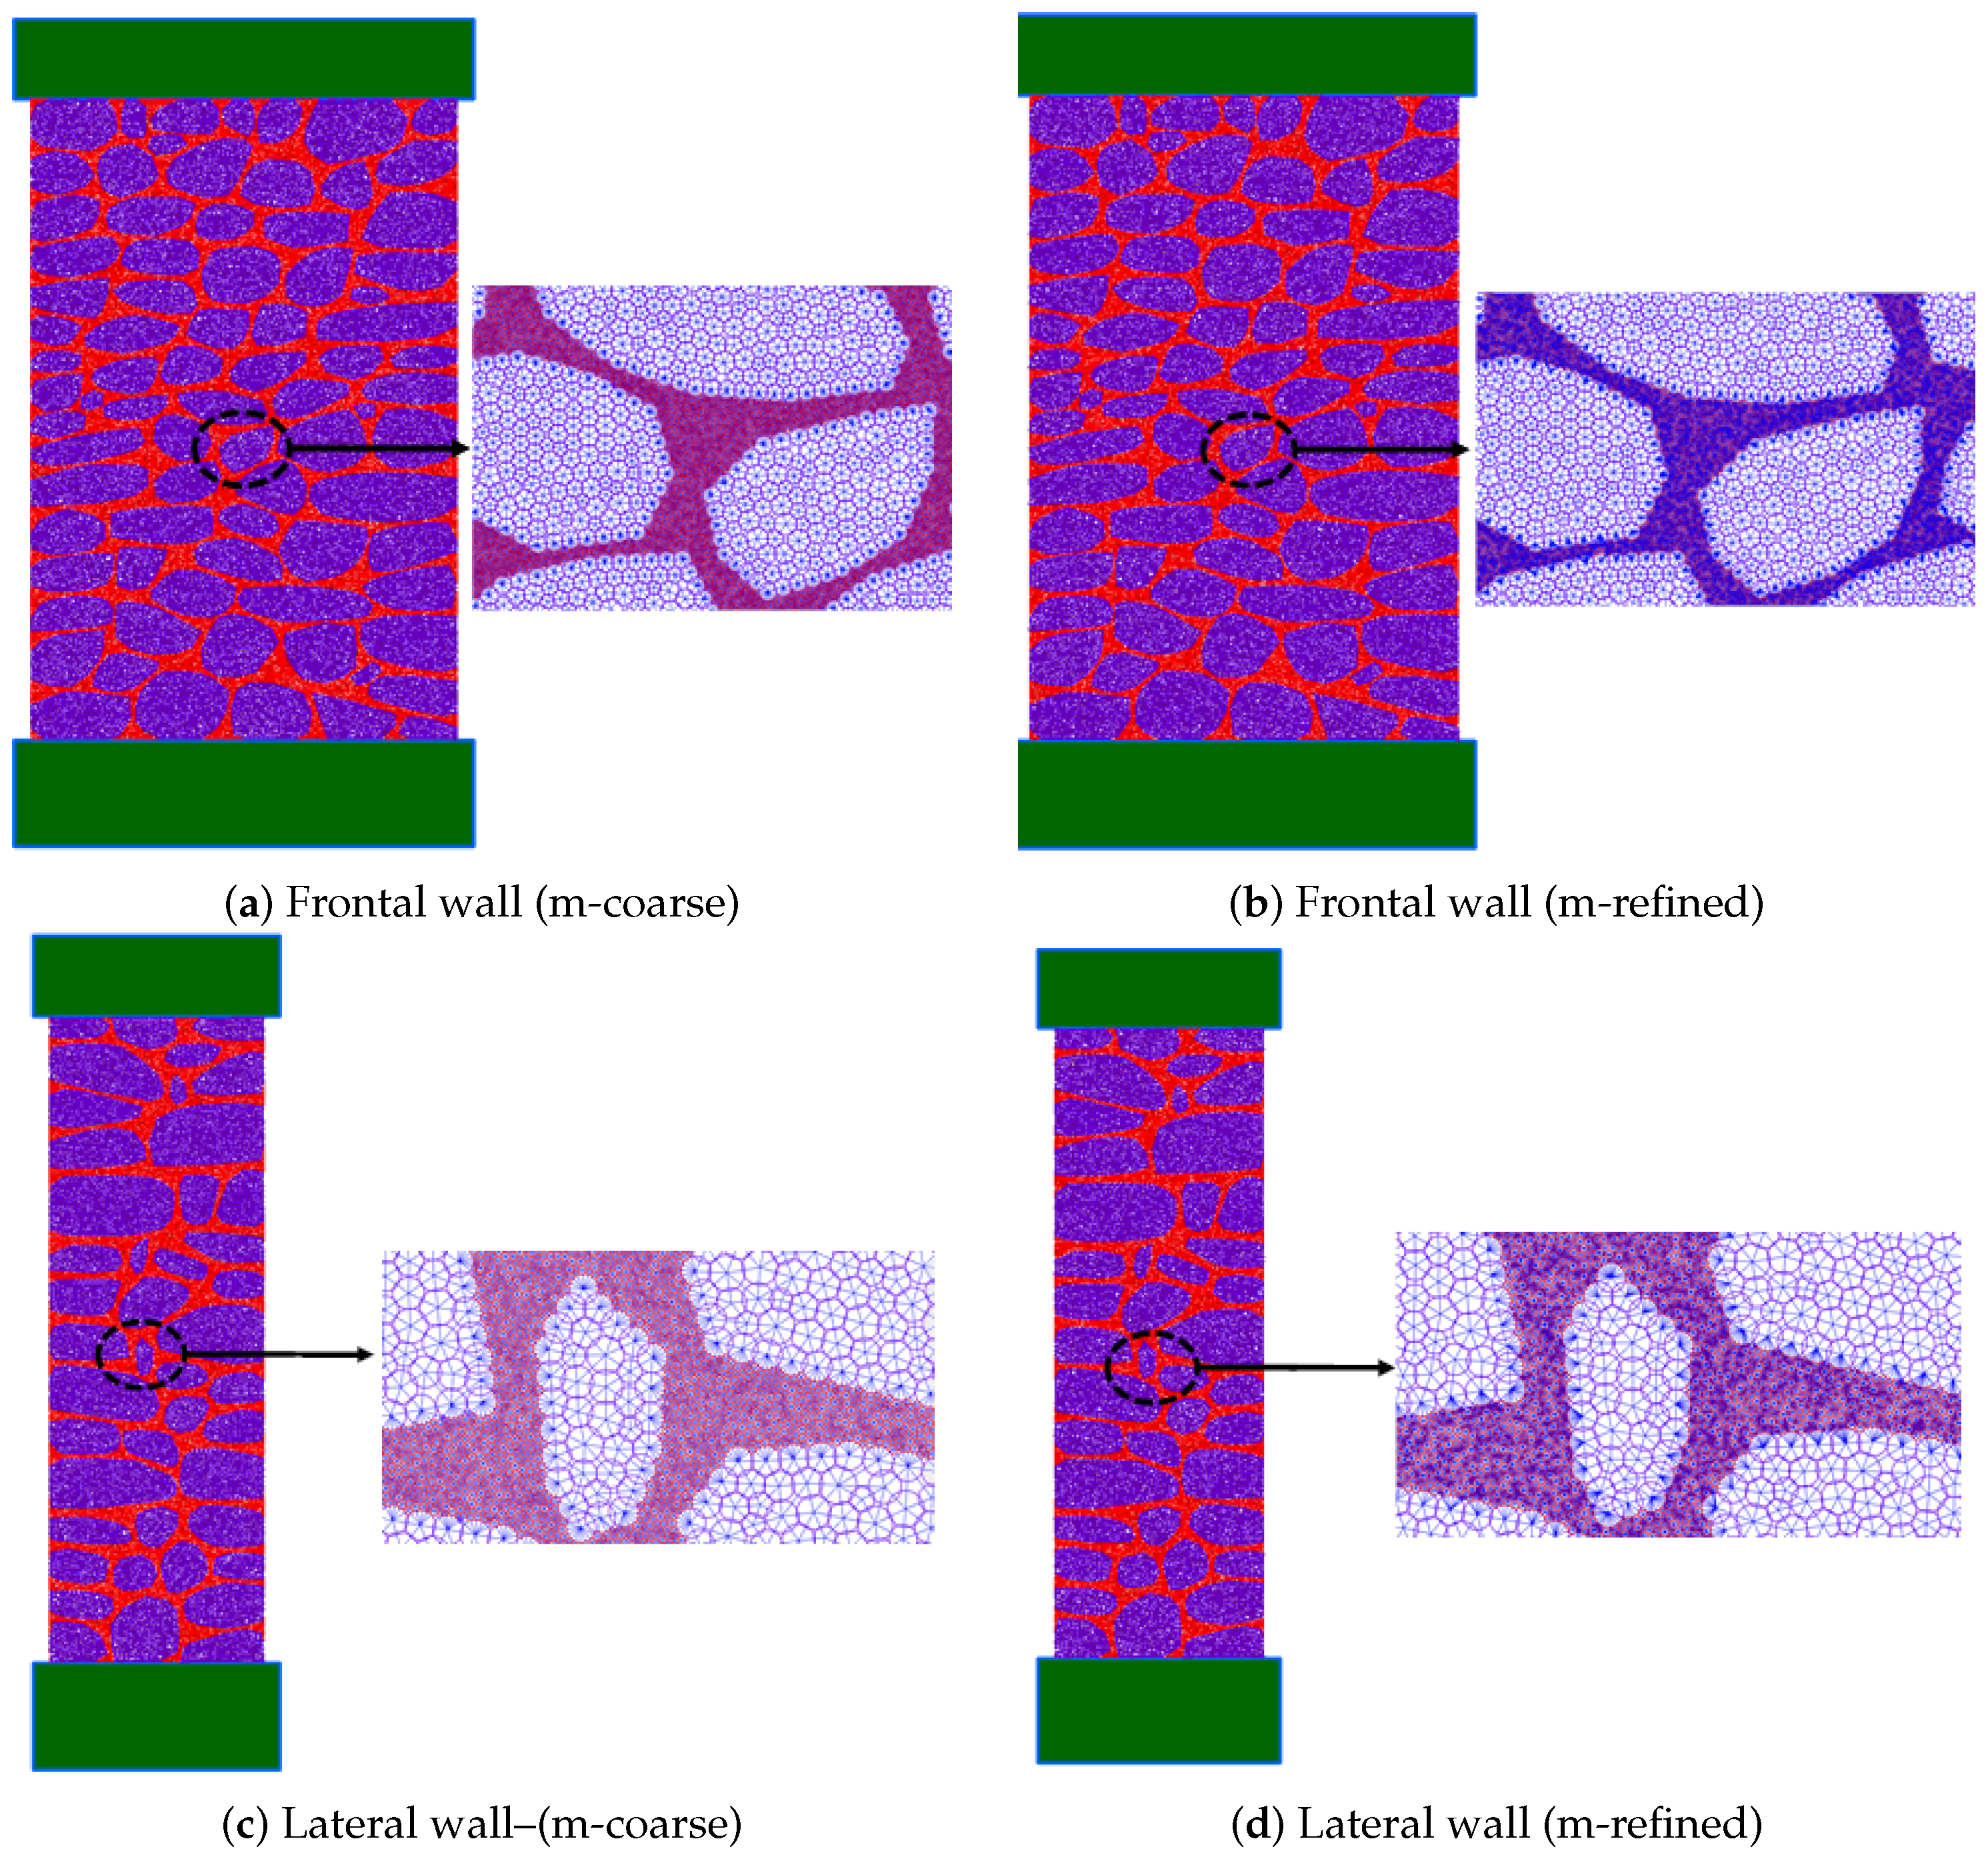
Figure 13 presents the numerical stress-displacement response predictions for the coarser 2D-PM model (m-coarse) and for the refined 2D-PM model (m-refined) mortar discretizations.
As shown, a coarser mortar discretization predicts a behaviour similar to the predicted with a finer particle discretization for a contact constitutive model with a yield plateau and for an elastic contact model under compression.
As pointed out in the calibration section, only with a finer particle discretization it is possible to predict a mortar maximum flexure stress closer to the experimental values. The presented numerical studies indicate that the mortar flexure response does not have a meaningful influence in the wall compressive strength. The 2D-PM m-refined model has a total simulation time of around 53 h, with around 2.20 h of simulation per 10,000 steps and the m-coarse model has a total simulation time of 27 h, with around 1.25 h of simulation per 10,000 steps, significantly less. The presented results clearly point out that with the coarser mortar discretization (m-coarse) it is possible to greatly reduce the simulation times without compromising the quality of the numerical predictions.
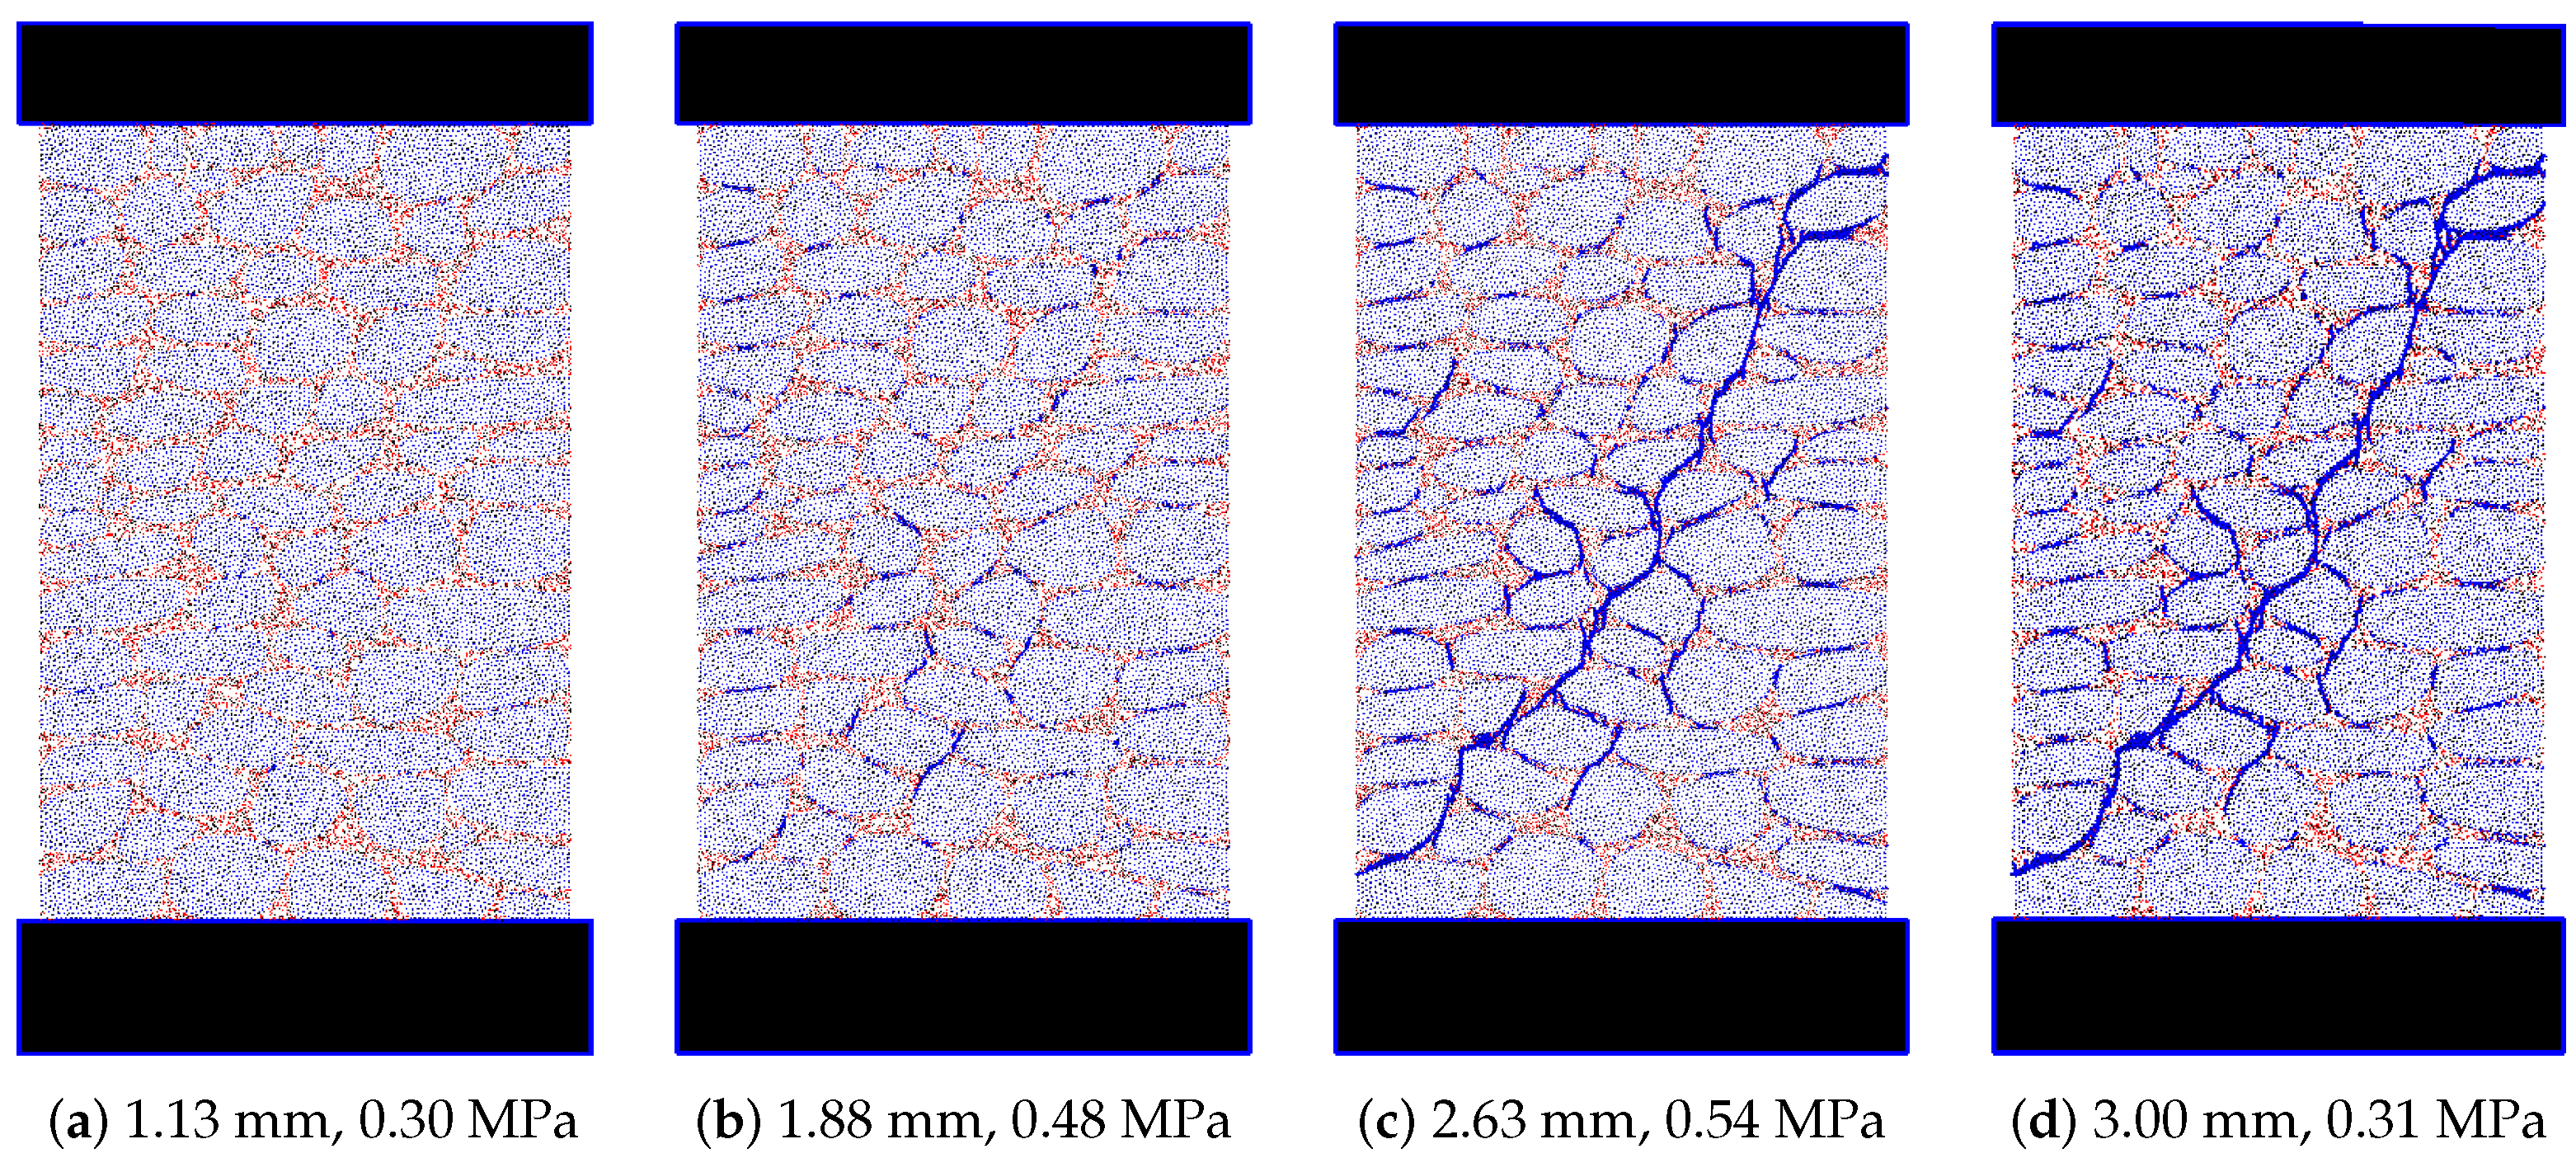
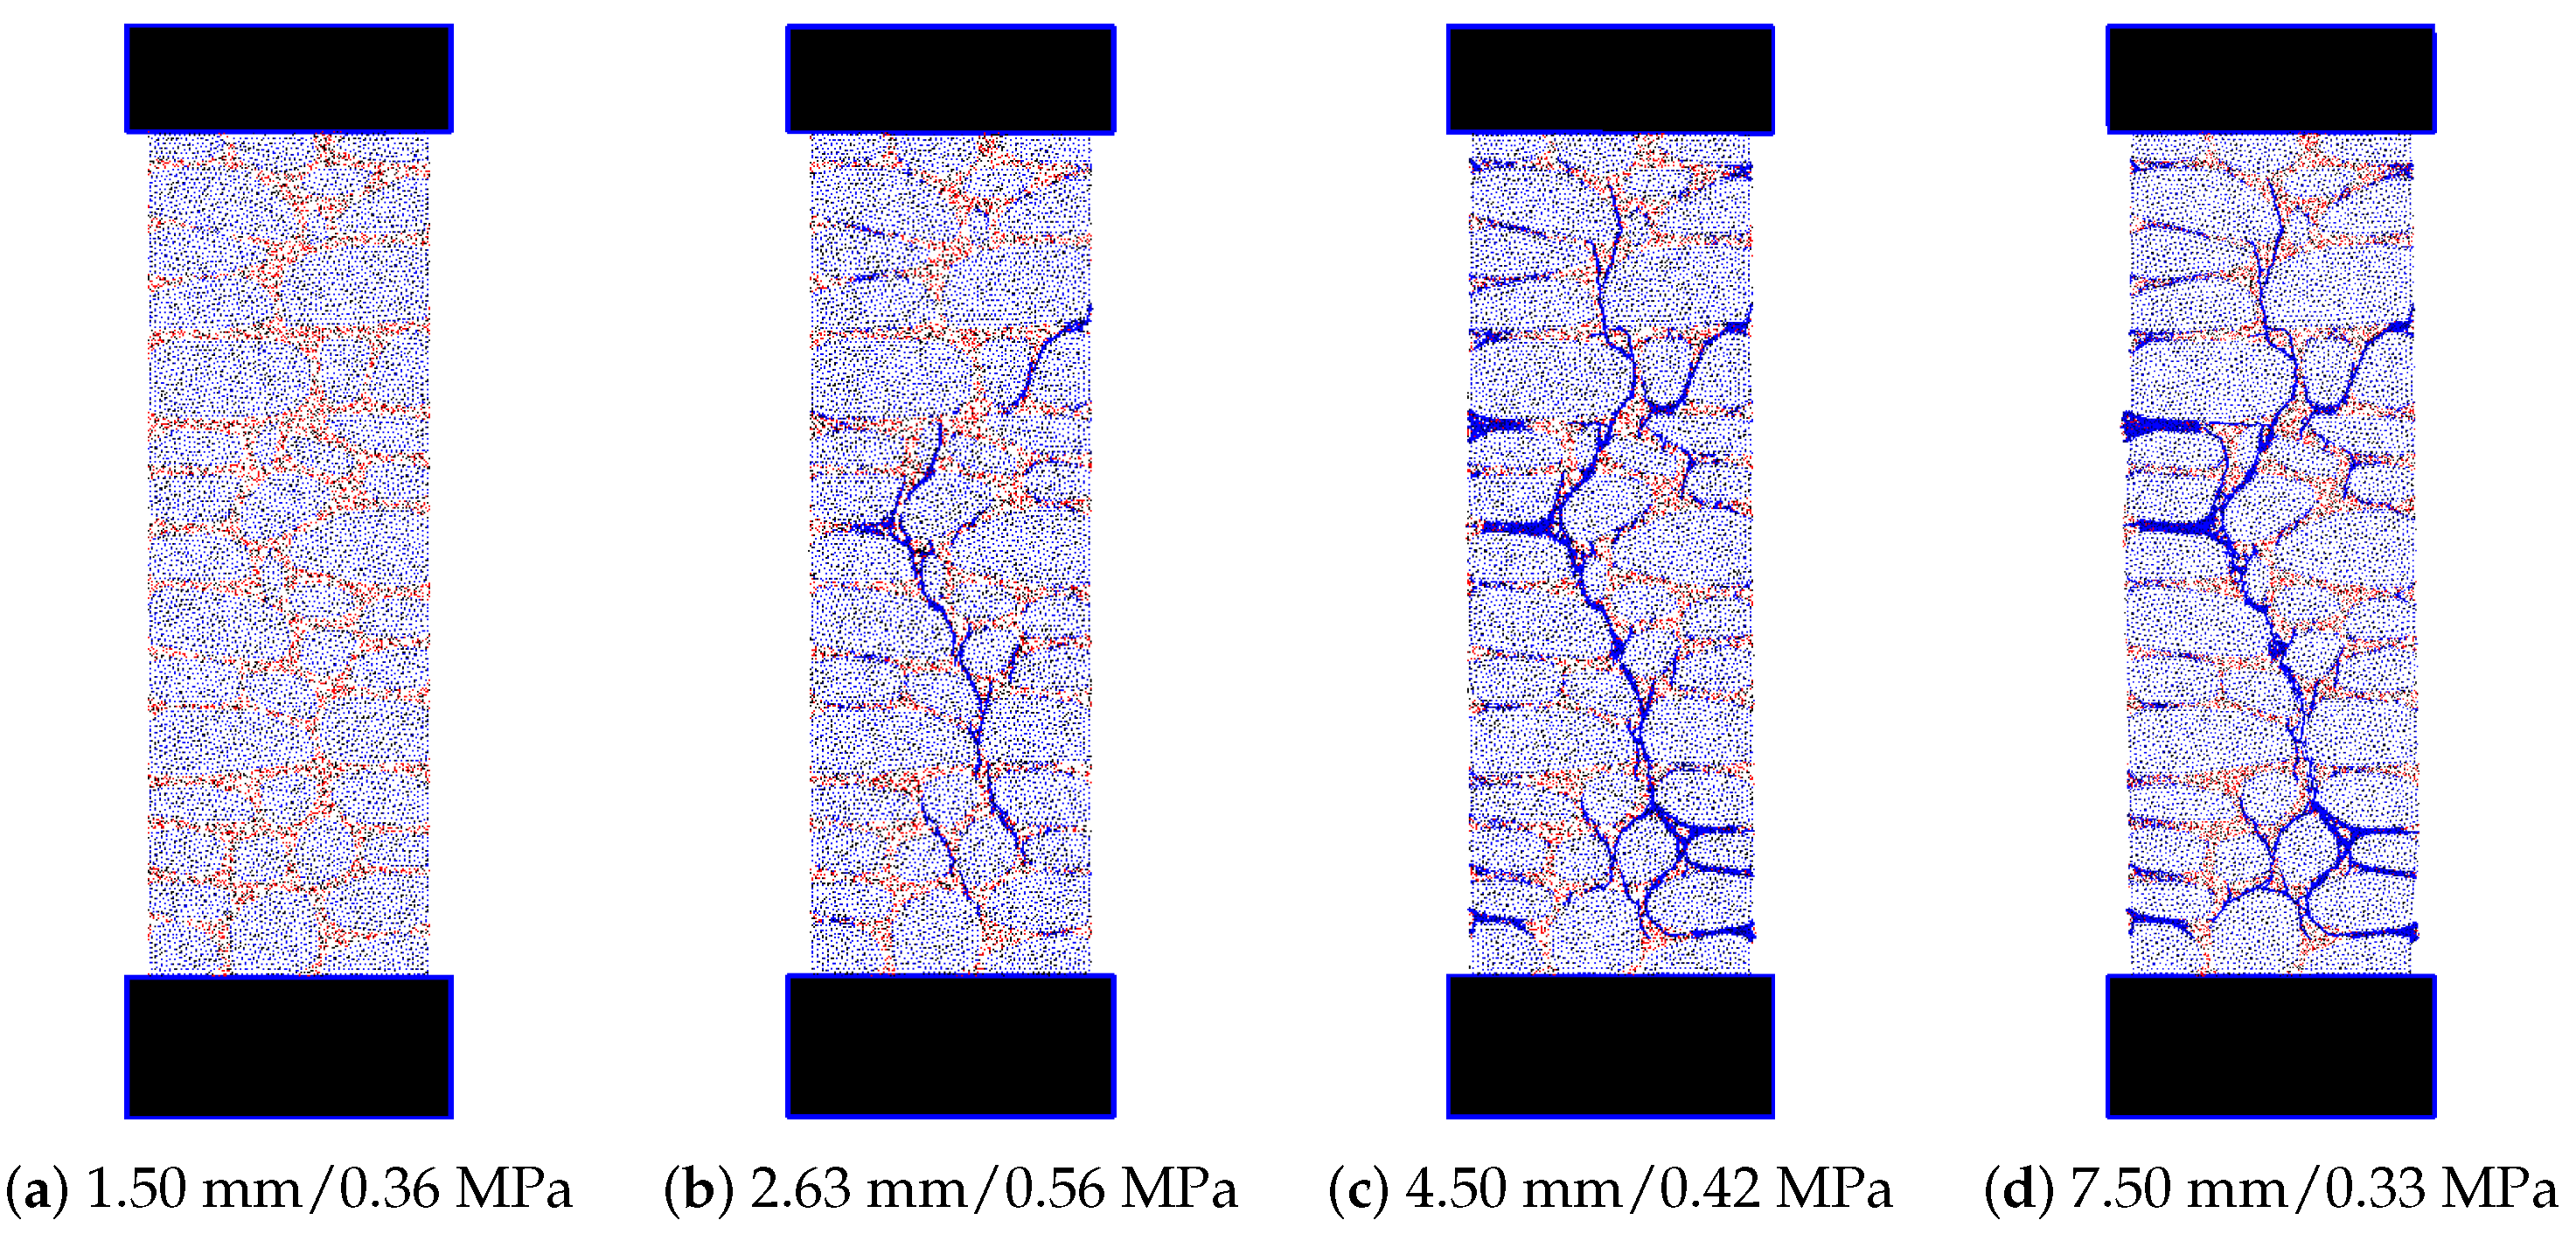
In Figure 14 it is shown the contact damage evolution for the points defined in the stress-displacement curve presented in Figure 10, for the numerical model m-refined.
It can be observed that, when a yield plateau of 0.80 MPa is adopted in compression, the damage starts to occur in very localized areas, throughout the wall inside the mortar, Figure 14a,b. Closer to the peak load, damage starts to concentrate at a diagonal surface which will correspond to the final failure mode. With an elastic contact model under compression, 
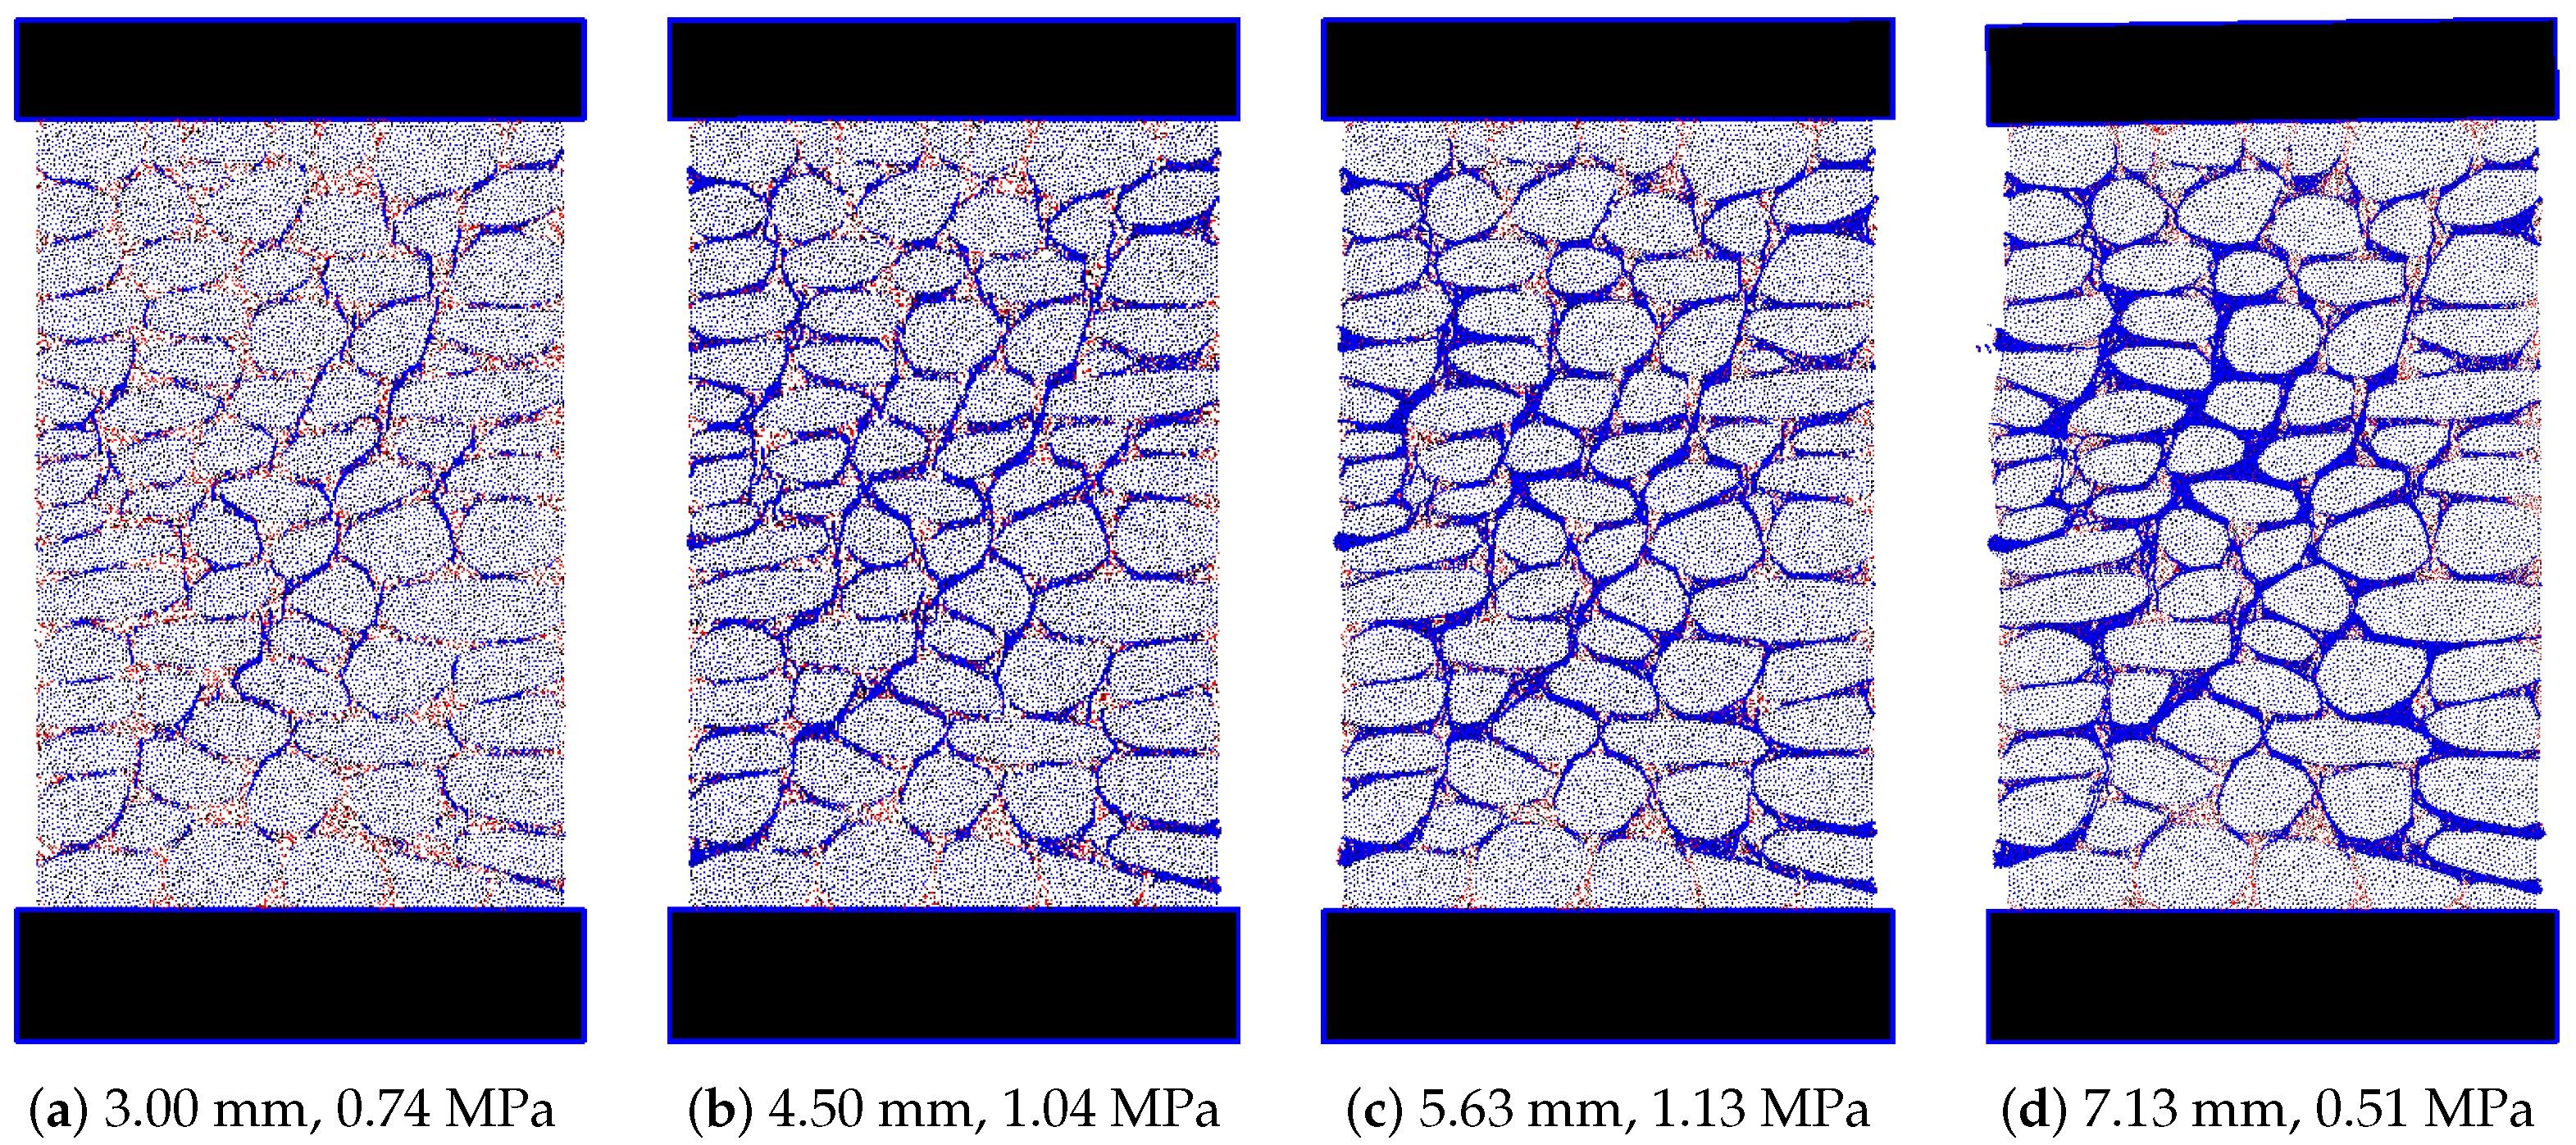
Figure 15, the numerical model predicts a less localized damage distribution when compared with the m-refined model.
By including a high shear strength capacity, the 2D-PM model, m-refined (elastic), is able to restrain the formation of the diagonal macroscopic crack that occurs in the 2D-PM m-refined model. In the 2D-PM numerical model with an elastic behaviour, the failure mode is due to the bending of the wall at the lateral stone stacks. As before, the results presented in Figure 14 and Figure 15 clearly show the relevance of the mortar behaviour under a biaxial state of stress, which in our view is due to the high heterogeneity of the wall components.

5.2. Lateral Model

The numerical model of the lateral sides was also developed in order to assess if the lateral side can also be a valid analysis option, regarding the peak strength and the wall overall behaviour. This study was carried out, given that the computational requirements for a lateral model are much lower when compared with the frontal 2D-PM model computational costs.
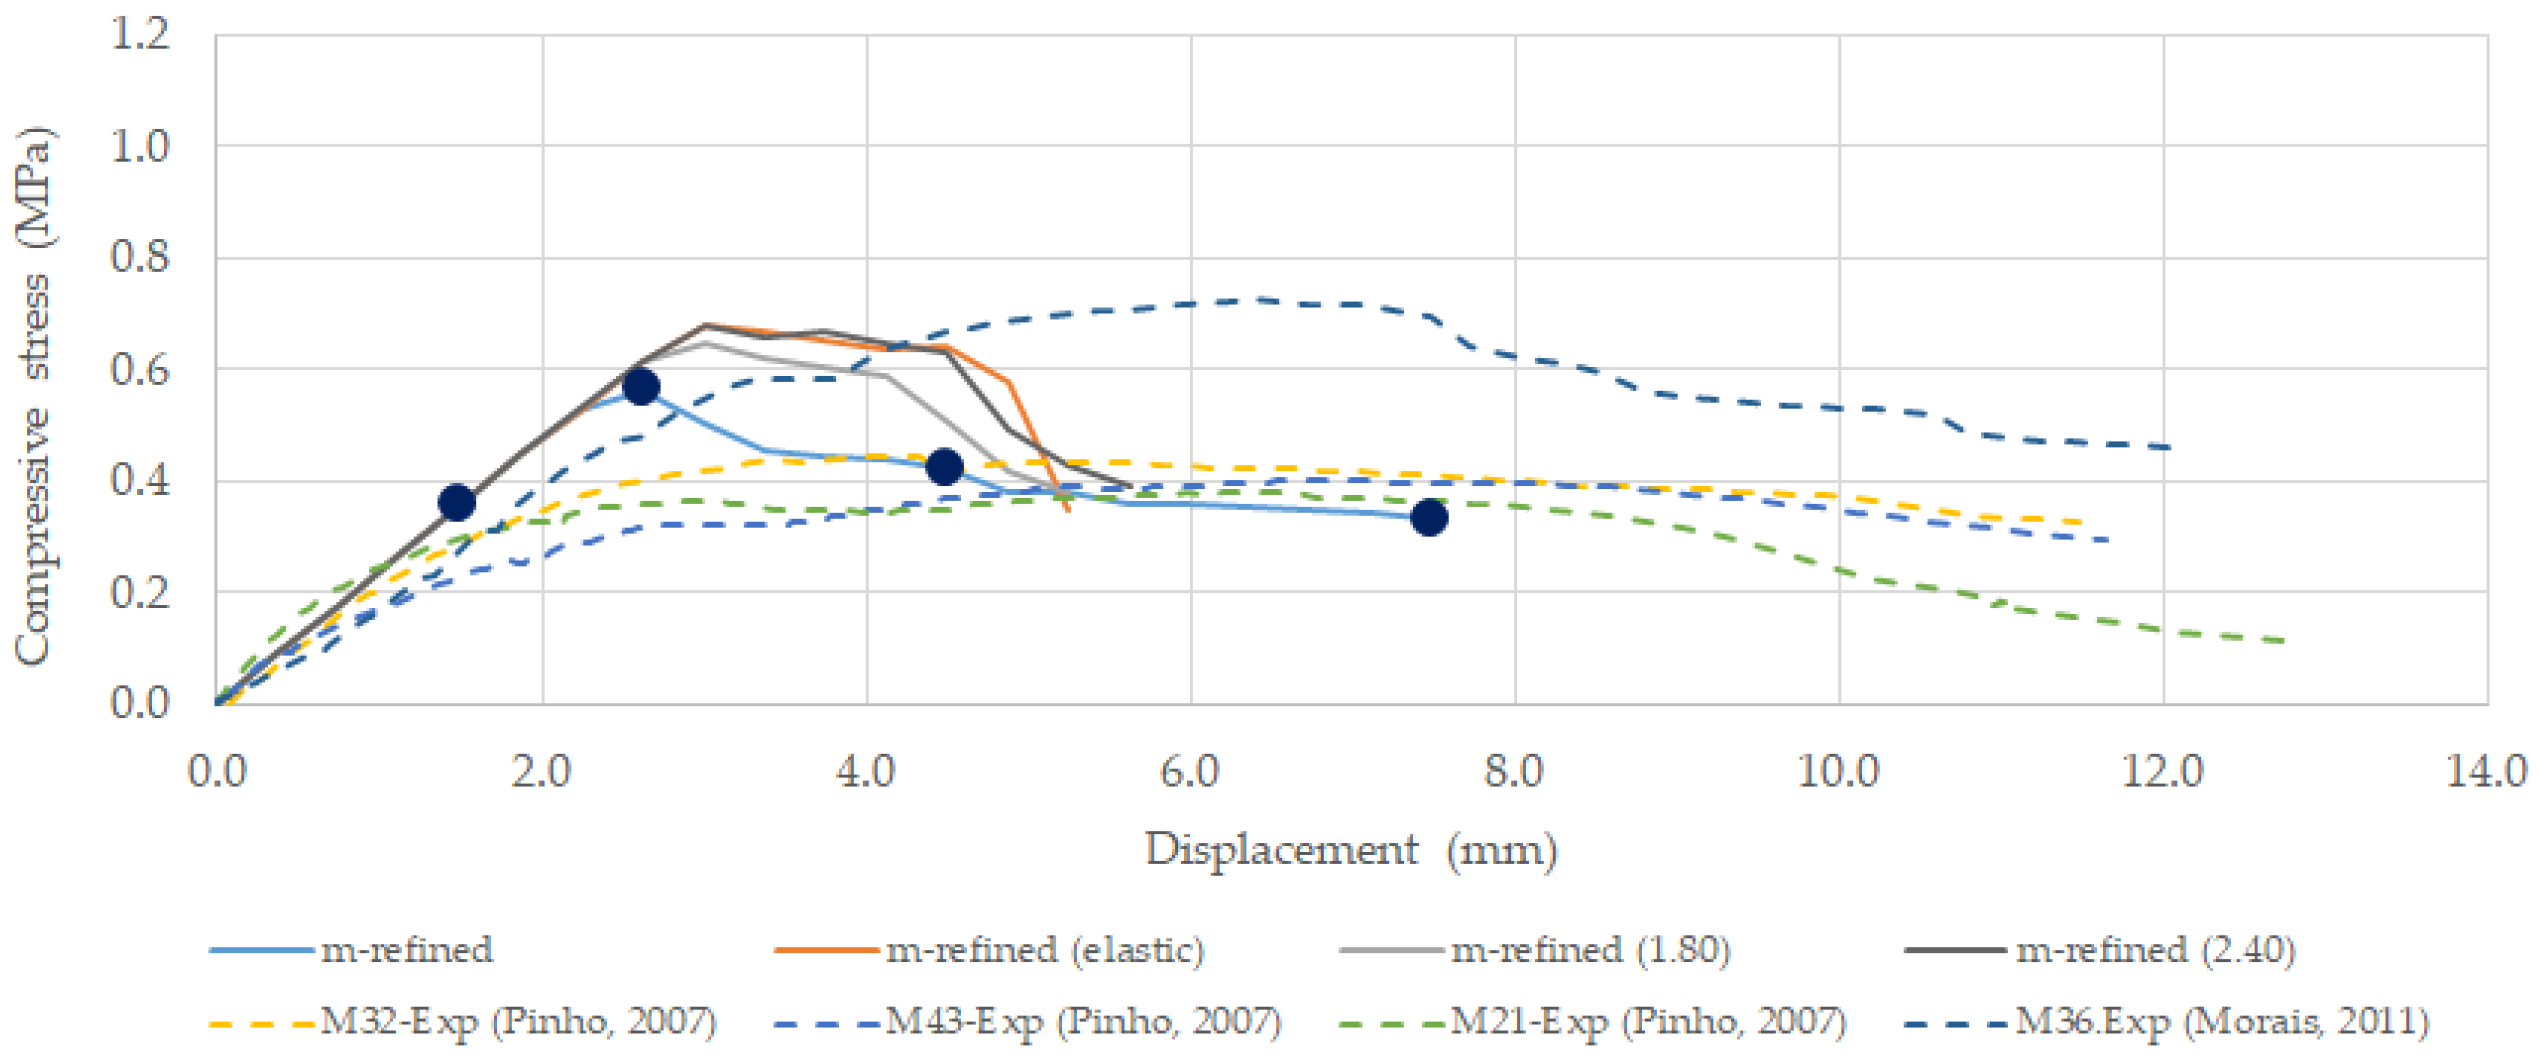
Figure 16 presents the numerical stress-displacement response predictions obtained with the lateral models and the 2D-PM numerical predictions obtained with the frontal models.
As shown in Figure 16, the numerical predictions with the calibrated contact constitutive models adopting a yield plateau under uniaxial compression with a maximum value of 0.80 MPa (m-refined) and the numerical predictions with the traditional elastic behaviour under compression (m-refined (elastic)) are very similar.
Figure 16 shows that it is possible to numerically predict a masonry wall response under uniaxial testing with the lateral models. The 2D-PM model results obtained with the lateral and with the frontal models, point out that the adopted experimental lateral width mostly influences the wall ductility, which is higher in the lateral models with a reduced width. Figure 16 also shows that in the lateral models, with a wall width of 0.40 m, the adopted contact constitutive model under compression has a lower influence in the predicted numerical results, when compared with the frontal model. A similar result is obtained with the coarser mortar discretization.
In Table 7 are shown the numerically obtained elastic modulus, peak strength and maximum displacement at peak strength, as well as the average experimental values obtained [1,30].
Table 7. Elastic properties and peak-strength—numerical and experimental values [1].
Model F m a x  [kN]E [GPa] σ c , m a x  [MPa] d v , F m a x [mm]
m-refined2700.2540.563.38
m-refined-elastic3250.2540.684.50
[1]168 (238)-0.49 (0.73)5.97 (6.39)
It can be seen that the 2D-PM lateral m-refined numerical model is able to predict values closer to the obtained experimentally, namely the peak stress. The similar response of the frontal and lateral numerical models is related to the fact that the walls have similar stone arrangements. Nevertheless, it is shown that a lateral wall model when compared with the frontal model has a higher ductility.
In Figure 17 are shown the final failure models for the lateral numerical models adopting a refined and a coarse mortar particle assembly.
In the lateral numerical models, the failure predicted with a maximum yield compressive stress of 0.80 MPa is closer to the failure mode predicted with an elastic model under compression, for both mortar discretizations. In both models a final macroscopic crack is formed due to the bending of the wall lateral stone column, which occurs due to a loss of stiffness in the mortar vertical alignments. Figure 18 shows the damage evolution for the lateral model with a refined mortar discretization. Like in the frontal model the crack occurs initially at the mortar due to tensile loading and then evolves throughout the wall within the mortar and finally it localizes leading to the final failure mode.
Figure 19 presents the 2D-PM numerical stress-displacement response predictions for the coarse (m-coarse) and for the refined (m-refined) mortar discretizations. Like in the frontal model, the coarse mortar discretization predicts a behaviour similar to the predicted with a finer particle discretization, for both adopted constitutive models.
The m-refined model has a total simulation time of around 60 h, with around 1.00 h of simulation per 10,000 steps and the m-coarse model has a total simulation time of 20 h with around 0.61 h of simulation per 10,000 steps.
The presented numerical results point out that with a lateral wall model adopting a coarser mortar discretization (m-coarse), it is possible to greatly reduce the simulation times without compromising the quality of the numerical predictions, namely the peak strength. The results also show that a numerical model of the lateral wall section can be adopted, not only to predict the peak strength but also to numerically assess reinforcement solutions.

6. Conclusions

PM models have been proposed to study traditional masonry structures, with irregular stones or rubble masonry, due to its ability to predict complex macroscopic failure with simple constitutive models. PM models based on DEM method are also known to be suitable for large displacement analysis and cyclic loading. Compared with other approaches, namely with FEM based micro-models, PM models are known to have two main disadvantages: the high computational resources that they require, due to the low level discretization requirements, and the need to carry out a previous calibration the contact elastic and strength parameters.
The presented results show that after an independent calibration of the contact parameters of each wall component, mortar and stones, with known experimental data, the proposed particle model (2D-PM) is able to predict, with simple interaction models, the stone masonry wall behaviour under uniaxial compression, namely the crack formation and propagation, the initial elastic behaviour and the peak strength. Nevertheless, particle models need to be further developed, namely by adopting more complex contact constitutive laws to be able to predict the wall ductility that is observed experimentally under uniaxial loading. The 2D-PM best fit frontal model predicted a peak strength value 5% above the average peak strength value observed experimentally (168 kN), but the predicted maximum displacement at the peak strength value was only 40% of the average value observed experimentally (5.97 mm).
The 2D-PM numerical results clearly indicate that the main micro-mechanism that is responsible for an increase in the wall built with hydrated air lime mortar ductility is the mortar behaviour under confined compression, which does not occur in more homogeneous materials. For this reason, a contact model with a yield plateau under compression with maximum value closer to the mortar uniaxial compressive strength was adopted, allowing the 2D-PM model to predict peak strength values closer to those obtained experimentally. In order to obtain a better agreement with the wall experimental results, the mortar-mortar contacts need to be calibrated using the mortar known experimental biaxial failure envelope. The numerical results show that the uniaxial compression value, that is usually obtained experimentally, is not sufficient to characterize the mortar behaviour.
A detailed representation of materials by means of 2D-PM models is possible nowadays, due to the available computational resources and due to the expected evolution in the computational technology. The presented results show that it is possible to predict a numerical response close to the obtained experimentally, with a coarser mortar discretization with lower computational requirements. It is also shown that the numerical models of the lateral wall sections can be used to predict the wall peak strength, given that the frontal and lateral models have a similar stone arrangement. The studies that were carried out indicate that the wall width does not have a significant effect on the wall peak strength and mainly influences the wall ductility under uniaxial compression.
Overall, the numerical results that are presented show that the adopted 2D-PM approach can be used to identify the main parameters that influence the structural capacity of rubble-stone walls and for this reason can be adopted in the development of reinforcement structural solutions or as a prediction tool of old stone masonry structural behaviour.

Author Contributions

Conceptualization, N.M.A.; methodology, N.M.A., I.C. and M.S.; software, N.M.A.; validation, N.M.A. and I.C.; writing—original draft preparation, N.M.A., F.F.S.P. and I.C.; visualization, I.C.; supervision, F.F.S.P.; experiment, F.F.S.P.; revision, F.F.S.P. All authors have read and agreed to the published version of the manuscript.

Funding

This research received no external funding.

Institutional Review Board Statement

Not applicable.

Informed Consent Statement

Not applicable.

Data Availability Statement

Not applicable.

Conflicts of Interest

The authors declare no conflict of interest.

Abbreviations

The following abbreviations are used in this manuscript:
URMUnreinforced masonry
FEMFinite element method
DEMDiscrete element method
DDADiscontinuous deformation analysis
RVERepresentative volume element
2D-PM2D Particle model
PMParticle model

References

  1. Pinho, F.F.S. Ordinary Masonry Walls–Experimental Study with Unstrengthened and Strengthened Specimens. Ph.D. Thesis, Faculdade de Ciências e Tecnologia, Universidade Nova de Lisboa, Caparica, Portugal, 2007. (In Portuguese). [Google Scholar]
  2. Pinho, F.F.S.; Lúcio, V.J.G. Rubble Stone Masonry Walls in Portugal: Material Properties, Carbonation Depth and Mechanical Characterization. Int. J. Archit. Herit. 2017, 11, 685–702. [Google Scholar] [CrossRef]
  3. Rots, J.G. Numerical simulation of cracking in structural masonry. Heron 1991, 36, 49–63. [Google Scholar]
  4. Lourenço, P.B.; Rots, J.G. Multisurface Interface Model for Analysis of Masonry Structures. J. Eng. Mech. 1997, 123, 660–668. [Google Scholar] [CrossRef]
  5. Lemos, J. Discrete element modelling of the seismic behaviour of stone masonry arches. In Proceedings of the Computer Methods in Structural Masonry—4 Fourth International Symposium, 1st ed.; Pande, G., Middleton, J., Kralj, B., Eds.; CRC Press: London, UK, 1998; pp. 220–227. ISBN 9780419235408. [Google Scholar]
  6. Azevedo, N.M.; Lemos, J.V.; de Almeida, J.R. Discrete Element Particle Modelling of Stone Masonry. In Computational Modeling of Masonry Structures Using the Discrete Element Method; IGI Global: Hershey, PA, USA, 2016; pp. 146–170. [Google Scholar] [CrossRef]
  7. Luo, Q.; Wang, W.; Sun, Z.; Wang, B.; Xu, S. Statistical analysis of mesoscopic concrete with random elastic modulus. J. Build. Eng. 2021, 33, 101850. [Google Scholar] [CrossRef]
  8. Smoljanović, H.; Živaljić, N.; Nikolić, Ž. A combined finite-discrete element analysis of dry stone masonry structures. Eng. Struct. 2013, 52, 89–100. [Google Scholar] [CrossRef]
  9. Smoljanović, H.; Živaljić, N.; Nikolić, Ž.; Munjiza, A. Numerical analysis of 3D dry-stone masonry structures by combined finite-discrete element method. Int. J. Solids Struct. 2018, 136, 150–167. [Google Scholar] [CrossRef]
  10. Baggio, C.; Trovalusci, P. Limit Analysis for No-Tension and Frictional Three-Dimensional Discrete Systems. Mech. Struct. Mach. 1998, 26, 287–304. [Google Scholar] [CrossRef]
  11. Thavalingam, A.; Bicanic, N.; Robinson, J.I.; Ponniah, D.A. Computational framework for discontinuous modelling of masonry arch bridges. Comput. Struct. 2001, 79, 1821–1830. [Google Scholar] [CrossRef]
  12. Massart, T.J.; Peerlings, R.H.J.; Geers, M.G.D. Structural Damage Analysis of Masonry Walls using Computational Homogenization. Int. J. Damage Mech. 2007, 16, 199–226. [Google Scholar] [CrossRef]
  13. Azevedo, N.M.; Candeias, M.; Gouveia, F. A Rigid Particle Model for Rock Fracture Following the Voronoi Tessellation of the Grain Structure: Formulation and Validation. Rock Mech. Rock Eng. 2014, 48, 535–557. [Google Scholar] [CrossRef]
  14. Chen, X.; Wang, X.; Wang, H.; Agrawal, A.K.; Chan, A.H.; Cheng, Y. Simulating the failure of masonry walls subjected to support settlement with the combined finite-discrete element method. J. Build. Eng. 2021, 43, 102558. [Google Scholar] [CrossRef]
  15. Azevedo, N.M.; Lemos, J.V. A Hybrid Particle/Finite Element Model with Surface Roughness for Stone Masonry Analysis. Appl. Mech. 2022, 3, 608–627. [Google Scholar] [CrossRef]
  16. Senthivel, R.; Lourenço, P.B. Finite element modelling of deformation characteristics of historical stone masonry shear walls. Eng. Struct. 2009, 31, 1930–1943. [Google Scholar] [CrossRef] [Green Version]
  17. Bergonse de Souza, M. Numerical Modeling of Ordinary Masonry Walls Using a Particle Model. Master’s Thesis, FCT UNL, Lisbon, Portugal, 2019. (In Portuguese). [Google Scholar]
  18. Oliveira, D.V.; Lourenço, P.B. Implementation and validation of a constitutive model for the cyclic behaviour of interface elements. Comput. Struct. 2004, 82, 1451–1461. [Google Scholar] [CrossRef] [Green Version]
  19. Pinho, F.F.S. Structural Rehabilitation of Traditional Stone Masonry Walls; Science, Engineering and Technology Collection, Nova; FCT Editorial: Lisbon, Portugal, 2021. (In Portuguese) [Google Scholar]
  20. E223:1968; Aggregates Volumetric Ratio Determination. Laboratório Nacional de Engenharia Civil (LNEC): Lisbon, Portugal, 1968. (In Portuguese)
  21. NP EN 1936:2008; Natural Stone Test Methods. Determination of Real Density and Apparent Density, and of Total and Open Porosity. Intituto Português de Qualidade: Caparica, Portugal, 2008. (In Portuguese)
  22. NP EN 1926:2000; Test Methods for Natural Stone. Determination of Compression Resistance. Intituto Português de Qualidade: Lisbon, Portugal, 2000. (In Portuguese)
  23. Veiga, M.; Aguiar, J.; Silva, A.; Carvalho, F. Conservation and Renovation of Ancient Building Walls Coverings; Collection on Buildings; LNEC: Lisbon, Portugal, 2004; Volume 9. (In Portuguese) [Google Scholar]
  24. EN1015-11:1999; Methods of Test for Mortar for Masonry—Part 11: Determination of Flexural and Compressive Strength of Hardened Mortar. Comité Européen de Normalisation (CEN): Brussels, Belgium, 1999.
  25. Pinho, F.F.S.; Lúcio, V.J.G.; Baião, M.F.C. Rubble stone masonry walls in Portugal strengthened with reinforced micro-concrete layers. Bull. Earthq. Eng. 2012, 10, 161–180. [Google Scholar] [CrossRef]
  26. Pinho, F.F.S.; Lúcio, V.J.G.; Baião, M.F.C. Rubble Stone Masonry Walls Strengthened by Three-Dimensional Steel Ties and Textile Reinforced Mortar Render, Under Compression. Int. J. Archit. Herit. 2014, 8, 670–689. [Google Scholar] [CrossRef]
  27. Pinho, F.F.S.; Lúcio, V.J.G.; Baião, M.F.C. Rubble Stone Masonry Walls Strengthened by Three-Dimensional Steel Ties and Textile-Reinforced Mortar Render, Under Compression and Shear Loads. Int. J. Archit. Herit. 2015, 9, 844–858. [Google Scholar] [CrossRef]
  28. Pinho, F.F.S.; Lúcio, V.J.G.; Baião, M.F.C. Experimental analysis of rubble stone masonry walls strengthened by transverse confinement under compression and compression-shear loadings. Int. J. Archit. Herit. 2018, 12, 91–113. [Google Scholar] [CrossRef]
  29. Correia, J. Experimental Analysis of a Large Rubble Stone Masonry Specimen. Master’s Thesis, FCT UNL, Lisbon, Portugal, 2011. (In Portuguese). [Google Scholar]
  30. Morais, H. Experimental Analysis of a Small Rubble Stone Masonry Specimen. Master’s Thesis, FCT UNL, Lisbon, Portugal, 2010. (In Portuguese). [Google Scholar]
  31. Cusatis, G.; Bažant, Z.P.; Cedolin, L. Confinement-shear lattice model for concrete damage in tension and compression: I. Theory. J. Eng. Mech. 2003, 129, 1439–1448. [Google Scholar] [CrossRef]
Figure 1. Bilinear softening contact model.
Buildings 12 01283 g001
Figure 2. Discretization of a stone masonry wall.
Buildings 12 01283 g002
Figure 3. Geometry and views of the URM specimens: (a) side view of a large specimen; (b) side view of a small specimen; (c) end view of the specimens; (d) view of a small specimen. See [1,19] for more details.
Buildings 12 01283 g003
Figure 4. Axial compression loading tests: (1) axial compression testing system; (2 to 7) final stages of different URM tested masonry specimens. See [1,19,29,30] for more details.
Buildings 12 01283 g004
Figure 5. Force-displacement and stress-strain diagrams of the compression loading tests (following the chronological order of tests). See [1,19,29,30] for more details.
Buildings 12 01283 g005
Figure 6. Numerical model generation: (a) Frontal wall photography with stone contour and (b) final stone units representative polygons discretized with inner particles.
Buildings 12 01283 g006
Figure 7. 2D-PM numerical models that are representative of the masonry walls facets with a zoom of the particle assembly including the inter-particle contacts.
Buildings 12 01283 g007
Figure 8. Final crack patterns: compression tests (specimen size 0.04 × 0.04 m2) and bending tests (specimen size 0.14 × 0.04 m2).
Buildings 12 01283 g008
Figure 9. (a) Stress-displacement diagram for compression test and (b) Force-displacement diagram for bending test.
Buildings 12 01283 g009
Figure 10. Comparison of the experimental [1,30] and numerical stress-displacement diagrams for frontal numerical models with 25% mortar–Frontal model–Refined particle assembly.
Buildings 12 01283 g010
Figure 11. Failure mode at final stage for frontal models with 25% mortar.
Buildings 12 01283 g011
Figure 12. Contact crack evolution for frontal numerical model with 25% mortar–Yield plateau of 0.80 MPa (m-refined) and elastic behaviour under compression (m-refined (elastic)).
Buildings 12 01283 g012
Figure 13. Numerical stress-displacement diagrams for frontal numerical models with 25% mortar volume–Frontal model–Refined and coarse particle assemblies.
Buildings 12 01283 g013
Figure 14. Frontal model (m-refined)-Evolution of the damage pattern. Instances (ad) are identified on Figure 10 as “Representative points”.
Buildings 12 01283 g014
Figure 15. Frontal model (m-refined (elastic))-Evolution of the damage pattern. Instances (ad) are identified on Figure 10 as “Representative points”.
Buildings 12 01283 g015
Figure 16. Comparison of the experimental [1] and numerical stress-displacement diagrams for frontal numerical models with 25% mortar volume–Lateral model–Refined particle assembly.
Buildings 12 01283 g016
Figure 17. Failure mode at final stage for lateral models with 25% mortar volume.
Buildings 12 01283 g017
Figure 18. Lateral Model m-refined-Evolution of the damage pattern. Instances (ad) are identified on Figure 16 as “Representative points”.
Buildings 12 01283 g018
Figure 19. Numerical stress-displacement diagrams for lateral numerical models with 25% mortar volume–Lateral model–Refined and coarse particle assemblies.
Buildings 12 01283 g019
Table 1. Main experimental results obtained under compression loads of the rubble-stone’s masonry specimens.
SpecimenAge at Test F m a x σ c , m a x d v , F m a x E
[days][kN][MPa][mm][GPa]
M47 (1)37276.80.244.50.093
M43 (2)618134.20.426.80.239
M21 (3)626127.70.406.40.409
M32 (4)638148.50.464.30.267
M36 (5)2866238.30.746.40.212
M9 (6)3087192.20.605.40.341
(1–4) [1]; (5) [30]; (6) [29].
Table 2. Numerical models—number of particles and contacts.
ModelParticlesContacts
Stone (s)Mortar (m)m-mm-ss-s
Frontal-m-coarse14,99088,73840,337247,94321,053
Frontal-m-refined17,790175,82245,141499,09732,925
Lateral-m-coarse750145,38120,034127,17610,154
Lateral-m-refined936390,01223,327255,61916,275
Table 3. Elastic and strength properties: macroscopic values.
(a) Experimental values
MaterialE [GPa] ν σ c  [MPa] σ t . f l  [MPa]
Mortar0.0750.160.650.3
Stone6.00.347.8-
(b) Numerical predictions after calibration
Mortar (m-coarse)0.0750.160.66 (0.69)0.15 (0.16)
Mortar (m-refined)0.0750.160.65 (0.67)0.25 (0.25)
Stone6.00.347.8-
Table 4. Elastic and strength properties: contact values.
Contacts E ¯ α σ n t , c τ c μ c G f , n G f , s
[GPa][–][MPa][MPa][–][N/m][N/m]
s-s8.600.118.9035.71.00.383856.1403
m-m & m-s (m-coarse)0.090.430.160.161.00.00130.0030
m-m & m-s (m-refined)0.090.450.170.171.00.00200.0046
Table 5. Elastic properties and peak-strength—Frontal model-Numerical and experimental values [1].
Model F m a x  [kN]E [GPa] σ c , m a x  [MPa] d v , F m a x  [mm]
m-refined1760.2830.552.25
m-refined-elastic3500.2831.135.63
[1]168 (238)0.49 (0.73)5.97 (6.39)
Table 6. Maximum compression stress at contacts–m-refined (elastic)–Frontal model.
Loading Stage σ c m a x [MPa]
m-mm-s
3.00 mm/0.74 MPa5.945.21
4.50 mm/1.04 MPa10.3610.26
5.63 mm/1.13 MPa14.2715.13
4.50 mm/1.04 MPa11.7911.38
Publisher’s Note: MDPI stays neutral with regard to jurisdictional claims in published maps and institutional affiliations.

