Article

Study on Influencing Factors of Paste Coating Thickness of Pervious Concrete

1
College of Hydraulic and Environmental Engineering, China Three Gorges University, Yichang 443000, China
2
School of Water Conservancy Engineering, Zhengzhou University, Zhengzhou 450001, China
3
Guangxi Key Laboratory of Water Engineering Materials and Structures, Guangxi Institute of Water Resources Research, Nanning 530000, China
4
Hubei Institute of Water Resources Survey and Design, Wuhan 430000, China
*
Authors to whom correspondence should be addressed.
Buildings 2023, 13(2), 380; https://doi.org/10.3390/buildings13020380
Submission received: 31 December 2022 / Revised: 21 January 2023 / Accepted: 25 January 2023 / Published: 30 January 2023
(This article belongs to the Special Issue Research on Concrete and Cement-Based Materials)

Abstract

:
Pervious concrete (PC) is a multifunctional material with good water permeability, noise reduction, and heat absorption properties. The most critical performance indicators of the PC are permeability and strength, which are mainly affected by the cement paste coating thickness (PCT) on the aggregate surface. The experiment was carried out to study the influence of the water–cement ratio, superplasticizer dosage, aggregate roughness, and aggregate size on PCT, and a new normalization method was proposed for grey correlation analysis to determine the influence degree of the above factors on PCT. Finally, fitting models for predicting the PCT were established based on experimental data. The experimental results indicate that the influence of the water–cement ratio on PCT can be divided into two stages, whereby the PCT shows a slow decline and then a rapid decline with the increase in water–cement ratio; with the increase in superplasticizer dosage, the PCT represents an exponentially decreasing trend; the PCT increases with the aggregate size and aggregate roughness. Based on the grey correlation analysis, the superplasticizer dosage exerts the greatest influence on PCT, followed by the water–cement ratio, aggregate size, and aggregate roughness. The results of this study revealed the change law of PCT under the action of the above factors, which established the premise of controlling the strength and permeability of PC from the perspective of the PCT and provided a reference for the mixture proportion design.

1. Introduction

Nowadays, scientists and engineers are putting more effort into designing environmentally sustainable systems. To achieve sustainability, pervious concrete and other materials that use renewable resources have been extensively studied [1,2]. Pervious concrete (PC) is treated as a two-phase material composed of cement paste and aggregate [3]. In the case of today’s large-area impermeable concrete pavement structure being applied, the rainwater cannot directly infiltrate into the underground, resulting in groundwater that cannot be compensated, which brings a series of ecological problems. The above problems can be solved by using PC instead of impervious concrete [4,5,6,7]. The large, open pore structure (typically in the range of 15–25% interconnected porosity, and pore size ranging from 2 to 8 mm) of pervious concrete allows air and fluids to pass easily from the surface to underlying layers [8]. Previous studies have shown that the typical water–cement ratio for PC is generally between 0.25 and 0.45, the aggregate size is between 5 and 20 mm, and the cement content ranges from 200 kg/m3 to 450 kg/m3 [2,9,10,11,12]. According to the needs of the working performance of the fresh mixture, materials such as superplasticizers can be added. Pervious concrete, which is well recognized as one of the key building materials of a sponge city [13], has been widely used in pavement, parking lots, ecological revetment, and other engineering scenarios [14,15,16]. Moreover, pervious concrete can contribute to reducing the urban heat island effect and acoustic noise as well as improving driving safety on rainy days [17,18].
Previous research consistently focused on the pore structure of PC, which indirectly determines its permeability and strength [19,20,21,22], wherein the pore characteristics such as pore size, porosity, tortuosity, distribution, and specific surface were investigated to establish the relationship between pore characteristics and PC performance [23,24]. However, the pore structure of permeable concrete is complex and unpredictable. Different molding methods, mix proportions, and aggregate conditions will form different pore structures, which are challenging to characterize with a simple quantitative description [25]. Essentially, strength, permeability, and pore structure are determined mainly by the cement paste coating thickness (PCT) [26,27].
The PCT determines the pore distribution and the bond state among the aggregates wrapped with cement paste [26,28]. When the PCT increases, the pore size of the PC becomes smaller, and more cement paste is filled among the aggregates. Therefore, the PC strength is improved, but the permeability is correspondingly reduced. Conversely, a reduction in the strength of the PC raises engineering safety concerns when the PCT decreases. Zhongzhen Wang stated that the macroperformance and mesostructure of PC are mainly determined by the PCT and explored the influence of the PCT on the compressive strength, permeability, and characteristics of cement paste and pores [26]. Anthony Torres’s study [29] correlated the fundamental properties of pervious concrete, such as the porosity, permeability, and compressive and tensile strengths, with the PCT, and the results showed that the porosity and permeability of the pervious concrete samples decreased with an increase in cementitious paste thickness, but the 28-day compressive strength and splitting tensile strength increased. In addition, the ideal paste thickness (IPT) was proposed [30], which characterized the ability of a cement paste to form a stable film on a smooth, nonabsorbent vertical surface, and the actual paste thickness (APT) represented the ability of cement paste to adhere to and remain on the aggregate surface. Betiglu E. Jimma’s work introduced the concept of paste film-forming ability as an additional parameter for characterizing cement paste for pervious concrete applications [30]. However, relevant studies have investigated the relationship between PCT and the macroscopic properties of the PC, but the influence of cement and aggregate factors on PCT has not been fully revealed.
This study aimed to investigate the influence of cement paste and aggregate factors on PCT. In particular, the cement paste factors include water–cement ratio and superplasticizer dosage, and the aggregate factors include aggregate roughness and aggregate size. The experiment was carried out to study the influence of the above factors on PCT. A new normalization method was proposed for grey correlation analysis, and the influence degree ranking of each factor was obtained. Finally, a fitting model for predicting PCT was established.

2. Materials and Methods

2.1. Materials

The P.O 42.5 ordinary Portland cement was used, and its chemical compositions are listed in Table 1. The superplasticizer (SP) was produced by Tianjin Weihe Technology Development Co., Ltd., and its recommended dosage ranged from 0.1% to 0.5% (mass ratio of superplasticizer to cement). Dolomite was chosen as the aggregate because its white cross-section will be used for image analysis (Section 2.4). In previous studies, the main problem encountered with image analysis was that because the hardened cement paste color was similar to the aggregate, it caused certain difficulties and errors in image analysis [26,31,32]. The dolomite aggregates with white cross-sections can be better distinguished from the color of cement paste and pores. Three kinds of dolomite aggregates with different sizes listed in Table 2 were prepared to explore the influence of the aggregate size on PCT. All aggregates were kept in a saturated, surface-dried condition (SSD) to avoid the influence of aggregate moisture content. Tap water was used throughout the experiment.

2.2. Preparation and Measurement of Aggregate Roughness

A vibration polishing machine was used to produce dolomite aggregates with different roughness (Figure 1) to explore the influence of aggregate roughness on PCT. Aggregates with different roughness (Figure 2) were prepared by adding emery with varying mesh numbers into the vibrating polisher container for polishing. The parameters of polishing are tabulated in Table 3. Given the problem that the aggregate size became smaller during the polishing process, the aggregates were sieved again after polishing.
A probe-type surface roughness tester cannot measure the roughness of the aggregate well because of the complex spatial surface of the aggregate, which exceeds the equipment’s measuring range. As an emerging technology, the 3D scanner can be utilized to solve this problem because of its fast scanning speed and high scanning accuracy [33]. A DAVID SLS-2 structured light scanner was used to scan four groups of aggregates, R1, R2, R3, and R4, respectively, to obtain their high-density point cloud information for calculating the aggregate roughness. Moreover, the index Ra (the arithmetic mean deviation of the profile [34,35]) is used to characterize the roughness of the aggregate surface, as shown in Equation (1), and the calculation process of the Ra can be seen in Figure 3. First, a random cut plane is inserted into the point cloud of the aggregate. Then, the point cloud coordinates located on the cut plane are extracted and sorted clockwise. Third, a random point is selected from the extracted points as the starting point, and other points are selected clockwise as the calculation objects. When the distance between the last point and the starting point is closest to 2 mm, the Ra is calculated by all the previously selected calculation objects. Fourth, the same method can be used to calculate the Ra value of the remaining points in this cut plane. Fifth, insert a new cut plane and continue to calculate the Ra using the above method. The above steps are implemented by computer programs. In this experiment, the Ra value of a single group of aggregates is the average value after 300 times of sampling using the program. The roughness index Ra for R1, R2, R3, and R4 groups is listed in Table 3 and Figure 2. Four groups of aggregates with different roughness.
R a = 1 n i = 1 n Z i
where n is the total number of data points, Zi is the distance that the ith point deviates from the midline, and the midline is a line fitted from these n points by the least squares method, that is, the fitting line when ϵ = Z i 2 takes the minimum value.

2.3. Sample Preparation

The mixture proportion design of the experiment is presented in Table 4, and the cement content of all groups is 300 kg/m3. The pouring process can be summarized in two steps: the first step is to place the calculated aggregate (saturated surface dried condition) and 40% of the water into the mixer and stir for 60 s, which keeps moisture on the aggregate surface; the second step is to add the cement and the remaining water with superplasticizer into the mixer and stir for 120 s. The size of the sample mold is 100 × 100 × 100 mm. There are three main molding methods for PC: the vibration molding method, the manual poking molding method, and the static pressure molding method [36]. The manual poking molding method was used in this experiment. The production process of the specimens is shown in Figure 4. Furthermore, all samples were cured for 28 days under standard curing conditions.

2.4. Image Analysis Method

The PCT can be measured by using a grid and digital measurement calipers [29], the semi-manual hand measurement method [31], the high-precision CT image analysis method [26,32,37], and the cross-sectional image analysis method [23,38]. In contrast, the results obtained by the high-precision CT image analysis method and the cross-sectional image analysis method are more accurate than other methods. The former can obtain the PCT without damaging the specimen, but the price is high. On the contrary, the latter cuts the specimen into several slices, which is more convenient to operate and less expensive [39]. Hence, the cross-sectional image analysis method was used in this experiment, and the PCT can be calculated as the total area of cement paste divided by the total perimeter of aggregate in a cross-sectional image. ImageJ, the software used to calculate a series of geometric features of the analyzed object within the selected area of an image, was applied to analyze the geometric information of aggregate and cement paste.
In this experiment, the cement content of all specimens was 300 kg/m3. If the cement paste can be evenly wrapped on each aggregate, a change in the water–cement ratio, superplasticizer dosage, aggregate size, and aggregate roughness will not cause the change in the PCT. However, in the preliminary experiments, when the superplasticizer dosage was high, the cement paste flowed with great fluidity to the bottom of the specimen. It caused a blockage, and the PCT of the specimen’s upper part changed with the superplasticizer dosage. If the average value of PCT is calculated using all parts of the specimen sections, the PCT of each specimen may be the same due to the same cement content in all specimens, but the vertical PCT distribution of each specimen is different. Therefore, the cross-sectional image analysis method can be used to obtain the change law of PCT of the specimen’s upper part under the action of cement and aggregate factors. The specimen was cut into four equal parts (100 × 100 × 25 mm) along the height. Finally, six cross-section images were obtained, and the four cross-sectional images of the upper part of the specimen were taken as the image analysis objects.
In order to obtain the perimeter of the aggregate, the general procedures of the image analysis have been displayed in Figure 5. First, photograph four cross-sections of the specimen in sequence. A bracket is used to fix the camera and provide annular lighting conditions to ensure imaging quality. Then, keep the bracket position and the camera focal length unchanged, and take a picture of a steel ruler for the next step to obtain the ratio of the actual distance to the pixel size in the picture. Second, import the pictures into the ImageJ software, and the ratio of the actual distance to the pixel size is calibrated according to the picture of the steel ruler in the previous step. Third, convert the image to an 8-bit type. Fourth, perform a threshold segmentation on the image, at which time the aggregates will be marked as a red area. Fifth, perform a binarization operation on the image; and there is some noise in the picture, which can be dealt with by smoothing and noise reduction. The black area in the picture represents aggregates, and the white area represents pores and cement paste. Finally, extract the perimeter of the black area (i.e., the perimeter of the aggregates).
For the extraction of the cement paste area, CaCO3 powder was used to fill the pores on the slices, making each pore appear white in the photo, similar to the aggregate color (Figure 6a). In addition, the process shown in Figure 5 can be used to extract the area of cement paste. The processed picture is shown in Figure 6b, where the black area represents the cement paste and the white area represents pores and aggregates. In this way, the area of cement paste is extracted.
The aggregate perimeter and cement paste area in four sections were determined based on the above process. The average value of the cement area divided by the aggregate perimeter on the four sections is taken as the PCT of this specimen.

3. Results and Discussion

3.1. Influence of Cement Paste and Aggregate Factors on PCT

The experiment was carried out to study the influence of the water–cement ratio, superplasticizer dosage, aggregate roughness, and aggregate size on PCT, which established the premise of controlling the strength and permeability of PC from the perspective of PCT and provided a reference for the mixture proportion design.

3.1.1. The Influence of Water–Cement Ratio on PCT

Figure 7 reflects the influence of the water–cement ratio on PCT. The PCT showed a downward trend when the water–cement ratio increased from 0.28 to 0.36. Furthermore, when the water–cement ratio is between 0.28 and 0.32, the decline of PCT is relatively slow, accounting for 30.5% of the total decline; when the water–cement ratio is greater than 0.32, the decrease is larger, accounting for 69.5% of the total decline. During the experiment (Figure 4), aggregates with their paste coating were taken out for close observation. When the water–cement ratio was low, the fluidity of the paste was poor. It can be seen that the contour characteristics of the aggregate itself are covered by the paste coating. The paste coating showed more irregular protrusions and high roughness, as shown in Figure 8a. When the cement fluidity increases due to the rise in the water–cement ratio, less cement paste can be wrapped on the aggregate surface. As shown in Figure 8b, the cement paste forms a smooth, relatively thin paste coating on the aggregate surface, and the original contour characteristics of the aggregate can be seen at this time.
Based on existing research [40], the initial fluidity of fresh cement paste depends mainly on the free water content. At any mix proportion (water–cement ratio and superplasticizer–cement ratio), the cement paste can flow only if the free water content is greater than a critical value (called critical free water content, denoted as W0/C); when the system is bleeding, even if the free water is increased (by increasing the water–cement ratio or superplasticizer–cement ratio), all the additional free water will be bleeding and will no longer affect the initial fluidity. At this time, the free water content is called saturated free water content, denoted as W1/C. The necessary condition for the proper fluidity of fresh cement paste is that its free water content is within the range of (W0/C, W1/C). In this range, the higher the free water content, the greater the initial fluidity [41]. In this experiment, with the increase in the water–cement ratio, the free water content in cement paste increases, which enhances the fluidity of cement paste and reduces the yield stress and apparent viscosity of cement paste, so the cement paste wrapped on the surface of aggregate decreases accordingly.
It can be seen in Figure 7 that the change in PCT with the increase in the water–cement ratio can be divided into two stages. When the water–cement ratio is between 0.28 and 0.32, the free water content in the cement paste is only slightly higher than or equal to the critical free water content, and the fluidity of the cement paste is small. Hence, the PCT slowly decreases with the increase in the water–cement ratio, which means the water–cement ratio has less influence on the PCT. When the water–cement ratio is between 0.32 and 0.36, the free water content in the cement paste gradually increases, so the PCT begins to decrease relatively quickly, which means the water–cement ratio has a certain influence on PCT.

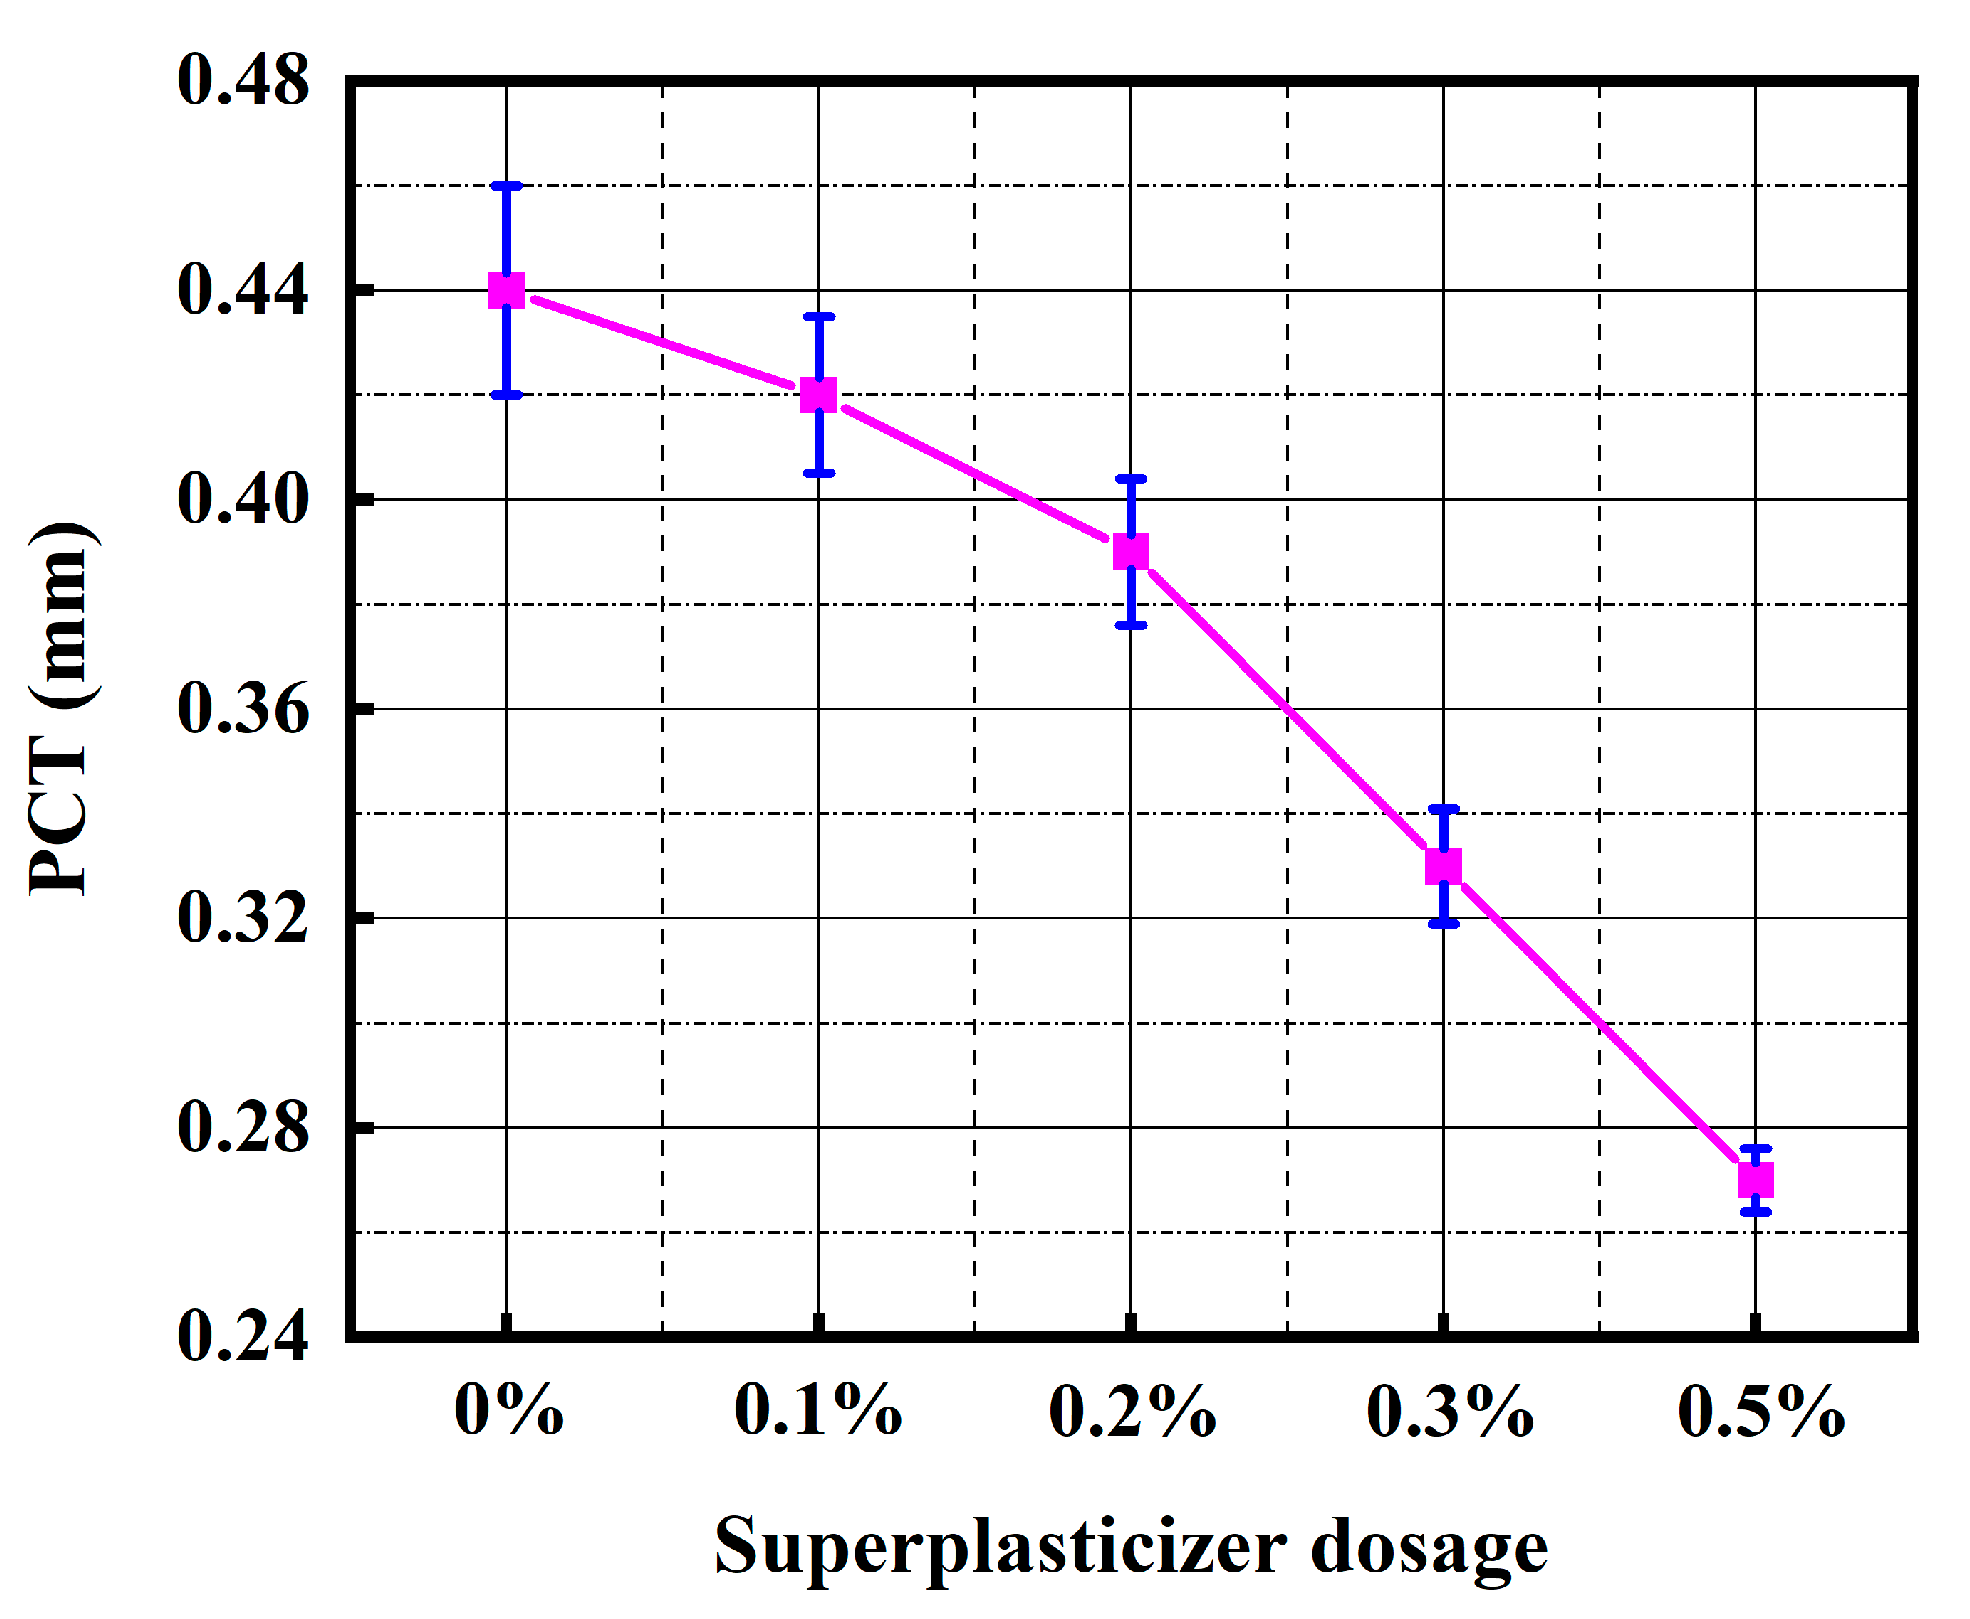
3.1.2. The Influence of Superplasticizer Dosage on PCT

After the superplasticizer was added to the concrete mixture, it exerted a dispersing effect on the cement particles, which can improve the workability and fluidity of the cement mixture [42]. The influence of superplasticizer dosage on PCT is illustrated in Figure 9, where the PCT showed a declining exponential trend with the increase in superplasticizer dosage. The reason is that a large superplasticizer dosage in the mixture proportion significantly improves the fluidity of cement paste, thus reducing the limit value of the PCT on the aggregate surface, which manifests as a rapid decrease in PCT with the increase in superplasticizer dosage.
Without the superplasticizer, the cement and water are mixed to form a cement suspension system. The charge characteristics of different mineral phases and the surface of early hydration products in the system are different, attracting each other to form a flocculation structure and wrapping large amounts of mixed water, thereby reducing the fluidity of the paste [43,44]. After adding the superplasticizer, the superplasticizer molecules dissociate into macromolecular anions in water and adsorb on the surface of cement particles and their hydration products so that the absolute value of the zeta potential of particles increases, the electrostatic repulsion between particles increases, the formation of flocculation structures in the system is destroyed and inhibited, and the free water in the system increases [45]. Macroscopically, the fluidity of the paste has improved. Thus, the greater the superplasticizer dosage, the greater the absolute value of the zeta potential, and the better the superplasticizer’s dispersion effect [40,45]. The above mechanism explains how increasing the superplasticizer dosage increases the fluidity of cement paste, which is consistent with the experimental results. The superplasticizer dosage exerts a great effect on PCT, showing a declining exponential trend with the increase in the superplasticizer dosage.
The guiding significance of this conclusion for practical engineering is that, when designing the mixture proportion of PC, it is necessary to control the superplasticizer dosage precisely. An excessive superplasticizer dosage will lead to extreme fluidity of the mixture, and the cement paste during pouring will flow to the bottom of the material because of its gravity and the vibration of the vibrating process, thereby resulting in blockage at the bottom of the material (Figure 10). On the contrary, adding too little superplasticizer is not advantageous for the workability of the fresh mixture, particularly when the water–cement ratio is low.

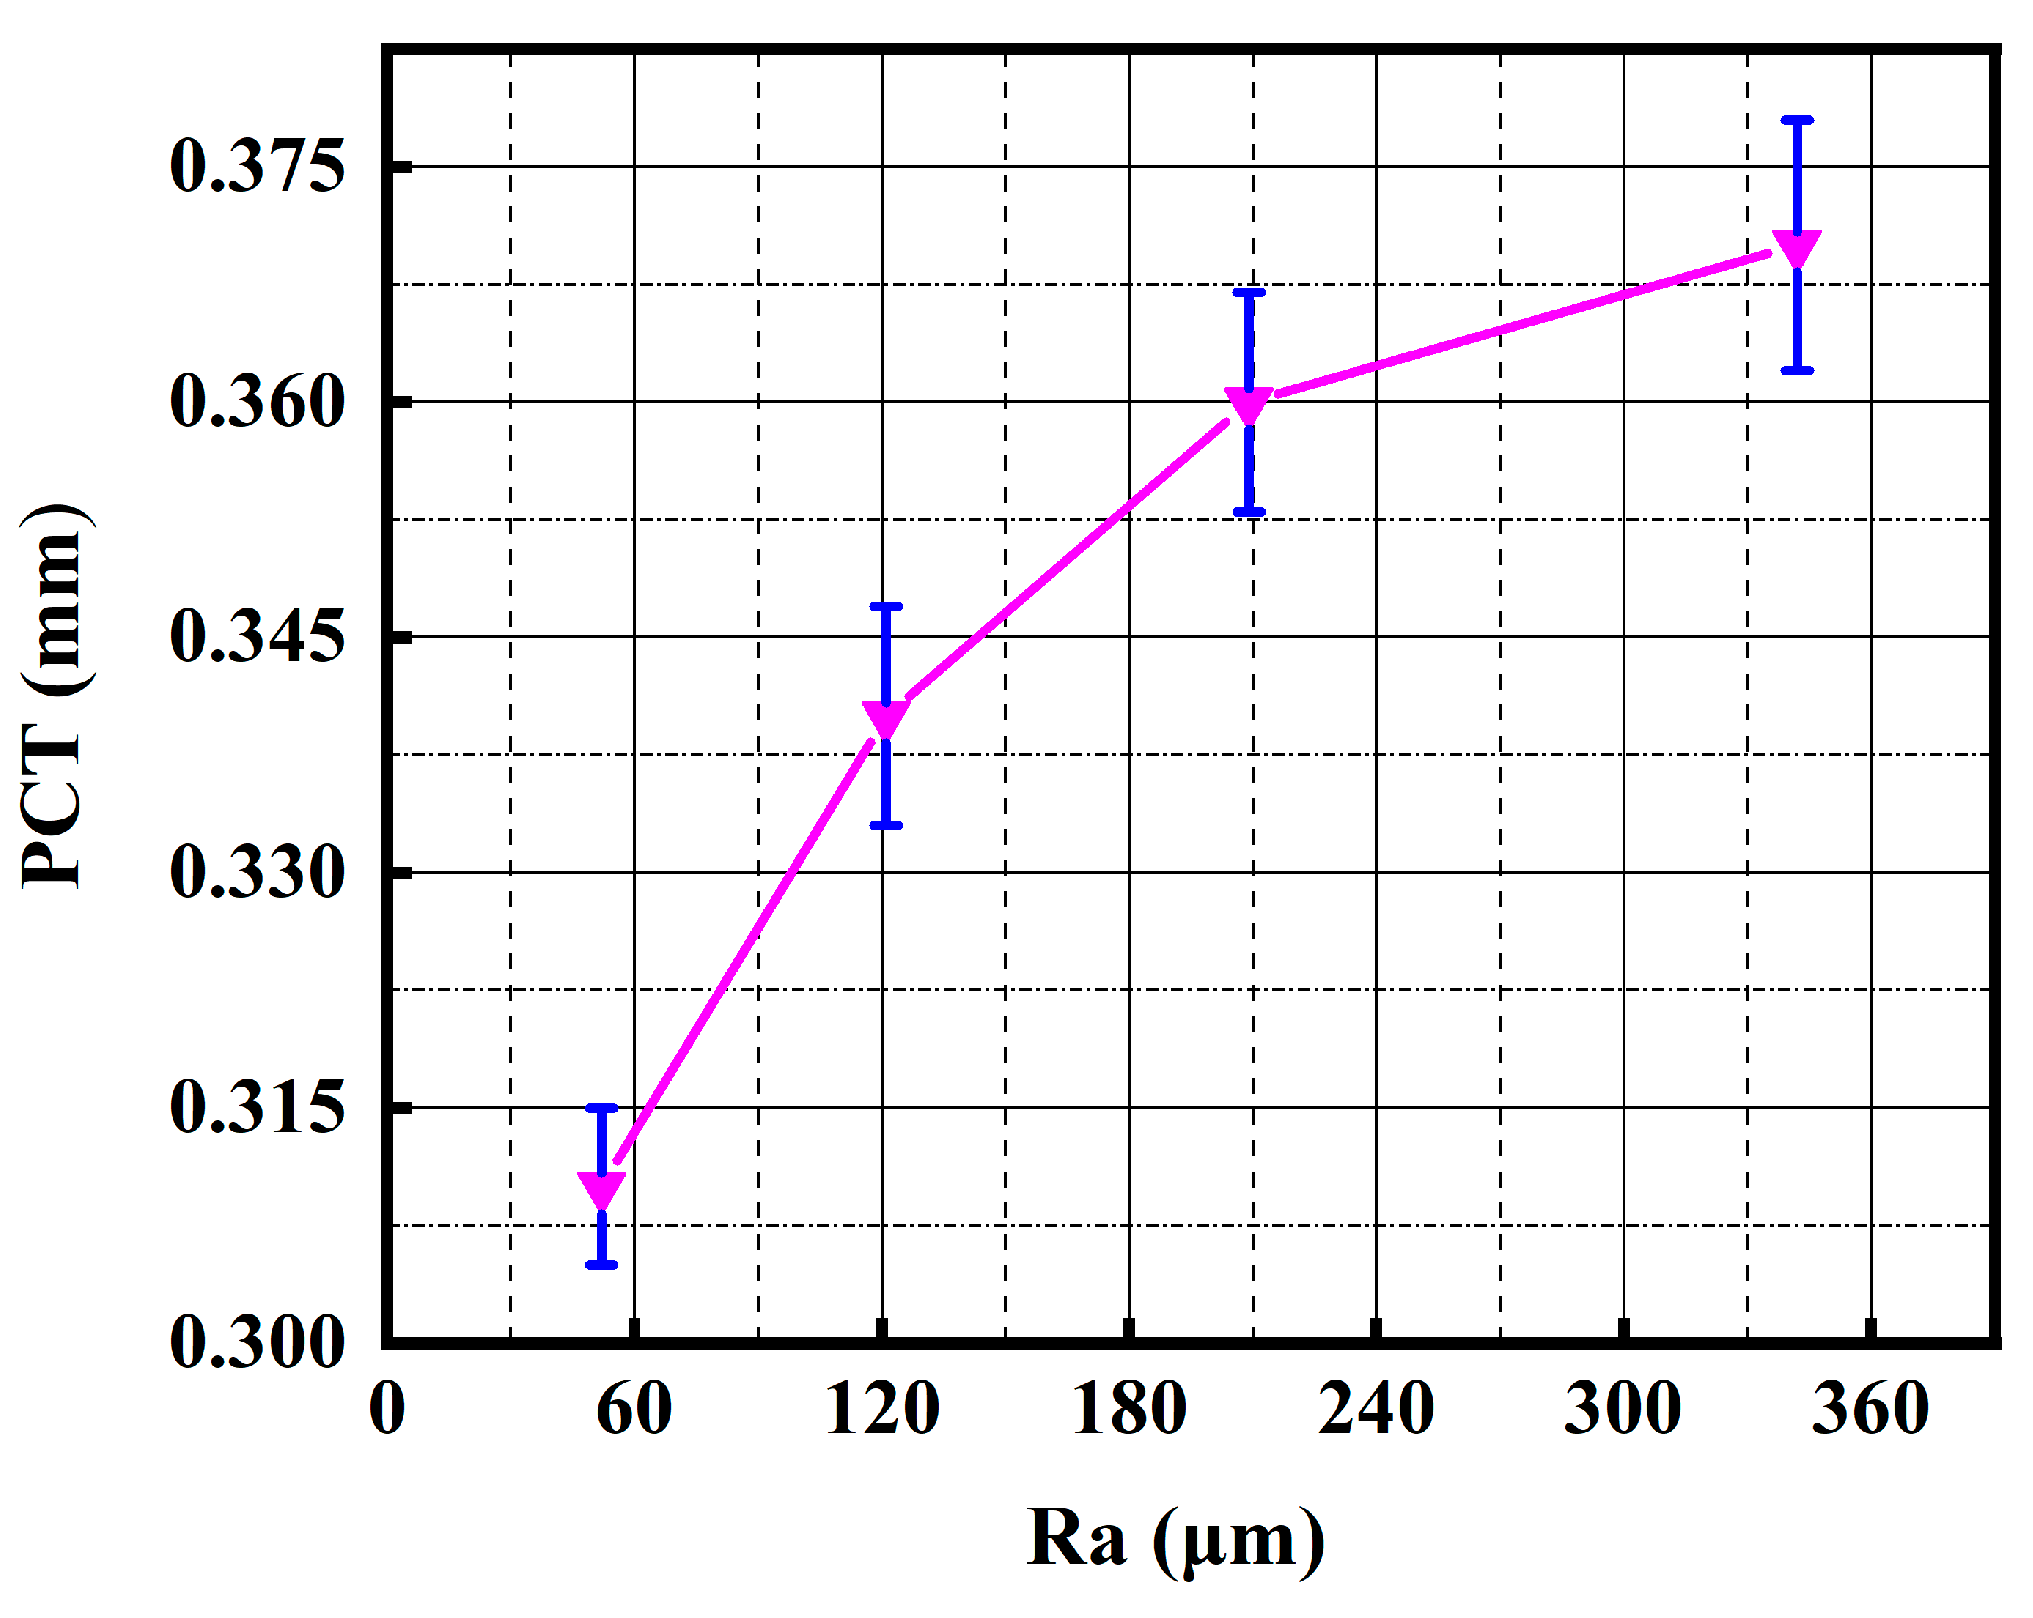
3.1.3. The Influence of Aggregate Roughness on PCT

The influence of aggregate roughness on PCT is shown in Figure 11. With the increase in aggregate roughness index Ra, the PCT rapidly increased and tended to be stable in the end, which reflects that the cement paste was more likely to adhere to the rough aggregate surface. On the micro scale, with the increase in aggregate roughness index Ra, the aggregate surface is more tortuous, which increases the actual area of the aggregate surface, thus increasing the anti-slide force between the aggregate surface and cement paste. From a macro perspective, the friction coefficient of the aggregate surface increases with the aggregate roughness index Ra, thereby enhancing the anti-slide force. The abovementioned mechanism explains the phenomenon that the PCT increase with aggregate roughness index Ra. When the index Ra of aggregate is larger than 200 μm, the anti-skid force between the aggregate surface and fresh cement paste will gradually reach the maximum value, so the PCT tends to be stable with the increase in the index Ra.
Based on the existing research [46], the bond tensile strength of the aggregate-mortar interface increases with the aggregate roughness and tends to a constant value; the shear strength of the aggregate–mortar interface increases with the aggregate roughness; and the splitting tensile strength and the axial compressive strength of concrete increase with the aggregate roughness. Thus, the shear and tensile strengths of the aggregate–fresh cement paste interface will decrease with the decrease in the aggregate roughness, and the bond strength of the aggregate–cement paste interface after cement hardening will also decrease with the decrease in the aggregate roughness, which ultimately affects the overall strength of PC. Therefore, too-round and smooth aggregates should be avoided in PC production.

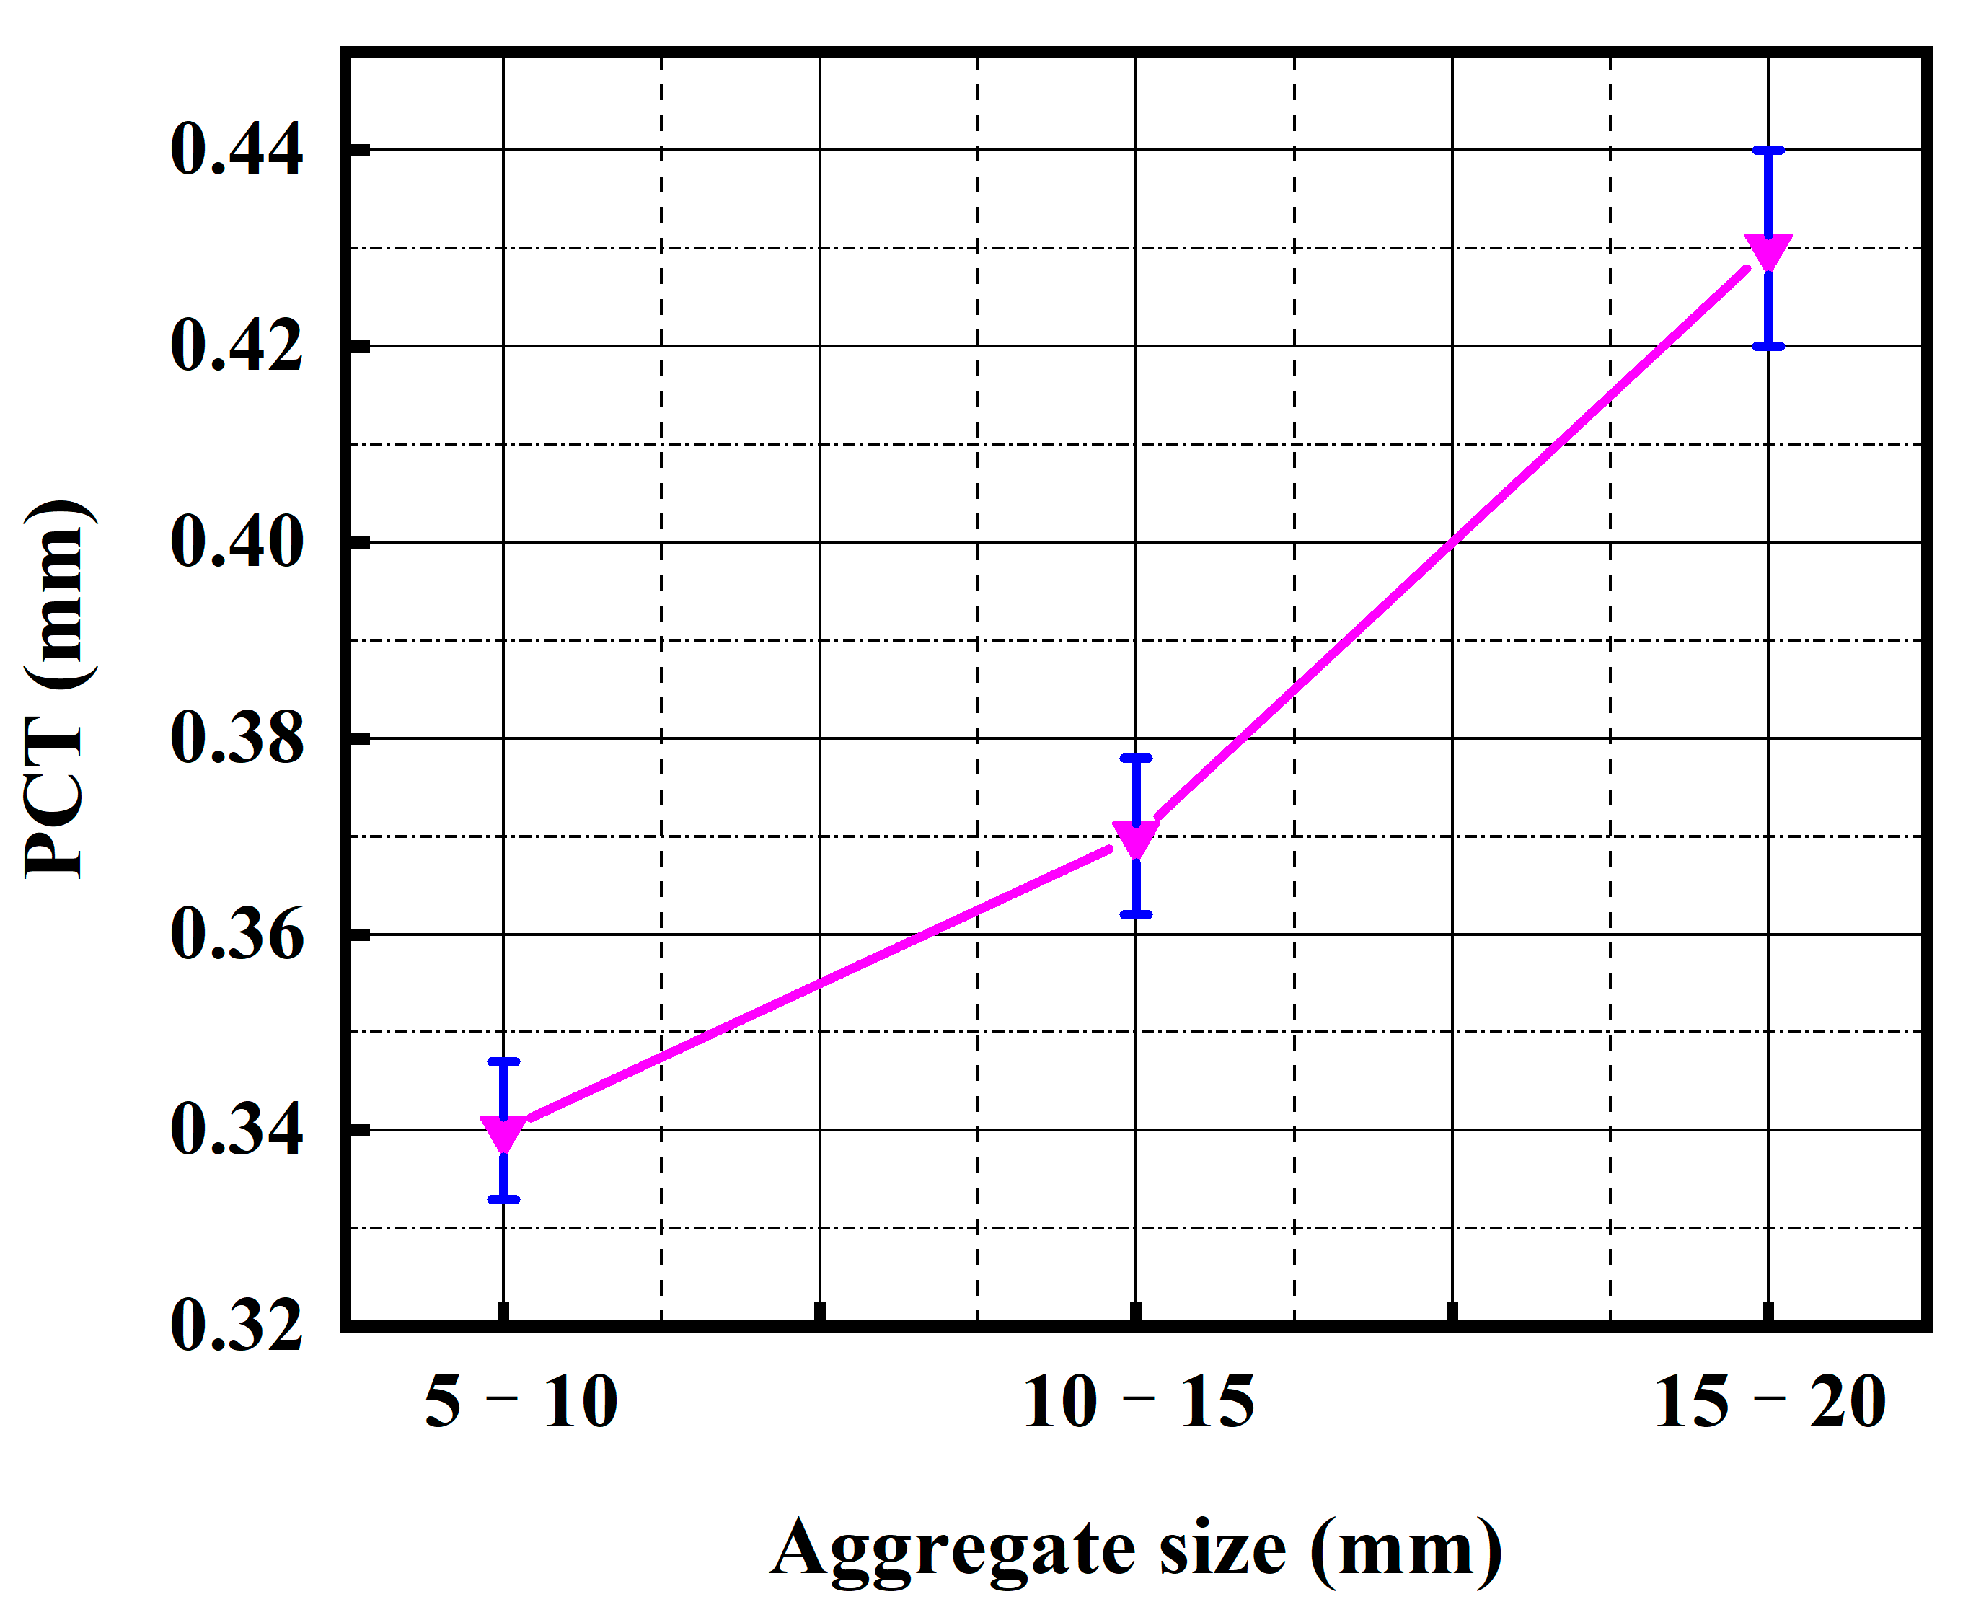
3.1.4. The Influence of Aggregate Size on PCT

In practical projects, the aggregate size ranges from 5 mm to 20 mm [31,47]. Therefore, three types of aggregates with particle sizes ranging from 5–10 mm, 10–15 mm, and 15–20 mm were used to investigate the influence of the aggregate size on PCT. The influence of the aggregate size on PCT is shown in Figure 12. With the increase in the aggregate size, the PCT shows a gradual increase, characterized by relatively slow growth at first and then rapid growth.
During the experiment, the cement paste volume (denoted as V) and the aggregate mass (denoted as M) are fixed. However, the specific surface area (denoted as S) of the aggregate with a small size is larger than that of the aggregate with a large size. Assuming that the cement paste is uniformly wrapped on each aggregate, then the PCT can be expressed as V/(S × M). Therefore, under the same cement paste volume and aggregate mass, the larger the aggregate size is, the greater the PCT is. However, the increase in PCT caused by the increase in aggregate size does not promote PC strength but exerts the opposite effect. The PC strength decreases with the rise in aggregate size [12,48,49,50,51]. It is because the specific surface area of an aggregate with a small size is larger, thereby increasing the bonding region [26] between aggregates and improving the material strength. In practical application, selecting an aggregate with medium particle size is beneficial to maintain a balance between strength and permeability.

3.2. Influence Degree of Cement Paste and Aggregate Factors on PCT

The influence law of different factors on the PCT has been explored in the previous chapters, but the specific influence degree is unknown. For example, suppose the engineers want to improve the PC strength. In that case, it is possible to reduce the water–cement ratio, reduce the superplasticizer dosage, increase the aggregate size, and use the aggregate with higher a roughness from the perspective of increasing the PCT. However, it is necessary further to analyze the influence degree of various factors on PCT to determine which way is more effective, which is of great significance for the mixture proportion design of PC and even the balance of the material strength and permeability. In this section, the grey correlation degree method [52,53] was used to determine the influence degree of various factors on PCT.

3.2.1. Grey Relational Analysis

The grey system theory [54], founded by Chinese scholar Julong Deng in 1982, is a new method to study the problems of fewer data, poor information, and uncertainty. The grey system theory provides a new statistical analysis method—grey relational analysis (GRA). The GRA uses the order of grey correlation degree to describe the strength, size, and order of the relationship between factors to judge each factor’s influence on the system’s development. The greater the grey correlation degree γ i of a factor, the greater the contribution of the factor to the development of the system, and vice versa. The influence of the four factors (water–cement ratio, superplasticizer dosage, aggregate roughness, and aggregate size) on PCT can be understood as a grey system, which could use the grey correlation degree to manifest the influence degree of each factor on PCT. The calculation process of the grey correlation degree can be divided into four steps. First, taking PCT as the reference sequence X0, the water–cement ratio, superplasticizer dosage, aggregate roughness, and aggregate size are considered the comparison sequences X1, X2, X3, and X4, respectively. Second, in order to eliminate the gap caused by the non-uniform dimension of each factor, all data sequences are normalized by Equation (2). Third, the grey correlation coefficient ξ i k of all data in each comparison sequence is calculated by Equation (3). ξ i k reflects the degree of difference between the comparison sequence Xi and the reference sequence X0 on the kth value. Last, the grey correlation degree γ i of each comparison sequence is calculated by Equation (4).
f x k = x k x ¯
where x k is the kth value of the data sequence to be normalized, x ¯ is the average value of the data sequences.
ξ i k = m i n i m i n k x 0 k x i k + ρ · m a x i m a x k x 0 k x i k x 0 k x i k + ρ · m a x i m a x k x 0 k x i k
where x 0 k x i k is the absolute difference between sequence X0 and sequence Xi, m i n i m i n k x 0 k x i k is the two-level minimum absolute difference, m a x i m a x k x 0 k x i k is the two-level maximum absolute difference, ρ is the resolution coefficient, which is usually taken as 0.5.
γ i = 1 n k = 1 n ξ i k
where n is the data number of the comparison sequence Xi, ξ i k is the grey correlation coefficient corresponding to each data point in the comparison sequence Xi.
After calculation, the grey correlation degree γ i of the water–cement ratio, superplasticizer dosage, aggregate roughness, and aggregate size are 0.898, 0.739, 0.879, and 0.914, respectively. Based on the above calculation result, the grey correlation degree of the superplasticizer dosage is the lowest, indicating that the influence degree of the superplasticizer dosage on PCT is the lowest, which is inconsistent with the experimental phenomenon and data. It is because the above calculation results only conform to the mathematical relationship between the reference sequence and the comparison sequence and do not take into account the common value range of each factor.
Therefore, a new normalization method is proposed to normalize the sequence data, as shown in Equation (5). We can use this equation instead of Equation (2) mentioned above, then continue to calculate the grey correlation coefficient ξ i k (Equation (3)) and grey correlation degree γ i (Equation (4)) of each comparison sequence. The new result after grey relational analysis considers the common value ranges of each factor, which means that the new result is no longer limited to reflecting the mathematical relationship between the reference sequence and the comparison sequence but can provide better guidance for practical application.
f x k = V m a x x k V m a x V m i n
where V m a x and V m i n are the maximum and minimum values of the common value range of the factor, respectively. x k is the kth value of the data sequence to be normalized.

3.2.2. Grey Relational Analysis by New Normalization Method

Based on the literature about pervious concrete [2,5,9,10,11,12], the common value range of the water–cement ratio in PC is generally 0.25–0.45; the superplasticizer dosage is about 0.1–1% based on the type and brand, and 0.1–0.5% is considered the common value range of the superplasticizer used in this experiment; the aggregate size is usually 5–20 mm. According to the calculation method of aggregate roughness in Section 2.2, the roughness index Ra of rough aggregates is about 350 μm, and the index Ra is around 50 μm in smooth pebbles.
The new normalization method introduced in Section 3.2.1 was used to normalize the sequence data, and the grey correlation coefficient ξ i k and grey correlation degree γ i of each comparison sequence were calculated by Equations (3) and (4). The calculated ξ i k and γ i of each comparison sequence (X1, X2, X3, X4) are shown in Table 5. The results show that the degree of influence of cement paste-related factors on PCT is greater than that of aggregate-related factors on PCT in general. Particularly, the superplasticizer dosage exerts the greatest influence on PCT, followed by the water–cement ratio, aggregate size, and aggregate roughness. It can be concluded that the most effective way to control PCT in practical applications is to change the superplasticizer dosage. However, it is necessary to pay attention to the excessive superplasticizer that will cause severe bottom blockage. In contrast, the aggregate roughness performs the slightest influence on PCT.

3.3. Statistical Model for Predicting PCT

Based on the experiment results, taking the water–cement ratio, superplasticizer dosage, aggregate roughness, and aggregate size as independent variables, the PCT is considered the dependent variable for linear regression analysis. The predicting model was established to predict the PCT under different factors, as shown in Equation (6). The fitting statistics of the model are shown in Table 6. The predicting model passed the F test (F = 77.824, p = 0.000 < 0.05). The F value is the statistical value of the F test. The regression model is statistically significant when the p-value corresponding to the F value is less than 0.05. The multicollinearity test of the model found that all the VIF (variance inflation factor) values in the model were less than 5, which means that there is no collinearity problem. The D-W (Durbin-Watson test) value is near 2, indicating no autocorrelation in the model and no correlation between the sample data. Overall, the proposed predicting model has a high degree of accuracy and shows a good fit. Based on the fitting statistics, aggregate size and aggregate roughness exert a significant positive effect on PCT, and superplasticizer dosage and water–cement ratio perform a significant negative effect on PCT. According to the grey correlation analysis results in Section 3.2.2, the influence of the aggregate roughness on the PCT is the lowest. Therefore, the contour maps are used to represent the prediction of the PCT by Equation (6) under the change in the water–cement ratio, superplasticizer dosage, and aggregate size (the default aggregate roughness Ra is 342 μm), as shown in Figure 13.
PCT = 0.37980 + 0.00022 R + 0.00900 S 36.44127 SP 0.41405 WC R 2 = 0.972
where R is the aggregate roughness, S is the aggregate size, SP is the superplasticizer dosage, and WC is the water–cement ratio.

4. Scope for Future Research and Conclusions

The experiment was carried out to study the influence law and degree of the water–cement ratio, superplasticizer dosage, aggregate roughness, and aggregate size on PCT. The most critical performance indicators of PC are permeability and strength, which are mainly affected by the PCT. The work carried out in this study is only the first step in exploring the seepage and strength characteristics of pervious concrete from the perspective of the PCT. In the future, researchers can continue exploring the PCT’s non-uniform distribution along the height direction of specimens under different mixture proportions. Try to describe the non-uniform distribution of the PCT along the height direction of the specimens through several distribution functions, and then establish a series of numerical models of pervious concrete that consider the non-uniform distribution of the PCT. Further, the numerical simulation can be used to verify the experimental results and explore the influence of the PCT on the performance of pervious concrete.
The main conclusions of this study are summarized below:
(1)
The influence of the water–cement ratio on PCT can be divided into two stages. When the water–cement ratio is between 0.28 and 0.32, the PCT decreases slowly with the increase in the water–cement ratio; when the water–cement ratio is between 0.32 and 0.36, the PCT begins to decrease relatively quickly. The PCT shows a declining exponential trend with the increase in superplasticizer dosage. When designing the mix proportion of PC, it is necessary to control the superplasticizer dosage precisely.
(2)
The PCT increases with the increase in aggregate roughness. Under the same circumstances, the larger the aggregate size, the larger the PCT.
(3)
A new normalization method is proposed for grey relational analysis. The common value ranges of different factors are considered in this new method, which is more suitable for multi-factor impact analysis on the PCT.
(4)
The result of the grey relational analysis shows that the superplasticizer dosage exerts the greatest influence on PCT, followed by the water–cement ratio, aggregate size, and aggregate roughness.
(5)
Taking the water–cement ratio, superplasticizer dosage, aggregate roughness, and aggregate size as independent variables and the PCT as a dependent variable, a predicting model was established to predict the PCT under different factors.

Author Contributions

Conceptualization, B.X.; writing—original draft preparation, H.G.; funding acquisition, J.C.; validation, X.L.; supervision, B.T.; writing—review and editing, B.C.; data curation, W.L. All authors have read and agreed to the published version of the manuscript.

Funding

This research was funded by the National Natural Science Foundation of China [No. 52009068, No. 52169024, No. 42172287]; Joint Funds of the Natural Science Foundation of Hubei Province: 2022CFD168.

Data Availability Statement

The data presented in this study are available on request from the corresponding author.

Conflicts of Interest

The authors declare no conflict of interest.

References

  1. Rajamony, L.L.; Gurupatham, B.G.A.; Roy, K.; Lim, J.B.P. Effect of Super Absorbent Polymer on Microstructural and Mechanical Properties of Concrete Blends Using Granite Pulver. Struct. Concr. 2021, 22, E898–E915. [Google Scholar] [CrossRef]
  2. AlShareedah, O.; Nassiri, S. Pervious Concrete Mixture Optimization, Physical, and Mechanical Properties and Pavement Design: A Review. J. Clean. Prod. 2021, 288, 125095. [Google Scholar] [CrossRef]
  3. Chindaprasirt, P.; Hatanaka, S.; Chareerat, T.; Mishima, N.; Yuasa, Y. Cement Paste Characteristics and Porous Concrete Properties. Constr. Build. Mater. 2008, 22, 894–901. [Google Scholar] [CrossRef]
  4. Ghafoori, N.; Dutta, S. Development of No-Fines Concrete Pavement Applications. J. Transp. Eng. 1995, 121, 283–288. [Google Scholar] [CrossRef]
  5. Xie, N.; Akin, M.; Shi, X. Permeable Concrete Pavements: A Review of Environmental Benefits and Durability. J. Clean. Prod. 2019, 210, 1605–1621. [Google Scholar] [CrossRef]
  6. Huang, B.; Wu, H.; Shu, X.; Burdette, E.G. Laboratory Evaluation of Permeability and Strength of Polymer-Modified Pervious Concrete. Constr. Build. Mater. 2010, 24, 818–823. [Google Scholar] [CrossRef]
  7. Neithalath, N.; Sumanasooriya, M.S.; Deo, O. Characterizing Pore Volume, Sizes, and Connectivity in Pervious Concretes for Permeability Prediction. Mater. Charact. 2010, 61, 802–813. [Google Scholar] [CrossRef]
  8. Xie, X.; Zhang, T.; Yang, Y.; Lin, Z.; Wei, J.; Yu, Q. Maximum Paste Coating Thickness without Voids Clogging of Pervious Concrete and Its Relationship to the Rheological Properties of Cement Paste. Constr. Build. Mater. 2018, 168, 732–746. [Google Scholar] [CrossRef]
  9. Akkaya, A.; Çağatay, İ.H. Experimental Investigation of the Use of Pervious Concrete on High Volume Roads. Constr. Build. Mater. 2021, 279, 122430. [Google Scholar] [CrossRef]
  10. Kant Sahdeo, S.; Ransinchung, G.D.; Rahul, K.L.; Debbarma, S. Effect of Mix Proportion on the Structural and Functional Properties of Pervious Concrete Paving Mixtures. Constr. Build. Mater. 2020, 255, 119260. [Google Scholar] [CrossRef]
  11. Elango, K.S.; Gopi, R.; Saravanakumar, R.; Rajeshkumar, V.; Vivek, D.; Raman, S.V. Properties of Pervious Concrete—A State of the Art Review. Mater. Today Proc. 2021, 45, 2422–2425. [Google Scholar] [CrossRef]
  12. Yang, J.; Jiang, G. Experimental Study on Properties of Pervious Concrete Pavement Materials. Cem. Concr. Res. 2003, 33, 381–386. [Google Scholar] [CrossRef]
  13. Xu, G.; Shen, W.; Huo, X.; Yang, Z.; Wang, J.; Zhang, W.; Ji, X. Investigation on the Properties of Porous Concrete as Road Base Material. Constr. Build. Mater. 2018, 158, 141–148. [Google Scholar] [CrossRef]
  14. Joshi, T.; Dave, U. Construction of Pervious Concrete Pavement Stretch, Ahmedabad, India—Case Study. Case Stud. Constr. Mater. 2022, 16, e00622. [Google Scholar] [CrossRef]
  15. Kayhanian, M.; Anderson, D.; Harvey, J.T.; Jones, D.; Muhunthan, B. Permeability Measurement and Scan Imaging to Assess Clogging of Pervious Concrete Pavements in Parking Lots. J. Environ. Manag. 2012, 95, 114–123. [Google Scholar] [CrossRef]
  16. Sun, R.; Wang, D.; Cao, H.; Wang, Y.; Lu, Z.; Xia, J. Ecological Pervious Concrete in Revetment and Restoration of Coastal Wetlands: A Review. Constr. Build. Mater. 2021, 303, 124590. [Google Scholar] [CrossRef]
  17. Marolf, A.; Neithalath, N.; Sell, E.; Wegner, K.; Weiss, J.; Olek, J. Influence of Aggregate Size and Gradation on Acoustic Absorption of Enhanced Porosity Concrete. ACI Mater. J. 2004, 101, 82–91. [Google Scholar] [CrossRef]
  18. Park, S.B.; Seo, D.S.; Lee, J. Studies on the Sound Absorption Characteristics of Porous Concrete Based on the Content of Recycled Aggregate and Target Void Ratio. Cem. Concr. Res. 2005, 35, 1846–1854. [Google Scholar] [CrossRef]
  19. Debnath, B.; Sarkar, P.P. Permeability Prediction and Pore Structure Feature of Pervious Concrete Using Brick as Aggregate. Constr. Build. Mater. 2019, 213, 643–651. [Google Scholar] [CrossRef]
  20. Wen, F.; Fan, H.; Zhai, S.; Zhang, K.; Liu, F. Pore Characteristics Analysis and Numerical Seepage Simulation of Antifreeze Permeable Concrete. Constr. Build. Mater. 2020, 255, 119310. [Google Scholar] [CrossRef]
  21. Deo, O.; Neithalath, N. Compressive Behavior of Pervious Concretes and a Quantification of the Influence of Random Pore Structure Features. Mater. Sci. Eng. A 2010, 528, 402–412. [Google Scholar] [CrossRef]
  22. Zhong, R.; Wille, K. Linking Pore System Characteristics to the Compressive Behavior of Pervious Concrete. Cem. Concr. Compos. 2016, 70, 130–138. [Google Scholar] [CrossRef]
  23. Ni, T.; Ma, W.; Yang, Y.; Yu, J.; Liu, J.; Jiang, C.; Gu, C. Interface Reinforcement and a New Characterization Method for Pore Structure of Pervious Concrete. Constr. Build. Mater. 2021, 267, 121052. [Google Scholar] [CrossRef]
  24. Yu, F.; Sun, D.; Hu, M.; Wang, J. Study on the Pores Characteristics and Permeability Simulation of Pervious Concrete Based on 2D/3D CT Images. Constr. Build. Mater. 2019, 200, 687–702. [Google Scholar] [CrossRef]
  25. Wang, Z.; Zou, D.; Liu, T.; Zhou, A.; Shen, M. A Novel Method to Predict the Mesostructure and Performance of Pervious Concrete. Constr. Build. Mater. 2020, 263, 120117. [Google Scholar] [CrossRef]
  26. Wang, Z.; Zou, D.; Liu, T.; Zhou, A. Influence of Paste Coating Thickness on the Compressive Strength, Permeability, and Mesostructure of Permeable Concrete. Constr. Build. Mater. 2021, 299, 123994. [Google Scholar] [CrossRef]
  27. Xie, X.; Zhang, T.; Wang, C.; Yang, Y.; Bogush, A.; Khayrulina, E.; Huang, Z.; Wei, J.; Yu, Q. Mixture Proportion Design of Pervious Concrete Based on the Relationships between Fundamental Properties and Skeleton Structures. Cem. Concr. Compos. 2020, 113, 103693. [Google Scholar] [CrossRef]
  28. Li, L.G.; Feng, J.J.; Lu, Z.C.; Xie, H.Z.; Xiao, B.F.; Kwan, A.K.H.; Jiao, C.J. Effects of Aggregate Bulking and Film Thicknesses on Water Permeability and Strength of Pervious Concrete. Powder Technol. 2022, 396, 743–753. [Google Scholar] [CrossRef]
  29. Torres, A.; Hu, J.; Ramos, A. The Effect of the Cementitious Paste Thickness on the Performance of Pervious Concrete. Constr. Build. Mater. 2015, 95, 850–859. [Google Scholar] [CrossRef]
  30. Jimma, B.E.; Rangaraju, P.R. Film-Forming Ability of Flowable Cement Pastes and Its Application in Mixture Proportioning of Pervious Concrete. Comput. Chem. Eng. 2014, 71, 273–282. [Google Scholar] [CrossRef]
  31. Yu, F.; Sun, D.; Wang, J.; Hu, M. Influence of Aggregate Size on Compressive Strength of Pervious Concrete. Constr. Build. Mater. 2019, 209, 463–475. [Google Scholar] [CrossRef]
  32. Zhou, H.; Li, H.; Abdelhady, A.; Liang, X.; Wang, H.; Yang, B. Experimental Investigation on the Effect of Pore Characteristics on Clogging Risk of Pervious Concrete Based on CT Scanning. Constr. Build. Mater. 2019, 212, 130–139. [Google Scholar] [CrossRef]
  33. Bugeja, A.; Bonanno, M.; Garg, L. 3D Scanning in the Art & Design Industry. Mater. Today Proc. 2022, 63, 718–725. [Google Scholar] [CrossRef]
  34. Dhananchezian, M.; Rajkumar, K. Comparative Study of Cutting Insert Wear and Roughness Parameter (Ra) While Turning Nimonic 90 and Hastelloy C-276 by Coated Carbide Inserts. Mater. Today Proc. 2020, 22, 1409–1416. [Google Scholar] [CrossRef]
  35. La Fé-Perdomo, I.; Ramos-Grez, J.; Mujica, R.; Rivas, M. Surface Roughness Ra Prediction in Selective Laser Melting of 316L Stainless Steel by Means of Artificial Intelligence Inference. J. King Saud Univ. Eng. Sci. 2021. [Google Scholar] [CrossRef]
  36. Li, W.; Chen, F.; Ai, Z.; Zhang, C.; Wang, C.; Li, Y.; Zhang, Y. Influence of Molding Methods on the Polymer Pervious Concrete. IOP Conf. Ser. Earth Environ. Sci. 2021, 643, 012024. [Google Scholar] [CrossRef]
  37. Liu, T.; Wang, Z.; Zou, D.; Zhou, A.; Du, J. Strength Enhancement of Recycled Aggregate Pervious Concrete Using a Cement Paste Redistribution Method. Cem. Concr. Res. 2019, 122, 72–82. [Google Scholar] [CrossRef]
  38. Rao, Y.; Ding, Y.; Sarmah, A.K.; Liu, D.; Pan, B. Vertical Distribution of Pore-Aggregate-Cement Paste in Statically Compacted Pervious Concrete. Constr. Build. Mater. 2020, 237, 117605. [Google Scholar] [CrossRef]
  39. Lederle, R.; Shepard, T.; De La Vega Meza, V. Comparison of Methods for Measuring Infiltration Rate of Pervious Concrete. Constr. Build. Mater. 2020, 244, 118339. [Google Scholar] [CrossRef]
  40. Zhang, Y. Study on the Microstructure and Rheological Properties of Cement-Chemical Admixtures-Water Dispersion System at Early Stage. Ph.D. Thesis, Tsinghua University, Beijing, China, 2014. [Google Scholar]
  41. Cao, E.; Zhang, Y.; Kong, X. Microstructure Model of Fresh Cement Paste with Superplasticizer Incorporated. Concrete 2012, 37–40. [Google Scholar] [CrossRef]
  42. Ben Aicha, M. The Superplasticizer Effect on the Rheological and Mechanical Properties of Self-Compacting Concrete. In New Materials in Civil Engineering; Butterworth-Heinemann: Oxford, UK, 2020; pp. 315–331. [Google Scholar] [CrossRef]
  43. Shui, L.; Sun, Z.; Yang, H.; Yang, X.; Ji, Y.; Luo, Q. Experimental Evidence for a Possible Dispersion Mechanism of Polycarboxylate-Type Superplasticisers. Adv. Cem. Res. 2016, 28, 287–297. [Google Scholar] [CrossRef]
  44. Zhang, L.; Wang, D.; Zhang, W.; Piao, C. Observation of the Multi-Level Flocculation Structures of Fresh Cement Pastes by Confocal Laser Scanning Microscope. J. Chin. Electron Microsc. Soc. 2013, 32, 231–236. [Google Scholar]
  45. Shui, L.; Yang, H.; Sun, Z.; He, Y.; Zeng, W. Research Progress on Working Mechanism of Polycarboxylate Superplasticizer. J. Build. Mater. 2020, 23, 64–69,76. [Google Scholar]
  46. Hong, L. Influence of Surface Roughness and Shape of Coarse Aggregates on Mechanical Properties of Concrete. Ph.D. Thesis, Tongji University, Shanghai, China, 2014. [Google Scholar]
  47. Huang, J.; Luo, Z.; Khan, M.B.E. Impact of Aggregate Type and Size and Mineral Admixtures on the Properties of Pervious Concrete: An Experimental Investigation. Constr. Build. Mater. 2020, 265, 120759. [Google Scholar] [CrossRef]
  48. Bonicelli, A.; Arguelles, G.M.; Pumarejo, L.G.F. Improving Pervious Concrete Pavements for Achieving More Sustainable Urban Roads. Procedia Eng. 2016, 161, 1568–1573. [Google Scholar] [CrossRef] [Green Version]
  49. Lian, C.; Zhuge, Y. Optimum Mix Design of Enhanced Permeable Concrete—An Experimental Investigation. Constr. Build. Mater. 2010, 24, 2664–2671. [Google Scholar] [CrossRef]
  50. Ćosić, K.; Korat, L.; Ducman, V.; Netinger, I. Influence of Aggregate Type and Size on Properties of Pervious Concrete. Constr. Build. Mater. 2015, 78, 69–76. [Google Scholar] [CrossRef]
  51. Zhang, F.; Li, N.; Guo, M.; Chi, X. Coarse Aggregate Effects on Compressive Strength and Permeability Coefficient of Non-Fine Concrete. Electron. J. Geotech. Eng. 2014, 19, 8905–8913. [Google Scholar]
  52. Tan, X.; Deng, J. Grey Correlation Analysis: A New Method of Multivariate Statistical Analysis. Stat. Res. 1995, 12, 46–48. [Google Scholar]
  53. Tan, X.; Deng, J. Grey Relational Analysis: A New Statistical Method of Multifactorial Analysis in Medicine. J. Xian Med. Univ. 1997, 9, 59–65. [Google Scholar]
  54. Tan, X.; Deng, J.; Pan, H.; Liu, S. Grey System and Grey Data Management in Medicine. In Proceedings of the IEEE International Conference on Grey Systems & Intelligent Services, Nanjing, China, 18–20 November 2007. [Google Scholar]
Figure 1. Vibration polishing machine to produce aggregates with different roughness.
Buildings 13 00380 g001
Figure 2. Four groups of aggregates with different roughness.
Buildings 13 00380 g002
Figure 3. The calculation process of Ra.
Buildings 13 00380 g003
Figure 4. The production process of the specimens. (a) Pour out the fresh mixture from the mixer; (b) put the fresh mixture into the mold and poke the mixture manually; (c) flatten the specimen surface; (d) demold the specimens.
Buildings 13 00380 g004
Figure 5. Extraction of the perimeter of aggregate.
Buildings 13 00380 g005
Figure 6. Extraction of the area of cement paste. (a) Filling CaCO3 powder into pores; (b) the cement paste is selected in the image.
Buildings 13 00380 g006
Figure 7. Change law of PCT under the action of water–cement ratio. Error bars are standard deviations based on 4 replicates.
Buildings 13 00380 g007
Figure 8. Shape changes of paste-coating under the action of water–cement ratio.
Buildings 13 00380 g008
Figure 9. Change law of PCT under the action of superplasticizer dosage. Error bars are standard deviations based on 4 replicates.
Buildings 13 00380 g009
Figure 10. Blockage at the bottom of the PC sample.
Buildings 13 00380 g010
Figure 11. Change law of PCT under the action of aggregate roughness index Ra. Error bars are standard deviations based on 4 replicates.
Buildings 13 00380 g011
Figure 12. Change law of PCT under the action of aggregate size. Error bars are standard deviations based on 4 replicates.
Buildings 13 00380 g012
Figure 13. Prediction of the PCT under the change of water–cement ratio, superplasticizer dosage and aggregate size (the default aggregate roughness Ra is 342 μm). (a) aggregate size ranges from 5–10 mm; (b) aggregate size ranges from 10–15 mm; (c) aggregate size ranges from 15–20 mm.
Buildings 13 00380 g013
Table 1. Chemical composition of cement.
ComponentsMass Ratio (%)
CaO51.42
SiO224.99
Al2O38.26
Fe2O34.03
MgO3.71
SO32.51
Loss on ignition3.31
Table 2. Properties of aggregate.
Aggregate Size
(mm)
Apparent Density
(kg/m3)
Bulk Density
(kg/m3)
Void Content
(%)
5–102857175538.57
10–15173339.34
15–20169140.81
Table 3. Polishing parameter of four groups of aggregates.
GroupMesh Number of EmerySize of Ceramic Abrasive Time of Polishing (Hour)Ra 1
(μm)
R1-3 × 3 mm
Regular tri-prism
-342
R224024209
R340024121
R48002452
1 Ra is calculated from Equation (1).
Table 4. Mixture proportion designs of the experiment.
GroupWater–Cement RatioSuperplasticizer Dosage
(%)
Aggregate Size
(mm)
Ra
(μm)
W/C 10.280.1%10–15342
W/C_20.30
W/C_30.32
W/C_40.34
W/C_50.36
SP_10.28010–15342
SP_20.10%
SP_30.20%
SP_40.30%
SP_50.50%
Size_10.360.1%5–10342
Size_210–15
Size_315–20
R10.360.1%10–15342
R2209
R3121
R452
Table 5. The grey correlation coefficient ξ i k and grey correlation degree γ i of each comparison sequence.
XiX1
Water–Cement Ratio
X2
Superplasticizer Dosage
X3
Aggregate Roughness
X4
Aggregate Size
ξ i k 0.5201.0000.3780.544
0.5330.9560.5420.558
0.5600.8790.7980.588
0.6070.7840.7910.640
0.5600.8790.3990.879
0.4550.7920.3430.337
0.6800.8220.3480.484
0.7500.6650.3650.518
0.9440.6040.4060.604
0.8310.4480.4570.725
0.6800.8220.3480.484
0.6090.8220.3480.484
0.5660.8540.3540.495
0.5420.9270.3650.518
γ i 0.6310.8040.4460.561
Table 6. Fitting parameters of the prediction model.
Standard
Error
p-ValueVIF
(Variance Inflation Factor)
D–W
(Durbin–Watson Test)
Intercept0.041510.000007-2.244
Aggregate roughness0.000030.0000991.352
Aggregate size0.001410.0001291.000
Superplasticizer dosage2.514120.0000001.232
Water–cement ratio0.093620.0016651.608
Disclaimer/Publisher’s Note: The statements, opinions and data contained in all publications are solely those of the individual author(s) and contributor(s) and not of MDPI and/or the editor(s). MDPI and/or the editor(s) disclaim responsibility for any injury to people or property resulting from any ideas, methods, instructions or products referred to in the content.

