

Study on the Applicable Room Size Dimension of Stratum Ventilation for Heating Based on Multi-Criteria Analytic Hierarchy Process-Entropy Weight Model

Abstract
:1. Introduction
2. Methodology
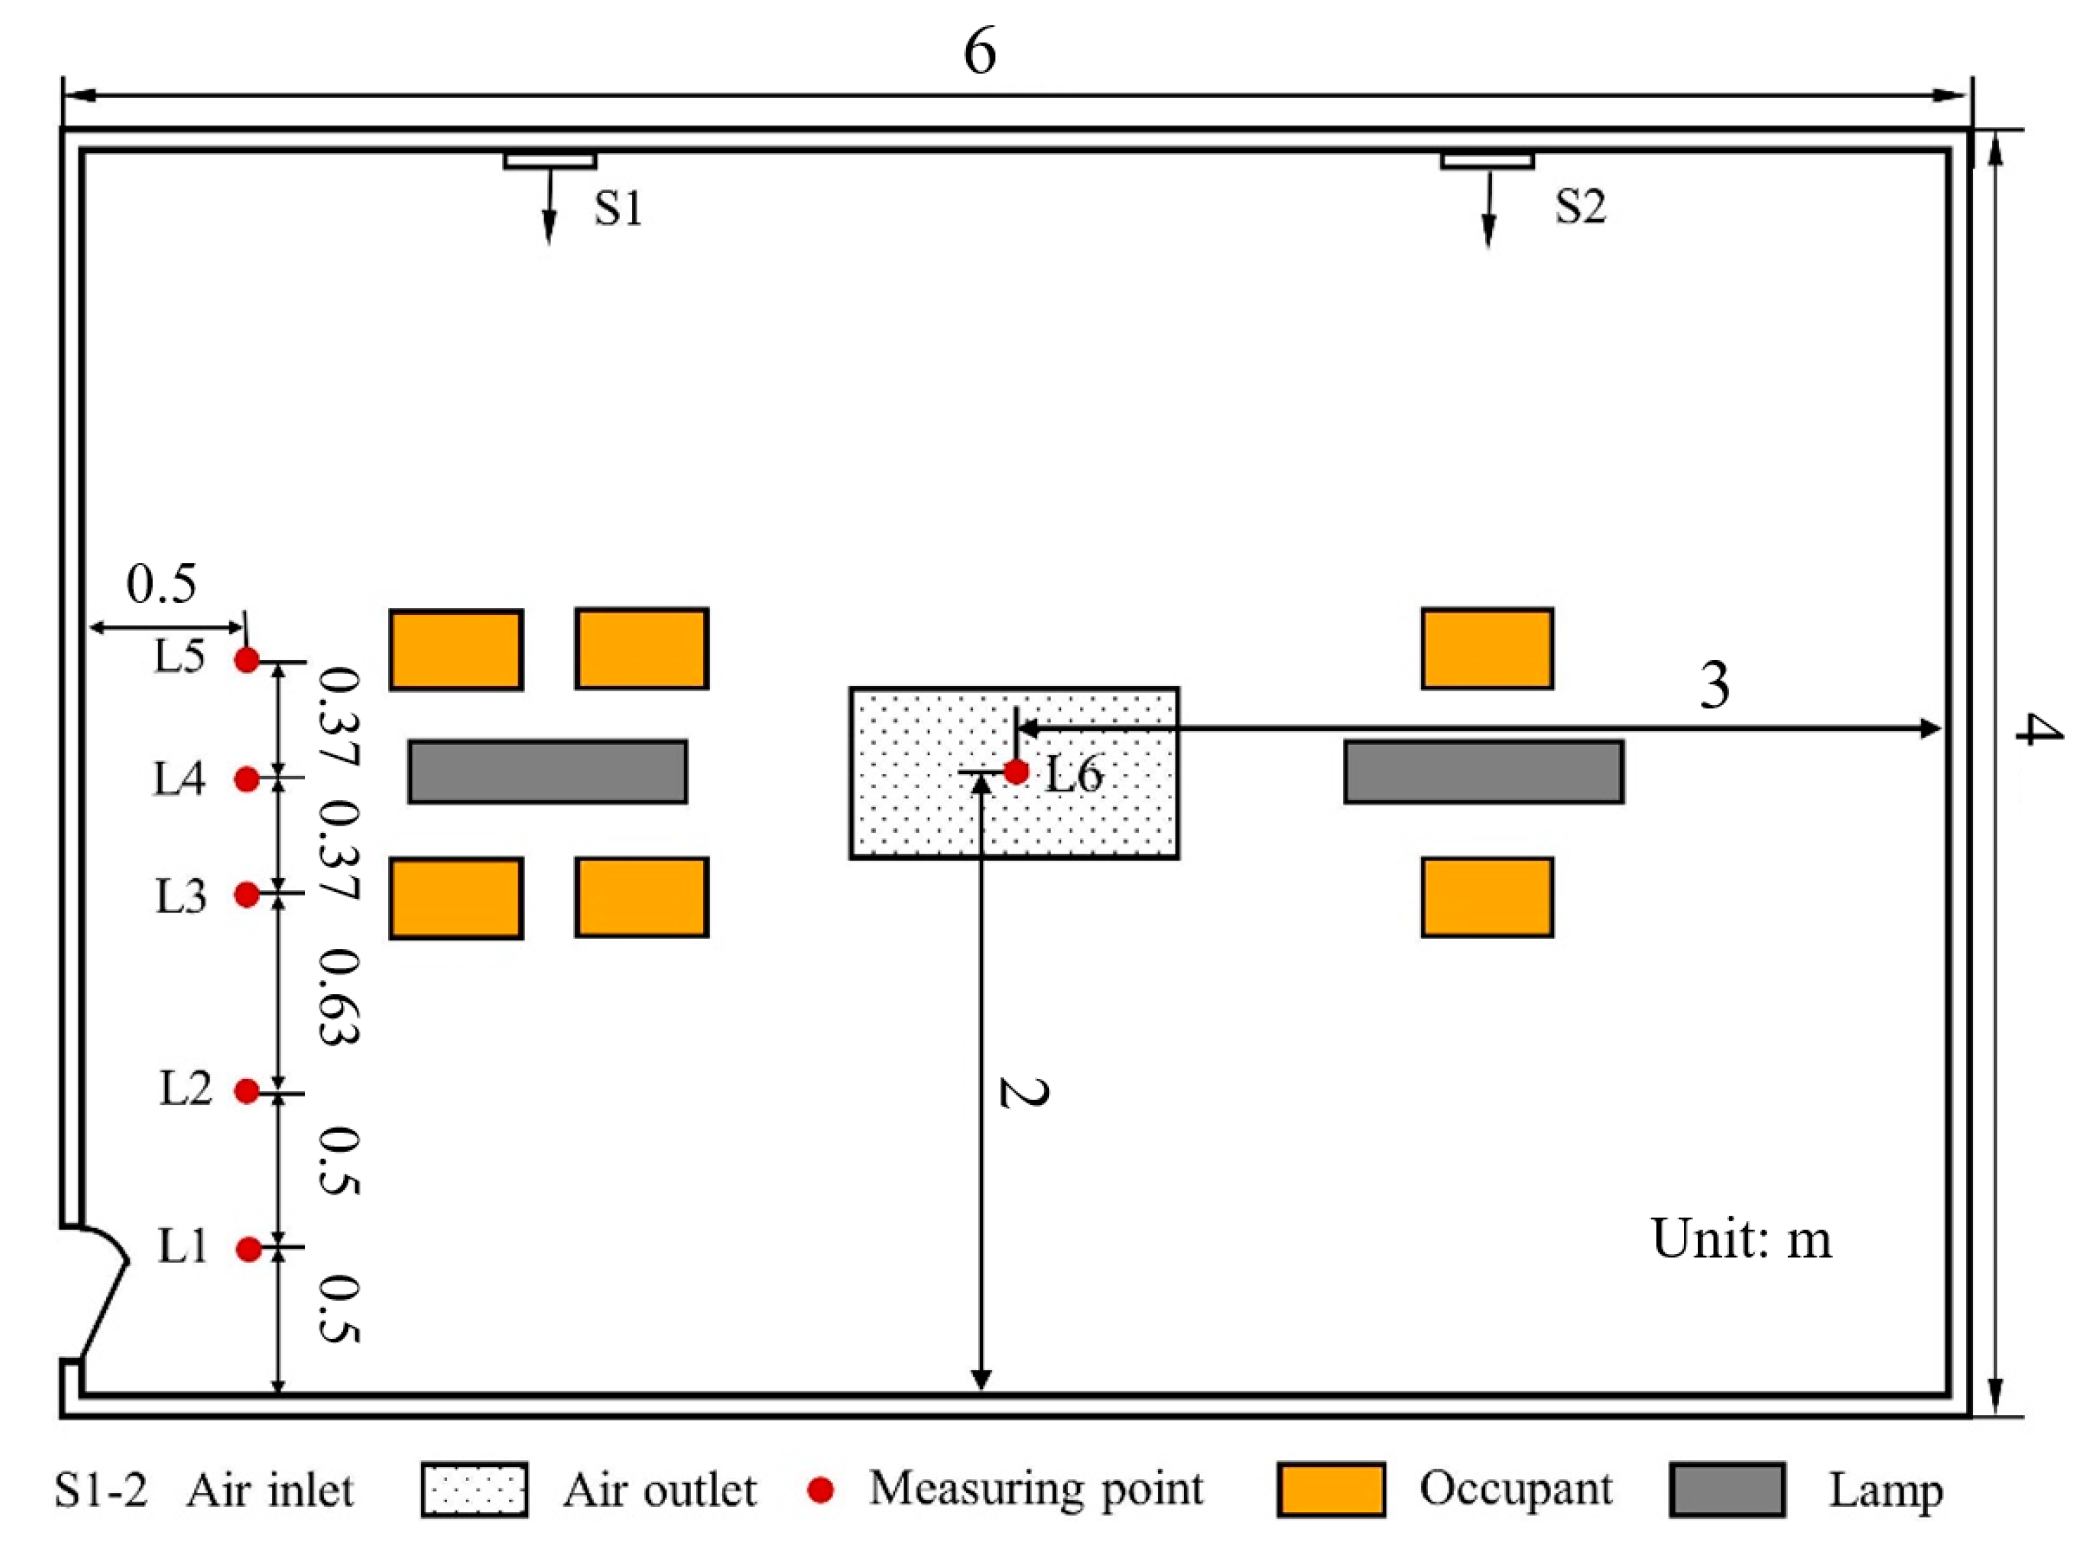
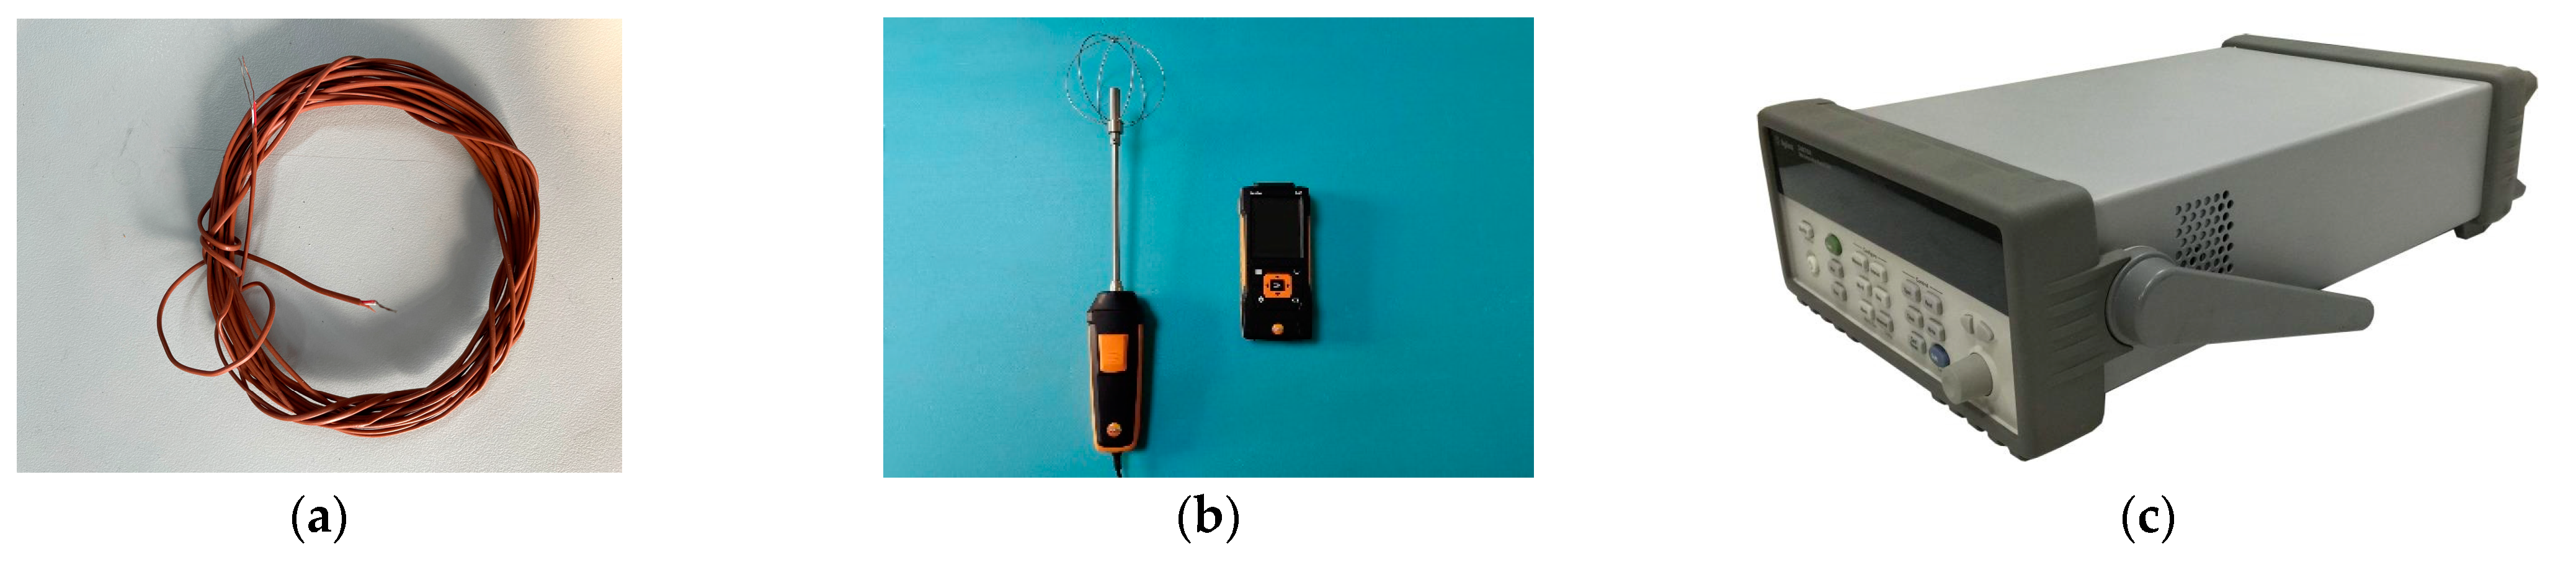
2.1. Experiment
2.2. Computational Fluid Dynamics (CFD) Simulation
2.2.1. Boundary Conditions
2.2.2. Mathematical Models
2.2.3. Grid-Independent Tests
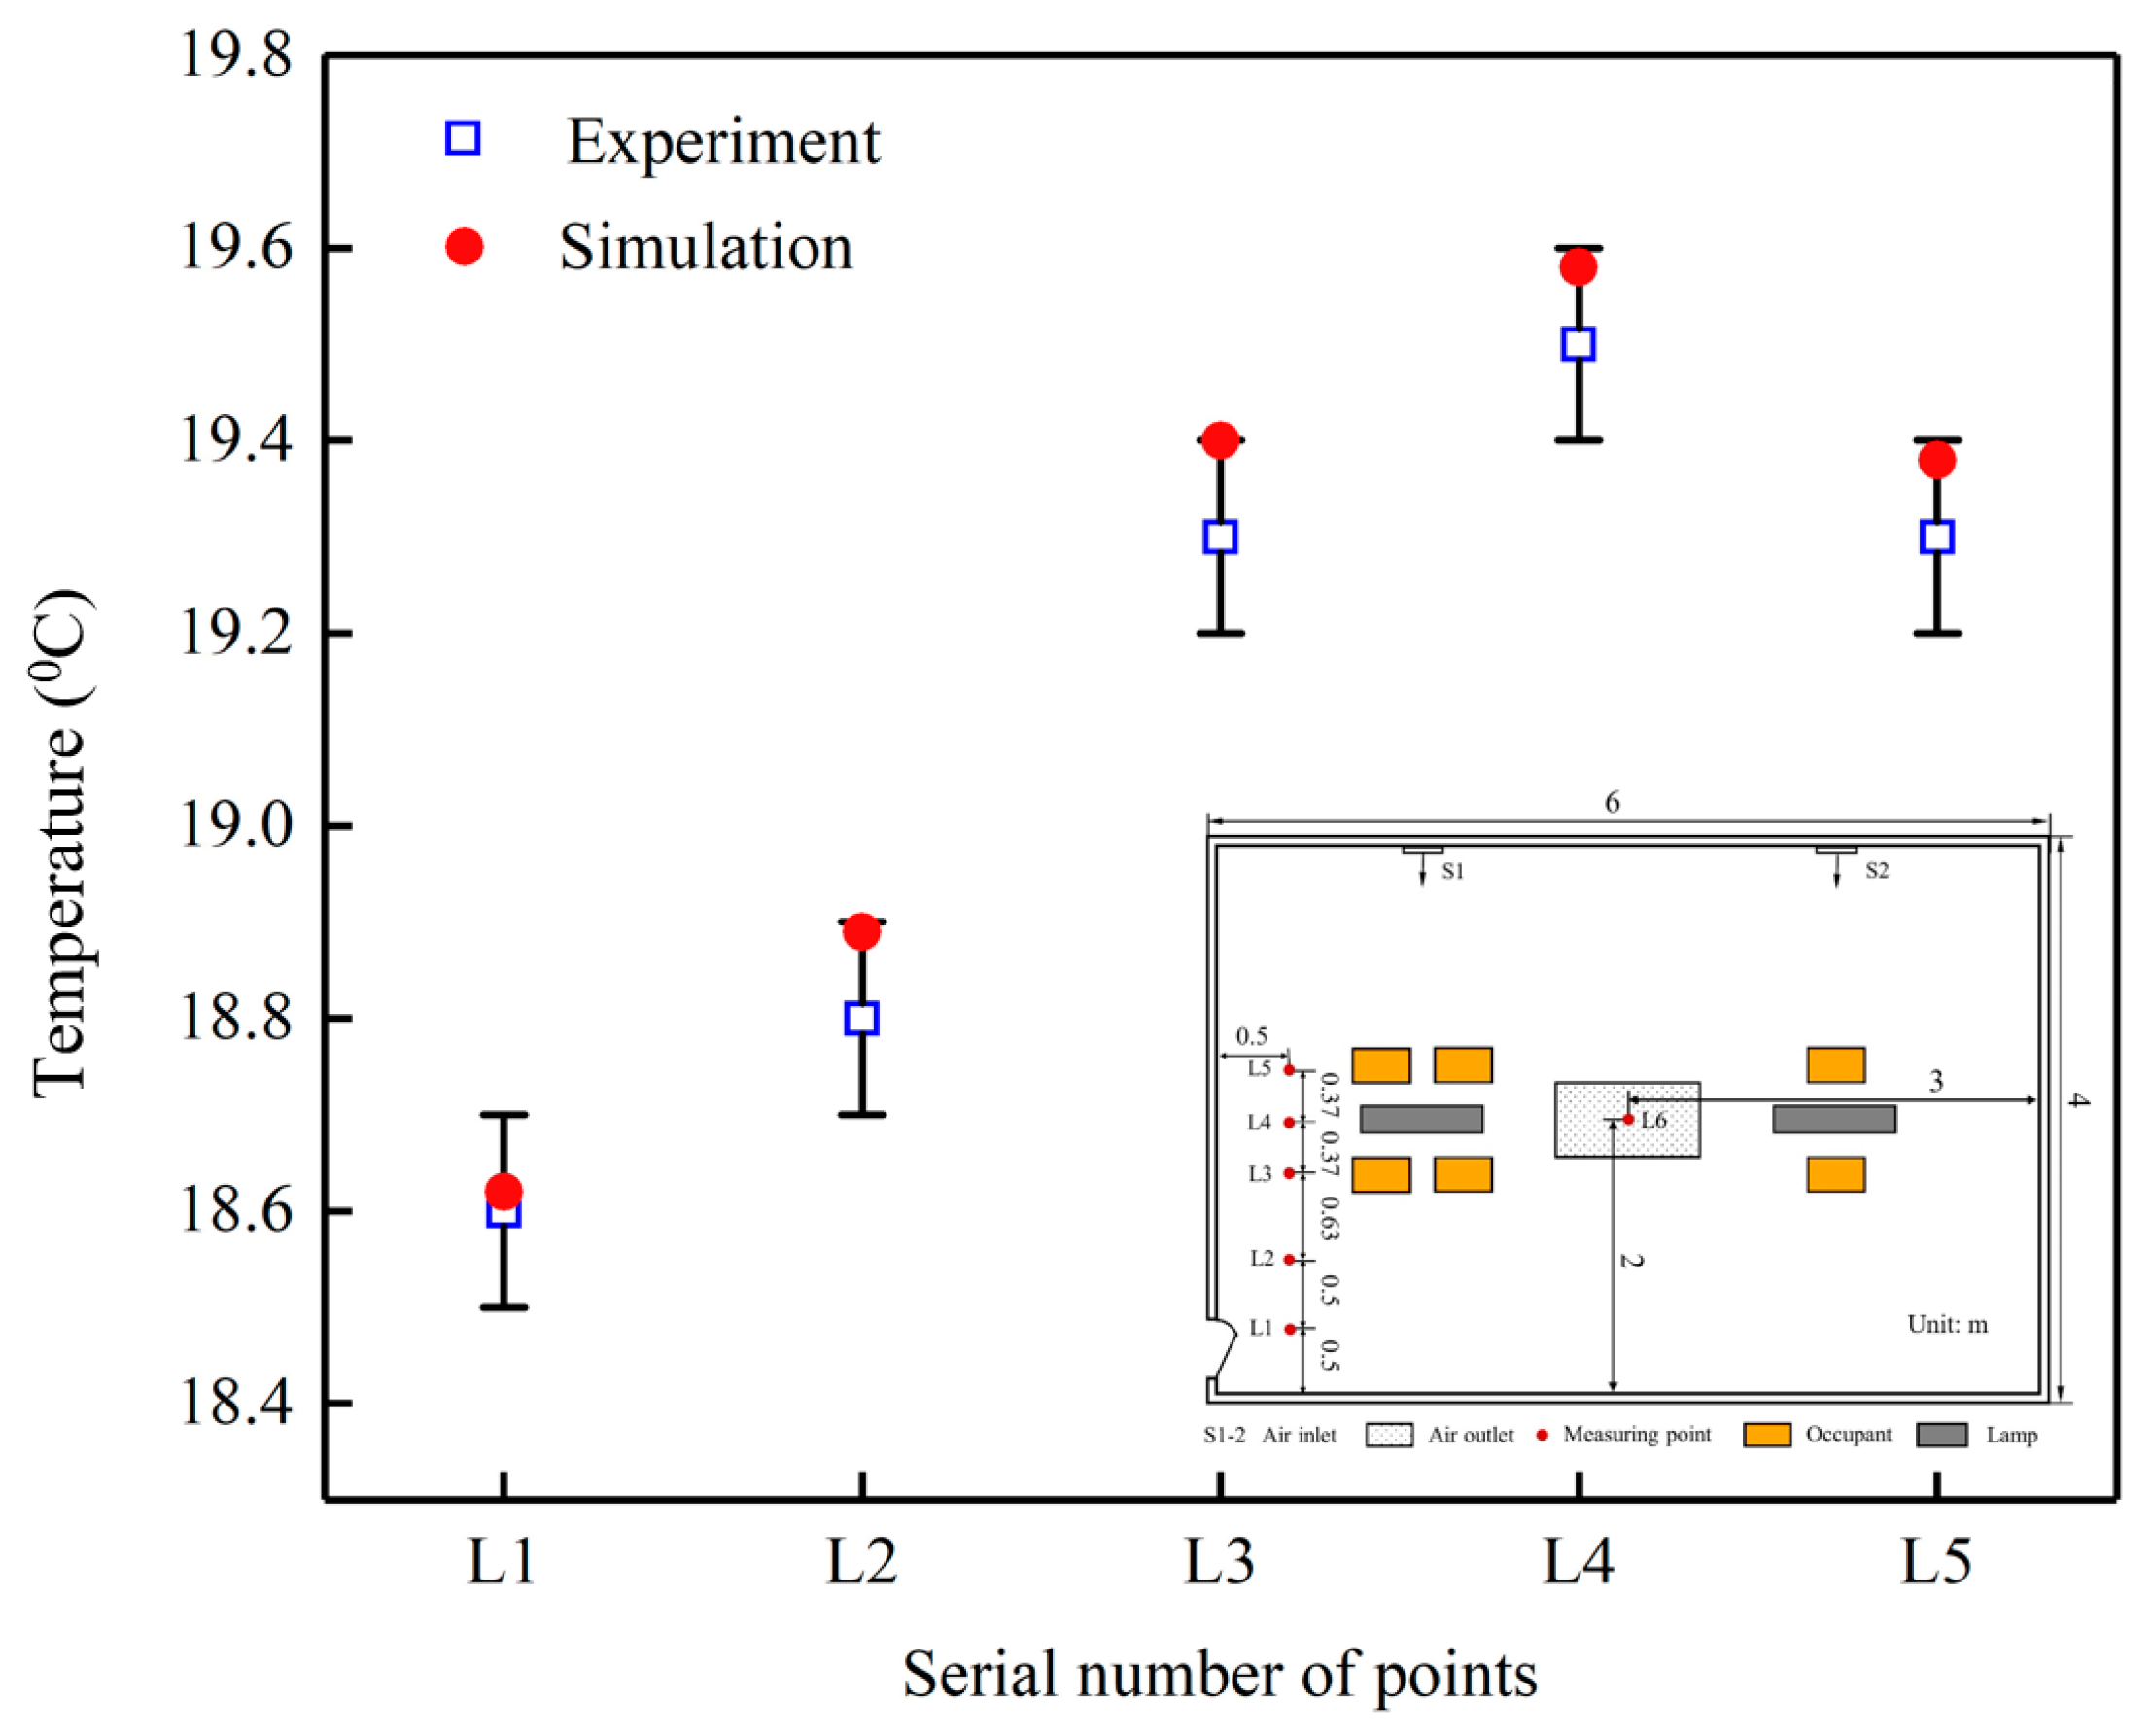
2.2.4. Simulation Validity Verification Method
2.3. Simulated Cases
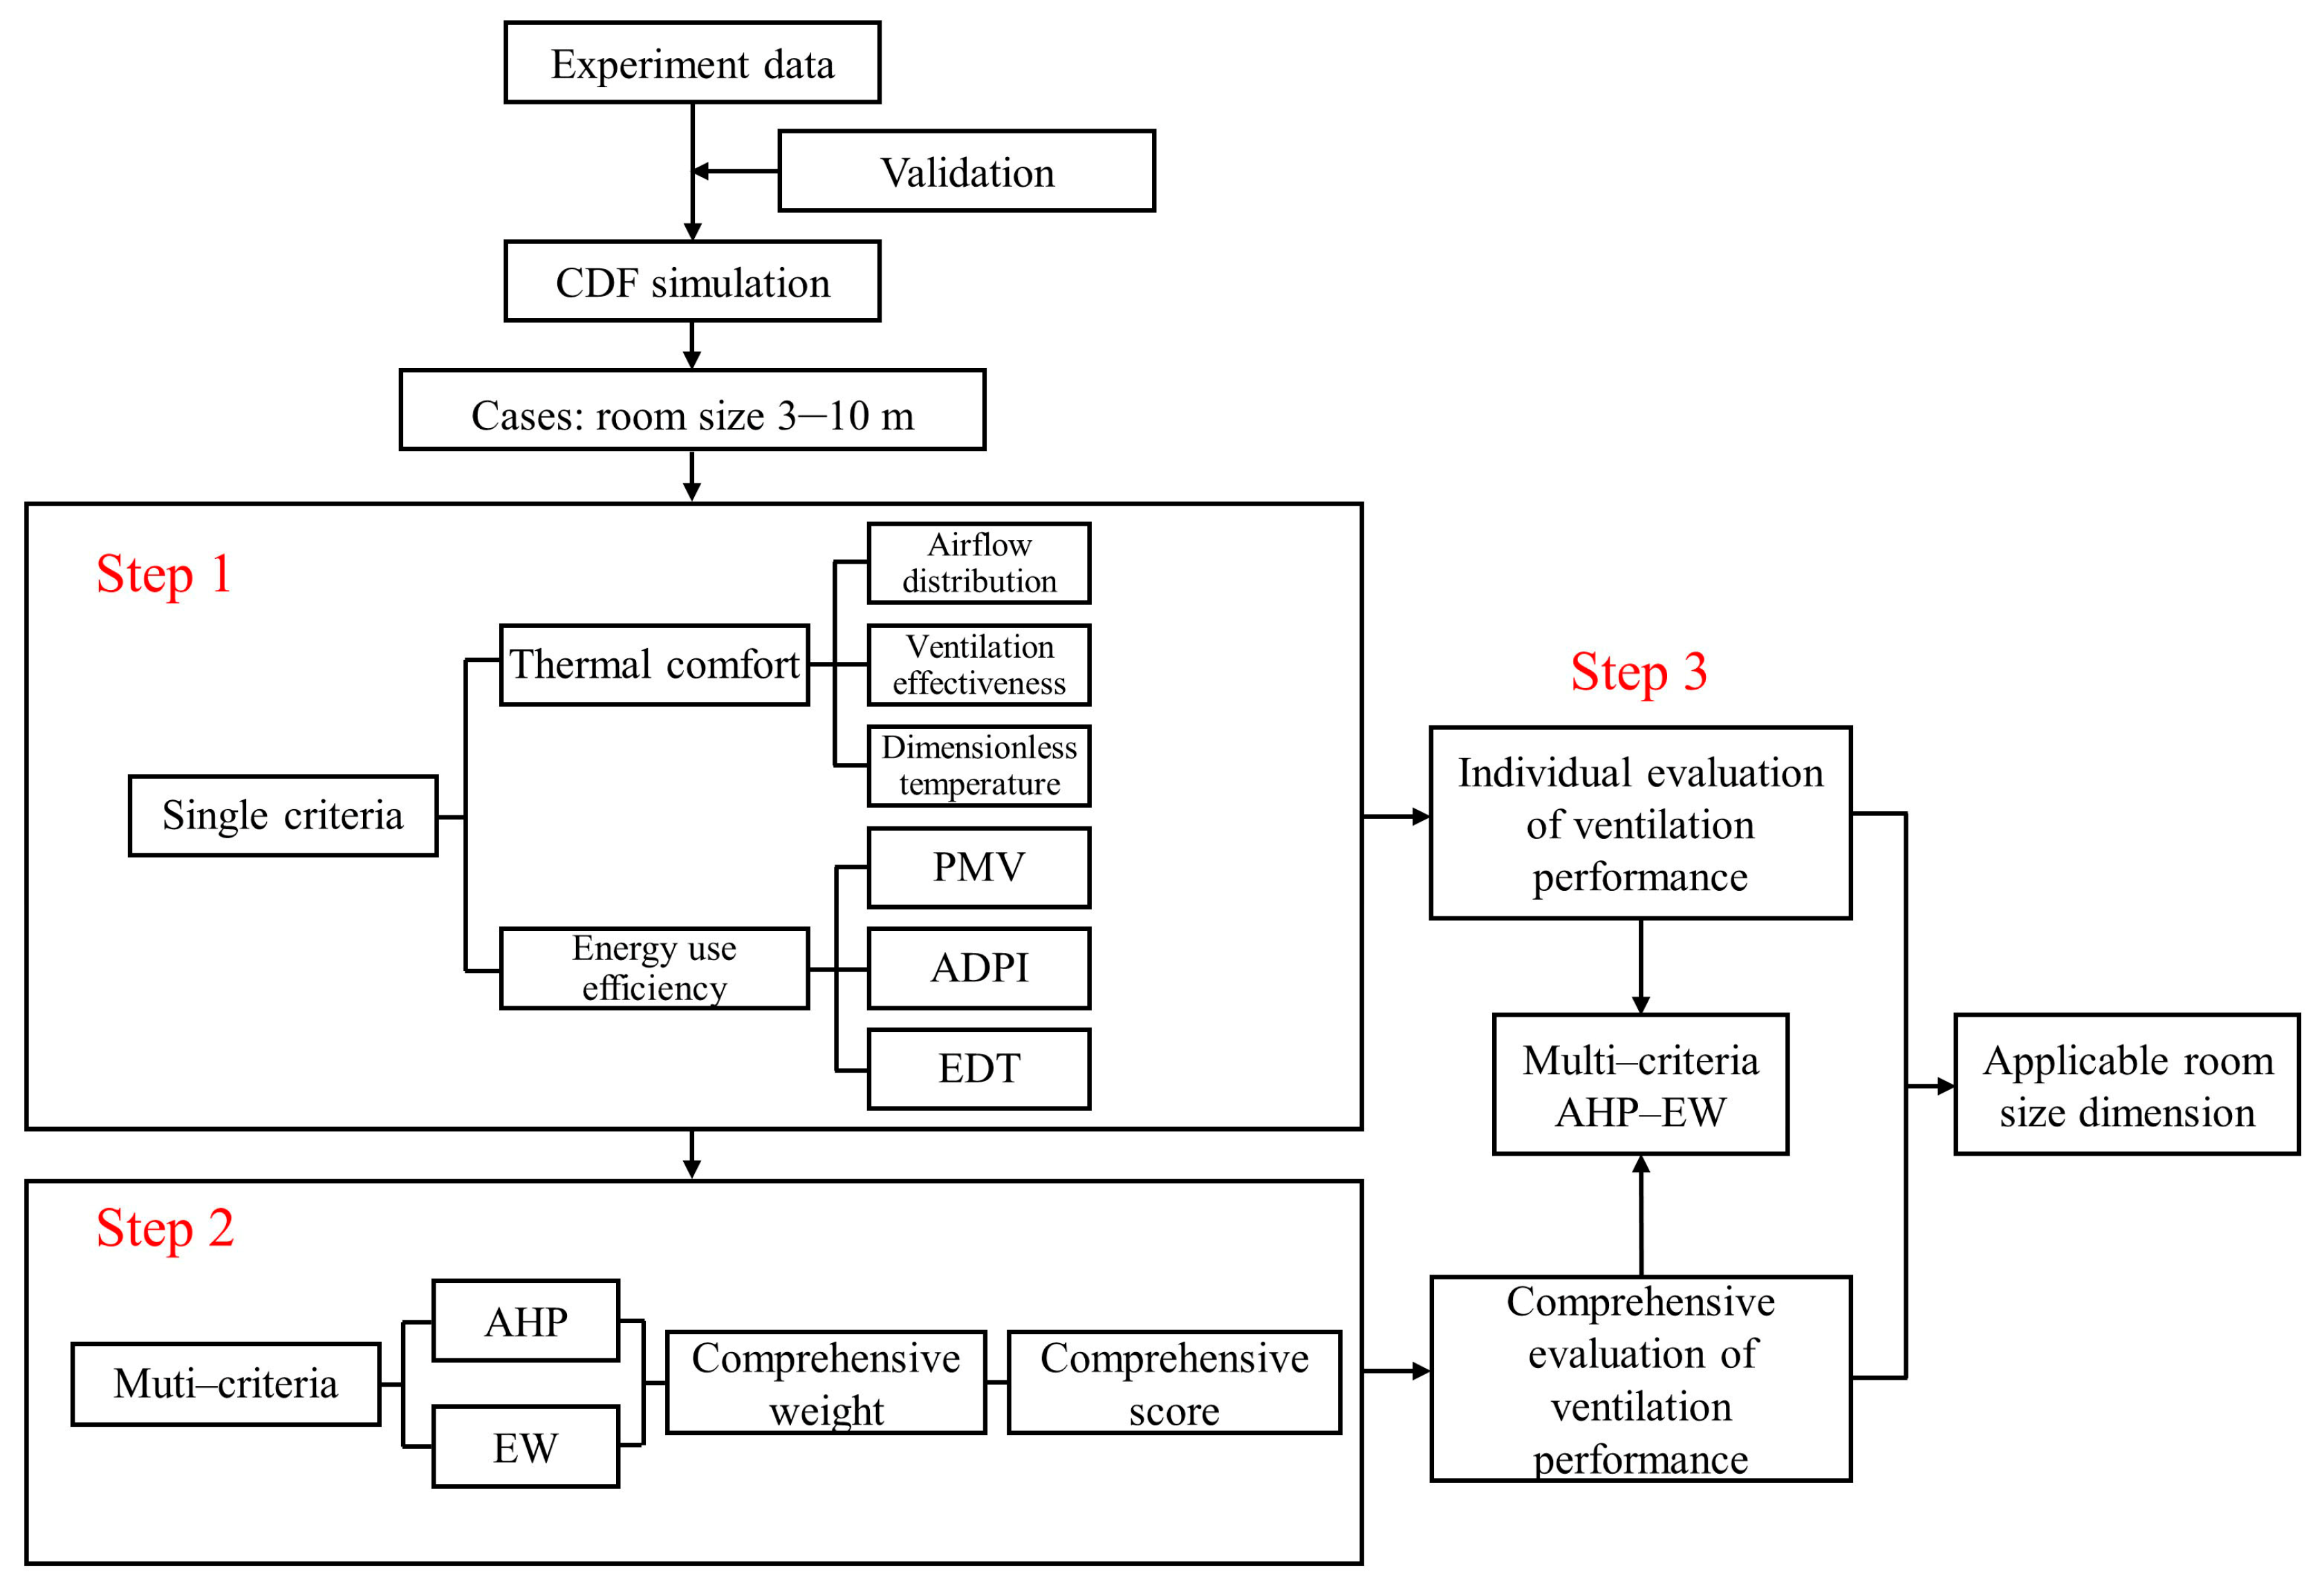
2.4. Ventilation Performance Evaluation Method
2.4.1. Single Criteria
- Energy use efficiency
- 2.
- Thermal comfort
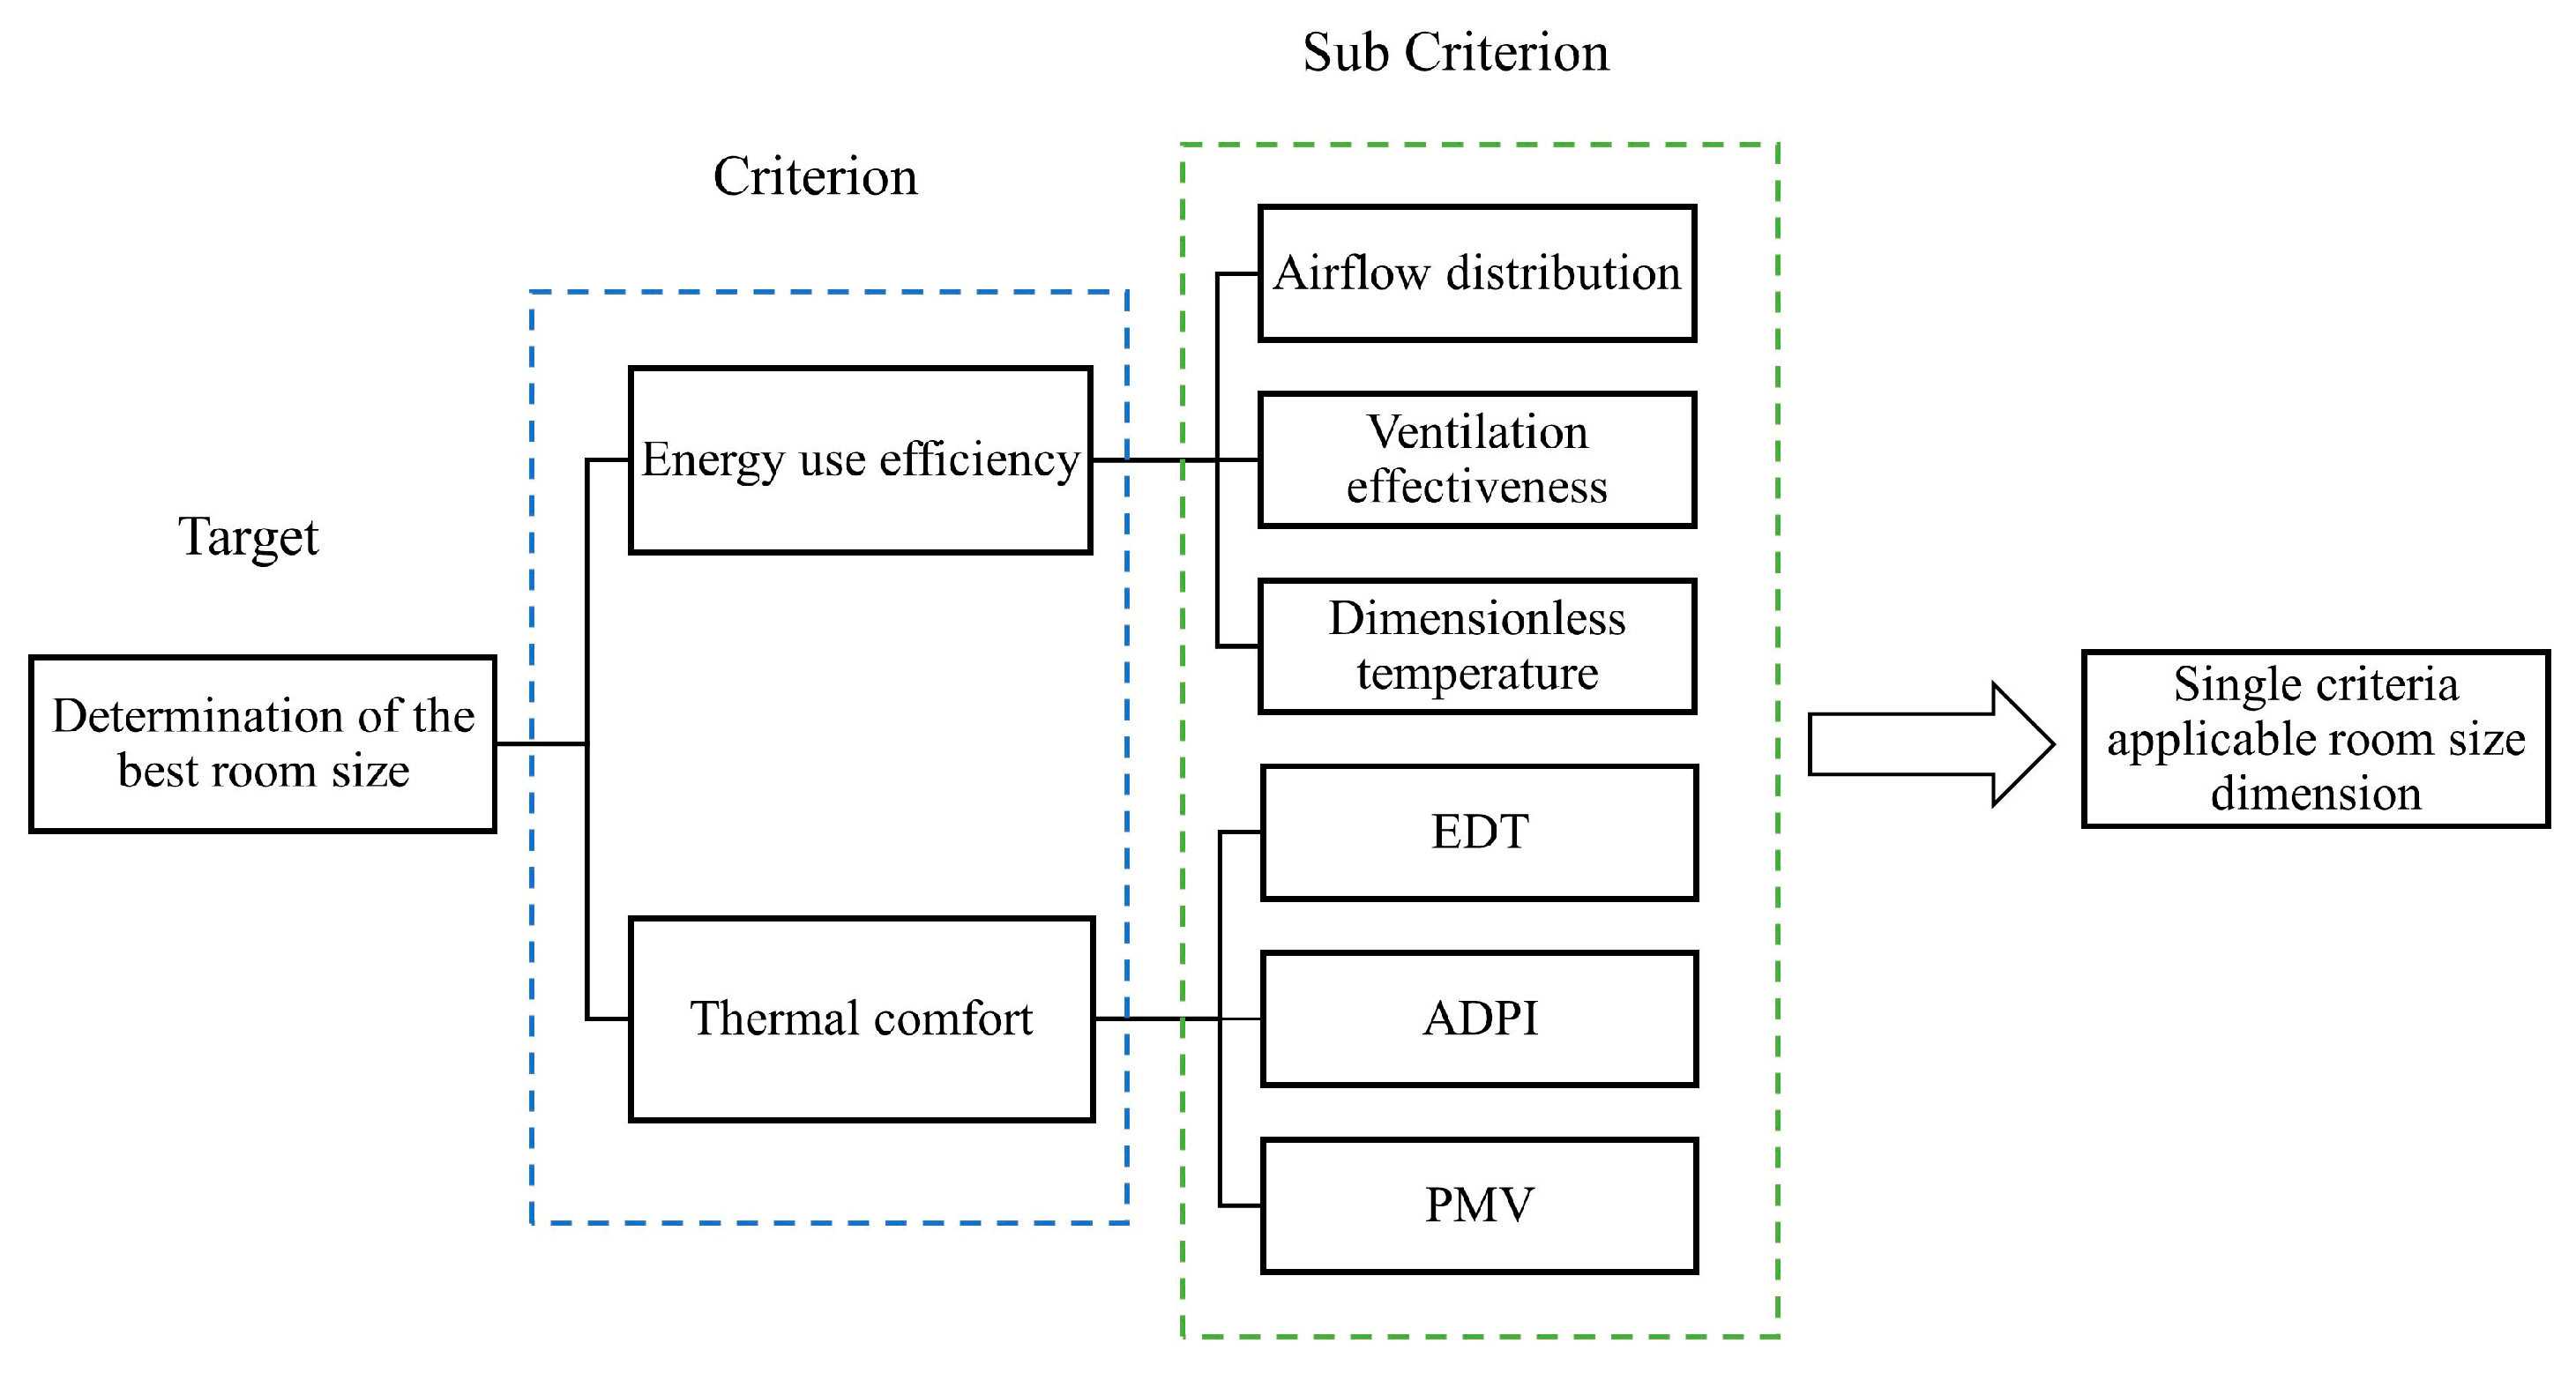
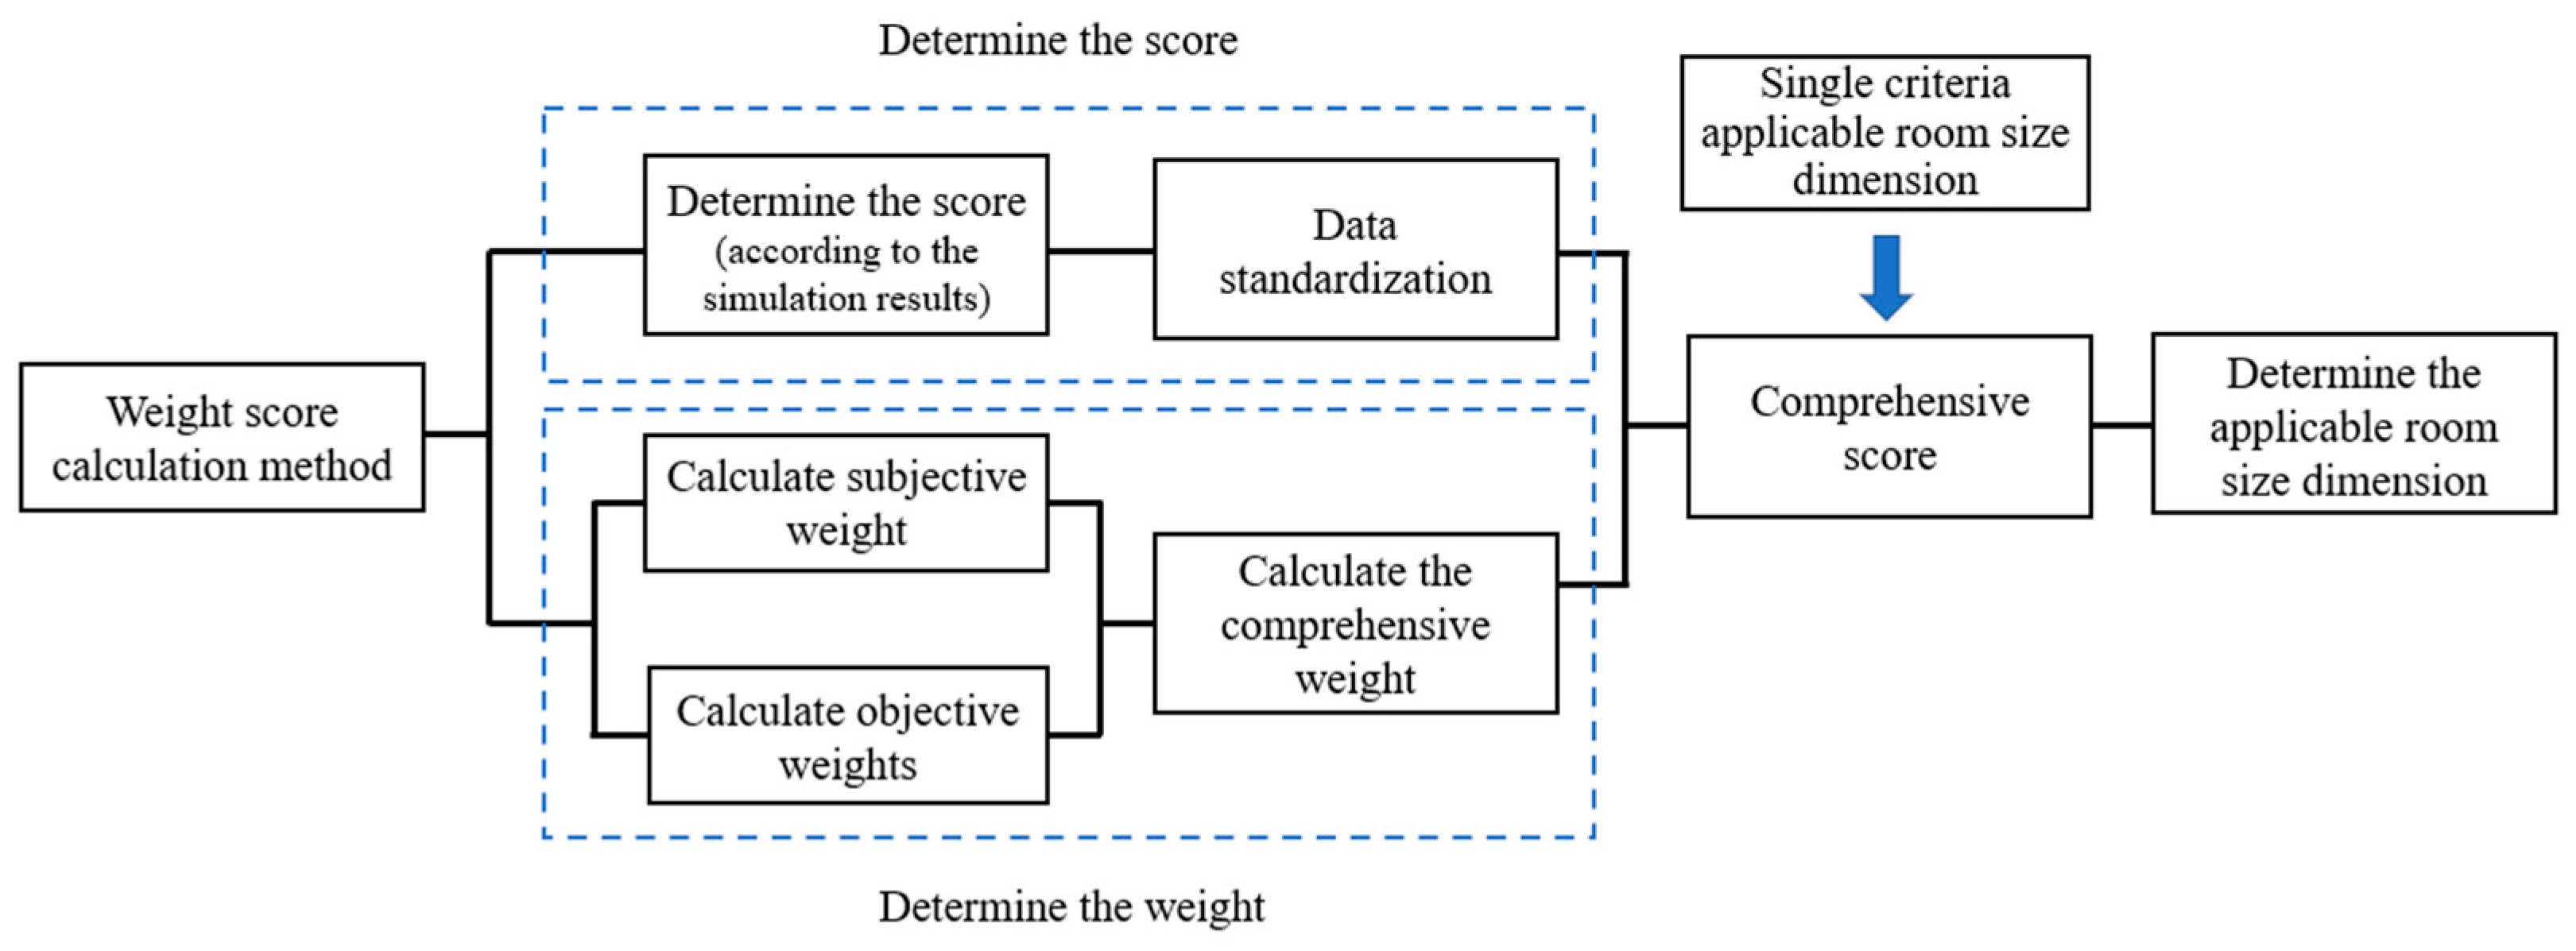
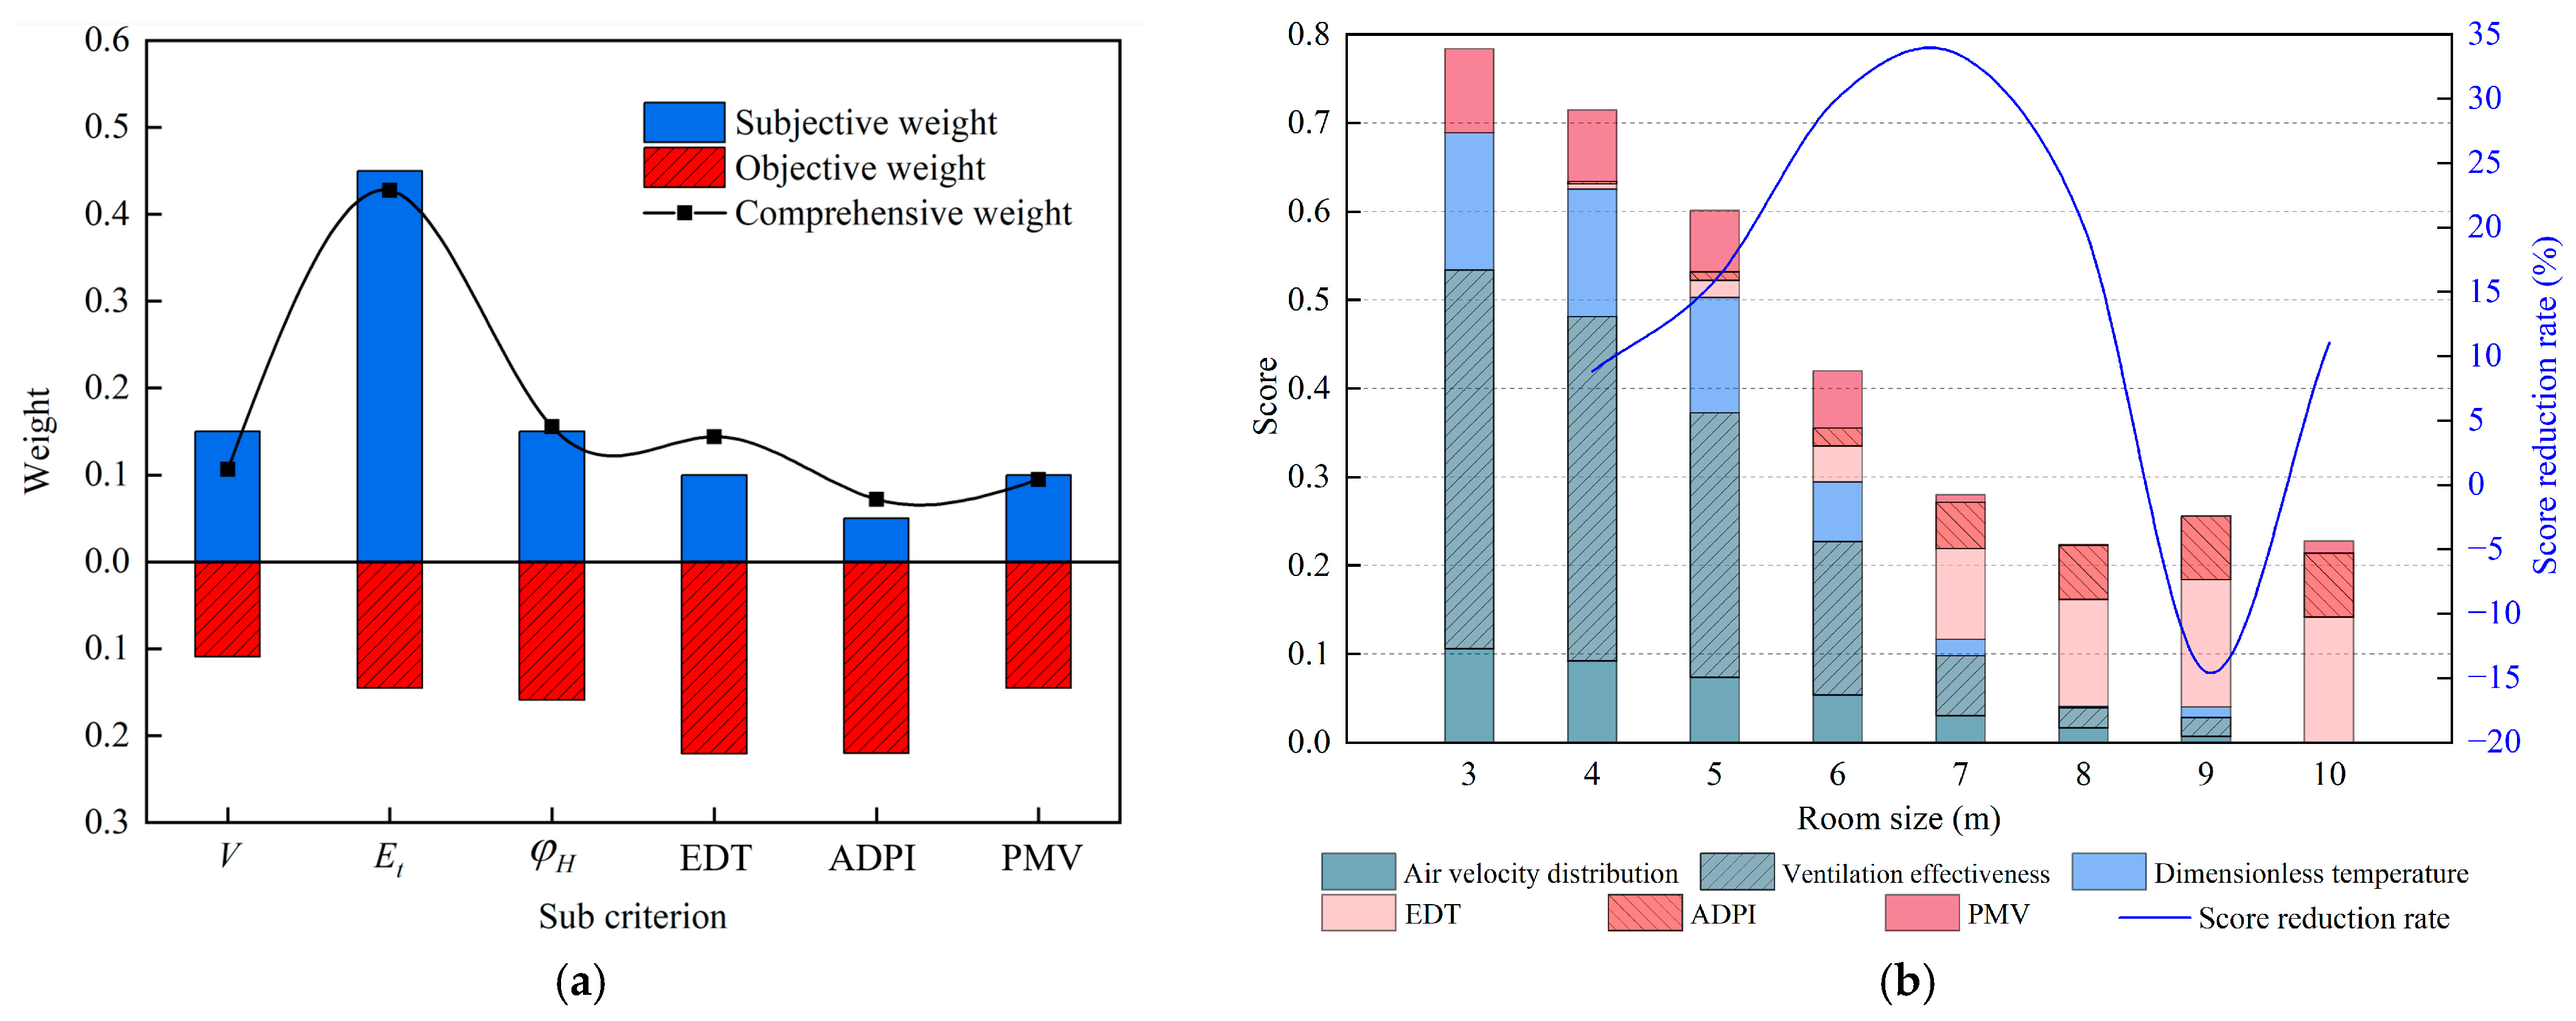
2.4.2. Multi-Criteria Analytic Hierarchy Process-Entropy Weight Method (AHP-EW Model)
3. Results and Discussion
3.1. Validation of CFD Simulations
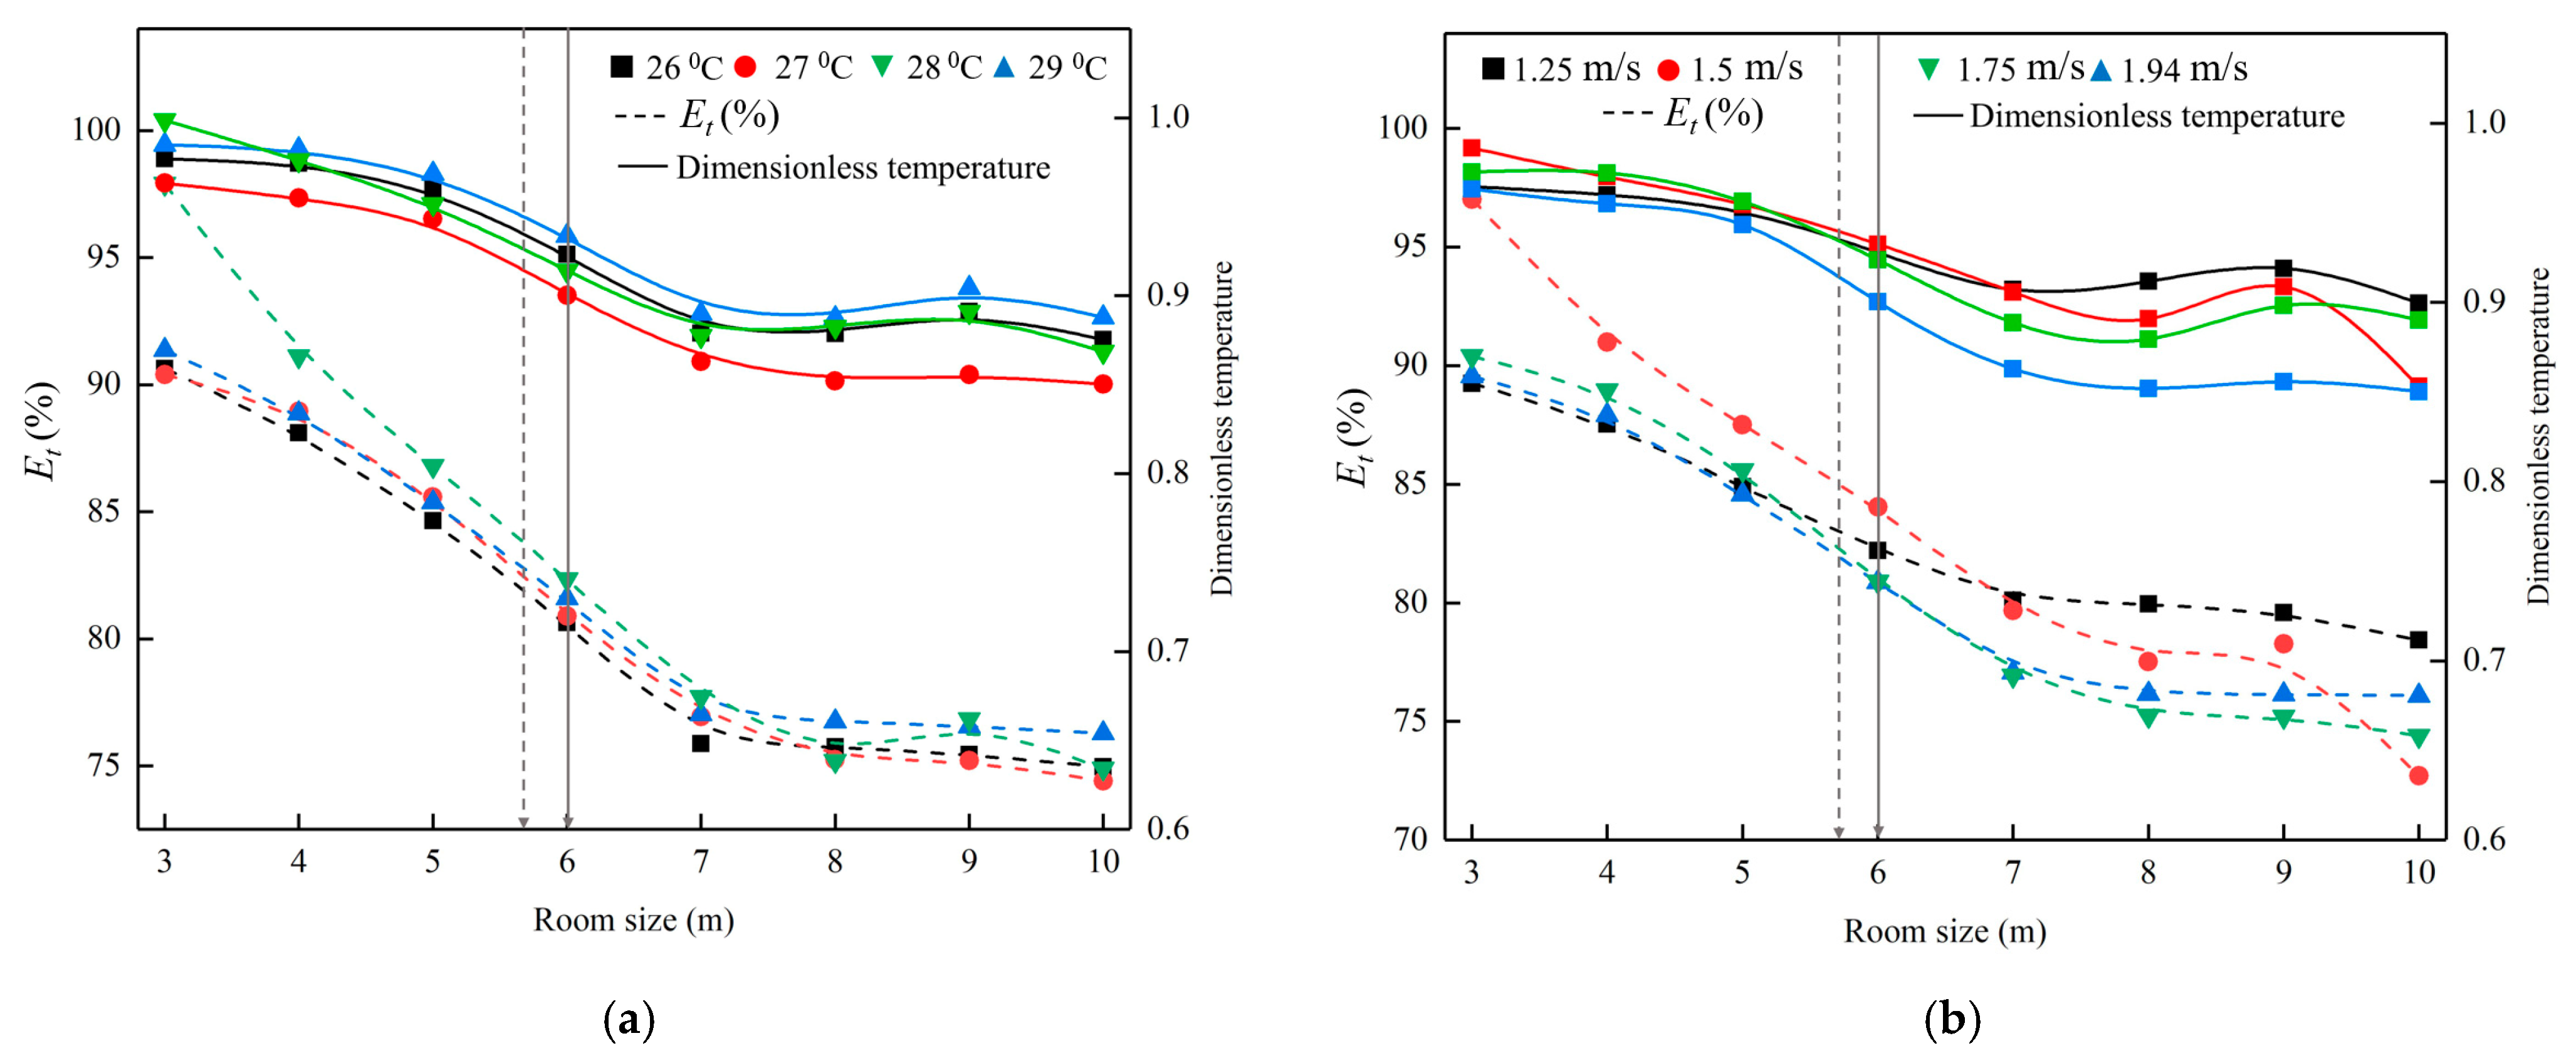
3.2. Energy Use Efficiency
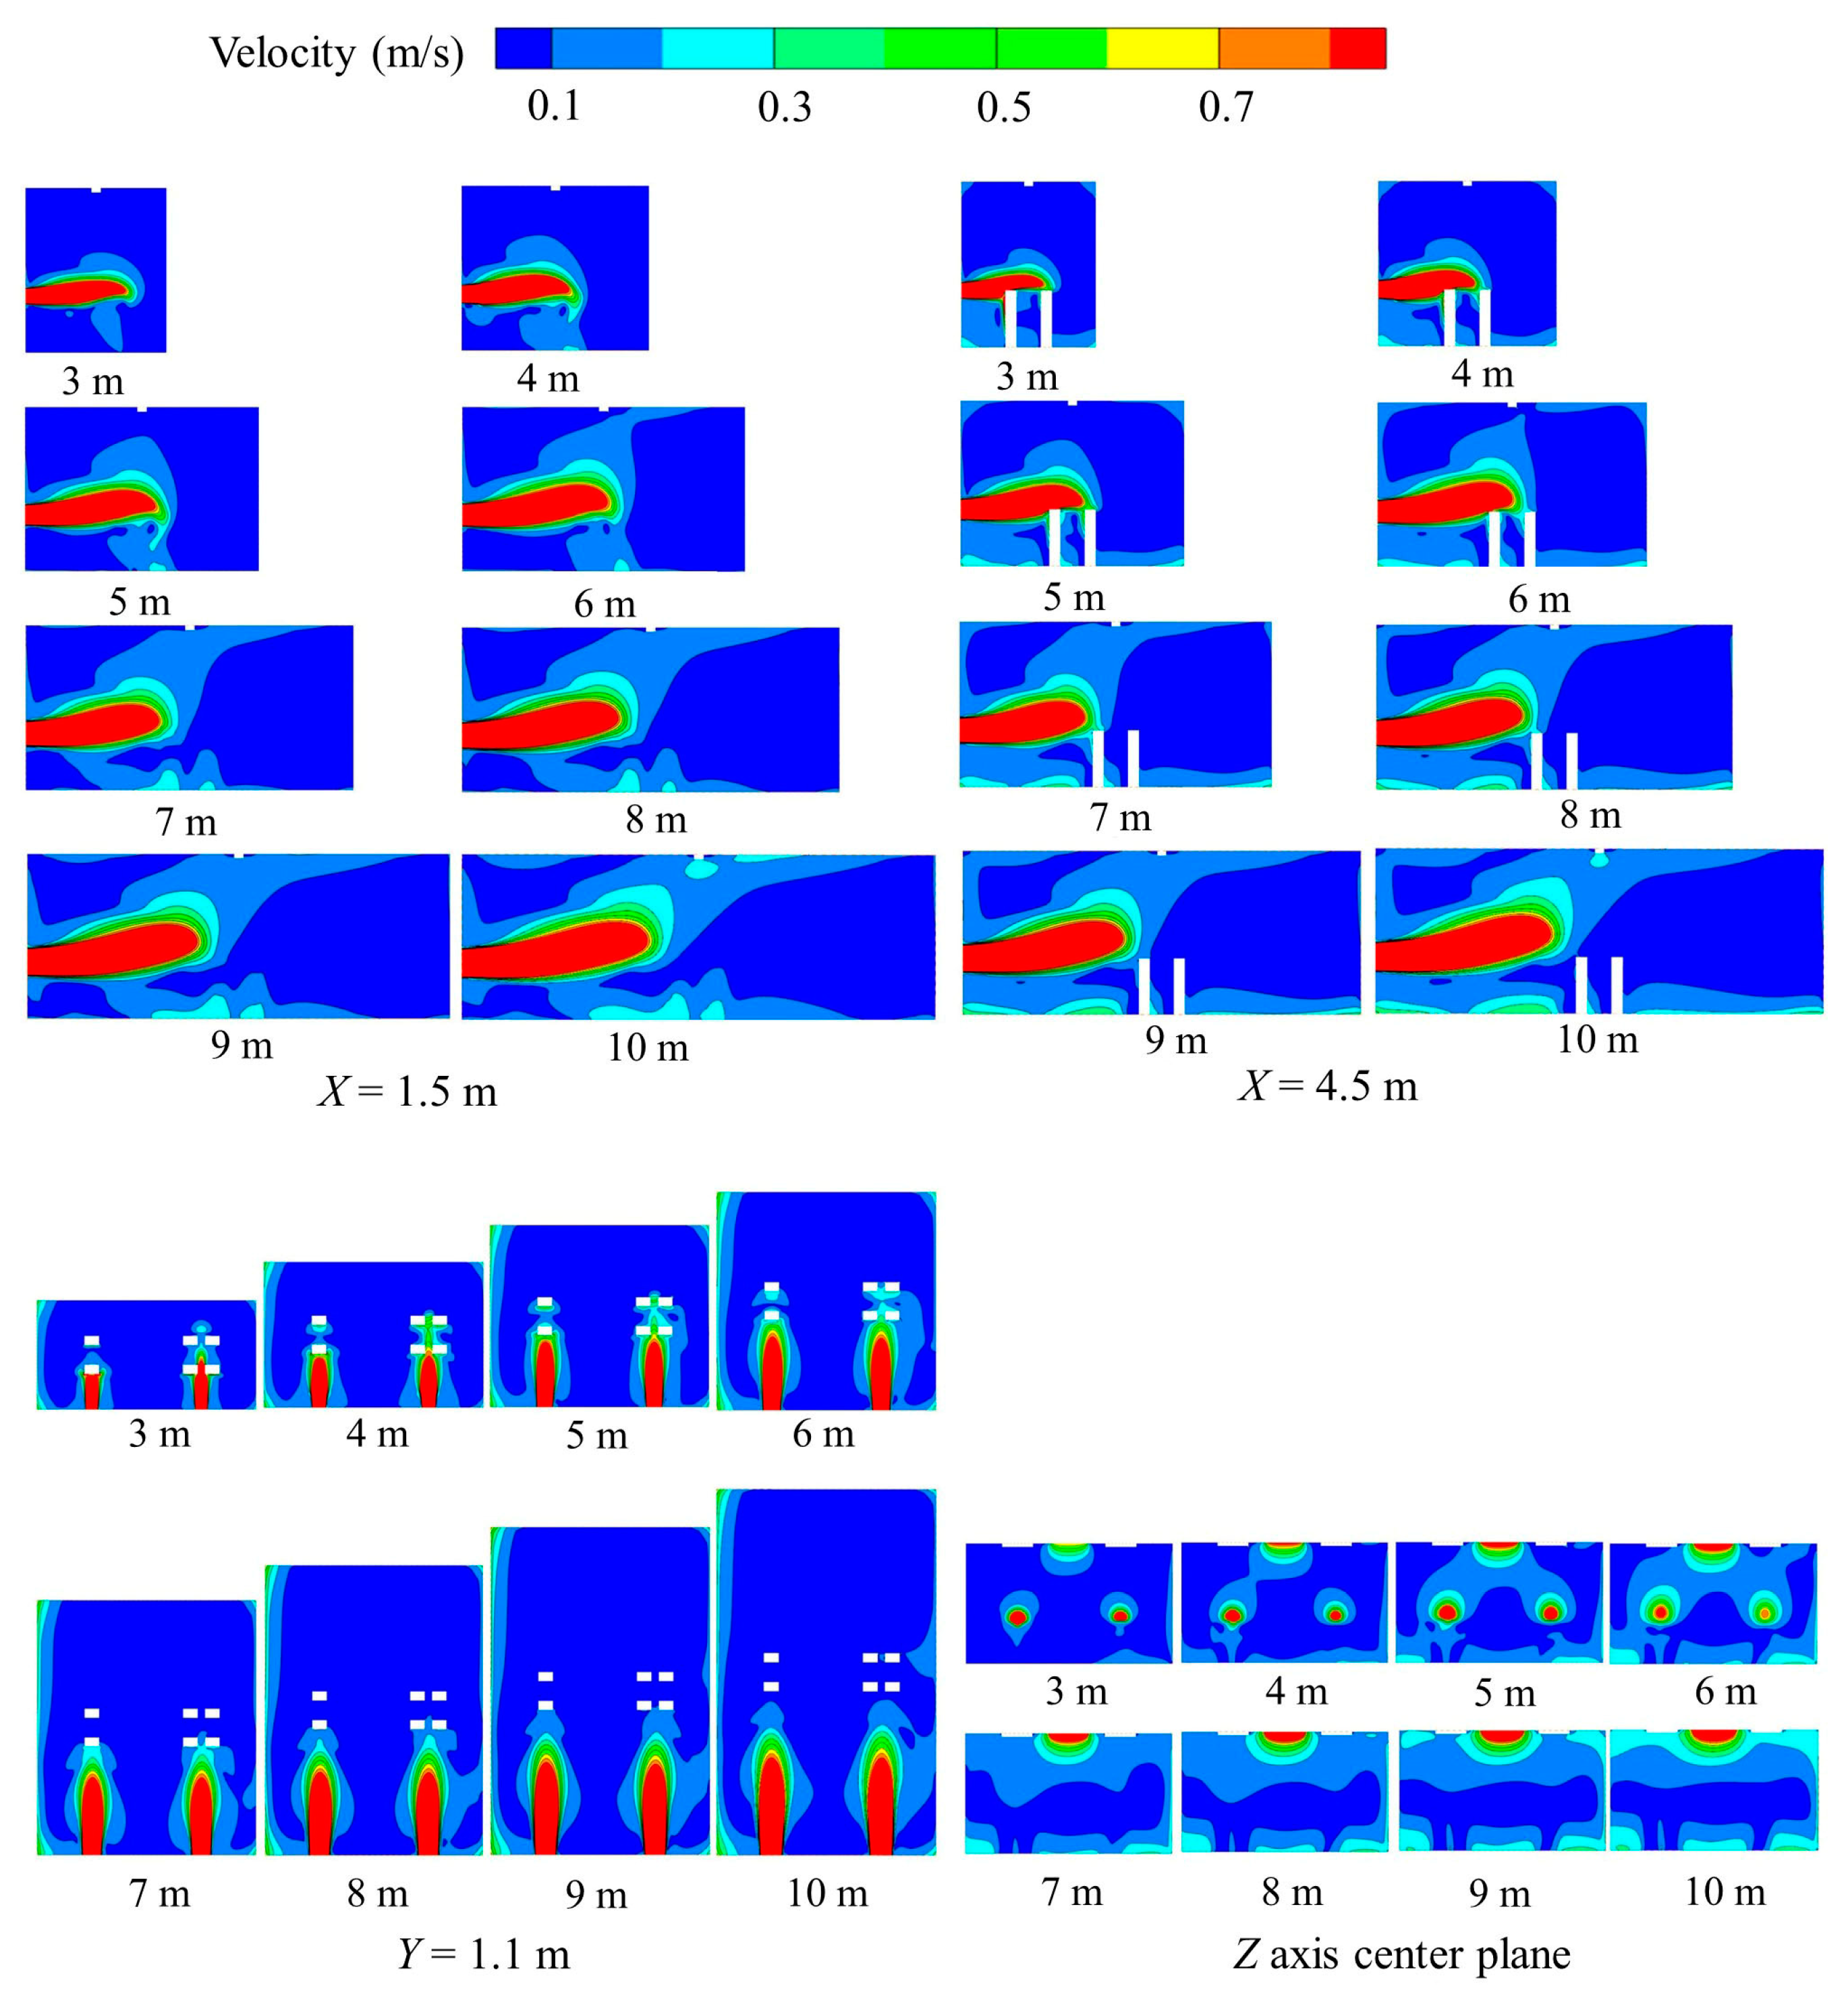
3.2.1. Airflow Distribution
3.2.2. Ventilation Efficiency
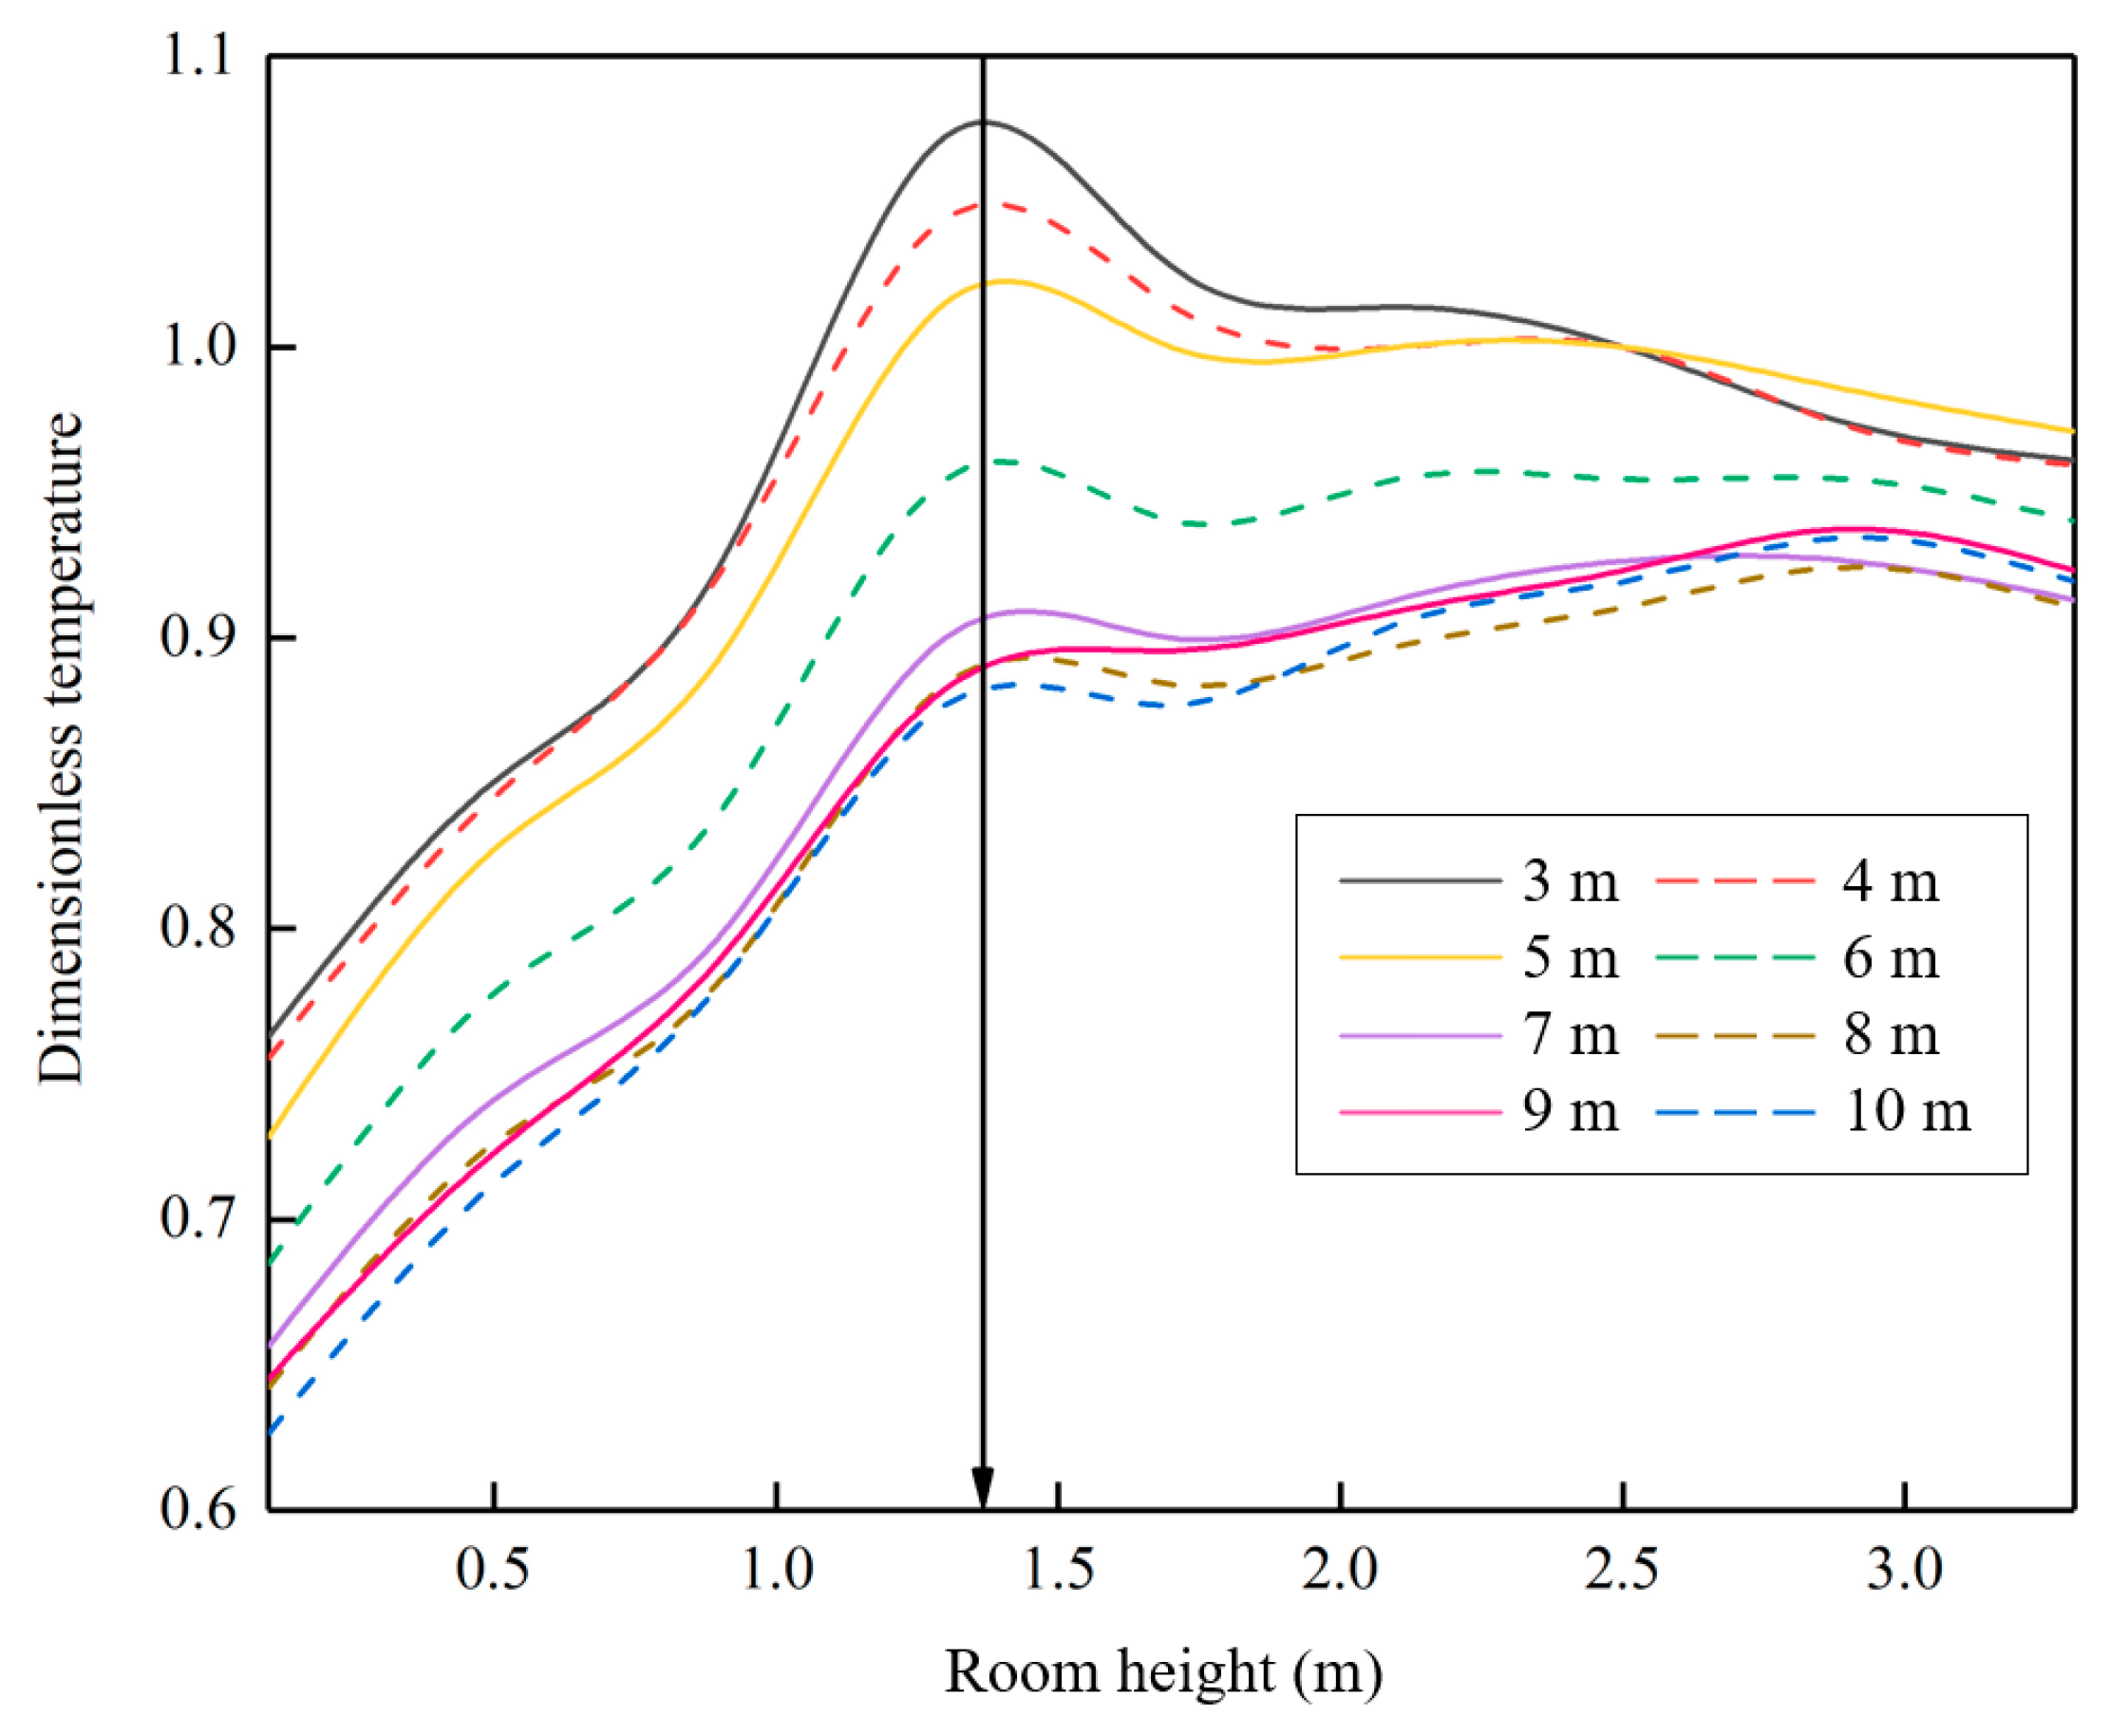
3.2.3. Dimensionless Temperature
3.3. Thermal Comfort
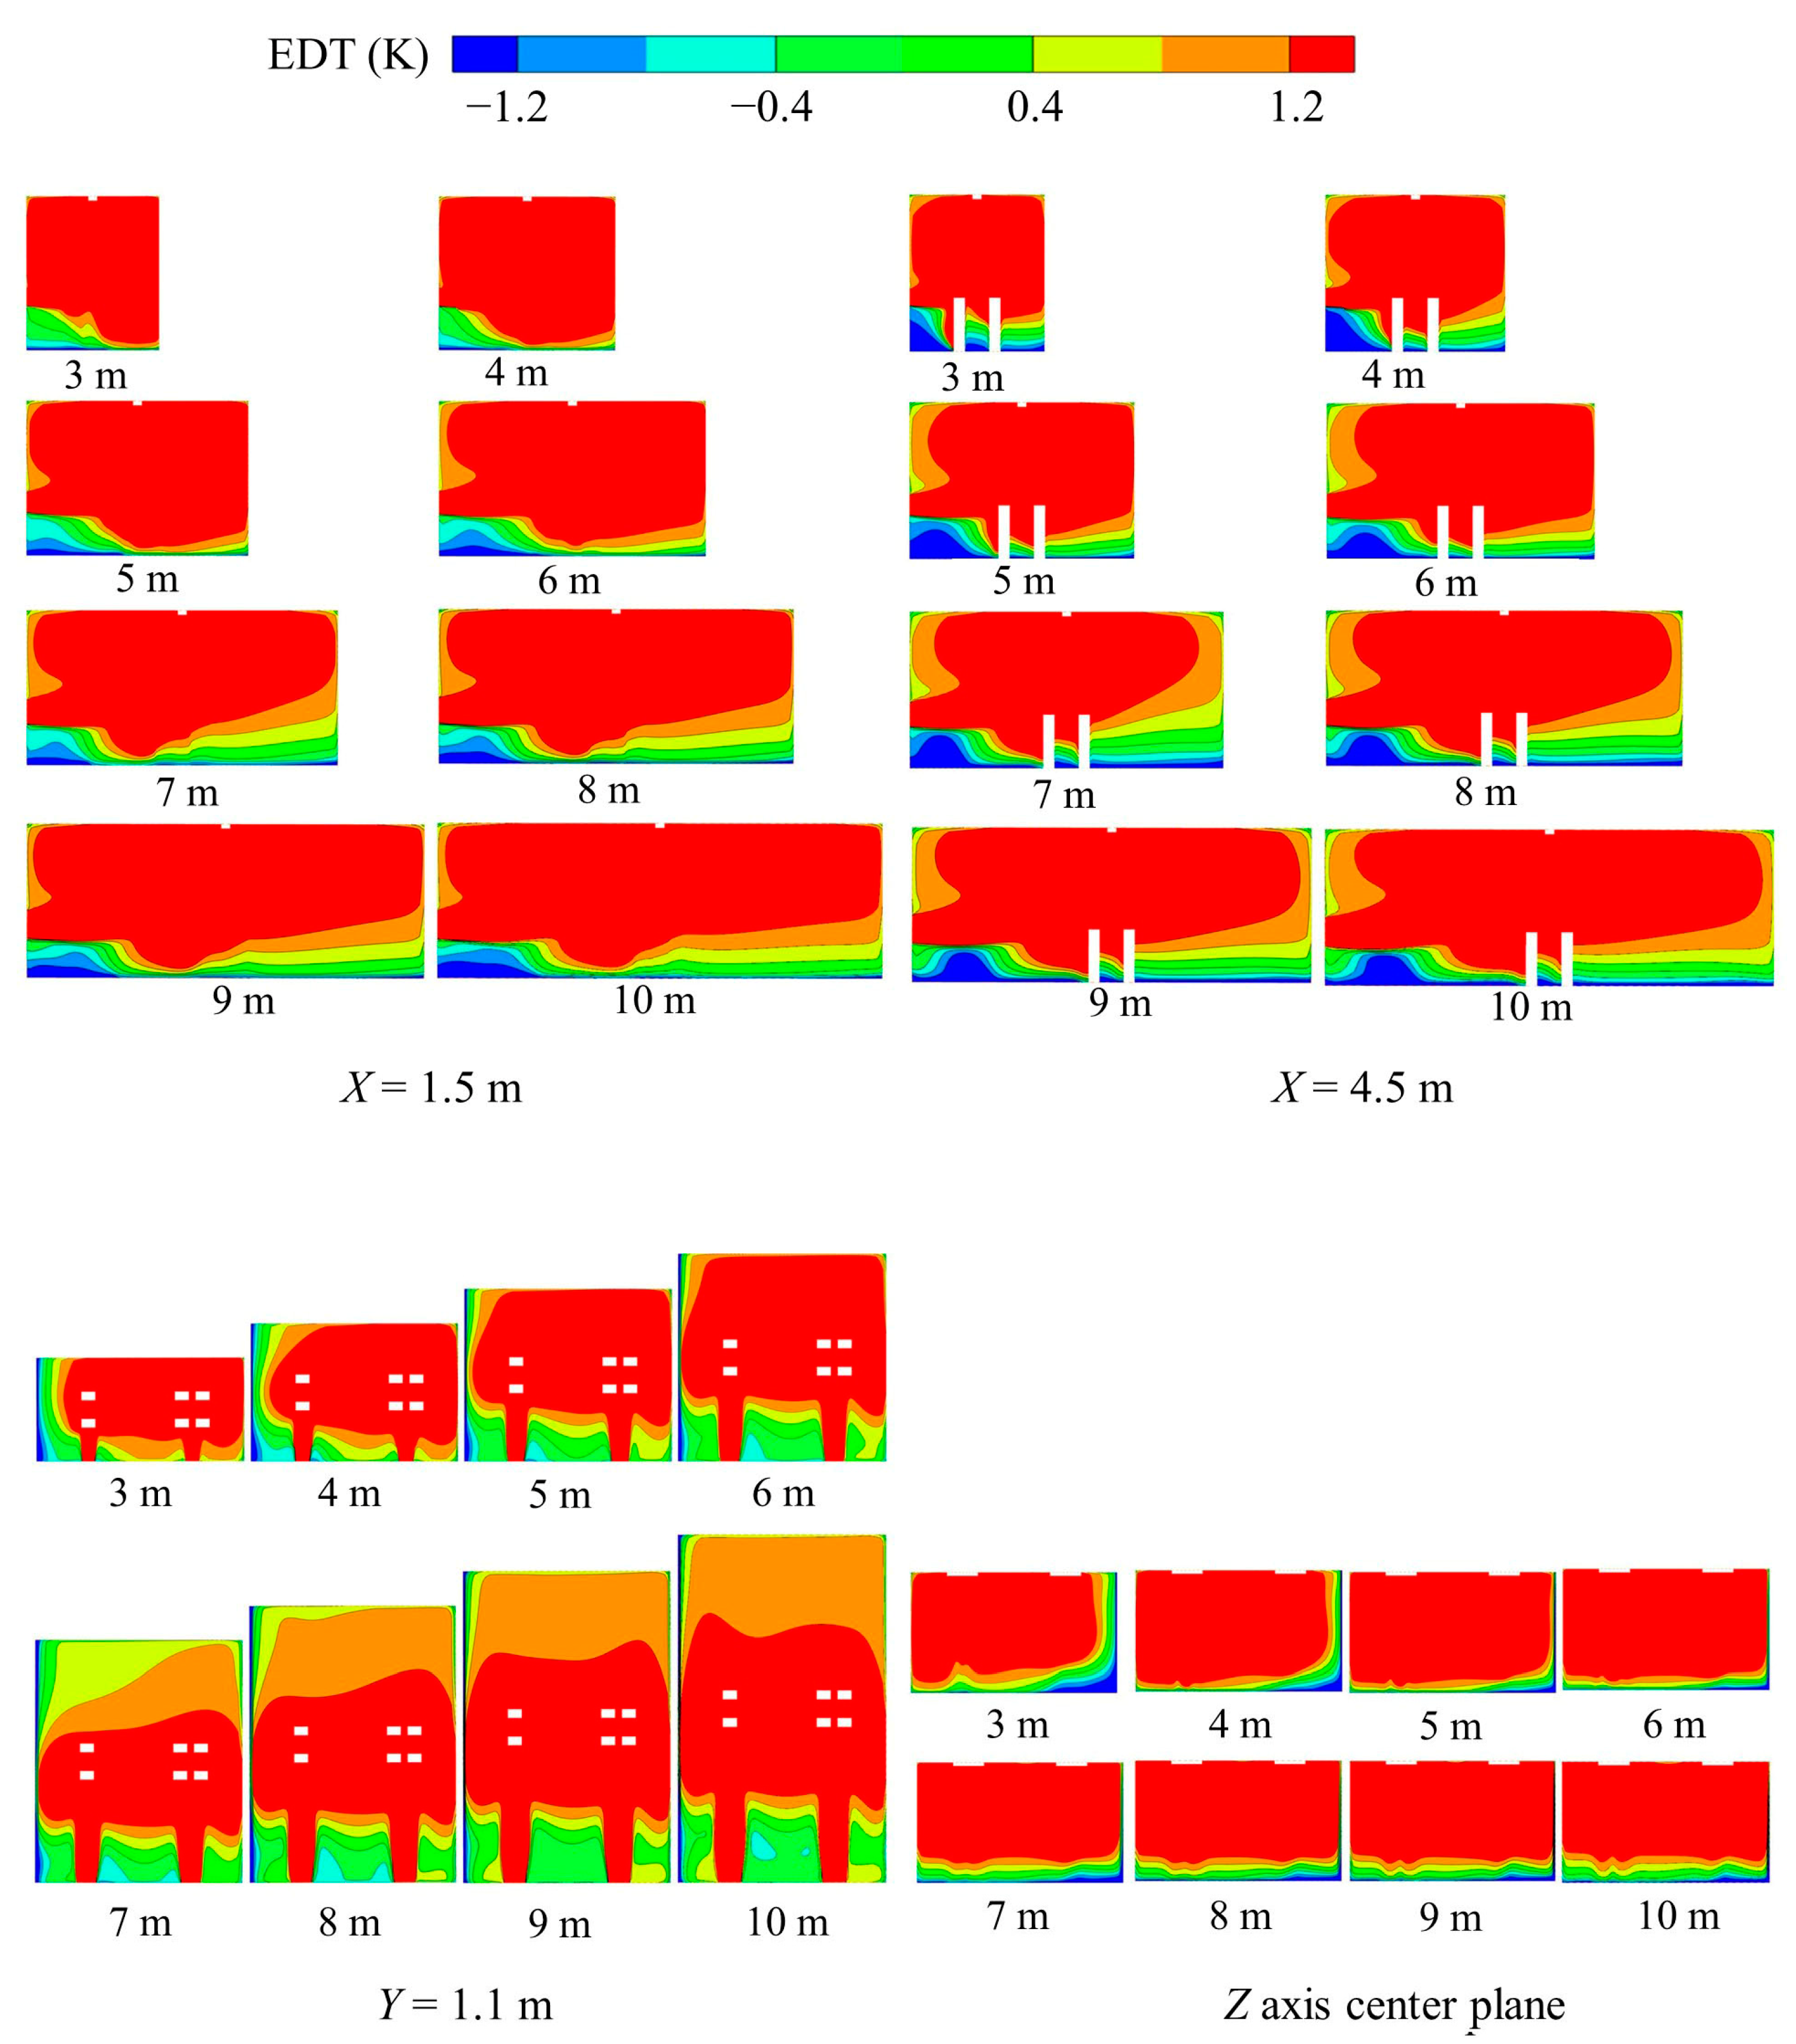
3.3.1. Effective Draft Temperature
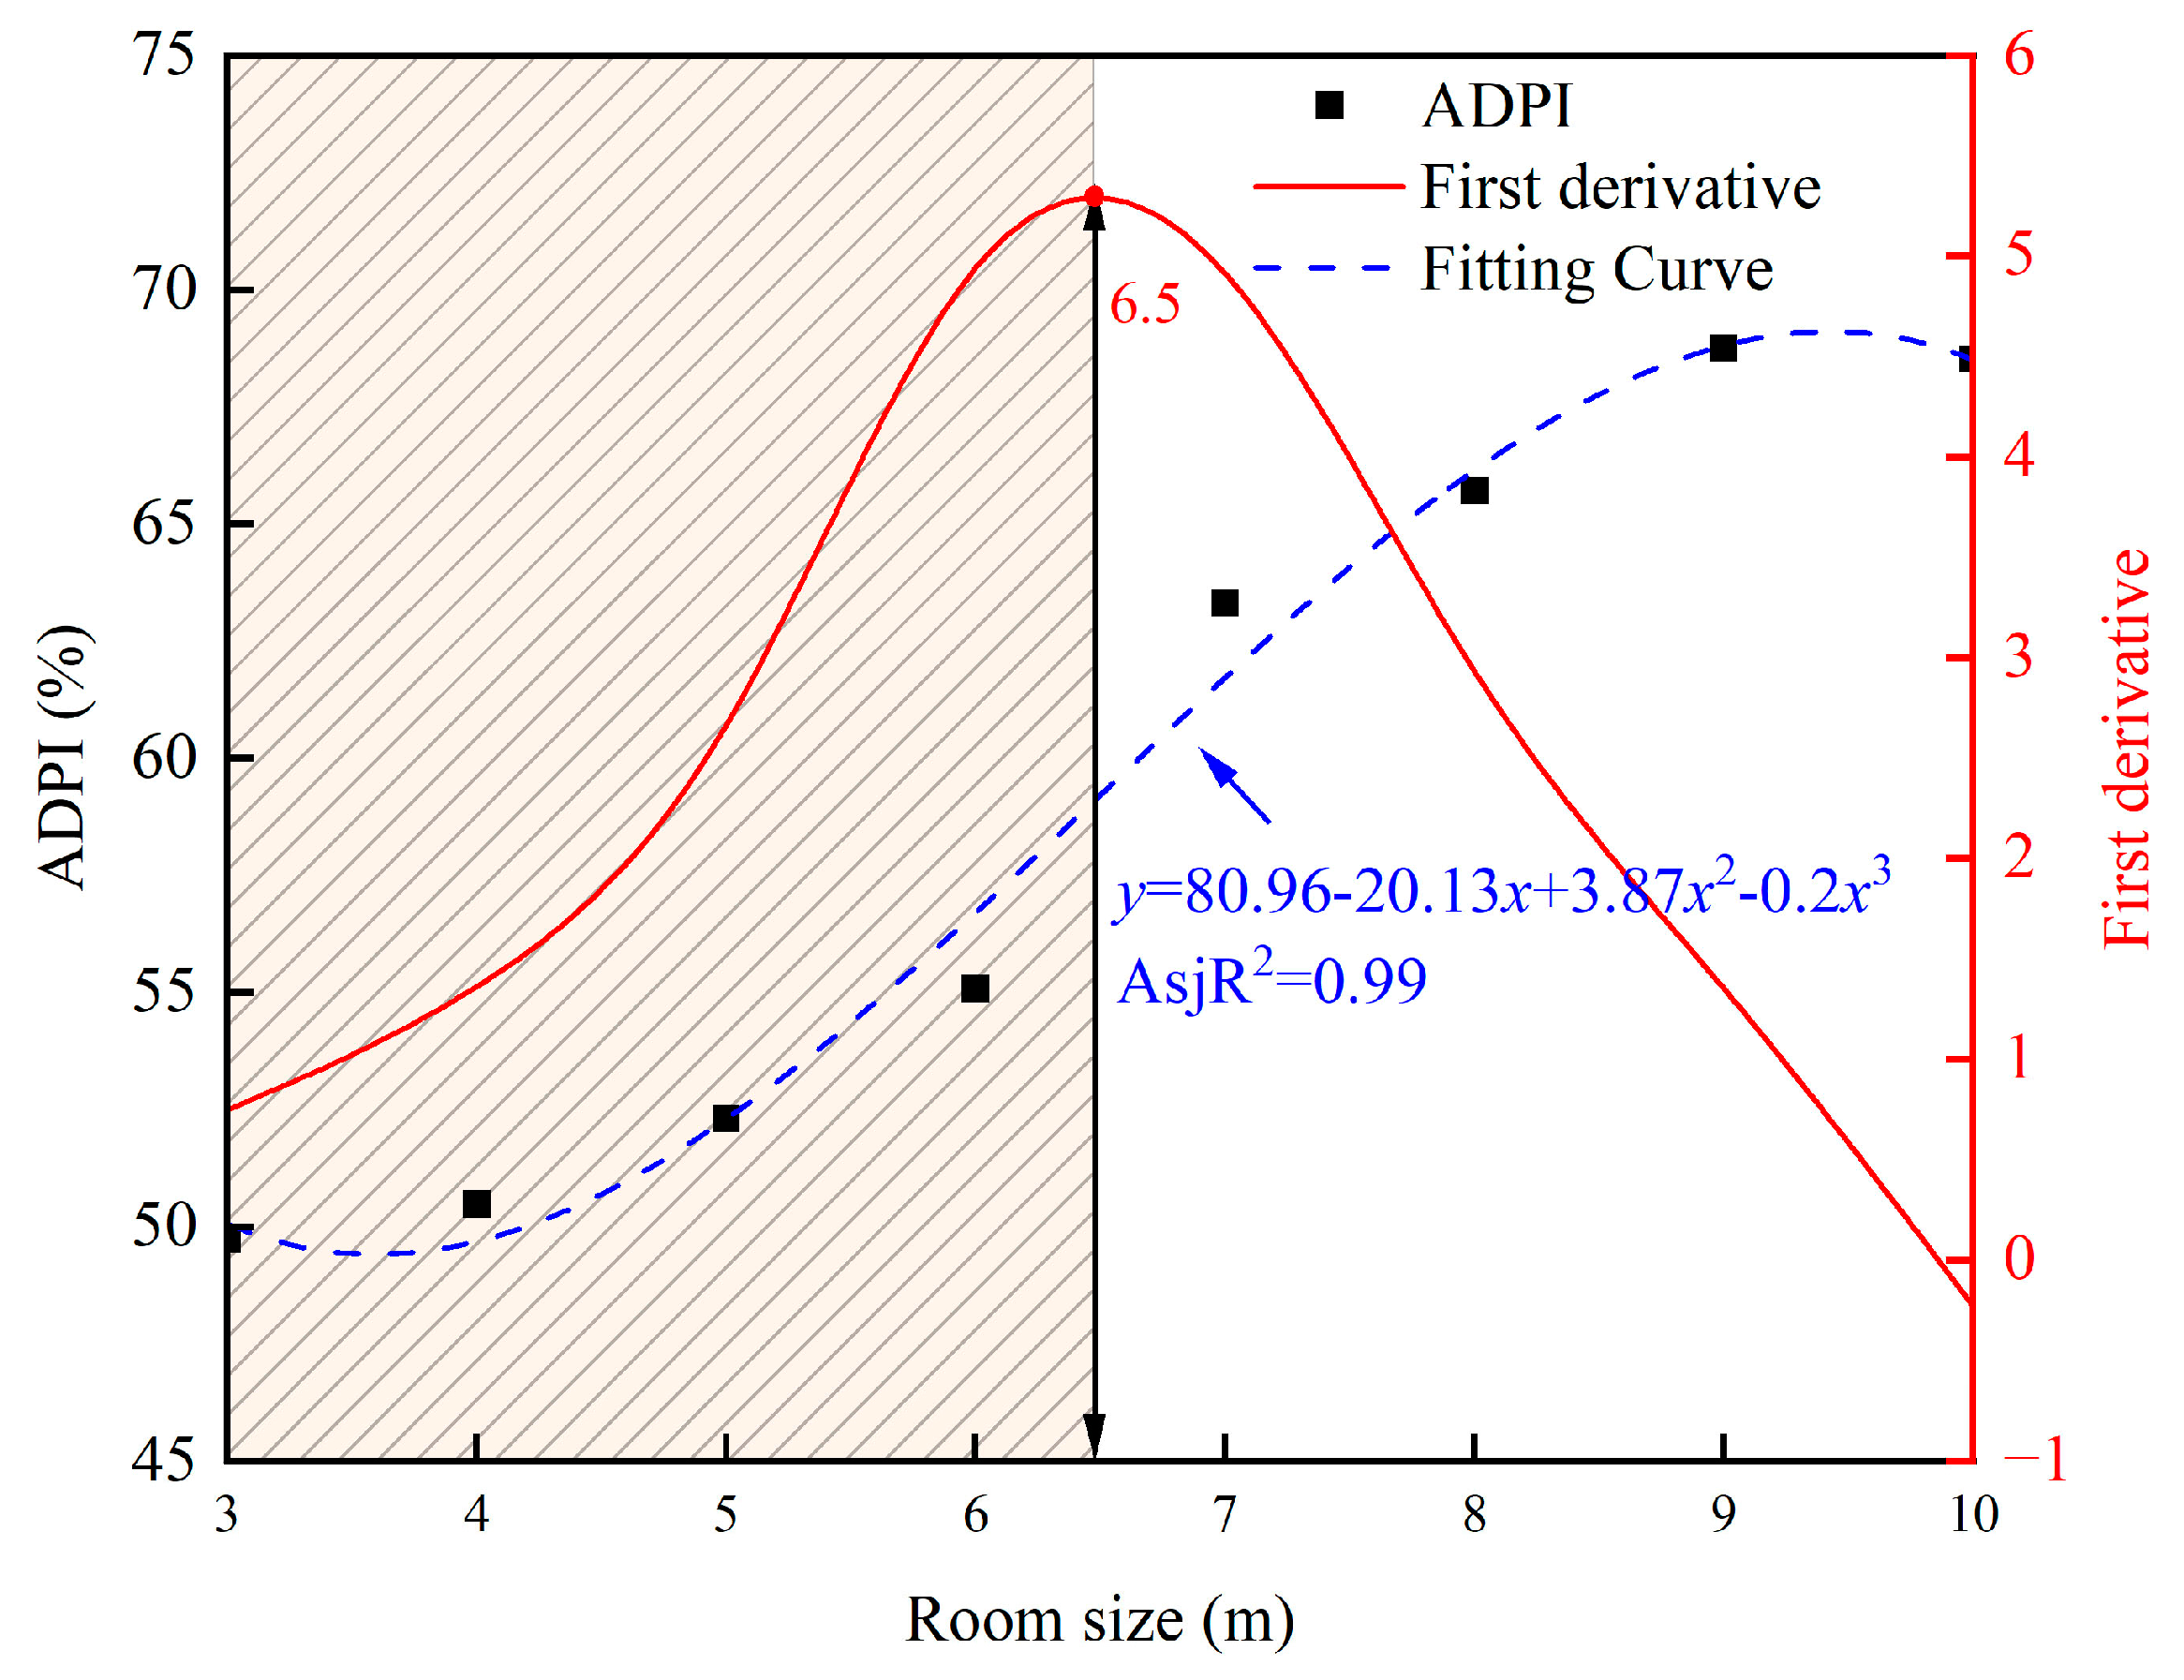
3.3.2. ADPI
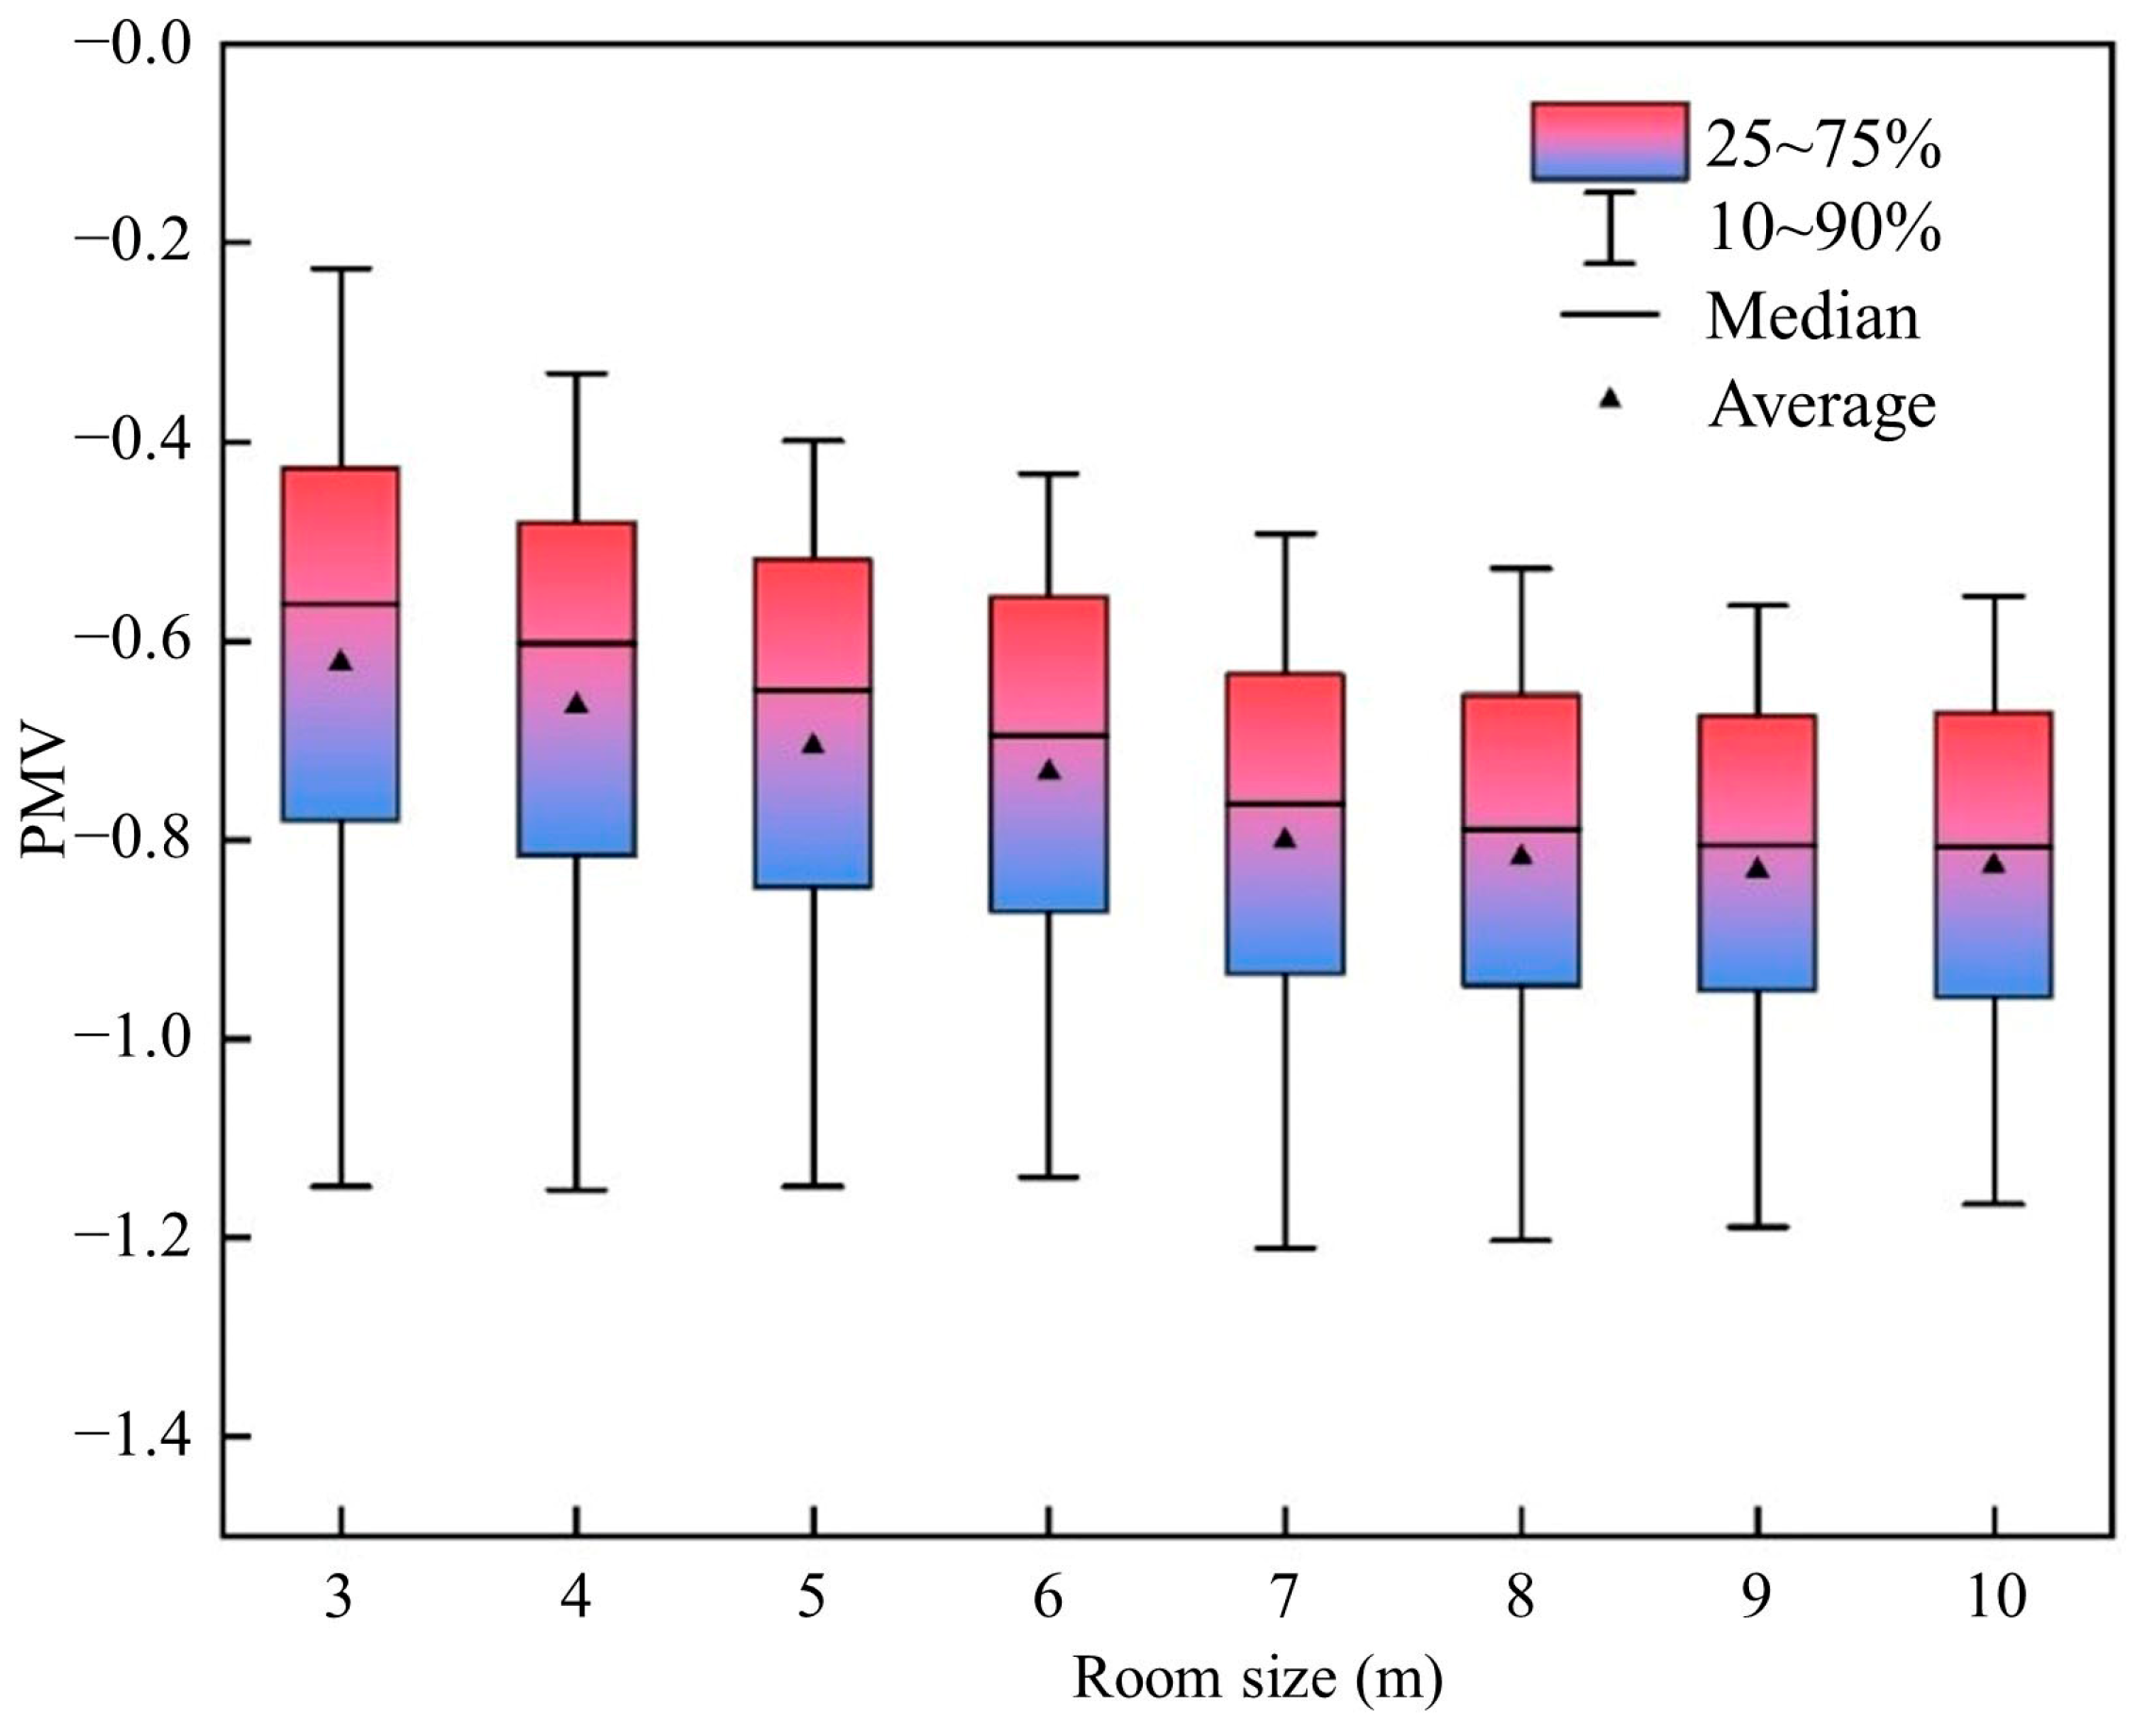
3.3.3. PMV
3.4. Multi-Criteria AHP-EW Method
3.4.1. AHP-EW Comprehensive Score
3.4.2. Determining the Applicable Room Size Dimension
3.5. Sensitivity Analysis
4. Conclusions
- (1)
- Increasing room size caused increasingly significant hot air floating. An increase of room size by 3.3 times would reduce the energy utilization efficiency by 11.5–37.5%.
- (2)
- In order to ensure the energy efficiency of stratum ventilation, the room size should not exceed 5.7 m.
- (3)
- As the room size increased from 3 m to 10 m, the temperature and velocity uniformity increased by 37.8–38.2%, but the risk of overcooling also increased by 32.6%.
- (4)
- Considering thermal comfort, the maximum applicable sizes for stratum ventilation were 6 m.
- (5)
- Using the multi-indicator AHP-EW method for the combined evaluation of energy use efficiency and thermal comfort found that the score decreases by 9% with room size increasing from 3 m to 10 m. By coupling single criteria, the maximum applicable size of stratum ventilation of 5.7 m is obtained.
Author Contributions
Funding
Institutional Review Board Statement
Informed Consent Statement
Data Availability Statement
Conflicts of Interest
Abbreviations
| SE | fluid energy source |
| Et | ventilation effectiveness (%) |
| EDT | effective draft temperature (K) |
| ADPI | air distribution performance index (%) |
| PMV | predicted mean vote |
| MAA | the mean age of air (s) |
| ACH | air changes per hour |
| ρ | density of the fluid (kg/m3) |
| t | time (s) |
| U | fluid flow velocity (m/s) |
| τ | stress tensor |
| T | Temperature (°C) |
| δ | identity matrix |
| P | thermodynamic compressive strength (Pa) |
| SM | fluid momentum source |
| h | fluid static enthalpy (J/kg) |
| λ | fluid thermal conductivity (w/(m·k)) |
| P | experimental measuring points number |
| τp | the local mean age of air (s) |
| Ct-t0 | the initial tracer gas concentration at time t-t0 |
| Ts | supply air temperature (°C) |
| Te | return air temperature (°C) |
| To | average temperature in the occupied zone (°C) |
| Tx | temperature of a certain point in space (°C) |
| Tr | average indoor temperature (°C) |
| xi | experimental result (°C) |
| yi | numerical simulation result (°C) |
| Ns | total number of effective blowing temperature and air velocity in the comfortable range |
| xij’ | The standardized score of the jth room size in the ith index |
| xij | initial score of the jth room size in the ith index |
| k | coefficients |
| q | coefficients |
| αi | AHP weight of ith index |
| Wi | EW weight of ith index |
| βi | comprehensive weight of ith index |
| Sj | comprehensive weight score for the jth size room |
| E | relative error (%) |
| Δ | absolute error (°C) |
| L | True value (°C) |
| φH | dimensionless temperature |
| MAPE | mean absolute percentage error |
| νx | air velocity at a certain point in space (m/s) |
| N | total number of occupied zone |
| IPCC | Intergovernmental Panel on Climate Change |
| GHG | greenhouse gas |
| COVID-19 | Corona Virus Disease 2019 |
| AHP | analytic hierarchy process |
| EW | entropy weight |
| CFD | Computational Fluid Dynamics |
References
- Wang, S.; Lee, C.L.; Song, Y. The COVID-19 Sentiment and Office Markets: Evidence from China. Buildings 2022, 12, 2100. [Google Scholar] [CrossRef]
- Ndaguba, E.; Cilliers, J.; Mbanga, S.; Brown, K.; Ghosh, S. Re-Imaging the Future in Urban Studies and Built Environment Discourse: A Neurourbanism Perspective. Buildings 2022, 12, 2056. [Google Scholar] [CrossRef]
- Zhang, B.; Cai, X.; Liu, M. Study on a New Type of Ventilation System for Rural Houses in Winter in the Severe Cold Regions of China. Buildings 2022, 12, 1010. [Google Scholar] [CrossRef]
- Yang, Y.; Li, Z. Integrated Design and Assessment for Indoor Heating, Ventilation and Air-Conditioning in Hot Summer and Cold Winter Area: A Case Study in China. Buildings 2022, 12, 1844. [Google Scholar] [CrossRef]
- Jorens, S.; Sörensen, K.; Verhaert, I.; de Corte, A. Air distribution system design optimization in non-residential buildings: Problem formulation and generation of test networks. J. Build. Eng. 2017, 12, 60–67. [Google Scholar] [CrossRef]
- Napier, J. Manchester Civil Justice Centre: Procuring and Managing an Institutional Building with a Mixed Mode Ventilation System—A Case for Post-Occupancy Evaluation. Buildings 2013, 3, 300–323. [Google Scholar] [CrossRef] [Green Version]
- Li, C.; Tang, H. Study on ventilation rates and assessment of infection risks of COVID-19 in an outpatient building. J. Build. Eng. 2021, 42, 103090. [Google Scholar] [CrossRef]
- Ahmadzadeh, M.; Farokhi, E.; Shams, M. Investigating the effect of air conditioning on the distribution and transmission of COVID-19 virus particles. J. Clean. Prod. 2021, 316, 128147. [Google Scholar] [CrossRef]
- Simanic, B.; Nordquist, B.; Bagge, H.; Johansson, D. Indoor air temperatures, CO2 concentrations and ventilation rates: Long-term measurements in newly built low-energy schools in Sweden. J. Build. Eng. 2019, 25, 100827. [Google Scholar] [CrossRef]
- Chen, R.; Liu, Y.-T.; Tsay, Y.-S. An Air Conditioning Design Strategy of the Stepped Hall Based on Building Performance Simulation. Buildings 2022, 12, 1269. [Google Scholar] [CrossRef]
- Duan, Z.; Sun, Y.; Wang, M.; Hu, R.; Dong, X. Evaluation of Mixed-Mode Ventilation Thermal Performance and Energy Saving Potential from Retrofitting a Beijing Office Building. Buildings 2022, 12, 793. [Google Scholar] [CrossRef]
- Lipinski, T.; Ahmad, D.; Serey, N.; Jouhara, H. Review of ventilation strategies to reduce the risk of disease transmission in high occupancy buildings. Int. J. Thermofluids 2020, 7–8, 100045. [Google Scholar] [CrossRef]
- Chlebnikovas, A.; Jasevičius, R. Air Pollution with Fine Particles in Closed Parking and Theoretical Studies of the Interaction of Inhaled Particles in Respiratory Tract. Buildings 2022, 12, 1696. [Google Scholar] [CrossRef]
- Ren, C.; Zhu, H.-C.; Cao, S.-J. Ventilation Strategies for Mitigation of Infection Disease Transmission in an Indoor Environment: A Case Study in Office. Buildings 2022, 12, 180. [Google Scholar] [CrossRef]
- Lin, Z. Stratum ventilation—A low-carbon way to thermal comfort and indoor air quality. Int. J. Low-Carbon Technol. 2017, 12, 323–329. [Google Scholar] [CrossRef] [Green Version]
- Lin, Z.; Lee, C.K.; Fong, S.; Chow, T.; Yao, T.; Chan, L.S.A. Comparison of annual energy performances with different ventilation methods for cooling. Energy Build. 2011, 43, 130–136. [Google Scholar] [CrossRef]
- Cheng, Y.; Fong, M.L.; Yao, T.; Lin, Z.; Fong, K.F. Uniformity of stratum-ventilated thermal environment and thermal sensation. Indoor Air 2014, 24, 521–532. [Google Scholar] [CrossRef]
- Fong, M.L.; Hanby, V.; Greenough, R.; Lin, Z.; Cheng, Y. Acceptance of thermal conditions and energy use of three ventilation strategies with six exhaust configurations for the classroom. Build. Environ. 2015, 94, 606–619. [Google Scholar] [CrossRef]
- Cheng, Y.; Lin, Z.; Fong, A.M.L. Effects of temperature and supply airflow rate on thermal comfort in a stratum-ventilated room. Build. Environ. 2015, 92, 269–277. [Google Scholar] [CrossRef]
- Huan, C.; Wang, F.H.; Lin, Z.; Wu, X.; Ma, Z.; Wang, Z.; Zhang, L. An experimental investigation into stratum ventilation for the cooling of an office with asymmetrically distributed heat gains. Build. Environ. 2016, 110, 76–88. [Google Scholar] [CrossRef]
- Cheng, Y.; Zhang, S.; Huan, C.; Oladokun, M.O.; Lin, Z. Optimization on fresh outdoor air ratio of air conditioning system with stratum ventilation for both targeted indoor air quality and maximal energy saving. Build. Environ. 2019, 147, 11–22. [Google Scholar] [CrossRef] [Green Version]
- Zhang, S.; Cheng, Y.; Fang, Z.; Huan, C.; Lin, Z. Optimization of room air temperature in stratum-ventilated rooms for both thermal comfort and energy saving. Appl. Energy 2017, 204, 420–431. [Google Scholar] [CrossRef]
- Kong, X.F.; Xi, C.; Li, H.; Lin, Z. Multi-parameter performance optimization for whole year operation of stratum ventilation in offices. Appl. Energy 2020, 268, 114966. [Google Scholar] [CrossRef]
- Zhao, H.; Liu, Z.; Zuo, Z. Numerical Simulation of Indoor Thermal Environment Effected by Air Supply Temperature and Grille Angle on Stratum Ventilation in a Typical Office. Procedia Eng. 2015, 121, 779–784. [Google Scholar] [CrossRef] [Green Version]
- Tian, L.; Lin, Z.; Liu, J.; Yao, T.; Wang, Q. The impact of temperature on mean local air age and thermal comfort in a stratum ventilated office. Build. Environ. 2011, 46, 501–510. [Google Scholar] [CrossRef]
- Li, H.; Xi, C.; Kong, X.; Yao, T.; Wang, Q. A comparative experimental investigation on radiant floor heating system and stratum ventilation. Sustain. Cities Soc. 2020, 52, 101823. [Google Scholar] [CrossRef]
- Zhang, S.; Lin, Z.; Ai, Z.; Huan, C.; Cheng, Y.; Wang, F. Multi-criteria performance optimization for operation of stratum ventilation under heating mode. Appl. Energy 2019, 239, 969–980. [Google Scholar] [CrossRef]
- Ren, C.; Chen, H.; Wang, J.; Feng, Z.; Cao, S.-J. Ventilation impacts on infection risk mitigation, improvement of environmental quality and energy efficiency for subway carriages. Build. Environ. 2022, 222, 109358. [Google Scholar] [CrossRef]
- Permana, I.; Wang, F.; Rakhsit, D.; Huang, J. Strategies to Enhance Contamination Control Performance through Ventilation Improvement in a Biosafety Laboratory Building. Buildings 2022, 12, 1849. [Google Scholar] [CrossRef]
- Fang, Z.; Wang, W.; Chen, Y.; Song, J. Structural and Heat Transfer Model Analysis of Wall-Mounted Solar Chimney Inlets and Outlets in Single-Story Buildings. Buildings 2022, 12, 1790. [Google Scholar] [CrossRef]
- Katona, Á.L.; Háber, I.E.; Kistelegdi, I. CFD Simulation Supported Development of Wind Catcher Shape Topology in a Passive Air Conduction System (PACS). Buildings 2022, 12, 1583. [Google Scholar] [CrossRef]
- Kong, M.; Zhang, J.S.; Wang, J.J. Air and air contaminant flows in office cubicles with and without personal ventilation: A CFD modeling and simulation study. Build. Simul. 2015, 8, 381–392. [Google Scholar] [CrossRef]
- Mustakallio, P.; Kosonen, R.; Korinkova, A. Full-scale test and CFD-simulation of radiant panel integrated with exposed chilled beam in heating mode. Build. Simul. 2017, 10, 75–85. [Google Scholar] [CrossRef]
- Zhao, W.; Mustakallio, P.; Lestinen, S.; Kilpeläinen, S.; Jokisalo, J.; Kosonen, R. Numerical and Experimental Study on the Indoor Climate in a Classroom with Mixing and Displacement Air Distribution Methods. Buildings 2022, 12, 1314. [Google Scholar] [CrossRef]
- Zhang, S.; Lin, Z.; Ai, Z.; Wang, F.; Cheng, Y.; Huan, C. Effects of operation parameters on performances of stratum ventilation for heating mode. Build. Environ. 2019, 148, 55–66. [Google Scholar] [CrossRef]
- ANSYS Fluent Inc. Fluent 6.3 User’s Guide; ANSYS Fluent Inc.: Lebanon, NH, USA, 2006. [Google Scholar]
- Zhang, S.; Cheng, Y.; Oladokun, M.O.; Huan, C.; Lin, Z. Heat removal efficiency of stratum ventilation for air-side modulation. Appl. Energy 2019, 238, 1237–1249. [Google Scholar] [CrossRef] [Green Version]
- Liu, Z.; Liu, Z.; Zuo, Z. Effect of Stratum Ventilation on Thermal Comfort and Energy Utilization Efficiency of Numerical Simulation. Energy Procedia 2017, 105, 3596–3602. [Google Scholar] [CrossRef]
- Lin, Y.; Liu, J.; Gabriel, K.; Yang, W.; Li, C.-Q. Data-Driven Based Prediction of the Energy Consumption of Residential Buildings in Oshawa. Buildings 2022, 12, 2039. [Google Scholar] [CrossRef]
- Petrone, G.; Cammarata, L.; Cammarata, G. A multi-physical simulation on the IAQ in a movie theatre equipped by different ventilating systems. Build. Simul. 2011, 4, 21–31. [Google Scholar] [CrossRef]
- Buratti, C.; Mariani, R.; Moretti, E. Mean age of air in a naturally ventilated office: Experimental data and simulations. Energy Build. 2011, 43, 2021–2027. [Google Scholar] [CrossRef]
- Tian, X.; Zhang, S.; Awbi, H.B.; Liao, C.; Cheng, Y.; Lin, Z. Multi-indicator evaluation on ventilation effectiveness of three ventilation methods: An experimental study. Build. Environ. 2020, 180, 107015. [Google Scholar] [CrossRef]
- Tian, X.; Li, B.; Ma, Y.; Liu, D.; Li, Y.; Cheng, Y. Experimental study of local thermal comfort and ventilation performance for mixing, displacement and stratum ventilation in an office. Sustain. Cities Soc. 2019, 50, 101630. [Google Scholar] [CrossRef]
- Lin, Z. Effective draft temperature for evaluating the performance of stratum ventilation. Build. Environ. 2011, 46, 1843–1850. [Google Scholar] [CrossRef]
- Duan, X.; Yu, S.; Chu, J.; Chen, D.; Chen, Y. Evaluation of Indoor Thermal Environments Using a Novel Predicted Mean Vote Model Based on Artificial Neural Networks. Buildings 2022, 12, 1880. [Google Scholar] [CrossRef]
- Salameh, M.; Touqan, B. Traditional Passive Design Solutions as a Key Factor for Sustainable Modern Urban Designs in the Hot, Arid Climate of the United Arab Emirates. Buildings 2022, 12, 1811. [Google Scholar] [CrossRef]
- Aldhaheri, M.A.M.M.; Xia, B.; Nepal, M.; Chen, Q. Selecting Key Smart Building Technologies for UAE Prisons by Integrating Analytical Hierarchy Process (AHP) and Fuzzy-TOPSIS. Buildings 2022, 12, 2074. [Google Scholar] [CrossRef]
- Feng, Y.; Wahab, M.A.; Azmi, N.A.B.; Yan, H.; Wu, H. Chinese Residents’ Willingness to Buy Housing: An Evaluation in Nanyang City, Henan Province, China Based on the Extension Cloud Model. Buildings 2022, 12, 1695. [Google Scholar] [CrossRef]
- Wu, Y.; Kang, J.; Mu, J.Y. Assessment and simulation of evacuation in large railway stations. Build. Simul. 2021, 14, 1553–1566. [Google Scholar] [CrossRef]
- Wang, H.; Jiang, Z.; Wang, Y.; Liu, Y.; Li, F.; Yan, W.; Zhang, H. A Demands-Matching Multi-Criteria Decision-Making Method for Reverse Logistics. Procedia CIRP 2018, 72, 1398–1403. [Google Scholar] [CrossRef]
- Yu, L.; Shen, J. Summary of Dimensionless Methods in Multi-attribute Evaluation. Techbilogy Intell. Eng. 2020, 6, 4–14. [Google Scholar]
- Zhu, L.; Zhang, L.; Ye, Q.; Du, J.; Zhao, X. A Three-Dimensional Evaluation Model of the Externalities of Highway Infrastructures to Capture the Temporal and Spatial Distance to Optimal—A Case Study of China. Buildings 2022, 12, 328. [Google Scholar] [CrossRef]
- Wang, H.; Jiang, Z.; Zhang, H.; Wang, Y.; Yang, Y.; Li, Y. An integrated MCDM approach considering demands-matching for reverse logistics. J. Clean. Prod. 2019, 208, 199–210. [Google Scholar] [CrossRef]
- Liang, S.; Li, B.; Tian, X.; Cheng, Y.; Liao, C.; Zhang, J.; Liu, D. Determining optimal parameter ranges of warm supply air for stratum ventilation using Pareto-based MOPSO and cluster analysis. J. Build. Eng. 2021, 37, 102145. [Google Scholar] [CrossRef]
- Ma, T.; Xiong, J.; Lian, Z. A human thermoregulation model for the Chinese elderly. J. Therm. Biol. 2017, 70, 2–14. [Google Scholar] [CrossRef] [PubMed]


| Measured Parameter | Measurement Instrument | Measurement Range | Measurement Accuracy |
|---|---|---|---|
| Air temperature | T-thermocouple | −200~260 °C | ±0.1 °C |
| Air velocity | Testo480 hot-line anemometer | 0~20 m/s | ±0.05 m/s |
| Boundary | Boundary Condition | Numerical Parameter |
|---|---|---|
| Inlet | Uniform velocity inlet | 27 °C, 1.94 m/s |
| Outlet | Free outflow | |
| Occupant | Constant heat flux solid boundary | 100 W |
| Light | Constant heat flux solid boundary | 75 W |
| Outer wall | Constant wall temperature | −3.2 °C |
| Internal wall | Constant wall temperature | 12.5 °C |
| Left/right wall | Constant wall temperature | 16.4 °C |
| Ceiling | Constant wall temperature | 14.5 °C |
| Floor | Constant wall temperature | 14.5 °C |
| Grid Numbers | 0.5 m Height (°C) | 1 m Height (°C) | 1.5 m Height (°C) | 2 m Height (°C) | 2.5 m Height (°C) | Maximum Relative Error (%) | |
|---|---|---|---|---|---|---|---|
| 1 | 914,568 | 18.3 | 18.6 | 18.9 | 19.1 | 19.3 | 2.19 |
| 2 | 1,803,536 | 17.9 | 18.4 | 18.8 | 19.0 | 19.0 | 0.51 |
| 3 | 2,772,928 | 18.0 | 18.5 | 18.8 | 19.0 | 19.0 | —— |
| Room Size (m) | 3 | 4 | 5 | 6 | 7 | 8 | 9 | 10 |
|---|---|---|---|---|---|---|---|---|
| Maximum MAA (s) | 235.8 | 236.7 | 257.8 | 276.0 | 303.1 | 317.6 | 325.1 | 336.2 |
| Average MAA (s) | 179.9 | 188.9 | 200.9 | 213.9 | 228.8 | 237.6 | 243.8 | 248.4 |
| Reduction rate (%) | 5.01 | 6.36 | 6.46 | 6.97 | 3.84 | 2.64 | 1.89 |
| Evaluation Criteria | Applicable Room Size Dimension (m) |
|---|---|
| Airflow distribution | <7 |
| Et | <5.7 |
| Dimensionless temperature | <6 |
| EDT | <7 |
| ADPI | <6.5 |
| PMV | <6 |
| AHP-EW model | <6 |
| Multi-criteria AHP-EW model | <5.7 |
Disclaimer/Publisher’s Note: The statements, opinions and data contained in all publications are solely those of the individual author(s) and contributor(s) and not of MDPI and/or the editor(s). MDPI and/or the editor(s) disclaim responsibility for any injury to people or property resulting from any ideas, methods, instructions or products referred to in the content. |
© 2023 by the authors. Licensee MDPI, Basel, Switzerland. This article is an open access article distributed under the terms and conditions of the Creative Commons Attribution (CC BY) license (https://creativecommons.org/licenses/by/4.0/).
Share and Cite
Mao, Y.; Xie, H.; Zhang, X.; Hou, F.; Wang, M. Study on the Applicable Room Size Dimension of Stratum Ventilation for Heating Based on Multi-Criteria Analytic Hierarchy Process-Entropy Weight Model. Buildings 2023, 13, 381. https://doi.org/10.3390/buildings13020381
Mao Y, Xie H, Zhang X, Hou F, Wang M. Study on the Applicable Room Size Dimension of Stratum Ventilation for Heating Based on Multi-Criteria Analytic Hierarchy Process-Entropy Weight Model. Buildings. 2023; 13(2):381. https://doi.org/10.3390/buildings13020381
Chicago/Turabian StyleMao, Yanhui, Honglei Xie, Xinlu Zhang, Fumin Hou, and Miantong Wang. 2023. "Study on the Applicable Room Size Dimension of Stratum Ventilation for Heating Based on Multi-Criteria Analytic Hierarchy Process-Entropy Weight Model" Buildings 13, no. 2: 381. https://doi.org/10.3390/buildings13020381