
Damage States Investigation of Infilled Frame Structure Based on Meso Modeling Approach

 ,
,
Abstract
:1. Introduction
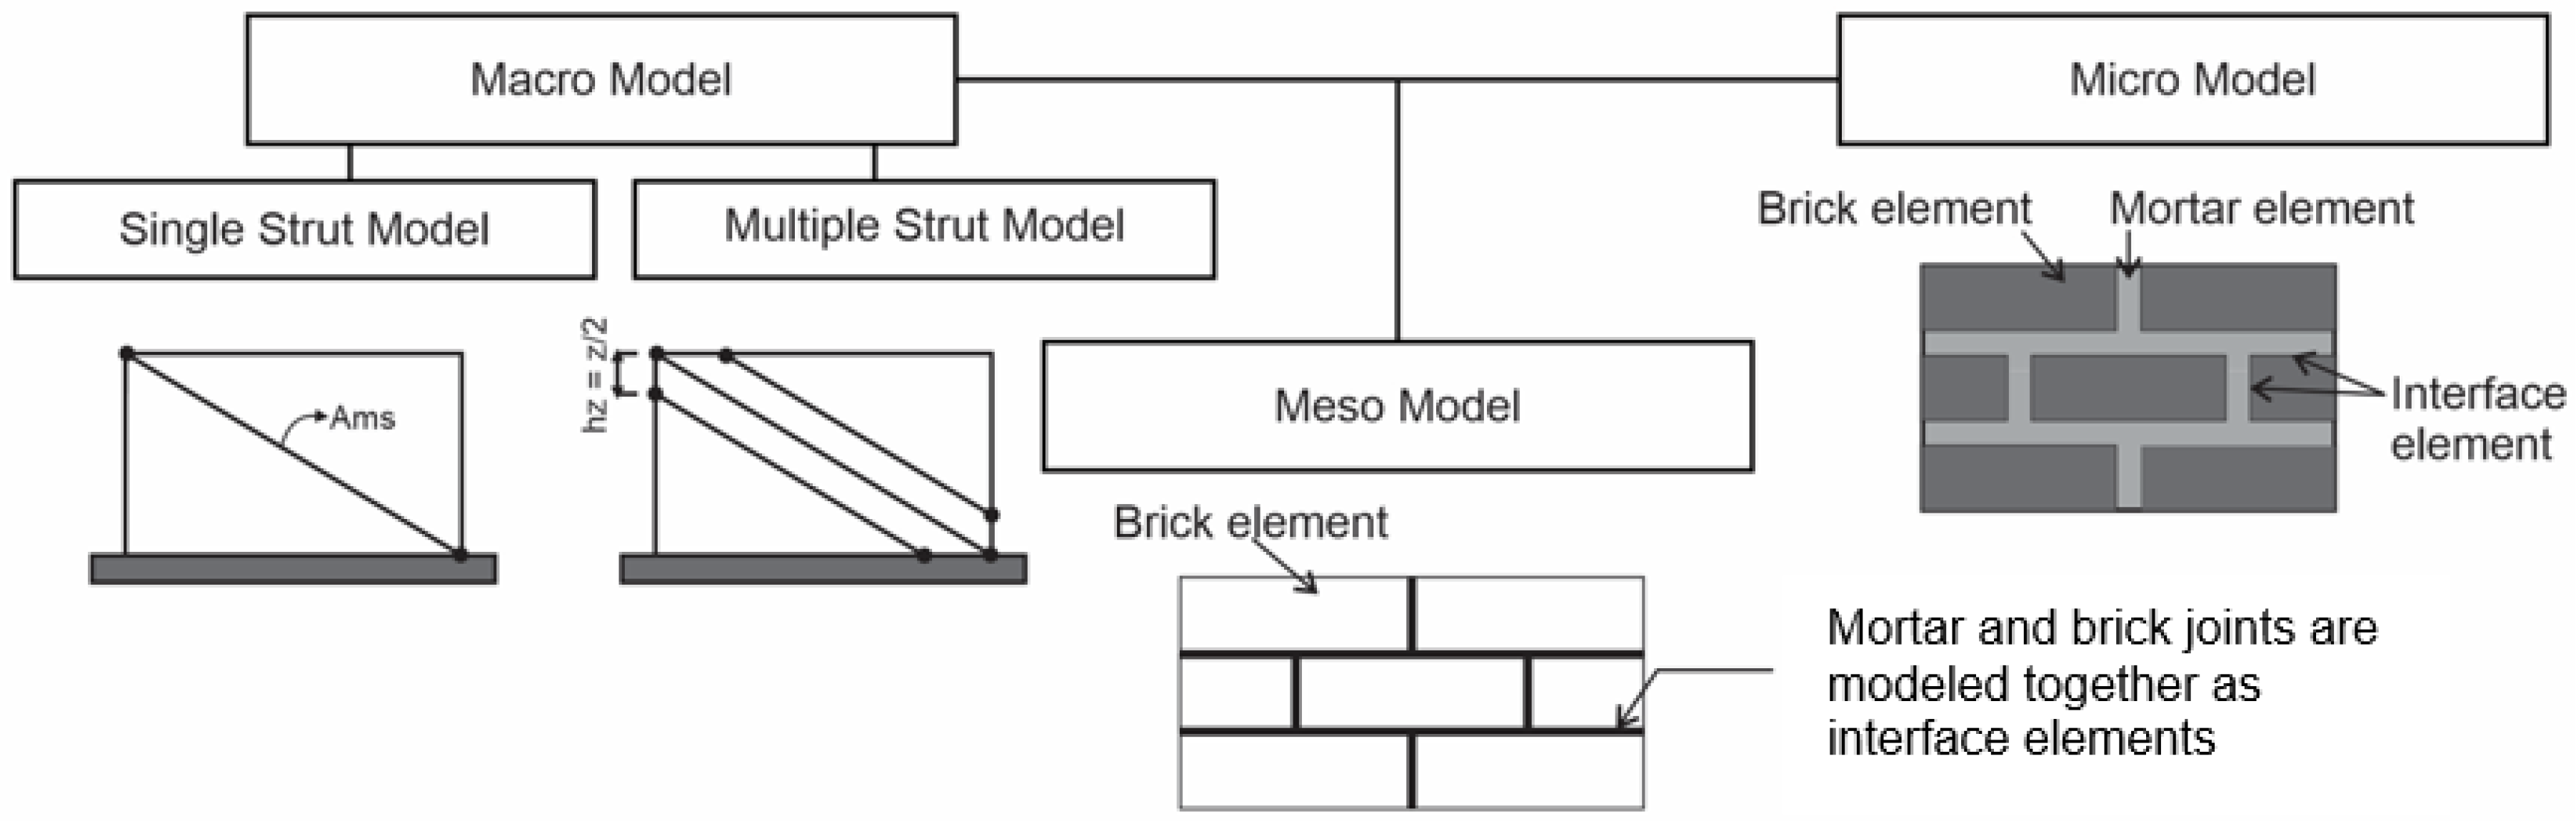
2. Various Approaches to Model an Infilled Frame
- (a)
- Micro Modeling
- (b)
- Meso Modeling
- (c)
- Macro Modeling
3. Damage States Definition
4. Numerical Modeling Methods
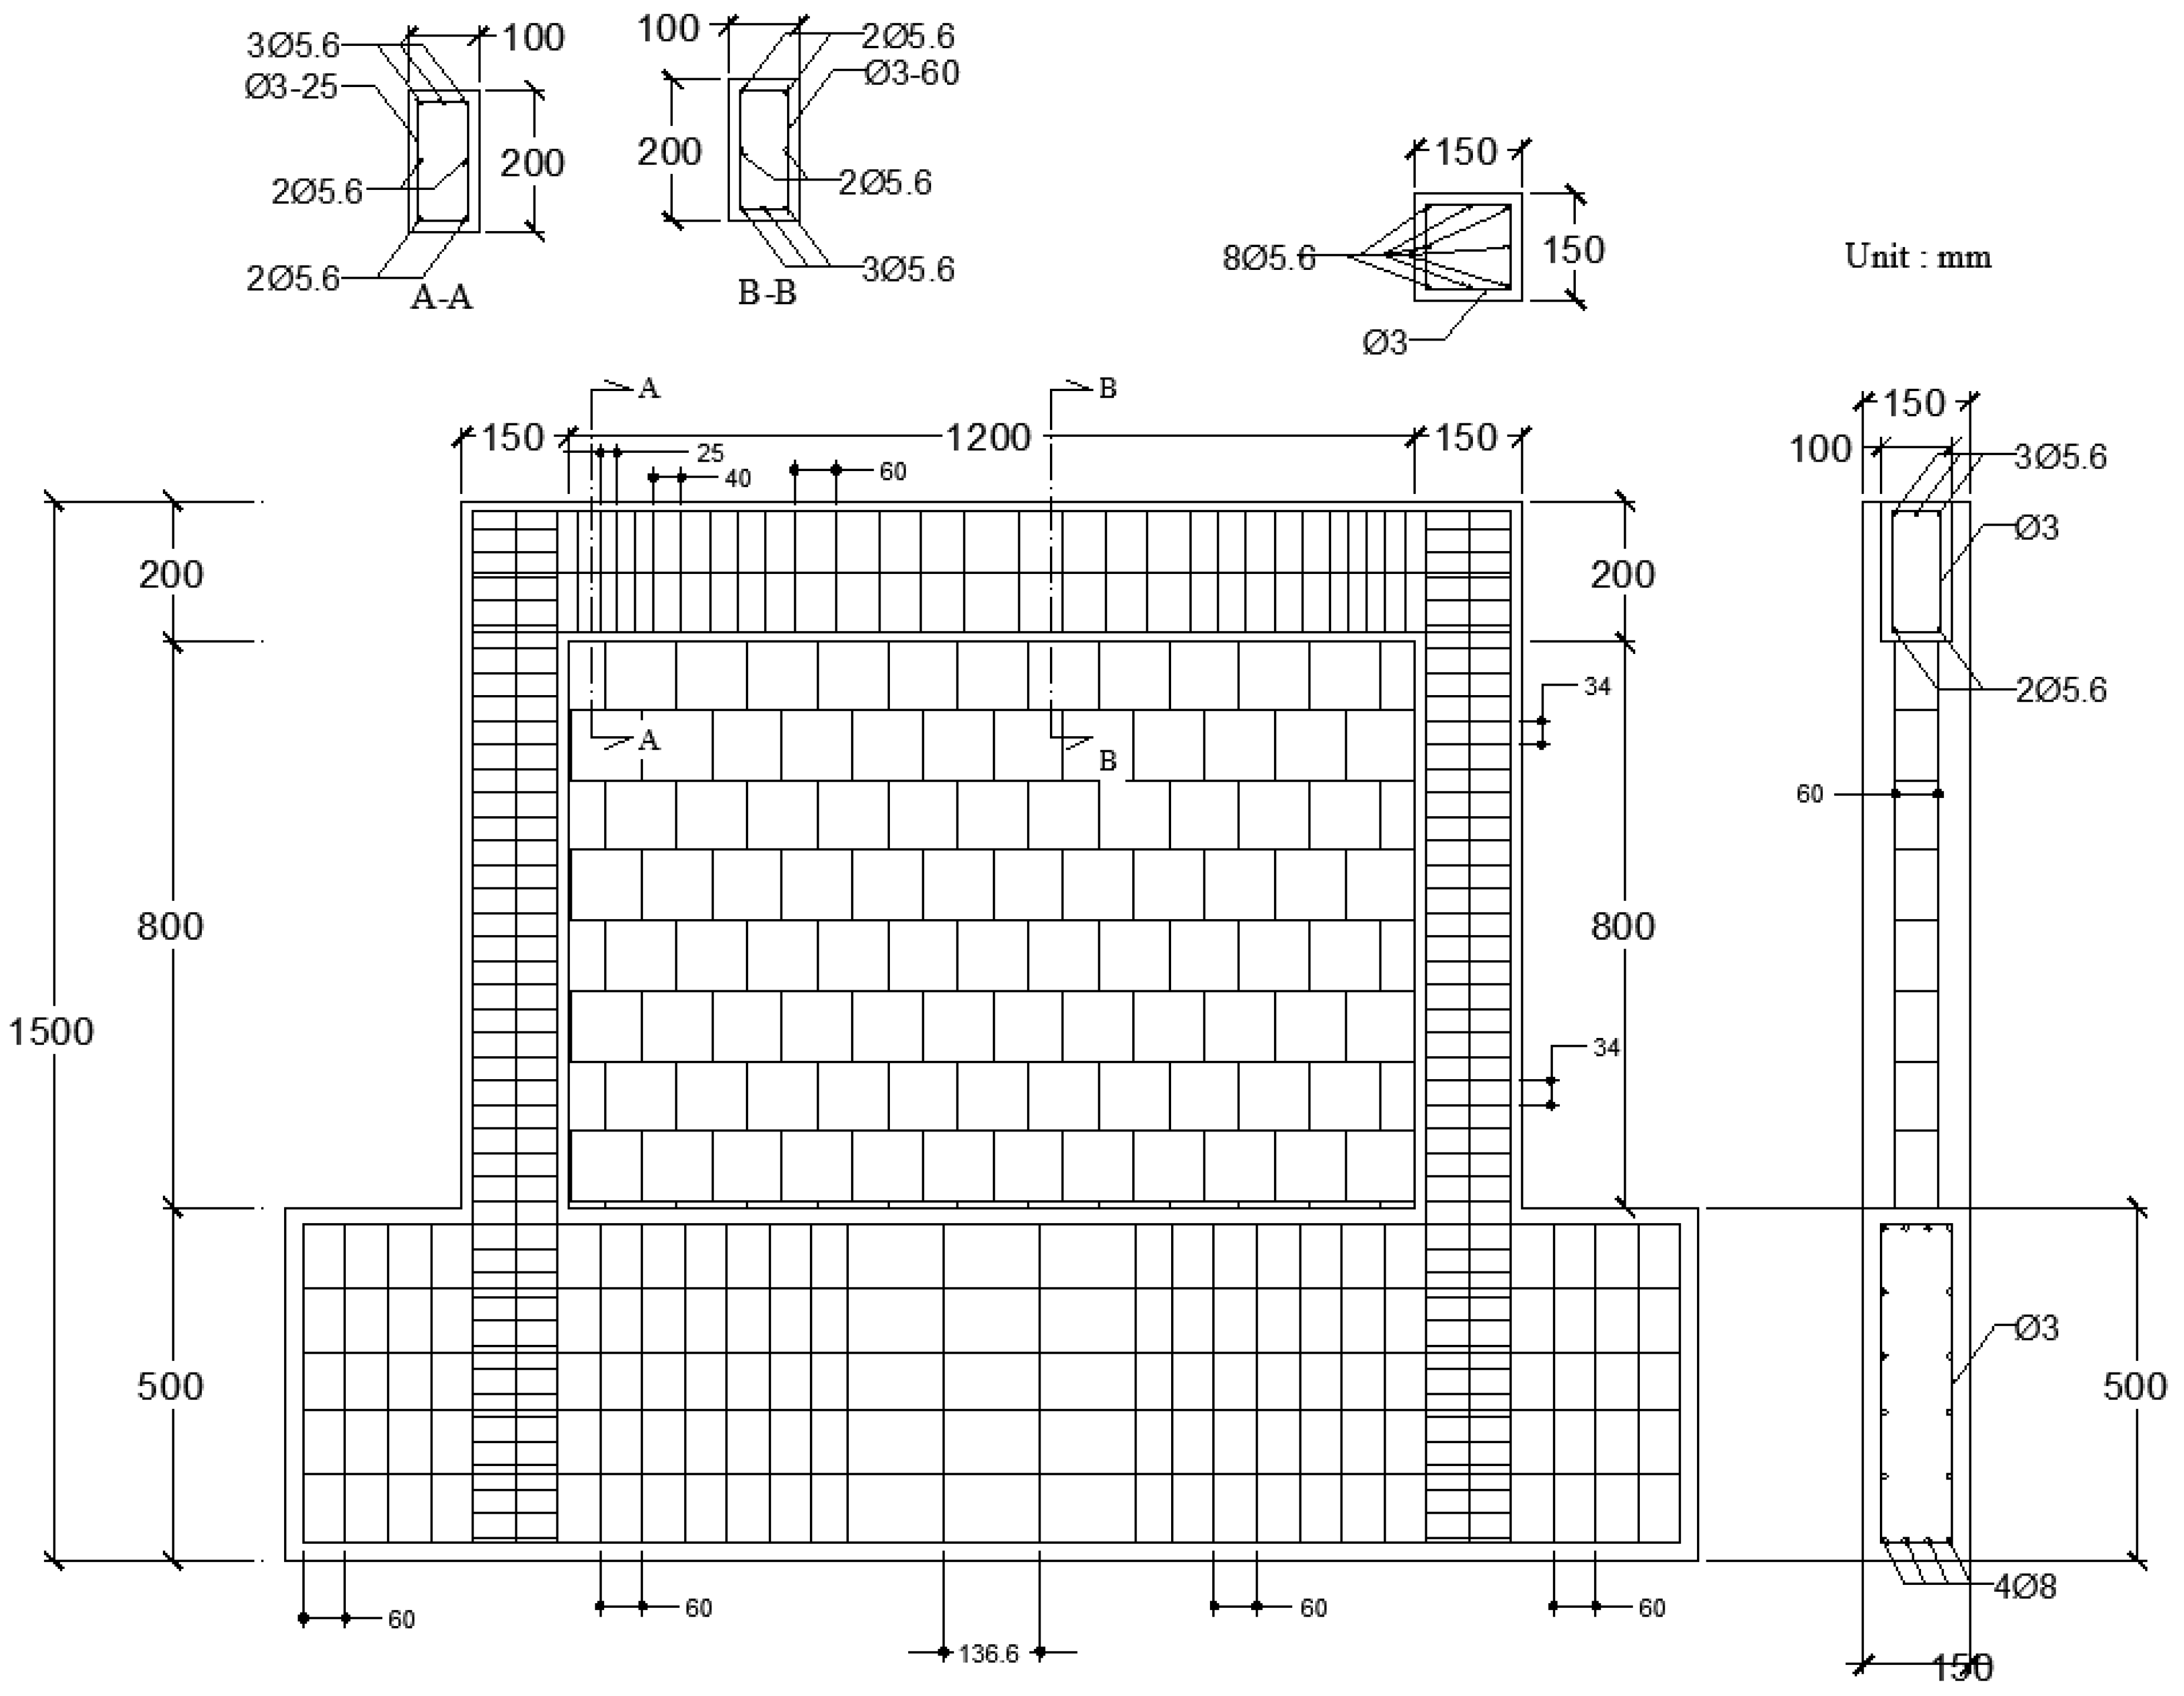
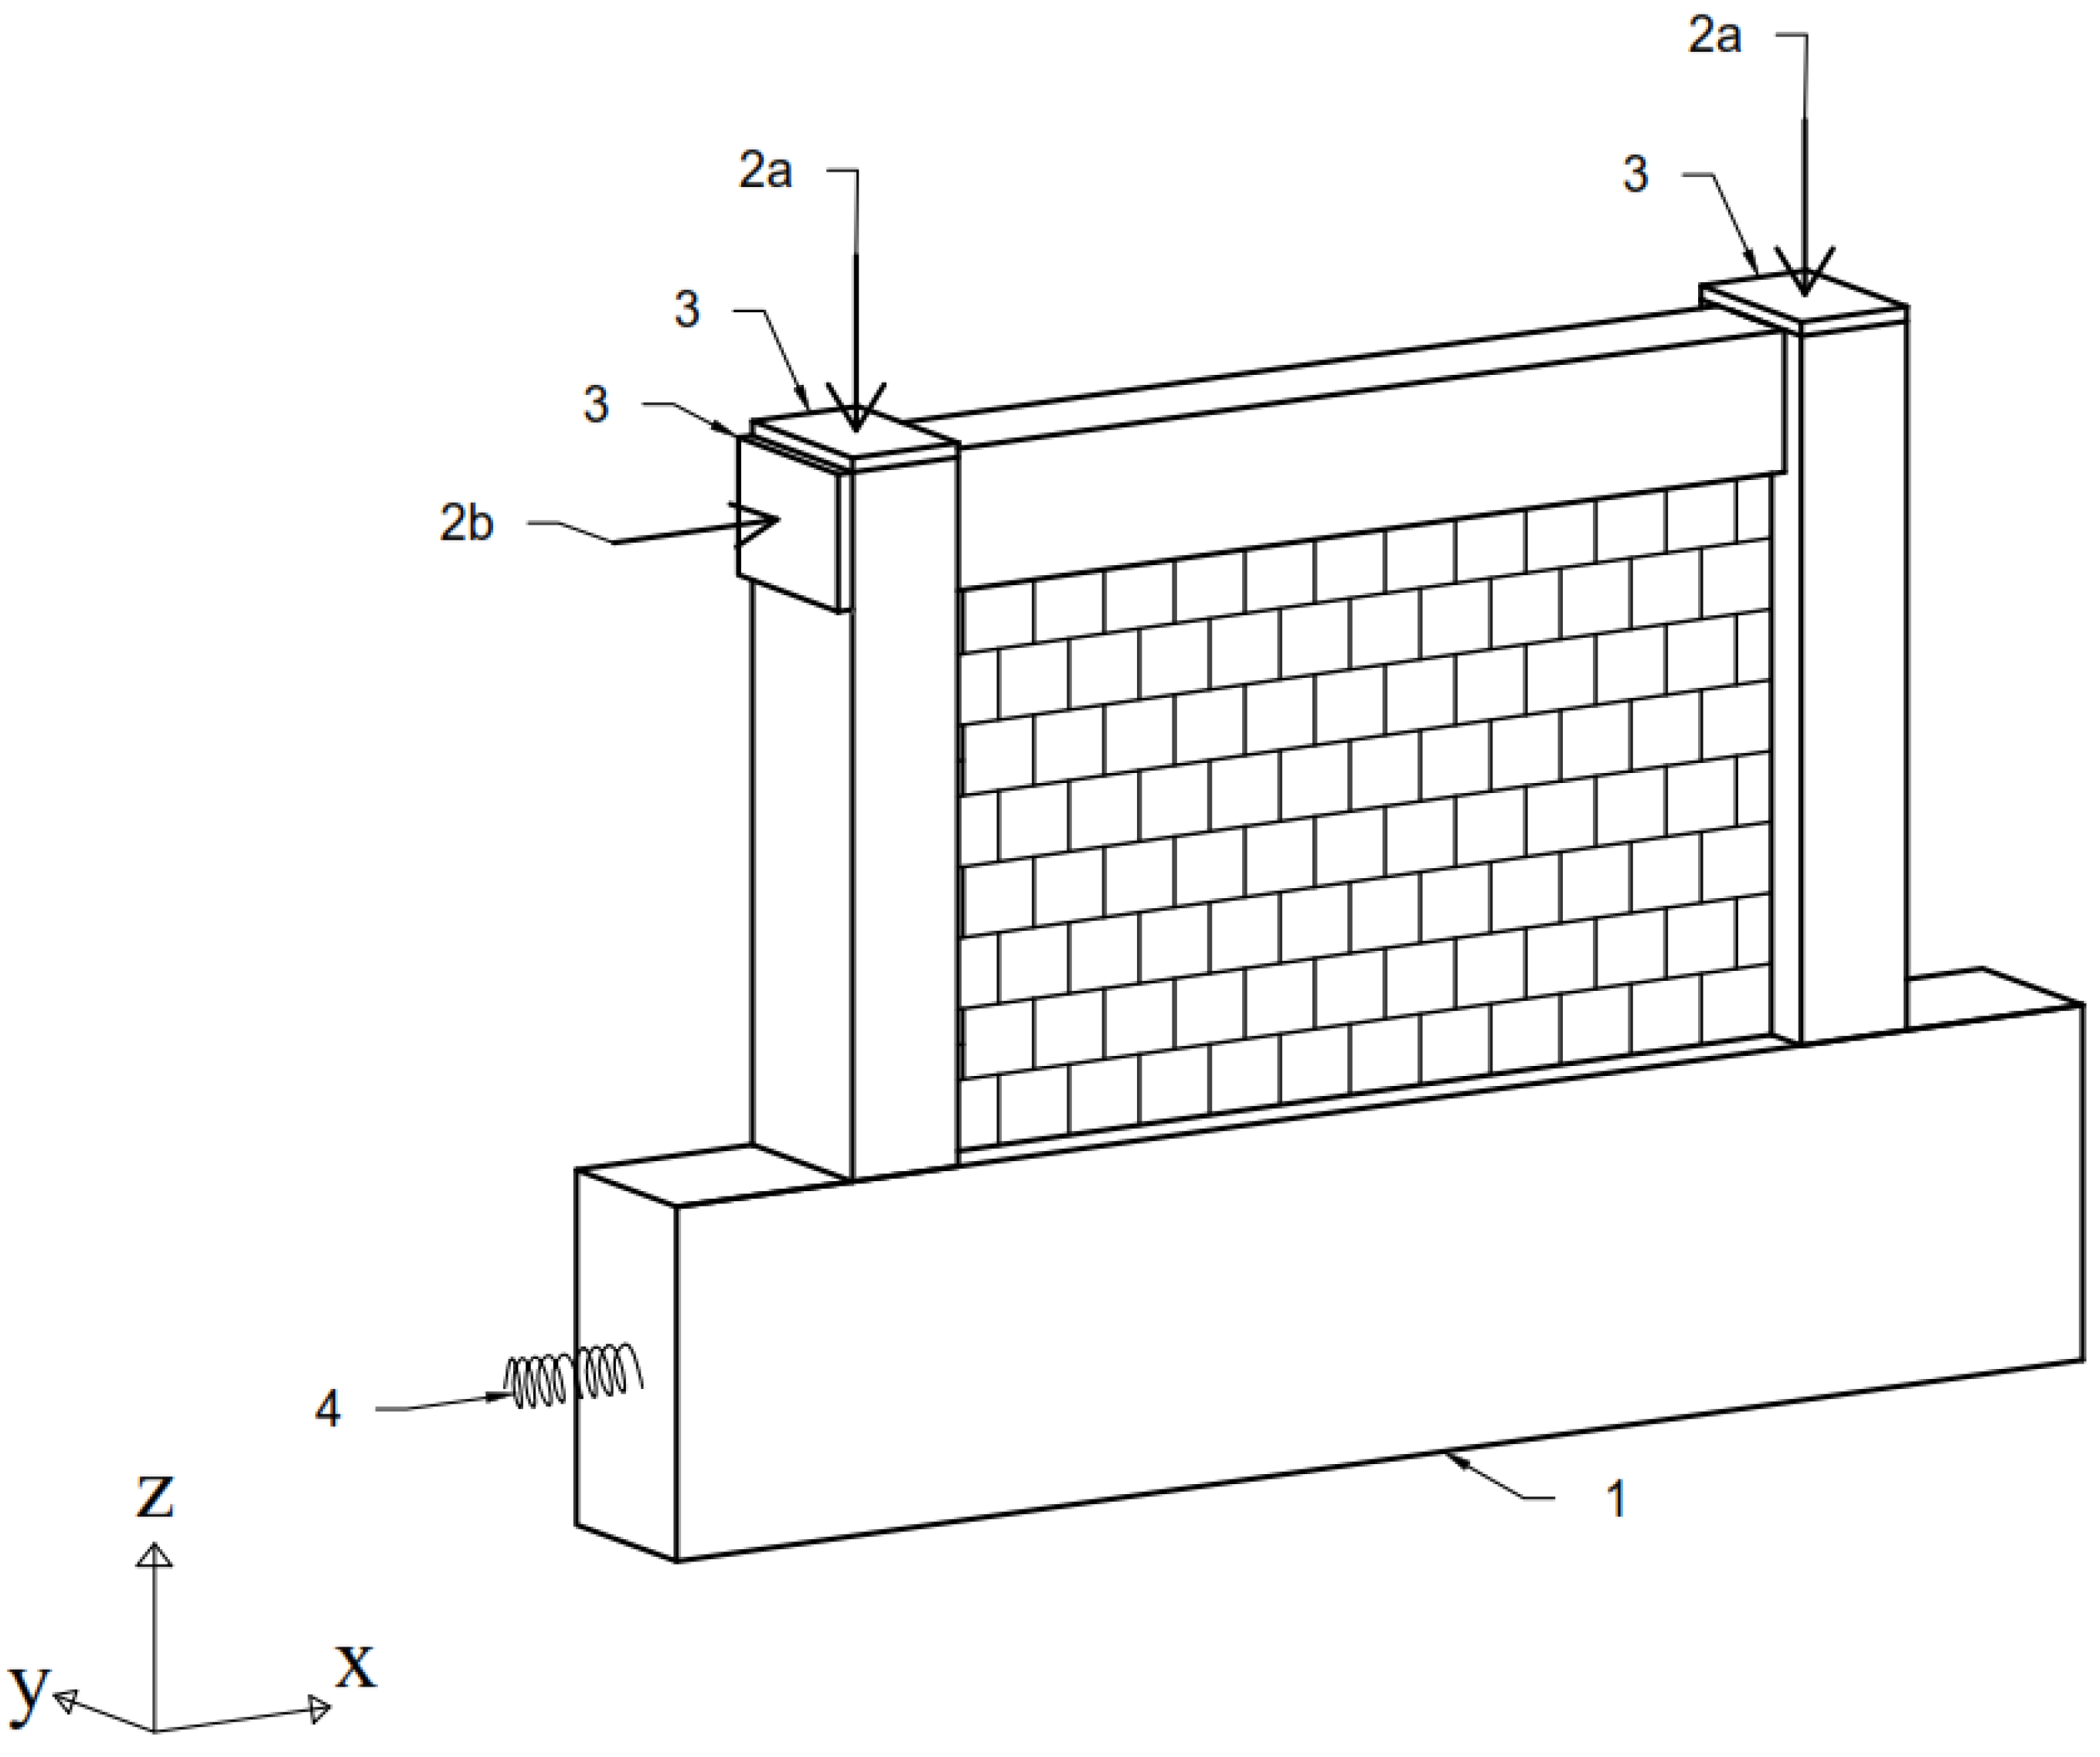
4.1. Modeling Configuration
4.2. Meso Modeling Approaches
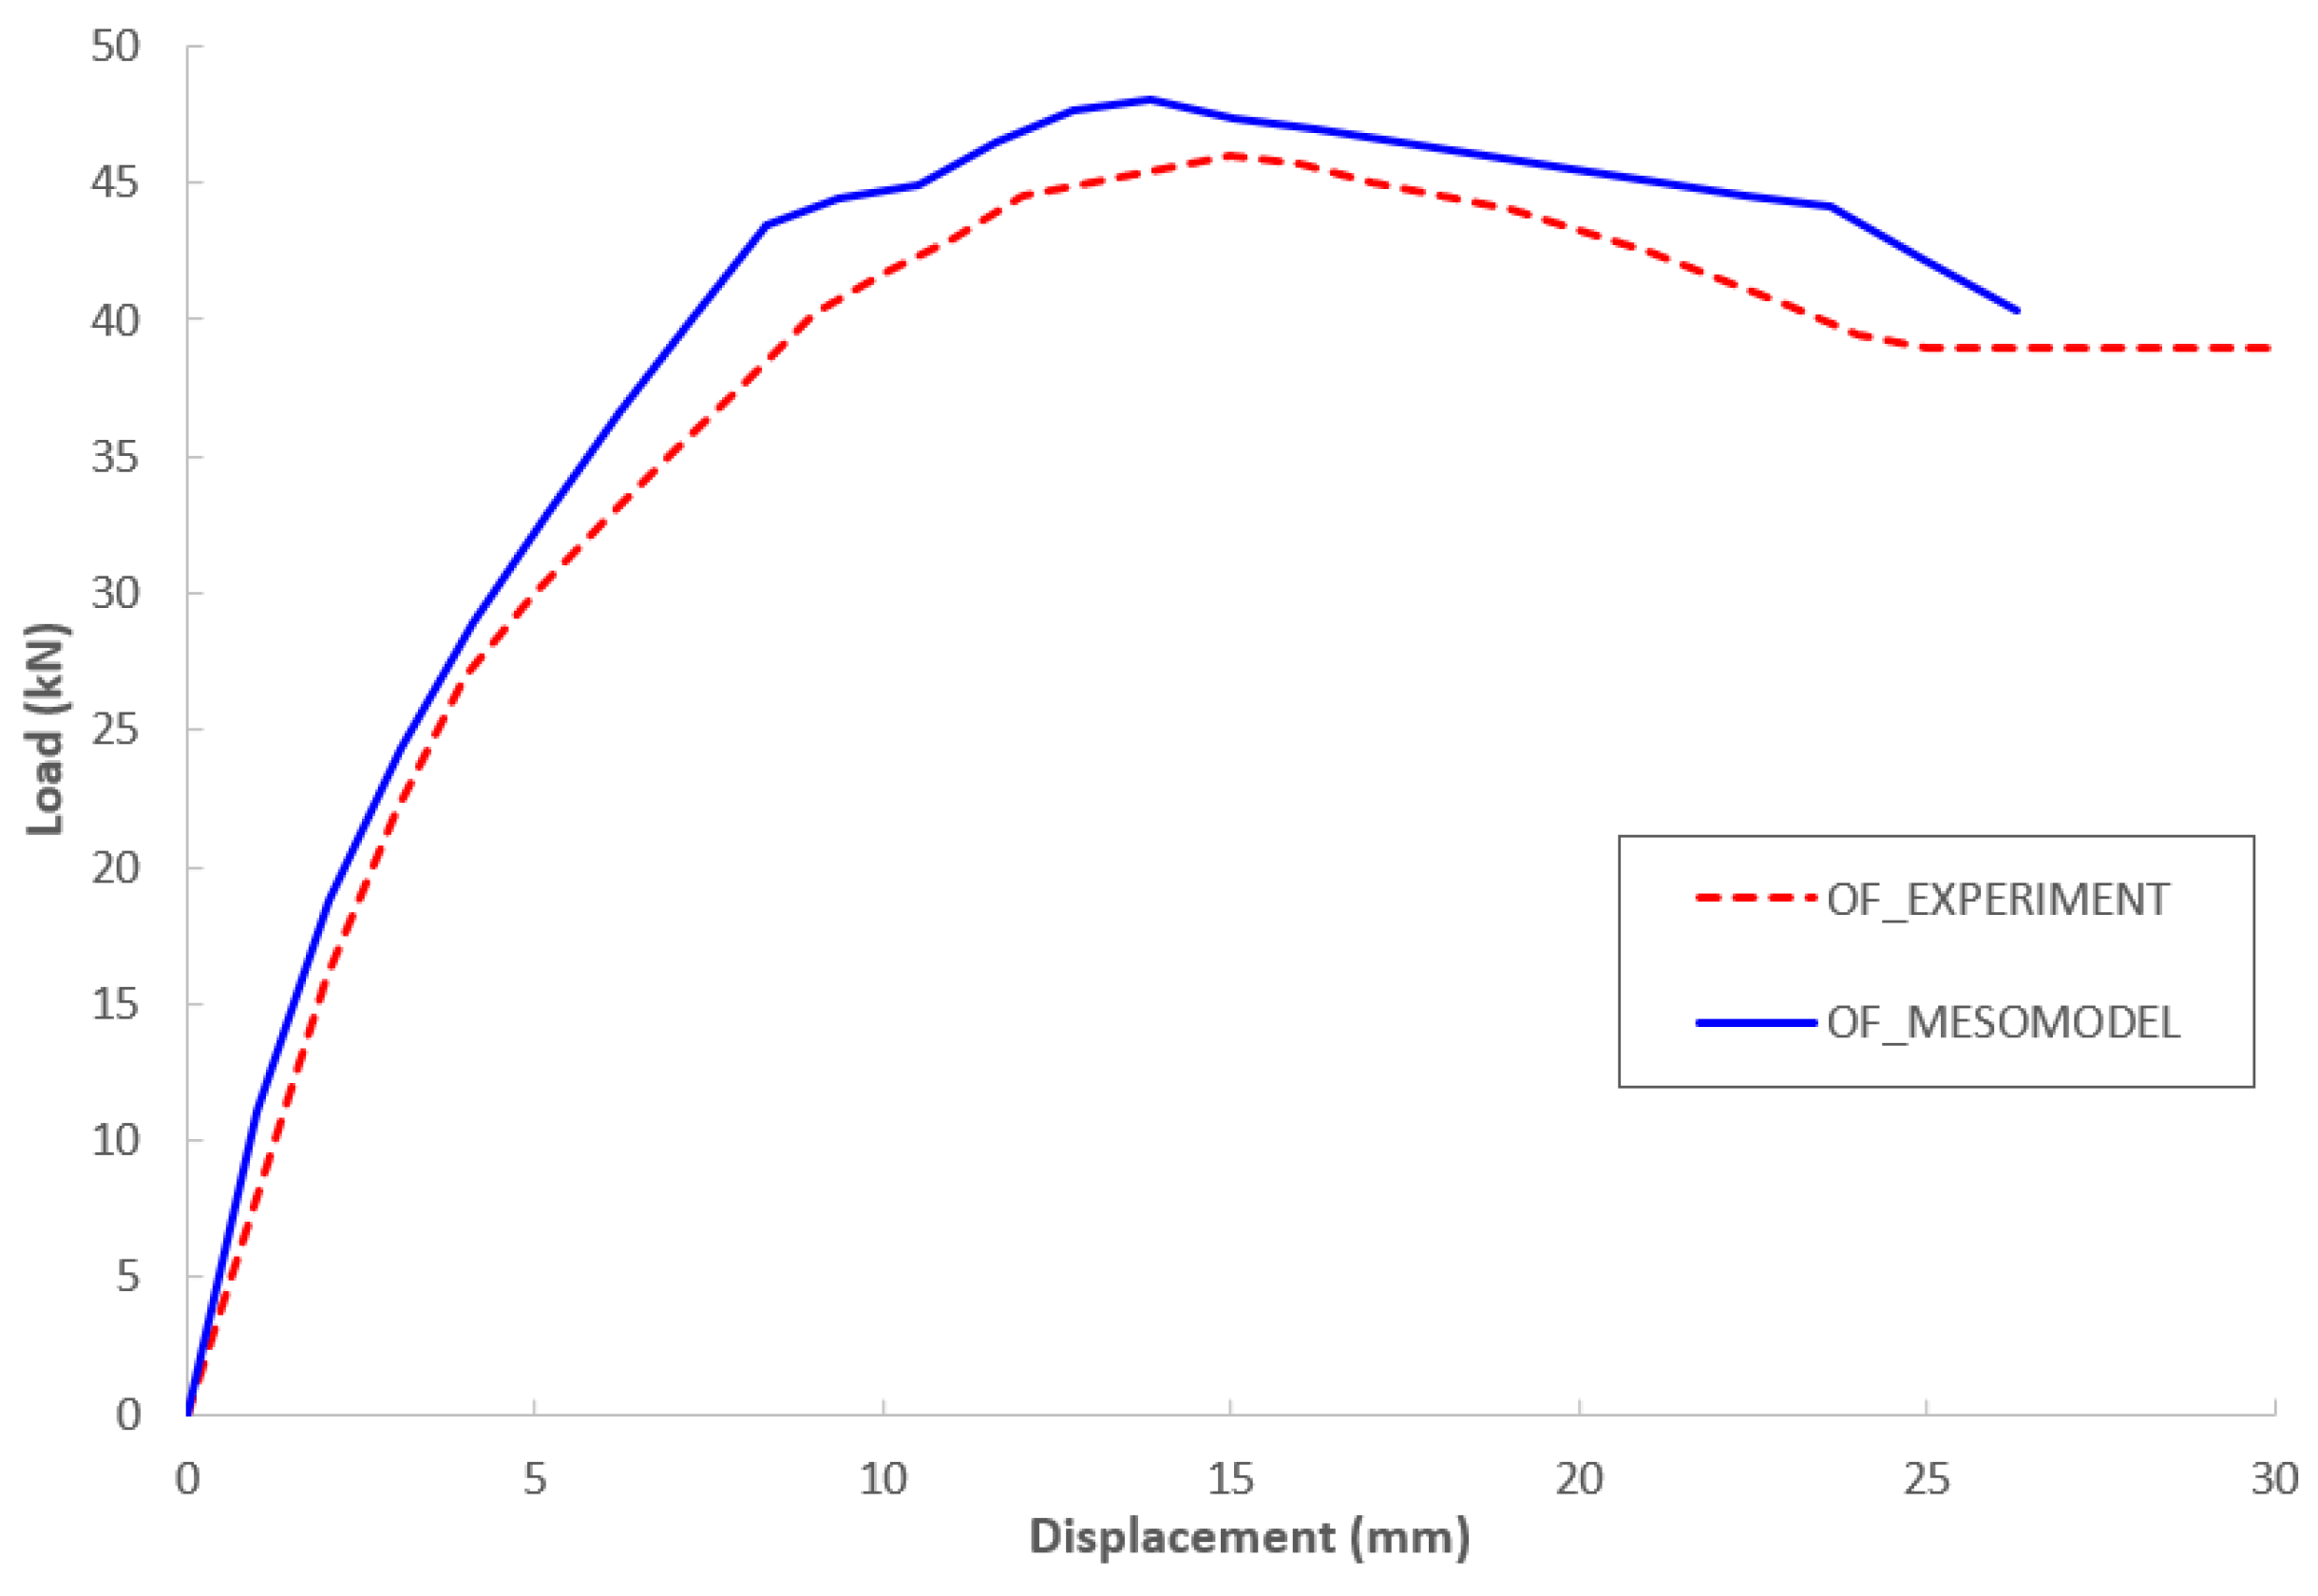
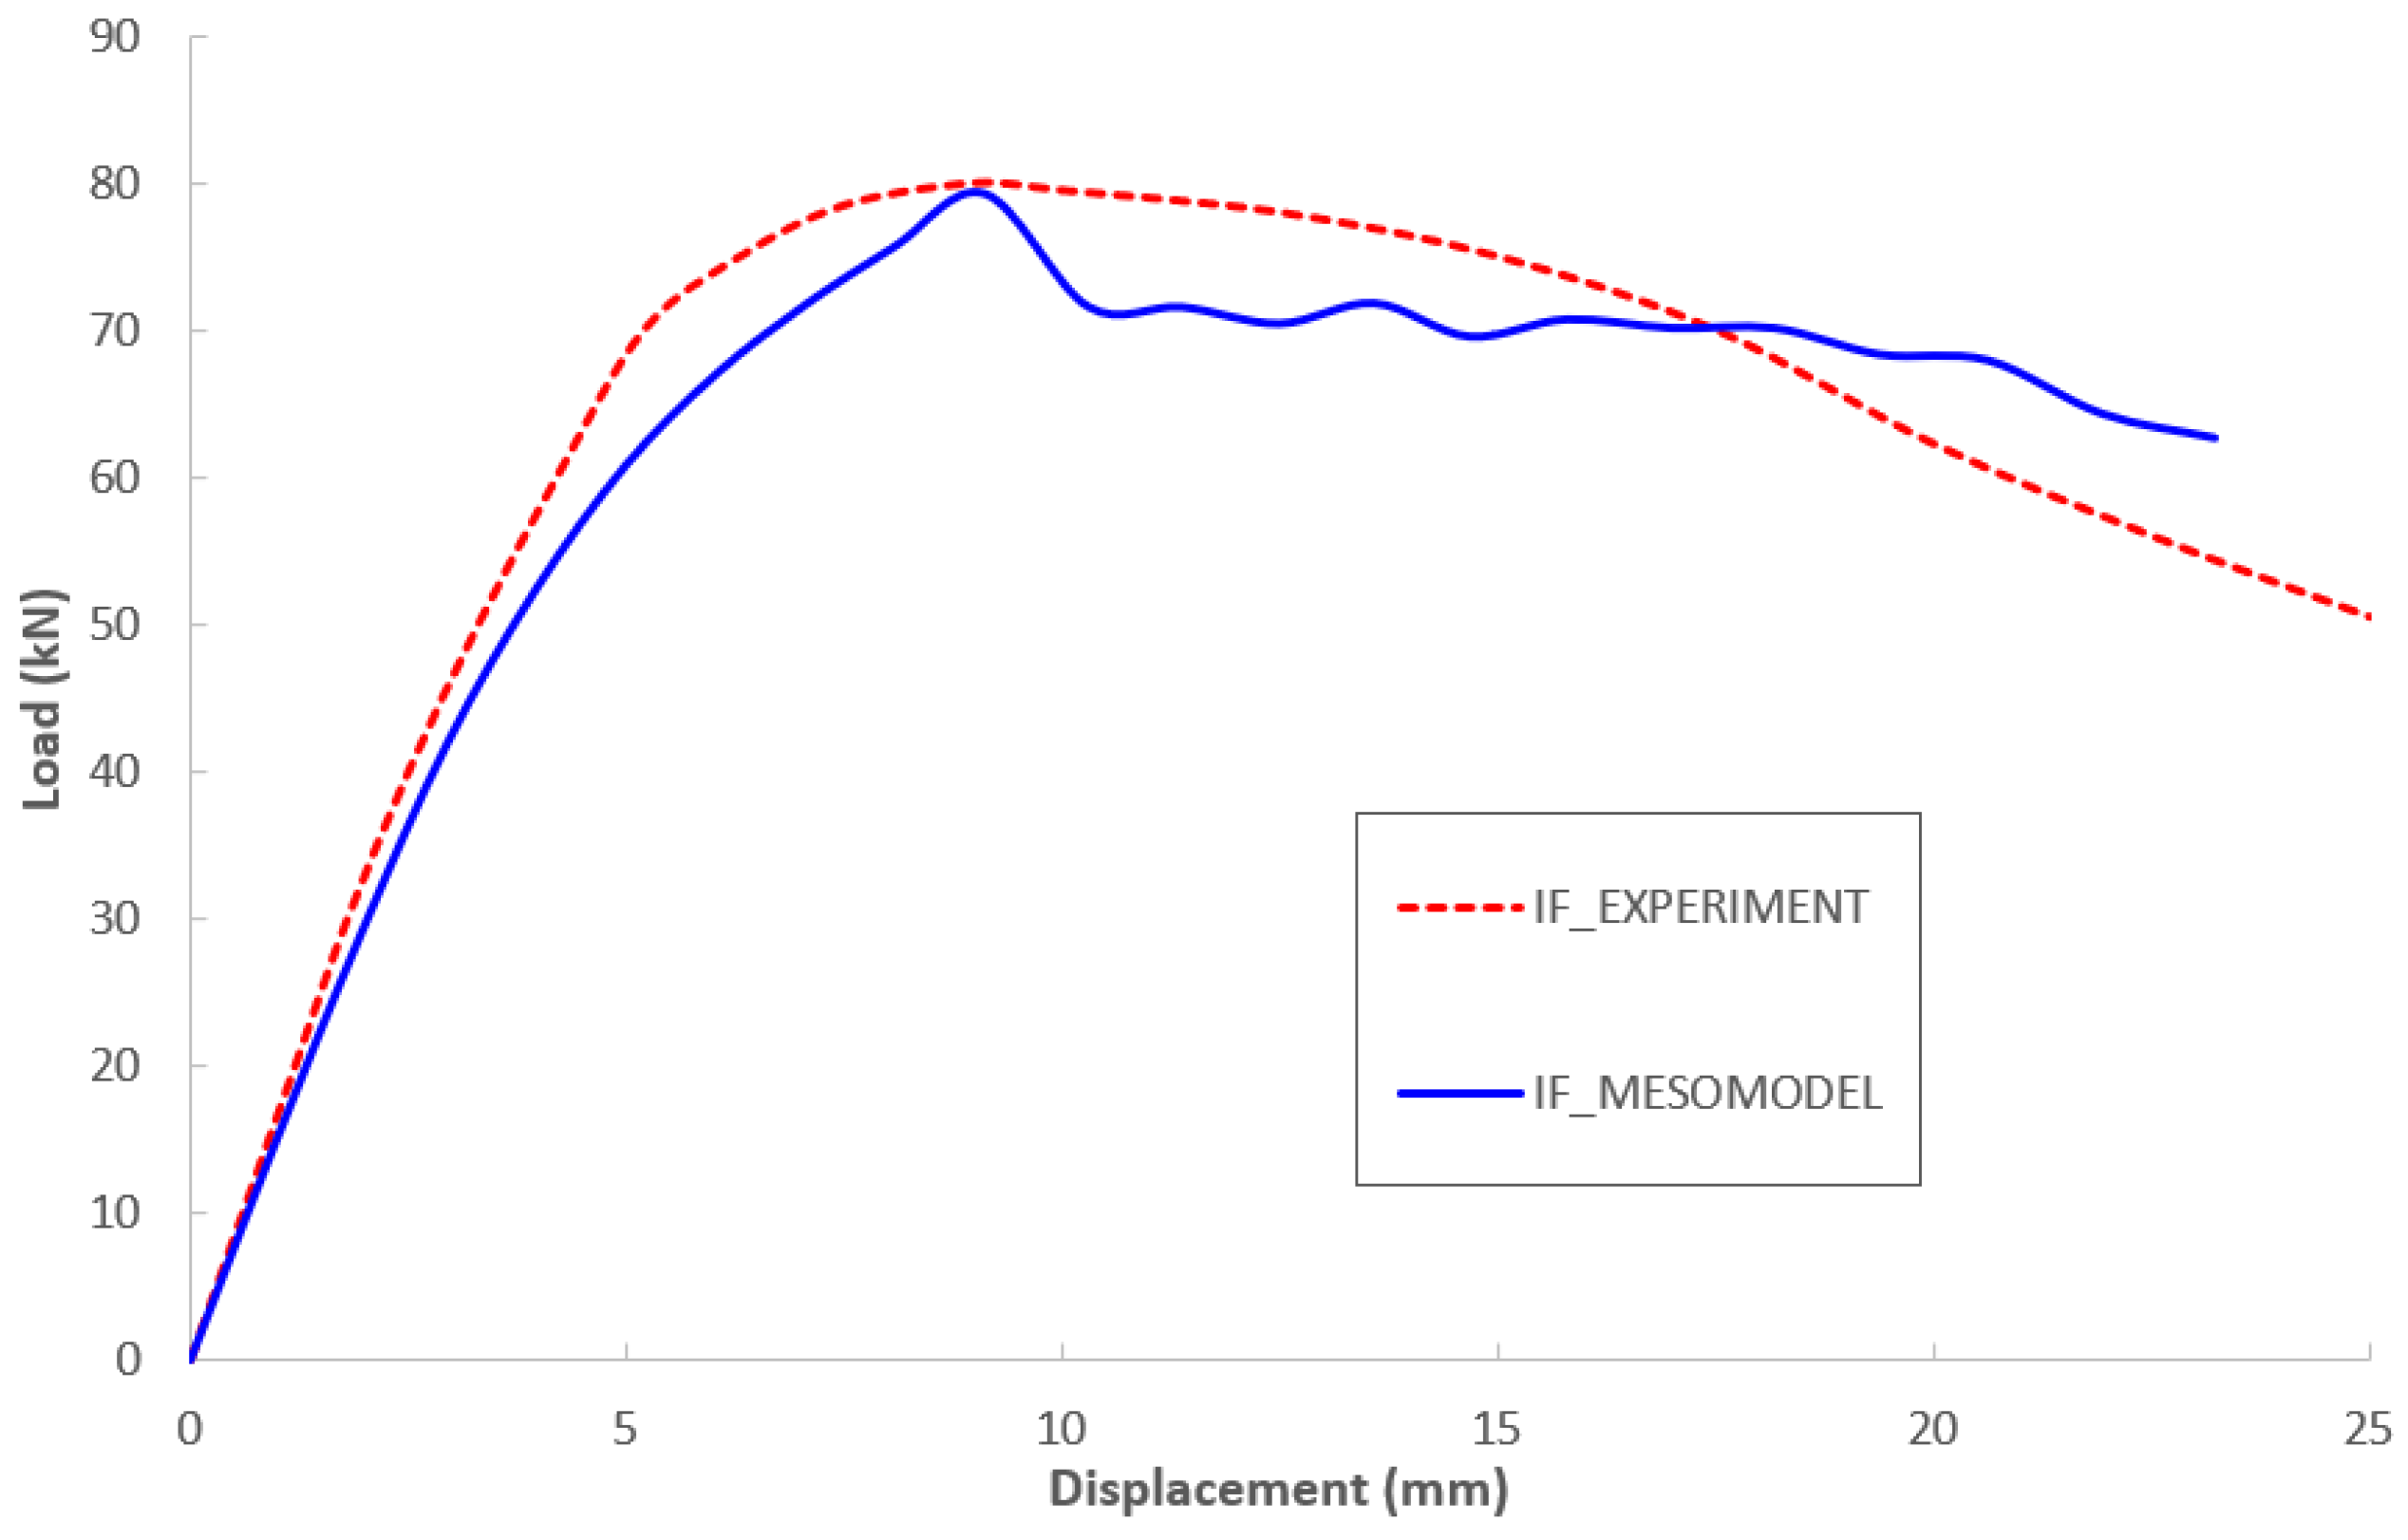
5. Numerical Modeling Validation
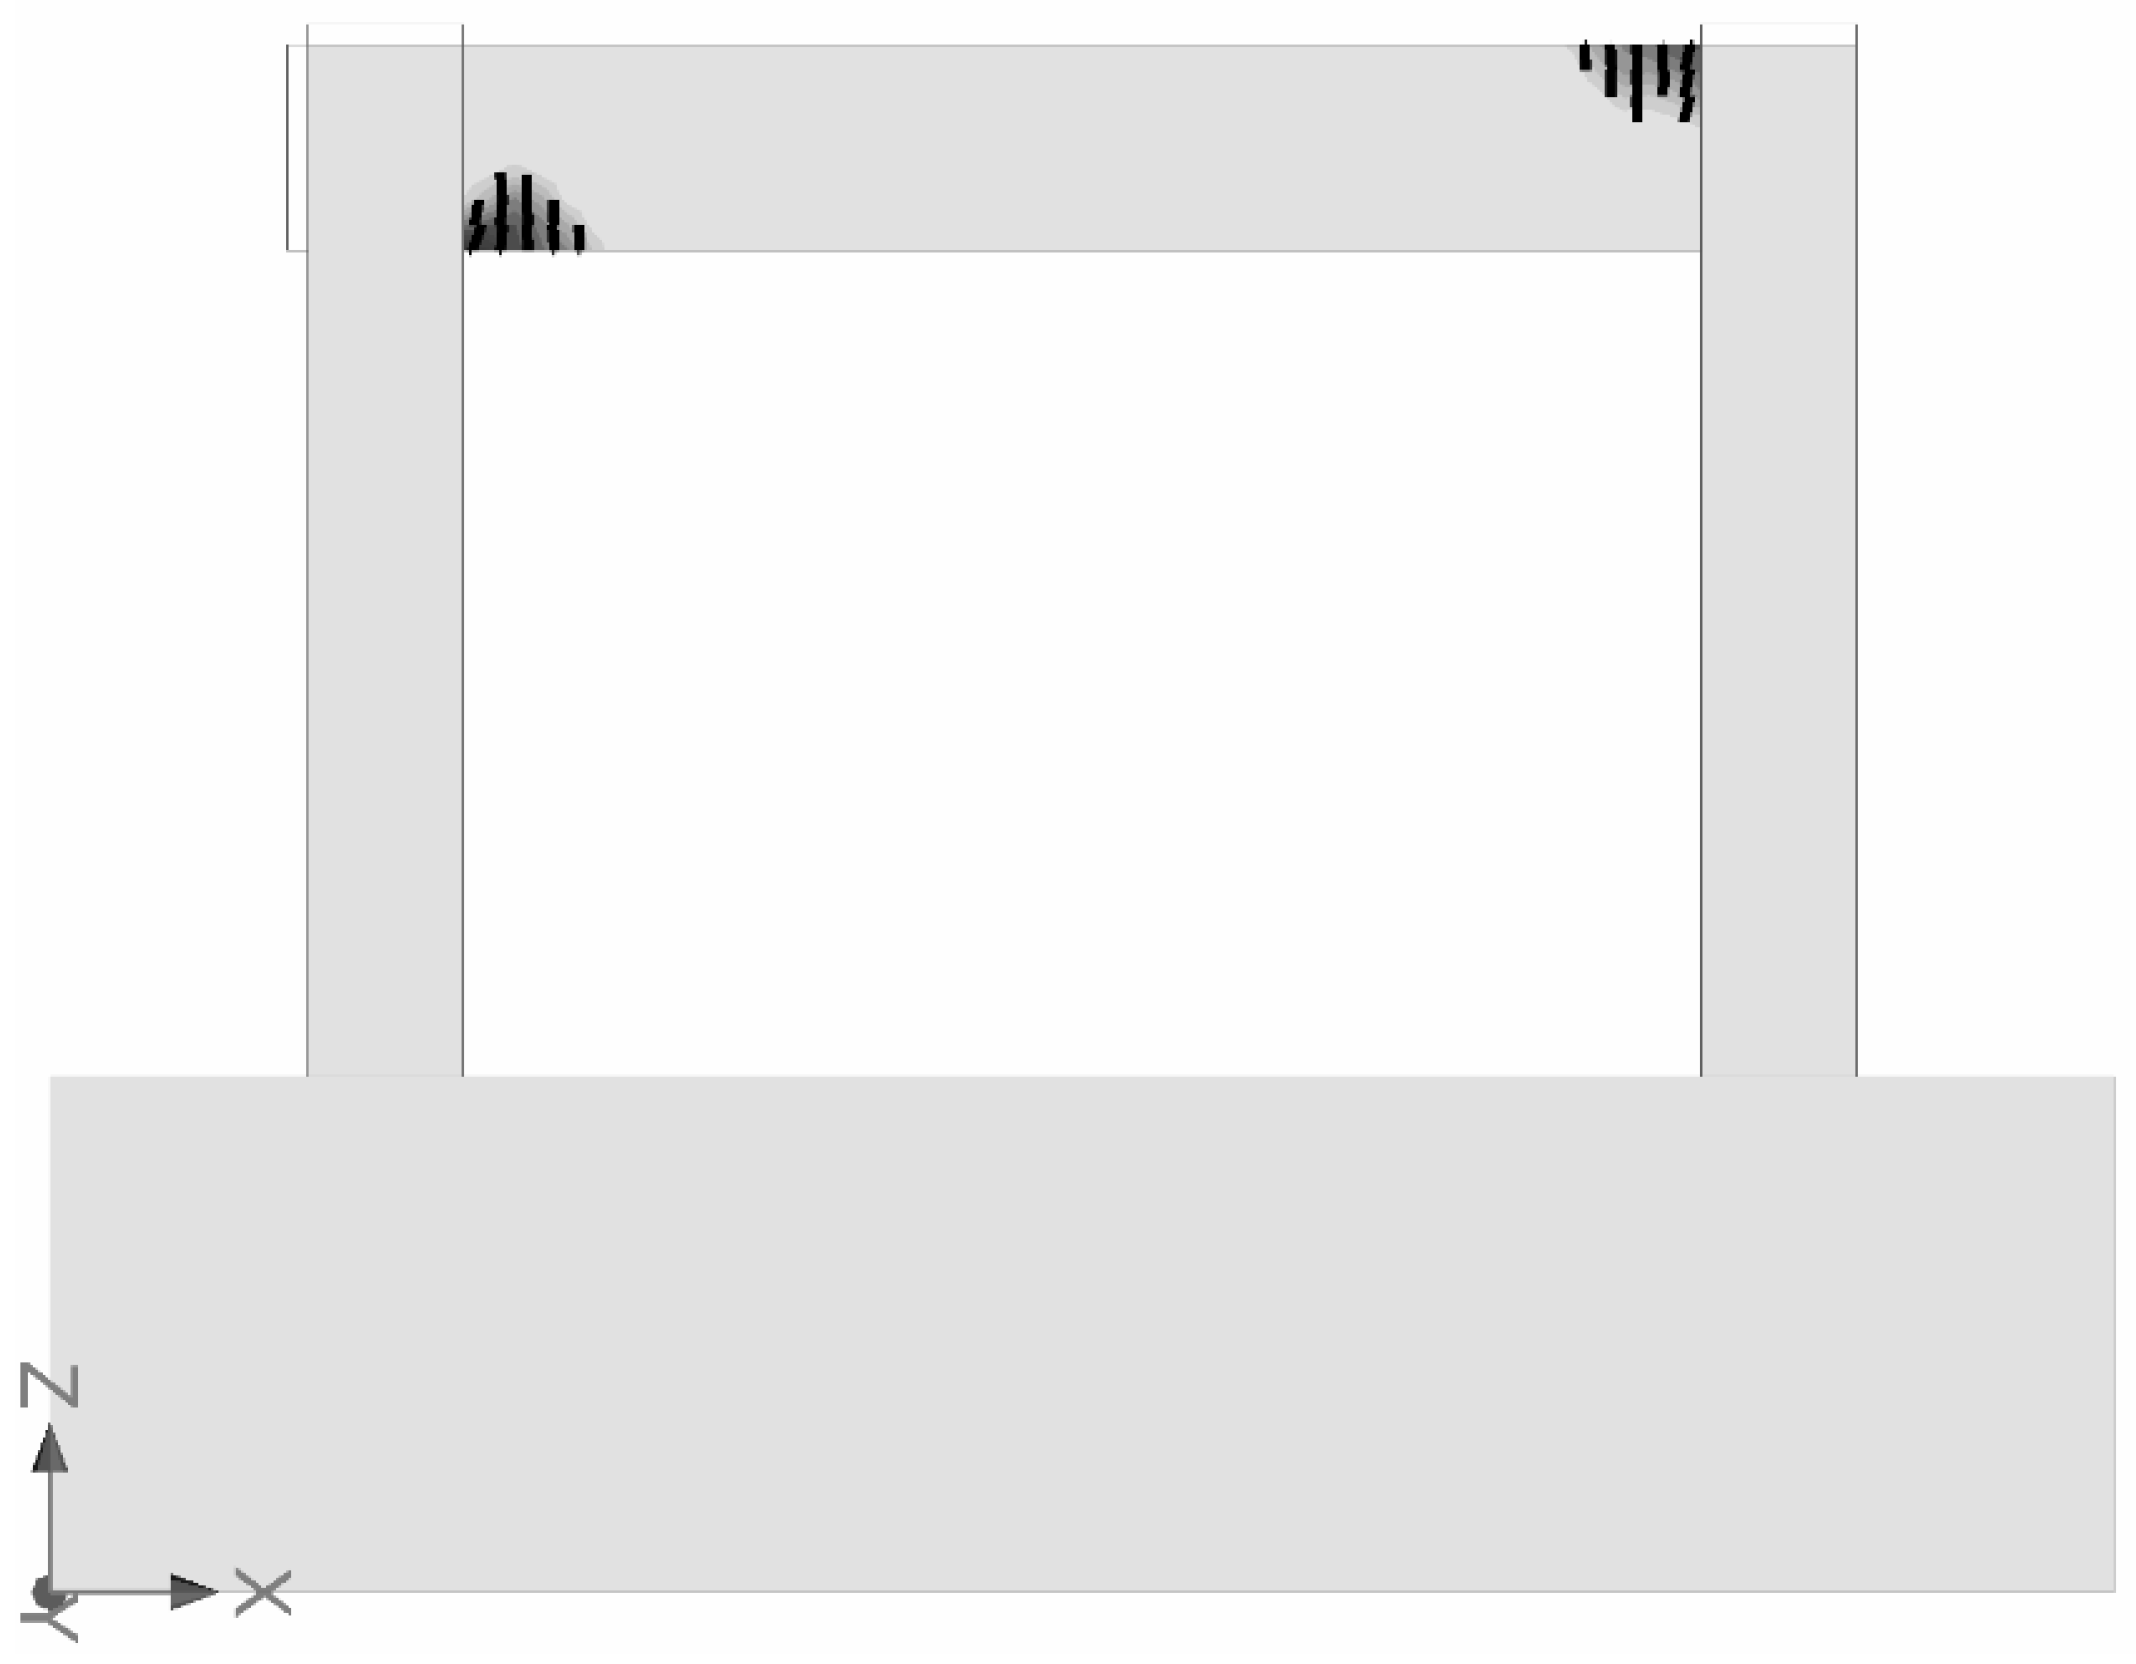
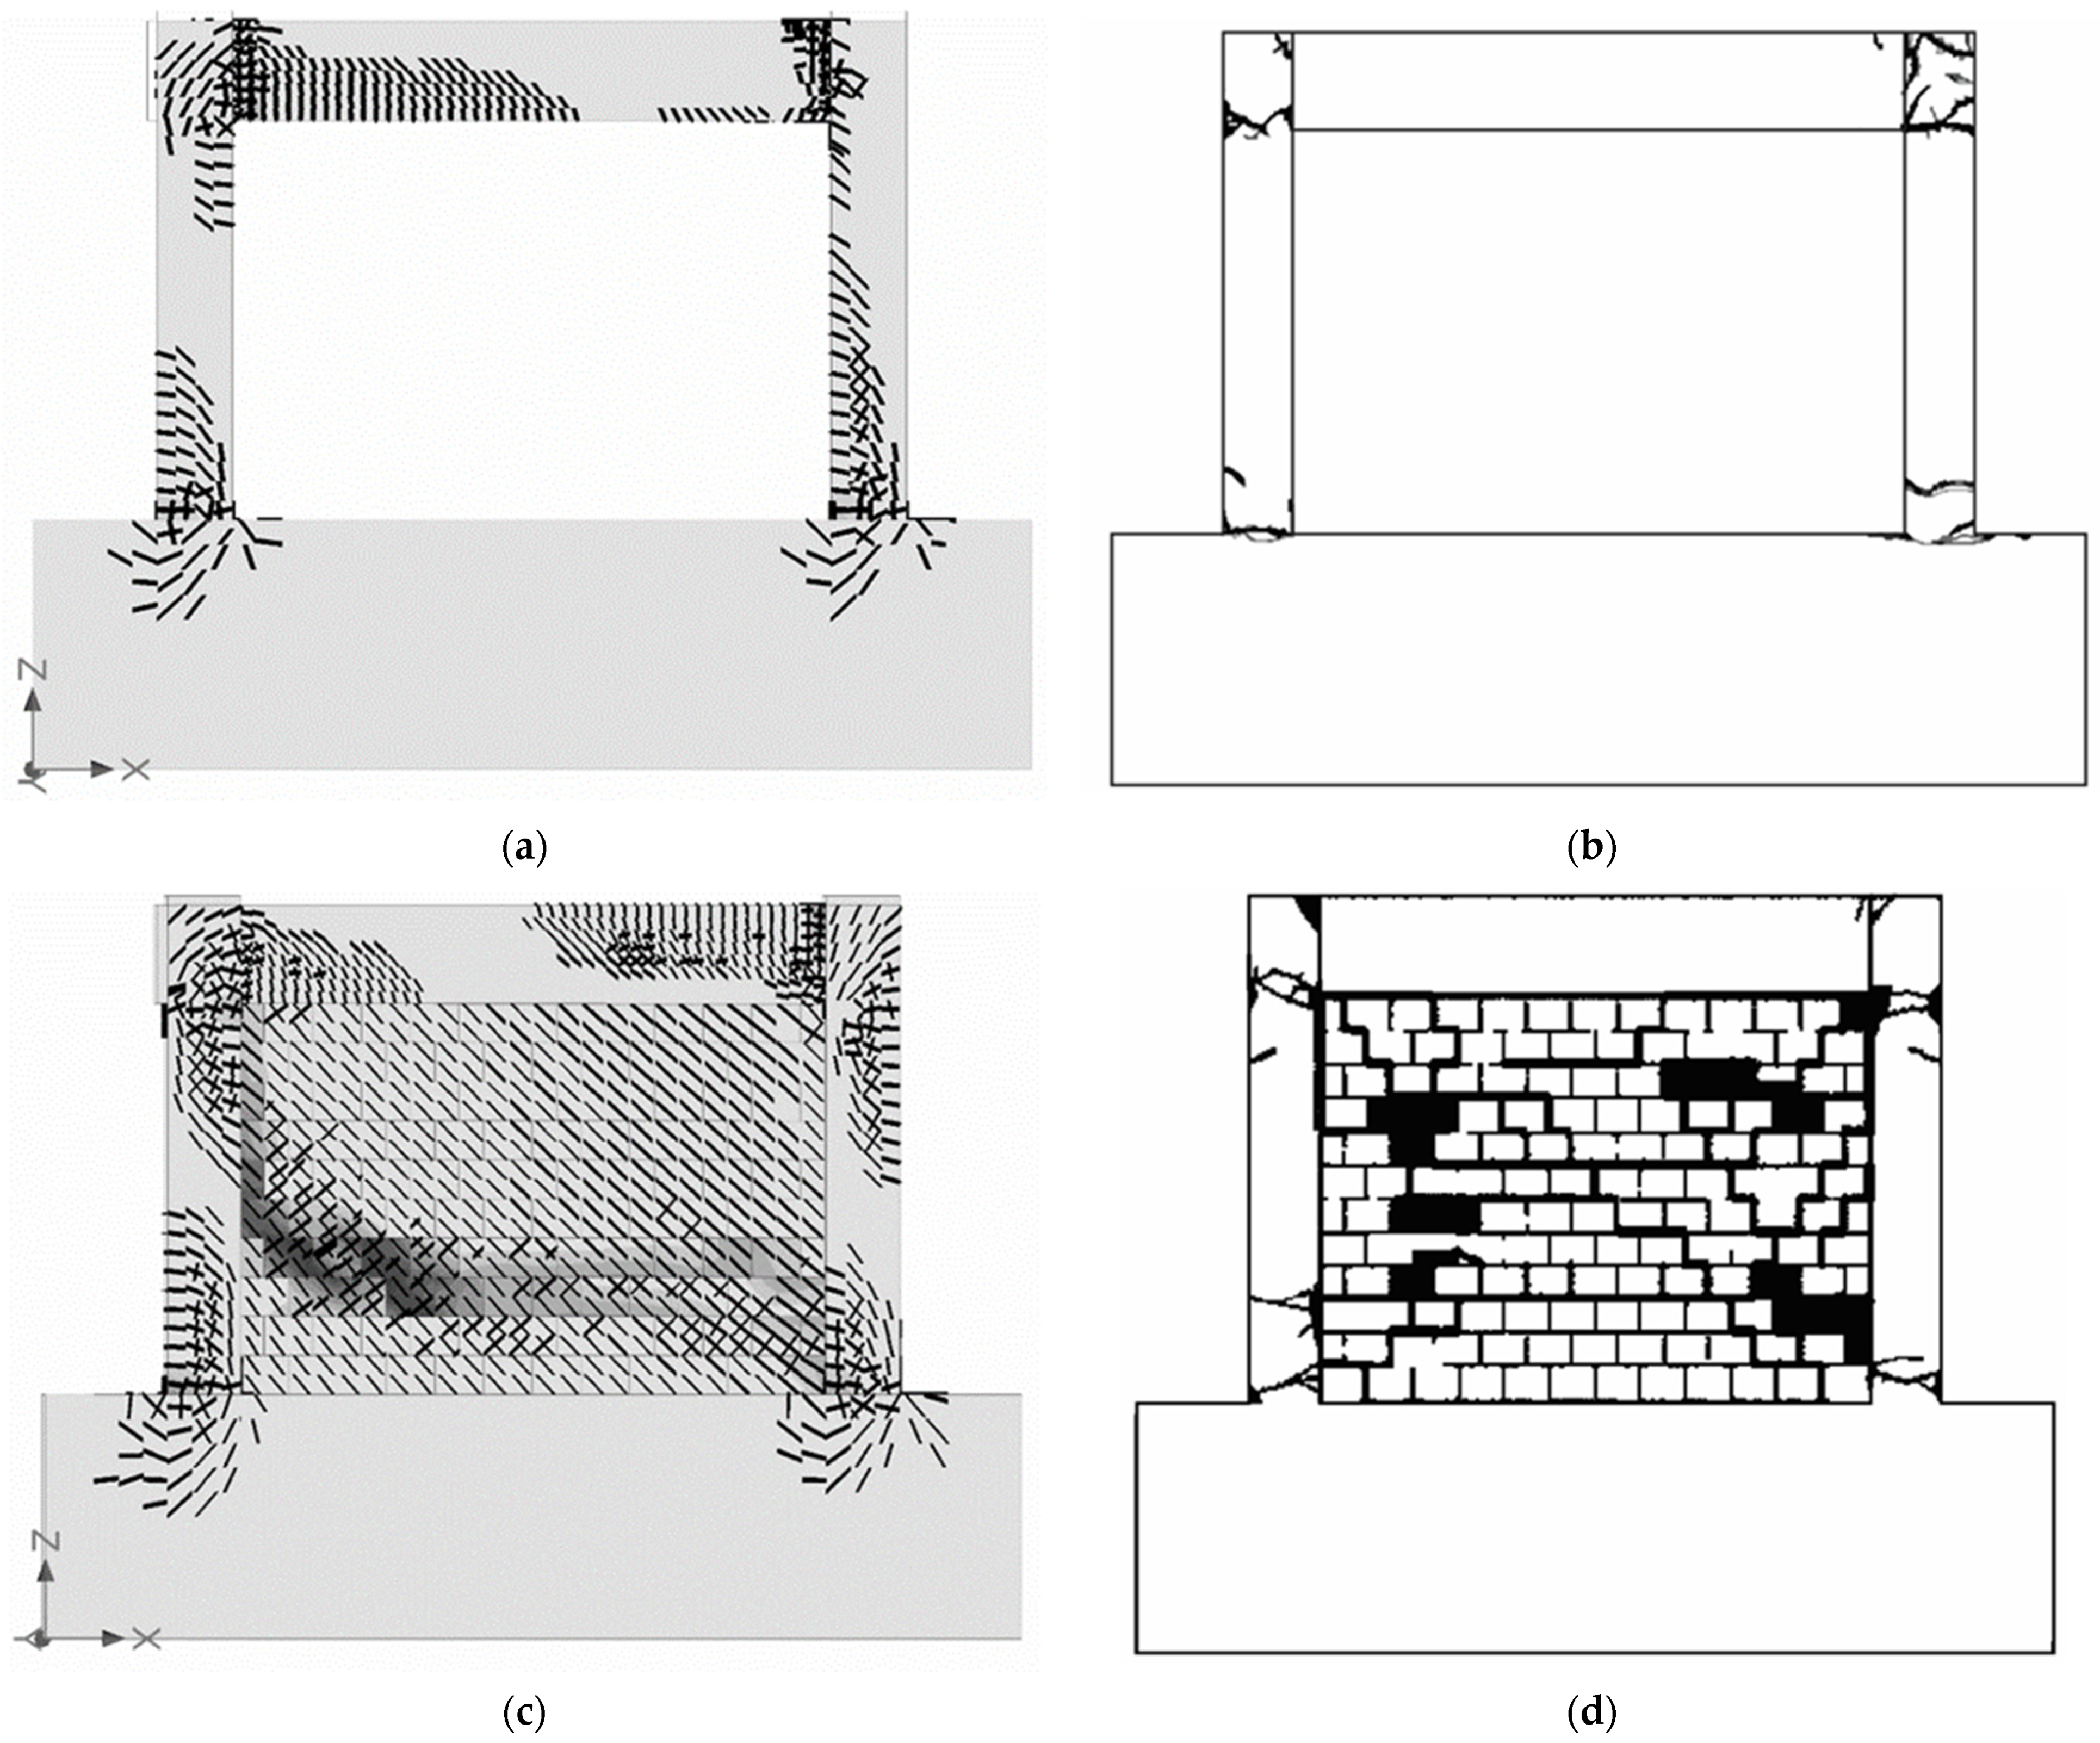
6. Damage States Analysis
7. Conclusions
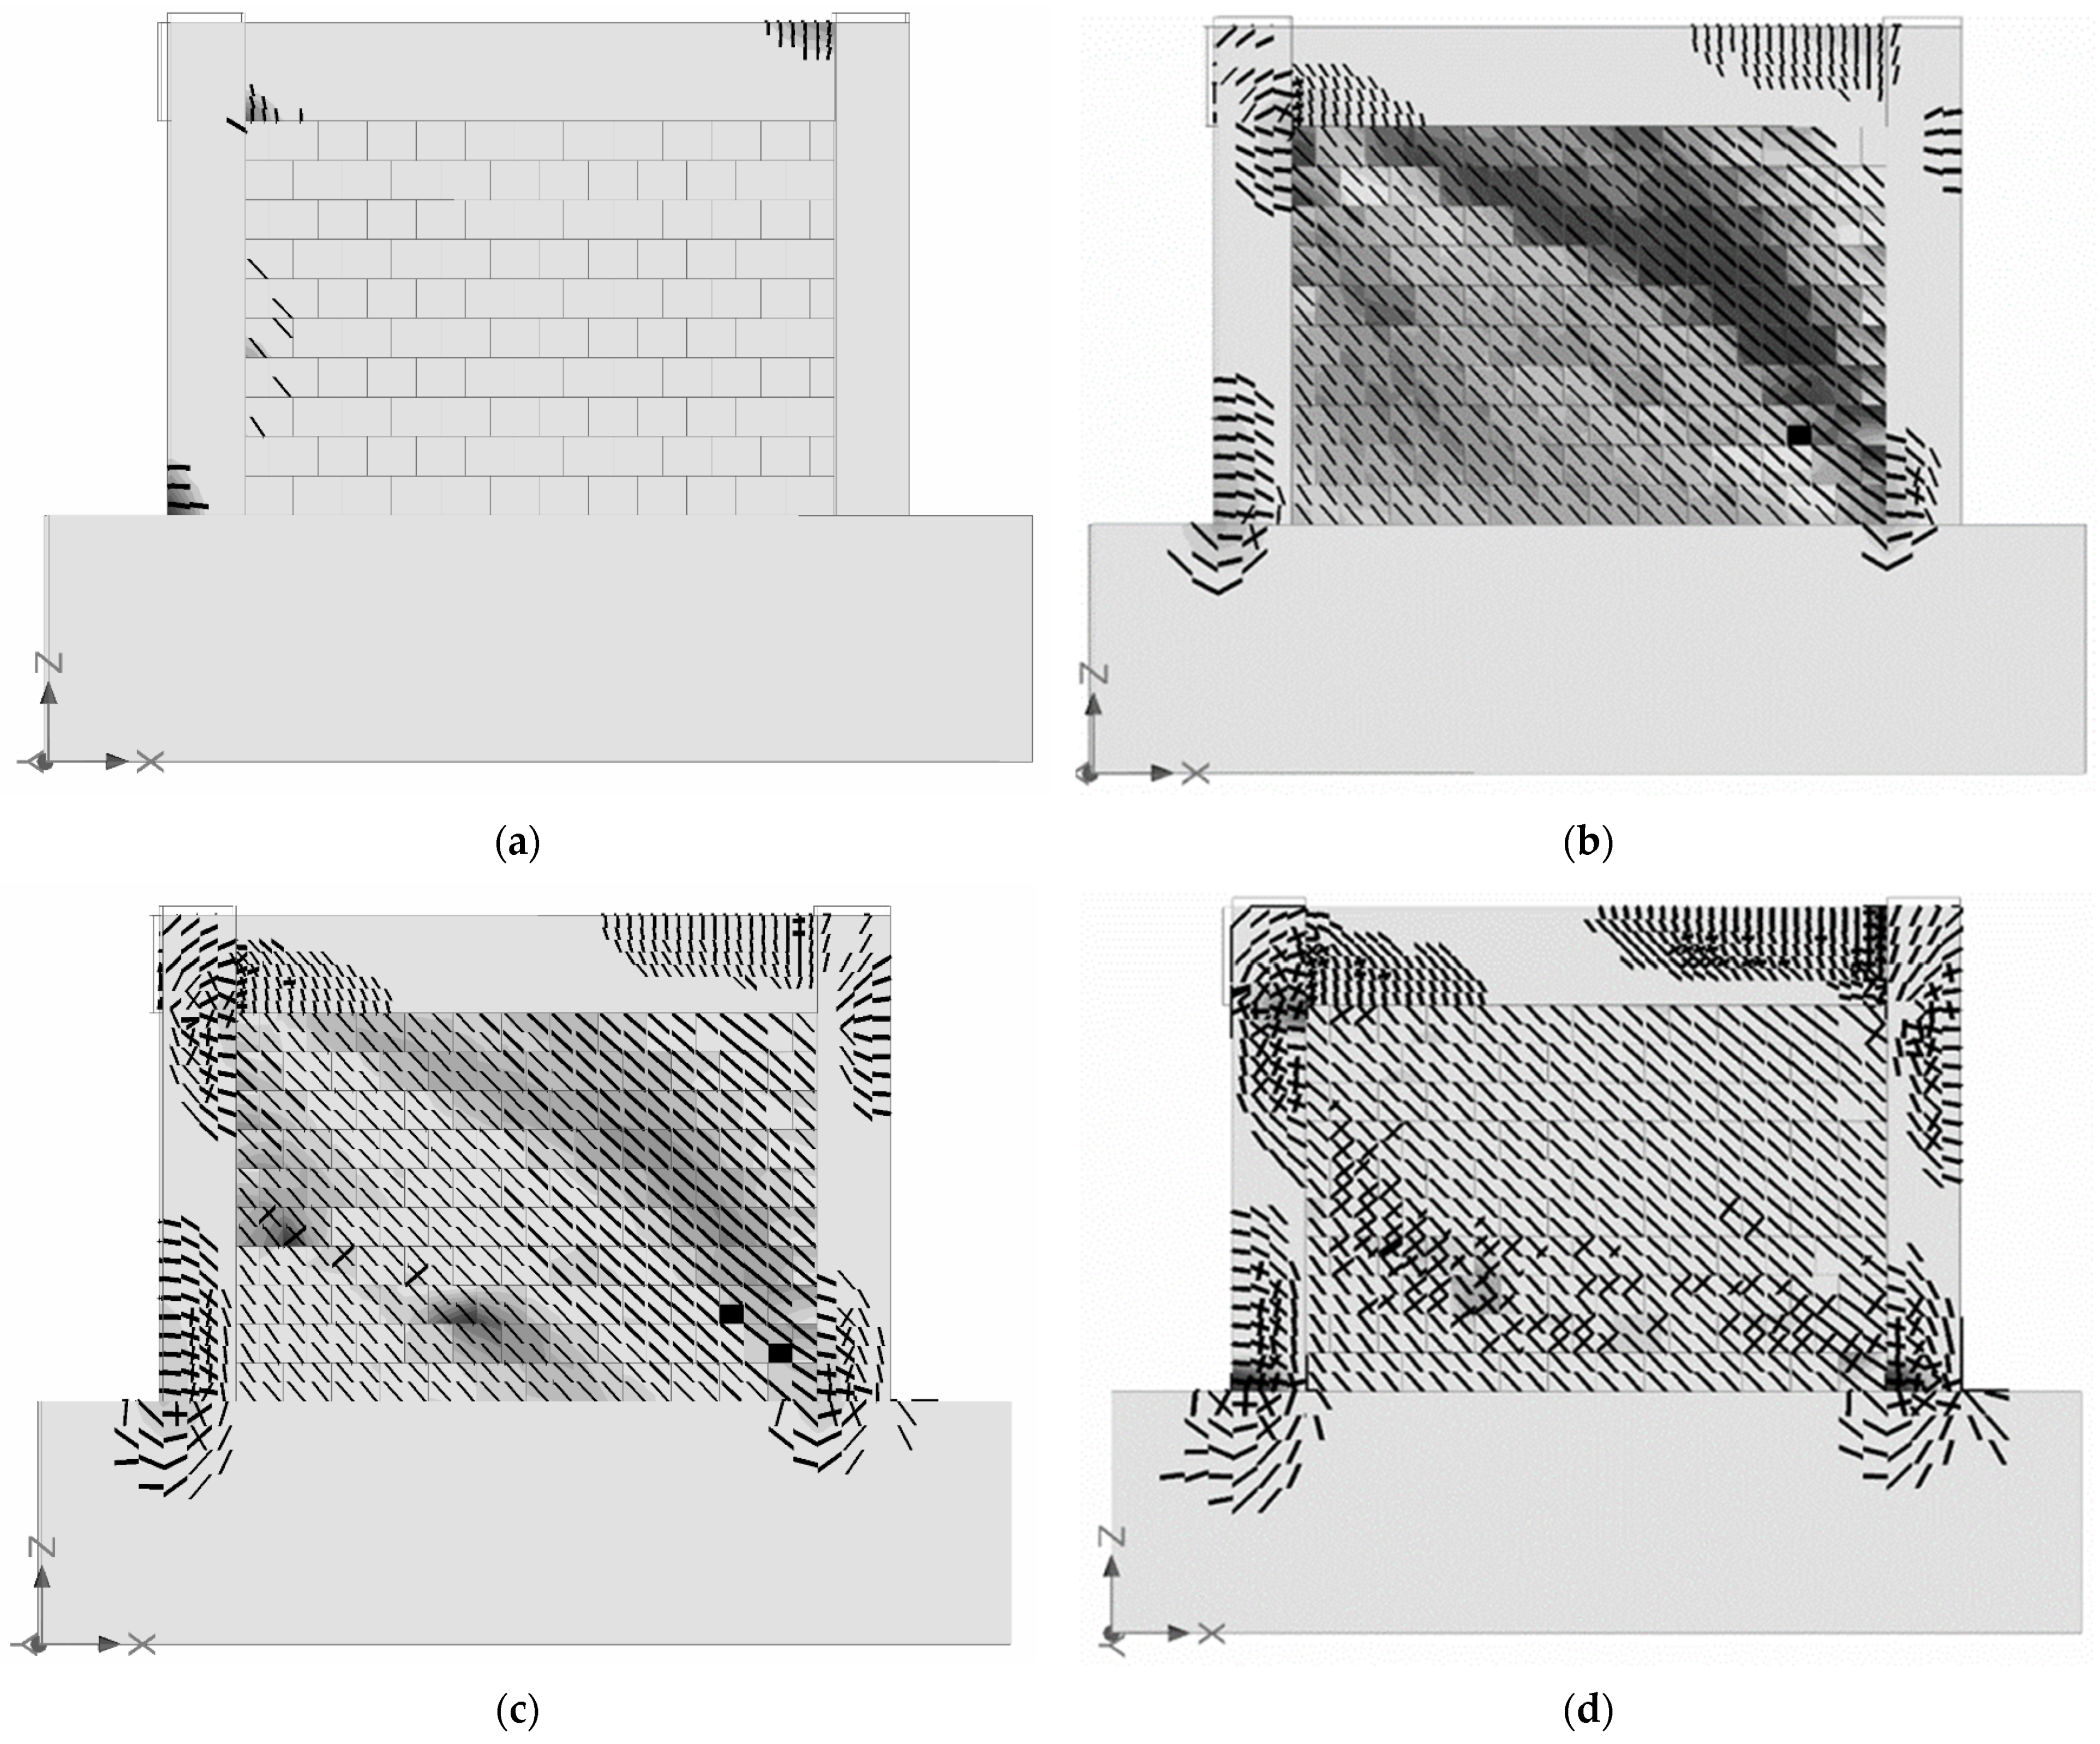
- The meso model is capable of capturing local damage information on each structural component, including wall panels, which can then be used for determining the level of structural damage.
- The stages of grouping the damage states in this study are based on the local damage that occurs in the panel, i.e., the shape of the crack, the severity of the crack and the width of the crack. Local damage per level is associated with the value of the inter-story drift ratio (IDR).
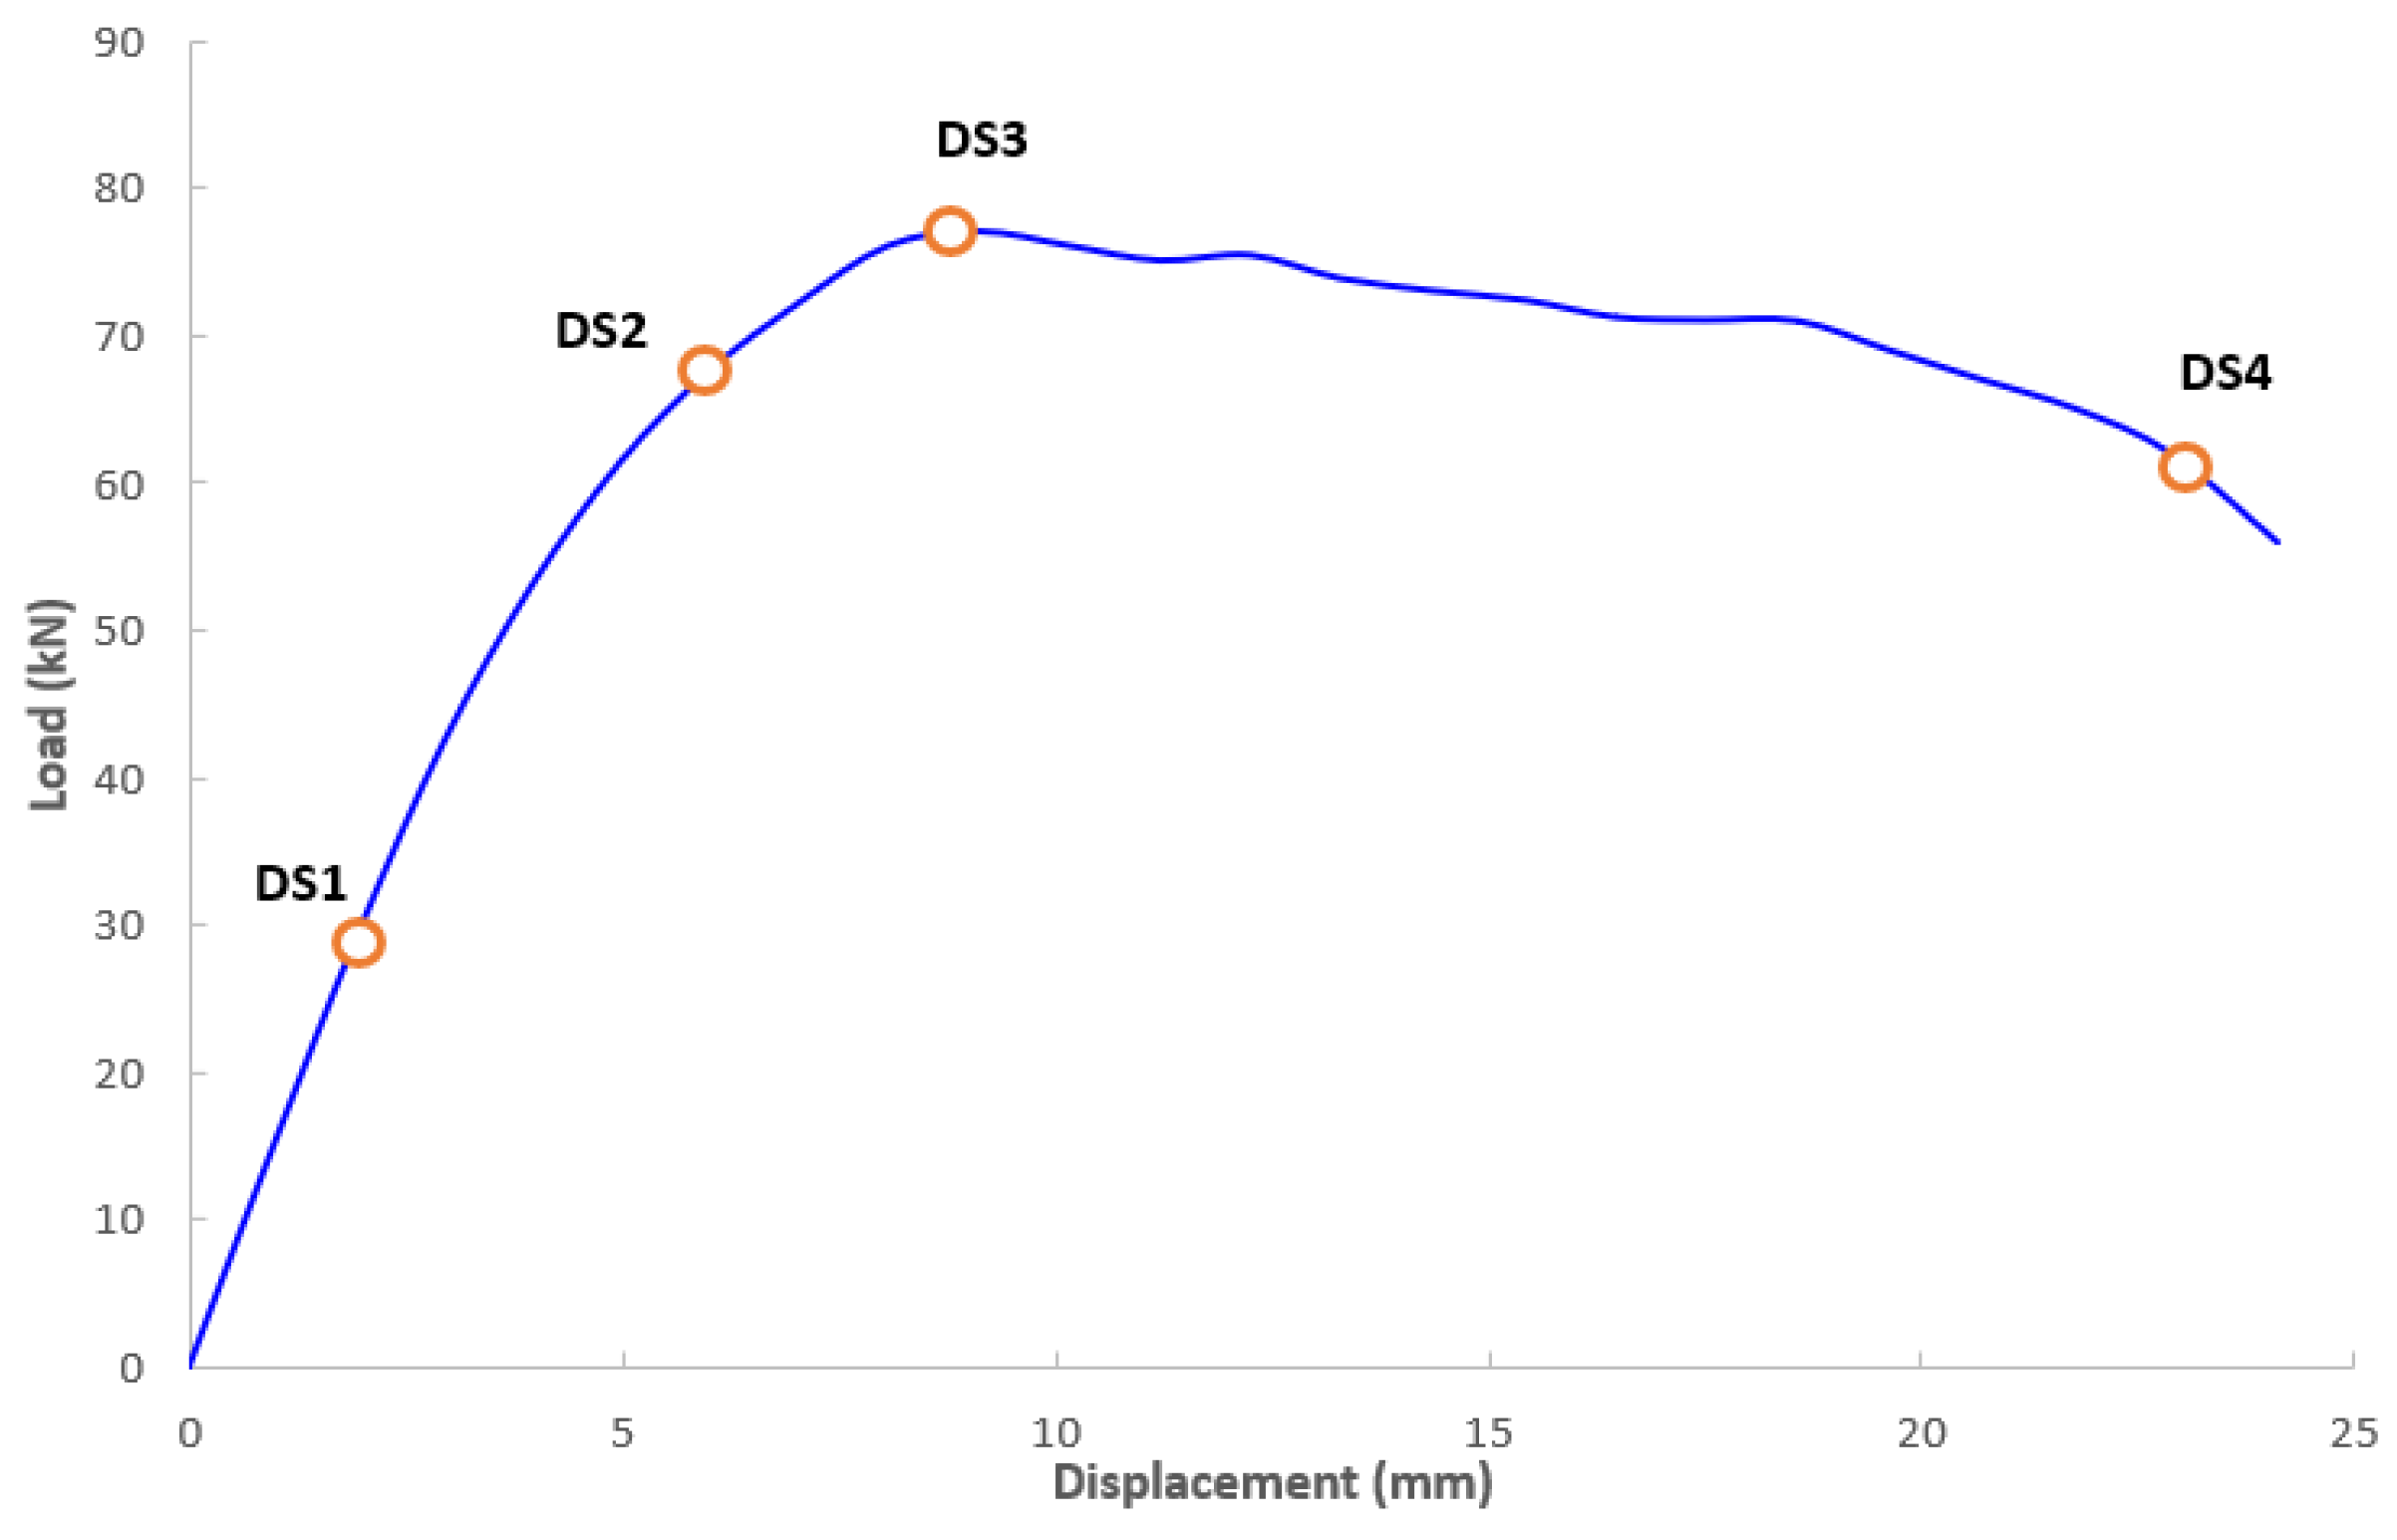
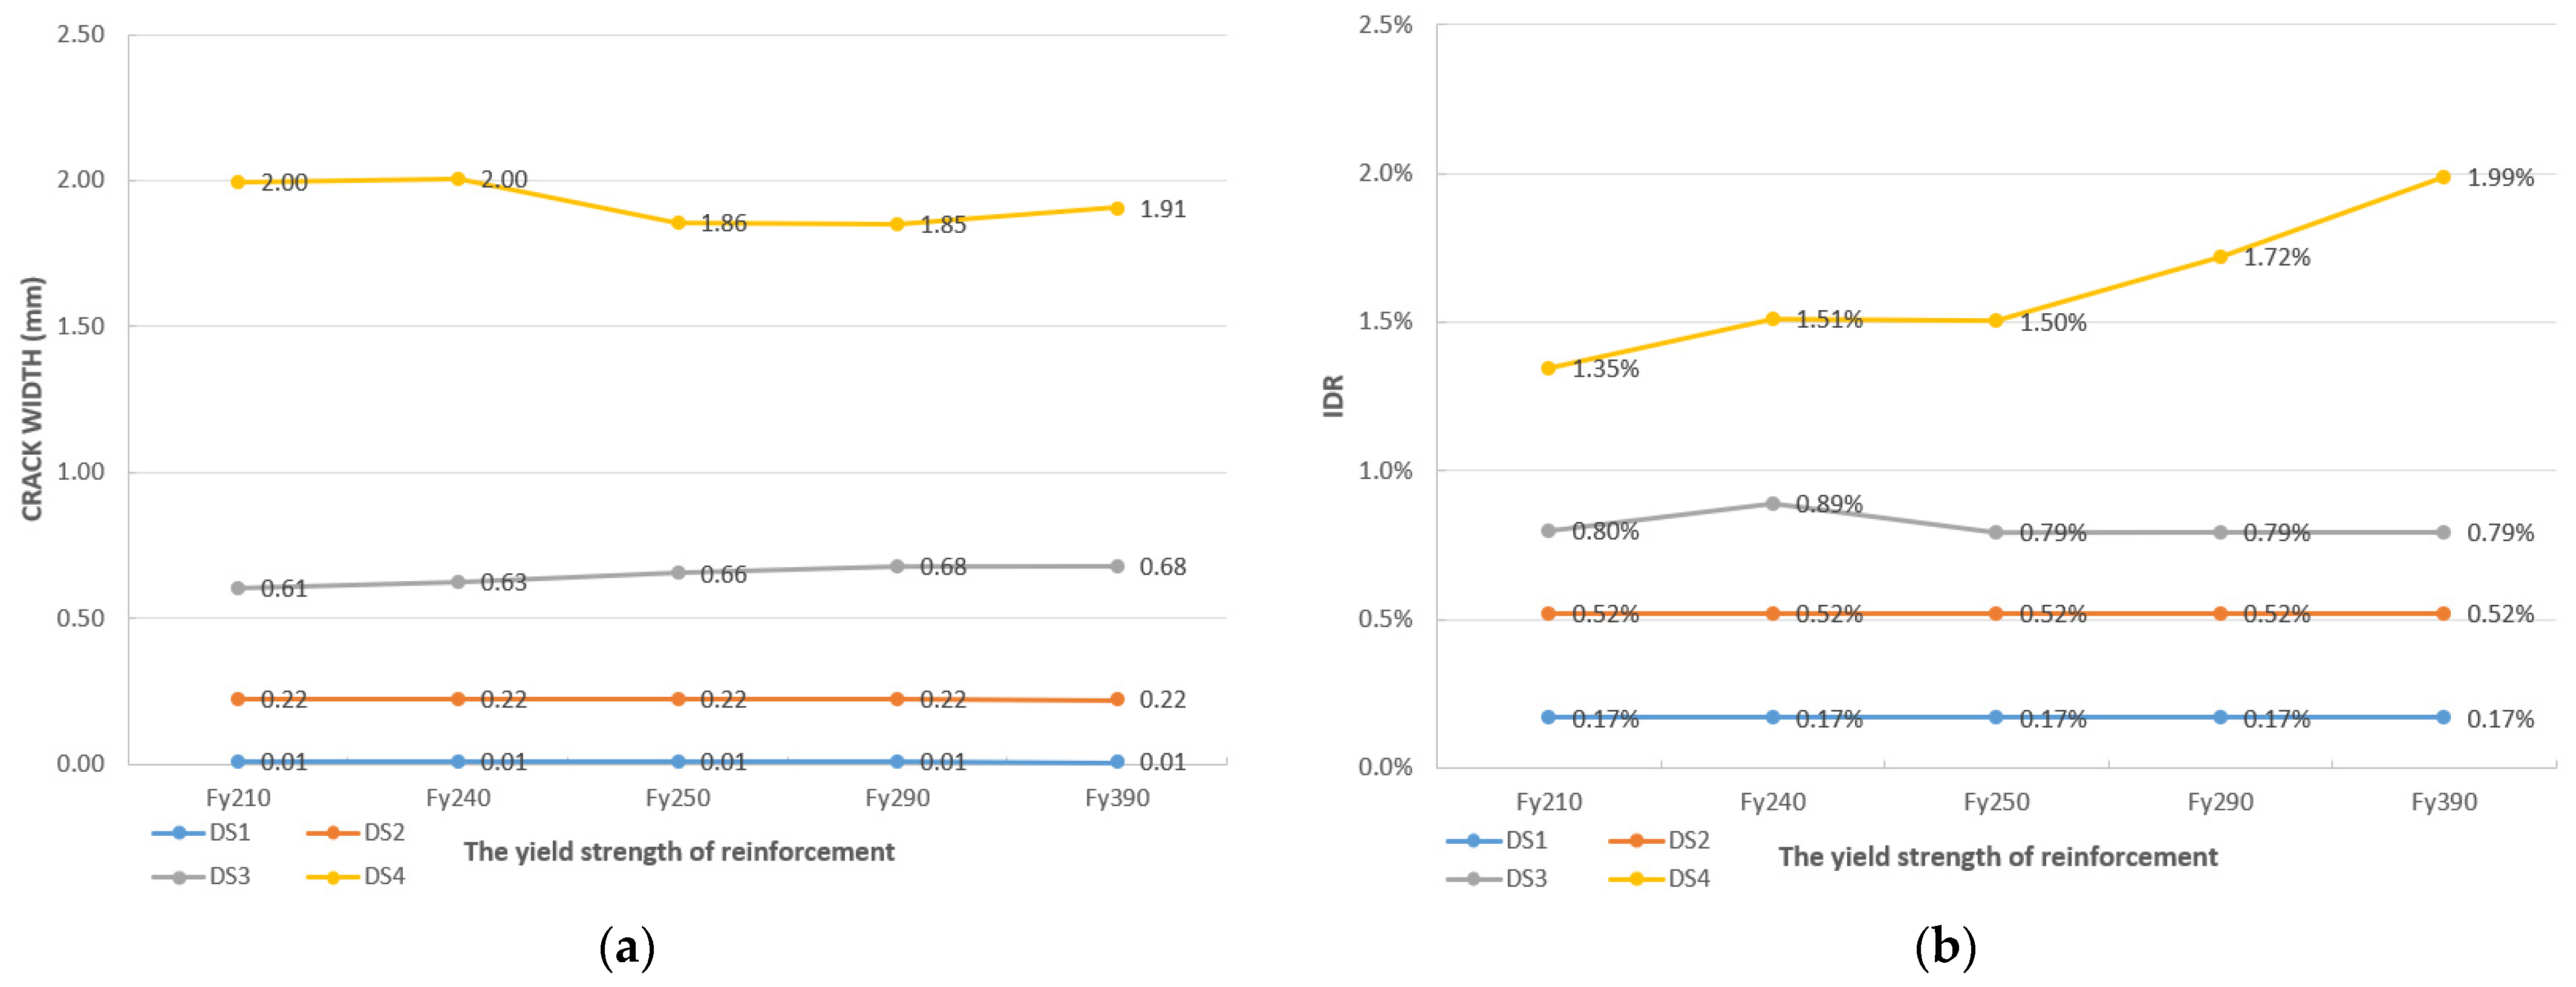
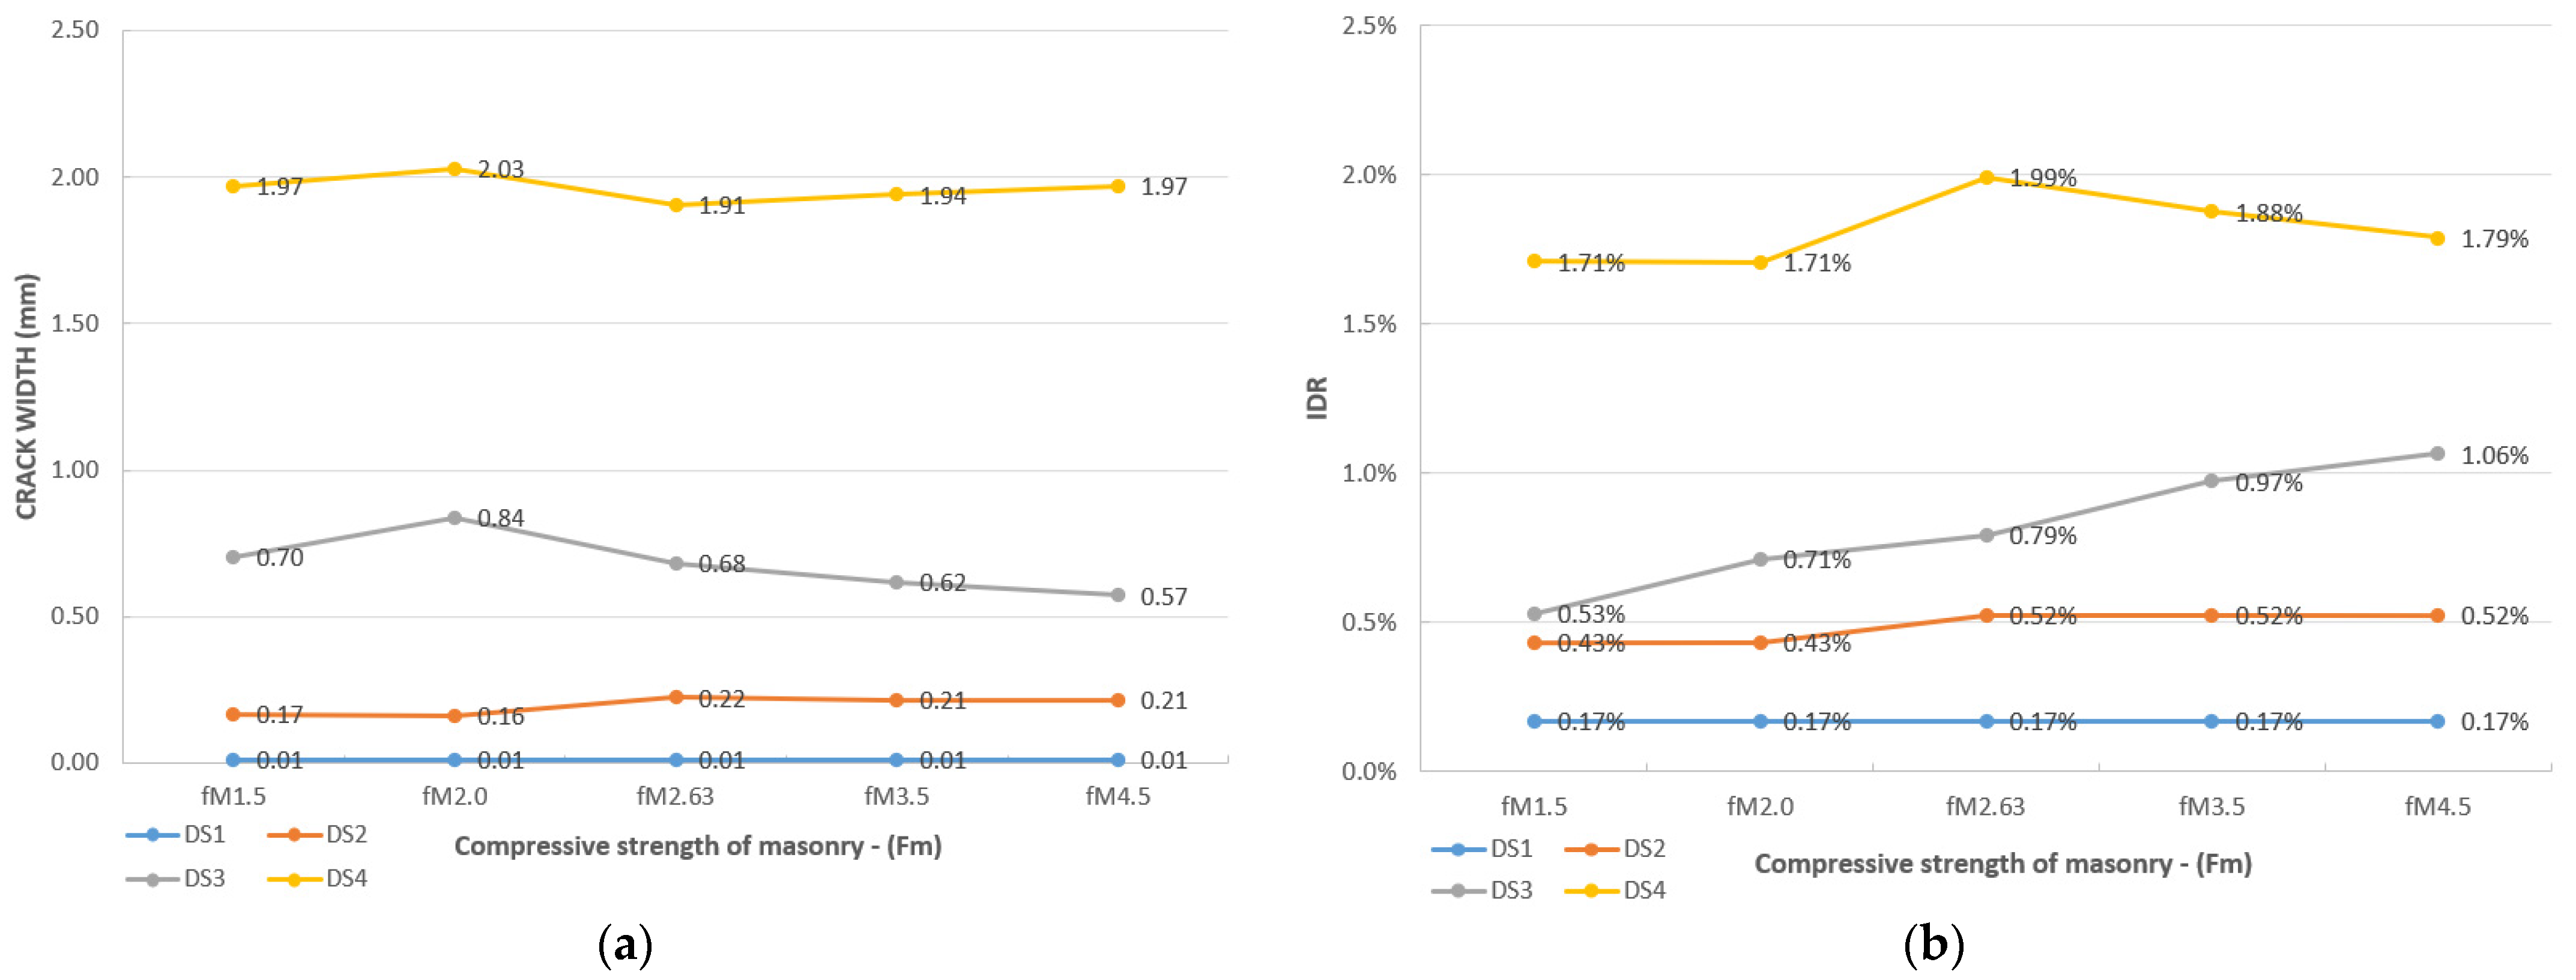
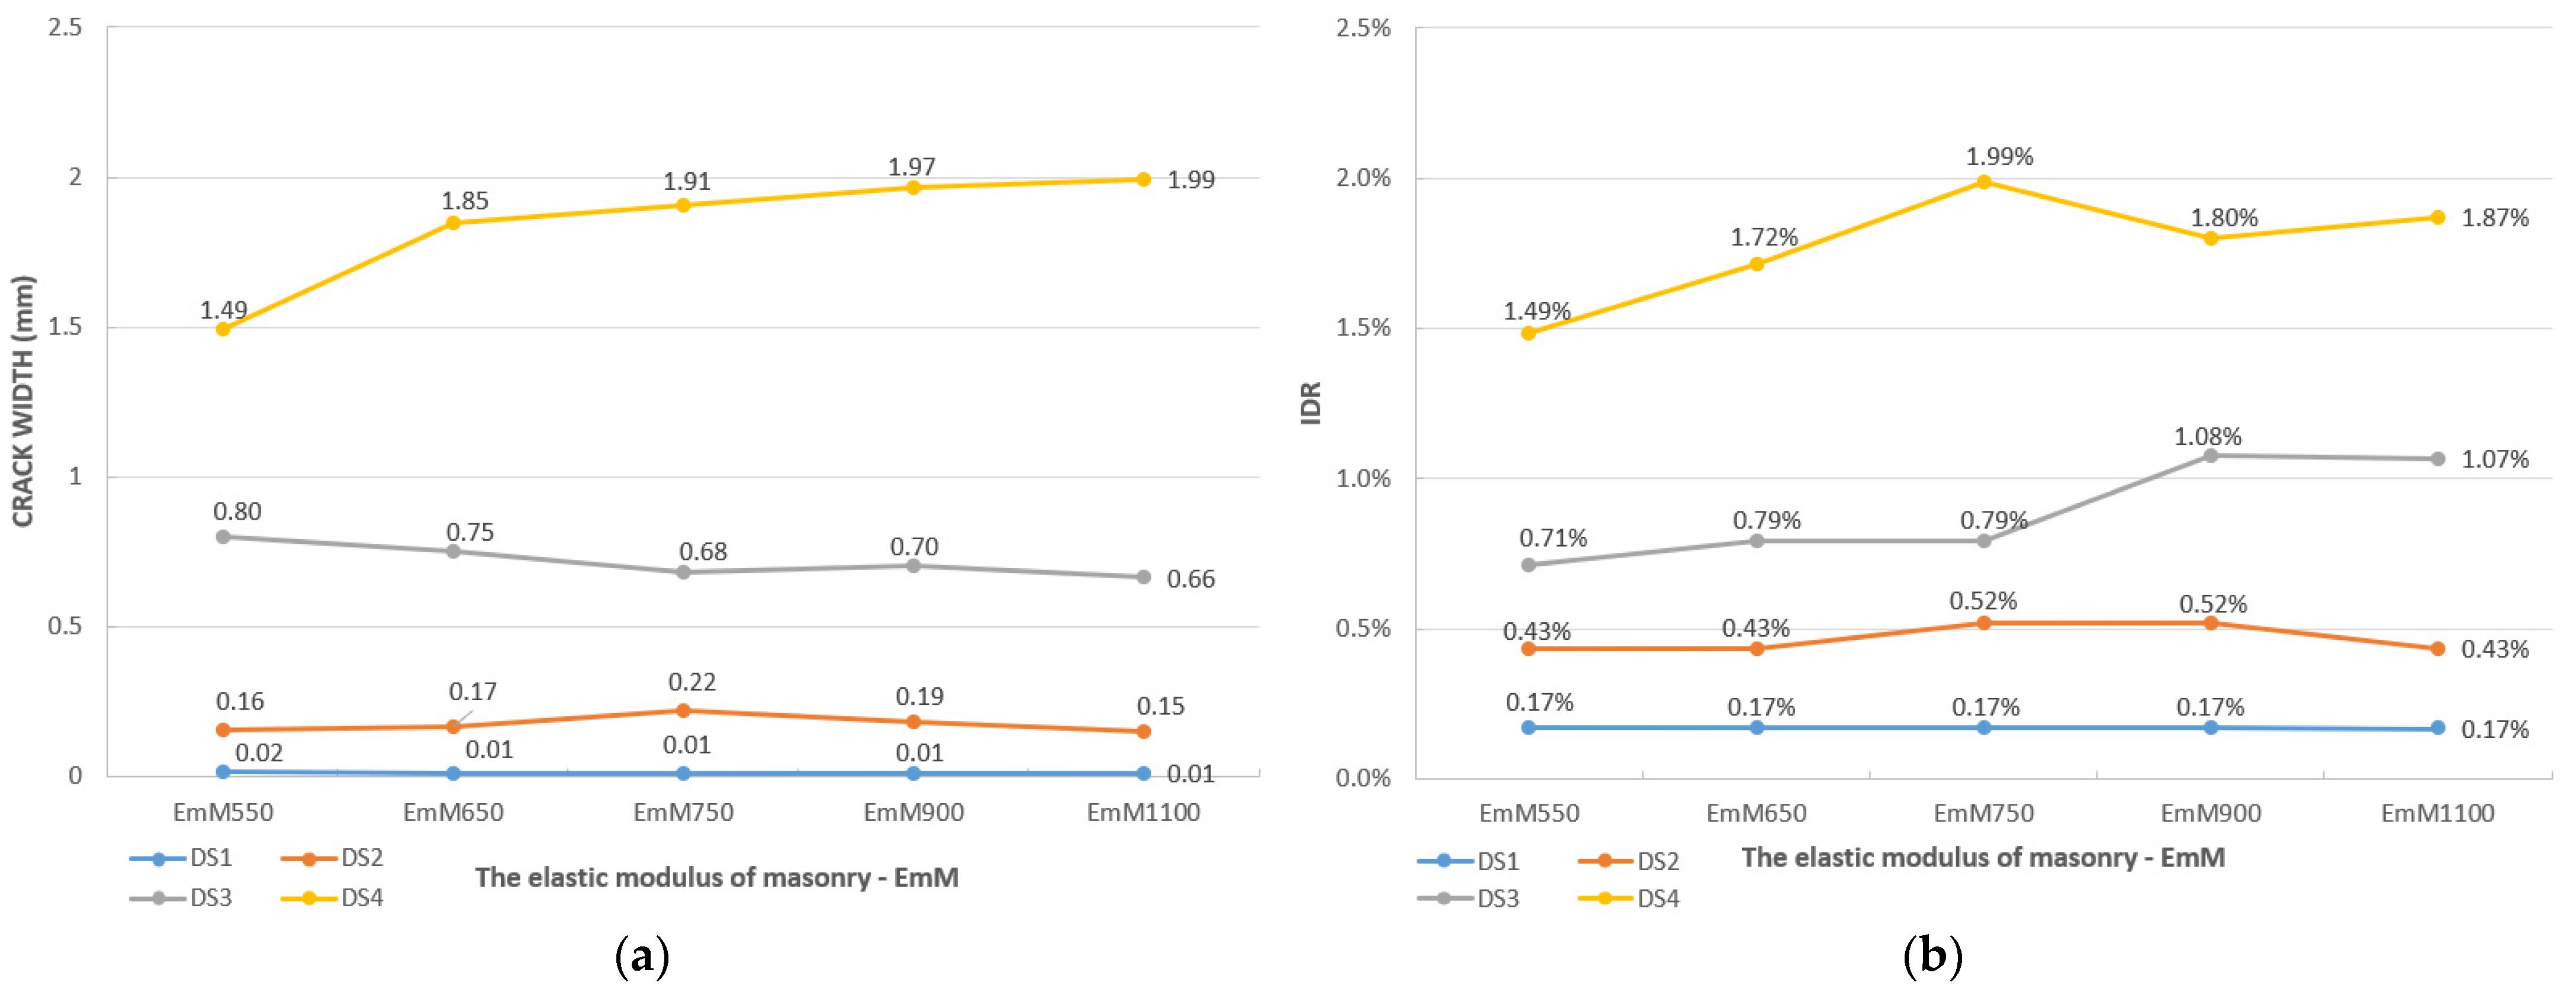
- The proposed IDR-based damage state values for infilled frames in this study are DS1 = 0.17%, DS2 = 0.52%, DS3 = 0.79% and DS4 = 1.99%.
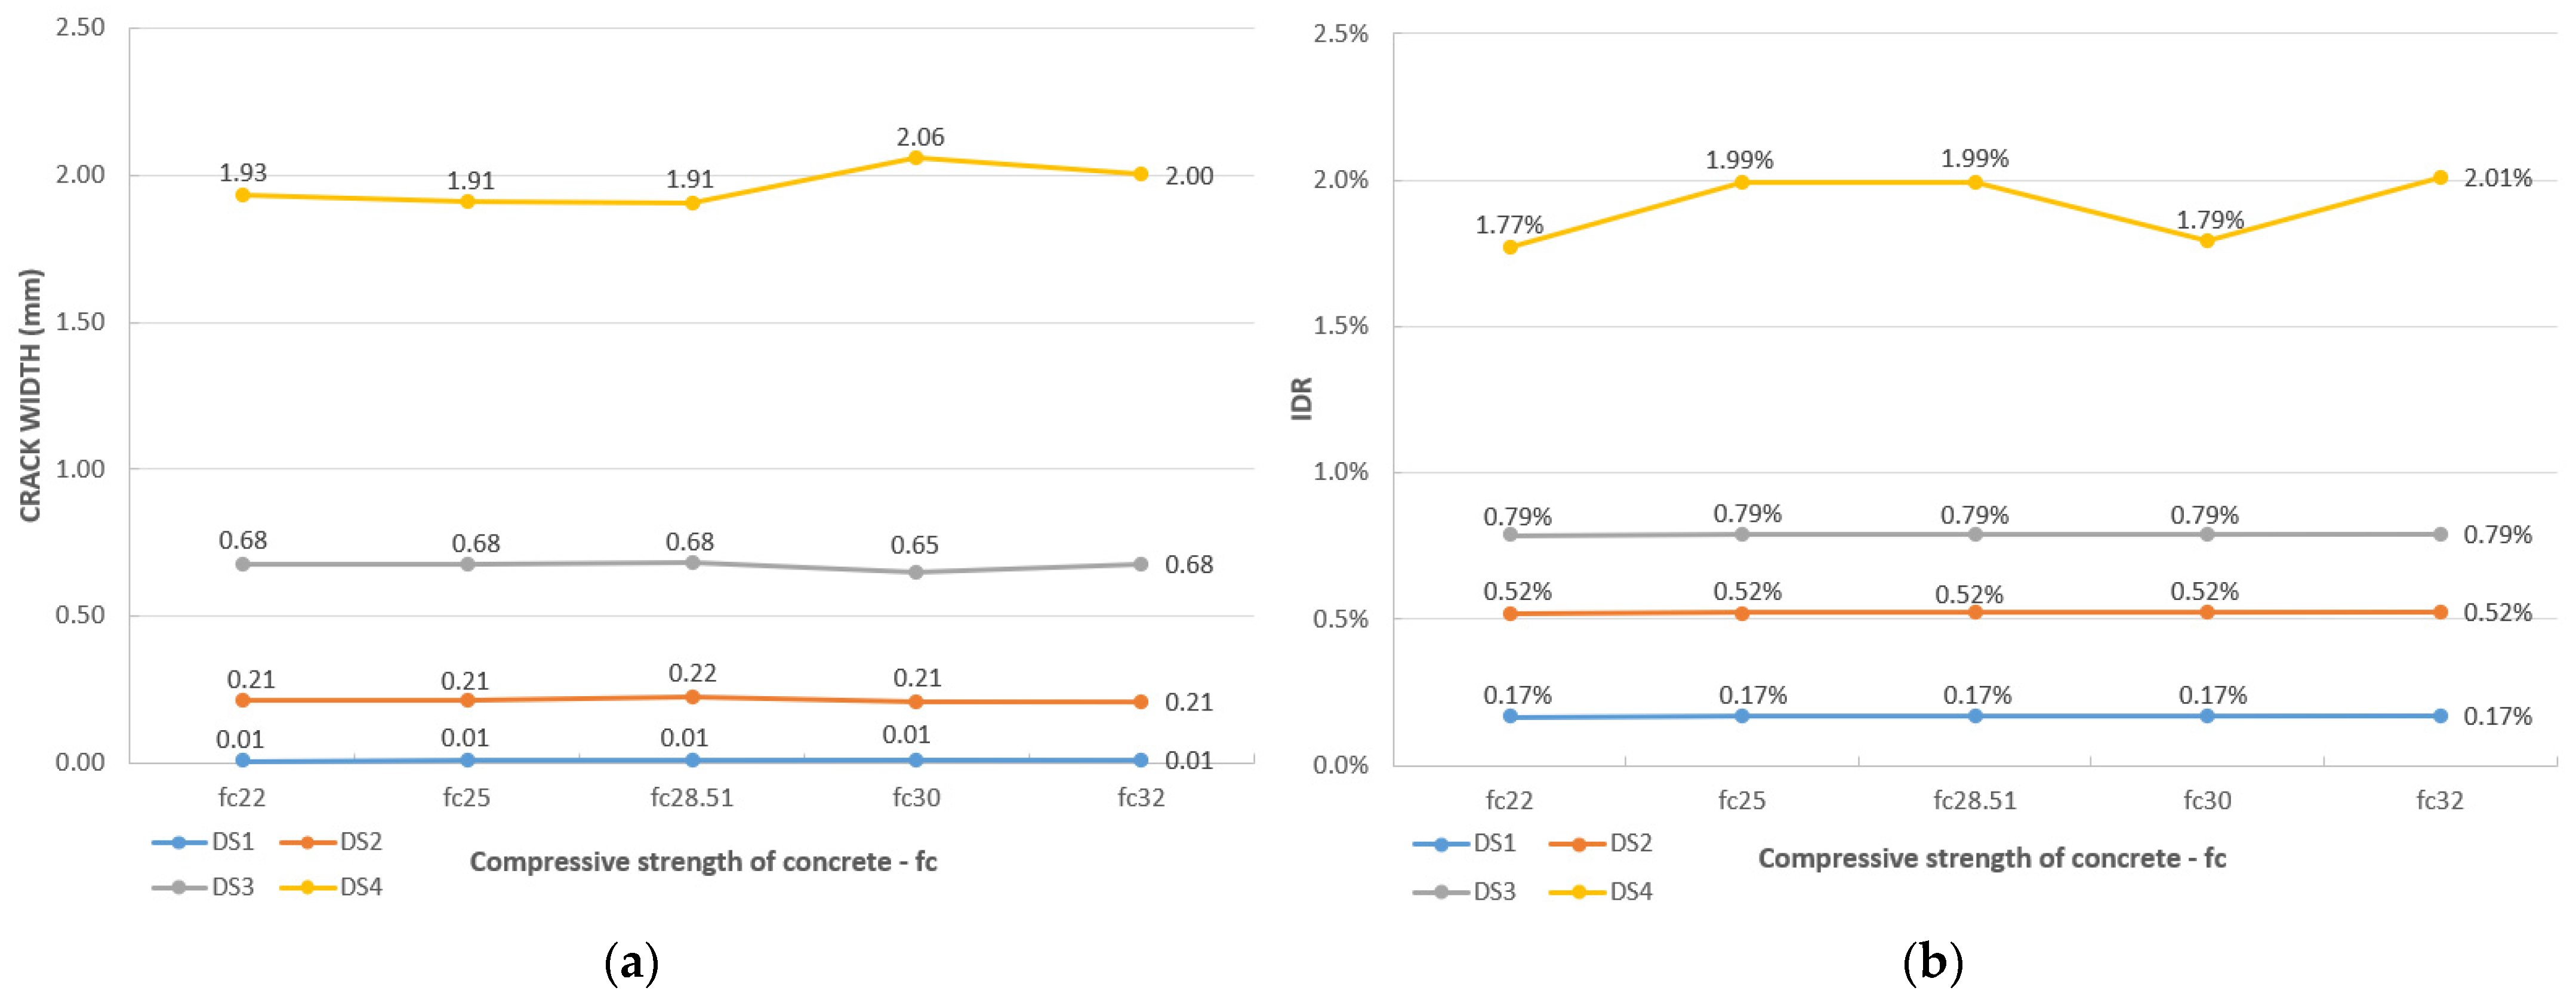
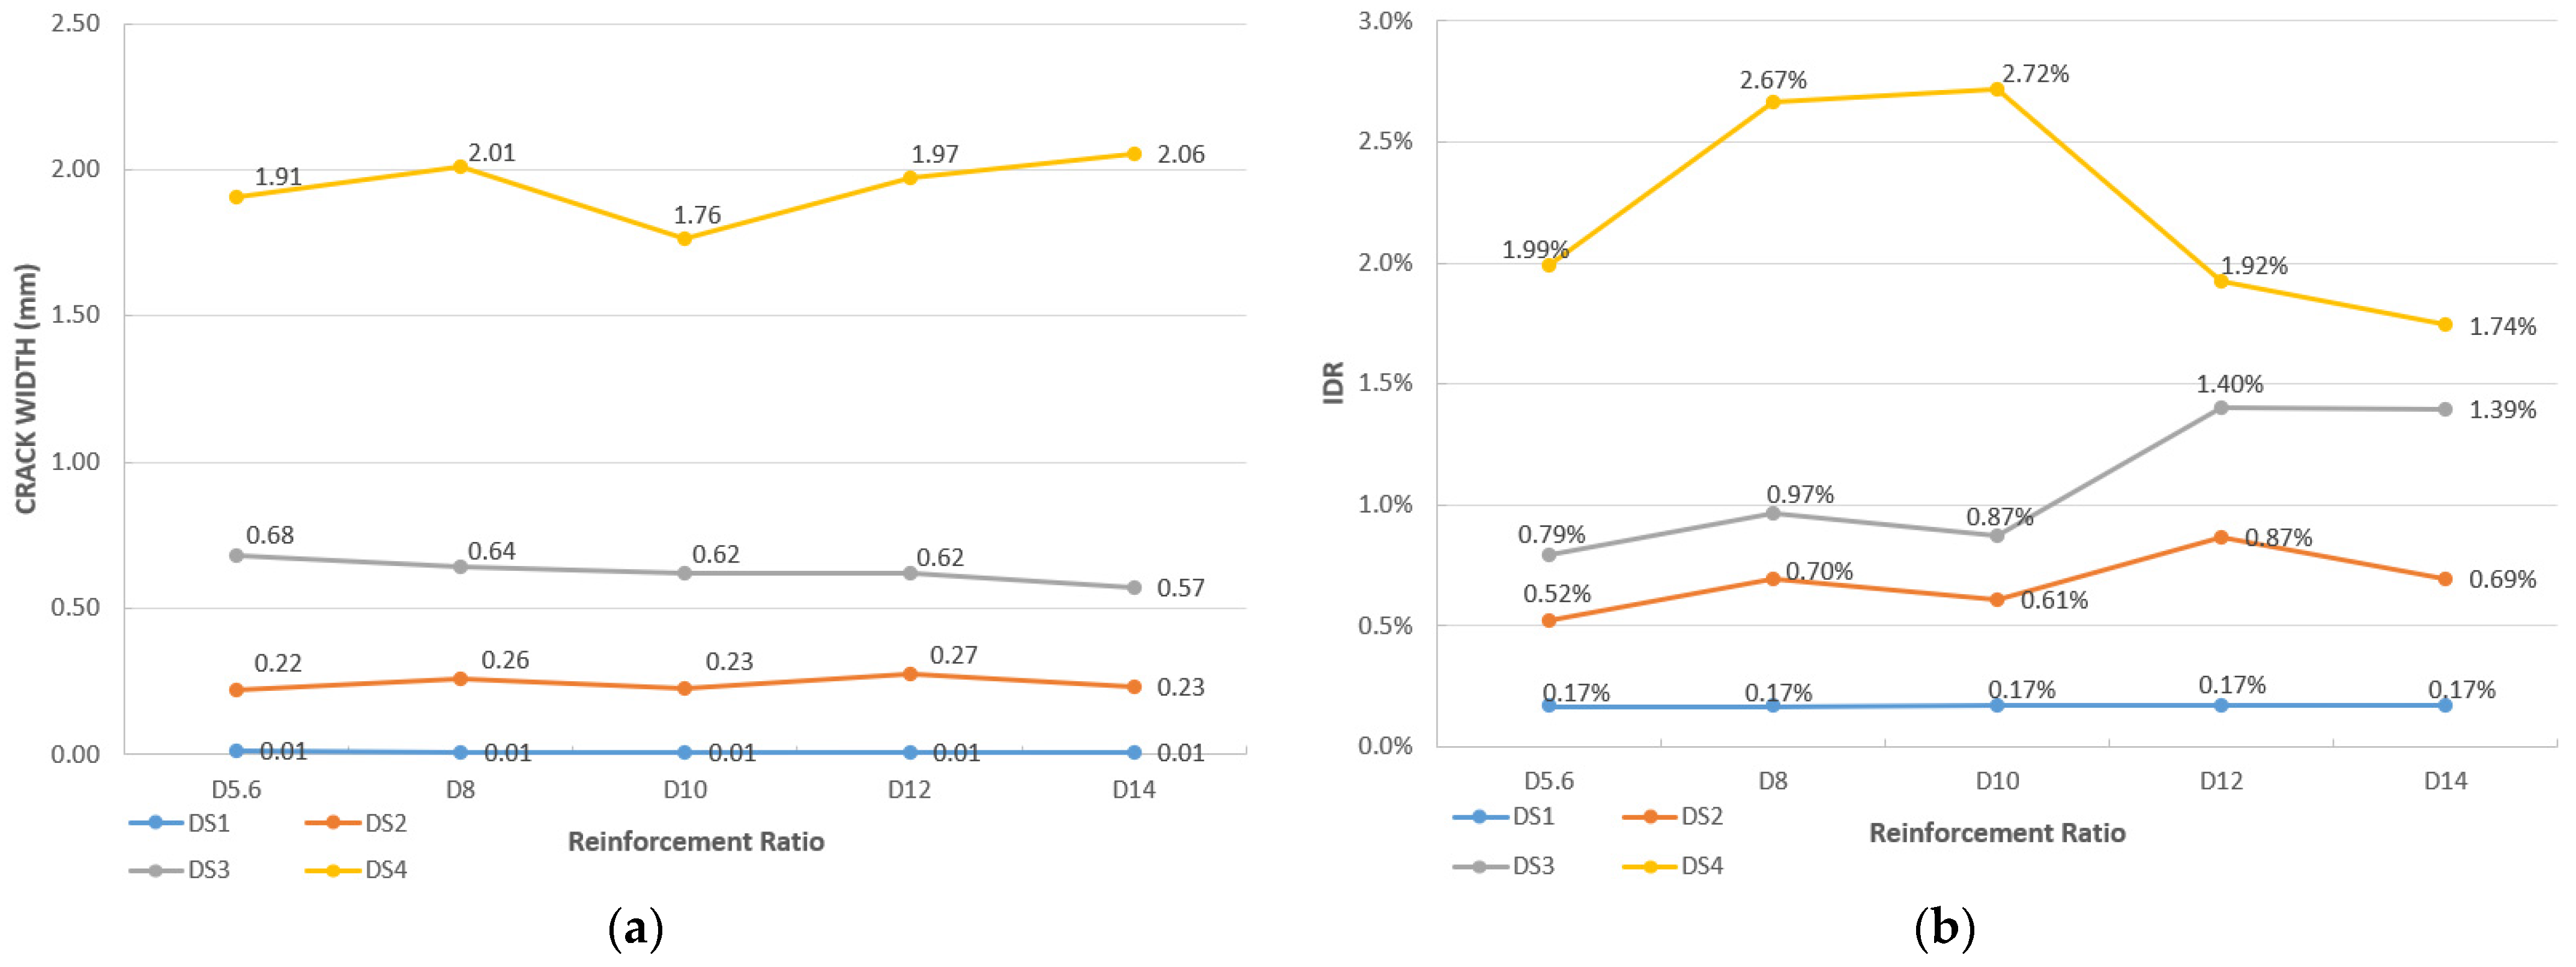
- The difference in IDR values for each level of damage in several previous studies and this study is due to the complexity of the infilled frame behavior accompanied by different typologies. This is proven through a parametric study conducted in this study using several mechanical properties of infilled frames, i.e., compressive strength of concrete, ratio of reinforcement, yield strength of reinforcement, compressive strength of masonry and elasticity modulus of masonry.
- When the structure is still in elastic condition, the difference in mechanical property values does not affect the level of damage to the initial structure—minor (DS1). On the other hand, differences in the values of mechanical properties cause the values of DS2, DS3 and DS4 to have fluctuate differences. This is due to the degree of damage occurring when the structure is in an after-elastic condition, so this inelastic condition results in nonlinear behavior of the structure.
8. Recommendation
Author Contributions
Funding
Institutional Review Board Statement
Informed Consent Statement
Data Availability Statement
Conflicts of Interest
References
- Khan, N.A.; Monti, G.; Nuti, C.; Vailati, M. Effects of Infills in the Seismic Performance of an RC Factory Building in Pakistan. Buildings 2021, 11, 276. [Google Scholar] [CrossRef]
- Zhang, B. Parametric Study on the Influence of Infills on the Displacement Capacity of RC Frames for Earthquake Loss Estimation. Master’s Thesis, Rose School, Pavia, Italy, 2006. [Google Scholar]
- Furtado, A.; Rodrigues, H.; Arêde, A.; Varum, H. Experimental Characterization of the In-plane and Out-of-Plane Behaviour of Infill Masonry Walls. Procedia Eng. 2015, 114, 862–869. [Google Scholar] [CrossRef] [Green Version]
- Hapsari, I.R.; Sangadji, S.; Kristiawan, S.A. Seismic performance of four-storey masonry infilled reinforced concrete frame building. In MATEC Web of Conferences; EDP Sciences: Les Ulis, France, 2018; Volume 195, p. 02017. [Google Scholar] [CrossRef] [Green Version]
- Vahidi, E.K.; Malekabadi, M.M. Conceptual investigation of shortcolumns and masonry infill frames effect in the earthquakes. Int. J. Civ. 2009, 3, 472–477. [Google Scholar]
- Rodrigues, H.; Varum, H.; Costa, A. Simplified Macro-Model for Infill Masonry Panels. J. Earthq. Eng. 2010, 14, 390–416. [Google Scholar] [CrossRef]
- Butenweg, C.; Marinković, M.; Salatić, R. Experimental results of reinforced concrete frames with masonry infills under combined quasi-static in-plane and out-of-plane seismic loading. Bull. Earthq. Eng. 2019, 17, 3397–3422. [Google Scholar] [CrossRef]
- D’Aragona, M.G.; Polese, M.; Di Ludovico, M.; Prota, A. Seismic Vulnerability for RC Infilled Frames: Simplified Evaluation for As-Built and Retrofitted Building Typologies. Buildings 2018, 8, 137. [Google Scholar] [CrossRef] [Green Version]
- Furtado, A.; Teresa de Risi, M. Recent Findings and Open Issues concerning the Seismic Behaviour of Masonry Infill Walls in RC Buildings. Adv. Civ. Eng. 2020, 2020, 9261716. [Google Scholar] [CrossRef] [Green Version]
- Nucera, F.; Santini, A.; Tripodi, E.; Cannizzaro, F.; Pantò, B. Influence of geometrical and mechanical parameters on the seismic vulnerability assessment of confined masonry buildings by macro-element modeling. In Proceedings of the 15th World Conference on Earthquake Engineering, Lisbon, Portugal, 24–28 September 2012; pp. 24–28. [Google Scholar]
- Stoica, D. About Masonry Walls Ductility Capacities Calculation. In Proceedings of the 3rd International Conference Research & Innovation in Engineering, Brasov, Romania, 16–17 October 2014; pp. 173–178. [Google Scholar]
- Crisafulli, F.J. Seismic Behaviour of Reinforced Concrete Structures with Masonry Infills. Ph.D. Thesis, University of Canterbury, Christchurch, New Zealand, 1997. [Google Scholar]
- IMeli, R.; Alcocer, S.M.; Leon, F.; Sanchez, T.A. Experimental study on earthquake-resistant design of confined masonry structures. Earthq. Eng. 1992, 6, 3469–3474. [Google Scholar]
- Flores, L.E.; Alcocer, S.M. Calculated response of confined masonry structures. In Proceedings of the 11th World Conference on Earthquake Engineering, Acapulco, Mexico, 23–28 June 1996; pp. 1–8. [Google Scholar]
- Varela-Rivera, J.; Fernandez-Baqueiro, L.; Alcocer-Canche, R.; Ricalde-Jimenez, J.; Chim-May, R. Shear and Flexural Behavior of Autoclaved Aerated Concrete Confined Masonry Walls. ACI Struct. J. 2018, 115, 1453–1462. [Google Scholar] [CrossRef]
- Flores, L.E.; Alcocer, S.M. Displacement Capacity of Confined Masonry Structures Reinforced with Horizontal Reinforcement: Shaking Table Tests. In Proceedings of the 16th World Conference on Earthquake Engineering, Santiago, Chile, 9–13 January 2017; pp. 1–12. [Google Scholar]
- Quiroz, L.G.; Maruyama, Y.; Zavala, C. Cyclic behavior of Peruvian confined masonry walls and calibration of numerical model using genetic algorithms. Eng. Struct. 2014, 75, 561–576. [Google Scholar] [CrossRef] [Green Version]
- Tena-Colunga, A.; Juárez-Ángeles, A.; Salinas-Vallejo, V.H. Cyclic behavior of combined and confined masonry walls. Eng. Struct. 2009, 31, 240–259. [Google Scholar] [CrossRef]
- Akhaveissy, A.H.; Abbassi, M. Pushover analysys of unreinforced masonry structures by fiber finite element method. Res. Civ. Environ. Eng. 2014, 2, 96–119. [Google Scholar]
- Lourenco, P.B. Computational Strategies for Masonry Structures. Ph.D. Thesis, Delft University of Technology, Delft, The Netherlands, 1996. [Google Scholar]
- Asteris, P.G.; Antoniou, S.T.; Sophianopoulos, D.S.; Chrysostomou, C.Z. Mathematical Macromodeling of Infilled Frames: State of the Art. Eng. Struct. 2011, 137, 1508–1517. [Google Scholar] [CrossRef]
- Van der Mersch, W. Modelling the Seismic Response of an Unreinforced Masonry Structure. Master’s Thesis, Delft University of Technology, Delft, The Netherlands, 2015. [Google Scholar]
- Baker, J.W. Measuring bias in structural response caused by ground motion scaling. In Proceedings of the 8th Pacific Conference on Earthquake Engineering, Singapore, 5–7 December 2007; pp. 1–8. [Google Scholar]
- Ghobarah, A. Performance-based design in earthquake engineering: State of development. Eng. Struct. 2001, 23, 878–884. [Google Scholar] [CrossRef]
- Arumugam, V.; Keshav, L.; Achuthan, A.; Dasappa, S. Seismic Evaluation of Advanced Reinforced Concrete Structures. Adv. Mater. Sci. Eng. 2022, 2022, 4518848. [Google Scholar] [CrossRef]
- Colangelo, F. Drift-sensitive non-structural damage to masonry-infilled reinforced concrete frames designed to Eurocode 8. Bull. Earthq. Eng. 2013, 11, 2151–2176. [Google Scholar] [CrossRef]
- Cardone, D.; Perrone, G. Developing fragility curves and loss functions for masonry infill walls. Earthquakes Struct. 2015, 9, 257–279. [Google Scholar] [CrossRef]
- Chiozzi, A.; Miranda, E. Fragility functions for masonry infill walls with in-plane loading. Earthq. Eng. Struct. Dyn. 2017, 46, 2831–2850. [Google Scholar] [CrossRef]
- Stavridis, A. Analytical and Experimental Study of Seismic Performance of Reinforced Concrete Frames Infilled with Masonry Walls. Ph.D. Thesis, University of California, San Diego, CA, USA, 2009. [Google Scholar]
- Page, A.W. Finite Element Model for Masonry. J. Struct. Div. 1978, 104, 1267–1285. [Google Scholar] [CrossRef]
- Polyakov, S.V. Masonry in Framed Buildings. Gosudalst-Vennoe’stvo Literature po Straitel’ stuv i Arkitecture, Moscow, Russia; Cairns, G.L., Translator; Building Research Station: Watford, UK, 1956. [Google Scholar]
- Crisafulli, F.J.; Carr, A.J. Proposed macro-model for the analysis of infilled frame structures. Bull. N. Z. Soc. Earthq. Eng. 2007, 40, 69–77. [Google Scholar] [CrossRef] [Green Version]
- Chrysostomou, C.; Gergely, P.; Abel, J.F. A Six-Strut Model For Nonlinear Dynamic Analysis Of Steel Infilled Frames. Int. J. Struct. Stab. Dyn. 2002, 2, 335–353. [Google Scholar] [CrossRef]
- Kumar, M.; Khalid, F.; Ahmad, N. Macro-Modelling of Reinforced Concrete Frame Infilled with Weak Masonry for Seismic Action. NED Univ. J. Res. 2018, 15, 15–38. [Google Scholar]
- Elgaaly, M.; Hamid, A.A. Three-Strut Model for Concrete Masonry-Infilled Steel Frames. Eng. Struct. 2003, 129, 177–185. [Google Scholar] [CrossRef]
- Tanganelli, M.; Rotunno, T.; Viti, S. On the modelling of infilled RC frames through strut models. Cogent Eng. 2017, 4, 1371578. [Google Scholar] [CrossRef]
- Pashaie, M.R.; Mohammadi, M. Estimating the local and global effects of infills on steel frames by an improved macro-model. Eng. Struct. 2019, 187, 120–132. [Google Scholar] [CrossRef]
- SEAOC. Vision 2000-A Framework for Performance Based Earthquake Engineering; Structural Engineers Association of California; Seismology Committee: Sacramento, CA, USA, 1995. [Google Scholar]
- Applied Technology Council. ATC-40 Seismic Evaluation and Retrofit of Concrete Buildings; Applied Technology Council: Redwood City, CA, USA, 1996; Volume 1. [Google Scholar]
- FEMA. NEHRP Guidelines for the Seismic Rehabilitation of Buildings; FEMA 273: Washington, DC, USA, 1996.
- Liu, C.; Liu, B.; Wang, X.; Kong, J.; Gao, Y. Seismic Performance Target and Fragility of Masonry Infilled RC Frames under In-Plane Loading. Buildings 2022, 12, 1175. [Google Scholar] [CrossRef]
- Šipoš, T.K.; Hadzima-Nyarko, M.; Miličević, I.; Grubišić, M. Structural Performance Levels for Masonry Infilled Frames. In Proceedings of the 16th European Conference on Earthquake Engineering, Thessaloniki, Greece, 18–21 June 2018; pp. 1–12. [Google Scholar]
- Krawinkler, H. A few basic concepts for performance based seismic design. In Proceedings of the 11th World Conference on Earthquake Engineering, Acapulco, Mexico, 23–28 June 1996; Volume 1133. [Google Scholar]
- Zhang, M.Y. Components Performance-Based Seismic Vulnerability Analysis of Masonry infilled Frame Structures. Master’s Thesis, Institute of Engineering Mechanics, China Earthquake Administration, Harbin, China, 2017. [Google Scholar]
- Kakaletsis, D.J.; Karayannis, C.G. Experimental Investigation of Infilled Reinforced Concrete Frames with Openings. ACI Struct. J. 2009, 106-S14, 132–141. [Google Scholar]
- Beer, M.; Kougioumtzoglou, I.A.; Patelli, E.; Au, I.S.-K. Encyclopedia of Earthquake Engineering; Springer: Berlin/Heidelberg, Germany, 2015. [Google Scholar] [CrossRef] [Green Version]
- Cervenka, V.; Jendele, L.; Cervenka, J. ATENA Program Documentation Part 1 Theory; Cervenka Consulting Ltd.: Prague, Czech Republic, 2012. [Google Scholar]
- Cervenka, V.; Cervenka, J.; Pukl, R. ATENA—A tool for engineering analysis of fracture in concrete. Sadhana 2002, 27, 485–492. [Google Scholar] [CrossRef]
- Sato, R.; Sogo, S.; Kanazu, T.; Kishi, T.; Noguchi, T.; Mizobuchi, T.; Miyazawa, S. JCI guidelines for control of cracking of mass concrete 2008. Sustain. Constr. Mater. Technol. 2013, 1, 18–21. [Google Scholar]
- ACI 318-19; Building Code Requirements for Structural Concrete (ACI 318R-19) and Commentary (ACI 318R-19). ACI: Farmington Hills, MI, USA, 2019. [CrossRef]
- Vonk, R.A. Softening of Concrete Loaded in Compression. Ph.D. Thesis, Technische Universiteit Eindhoven, Eindhoven, The Netherlands, 1992. [Google Scholar]
- Van Mier, J.B.M. Strain-Softening of Concrete under Multiaxial Loading Conditions. Ph.D. Thesis, Technische Hogeschool Eindhoven, Eindhoven, The Netherlands, 1984. [Google Scholar]
- Prasad, M.D.R.; Shakeeb, S.; Chandradhara, G.P. Nonlinear behavior of Reinforced Concrete Infilled Frames using ATENA 2D. Indian J. Adv. Chem. Sci. 2016, 1, 173–178. [Google Scholar]
- Ahmed, A.; Shahzada, K. Seismic vulnerability assessment of confined masonry structures by macro-modeling approach. Structures 2020, 27, 639–649. [Google Scholar] [CrossRef]
- Anić, F.; Penava, D.; Guljaš, I.; Sarhosis, V.; Abrahamczyk, L.; Butenweg, C. The Effect of Openings on Out-of-Plane Capacity of Masonry Infilled Reinforced Concrete Frames. In Proceedings of the 16th European Conference on Earthquake Engineering, Thessaloniki, Greece, 18–21 June 2018; pp. 1–11. [Google Scholar]


| Performance Level | Research Results & Codes | ||||
|---|---|---|---|---|---|
| Cardone [27] | Chun Hui Liu [41] | Chiozzi [28] | Kalman Sipos [42] | FEMA273 [40] | |
| DS1 | Light diagonal crack, crack width < 1 mm, IDR = 0.06–0.46% | No crack, IDR = 0.1% | Crack width < 2 mm, IDR = 0.125% | First yield, IDR < 0.1% | IDR < 0.1% |
| DS2 | The crack becomes wider 1–2 mm, cross-crack, IDR = 0.21–1.38% | A diagonal crack on the panel and different cracks start to connect, IDR = 0.3% | Crack width 2–4 mm, IDR = 0.327% | 0.1 ≤ IDR < 0.3% | 0.1 ≤ IDR < 0.3% |
| DS3 | Crack width > 2 mm, starting to fail, IDR = 0.5–1.98% | Crack develops into a cross-crack, peak load, IDR = 0.9% | Crack width > 4 mm, IDR = 0.82% | Ultimate point, 0.3 ≤ IDR < 0.75% | 0.3 ≤ IDR < 0.6% |
| DS4 | Failed/collapse, IDR = 1.06–3.26% | Collapse, IDR = IDR = 1.9% | - | IDR ≥ 0.75% | IDR ≥ 0.6% |
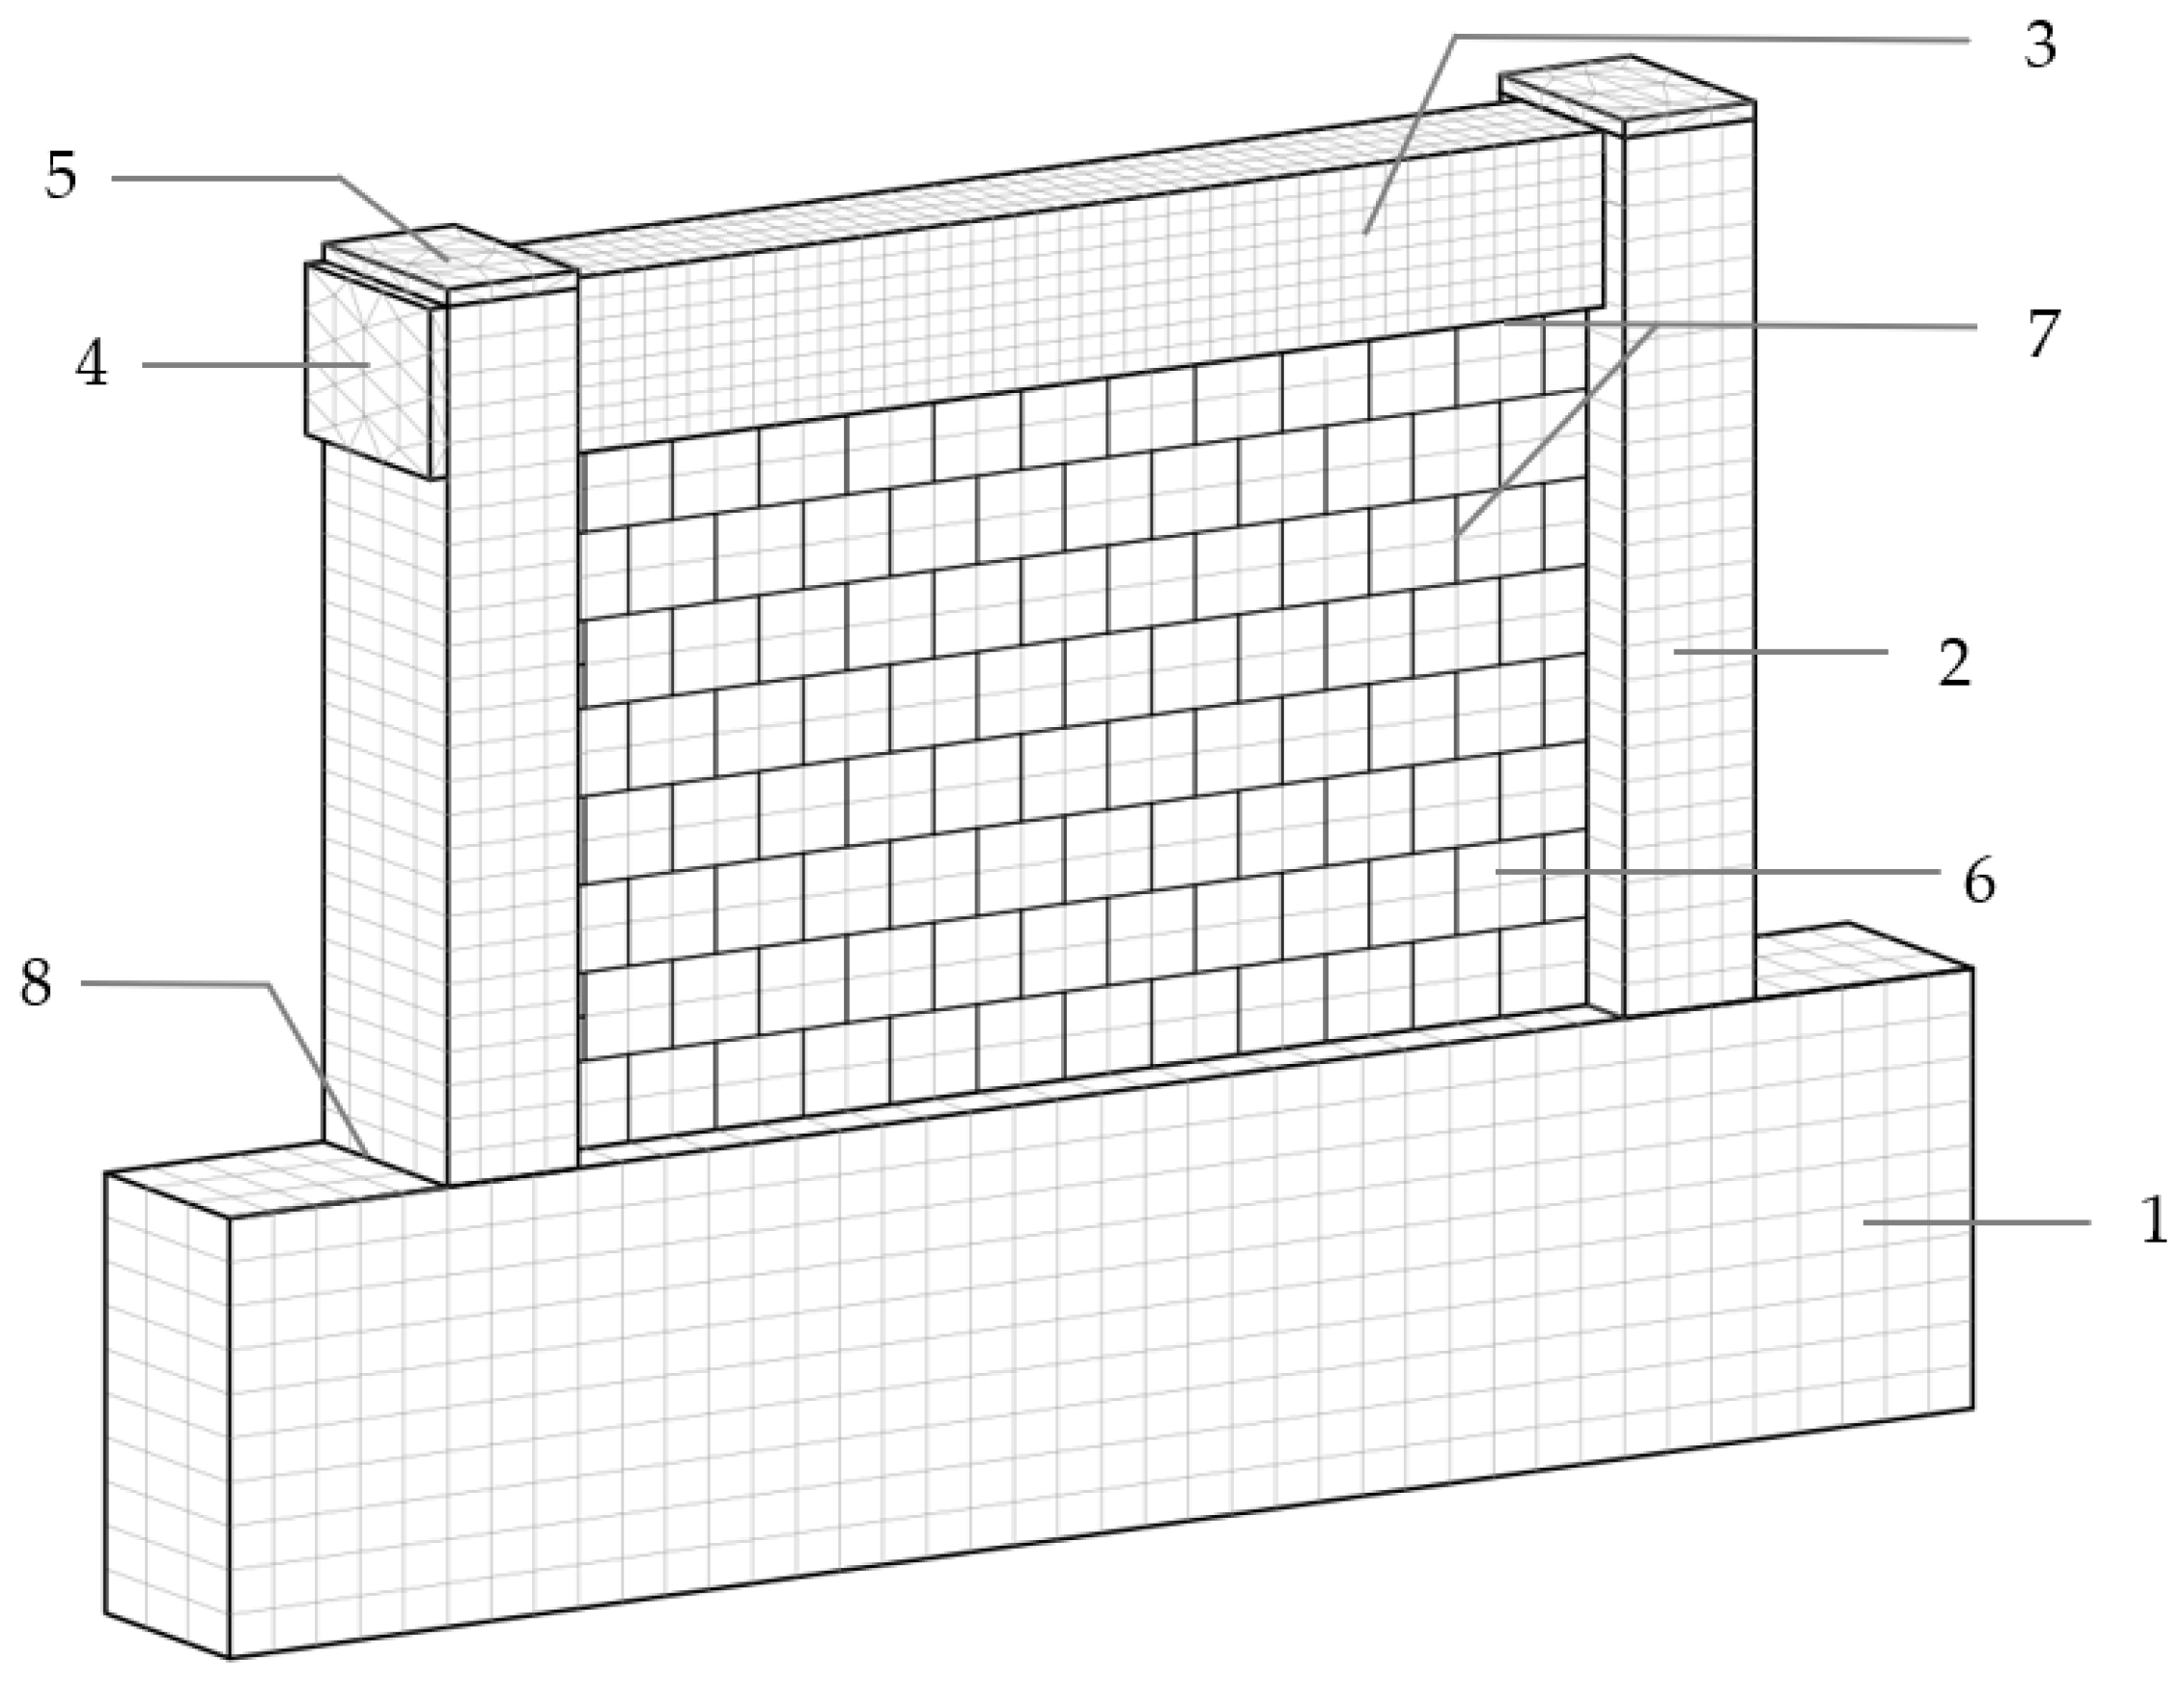
| No | Name of Macro Element | Material Usage |
|---|---|---|
| 1 | Plinth beam (foundation) | Concrete |
| 2 | Column | Concrete |
| 3 | Beam | Concrete |
| 4 | Plate | Steel |
| 5 | Plate | Steel |
| 6 | Bricks | Masonry |
| 7 | Brick–Interface | 3D Gap Connection |
| 8 | Macro element–Interface | Perfect Connection |
| Element | Meshing Size (m) | Meshing Type |
|---|---|---|
| Plinth beam (foundation) | 0.05 | Brick |
| Column | 0.0375 | Brick |
| Beam | 0.025 | Brick |
| Plate | 0.05 | Tetra |
| Masonry | 0.05 | Brick |
| Description | Symbol | Concrete | Masonry | Unit | Ref |
|---|---|---|---|---|---|
| Elastic modulus | E | 2.510 × 10⁴ | 6.607 × 10² | MPa | [45] |
| Poisson’s ratio | µ | 0.200 | 0.100 | / | |
| Tensile strength | ft | 2.349 | 0.260 | MPa | |
| Compressive strength | fc | −2.851× 101 | −2.630 | MPa | [45] |
| Specific fracture energy Equation (3) | 5.000 × 10⁻⁶ | 4.500 × 10⁻¹ | N/mm | [47] | |
| Crack spacing | 0.125 | / | m | ||
| Tensile stiffening | 0.400 | / | / | [47] | |
| Critical compressive disp. | −5.000 × 10⁻⁴ | −5.000 × 10⁻⁴ | / | [47,51,52] | |
| Plastic strain at fc | −1.417 × 10⁻² | −1.358 × 10⁻³ | / | ||
| Reduction of fc due to cracks | 0.800 | 0.800 | / | [47] | |
| Crack shear stiffness factor | 2.000 × 101 | 2.000 × 101 | / | ||
| Aggregate size | 1.600 × 10⁻² | / | m | ||
| Fixed crack model coefficient | 1.000 | 1.000 | / |
| Description | Symbol | Value | Unit |
|---|---|---|---|
| Normal stiffness (Equation (4)) | 6.607 × 10⁴ | MPa | |
| Tangential (shear) stiffness (Equation (5)) | 3.003 × 10⁴ | MPa | |
| Tensile strength | ft | 0.420 | MPa |
| Cohesion | C | 0.520 | MPa |
| Friction coefficient | Φ | 0.770 | / |
| Parameters Quantification | Unit | Models | Similarity | |
|---|---|---|---|---|
| Experiment | Meso | |||
| Peak load | kN | 46.00 | 48.03 | 104% |
| Displacement at peak load | mm | 15.00 | 13.83 | 92% |
| Initial stiffness | kN/mm | 7.30 | 8.16 | 112% |
| Residual strength at the collapse | kN | 39.00 | 40.31 | 103% |
| Parameters Quantification | Unit | Models | Similarity | |
|---|---|---|---|---|
| Experiment | Meso | |||
| Peak load | kN | 80.00 | 77.09 | 96% |
| Displacement at peak load | Mm | 9.00 | 9.11 | 101% |
| Initial stiffness | kN/mm | 16.67 | 14.80 | 89% |
| Residual strength at the collapse | kN | 52.44 | 55.97 | 107% |
| Performance Level | Proposed | ||||
|---|---|---|---|---|---|
| Panel Failure Definition | Failure Mode & Crack Severity | Panel Crack Width (mm) | State | IDR | |
| DS1 | Small crack | Figure 10a | 0.01 | First yield | 0.17% |
| DS2 | Diagonal cracks are starting to connect, block damage in panels | Figure 10b | 0.22 | Elastic–Plastic | 0.52% |
| DS3 | Cross-shaped cracks and block damage to panels increases | Figure 10c | 0.69 | Ultimate | 0.79% |
| DS4 | Failed/collapse | Figure 10d | 1.91 | Collapse | 1.99% |
Disclaimer/Publisher’s Note: The statements, opinions and data contained in all publications are solely those of the individual author(s) and contributor(s) and not of MDPI and/or the editor(s). MDPI and/or the editor(s) disclaim responsibility for any injury to people or property resulting from any ideas, methods, instructions or products referred to in the content. |
© 2023 by the authors. Licensee MDPI, Basel, Switzerland. This article is an open access article distributed under the terms and conditions of the Creative Commons Attribution (CC BY) license (https://creativecommons.org/licenses/by/4.0/).
Share and Cite
Hapsari, I.R.; Kristiawan, S.A.; Sangadji, S.; Gan, B.S. Damage States Investigation of Infilled Frame Structure Based on Meso Modeling Approach. Buildings 2023, 13, 298. https://doi.org/10.3390/buildings13020298
Hapsari IR, Kristiawan SA, Sangadji S, Gan BS. Damage States Investigation of Infilled Frame Structure Based on Meso Modeling Approach. Buildings. 2023; 13(2):298. https://doi.org/10.3390/buildings13020298
Chicago/Turabian StyleHapsari, Isyana Ratna, Stefanus Adi Kristiawan, Senot Sangadji, and Buntara Sthenly Gan. 2023. "Damage States Investigation of Infilled Frame Structure Based on Meso Modeling Approach" Buildings 13, no. 2: 298. https://doi.org/10.3390/buildings13020298