1. Introduction
In recent years, the construction industry has witnessed a surge of interest in fiber-reinforced concrete (FRC) as a sustainable and reliable material, which lauded for its enhanced mechanical and durability properties [
1,
2,
3]. Steel fiber-reinforced concrete (SFRC) is still the most applied FRC, where steel fibers are used to effectively mitigate brittle failure and control crack development [
4,
5], positioning itself as a promising solution for modern infrastructure projects. Employing enough steel fibers in reinforced SFRC beams lacking stirrups can enhance their shear capacity, which might potentially result in a transition of the failure pattern from being predominantly shear-driven to being governed by flexural mechanisms [
6,
7,
8,
9].
Furthermore, the utilization of glass fiber-reinforced polymers (GFRPs) as a partial or total replacement for traditional steel bars has emerged as a growing trend in structural engineering [
10,
11,
12], primarily driven by the need to combat the vulnerability of conventional steel reinforcement to corrosion [
13,
14]. The superior corrosion resistance of GFRP bars makes them an attractive alternative; however, beams reinforced solely with GFRP bars have been found to exhibit brittle failure modes [
15]. Additionally, GFRP bars demonstrate a notable decline in their mechanical properties under relatively high temperatures [
16,
17], posing unique challenges in fire-prone environments. To enhance the ductility and overall performance of GFRP-reinforced beams, the concept of hybrid reinforcement, comprising steel and GFRP bars, has been proposed [
18,
19,
20,
21,
22]. This innovative approach capitalizes the inherent strengths of both materials, striking a balance between corrosion resistance and ductile behavior, thus elevating the reliability of structural elements.
To predict the behavior of FRC beams with hybrid reinforcement under both Serviceability Limit State (SLS) and Ultimate Limit State (ULS) conditions, nonlinear finite element analysis (NLFEA) has emerged as a powerful strategy [
23,
24,
25]. NLFEA revolutionized the field, enabling practitioners and researchers to explore and replicate the response of reinforced concrete (RC) members and systems, accounting for both material and geometric non-linearities. The application of NLFEA in structural engineering, especially within the context of RC structures, has been the focus of numerous investigations and guidelines [
26,
27,
28]. Moreover, NLFEA has emerged as a powerful tool for assessing existing RC structures and infrastructures, considering the impact of deterioration processes [
29,
30].
In the ever-evolving landscape of structural engineering, the pursuit of safe, resilient, and efficient designs has been an ongoing challenge for professionals worldwide [
31,
32,
33,
34]. As architects and engineers encounter increasingly complex projects, traditional methods of linear analysis and localized safety checks have proven insufficient to address the intricate behaviors of RC structures [
35].
Historically, the analysis of concrete structures in civil engineering predominantly relied on linear and pseudo-nonlinear approaches [
36,
37]. However, the inherent nonlinear behavior of RC has sparked curiosity and discussion among structural designers [
38], prompting the need for more sophisticated methods to address this complexity.
The quest for more accurate and comprehensive design approaches has led to the emergence of global resistance methods (GRMs), a set of techniques that harness the power of NLFEA to explore the holistic performance of structures under diverse loading conditions [
28,
35,
39].
GRMs facilitate the definition of safety formats that encompass both aleatory (mechanical and geometric) and epistemic (numerical model) uncertainties [
40,
41,
42]. Using NLFEA, the global structural resistance can be better estimated, accounting for material and geometric uncertainties via appropriate partial safety factors. This approach provides a more refined and comprehensive understanding of structural reliability, allowing engineers to compare the design values of external actions with the corresponding global structural resistances [
42].
Comprehensive deliberations concerning the global safety formats for the NLFEA of RC structures are available within the references [
40,
43,
44]. Castaldo et al. [
35] explored the impact of aleatory uncertainty and the sensitivity of the numerical model in accurately predicting failure modes and their subsequent effects on NLFEA results in terms of reliability. Investigations have also been conducted to include geometric non-linearities [
45,
46] and nonlinear numerical models for RC structures [
39,
47,
48]. However, a comprehensive assessment of the combined influence of material and geometric uncertainties on hybrid GFRP-steel SFRC beams, particularly when subjected to materials non-linearities within the global resistance methods, is currently lacking.
This study assesses the applicability of global resistance methods in terms of the maximum load and failure mode of hybrid GFRP-steel reinforcement SFRC beams. By utilizing experimental test results on I-shaped SFRC beams, NLFEA models are developed and validated. Initially, two experimental tests selected through an experimental program conducted by Mazaheripour et al. [
49] on hybrid GFRP-steel SFRC beams, each with varying prestress levels, were simulated with a multi-directional fixed smeared crack model (MDFSCM), implemented into Femix V4.0, a software based on the finite element method (FEM) [
50]. The global resistance safety factor is evaluated, offering valuable insights into the structural performance of hybrid reinforcement SFRC beams and aiding in the application of global resistance safety formats, such as the Estimation of the Coefficient of Variation (ECoV) method [
42].
The paper begins by discussing the basic principles of GRM and then presents a case study to illustrate the application of GRM to the design of an FRC beam. Finally, a comparative analysis is conducted to assess the design outcomes achieved with various safety formats in the context of FRC beam design.
2. Definition and Characterization of Uncertainties According to Safety Formats for Nonlinear Finite Element Analysis
The reliability design method is an effective approach for assessing the probability of structural failure since it takes uncertainties into account in a quantitative manner. However, its implementation presents challenges due to the considerable computational complexity, making it difficult for design engineers to calculate failure probabilities. Higher-level reliability analysis methods, such as Monte Carlo simulation and first-order reliability methods, are also challenging to apply in complex structural design scenarios [
51,
52].
The “local approach” is widely embraced in design codes of practice and is highly efficient for practitioners and designers [
53,
54]. It involves structural linear analyses to determine the resultant stresses in intended cross sections of the members forming the structure and the comparison of the design value of these resultant stresses (
Ed) with the corresponding design value of the resisting capacity of the corresponding sections (
Rd) through the partial factor method [
54]. However, this local approach can be too over-conservative, mainly in structures of high redundant supports and/or when they have a high stress-redistribution capacity after crack initiation [
35], as is the case for FRC, due to the crack-opening resisting mechanisms offered by fibers [
55].
The “global resistance approach” allows for the establishment of appropriate safety criteria that facilitate the comparison between the design values of external actions (
Fd) and the corresponding design global resistance (
Rd) of the structural elements or the entire system [
35,
40,
42,
43]. The global structural resistance can be estimated through NLFEA, and its design value (
Rd) can be calculated by considering the influence of uncertain factors, such as material properties, geometric variations, and numerical model accuracy, by introducing specific safety factors [
42]. The partial safety factors can be assessed according to predefined target levels of reliability, which differentiate between newly constructed structures and those that already exist [
35,
42]. NLFEA comprehensively account for the global response of structural elements or systems, considering the evolution of damage under specific loading conditions, the nonlinear behavior of concrete and reinforcements, and even local or global instabilities. Within the global approach, the design value of external actions (
Fd) is assessed following the guidelines in Eurocode [
54] and then compared to the design value of global structural resistance (
Rd), which can be evaluated using NLFEA based on global resistance methods [
42] expressed as follows:
where
represents the global resistance of a structure evaluated by NLFEA by employing representative values (
) for both geometrical and material properties in accordance with the chosen safety format. The level of structural reliability is addressed through the utilization of two distinct global safety factors:
, which is the global resistance safety factor that accounts for data uncertainties like those associated with the material properties and geometry [
42], and
, which represents the resistance model’s uncertainty, dependent on the predictive performance of the nonlinear material model [
28,
47,
56]. Besides the characteristics of the model,
also depends on the type of structural failure mode and is larger in structures presenting brittle failures (punching/shear) and mixed failure modes, and it is smaller in structures with ductile bending failure modes (1.06 to 1.16) [
42].
As per
fib Model Code 2010, MC2010 [
57], the design resistance (
Rd) can be determined through several approaches that incorporate varying degrees of probabilistic theory implementation. These methods include the partial safety factor (PSF) method and the global resistance method (GRM), each offering distinct ways to account for uncertainties and reliability in the design process.
The PSF method involves utilizing the design values
as input parameters for the NLFEA:
The partial safety factors for the characteristic strength of steel, concrete, and GFRP during the ULS are 1.15, 1.5, and 1.25, respectively [
42]. However, for the SLS, the partial safety factor remains at 1.
The global resistance factor (GRF) method is becoming increasingly popular since it is the recommended approach in practice codes [
42] for the design and evaluation of RC structures using NLFEA. In this approach, the design resistance (
Rd) is determined through the following equation:
where
represents the global resistance of a structure evaluated by NLFEA using the mean value for the yield strength (
) of the steel reinforcement and a reduced value for concrete strength (
) to accommodate its higher random variability. To calculate the reduced mean values of other material properties of concrete, including tensile strength, fracture energy, and bond strength, the reduction factor of 0.85 should be applied. In the absence of a specific reduced value for GFRP bar strength in MC2010, the characteristic tensile strength (
) is assumed for the mean tensile strength since it has a more brittle behavior than steel but not as brittle as concrete. MC2010 recommends a partial factor of resistance (
) of 1.2 and a model uncertainty factor (
) of 1.06. It is worth emphasizing that in certain building scenarios,
can be calibrated using the NLFEA, as demonstrated by several researchers [
35,
41,
44,
48,
58,
59,
60].
According to probabilistic studies, the random distribution of resistance in RC members can be characterized by a two-parameter of lognormal distribution with the lower bound at the origin [
61]. Hence, the probabilistic method relies on this lognormal distribution assumption, with two key random parameters: R
m (mean resistance) and
VR (coefficient of variation of resistance). This method is known as ECOV (Estimation of the Coefficient of Variation). Using these assumptions, the random distribution of resistance can be determined through the mean (
) and characteristic (
) values for the material properties used by the model in the NLFEA. Given a probability of 0.05 for the characteristic value, the coefficient of variation of the distribution of the global structural resistance (
VR) can be obtained from
The calculation of the global factor for the mean resistance (
) is related to the random variation in resistance caused by basic material parameters and failure modes and is derived from
where
is the first-order-reliability-method (FORM) sensitivity factor for the reliability of resistance and is equal to 0.8 for a failure probability of 1‰ [
42,
53], and the reliability index (
) is equal to 3.8 for a reference period of 50 years [
62]. Finally, the design resistance (
Rd) using the ECOV method is determined from
The epistemic uncertainty in NLFEA arises from “missing” knowledge, assumptions, and simplifications concerning constitutive laws, kinematic compatibility, and force equilibrium [
63]. It also includes uncertainties related to auxiliary non-physical variables or individual choices made during the analysis.
The model uncertainty factor (
) for well-validated numerical models is suggested as 1.06 [
53]. However, for models with lower levels of validation, model uncertainty values greater than 1.06 should be employed [
42]. Consequently, a comprehensive investigation into the determination of the safety factors becomes important.
3. Experimental Tests of the Hybrid GFRP-Steel Reinforcement SFRC Beam
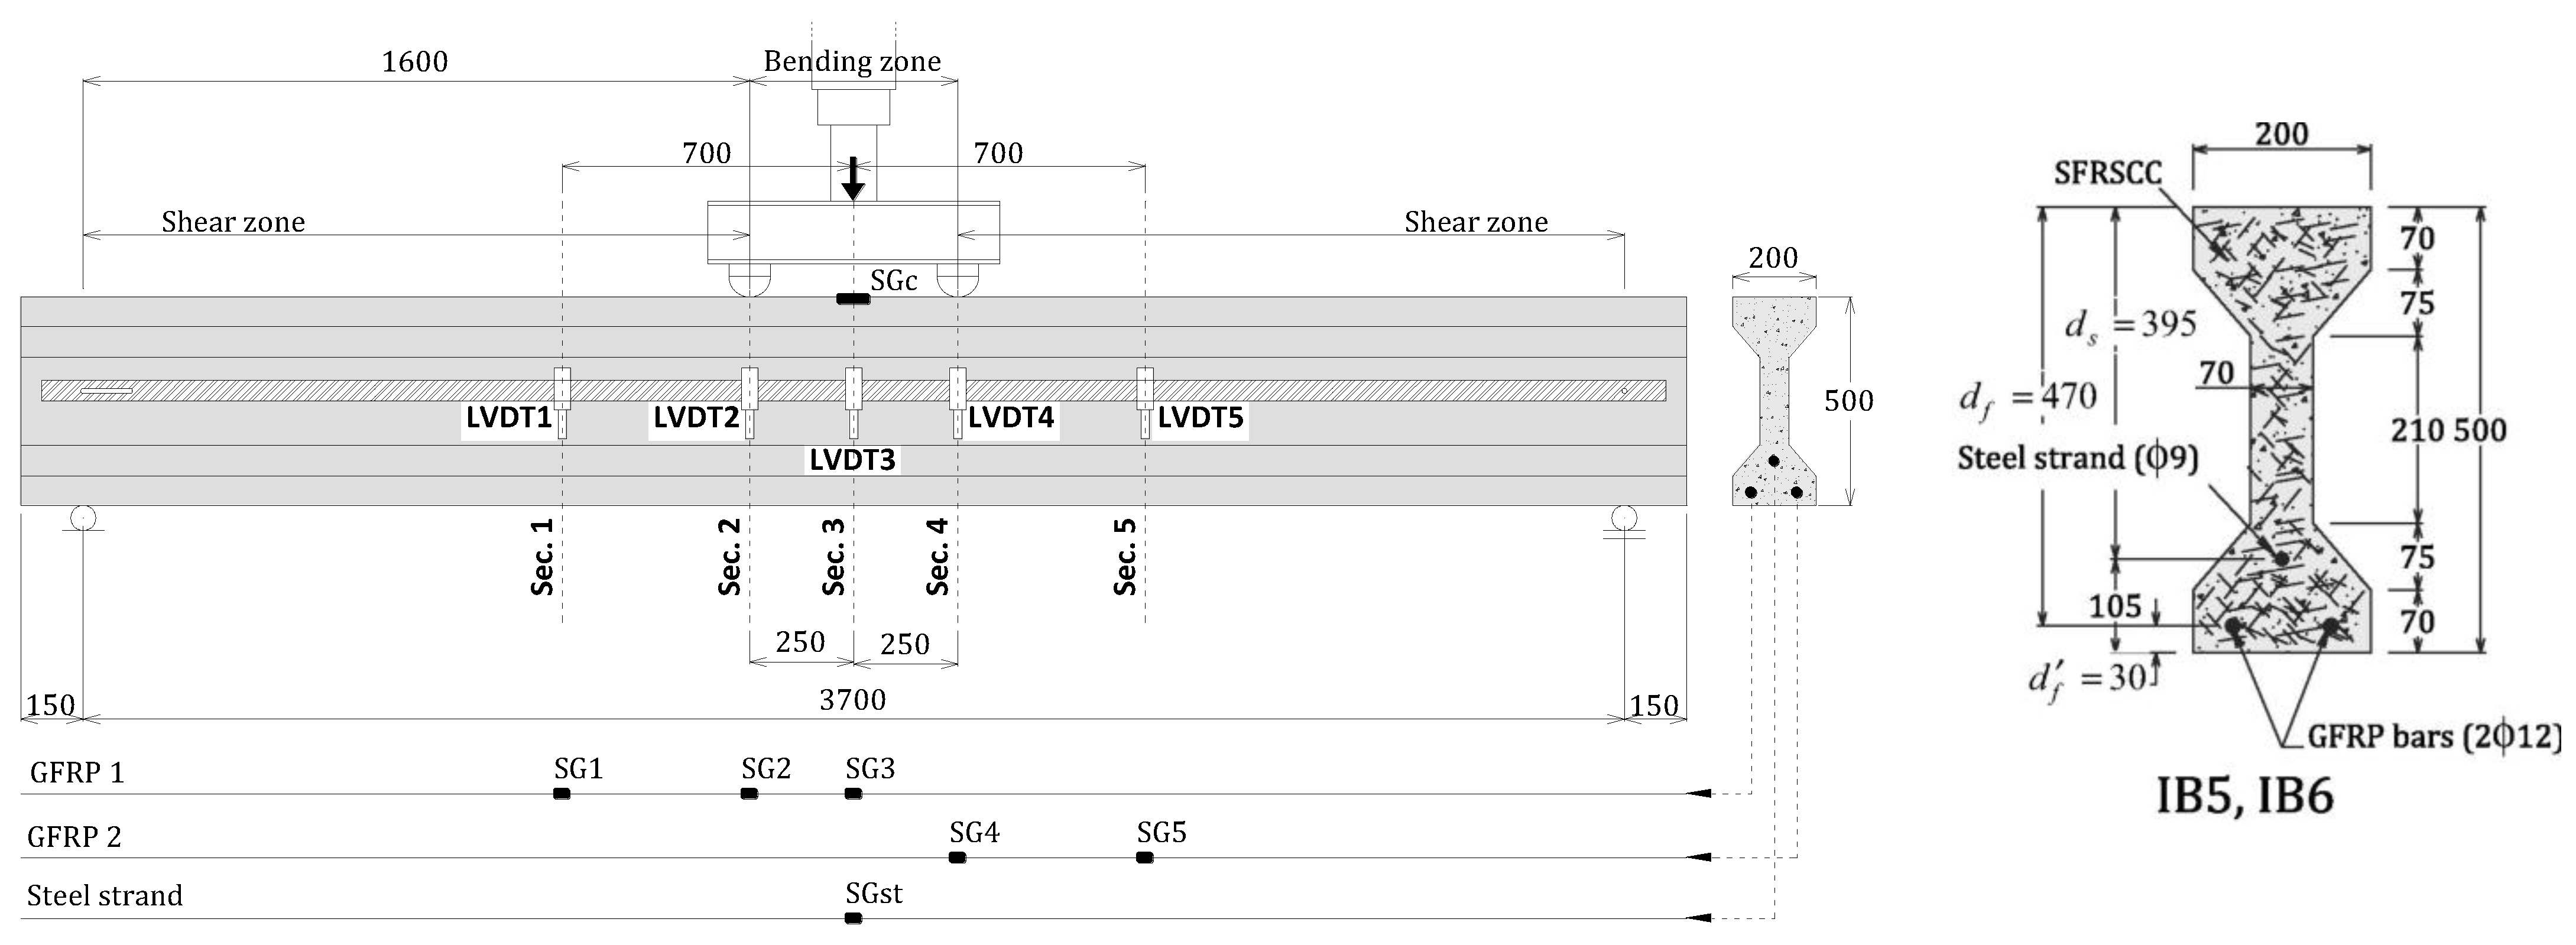
Figure 1 illustrates the geometric characteristics, reinforcement configurations, support, and loading conditions of the beams analyzed in the experimental study conducted by Mazaheripour et al. [
49]. A 4 m long beam was chosen to enable a thorough analysis of its behavior while staying within the limitations of the available resources and experimental setup. The adoption of an I-shaped cross-sectional configuration for this beam structure is suggested, aiming to achieve enhanced flexural performance. This choice leverages the superior flexural stiffness inherent in the I-shaped section, in contrast to a rectangular cross-sectional beam with an equivalent volume of SFRC material. The right support (
Figure 1) permits translational movement in the horizontal direction and rotations around the vertical and lateral axes, while the left support allows only rotation around the lateral axis. Five Linear Variable Differential Transducers (LVDT) were installed at intervals spanning the beam’s length to monitor the vertical deflection.
Figure 1 also depicts the arrangement of nine strain gauges placed on the materials to measure their strain under load, denoted as “SG” for GFRP bars, “SGst” for steel strands, and “SGc” for SFRSCC. The selected experimental program comprised two I-shaped beams, namely IB5 and IB6, which both had the same reinforcement but different prestress levels of the hybrid flexural reinforcement.
In the experimental program, each beam had flexural reinforcement consisting of two glass fiber-reinforced polymer (GFRP) bars, each with a diameter of 12 mm and a total cross-sectional area of 269 mm
2. Additionally, a single steel strand with a diameter of 9 mm and a cross-sectional area of 51.6 mm
2 was also used as longitudinal reinforcement. The nominal mechanical properties of these reinforcements, obtained from the manufacturers’ information, are provided in
Table 1.
Beam IB5 served as the reference beam and did not undergo any prestress application in either the GFRP bars or the steel strand. In beam IB6, the steel strand (
) was prestressed at a level of 800 MPa, while the GFRP bars (
) were prestressed to a level of 200 MPa, as specified in
Table 2. The average pre-strain losses at the time of testing were approximately 13.6% for the GFRP bars and 9.8% for the steel strand, compared to the pre-strain measured on the day of prestressing these reinforcements.
The steel fiber-reinforced self-compacting concrete (SFRSCC) containing 90 kg/m
3 of steel fibers was prepared using a mixing method outlined in a different source [
64]. This concrete mixture included hooked-end steel fibers with a length of 33 mm, an aspect ratio of 65, and a yield stress of 1100 MPa.
To assess the compressive strength and Young’s modulus of the SFRSCC, a total of 25 cylindrical specimens with a diameter of 150 mm and a height of 300 mm were subjected to compression tests in accordance with the ASTMC39 standards [
65]. The results showed an average compressive strength of 73 MPa with a coefficient of variation (CoV) of 6%. Additionally, the average Young’s modulus was found to be 35.4 GPa with a CoV of 3%.
The average residual flexural tensile strength parameters of the SFRSCC (
) were obtained from the applied force (
F) versus the Crack Mouth Opening Displacement (
CMOD) diagrams [
66] by executing three-point notched beam bending tests according to the recommendations of EN 1465 [
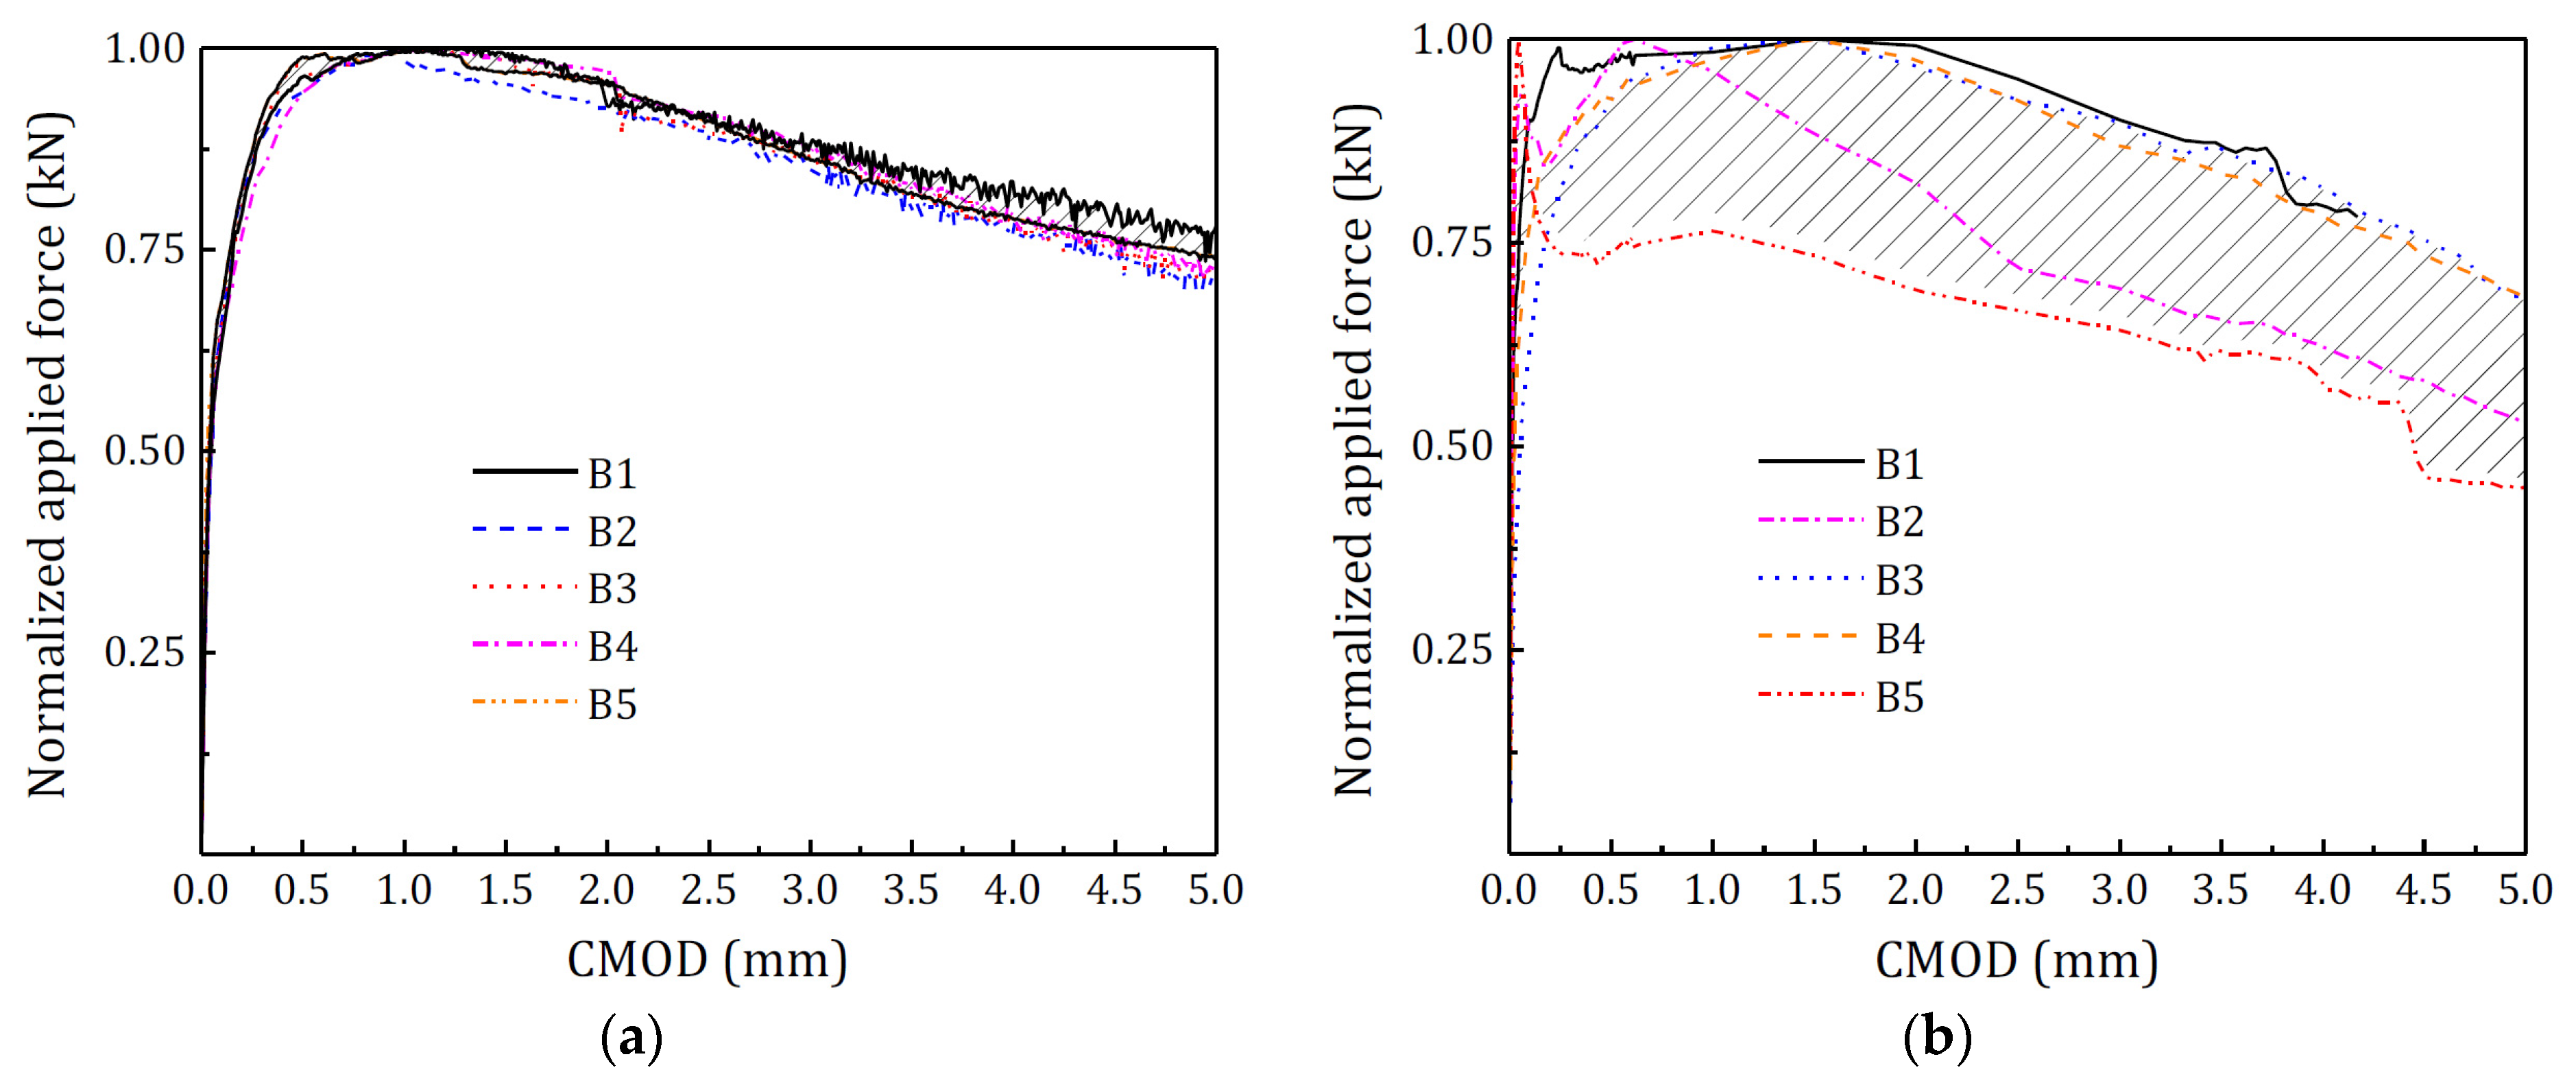
67]. Two separate sets of notched beams were investigated, with each set containing five specimens. The first set comprised standard specimens measuring 150 × 150 × 600 mm, and these specimens had a notch depth of 35 mm. The second set consisted of notched beam specimens obtained from intact sections at both ends of the beams. These specimens had dimensions of 70 × 70 × 600 mm and a notch depth of 15 mm. The results of the five notched beam bending tests involving these specimens are graphically represented in
Figure 2, where the applied force has been normalized against the CMOD. The detailed results of the residual flexural tensile strengths
fR1,
fR2,
fR3, and
fR4 for a CMOD of 0.5, 1.5, 2.5 and 3.5 mm, respectively, obtained from the experimental tests for both sets of specimens are provided in
Table 3.
The post-cracking behavior observed in extracted members exhibits a notably high degree of dispersion of the data with respect to the mean values, which is primarily attributed to the too-small fractured surface area of these specimens regarding the maximum dimension of the aggregates and length of fibers adopted for producing the SFRSCC. In this case, the number of fibers crossing the fracture surface is relatively small, as the post-cracking tensile capacity of these small specimens is very sensitive of the distribution and orientation of the fibers, contributing significantly to the obtained dispersion of . Since this fracture is much lower than what is expected to occur in the failure of the beams, the obtained in the tests of the second series should not be representative of the post-cracking tensile behavior of the SFRSCC, but specific research is required in this domain. This observation highlights the debatable nature of assuming isotropic post-cracking behavior when simulating SFRSCC structures; however, for the design in this study, the post-cracking behavior results from specimens with standard size were utilized.
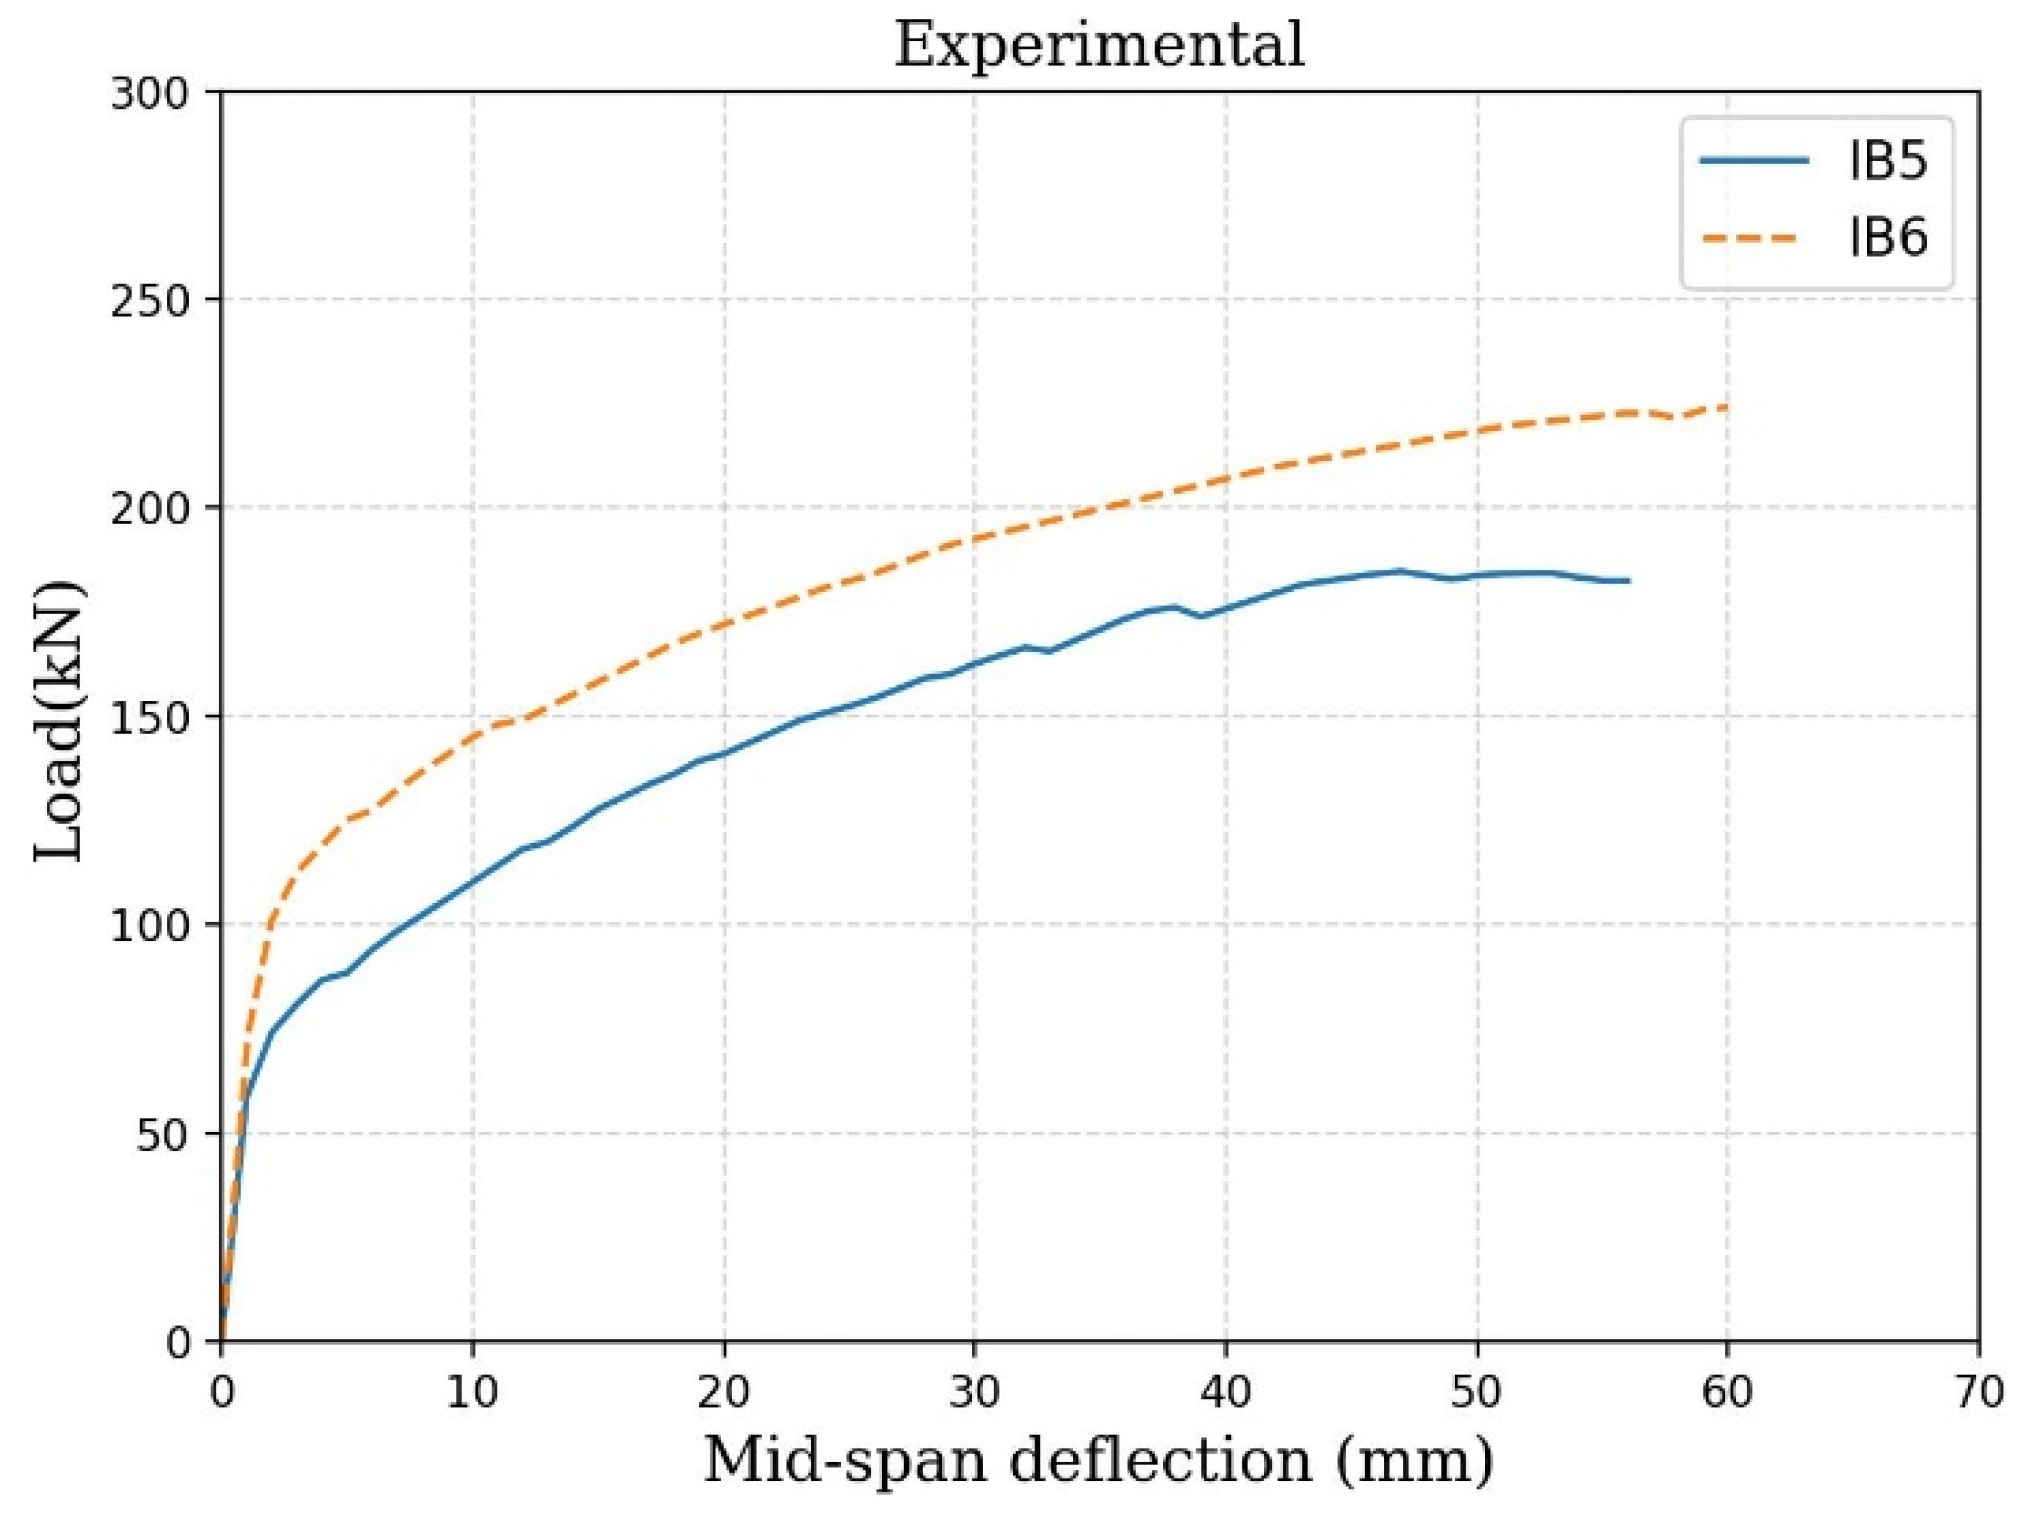
During the experimental program, the I-shaped beams were subjected to a four-point bending test configuration using a servo-hydraulic actuator until failure. The tests were conducted under monotonic loading conditions, with 500 mm between the applied loads, as illustrated in
Figure 1. The actuator’s piston was displacement-controlled at a speed of 0.01 mm/s. The load deflection response of tested beams is illustrated in
Figure 3.
The experimental findings demonstrate a clear trend of increasing the beam’s shear capacity with the prestress applied to the flexural reinforcement. This improvement is attributed to the favorable mechanism of aggregate interlock and a larger uncracked SFRC area. A comparison among experimental results also indicates that using the prestress in reinforcement results in a significant enhancement in the load-carrying capacity. This trend is also evident in the deflection of the beams.
In cases where the prestress was applied, the load–deflection curve exhibited a plateau after reaching a deflection of 35 mm, indicating that no further increase in the load was observed. Moreover, as the prestress level increased, the GFRP bars experienced higher strains at the point of failure.
4. Code-Based Design Provisions for Hybrid GFRP–Steel-Reinforcement SFRC Beams: Evaluation and Analysis
In this section, a brief analysis of the simplified methodologies employed by engineers in the flexural and shear design of SFRC beams is performed.
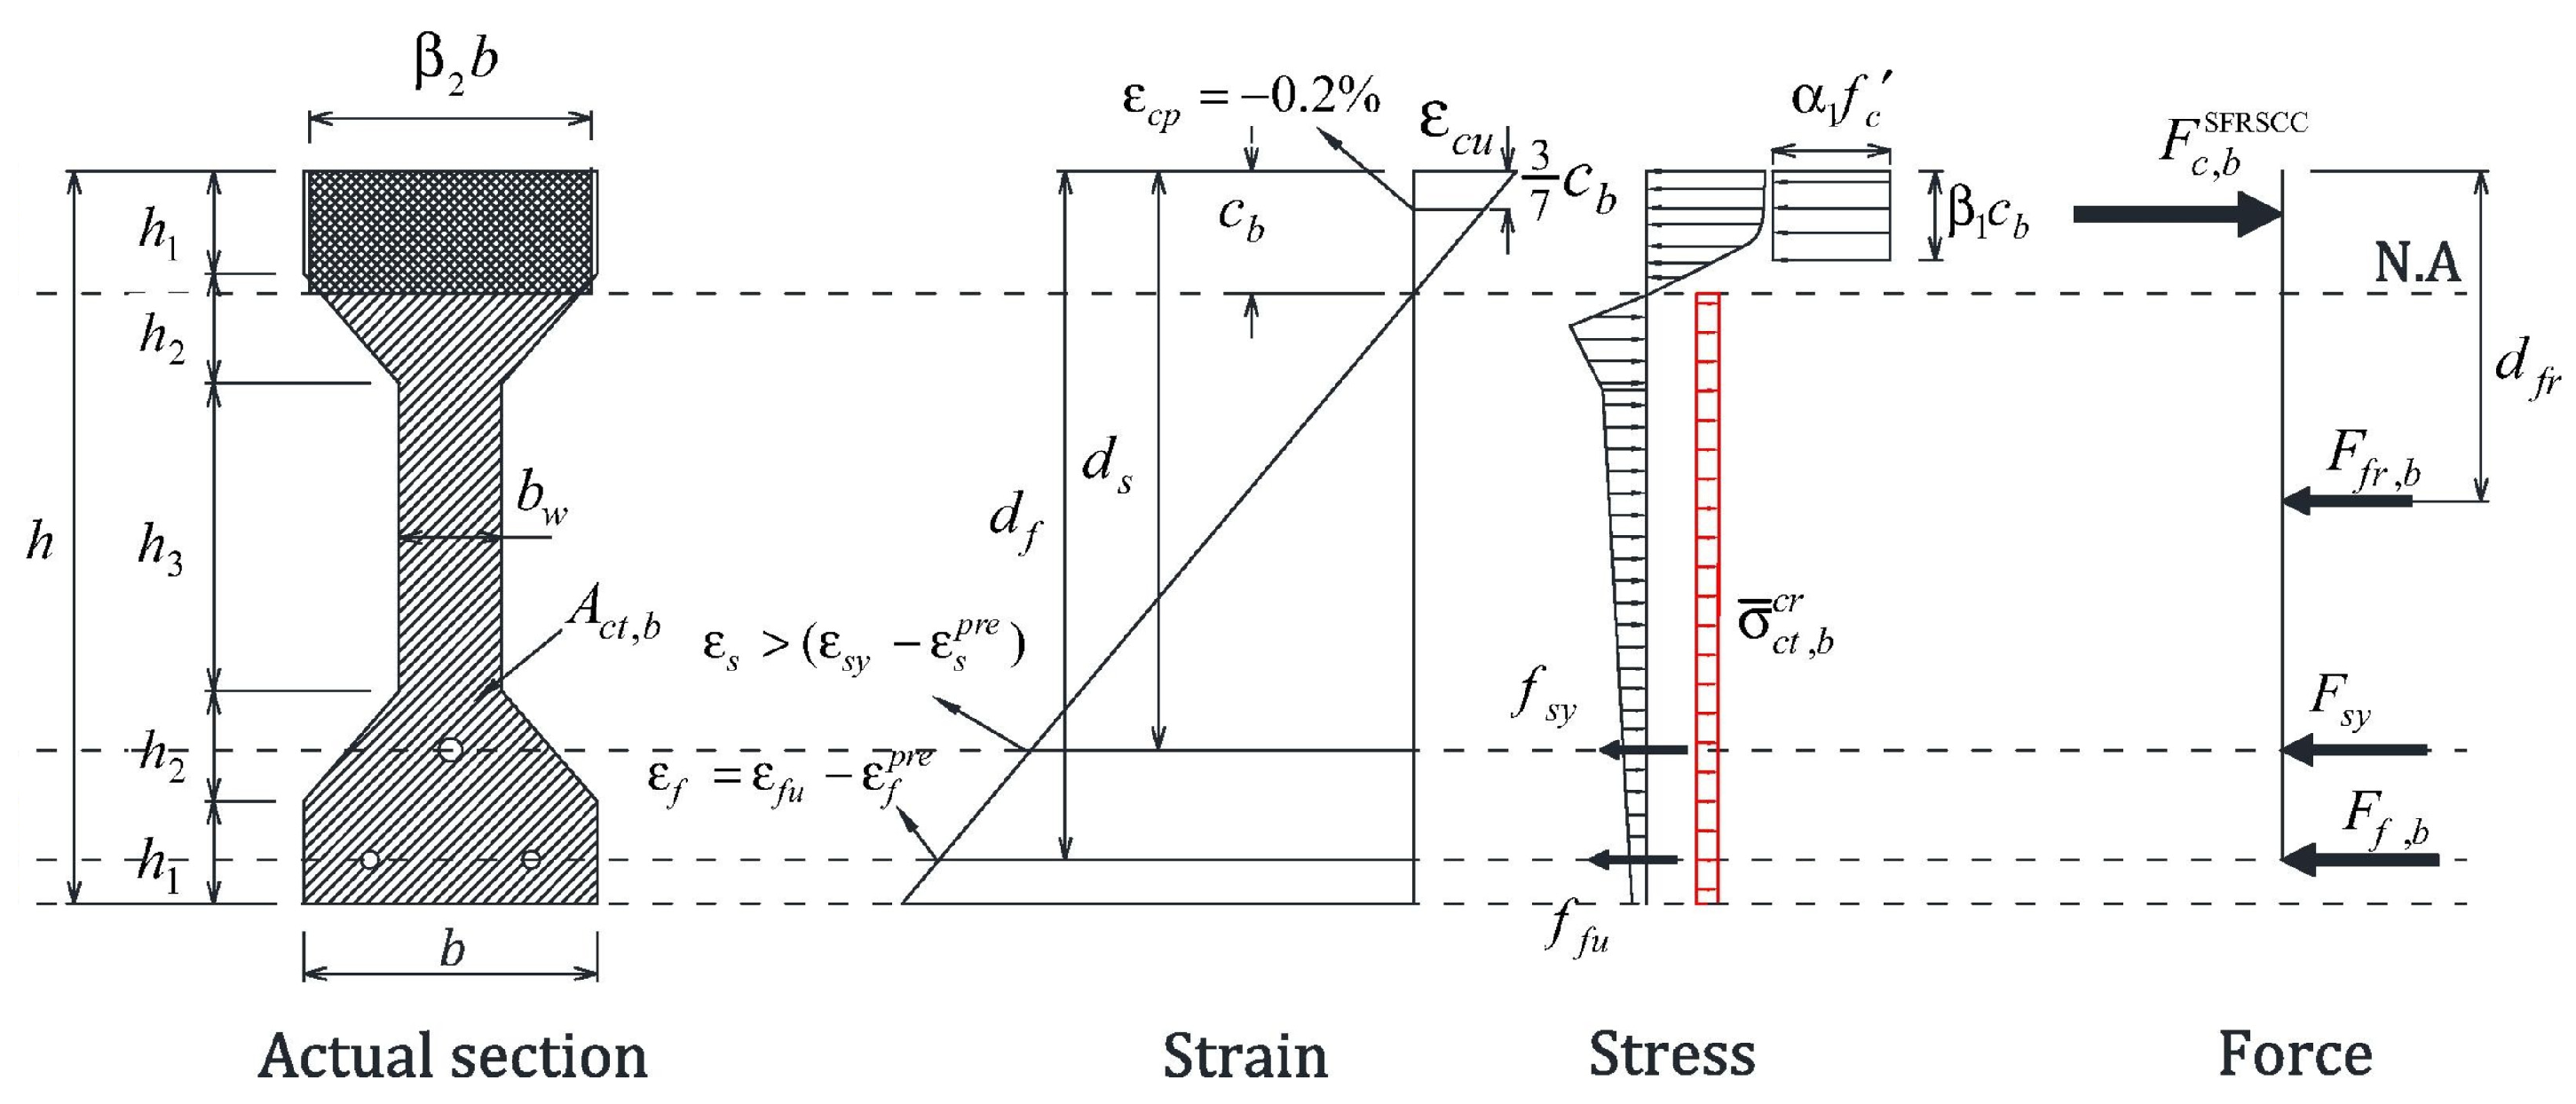
To determine the design flexural capacity of a cross section,
, the strain compatibility and constitutive laws of the intervenient materials, and the forces equilibrium are considered.
Figure 4 illustrates the experimental beam’s cross section along with the associated strain and stress distributions.
The value of
was obtained with the formulation resumed in
Table A1 of
Appendix A, where design values for the material properties were used. More details on this formulation are available elsewhere [
49].
The design shear capacity,
, of the tested beams was assessed using the formulation recommended by the MC2010, as outlined in
Table A2 of
Appendix A. The detailed description can be found in Barros et al. [
68].
By applying these formulations, the flexural and shear design resistance of IB5 and IB6 were determined and included in
Table 4. Considering the beam is simply supported (
Figure 1), the design ultimate load,
, was obtained, which is also included in this table.
When considering the design value of the IB5 and IB6 flexural strength, their load-carrying capacities are, respectively, 163.29/1.6 × 2 = 102 kN and 170.37/1.6 × 2 = 213 kN. However, the load-carrying capacity of these beams (
) is limited by their shear strength, resulting in the values indicated in
Table 4. These values are about 40% of the corresponding values registered experimentally, resulting in a safety factor of about 2.35. The calculated design load must be lower than the design load obtained after applying the applicable code-prescribed partial safety factors for various load combinations. This observation highlights the conservatism of the recommended design formulas for these beams according to the applied code.
5. Modeling Hypotheses for the NLFEA of SFRC Beams and Comparison with the Experimental Results
The NLFEA of concrete was carried out using a crack-shear-softening law [
50] with a multi-directional fixed smeared crack model (MDFSCM) available in the FEMIX computer program, whose details are described elsewhere [
69]. According to the MDFSCM, a crack (in reality, cracks are smeared in the corresponding integration point (IP)) is formed when the principal tensile stress,
, attains the tensile strength of the material (
) at less than an adopted small tolerance. A new crack is formed in an already-cracked IP when, besides the previous criterion, the angle formed between the new crack and previous active cracks (not completely closed) is higher than an adopted threshold angle (in general
[30–60]
). To avoid numerical instabilities with the occurrence of several crack status changes during the loading process, a maximum number of cracks (
) of three and four is generally adopted for, respectively, 2D- and 3D-type MDFSCM. For simulating the fracture mode I (orthogonal to the crack plane) and mode II (parallel to crack plane), the NLMM104 nonlinear material model of FEMIX was used. In an attempt to preserve the results independently of the refinement of the finite element mesh, the crack width and crack sliding are divided by the crack bandwidth,
, which is a certain length associated with the geometry of the FE. In the present version, the same
was adopted for the crack-opening and -sliding process, which was equal to the square root of the area of the integration point of the cracked finite element (
). In the NLMM104 model, it is assumed that the concrete in compression exhibits linear elastic behavior, which is an acceptable assumption in the tested beams since the maximum compressive strain level is expected to be much smaller than the SFRC crushing strain. The system of nonlinear equations is solved using the standard Newton–Raphson iterative method employing an energy convergence criterion. Simultaneously, the displacement at the point of load application was controlled using the arc-length method.
The stress–crack-opening relationship of the SFRSCC in each series of notched beam bending tests was obtained through inverse analysis (IA) [
70] using the force–CMOD response by fitting the load versus the CMOD registered experimentally. For numerical simulations, two models were employed. In the first model, the properties of the top and bottom flanges were assigned to the first series of specimens (150 × 150 × 600 mm), while the properties of the web were associated with the second series (70 × 70 × 600 mm). In the second model, the properties of all SFRSCC elements were assigned based on the standard size recommended by Eurocode 2, which corresponds to the first series.
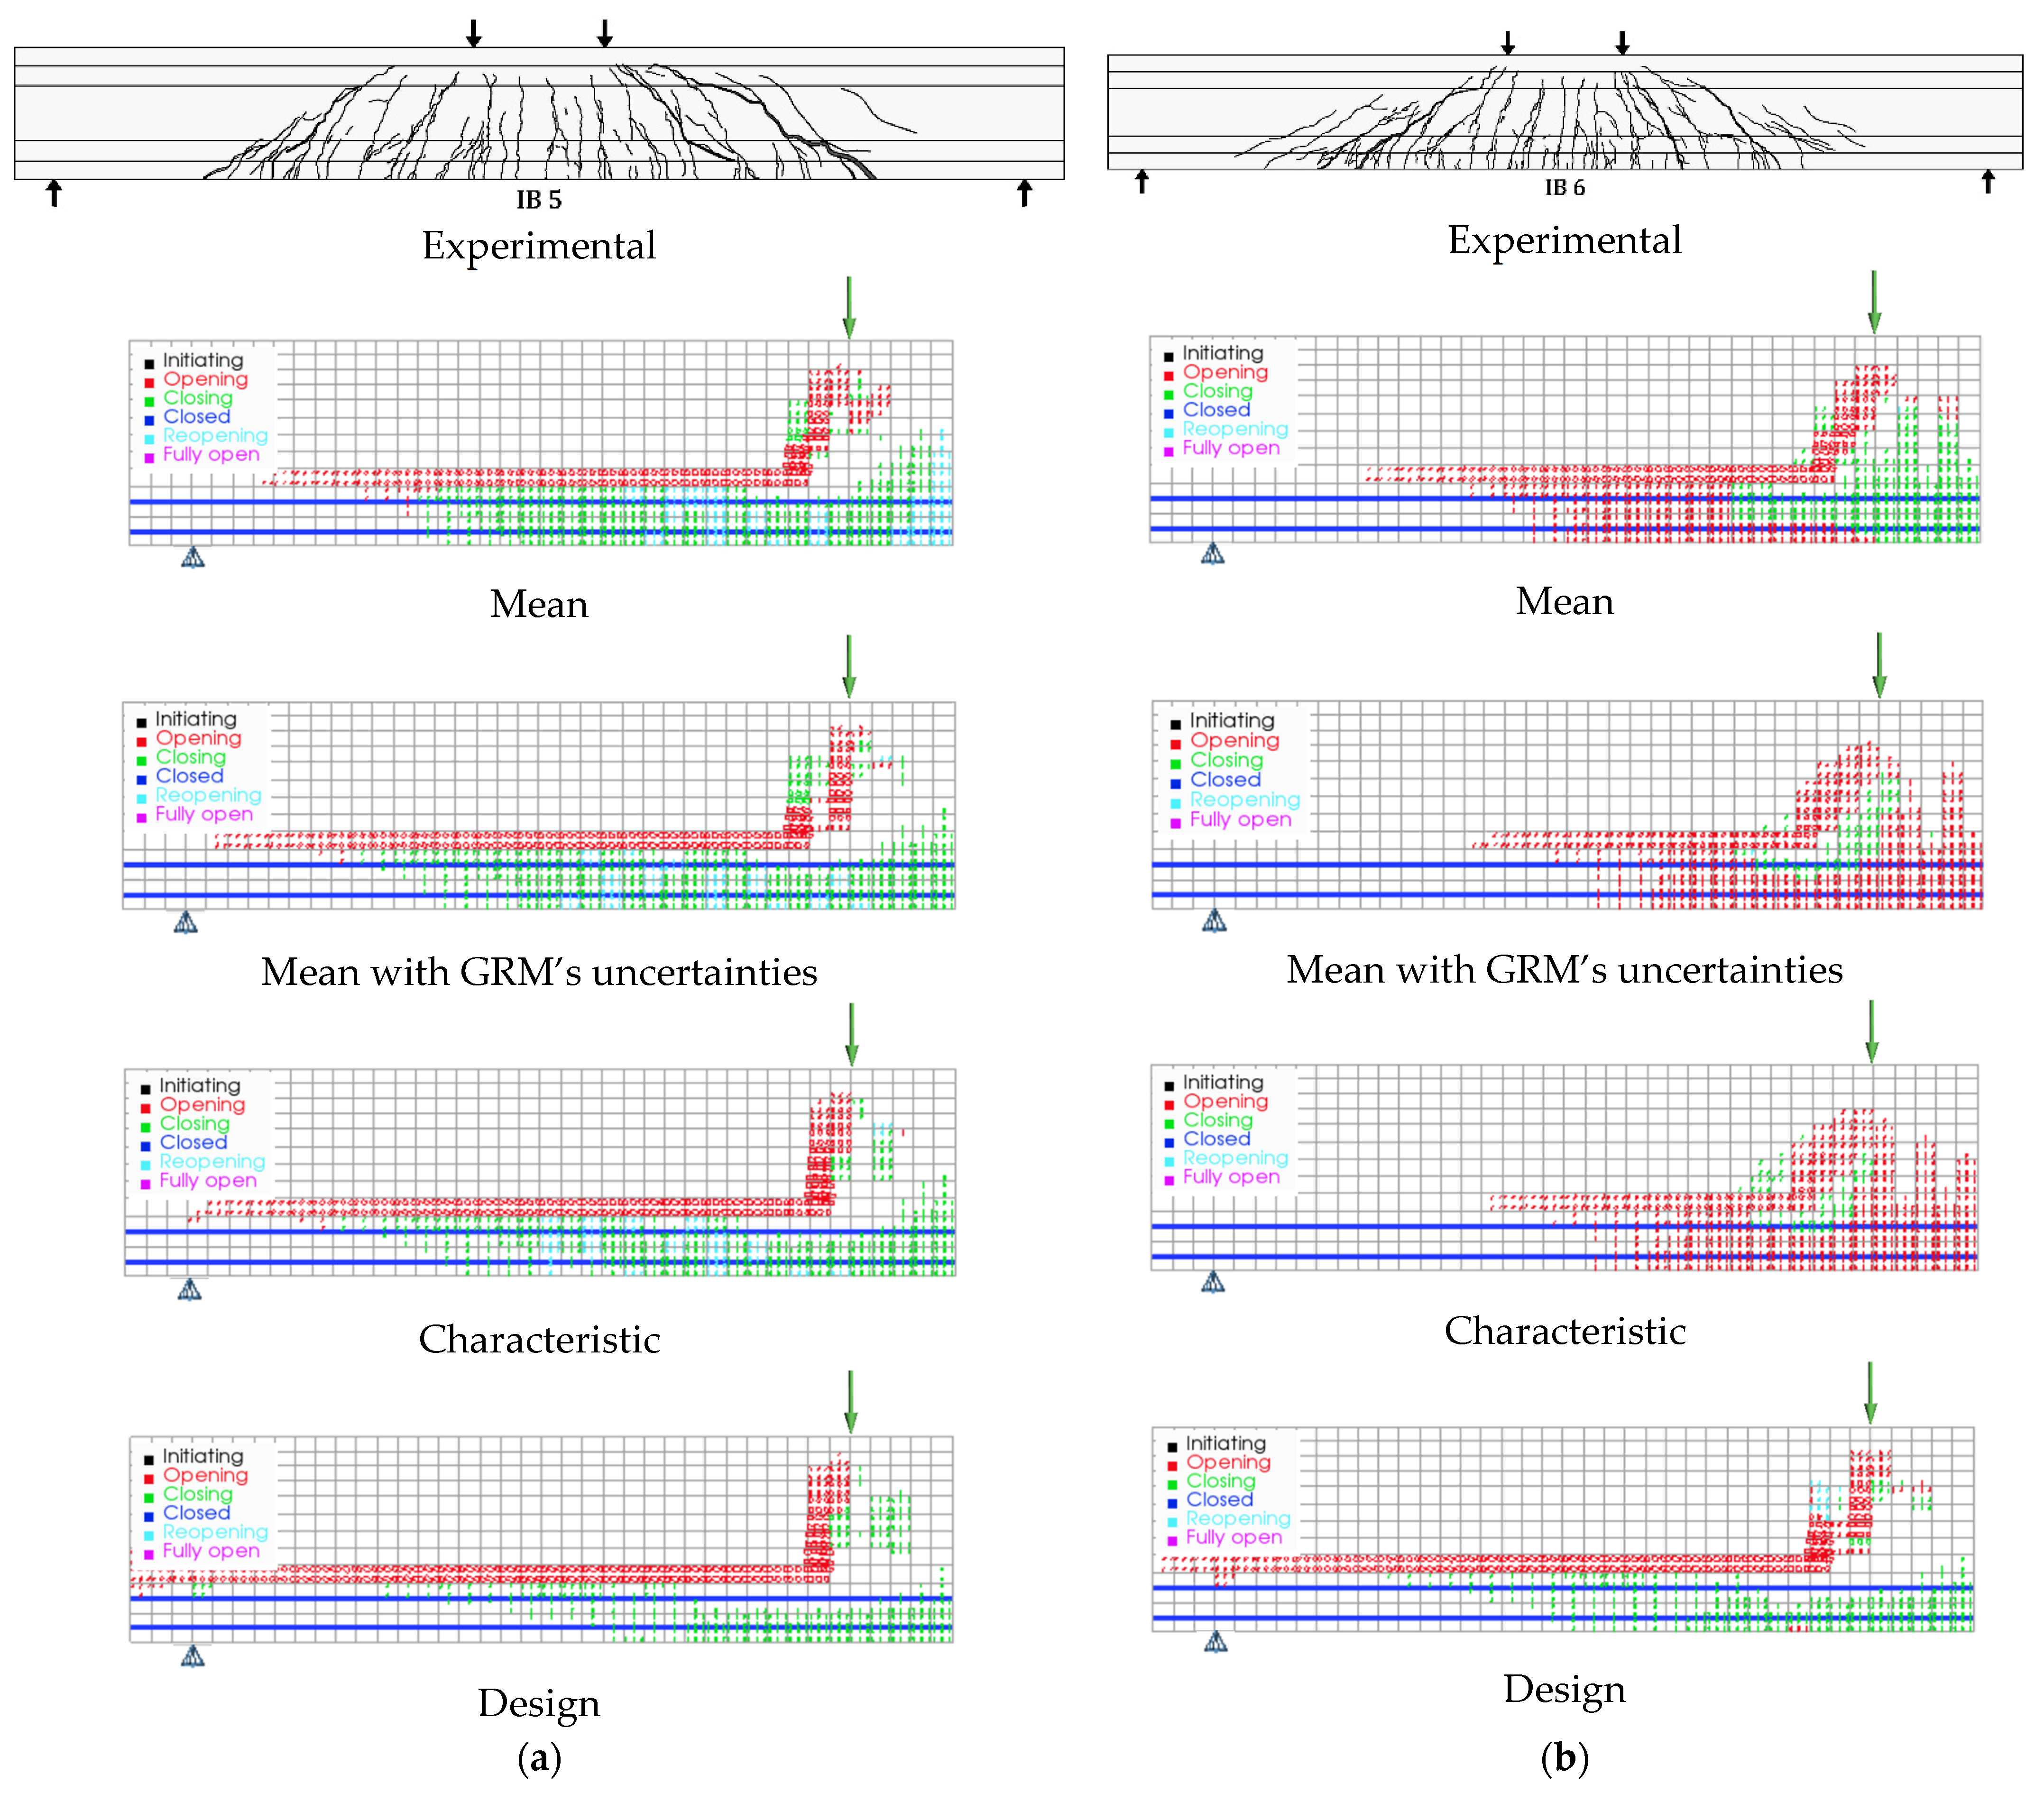
Failure criteria in all simulations are determined according to two distinct scenarios. The first occurs when the maximum load-carrying capacity is achieved and is observable in the load-deflection response of the beam through fully open cracks in finite elements, indicating the absence of shear stress transmission across the cracks. The second criterion is when the crack width in the beam exceeds 2.5 mm [
42].
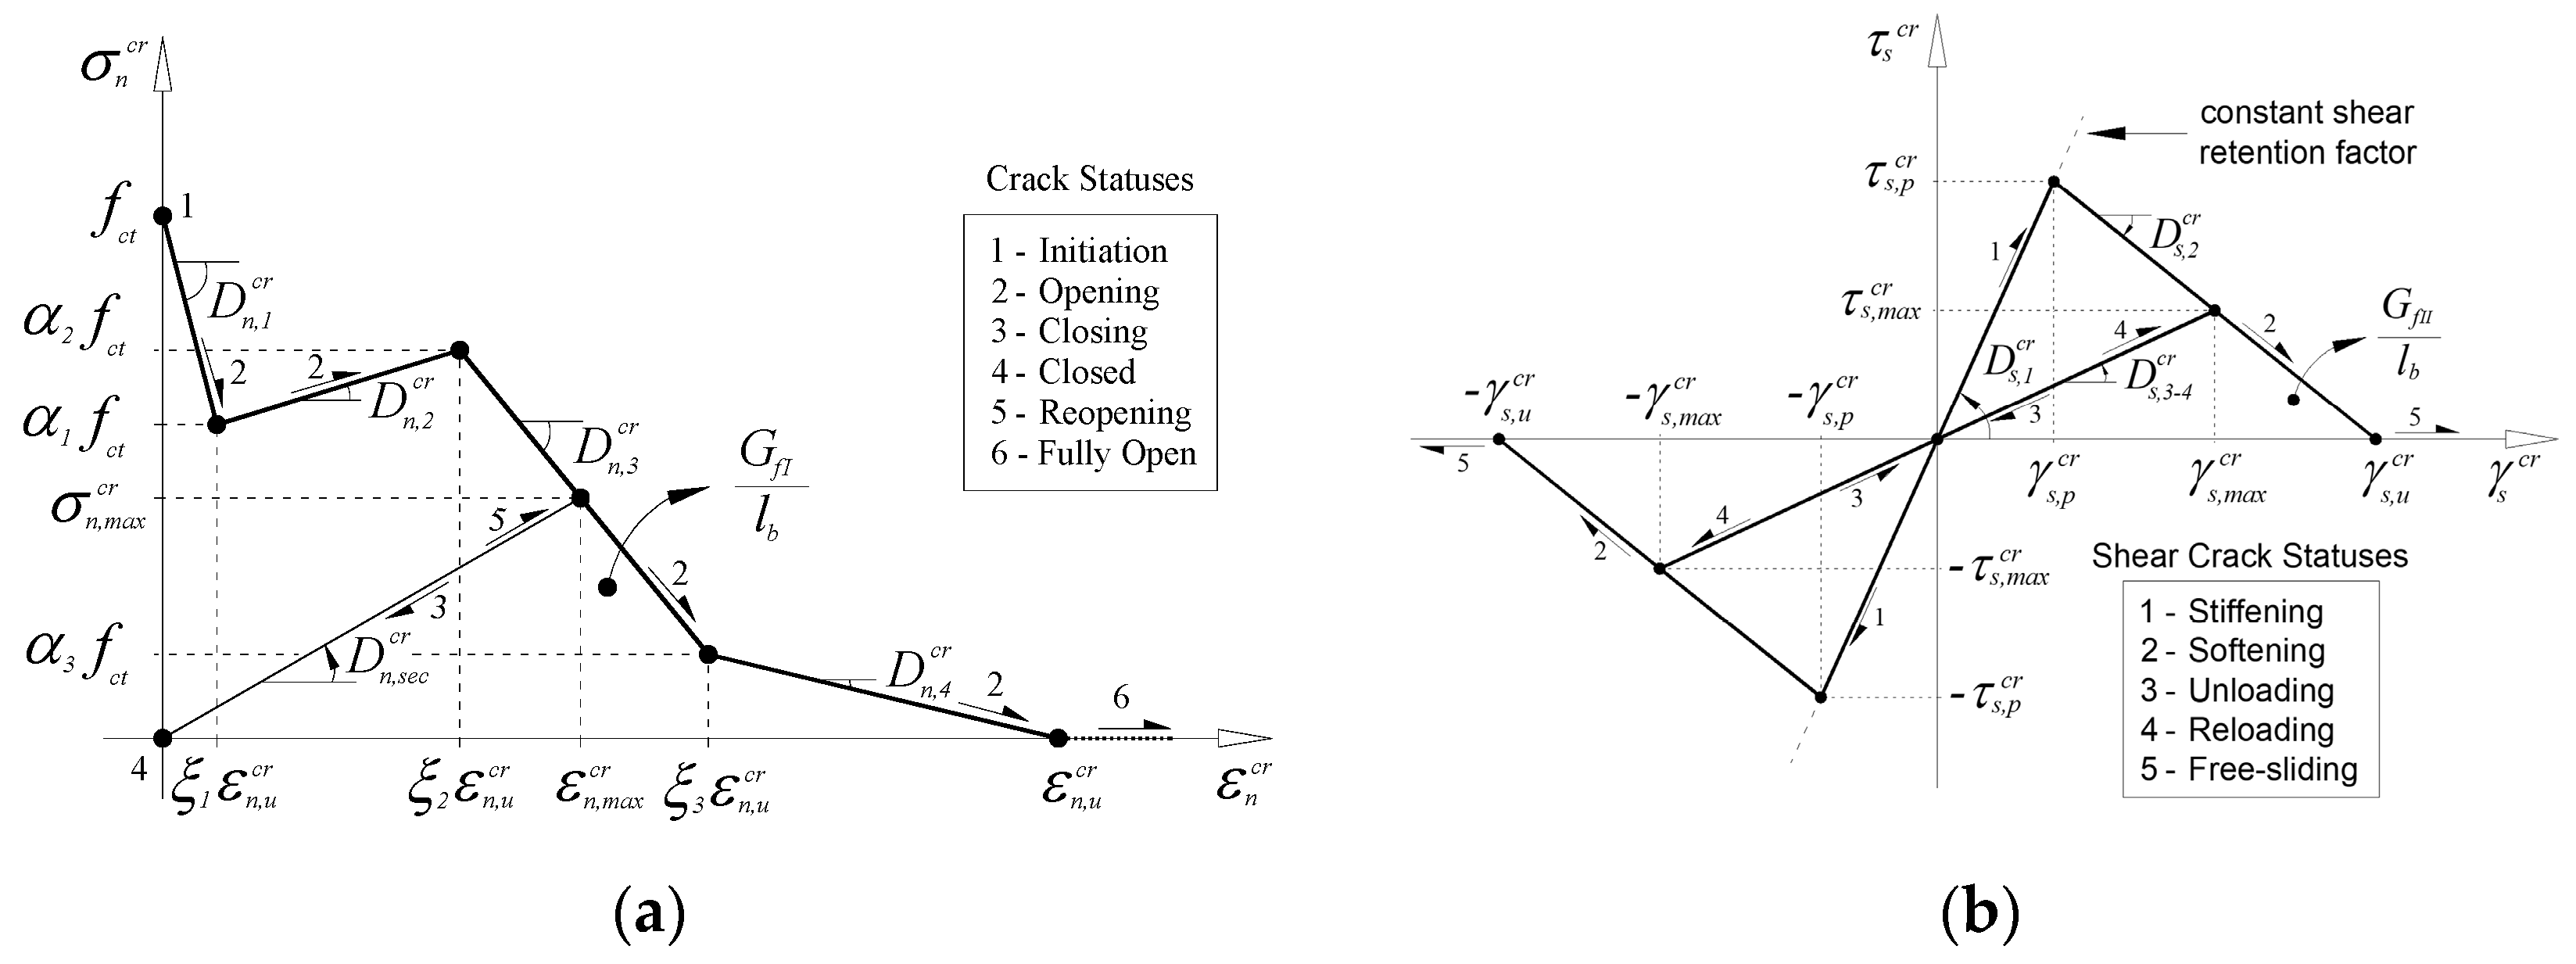
To simulate the fracture modes of SFRSCC, the NLMM104 nonlinear material model of FEMIX was used, whose corresponding diagrams are shown in
Figure 5, where
and
are the fracture energy mode I and II, respectively. The values of the parameters of the concrete constitutive model adopted in this study are presented in
Table 5. The values of the fracture mode II parameters were estimated based on previous research on the pure shear of FRC materials [
64].
The GFRP bar is assumed to exhibit a linear elastic tensile behavior until failure with a modulus of elasticity,
, of 60 GPa, while the steel strand is modeled with an elastoplastic behavior in tension and in compression, and their defining values are included in
Table 6.
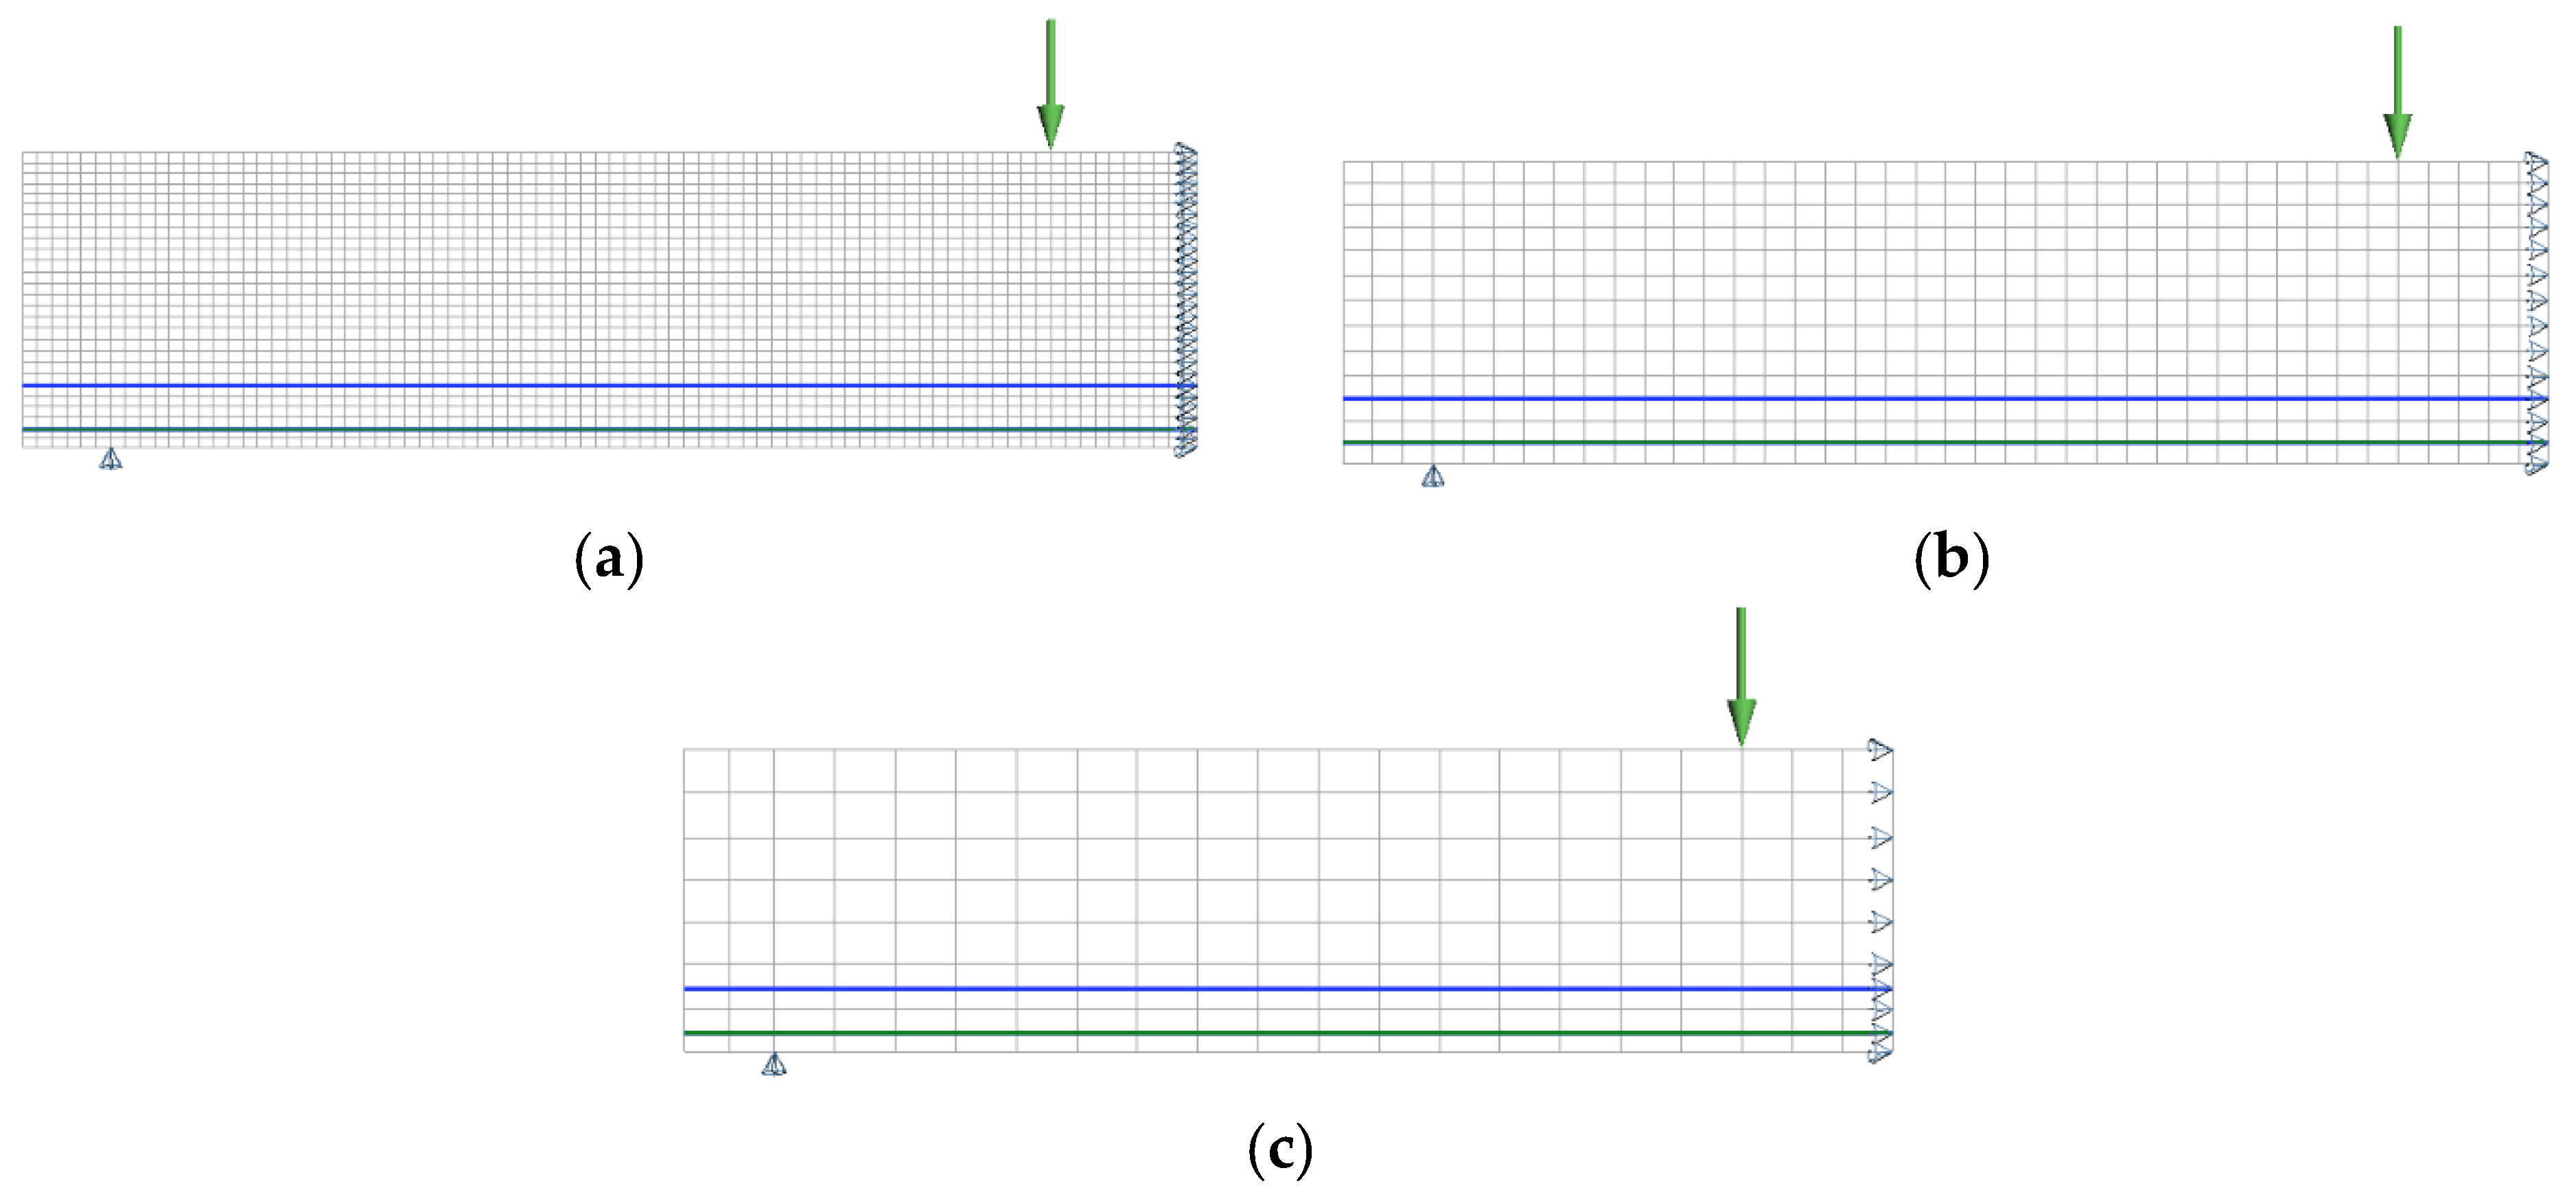
Three levels of finite element mesh refinement were utilized to investigate their impact on the simulations of the tested beams. Due to the symmetrical conditions, only one half of the I-beam is simulated. This involved using finite elements of rectangular shape and dimensions of 25 × 20 mm
2, 50 × 40 mm
2, and 100 × 70 mm
2 (width × height). The FE meshes for IB5 can be seen in
Figure 6. For modeling the SFRSCC material, plain stress Lagrangian four-node finite elements with 3 × 2 Gauss-Legendre integration points were utilized. Two-dimensional-cable-type finite elements with three Gauss-Legendre integration points, with one degree of freedom per node, were employed to simulate the steel and GFRP reinforcements in all simulations. Perfect bond conditions were assumed between these reinforcements and the surrounding concrete, which was materialized by considering the same nodes for the finite elements simulating the reinforcements and the surrounding concrete. Elements with continuous variable thickness in their nodes were used in the transition zones between the flanges and web of the beams to correctly simulate the geometry of these zones.
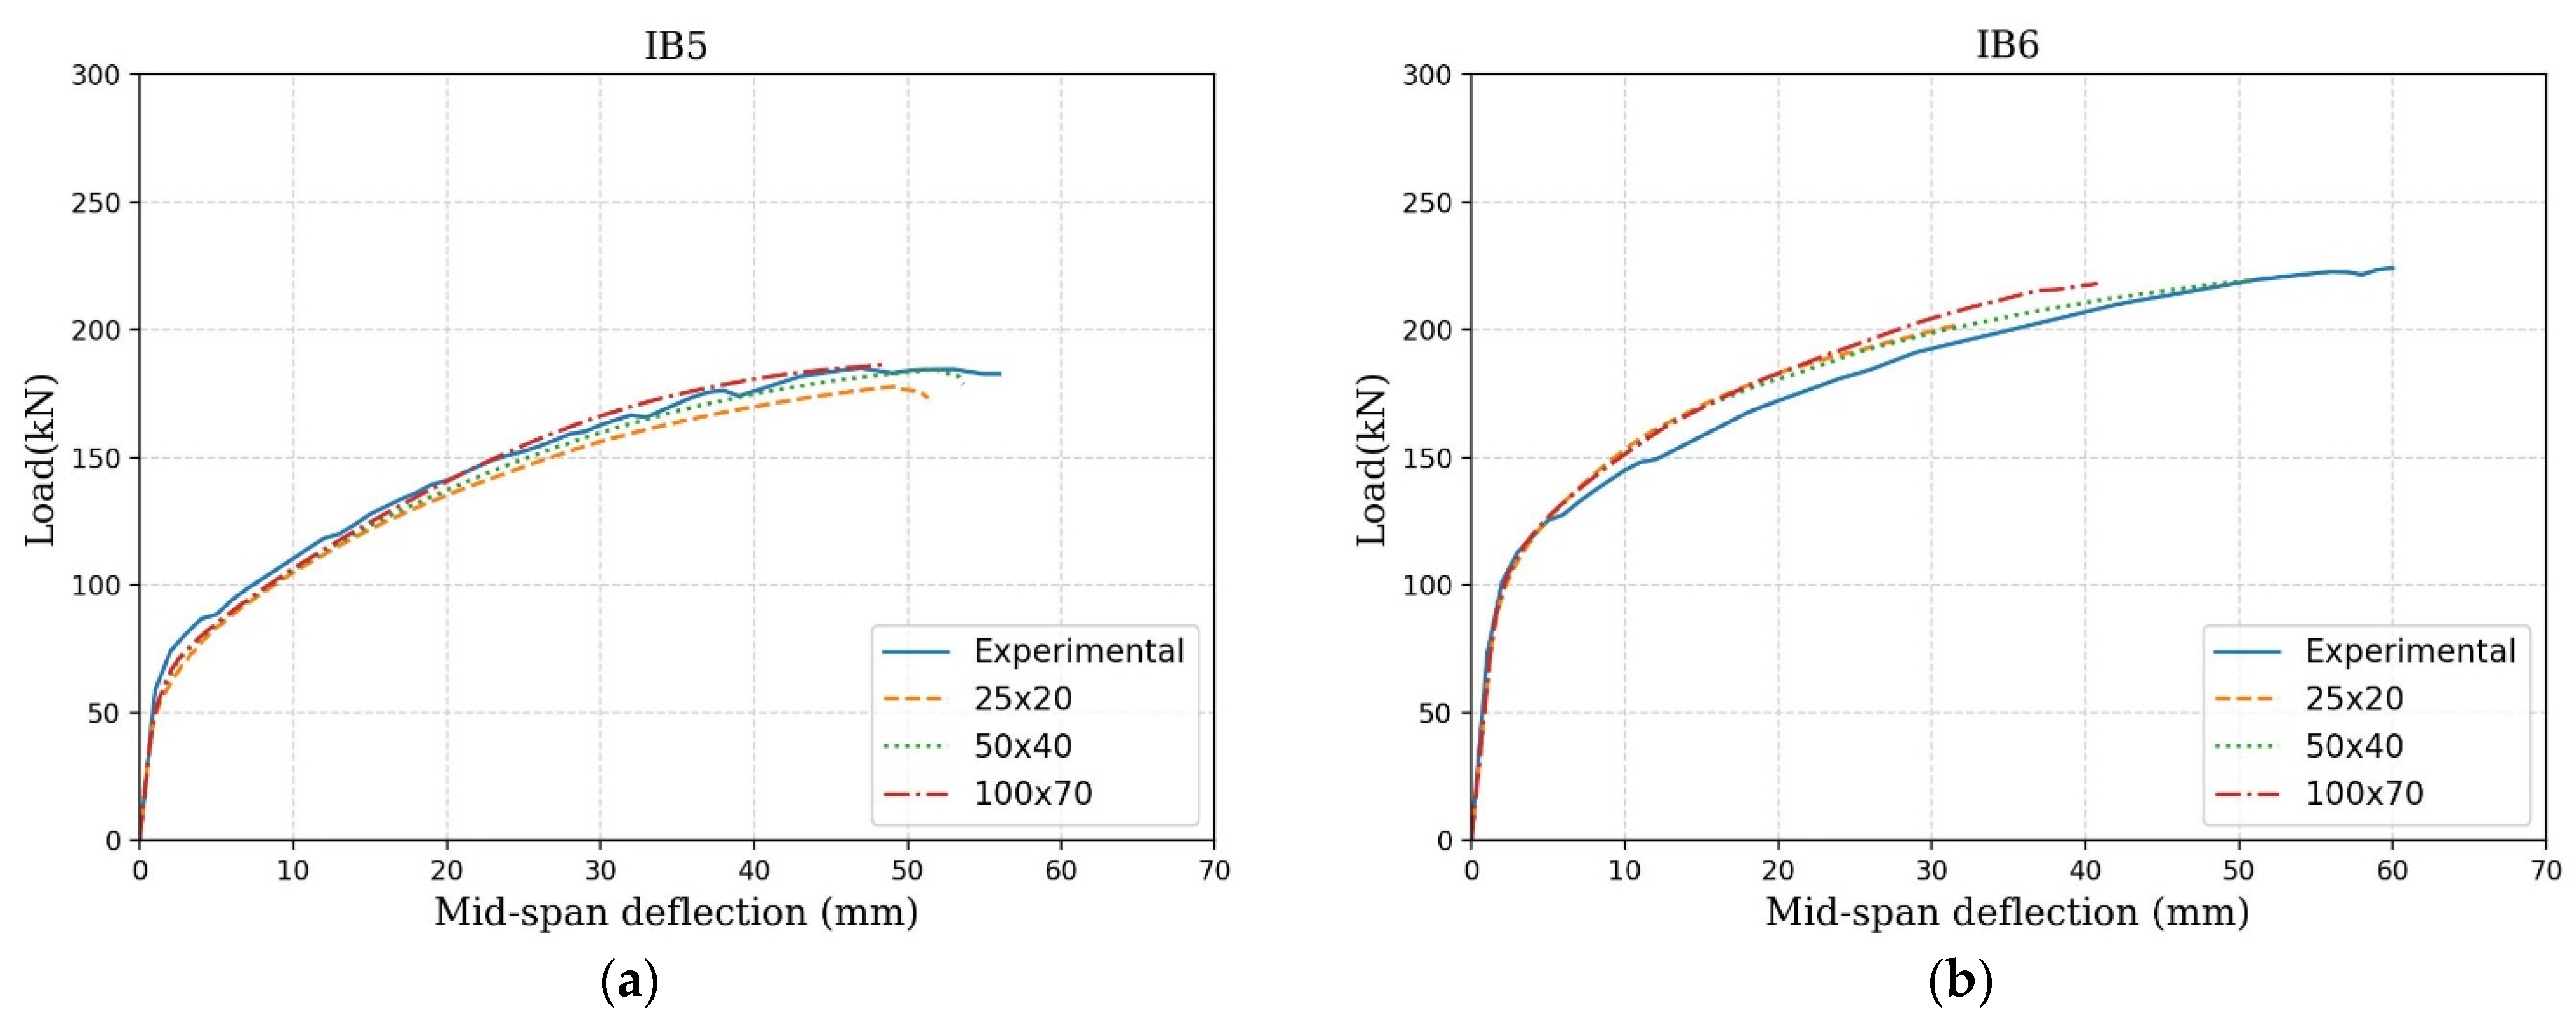
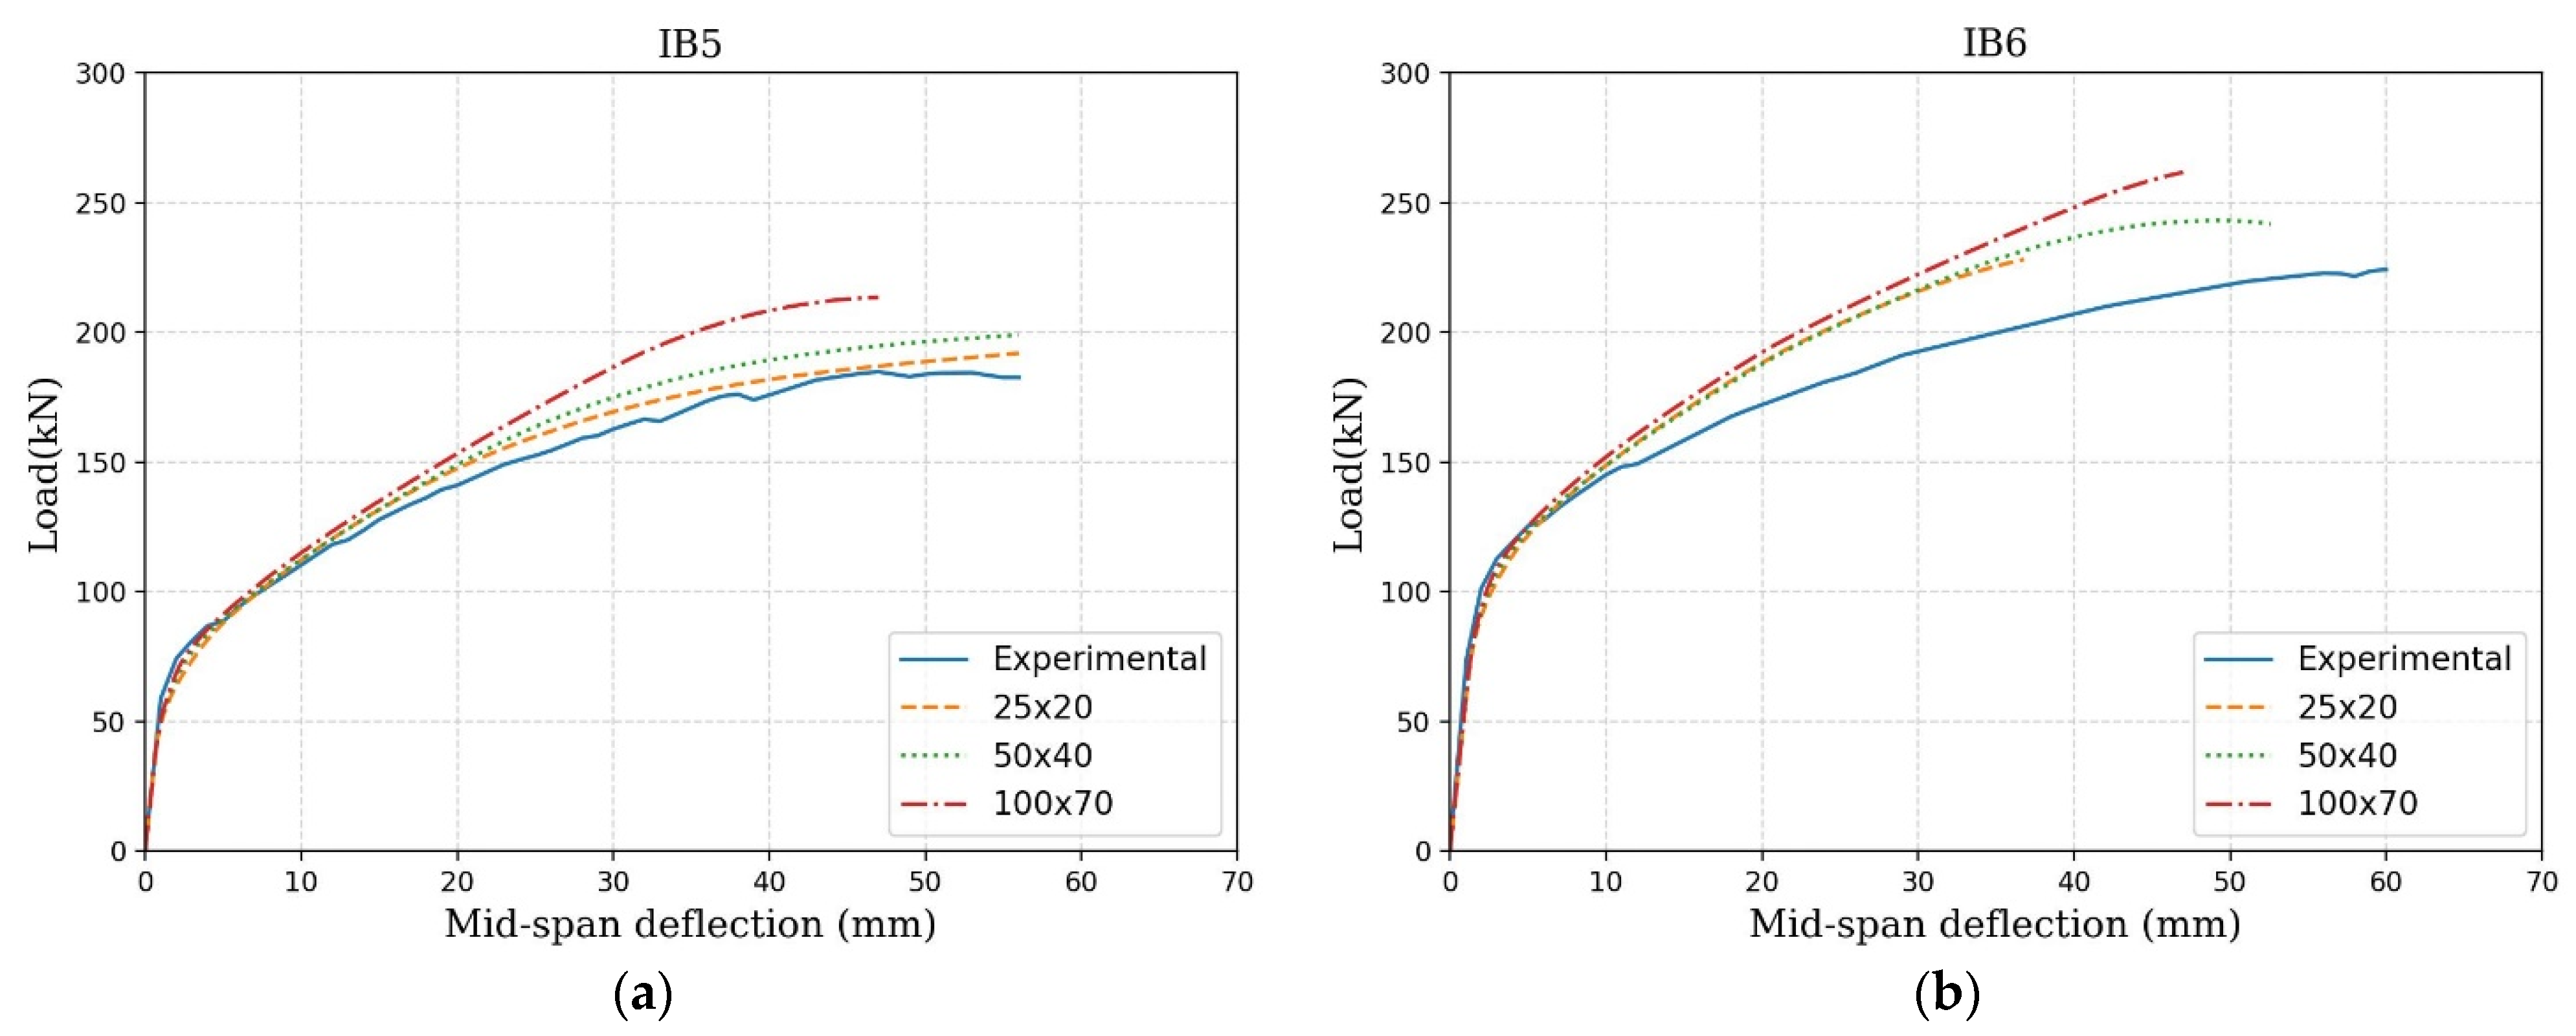
In
Figure 7 and
Figure 8, the total load versus mid-span deflection (
F-δc) of the beams with different mesh sizes is presented.
Figure 7 corresponds to the first model (where the properties of the first series are assigned to the flanges and the second series to the web), and
Figure 8 corresponds to the second model (where the properties of the first series are assigned to both the flanges and the web). In
Figure 7a and
Figure 8a, the load–deflection behavior of IB5, representing a non-prestressed beam, are depicted, while
Figure 7b and
Figure 8b pertain to IB6, which incorporates prestressed reinforcement. The data used for these models are derived from the values (mean) reported in
Table 5 and
Table 6. A small tendency is verified of an increase in the stiffness of the beams in the elasto-cracked stage with the increase in the size of the finite elements, which was already observed in elements failing in shear [
50]. However, below a FE size with a minimum dimension of 40 mm (almost three times the maximum dimension of aggregates), the results are quite close.
In the first model, the numerical outcomes closely matched the experimental load–deflection results but for the second model, assigning uniform fracture properties to all SFRSCC elements led to an overestimation of the structure’s global behavior, primarily due to the elevated fracture energy level. Based on mesh sensitivity results, hereafter, simulations will be executed with the FE mesh refinement corresponding to FE of 50 × 40 mm2.
Moreover, considering that the standard test for SFRC fracture properties, as recommended by the code, was conducted on the first series of specimens (150 × 150 × 600), and these are the specimens typically employed in practical engineering applications, and given the considerable data dispersion observed in the second group of specimens, for subsequent NLFEA involving various safety formats in this study, the second model is employed.
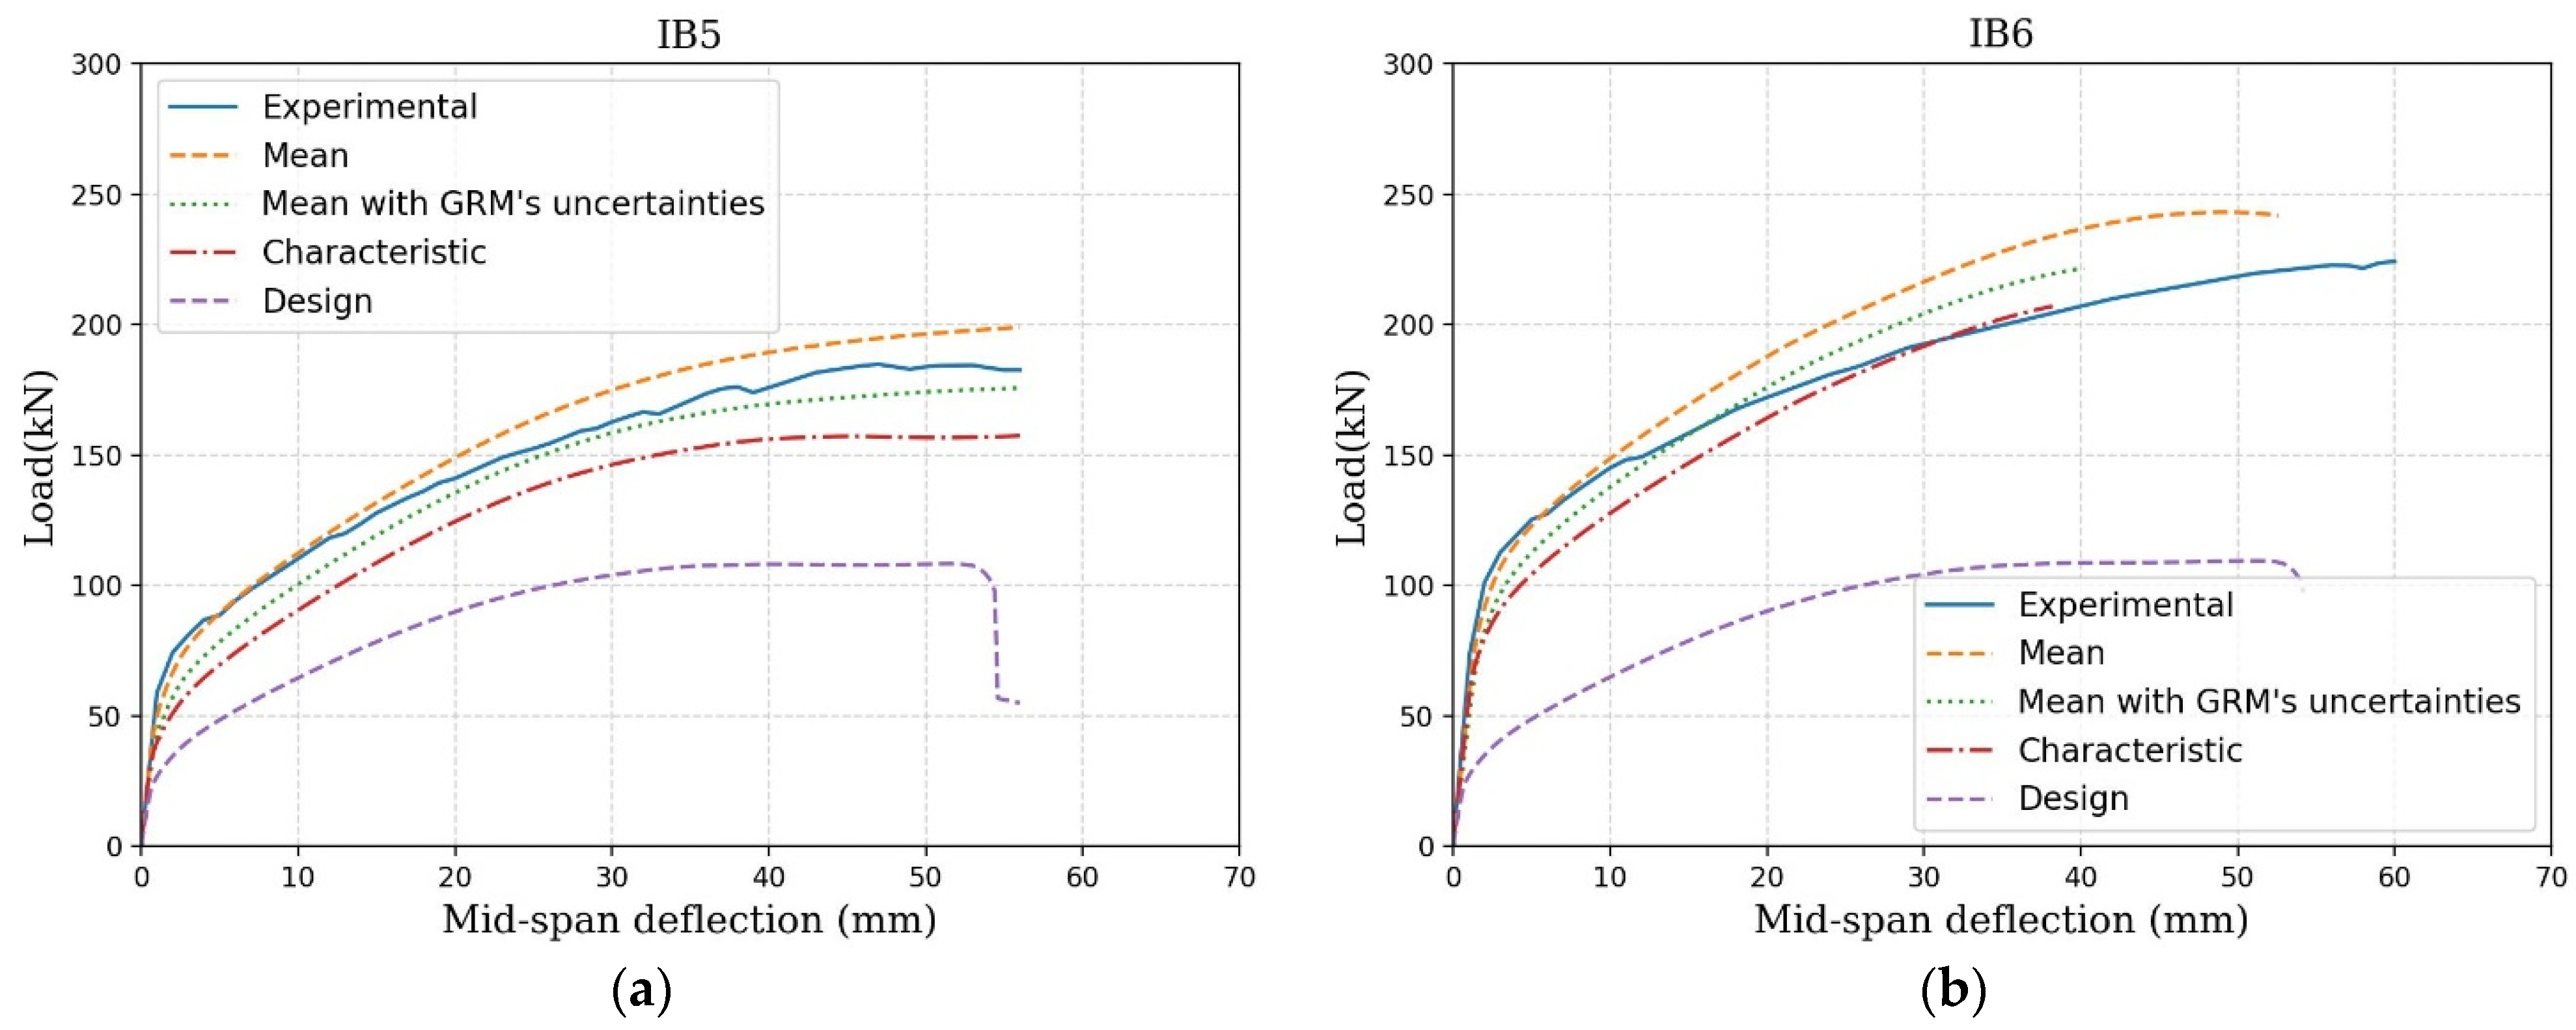
6. NLFEA According to Different Safety Formats
In this section, the results of the NLFEA necessary to implement various safety formats (i.e., GRM, PSF, and ECOV), as detailed in
Section 2, are presented. The focus is on understanding the relationship between ultimate global resistances, emphasizing their dependence on aleatory uncertainties. The NLFE model for each beam is adjusted to align with the specific guidelines of the chosen safety format. The simulations are predicated on incorporating distinct types of material properties, specifically encompassing mean, characteristic, and design values.
The mean values of material properties, explained in
Section 3 and
Section 4, are suitably adapted to match the framework of each safety format. Throughout the applications of relevant safety formats, the model uncertainty factor
maintains a consistent value of 1.06. Meanwhile, the reliability index
is established at 3.8, and the FORM sensitivity factor
is presumed to be 0.8. Consequently, the study proceeds to assess and compare the outcomes derived from the implementation of these safety formats specified in the MC2010, alongside the evaluation of the suggested simple equation within the code for SFRC beam design.
The reinforcement bars in the experimental program are accompanied by nominal mechanical properties, which manufacturers specify and that are equivalent to characteristic properties. These values are derived from the average mechanical property values of numerous test specimens.
In accordance with the MC2010 guidelines [
42], the characteristic compressive strength of concrete, denoted as
, is determined using Equation (7)
The reduced (characteristic) modulus of elasticity for standard-weight concrete can be determined using the following formula:
The characteristic tensile strength of concrete is given using the following formula:
The characteristic fracture properties,
, of SFRC were determined under the assumption of a normal distribution:
where the standard deviation,
, is computed from the mean value of the test results, and the statistical coefficient,
, is a factor that accommodates the number (
) of test results within the sample. In the specific scenario of five samples, the coefficient’s value is set at 1.8. The determined characteristic residual flexural tensile strength values for SFRSCC are presented in
Table 7. However, as previously explained, the residual strengths derived from specimens extracted from the web exhibit a significant standard deviation. Consequently, these values are notably diminished and do not accurately reflect the true material properties.
Table 8 provides the calculated characteristic properties of SFRSCC. The characteristic parameters related to mode I fracture energy are derived under crack width conditions similar to the average parameters. However, the fracture energy is proportionally reduced based on the observed decrease in the area beneath the residual flexural tensile strength curve, as indicated by mean and characteristic values. In the absence of experimental data for mode II fracture energy, the average mode II fracture energy was scaled down proportionally based on the ratio between average and characteristic values of mode I fracture energy to derive mode II characteristic parameters. In the context of this experimental case, the characteristic parameters associated with fracture mode II exhibited a reduction of 12% compared to their average values.
The partial safety factor (PSF) method relies on employing design values derived from material properties. These design values are acquired by dividing the characteristic values of material properties with a partial safety factor associated with the material (
,
,
). The design properties of SFRSCC are included in
Table 8.
The global resistance method (GRM) relies on experimental material property values; nevertheless, due to concrete’s heightened random variability, a reduced value is applied.
The Estimation of the Coefficient of Variation (ECOV) is determined by utilizing both the mean and characteristic values of material properties, as depicted in Equation (6).
7. Conclusions
The objective of this study was to evaluate and contrast various safety approaches in the context of estimating the global design strength of hybrid steel-GFRP SFRC beams. To achieve this, NLFE models were accurately defined to replicate the experimental tests and subsequently used to conduct numerous NLFEA, aligning with the distinct safety approaches, for each SFRC beam.
Upon reviewing the results, we can conclude that all safety formats yield the design of ultimate loads that are lower than the observed experimental outcome. Additionally, considering the non-total isotropy of SFRC materials, it is advisable to consider a global safety factor higher than the recommended value of 1.2 specified in MC2010. Despite this, in beams without stirrups, where shear is the governing failure mode, NLFEA is anticipated to provide a more dependable design as opposed to conservative simplified equations, which are recommended by MC2010.
Employing the GRM safety format with a global resistance factor of 1.2 as per MC2010 guidelines emerges as the most cost-effective approach. However, the ECOV safety format exhibits a higher global resistance factor of 1.5 due to disparities between the characteristic and mean ultimate loads derived from NLFEA. These differences are accentuated by the significant standard deviation in fracture properties of SFRC materials. As a result, ECOV proves to be a more conservative design in the case of investigated SFRC beams, surpassing the recommended MC2010 values.


