Article

Post-Cracking Shear Stiffness Model of Reinforced Concrete Beams

1
College of Civil Engineering, Nanjing Forestry University, Nanjing 210037, China
2
State Key Laboratory of Mechanical Behavior and System Safety of Traffic Engineering Structures, Shijiazhuang Tiedao University, Shijiazhuang 050043, China
*
Authors to whom correspondence should be addressed.
Buildings 2023, 13(11), 2814; https://doi.org/10.3390/buildings13112814
Submission received: 29 September 2023 / Revised: 29 October 2023 / Accepted: 7 November 2023 / Published: 10 November 2023
(This article belongs to the Special Issue Advances in Novel Precast Concrete Structures)

Abstract

:
Macro diagonal cracks can significantly reduce the stiffness of slender reinforced concrete (RC) beams, which results in excessive deflection compared with limitations from design specifications. To evaluate the post-cracking stiffness of slender RC beams with diagonal cracks, a shear degradation model that considers shear deformation is proposed. Based on the variable angle truss model, this study deduced the strut angle formula based on the minimum energy principle. Then, the relationship between the stirrup yielding shear stiffness and elastic shear stiffness was modeled. Finally, the calculation procedure was developed by quantifying the stiffness degradation tendency. The comparison between the experimental results of deflection and the proposed analytical method showed good agreement. Additionally, the proposed method can capture the full-range features of shear strain curves.

1. Introduction

Diagonal cracks are commonly seen in cast-in-place and precast reinforced concrete (RC) box girder bridges, which results in additional shear deformation besides flexural deflection. Therefore, accurately computing the total deformation is a perquisite for the design of RC box girder bridges. Typically, the total deformation can be computed by adding the deformations caused by shear and flexural deformations. In order to decouple the contribution of diagonal cracking to deflection from other time-varying factors (such as concrete shrinkage and creep), it is necessary to evaluate the shear stiffness of diagonal cracked bridges. However, due to the complex influencing mechanism of shear cracks on shear stiffness degradation, quantitative and practical evaluation methods that are suitable for engineering applications are particularly needed.
From a practical perspective, current deflection models for RC beams, whether cast in situ or prefabricated, typically ignore the contribution of shear deformations [1,2]. However, some prior shear tests on slender beams revealed that the measured deflections are generally much larger than the prediction-by-code method [3,4,5]. One possible reason for these underestimations may be from the neglect of the contribution of shear deformations, especially the contribution of shear deformation after shear cracking [6,7,8,9,10,11].
In the face of frequently occurring excessive deflections and shear failure in large-span concrete and precast concrete bridges and buildings, it is crucial to build rational shear models. The shear stiffness of a diagonally cracked RC beam is approximately 10% to 30% of the shear stiffness of the uncracked one, depending on the web reinforcement provided [12]. This means that diagonal cracking has a much larger effect on shear stiffness than flexural cracking on bending stiffness. However, unlike the calculation of bending stiffness, which is based on the Branson’s effective moment of inertia model and is accurate enough for design application [13], there is still no widely accepted shear stiffness model for cracked RC beams. Therefore, a simple, rational, and practical shear stiffness model for RC beams with shear cracks is needed.
Since the development of the truss analogy concept by Ritter and Mörsh, researchers have paid great attention to the shear deformation/stiffness of cracked beams [14]. Leonhardt and Walther (1961) [15], Kupfer (1964) [16], and Park and Paulay (1974) [12] investigated the shear stiffness of diagonally cracked beam based on the parallel-chord truss model. They also suggested different values or solving methods for the strut angle of the web strut. Vecchio and Collins (1986) [17], Bentz (2000) [18], Debernardi and Taliano (2006) [5], and Desalegne and Lubell (2012) [19] proposed or modified the MCFT (modified compression field theory) to predict the shear load-deformation response of RC beams. Pang and Hsu (1996) [20] and Zhu et al. (2001) [21] presented the shear modulus for the FA-STM (fixed-angle softened truss model) based on the smeared-crack concept. However, the iteration procedure of MCFT and FA-STM are somewhat complicated. Barzegar (1989) [22], Hansapinyo et al. (2003) [4], and Rahal (2010) [23] attempted to establish an empirical equation for the shear stiffness of beams after cracking. Their fitting parameters include concrete strain, stirrup ratio, and longitudinal reinforcement ratio.
Recently, the lower-bound theory of plasticity [9] and minimum strain energy principle [7] have been used for calculating the strut angle. Based on the minimum strain energy principle, truss models with variable strut angles were used to investigate the effective shear stiffness of RC beams with diagonal cracking [8,24,25].
For the shear stiffness degradation criteria, scholars have proposed various rules, such as linear tangent degradation [7], linear secant stiffness degradation [26], hybrid stiffness degradation [9], exponential degradation [8], adopted Branson’s degradation [3], etc. However, due to the complex influencing mechanism of shear cracks on shear behavior [27,28,29,30], there is a need for shear stiffness theories that can properly reflect the gradual degradation of shear stiffness with the development of shear cracks.
This paper aims to propose an energy-based strut angle calculation method and a practical degradation rule of the effective shear stiffness of diagonally cracked RC beams. With the adoption of the minimum strain energy principle and the additional consideration of the contribution of moment, an implicit analytical calculation formula for strut angle is established. Furthermore, through a parameter analysis and comparative study with implicit expressions, a simplified practical strut angle calculation formula is obtained. Experimental validation shows that the proposed method yields good and consistent predictions of post-cracking shear stiffness and shear deformation.

2. Post-Cracking Shear Stiffness Model of Reinforced Concrete Beams

2.1. Intial Elastic Shear Stiffness Ke

Beam shear can be divided into two stages: pre-cracking stage and post-cracking stage. At the first stage, the elastic shear stiffness Ke can be calculated using elasticity theory [12], as shown in Equation (1).
K e = G c A v = 1 2 ( 1 + μ ) E c A v
where Ke is the elastic shear stiffness before cracking, Gc is the shear modulus of concrete, Ec is the modulus of elasticity of concrete, μ is the Poisson’s ratio of concrete, Av is the effective shear area (Av = bwdv), bw is the web width of the beam, and dv is the effective shear depth.
In the post-cracking stage, as diagonal cracking violates the continuity of concrete, an alternative approach must be adopted for the post-cracking shear stiffness calculation.

2.2. Stirrup Yielding Shear Stiffness Ky Based on Truss Model

A truss model gives good depiction of slender beams in shear, which provides a possibility that the post-cracking shear stiffness can be depicted by the truss model. For slender beams, when the stirrups are yielded and the diagonally shear cracks are well developed, the truss model shown in Figure 1 can be used for analyses. As the observed shear cracks are generally parallel to each other in principle, the inclination of the strut angle θy can be assumed to be the same. The shear deformation of the truss is mainly induced by the deformation of web members δweb, including the elongation of stirrups δs and the vertical deformation δc caused by the shortening of the inclined strut. The deformation of stirrups and inclined concrete struts are listed in Table 1, in which As, Ag, and Acm are the areas of the longitudinal reinforcement, cross-section, and compression zone, respectively.
Equal to the shear distortion (shear deformation per unit length) induced by a unit shear force, the shear stiffness of the equivalent truss can be expressed as
K y = V γ 0 = V δ w e b / d v cot θ y = n ρ v cot 2 θ y 1 + n ρ v csc 4 θ y E c A v
where n is the ratio of the elastic modulus of the reinforcement and the concrete (n = Es/Ec), and ρv is the stirrup ratio. Equation (2) shows that the shear stiffness is mainly affected by the material type (n, Es, Ec), geometric properties (Av), stirrup ratio (ρv), and strut angle (θy).
In order to evaluate the degradation of the shear stiffness of the beam after the yielding of stirrups, it is necessary to establish the relationship between the stirrup yielding shear stiffness Ky and the initial shear stiffness Ke. Combine Equations (1) and (2), the ratio of Ky to Ke can be expressed as
ξ y = K y K e = 2 n ( 1 + μ ) ρ v cot 2 θ y 1 + n ρ v csc 4 θ y
where the ratio factor ξy is defined as the degradation coefficient of shear stiffness. Apparently, the parameters that have an effect on the shear stiffness degradation are the stirrup ratio ρv and the strut angle θy. For a specified specimen, n, μ, and ρv are all known; if θy is determined, the degradation coefficient can be easily calculated from Equation (3). Similarly, the yielding shear stiffness can be obtained from Equation (2).
Considering that the stirrup ratio ρv of practically used RC beams is generally between 1.0% and 2.0%, n = Es/Ec ≈ 6 and the Poisson’s ratio of the concrete μ ≈ 0.2. For θy between 25° and 45°, the shear stiffness degradation coefficient is between 0.12 and 0.29. That is to say, for concrete beams with severe web shear cracks, the yielding shear stiffness can be reduced by more than 70% compared with the elastic shear stiffness.

2.3. Shear Stiffness Degradation Rules for Partially Shear-Cracked RC Beams

Because the transition mechanism from an elastic shear stiffness to a stirrup yielding shear stiffness is affected by many factors, such as reinforcement ratio, section size, concrete strength, etc., it is unrealistic to give an accurate and quantitative expression to describe this degradation process.
Scholars have developed some empirical or simplified degradation rules to depict the degraded shear stiffness of partially shear-cracked RC beams, such as linear secant stiffness degradation [30], linear tangent stiffness degradation [7], mixed degradation [9], exponential degradation [8], regression fitting degradation [10], adopted Branson’s degradation [3], etc. Below are four representative effective shear stiffness models,
K e f f , 1 = K y + V V c r V y V c r K e K y   K y ,     K e
K e f f , 2 = V V c r K e + V V c r V y V c r V y K y V c r K e   K y ,     K e
K e f f , 3 = K e f f , 1 + K e f f , 2
K e f f , 4 = K y + V y V V y V c r 3 K e K y   K y ,     K e
where Keff,1, Keff,2, Keff,3, and Keff,4 are the effective shear stiffness considering linear secant degradation, linear tangent degradation, mix degradation, and adopted Branson’s degradation, respectively; Vcr and Vy are the diagonal cracking shear force and stirrup yielding shear force, which can be analytically calculated using Equations (8) and (9).
V c r = 0.17 f c b w d v
V y = V c r + ρ v f y v b w d v cot θ y
After determining the key parameters of the yield shear stiffness and the degradation rule of the shear stiffness, the effective shear stiffness of a partially shear-cracked RC beam can be calculated according to the following steps:
  • Before shear cracking, the elastic shear stiffness Ke can be calculated using Equation (1) and used for the calculation of elastic shear deformation;
  • The cracking shear force Vcr and stirrup yielding force Vy of the critical section are calculated using Equations (8) and (9);
  • After shear cracking, the yielding shear stiffness Ky can be obtained from Formula (2), and which the shear stiffness degradation coefficient ξy can be calculated using Equation (3);
  • The shear increment V-Vcr under the shear load V at different loading levels is calculated and substituted into the selected formula from Equations (4)–(7) to calculate the effective shear stiffness Keff of the RC beam with shear cracks;
  • The average shear strain or shear deformation of the corresponding beam segment is calculated according to the effective shear stiffness Keff under a specific shear load.

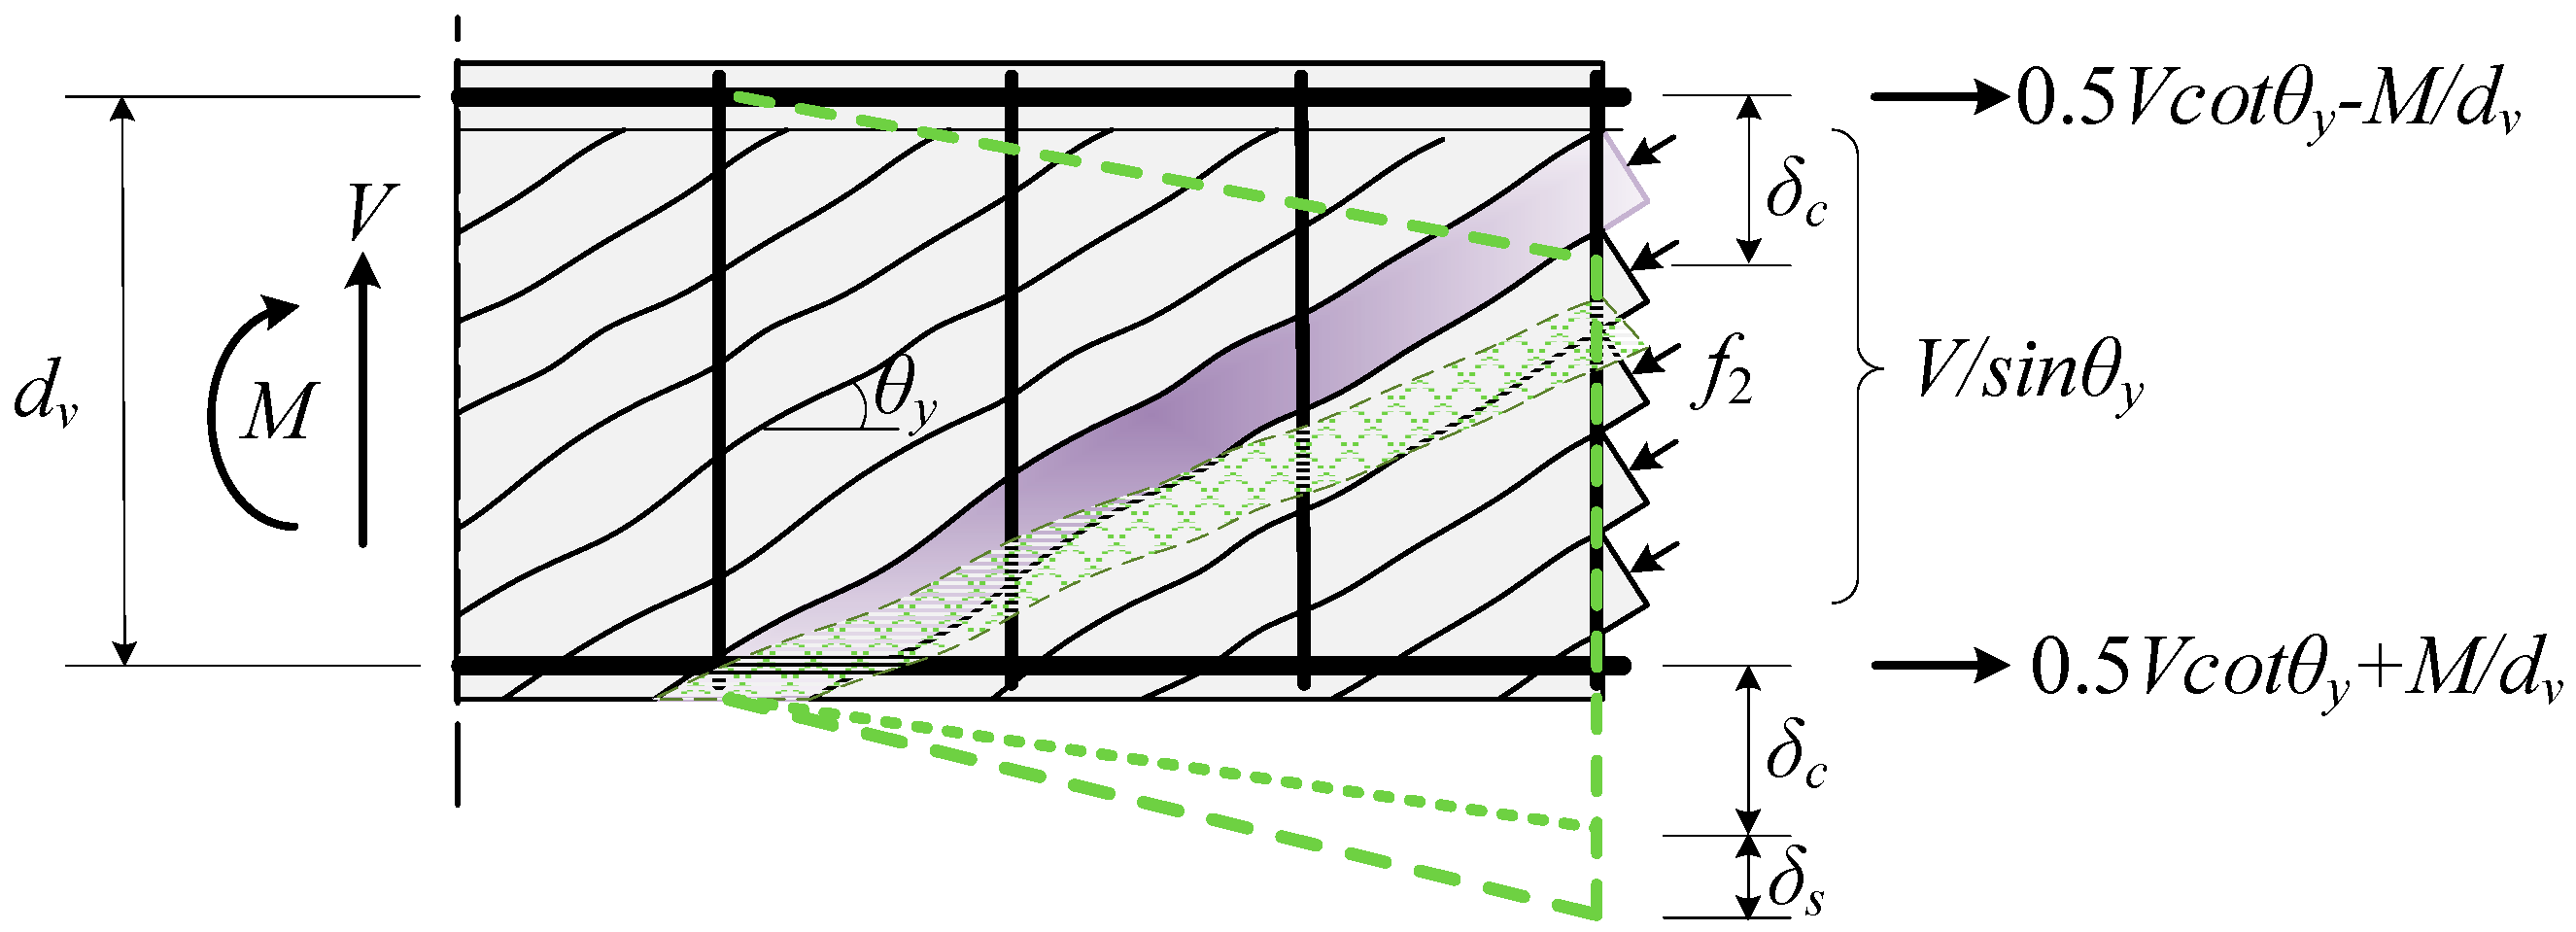
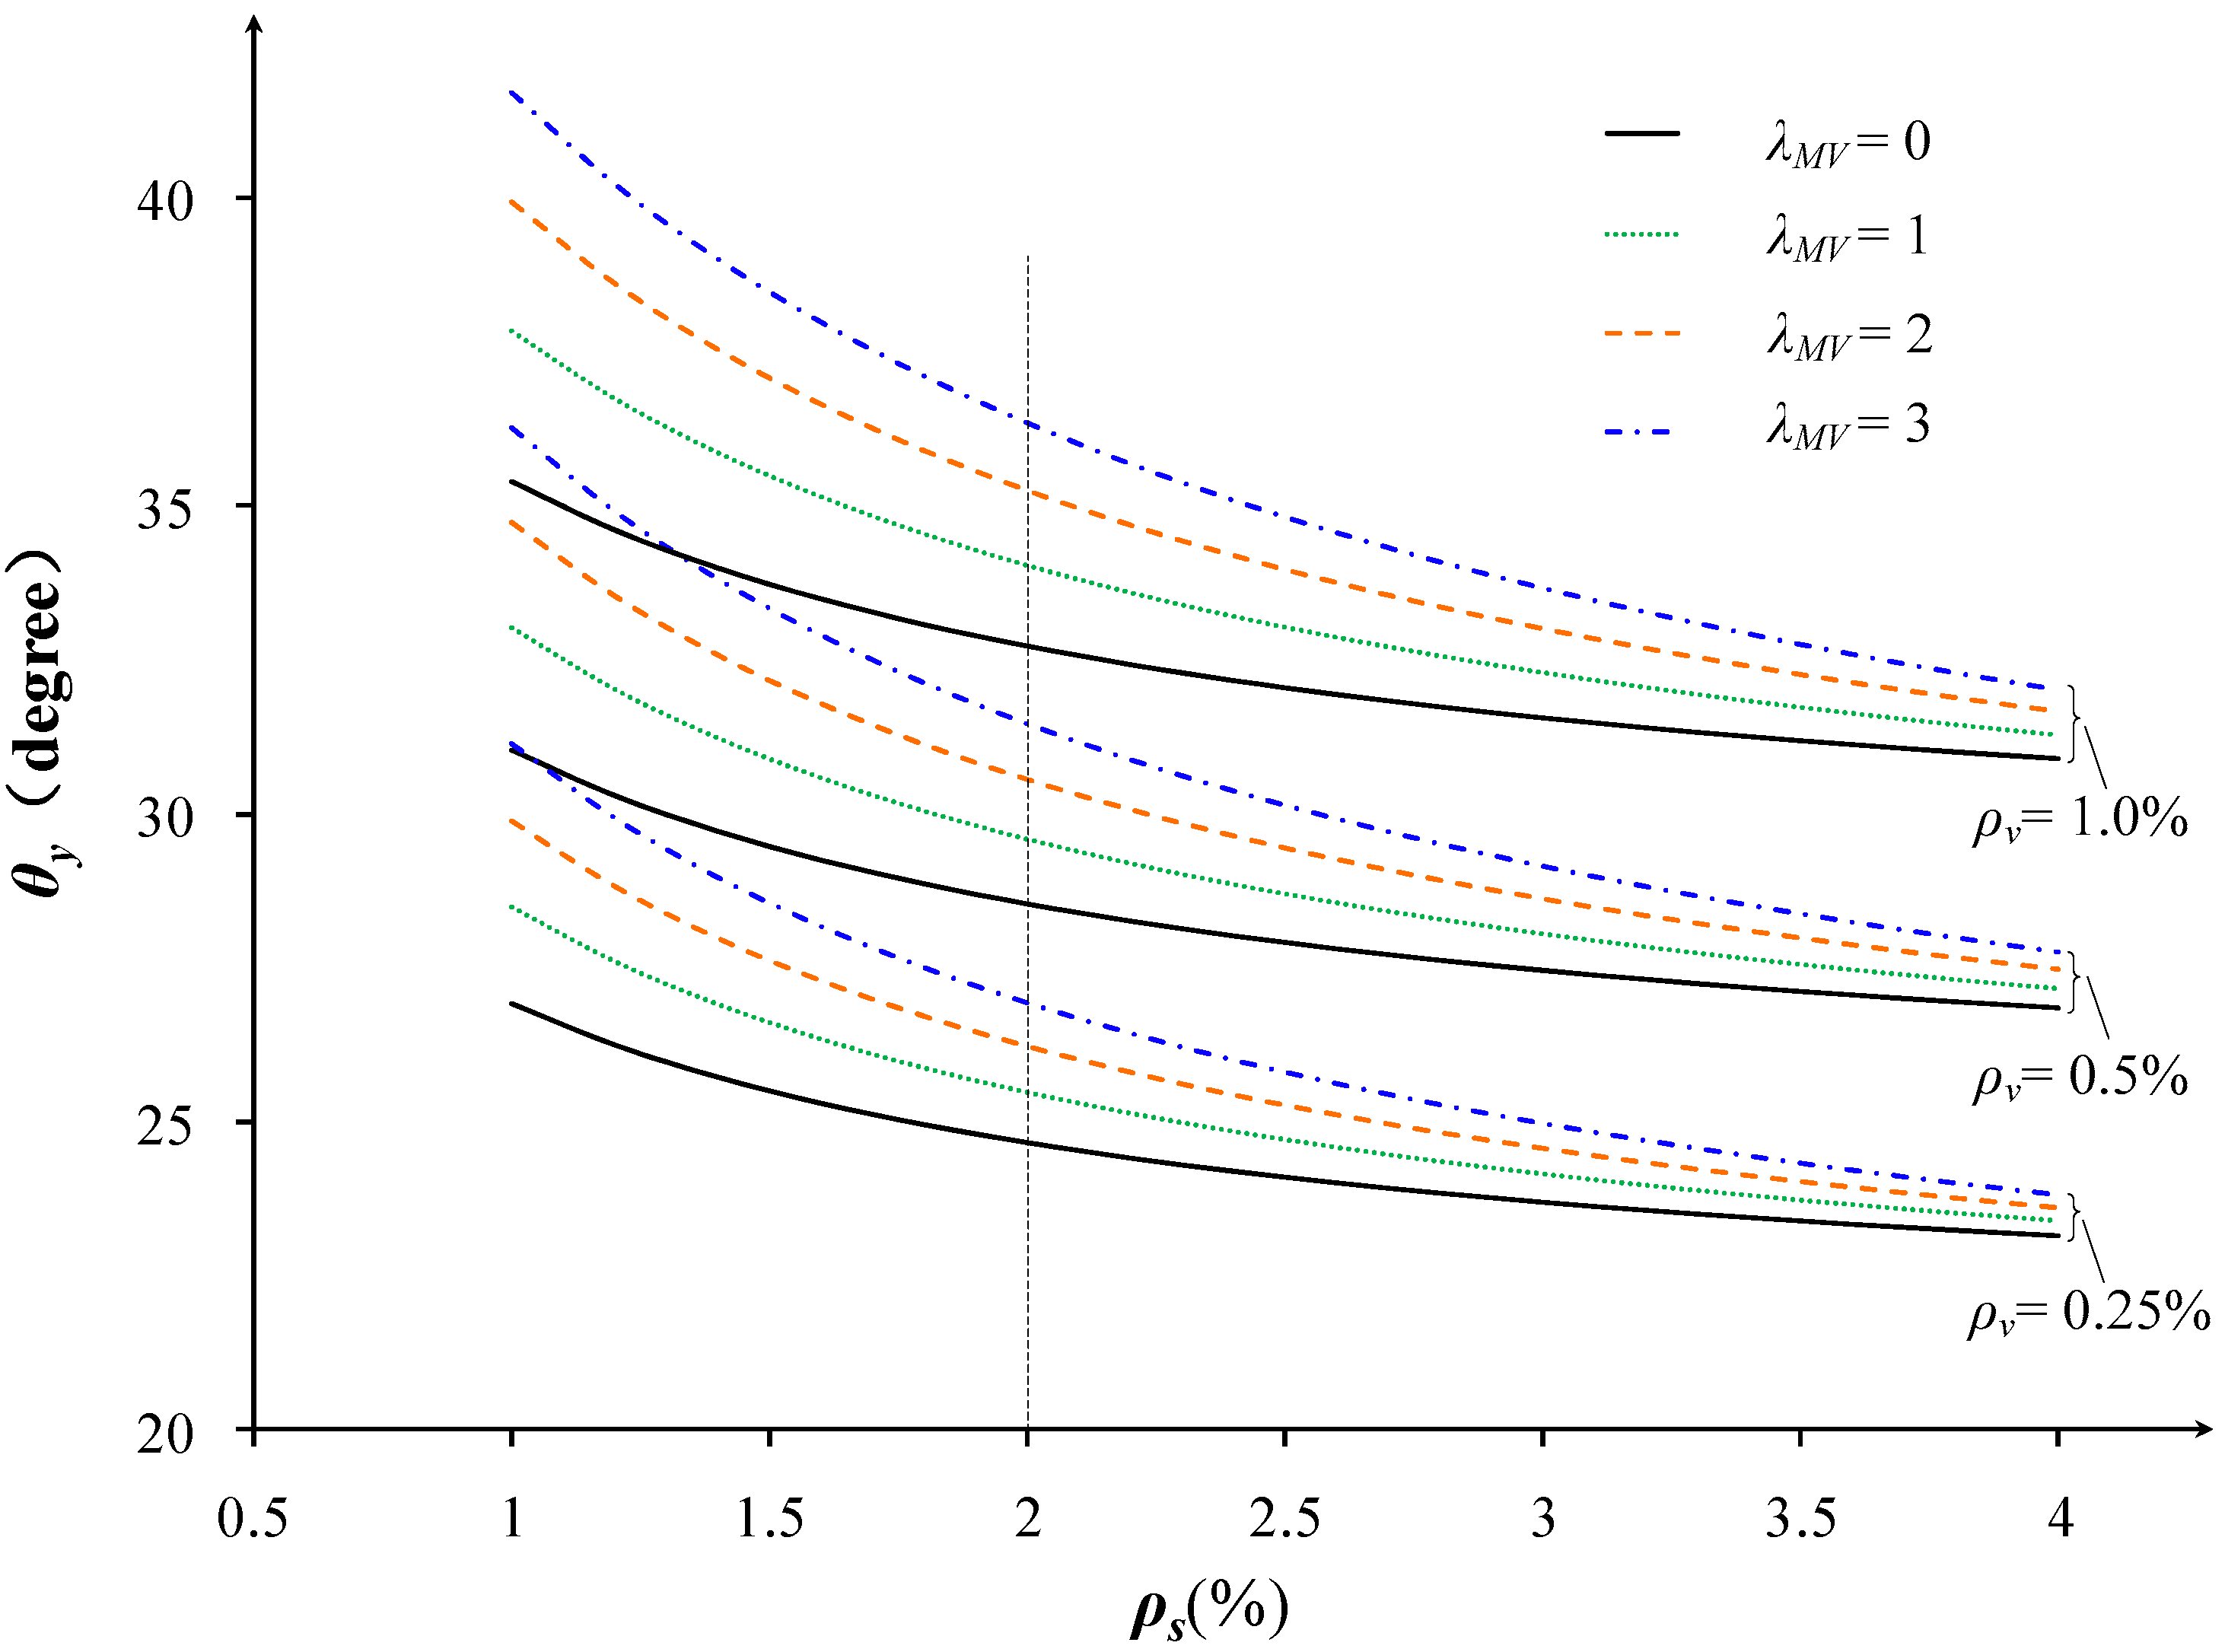
3. Determination of Strut Angle, θy

3.1. Strut Angle Based on Minimum Energy Principle

It is believed that the angle θy will occur at an inclination that requires the minimum potential energy [16]. The strain energy stored in the truss members can be determined using the virtual work principle. Assume that a unit shear force is applied to the truss, the internal force and deformation of each member (including web members and chord members) of the truss can be obtained (See Figure 1 and Table 1). The total vertical deformation of the truss is the sum of the members’ deformations listed in Table 1, that is:
δ = V 1 + n ρ v csc 4 θ y n ρ v E c b cot θ y + V d v cot 3 θ y 1 + n A s A c m 4 n E c A s + M cot 2 θ y 1 n A s A c m 2 n E c A s
The strain energy stored in the truss is equal to the external shear work (EWD) applied to the truss, which is the distortion angle of the truss induced by a unit load. The distortion angle can be obtained by dividing the vertical deformation of the truss by its horizontal length:
E W D = γ = δ d v cot θ y = V 1 + n ρ v csc 4 θ y n ρ v E c A v cot 2 θ y + V cot 2 θ y 1 + n A s A c m 4 n E c A s + M cot θ y 1 n A s A c m 2 n E c d v A s
Based on the minimum strain energy principle, the rational strut angle leads to a minimum energy. By differentiating Equation (11) with respect to θy and equating it to zero:
d E W D d θ y = d γ d θ y = 0
Through simplification, Equation (12) becomes
4 n ρ v + ρ v ρ s R 1 cot 4 θ y + λ M V ρ v ρ s R 2 cot 3 θ y = 4 + 4 n ρ v
where 1 + n ρ s A g A c m A v A g = R 1 , 1 n ρ s A g A c m A v A g = R 2 , and M V d v = λ M V , in which ρs (=As/Ag) is the longitudinal reinforcement ratio. The analytical solution of Equation (13) is too complex for expression. So, a trial-and-error procedure is used for the θy calculation.
The factors R1, R2 in Equation (13) remain constant for a specified section. For the rectangular section, the effective shear depth dv is the maximum of {0.72h, 0.9d} [14]; therefore, Av/Ag can be assumed to be 0.72 for simplicity; the depth of the compression zone c can be simply assumed to be 0.35d [31]; therefore, Acm/Ag is equal to 0.35. For the I-section, Av/Ag is equal to Aweb/Ag, and Acm/Ag is still simply assumed to be 0.35.
The factor λMV in Equation (13), which can be regard as the shear span-to-depth ratio, has a larger influence on shear deformation than the stirrup ratio ρv during the pre-cracking stage but less influence during the post-cracking stage [3,6]. This interesting phenomenon is further discussed in the next subsection and in the experimental validation.

3.2. Simplification Formula for Strut Angle

As is mentioned above, the shear-to-depth ratio λMV has little effect on the post-cracking shear deformation. To validate this supposition, first assume that the influence of moment is neglected, that is, λ M V = 0 . Then, Equation (13) can be rearranged and worked out:
θ y = arctan 1 + R 1 4 n ρ s 1 + 1 n ρ v 0.25
The strut angles calculated using Equations (13) and (14) are compared to investigate the influence of λMV (see Figure 2).
As is shown in Figure 2, the factor λMV has an effect on the strut angle θy, but slightly so, especially for a beam with a higher longitudinal reinforcement ratio ρs. For example, when the longitudinal reinforcement ratio ρs > 2.0%, the calculated strut angle of Equation (13) (taking into account the influence of λMV) is approximately 1.0 to 1.1 times of the calculated angle obtained using Equation (14) (assuming λMV = 0). The relative difference is very small and can be ignored.
Particularly, when we set Av = 0.72 Ag and Acm = 0.35 Ag, the value of R1 is approximately equal to 1 for cross-sections with ordinary longitudinal reinforcement arrangements. Therefore, Equation (14) can be simplified to:
θ y = arctan 1 + 1 4 n ρ s 1 + 1 n ρ v 0.25

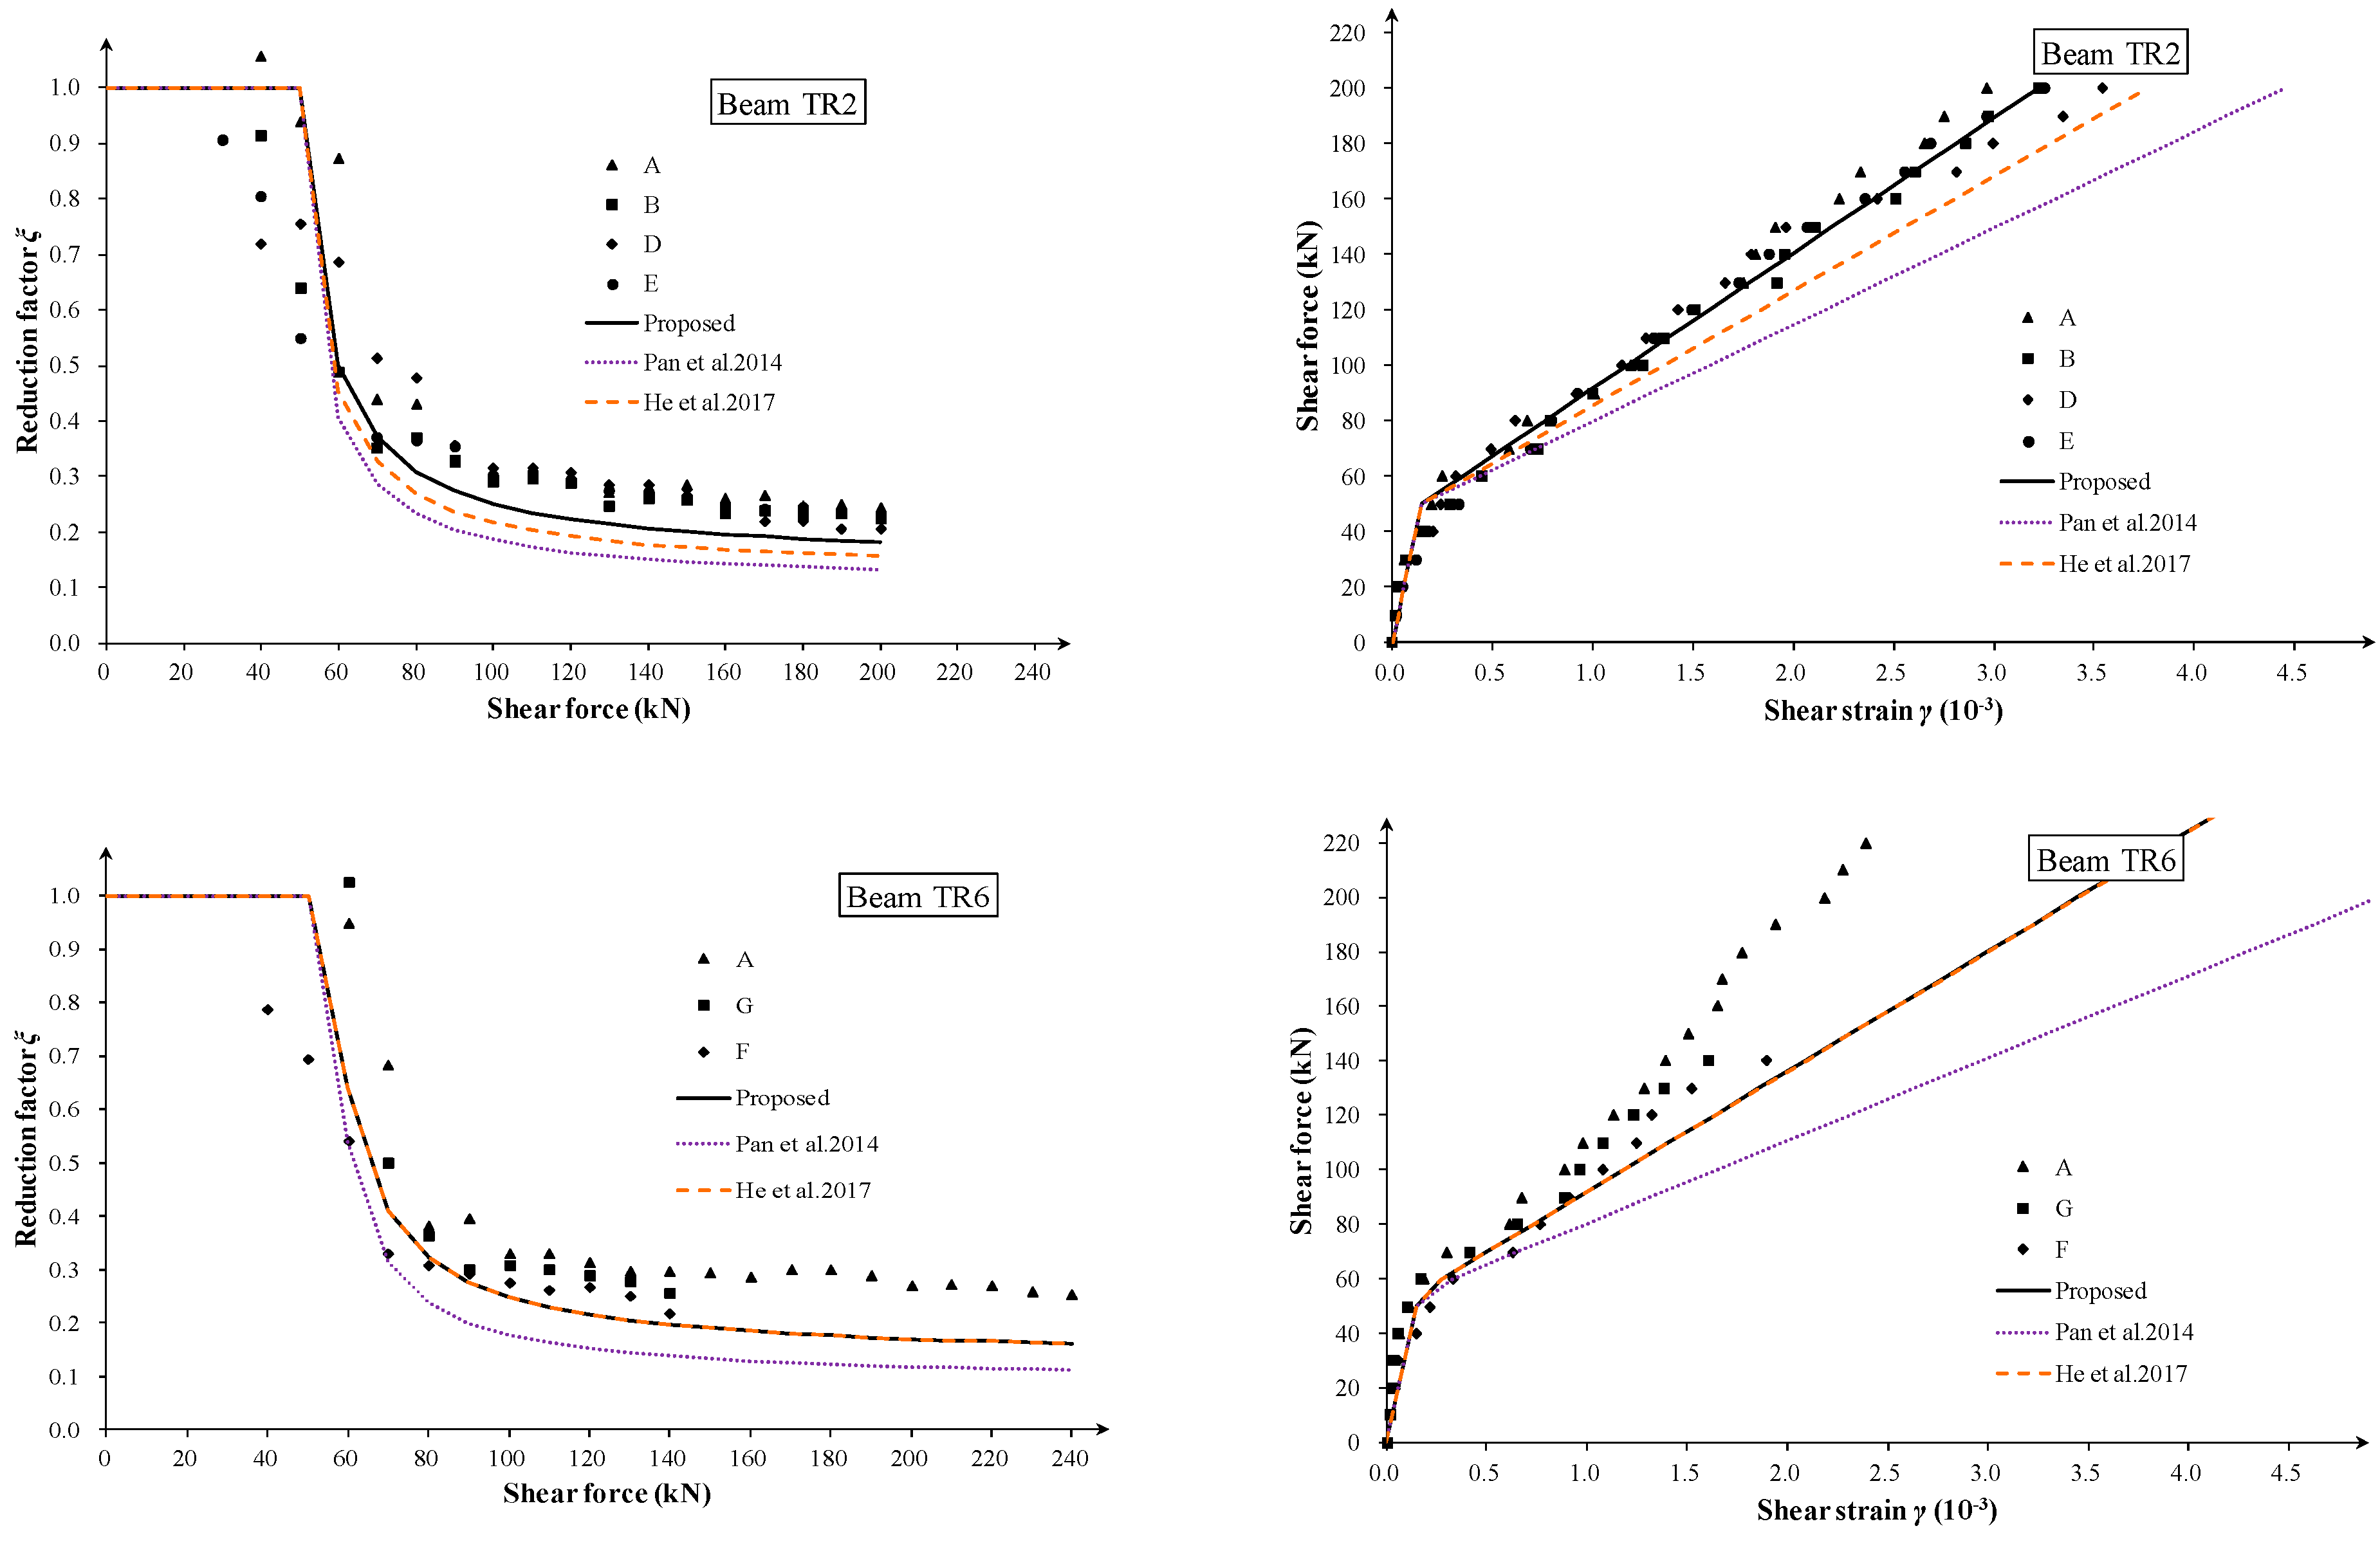
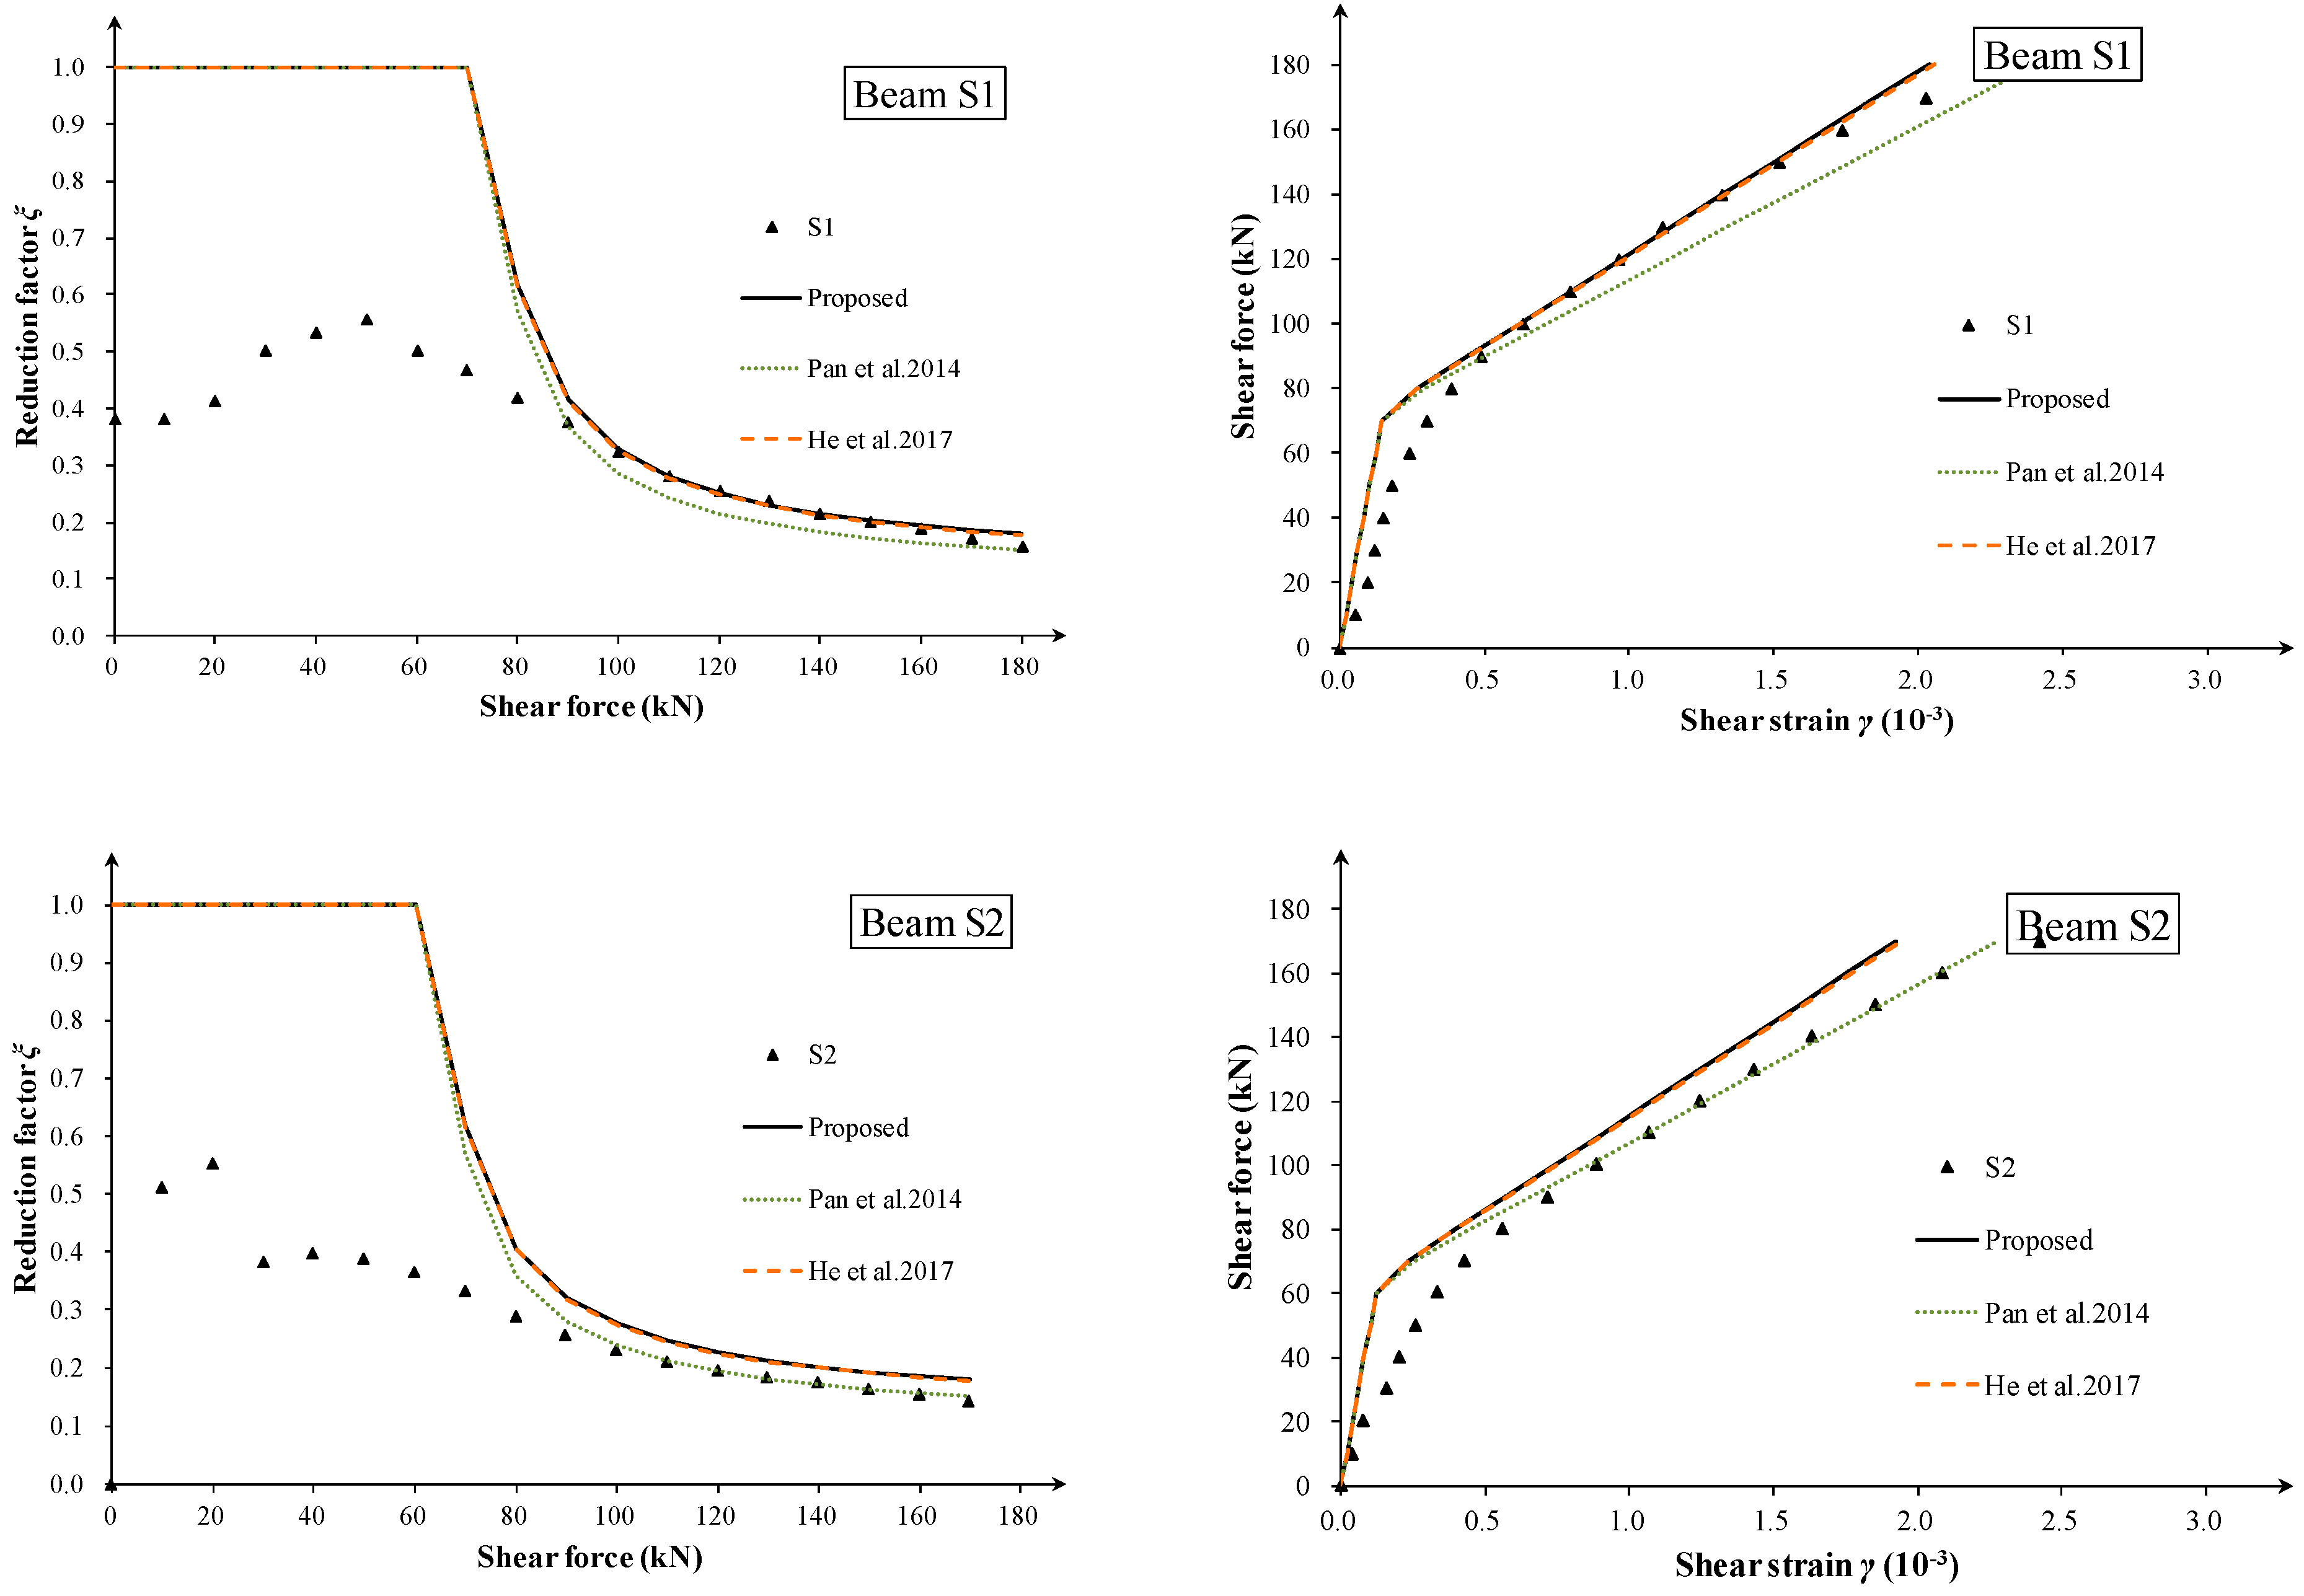
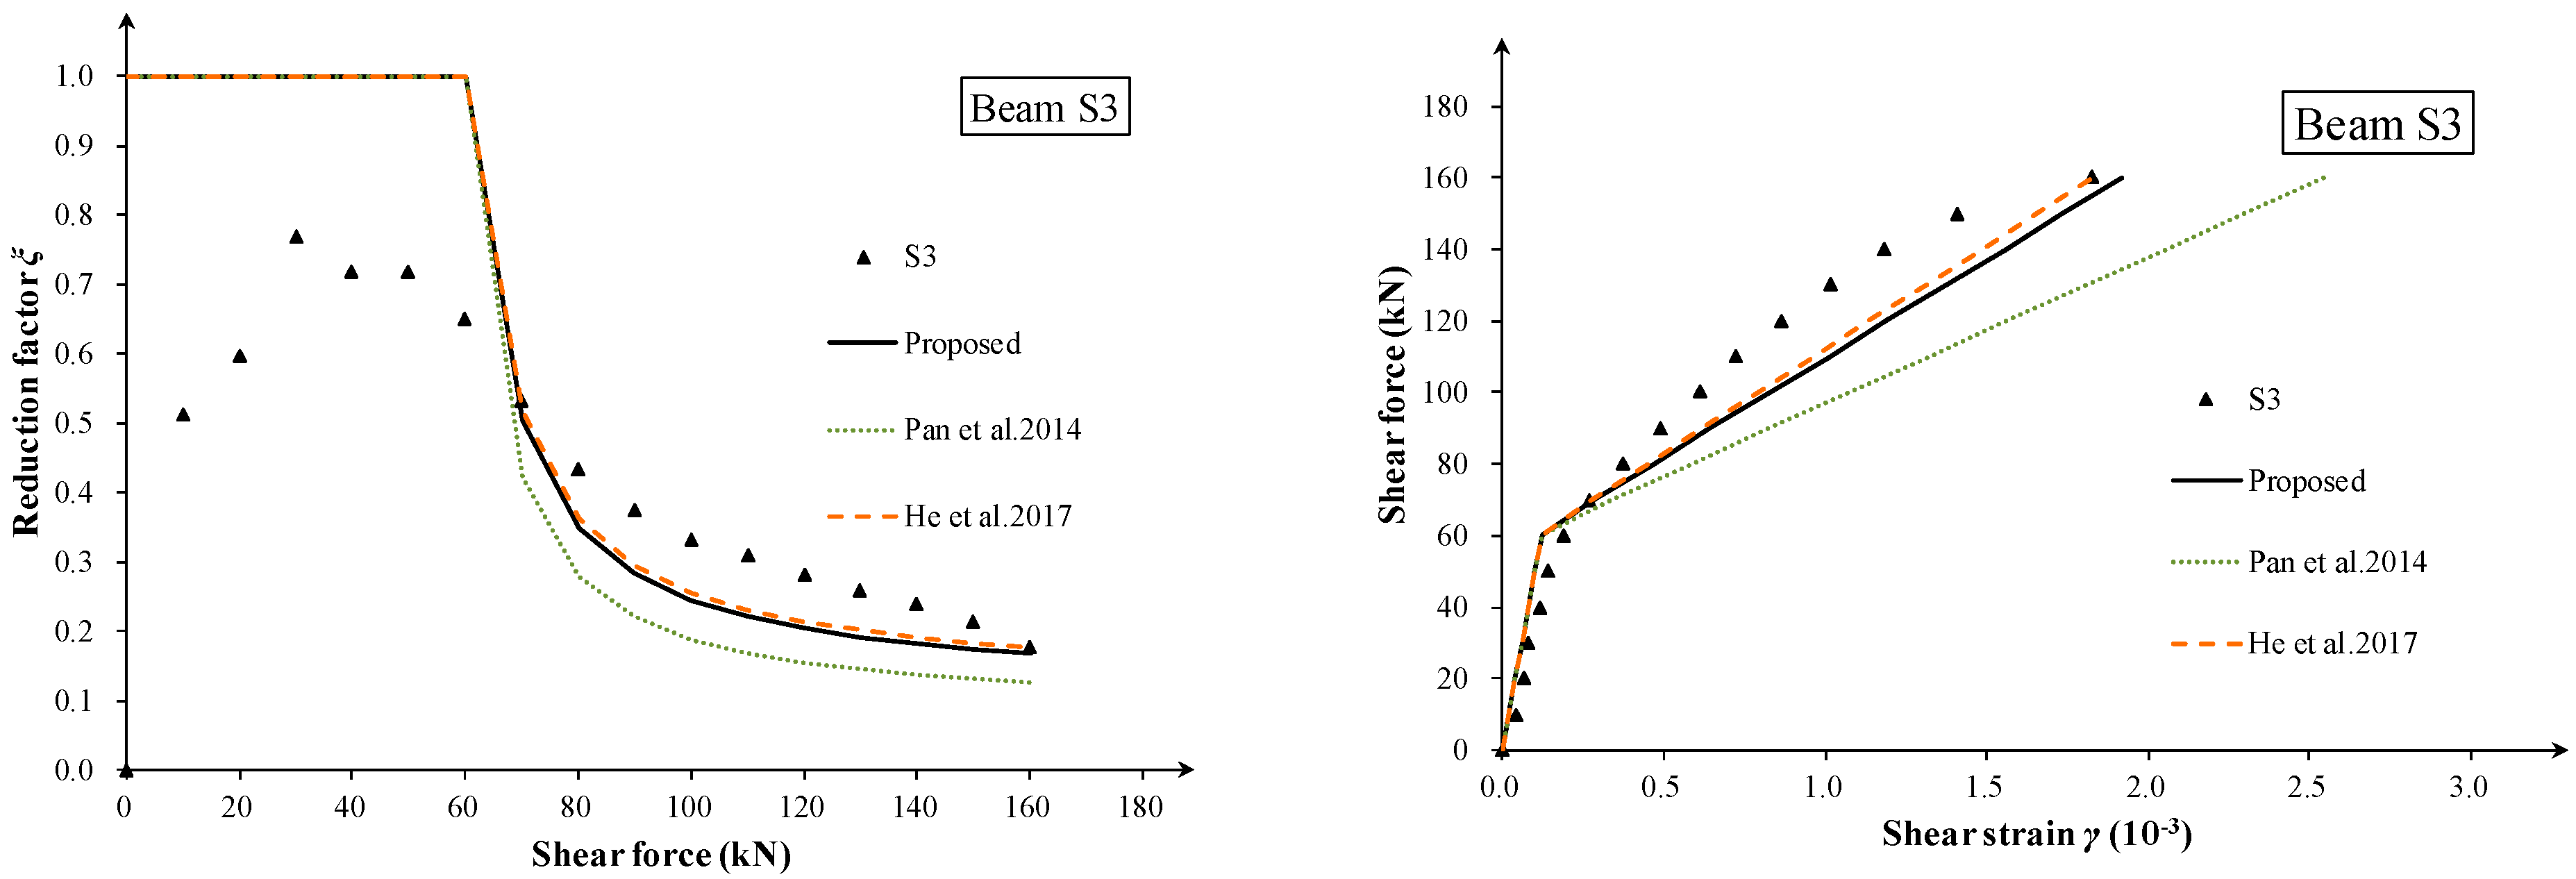
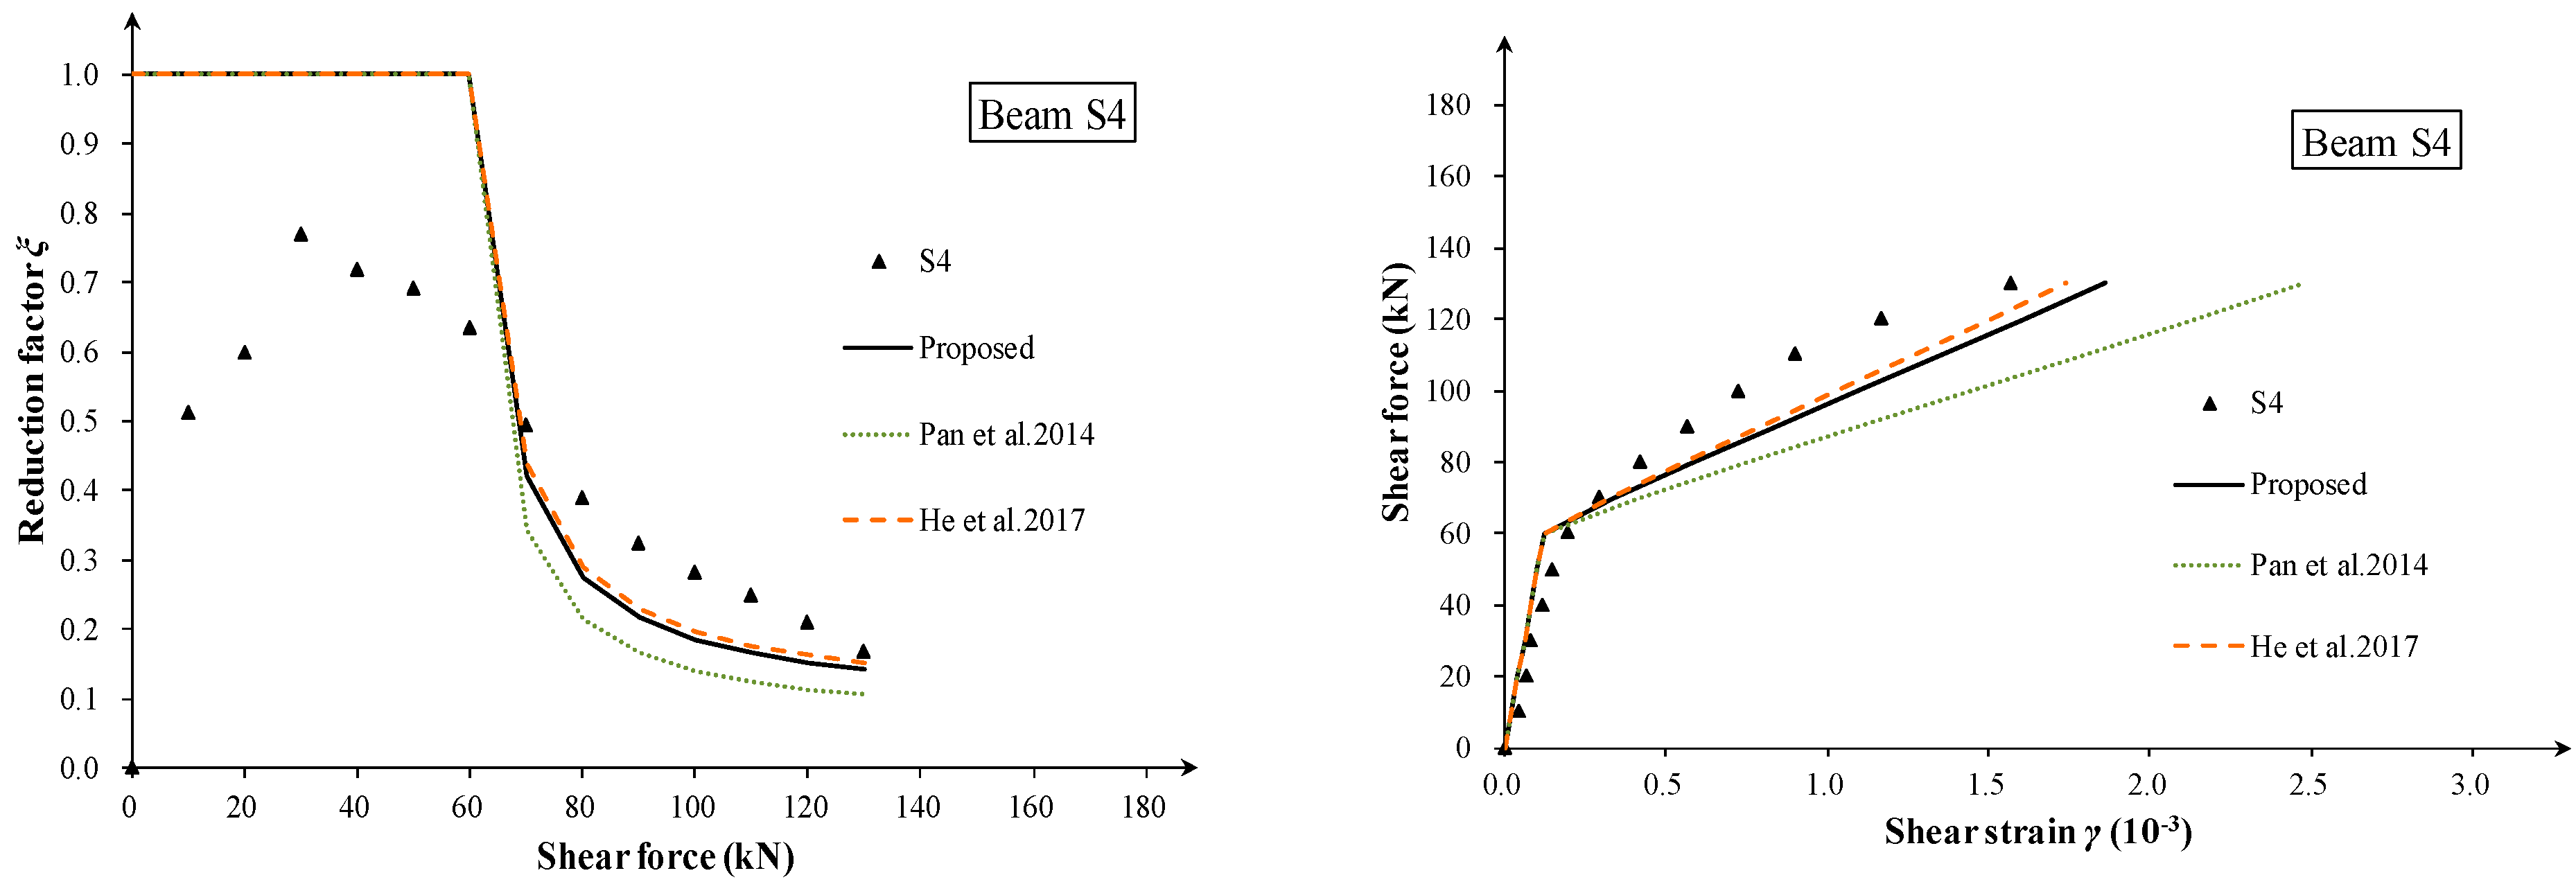
4. Experimental Validation

4.1. Shear Deformation Test in the Literature

To evaluate the proposed shear stiffness model, three series of shear test data were used for validation, in which the shear deformation was directly measured, and its corresponding equivalent shear stiffness was deduced. A total of 23 lattices/zones of 10 beams are used for comparison. It should be noted that many RC beam test data in which only the total deformation was measured cannot be used for validation and, therefore, were excluded.
The authors conducted shear deformation tests on six large thin-webbed RC beams. Self-tailored strain measuring lattices were installed on one side of the beams, and each measuring lattice was composed of five mechanical dial gauges. The mean shear strain of each lattice was obtained through a strain analysis. The detailed procedures are illustrated in reference [6].
Debernardi and Taliano [5] reported an experiment comprising six RC I-section beams with a thin web. Square lattices made up of transducers were arranged to measure the mean curvature and the mean shear strain, from which the shear deformations can be decoupled from flexural deformation. Fifteen lattices in four specimens (TR1, TR2, TR3, and TR6) with detailed shear strain curves were selected for validation. The specimens were simply supported, subjected to two symmetrical loads (TR1 and TR2), a symmetrical load (TR3), or a non-symmetrical load (TR6).
Hansapinyo et al. [4] tested four RC beams with web reinforcement to investigate the shear deformation after diagonal cracking. Electronic transducers were also used to measure the shear strains of each panel based on the rosette concept. All of the four specimens were selected for validation. The main parameters of all the specimens are listed in Table 2 and Table 3.

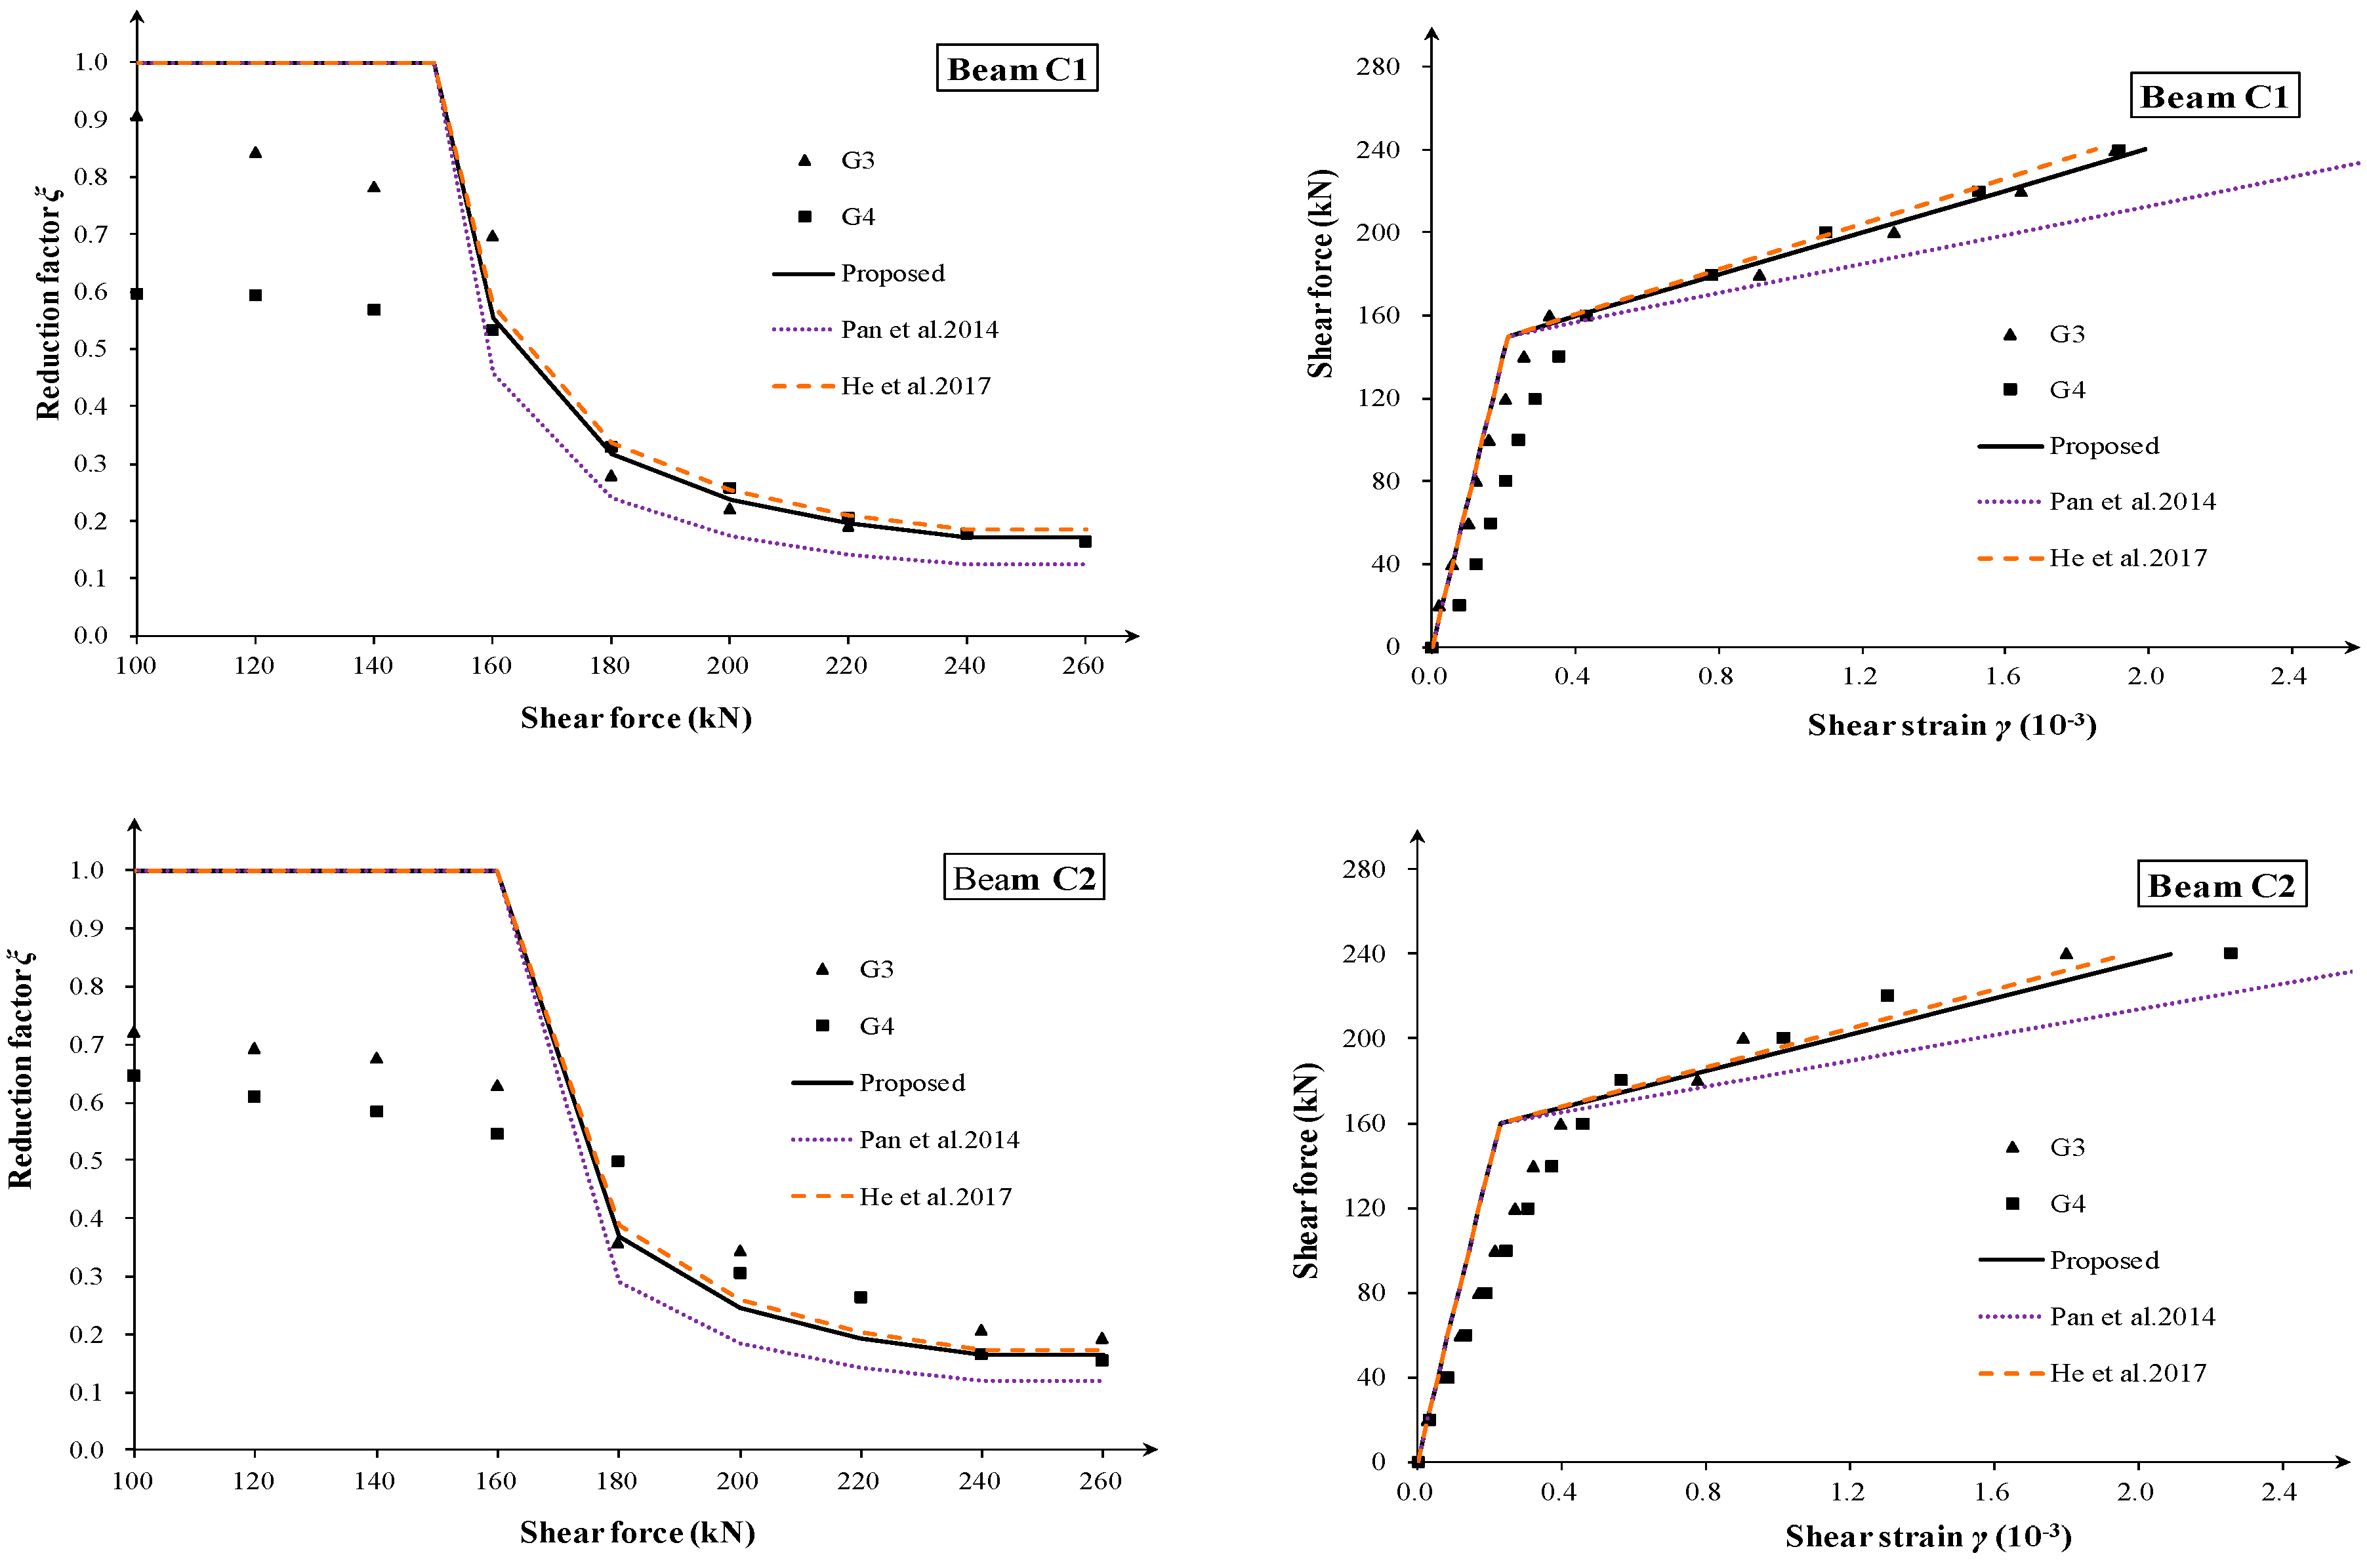
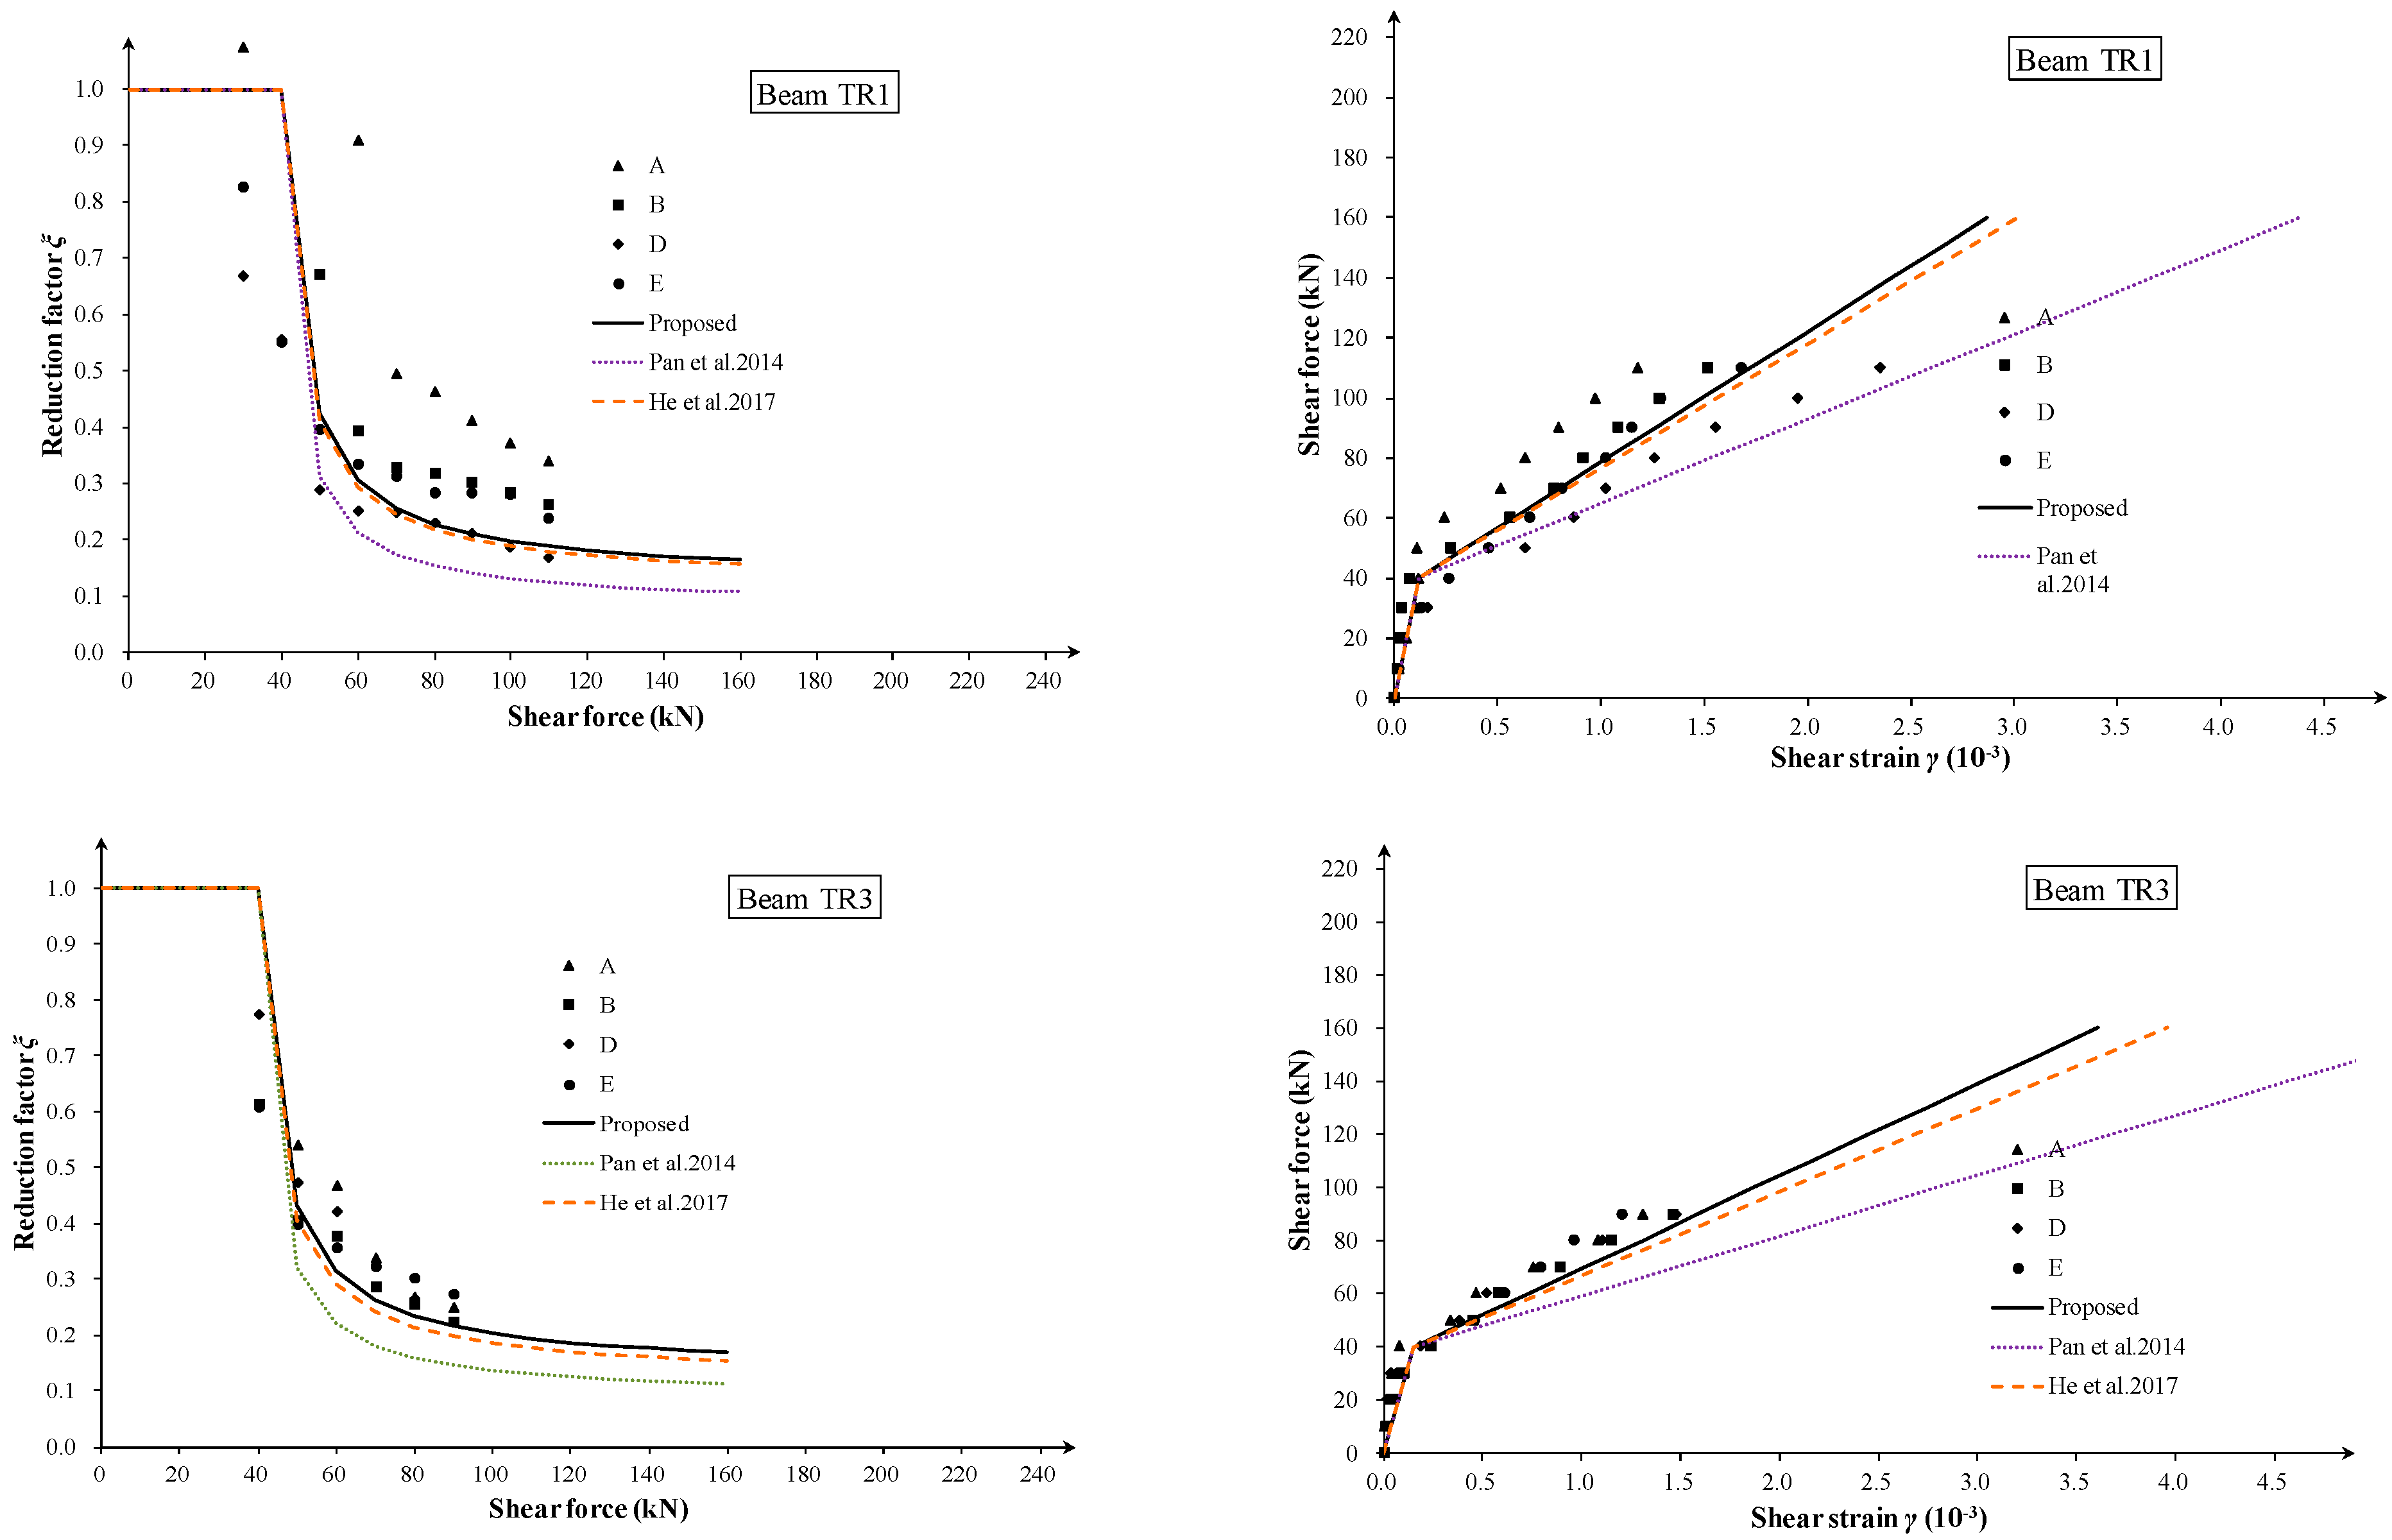
4.2. Comparison of Strut Angle and Degradation Coefficient

The stirrup yielding strut angles θy, θP, θH were calculated using the proposed method, Pan et al. [7], and He et al. [9], respectively. The stirrup yielding strut angles θy, θP, θH and corresponding calculated degradation coefficient ξy, ξP, ξH are listed in Table 4. Overall, the average ratio of the predicted values to the observed degradation coefficient ξexp and its coefficient of variation (CV) are 0.95 and 0.19, 0.76 and 0.25, and 0.95 and 0.20 for the proposed method, Pan’s method, and He’s method, respectively.
As is shown in Table 4, Pan’s method obtain a higher prediction of strut angle and lower prediction of degradation coefficient than the other two methods, and it has the largest value of CV. The other two methods obtain a relatively good prediction of shear stiffness degradation. However, He’s prediction method ignores the influence of the longitudinal reinforcement ratio and may cause larger deviations for specimens with a low longitudinal reinforcement ratio.

4.3. Comparison of Effective Shear Stiffness and Shear Strain

The measured and calculated effective shear stiffness reduction factor ξ and shear strain of 23 zones of 10 beams are shown in Figure 3, Figure 4, Figure 5, Figure 6 and Figure 7. All the shear force–shear strain curves have a distinct turn point, which means the shear stiffness decreases abruptly after the first diagonal cracking. Behind the turn point, the curve stays nearly linear before the stirrup yielding. Based on the experimental results, here, the linear tangent degradation model, which depicts the main features of shear strain curves of slender RC beams, was adopted to evaluate the post-cracking shear stiffness and was used for comparison.
As is known, the shear span-to-depth ratio λMV has a significant effect on shear strain before cracking. However, as is observed from the tests, the influence becomes very small for RC beams at the post-cracking stage (See A to H zones with different λMV values of specimens TR1 to TR6 in Figure 4 and Figure 5).
Three methods for determining the strut angle are used for comparison: the proposed method, method by Pan et al. [7], and method by He et al. [9]. As is shown in Figure 3, Figure 4, Figure 5, Figure 6 and Figure 7, all of the three methods give a rational evaluation of effective shear stiffness, while Pan’s method gives a more conservative result than the two other methods. Compared to He’s method, the proposed method accounts for the influence of ρs and gives a better prediction for beams with a lower ρs (Specimen TR2 in Figure 5). Based on the assumption that the longitudinal reinforcement will not yield before stirrup yielding, He’s method tends to give a similar prediction of effective shear stiffness with the proposed method for RC beams, with (ρsfys)/(ρvfyv) > 3.
From Figure 3, Figure 4, Figure 5, Figure 6 and Figure 7, it can be seen that the proposed shear stiffness degradation model simulates the degradation process of shear stiffness very well and provides better stiffness prediction results in most cases. Although the stiffness prediction results of specimen S2 are slightly larger (about 20%), the shear stiffness degradation law still conforms well. It should be noted that for specimen S2, the deviation between the predicted value calculated using the analytical method in the original literature [4] and the measured shear strain is also the largest, which may be due to the shear stiffness anomaly caused by the specimen’s own defects.
For thin-webbed beams, a linear tangent stiffness degradation tends to give safe predictions. Therefore, the authors suggest that linear tangent degradation criteria are used for the concrete box girder bridge’s shear stiffness evaluation in engineering practice.
In addition, although there is a significant difference in the shear span-to-depth ratio between different beam segments of the same specimen in the experiment (such as TR1~TR6), there is no clear connection between the measured shear stiffness degradation coefficient and the shear span-to-depth ratio. The stiffness degradation curves of each beam segment are also relatively close, indicating that the shear span ratio has little effect on the post-cracking shear stiffness degradation, and its impact on the shear stiffness and strain after cracking can be ignored.
Finally, the proposed shear stiffness model for RC beams is only validated using 23 beam segments. More shear deformation data are needed for further validation. The digital image correlation (DIC) technique based on shear deformation measurements may be widely used in a future study [32,33,34,35].

5. Conclusions

To evaluate the effective shear stiffness of RC beams with diagonal cracks, this paper proposed a post-cracking shear stiffness degradation model. Based on the variable truss model, and using the minimum strain energy principle, the strut angle was analytically deduced. Then, the linear tangent stiffness degradation rules were found to be more suitable for thin-webbed concrete beams. With experimental validation, the following conclusions can be drawn:
  • Based on the variable-angle truss model, the relationship between the stirrup yielding shear stiffness and elastic shear stiffness was established. Then, a practical linear tangent shear stiffness degradation model, which depicts the main features of shear strain curves of slender RC beams at the post-cracking stage, was adopted to evaluate the effective shear stiffness.
  • The strut angle θy, which was found as a function of the stirrup ratio, longitudinal reinforcement ratio, and elasticity modulus ratio, was determined using the minimum energy principle. Compared with other two methods in the literature, the proposed angle equation tended to give a moderate prediction of strut angles and degradation coefficients for varying beam parameters.
  • A turning point occurs in the shear strain curves corresponding to the first diagonal crack. Behind the turn point, the tangent slope of the curve remains nearly constant before the stirrup yielding, especially for thin-webbed beams. Additionally, the shear span-to-depth ratio λMV has little effect on the shear deformation of slender RC beams at the post-cracking stage.
  • The analytical prediction was compared with the shear strain data of 23 zones. The results showed that the proposed method gives a good and consistent prediction of the effective shear stiffness and shear strain. The proposed degradation model can be used for the post-cracking shear stiffness evaluation of shear-cracked RC beams.
  • In practice, the procedure introduced in Section 2.3 can be used for a quick shear stiffness evaluation of concrete box girder bridges in service, on which performing experimental tests may be impractical and costly.

Author Contributions

Conceptualization, K.Z.; Data curation, S.N. and J.G.; Funding acquisition, K.Z.; Investigation, K.Z. and S.N.; Methodology, K.Z.; Project administration, Y.Z. and Y.W.; Resources, Y.W.; Software, J.G. and M.G.; Supervision, Y.Z. and Y.W.; Validation, S.N., J.G. and M.G.; Writing—original draft, K.Z.; Writing—review and editing, Y.Z. and Y.W. All authors have read and agreed to the published version of the manuscript.

Funding

This research was funded by the National Natural Science Foundation of China (52108150), China Postdoctoral Science Foundation (2021M691606), State Key Laboratory of Mechanical Behavior and System Safety of Traffic Engineering Structures (KF2020-17), S&T Program of Hebei (215676145H), and Nanjing Forestry University Undergraduate Innovation Training Program (202310298024Z).

Data Availability Statement

Data are contained within the article.

Acknowledgments

The authors greatly appreciate the support from State Key Laboratory of High-Performance Civil Engineering Materials. Also, the authors sincerely appreciate the help from Xingxin Zou and Dongzhi Guan in improving the paper quality.

Conflicts of Interest

The authors declare no conflict of interest.

References

  1. ACI318-19; Building Code Requirements for Structural Concrete and Commentary. ACI: Farmington Hills, MI, USA, 2019.
  2. AASHTO. LRFD Bridge Design Specifications, 9th ed.; AASHTO: Washington, DC, USA, 2020. [Google Scholar]
  3. Zheng, K.; Zhou, S.; Zhang, Y.; Wei, Y.; Wang, J.; Wang, Y.; Qin, X. Simplified evaluation of shear stiffness degradation of diagonally cracked reinforced concrete beams. Materials 2023, 16, 4752. [Google Scholar] [CrossRef] [PubMed]
  4. Hansapinyo, C.; Pimanmas, A.; Maekawa, K.; Chaisomphob, T. Proposed model of shear deformation of reinforced concrete beam after diagonal cracking. J. Div. Mater. Concr. Struct. Pavements 2003, 725, 305–319. [Google Scholar] [CrossRef] [PubMed]
  5. Debernardi, P.G.; Taliano, M. Shear deformation in reinforced concrete beams with thin web. Mag. Concr. Res. 2006, 58, 157–171. [Google Scholar] [CrossRef]
  6. Zheng, K.; Kuwornu, M.; Liu, Z. Shear test of variable depth rc beams with inflection point. MATEC Web Conf. 2019, 275, 02003. [Google Scholar] [CrossRef]
  7. Pan, Z.; Bing, L.; Lu, Z. Effective shear stiffness of diagonally cracked reinforced concrete beams. Eng. Struct. 2014, 59, 95–103. [Google Scholar] [CrossRef]
  8. Wang, T.; Dai, J.G.; Zheng, J.J. Multi-angle truss model for predicting the shear deformation of rc beams with low span-effective depth ratios. Eng. Struct. 2015, 91, 85–95. [Google Scholar] [CrossRef]
  9. He, Z.; Liu, Z.; Ma, Z.J. Shear deformations of RC beams under service loads. J. Struct. Eng. 2017, 143, 04016153. [Google Scholar] [CrossRef]
  10. Huang, Z.; Tu, Y.; Meng, S.; Ohlsson, U.; Taljsten, B.; Elfgren, L. A practical method for predicting shear deformation of reinforced concrete beams. Eng. Struct. 2020, 206, 110116. [Google Scholar] [CrossRef]
  11. Liu, J.; Jia, Y.; Zhang, G.; Wang, J. Effect of diagonal cracks on shear stiffness of pre-stressed concrete beam. Int. J. Struct. Integr. 2018, 9, 414–428. [Google Scholar] [CrossRef]
  12. Park, R.; Paulay, P. Reinforcement Concrete Structures; John Wiley & Sons: Christchurch, New Zealand, 1975; pp. 315–319. [Google Scholar]
  13. Branson, D.E. Deformation of Concrete Structures; McGraw-Hill Companies: Toronto, ON, Canada, 1977; pp. 545–546. [Google Scholar]
  14. ACI 445-R99; Committee Recent Approaches to Shear Design of Structural Concrete. American Concrete Institute: Farmington Hills, MI, USA, 2009.
  15. Leonhardt, F.; Walther, R. The Stuttgart Shear Tests; Cement and Concrete Association: London, UK, 1964; Volume 111, pp. 1–134. [Google Scholar]
  16. Kupfer, H. Generalization of Morsch’s truss analogy using the principle of minimum strain energy. CEB Bull. 1964, 40, 44–57. [Google Scholar]
  17. Vecchio, F.J.; Collins, M.P. The modified compression field theory for reinforced concrete elements subjected to shear. ACI Struct. J. 1986, 83, 219–231. [Google Scholar]
  18. Bentz, E.C. Sectional Analysis of Reinforced Concrete Members; University of Toronto: Toronto, ON, Canada, 2000. [Google Scholar]
  19. Desalegne, A.S.; Lubell, A.S. Consideration of shear deformations for slender concrete beams. ACI Spec. Publ. 2012, SP284-15, 1–18. [Google Scholar]
  20. Pang, X.B.; Hsu, T.T.C. Fixed-angle softened-truss model for reinforced concrete. ACI Struct. J. 1996, 93, 197–207. [Google Scholar]
  21. Zhu, R.; Hsu, T.T.; Lee, J.Y. Rational shear modulus for smeared-crack analysis of reinforced concrete. ACI Struct. J. 2001, 98, 443–450. [Google Scholar]
  22. Barzegar, F. Analysis of RC membrane elements with anisotropic reinforcement. J. Struct. Eng. 1989, 115, 647–665. [Google Scholar] [CrossRef]
  23. Rahal, K.N. Post-cracking shear modulus of reinforced concrete membrane elements. Eng. Struct. 2010, 32, 218–225. [Google Scholar] [CrossRef]
  24. Kim, J.H.; Mander, J.B. Influence of transverse reinforcement on elastic shear stiffness of cracked concrete elements. Eng. Struct. 2007, 29, 1798–1807. [Google Scholar] [CrossRef]
  25. Li, B.; Tran CT, N. Reinforced concrete beam analysis supplementing concrete contribution in truss models. Eng. Struct. 2008, 30, 3285–3294. [Google Scholar] [CrossRef]
  26. Zheng, K.; Liu, Z.; Zhang, Y.; Qin, S. Practical evaluation method for shear stiffness of concrete beam bridges with web diagonal cracks. Bridge Constr. 2015, 45, 46–51. (In Chinese) [Google Scholar]
  27. Kuo, W.W.; Hsu, T.T.; Hwang, S.J. Shear Strength of Reinforced Concrete Beams. ACI Struct. J. 2014, 111, 809–818. [Google Scholar] [CrossRef]
  28. Słowik, M. Shear failure mechanism in concrete beams. Procedia Mater. Sci. 2014, 3, 1977–1982. [Google Scholar] [CrossRef]
  29. Armaghani, D.J.; Hatzigeorgiou, G.D.; Karamani, C.; Skentou, A.; Zoumpoulaki, I.; Asteris, P.G. Soft computing-based techniques for concrete beams shear strength. Procedia Struct. Integr. 2019, 17, 924–933. [Google Scholar] [CrossRef]
  30. Wang, Y.D.; Yang, S.; Han, M. Experimental study of section enlargement with reinforced concrete to increase shear capacity for damaged reinforced concrete beams. Appl. Mech. Mater. 2013, 256, 1148–1153. [Google Scholar] [CrossRef]
  31. Muttoni, A.; Fernández Ruiz, M. Shear strength of members without transverse reinforcement as function of critical shear crack width. ACI Struct. J. 2008, 105, 163–172. [Google Scholar]
  32. Duan, M.; Zou, X.; Bao, Y.; Li, G.; Chen, Y.; Li, Z. Experimental investigation of headed studs in steel-ultra-high performance concrete (UHPC) composite sections. Eng. Struct. 2022, 270, 114875. [Google Scholar] [CrossRef]
  33. Zhang, F.; Wang, C.; Liu, J.; Zou, X.; Sneed, L.H.; Bao, Y.; Wang, L. Prediction of FRP-concrete interfacial bond strength based on machine learning. Eng. Struct. 2023, 74, 115156. [Google Scholar] [CrossRef]
  34. Huang, Z.; Tu, Y.; Meng, S.; Sabau, C.; Popescu, C.; Sas, G. Experimental study on shear deformation of reinforced concrete beams using digital image correlation. Eng. Struct. 2019, 181, 670–698. [Google Scholar] [CrossRef]
  35. Chen, S.; Wei, Y.; Ding, M.; Zhao, K.; Zheng, K. Combinatorial design and flexural behavior of laminated bamboo-timber composite beams. Thin-Walled Struct. 2022, 181, 109993. [Google Scholar] [CrossRef]
Figure 1. Truss model for shear response of diagonally cracked RC beams.
Buildings 13 02814 g001
Figure 2. The influence of λMV on angle θy.
Buildings 13 02814 g002
Figure 3. Comparison of measured and calculated effective shear stiffness and shear strain of Beams C1, C2 [6,7,9].
Buildings 13 02814 g003
Figure 4. Comparison of measured and calculated effective shear stiffness and shear strain of Beams TR1, TR3 [5,7,9].
Buildings 13 02814 g004
Figure 5. Comparison of measured and calculated effective shear stiffness and shear strain of Beams TR2, TR6 [5,7,9].
Buildings 13 02814 g005
Figure 6. Comparison of measured and calculated effective shear stiffness and shear strain of Beams S1, S2 [4,7,9].
Buildings 13 02814 g006
Figure 7. Comparison of measured and calculated effective shear stiffness and shear strain of Beams S3, S4 [4,7,9].
Buildings 13 02814 g007aBuildings 13 02814 g007b
Table 1. Member deformation of the variable-angle truss model.
InducementMemberForceUnit LoadLengthRigidityDeformation
Shear force
V
Stirrups V 1 d v E s ρ v b w d v cot θ y V E s ρ v b w cot θ y
Inclined Strut V sin θ y 1 sin θ y d v sin θ y 1 E c b d v cos θ y V E c b sin 3 θ y cos θ y
Upper chord V cot θ y 2 cot θ y 2 d v cot θ y E c A c m V d v cot 3 θ 4 E c A c m
Lower chord V cot θ y 2 cot θ y 2 d v cot θ y E s A s V d v cot 3 θ y 4 E s A s
Moment
M
Upper chord M d v cot θ y 2 d v cot θ y E c A c m M cot 2 θ y 2 E c A c m
Lower chord M d v cot θ y 2 d v cot θ y E s A s M cot 2 θ y 2 n E c A s
Table 2. Details of specimens.
ResourcesSpecimen
ID
f’c
(MPa)
Ec
(GPa)
dv
(mm)
bw
(mm)
fyv
(MPa)
ρv
(%)
ρs
(%)
Vcr
(kN)
Vy
(kN)
Zheng [6]C139.029.46841003270.54.8150240
C236.028.26841003270.44.8160240
Debernardi [5]TR122.022.03001005700.50.7440160 *
TR222.022.03001005700.51.3450200
TR320.021.03001005700.50.7440160 *
TR633.527.23001005700.51.3455240
Hansapinyo [4]S133.027.03501503700.474.2673.6180
S233.027.03201503700.474.2664.1170
S333.027.03201503700.472.1361.3160
S433.027.03201503700.312.1361.6130
“*”—The yielding shear force Vy was calculated using Equation (9), as the specimen failed in flexure before the stirrups yielding in shear span.
Table 3. Shear-to-span depth ratio of each measuring zone.
ResourcesSpecimen IDZonea/h or M/(Vh)
Zheng [6]C1, C2G30.5
G40
Debernardi [5]TR1, TR2A, E1.67
B, D2.5
TR3A, E2.08
B, D2.92
TR6A2
G4
F4.83
Hansapinyo [4]S1, S2, S4-2.6
S3-3.5
Table 4. Strut inclination θy and degradation coefficient ξy at stirrup yielding status.
ResourceSpecimen
ID
θy
(Degree)
θP
(Degree)
θH
(Degree)
ξyξPξHξexpξy/ξexpξP/ξexpξH/ξexp
Zheng [6]C126.331.325.10.1820.1560.1860.1900.960.690.97
C225.230.024.10.1690.1450.1730.1780.950.710.98
Debernardi [5]TR1 *33.942.335.00.1640.1070.156----
TR231.138.535.00.1830.1320.1560.2250.810.590.69
TR3 *34.042.436.10.1690.1120.154----
TR630.838.430.80.1620.1130.1620.2530.640.450.64
Hansapinyo [4]S126.431.526.80.1790.1520.1780.1551.150.981.15
S226.431.526.80.1790.1520.1780.1431.251.061.24
S328.535.226.80.1700.1280.1780.1780.960.721.00
S426.132.523.80.1420.1060.1520.1680.850.630.90
Average0.950.760.95
CV0.190.250.20
“*”—Stirrups did not yield before specimen failure.
Disclaimer/Publisher’s Note: The statements, opinions and data contained in all publications are solely those of the individual author(s) and contributor(s) and not of MDPI and/or the editor(s). MDPI and/or the editor(s) disclaim responsibility for any injury to people or property resulting from any ideas, methods, instructions or products referred to in the content.

