
Study on the Bending Performance of High-Strength and High-Ductility CRE-Reinforced Concrete Beams

Abstract
:1. Introduction
2. Test Program
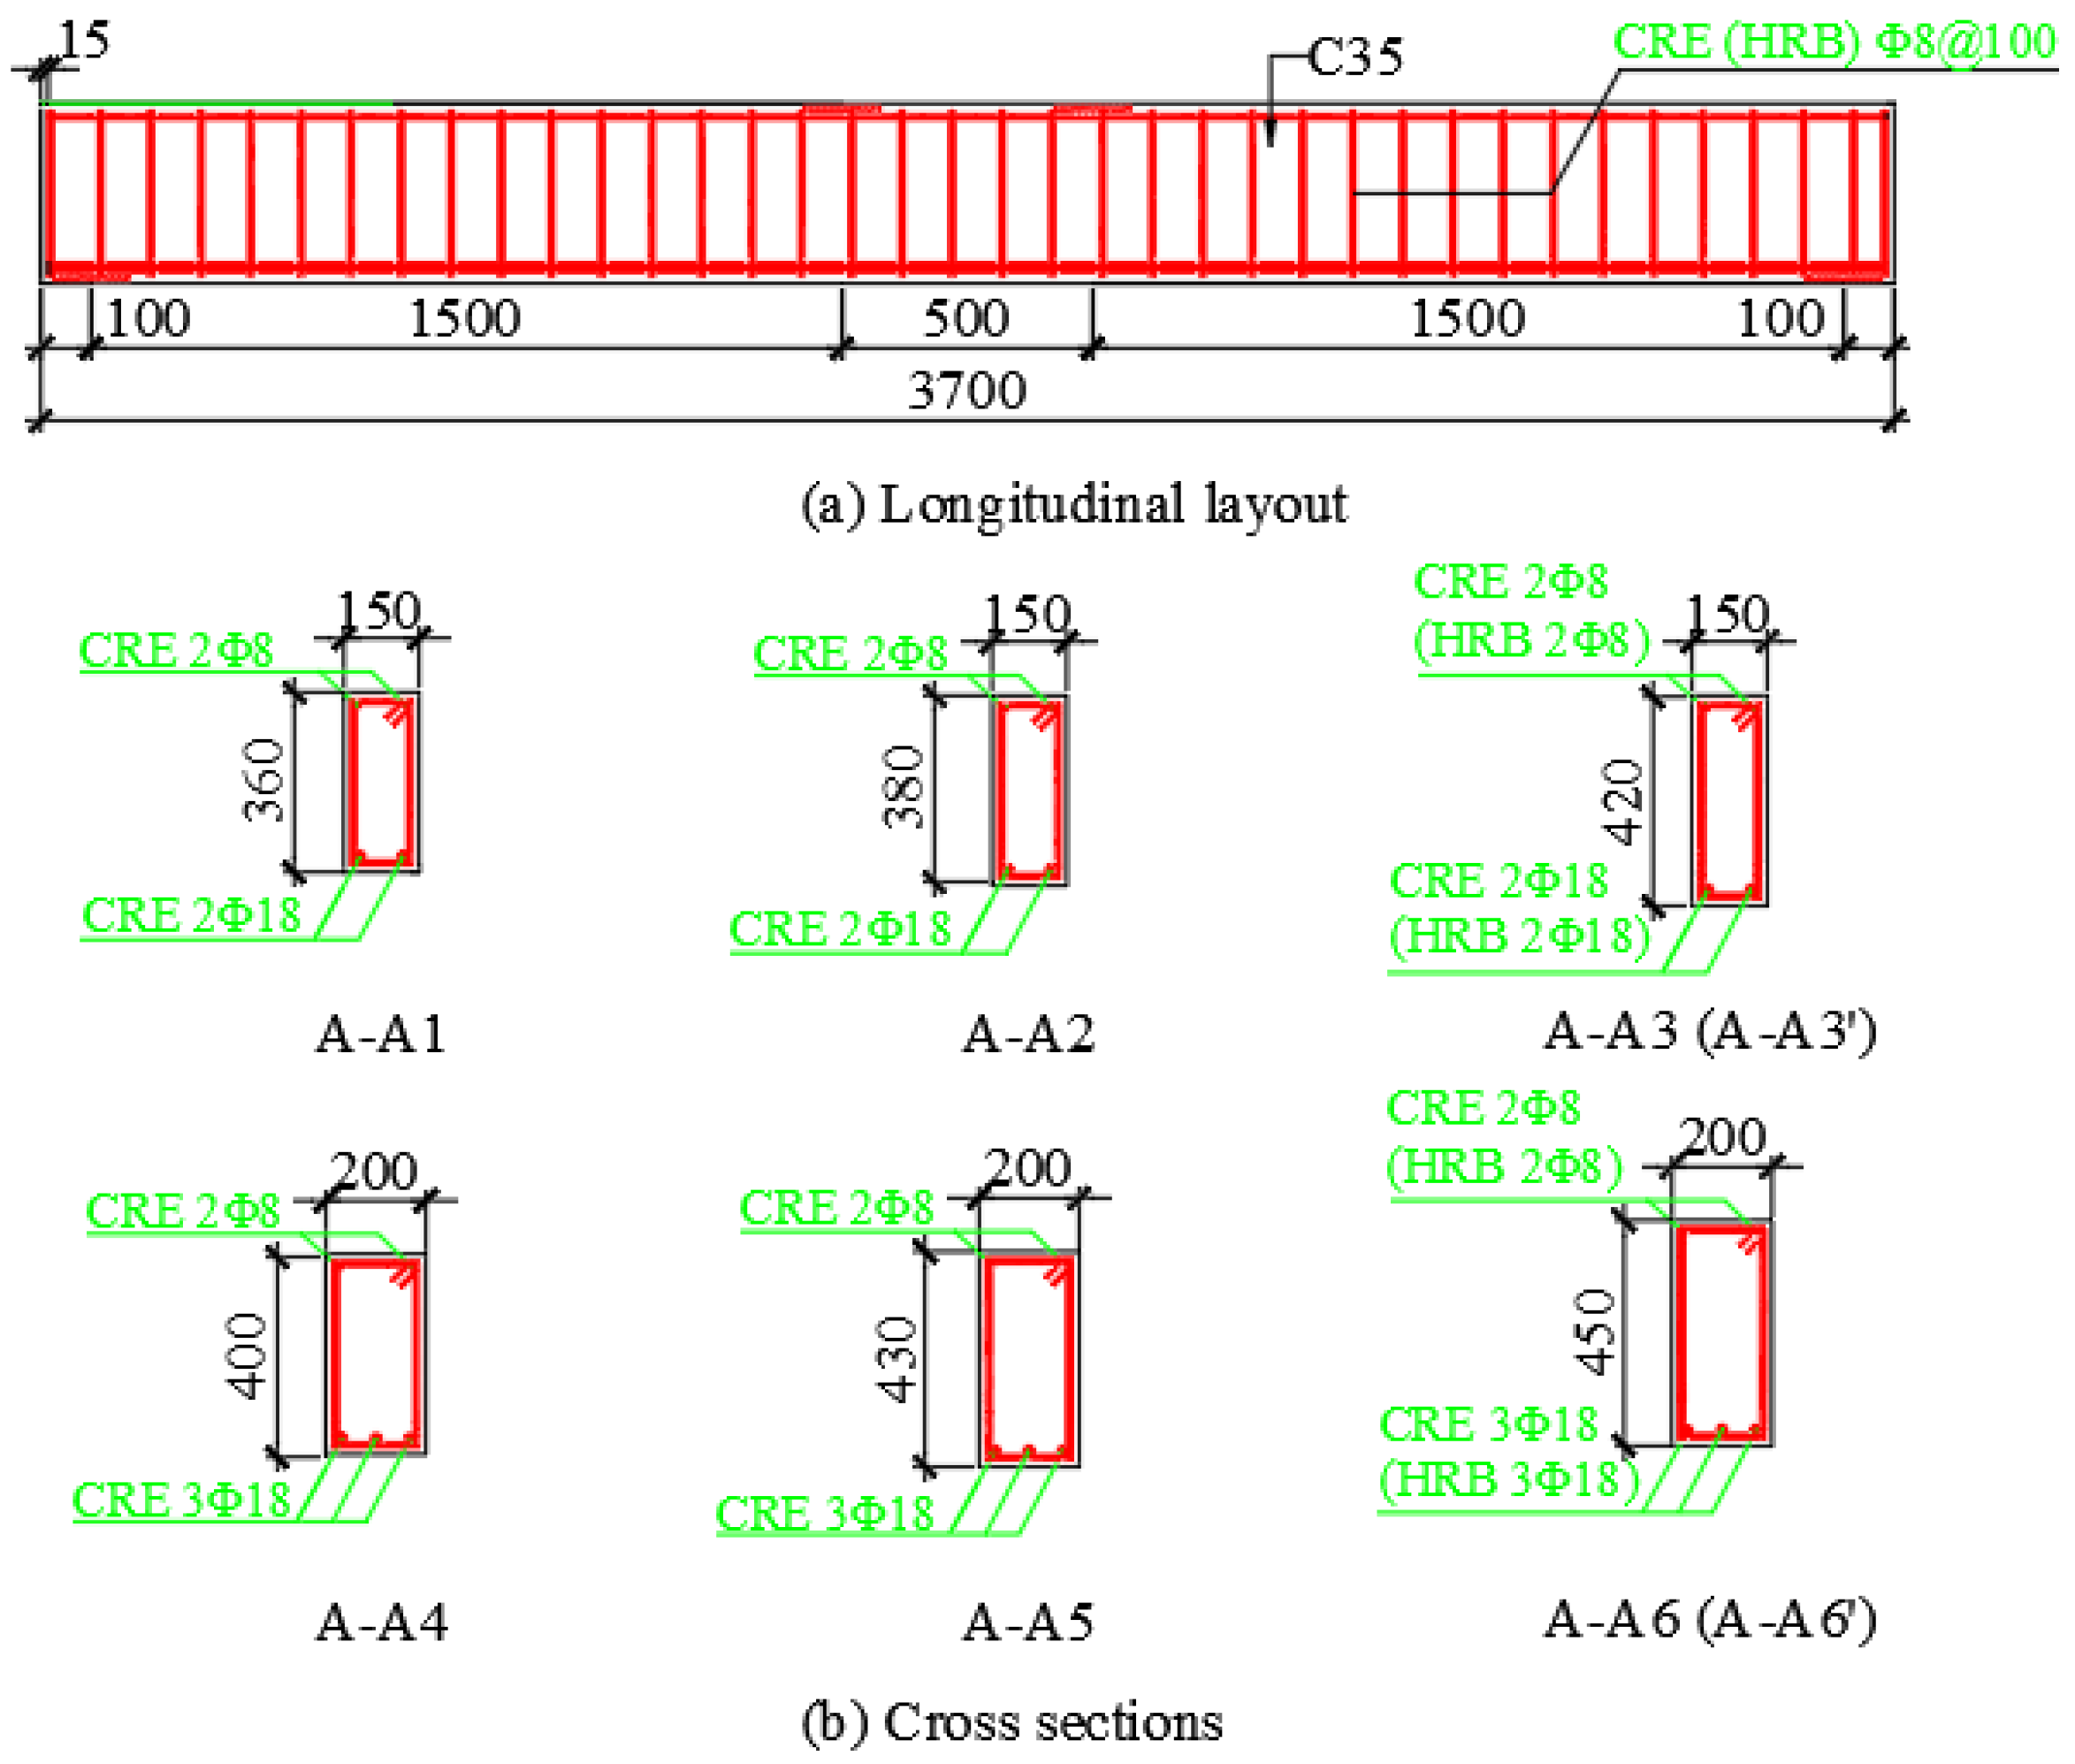
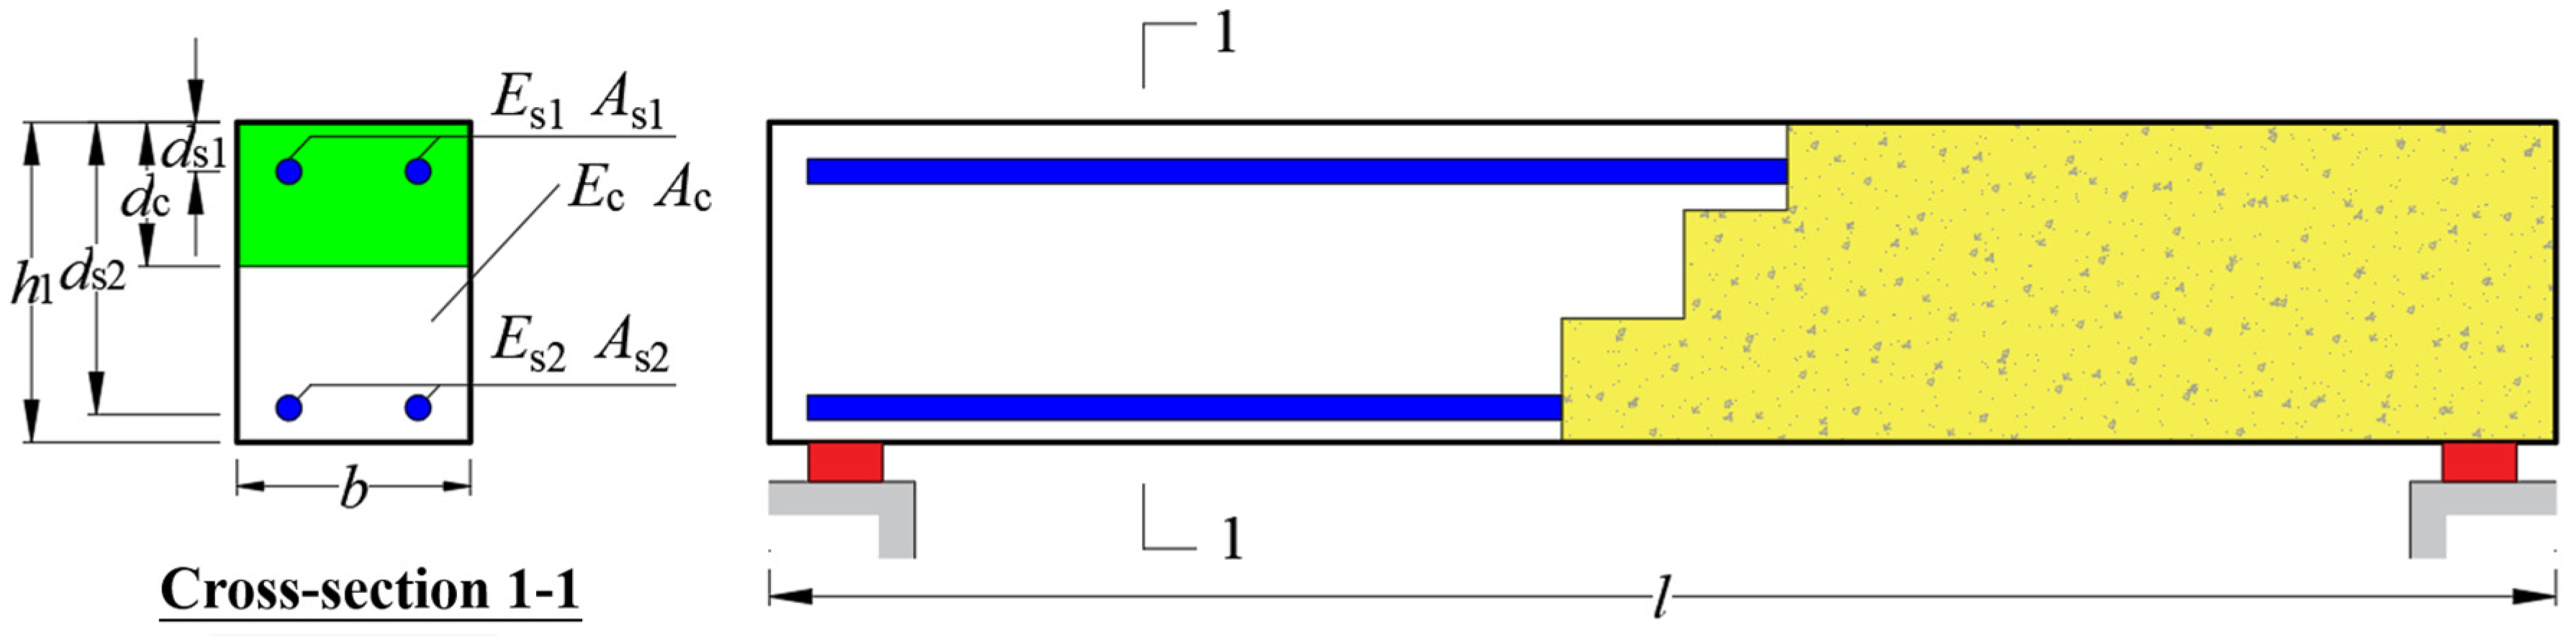
2.1. Test Design
2.2. Test Material
2.3. Test Setup and Loading Program
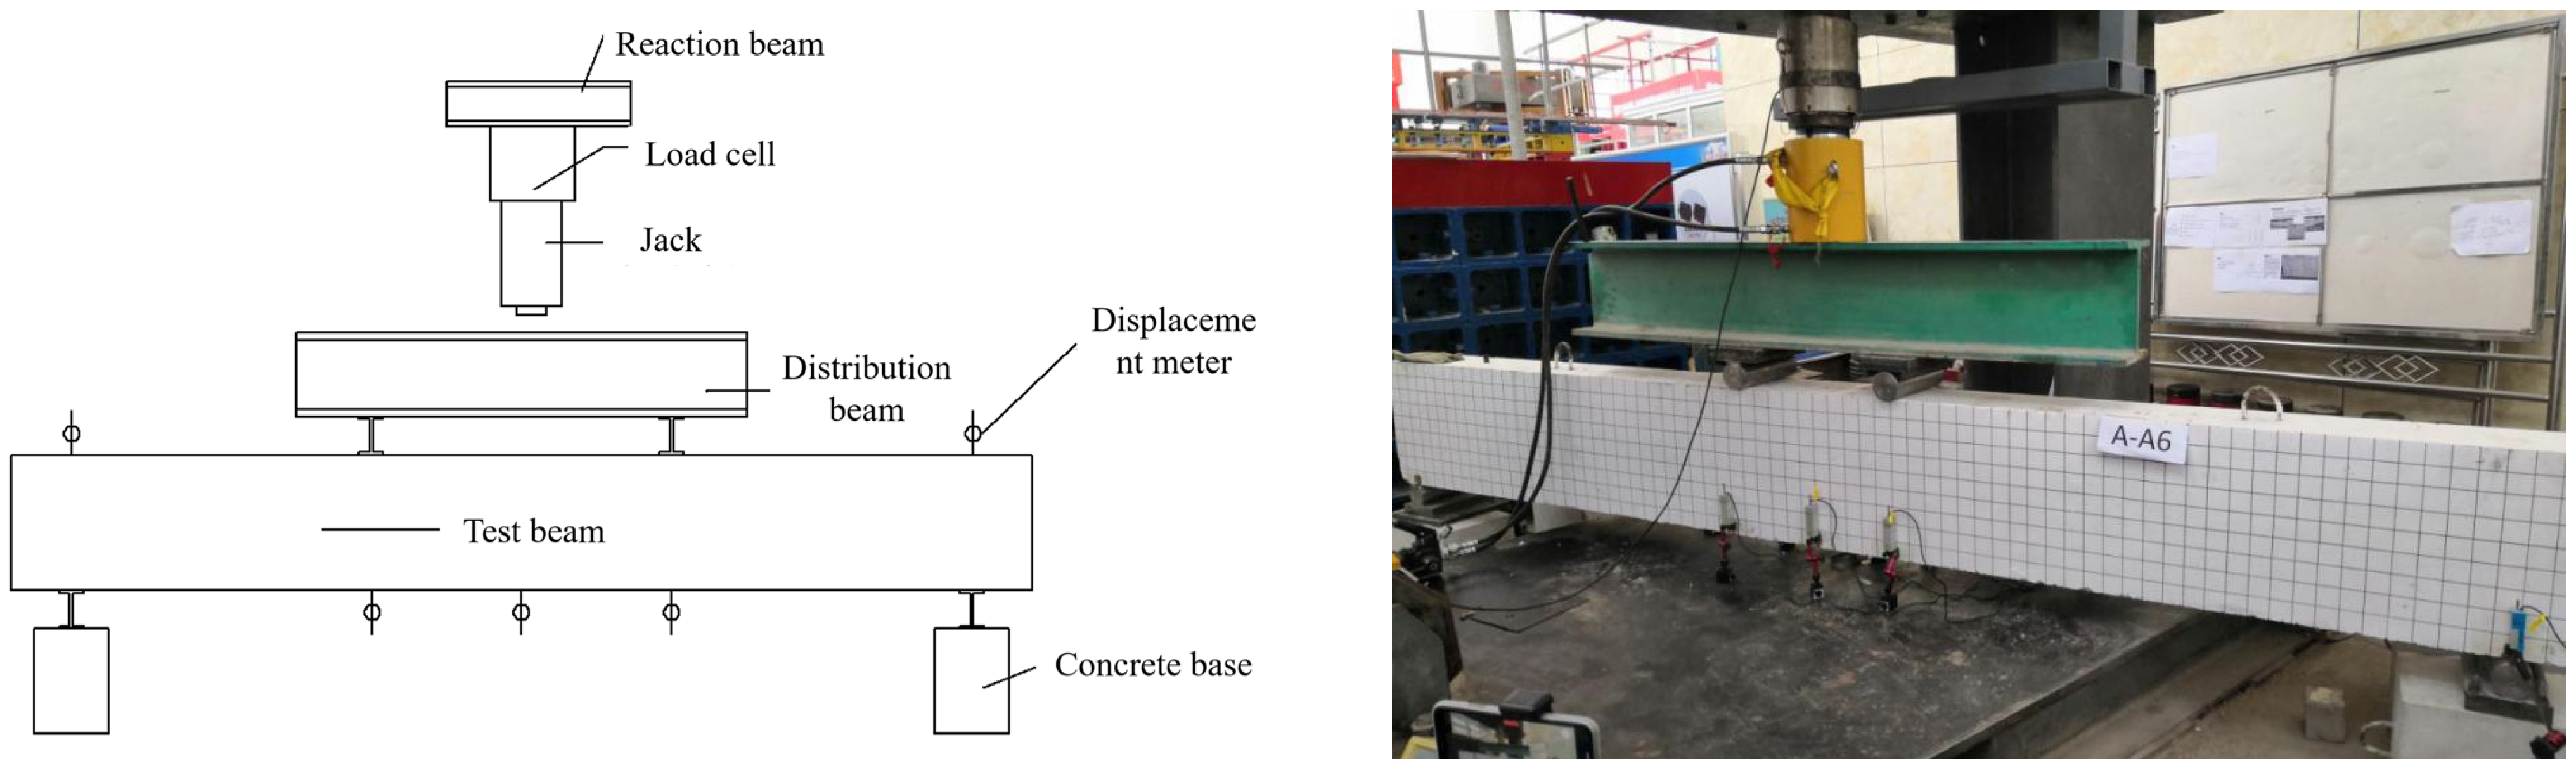
2.3.1. Test Setup
2.3.2. Loading Regime
2.4. Measurement Contents
2.5. Specimen Fabrication
3. Test phenomenon and Analysis
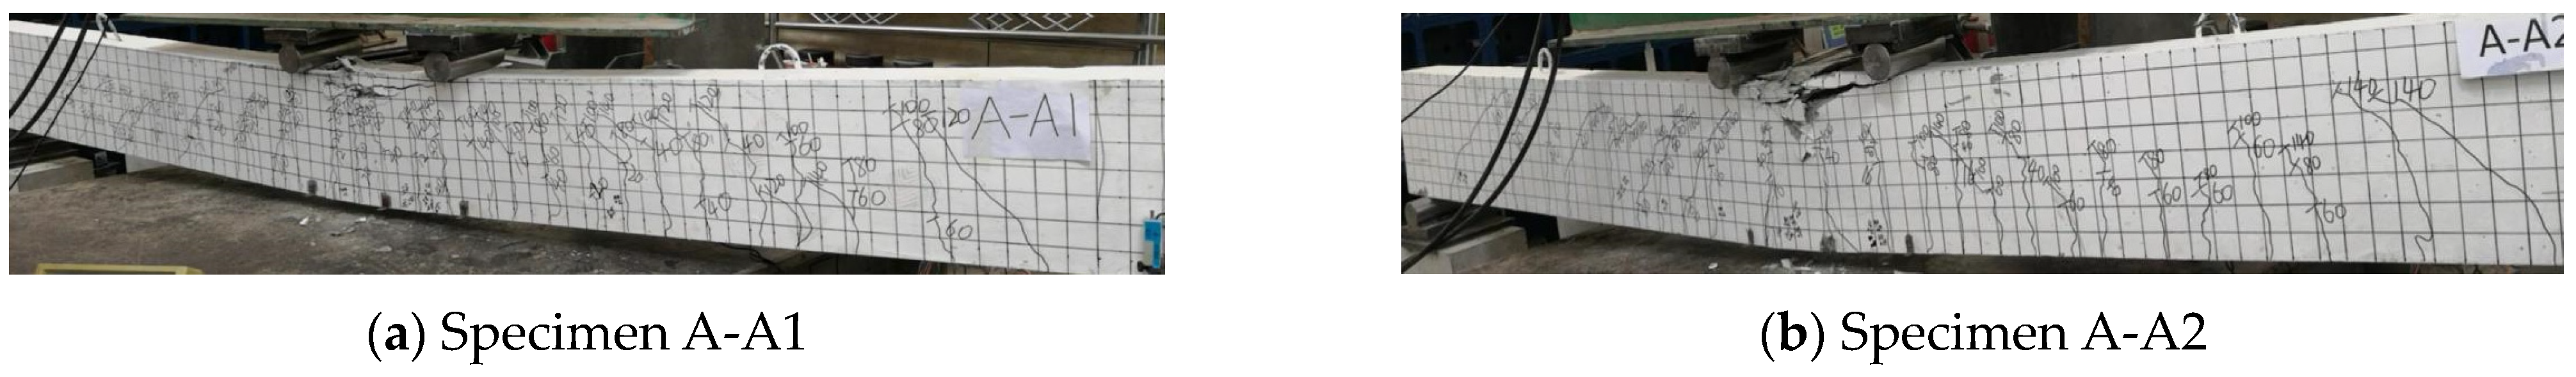
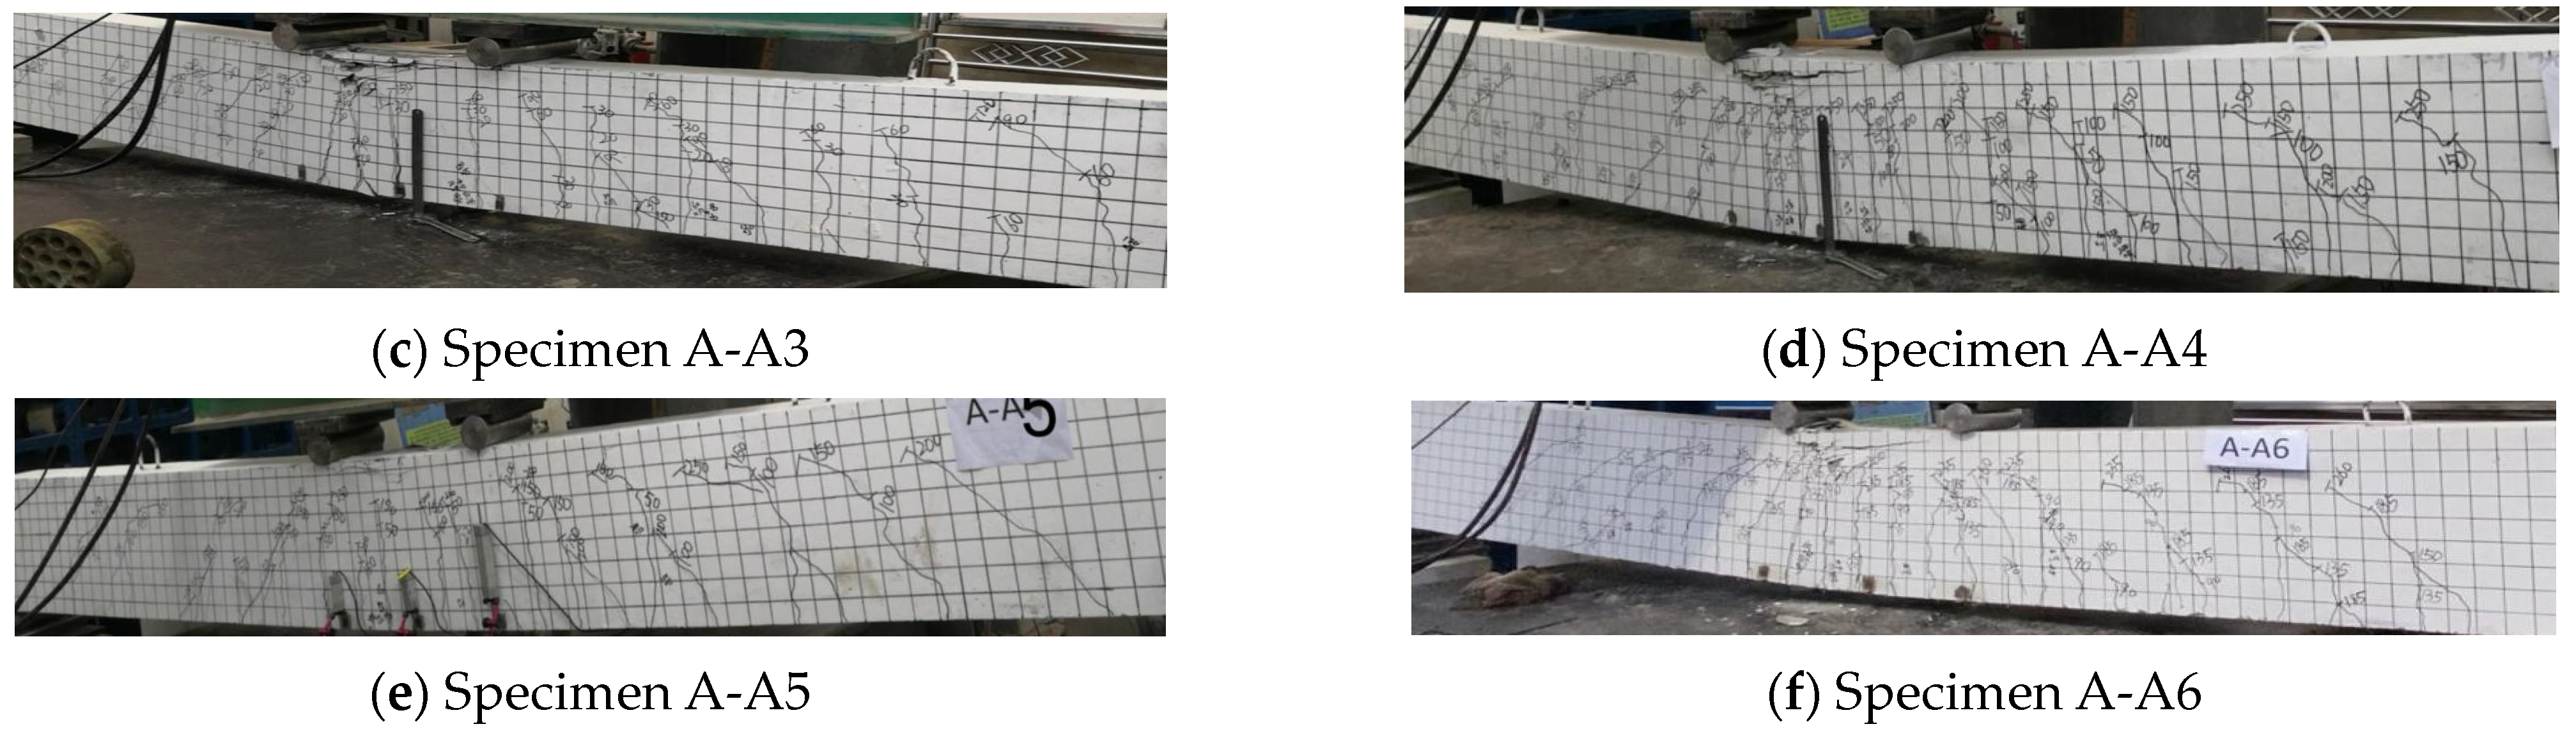
3.1. Test Phenomenon
3.1.1. Specimens A-A1~A-A6
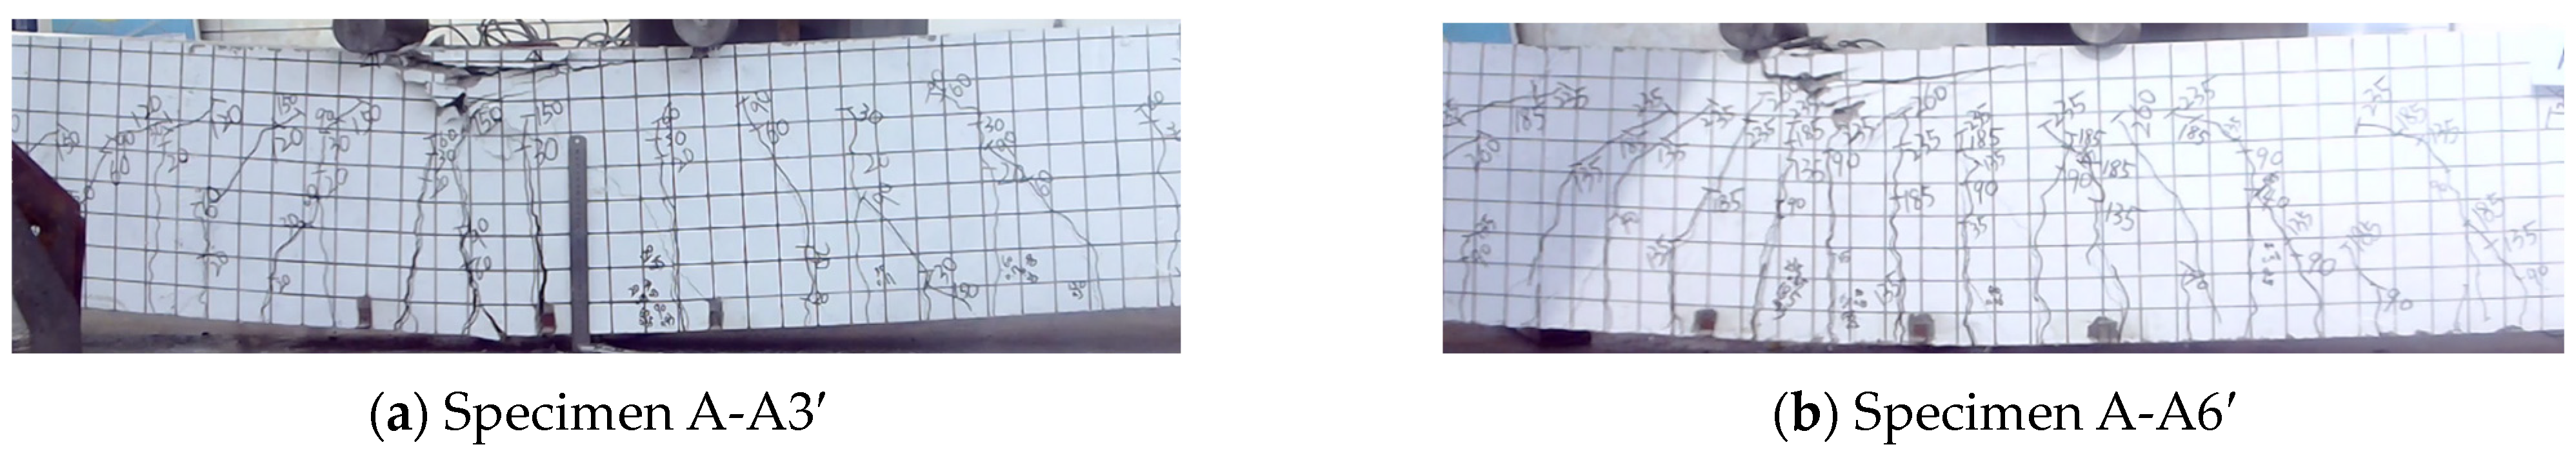
3.1.2. Specimens A-A3′ and A-A6′
3.2. Analysis of Test Results
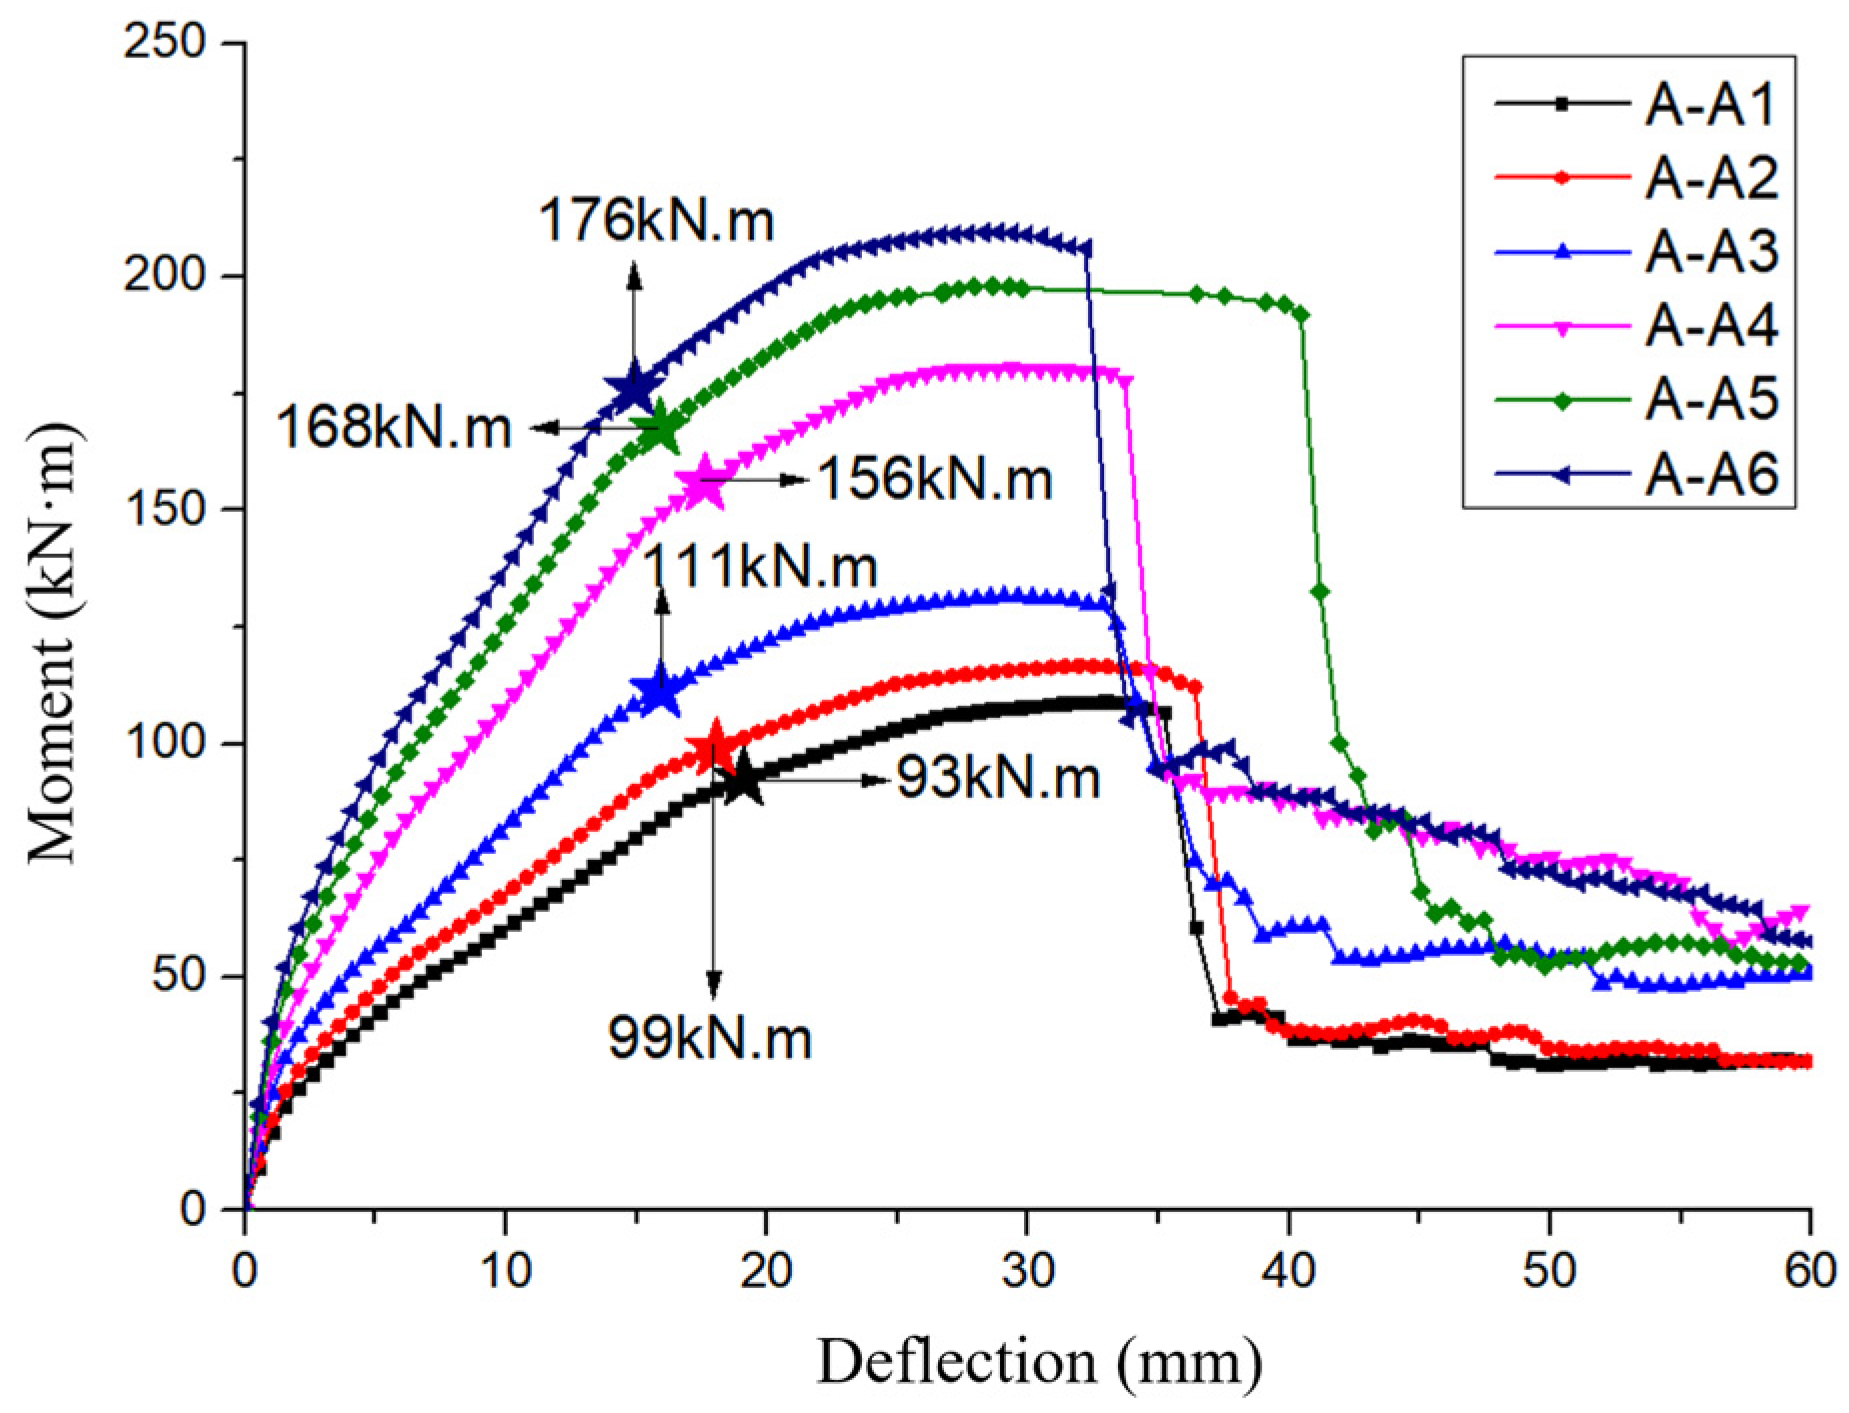
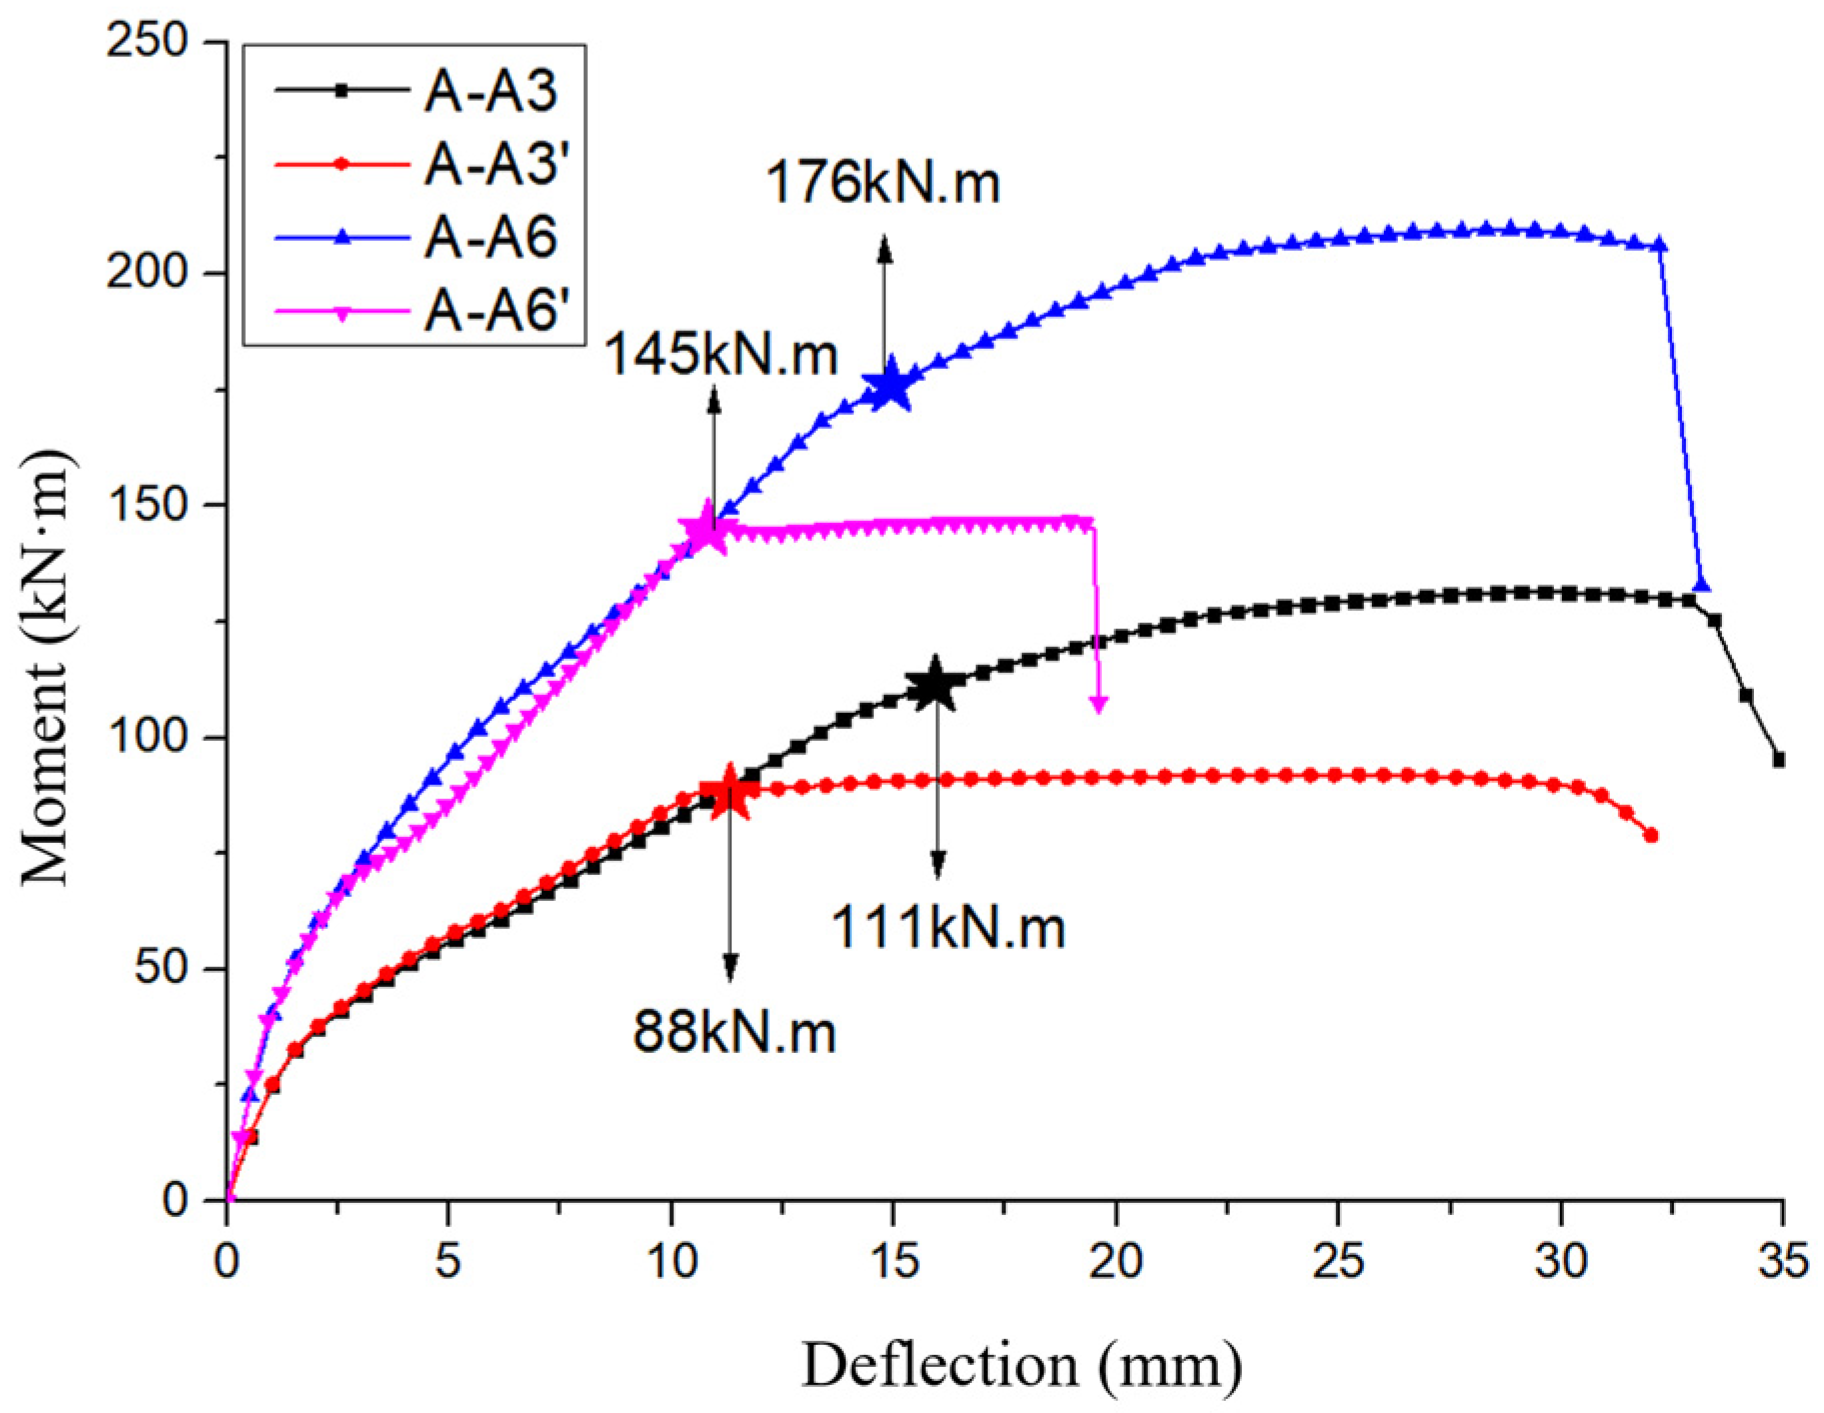
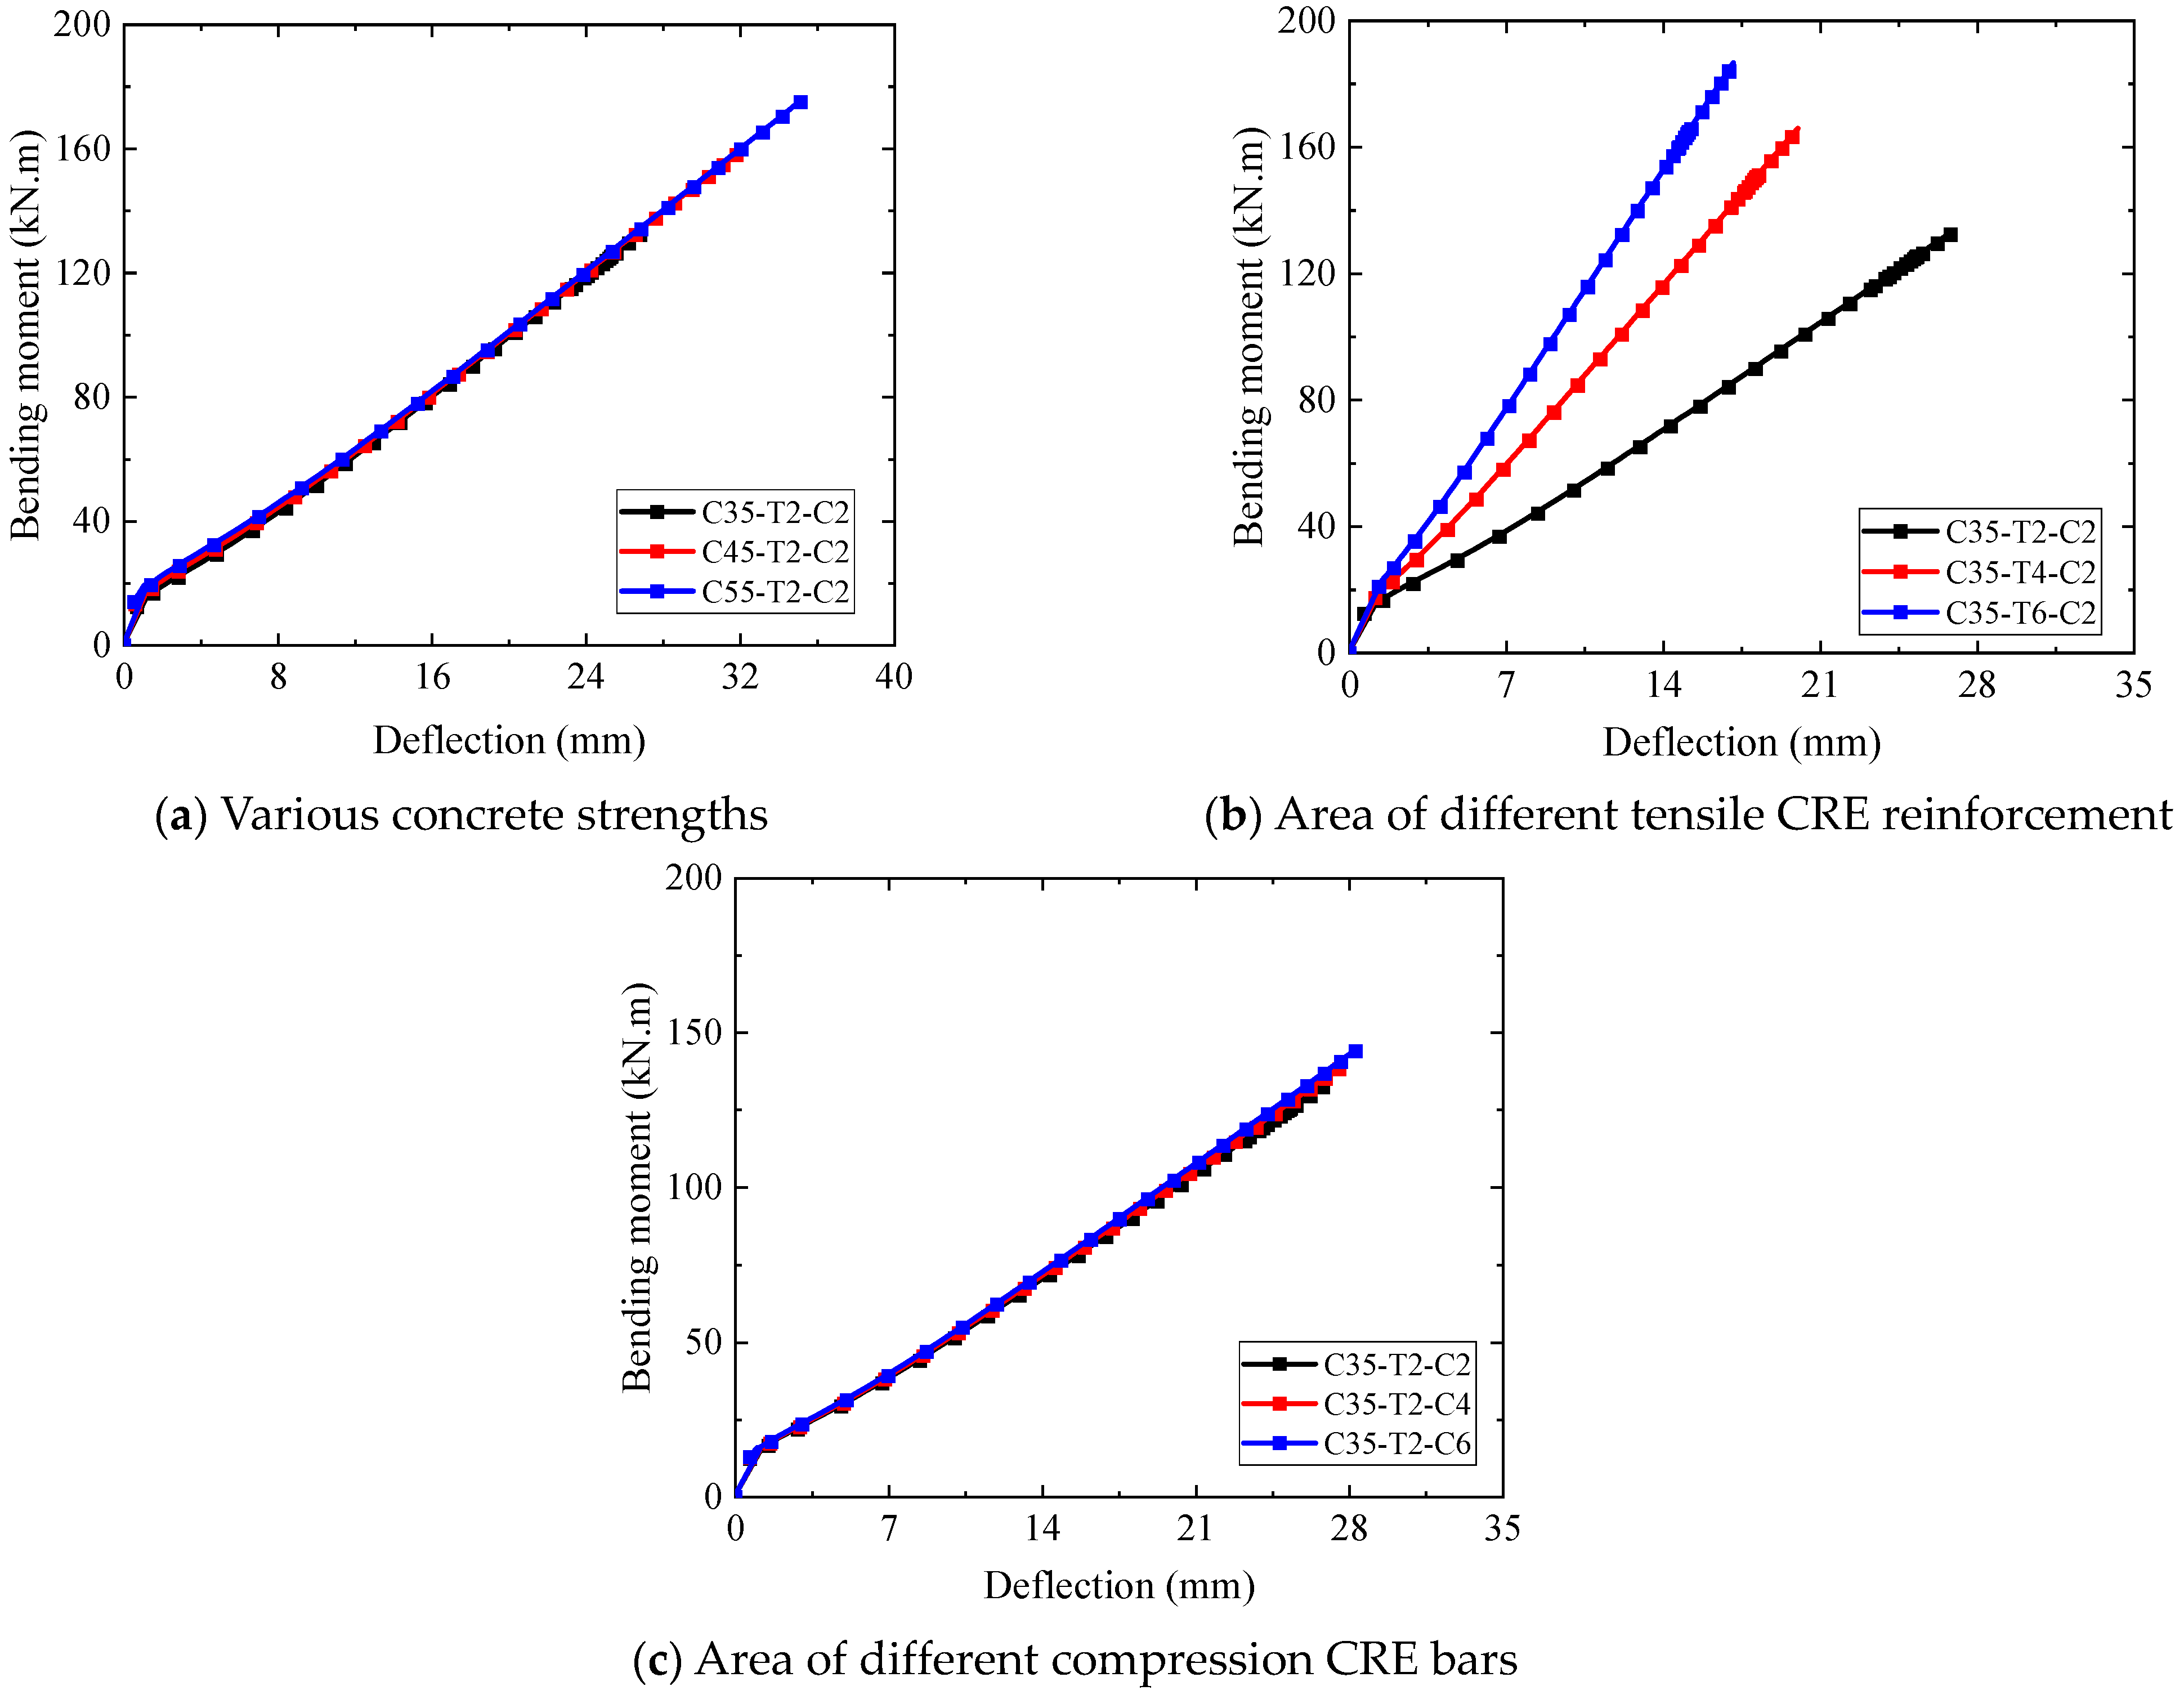
3.2.1. Bending Moment–Deflection Curve
- (1)
- Specimens A-A1~A-A6
- (2)
- Specimens A-A3, A-A3′, A-A6, and A-A6′
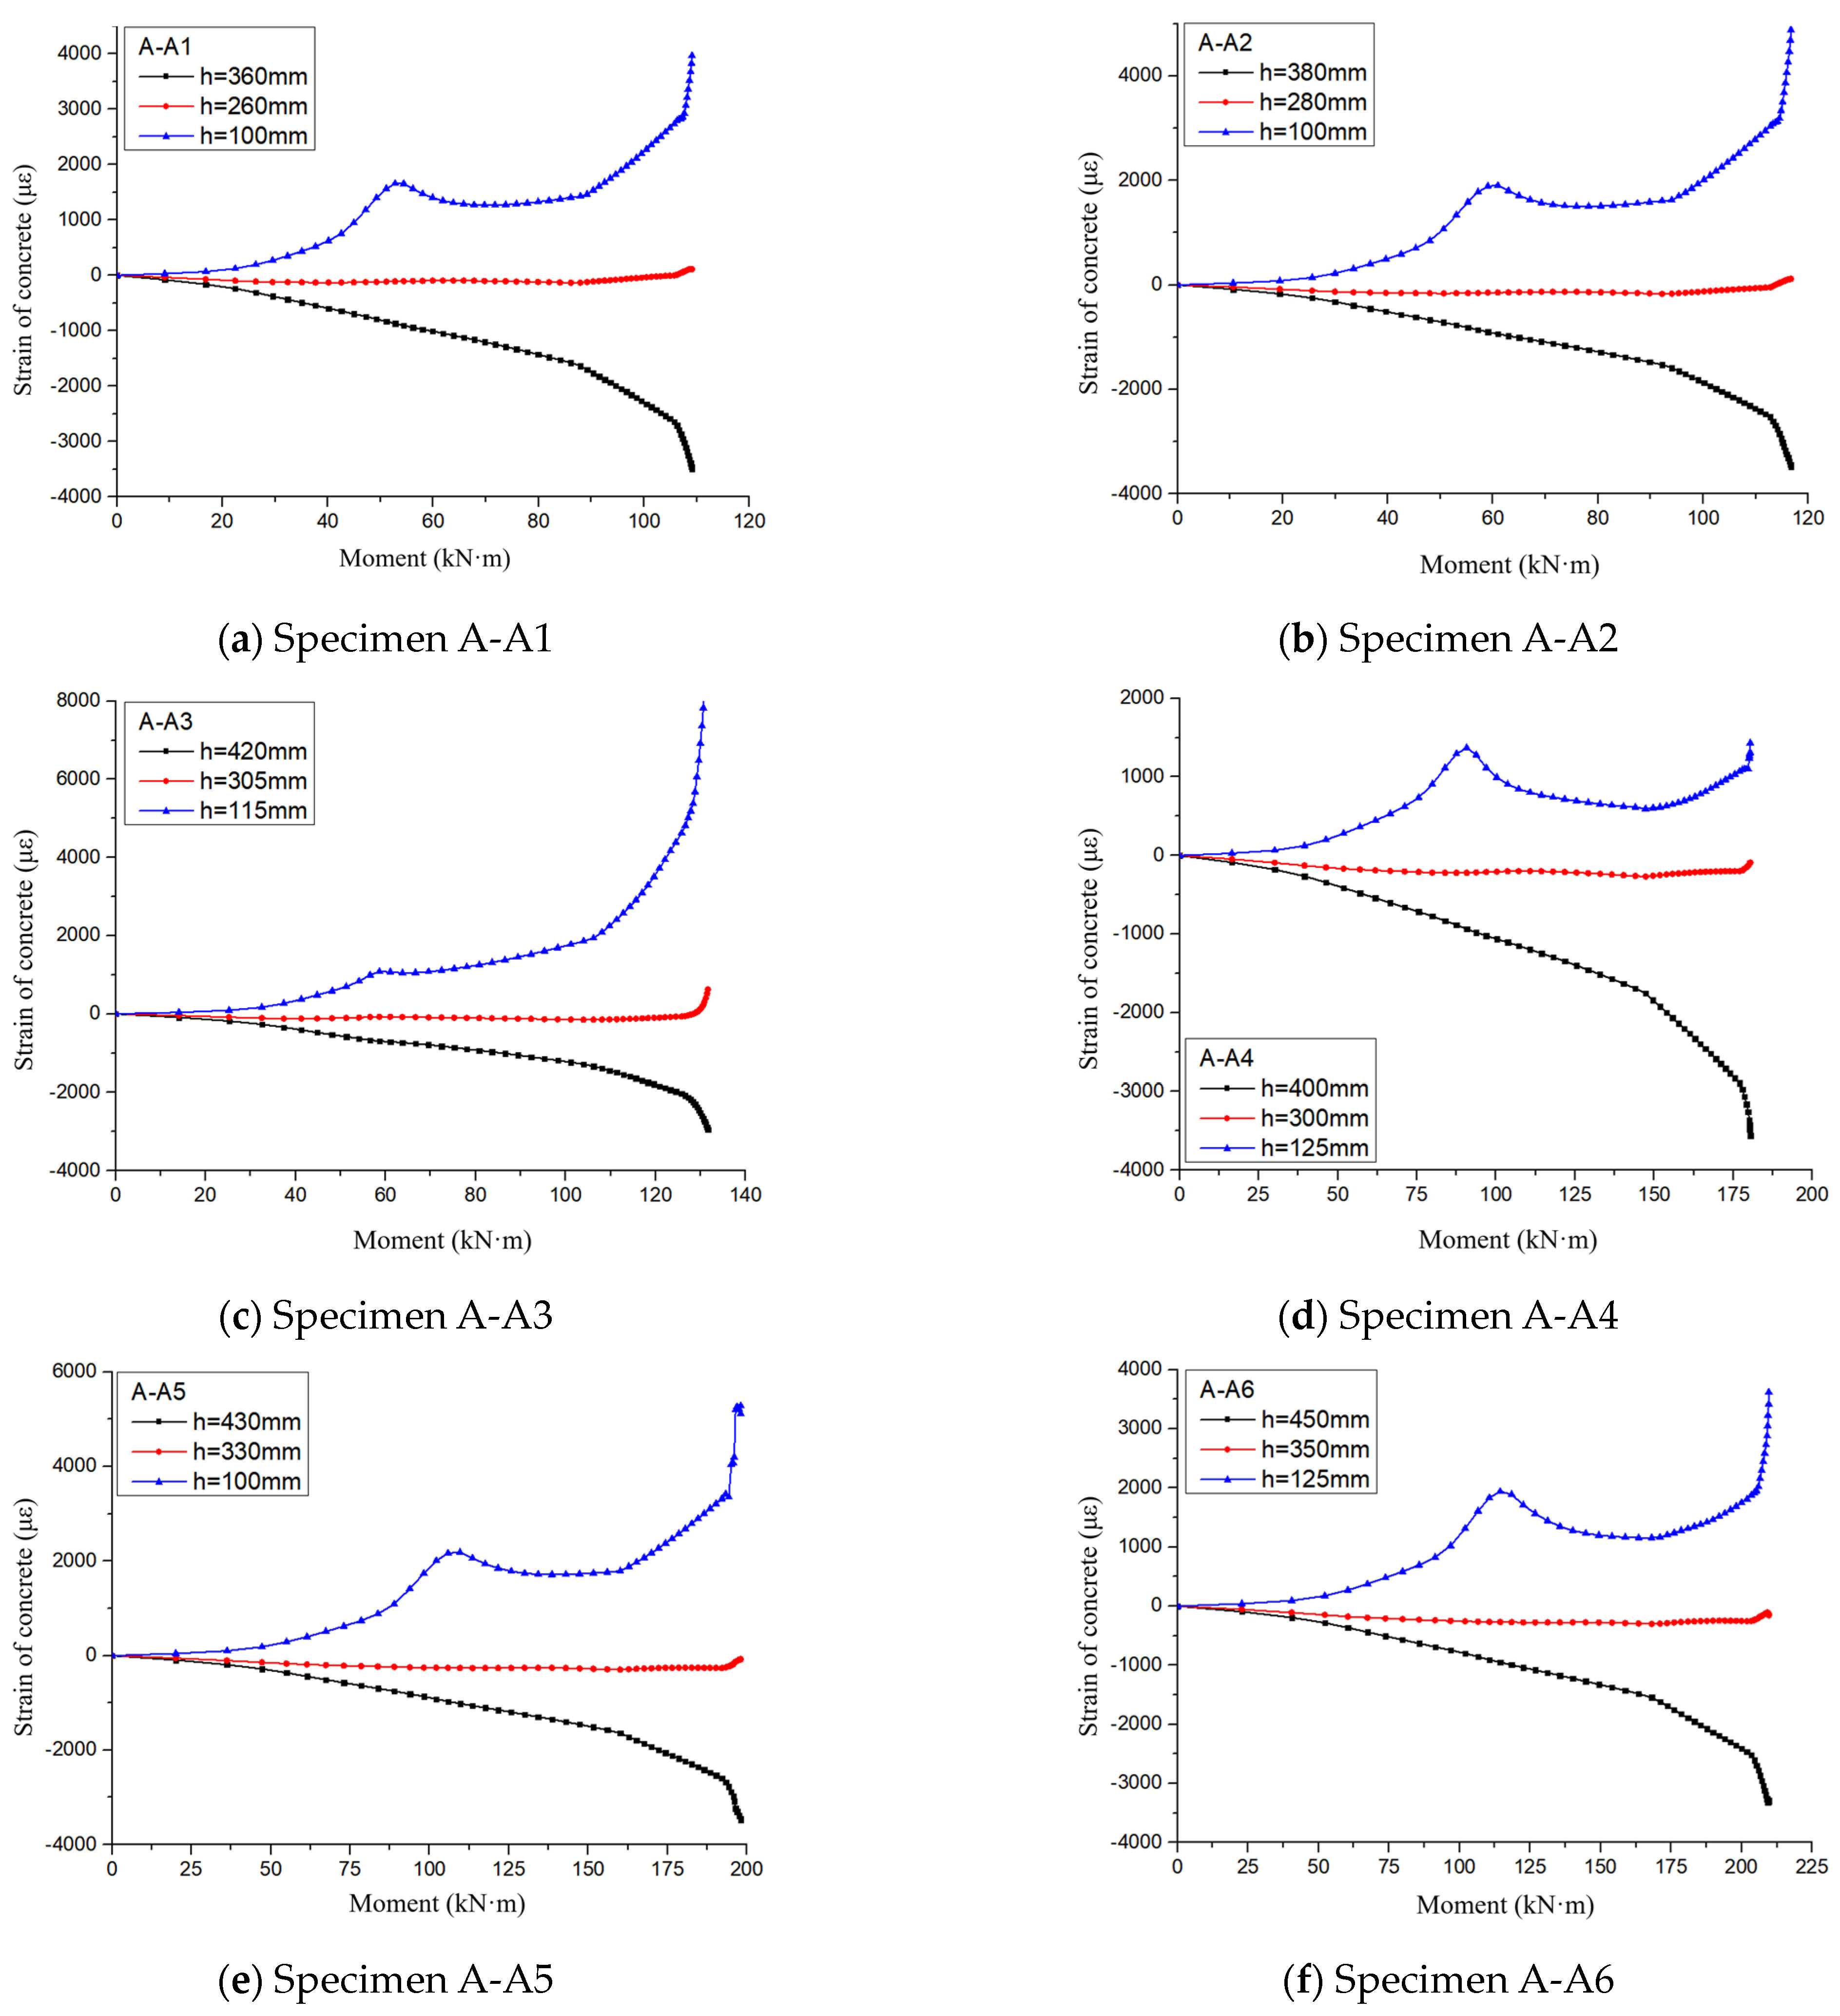
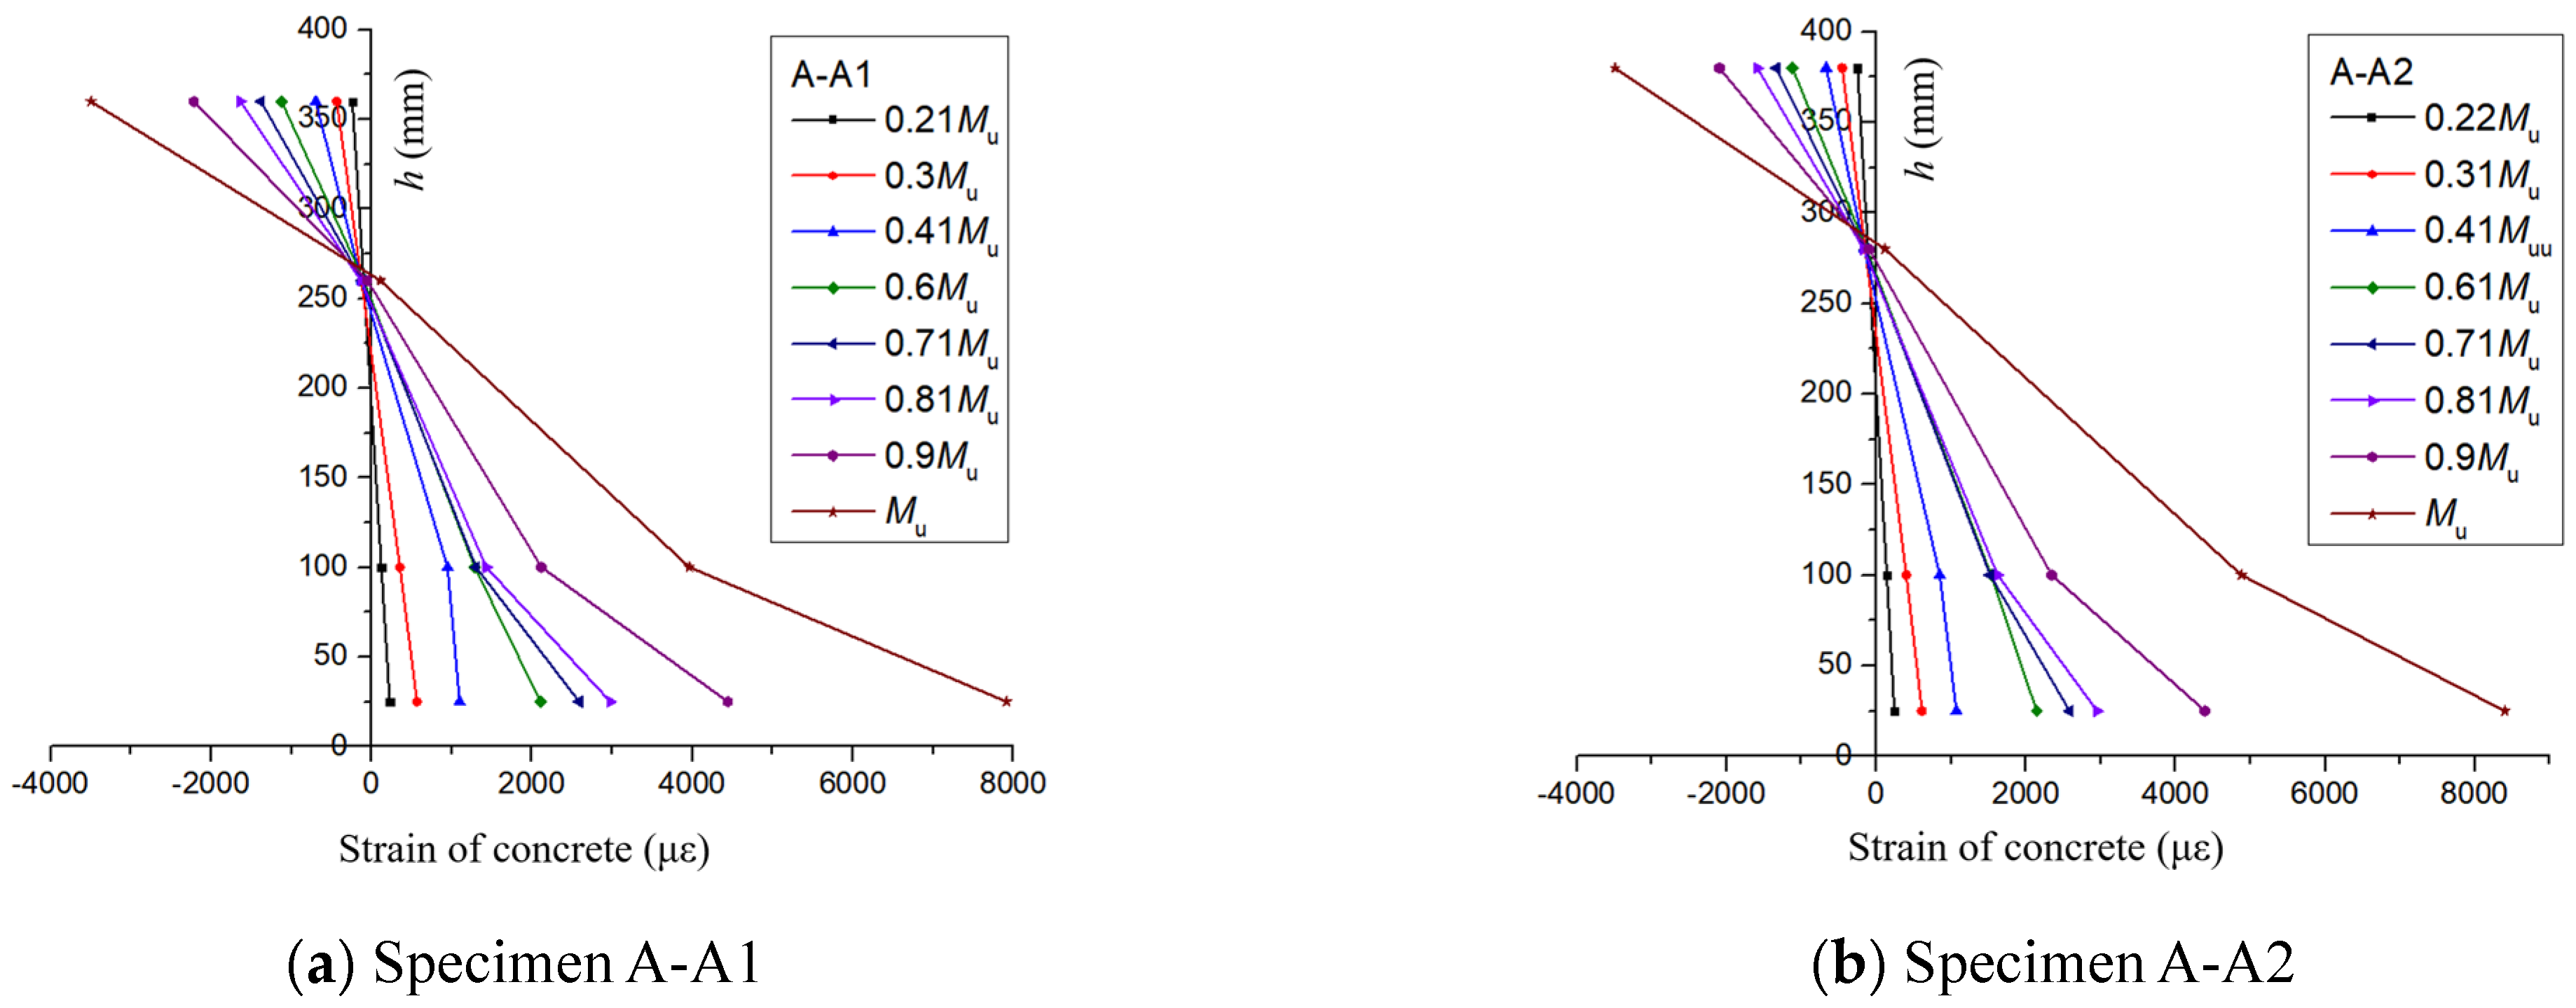
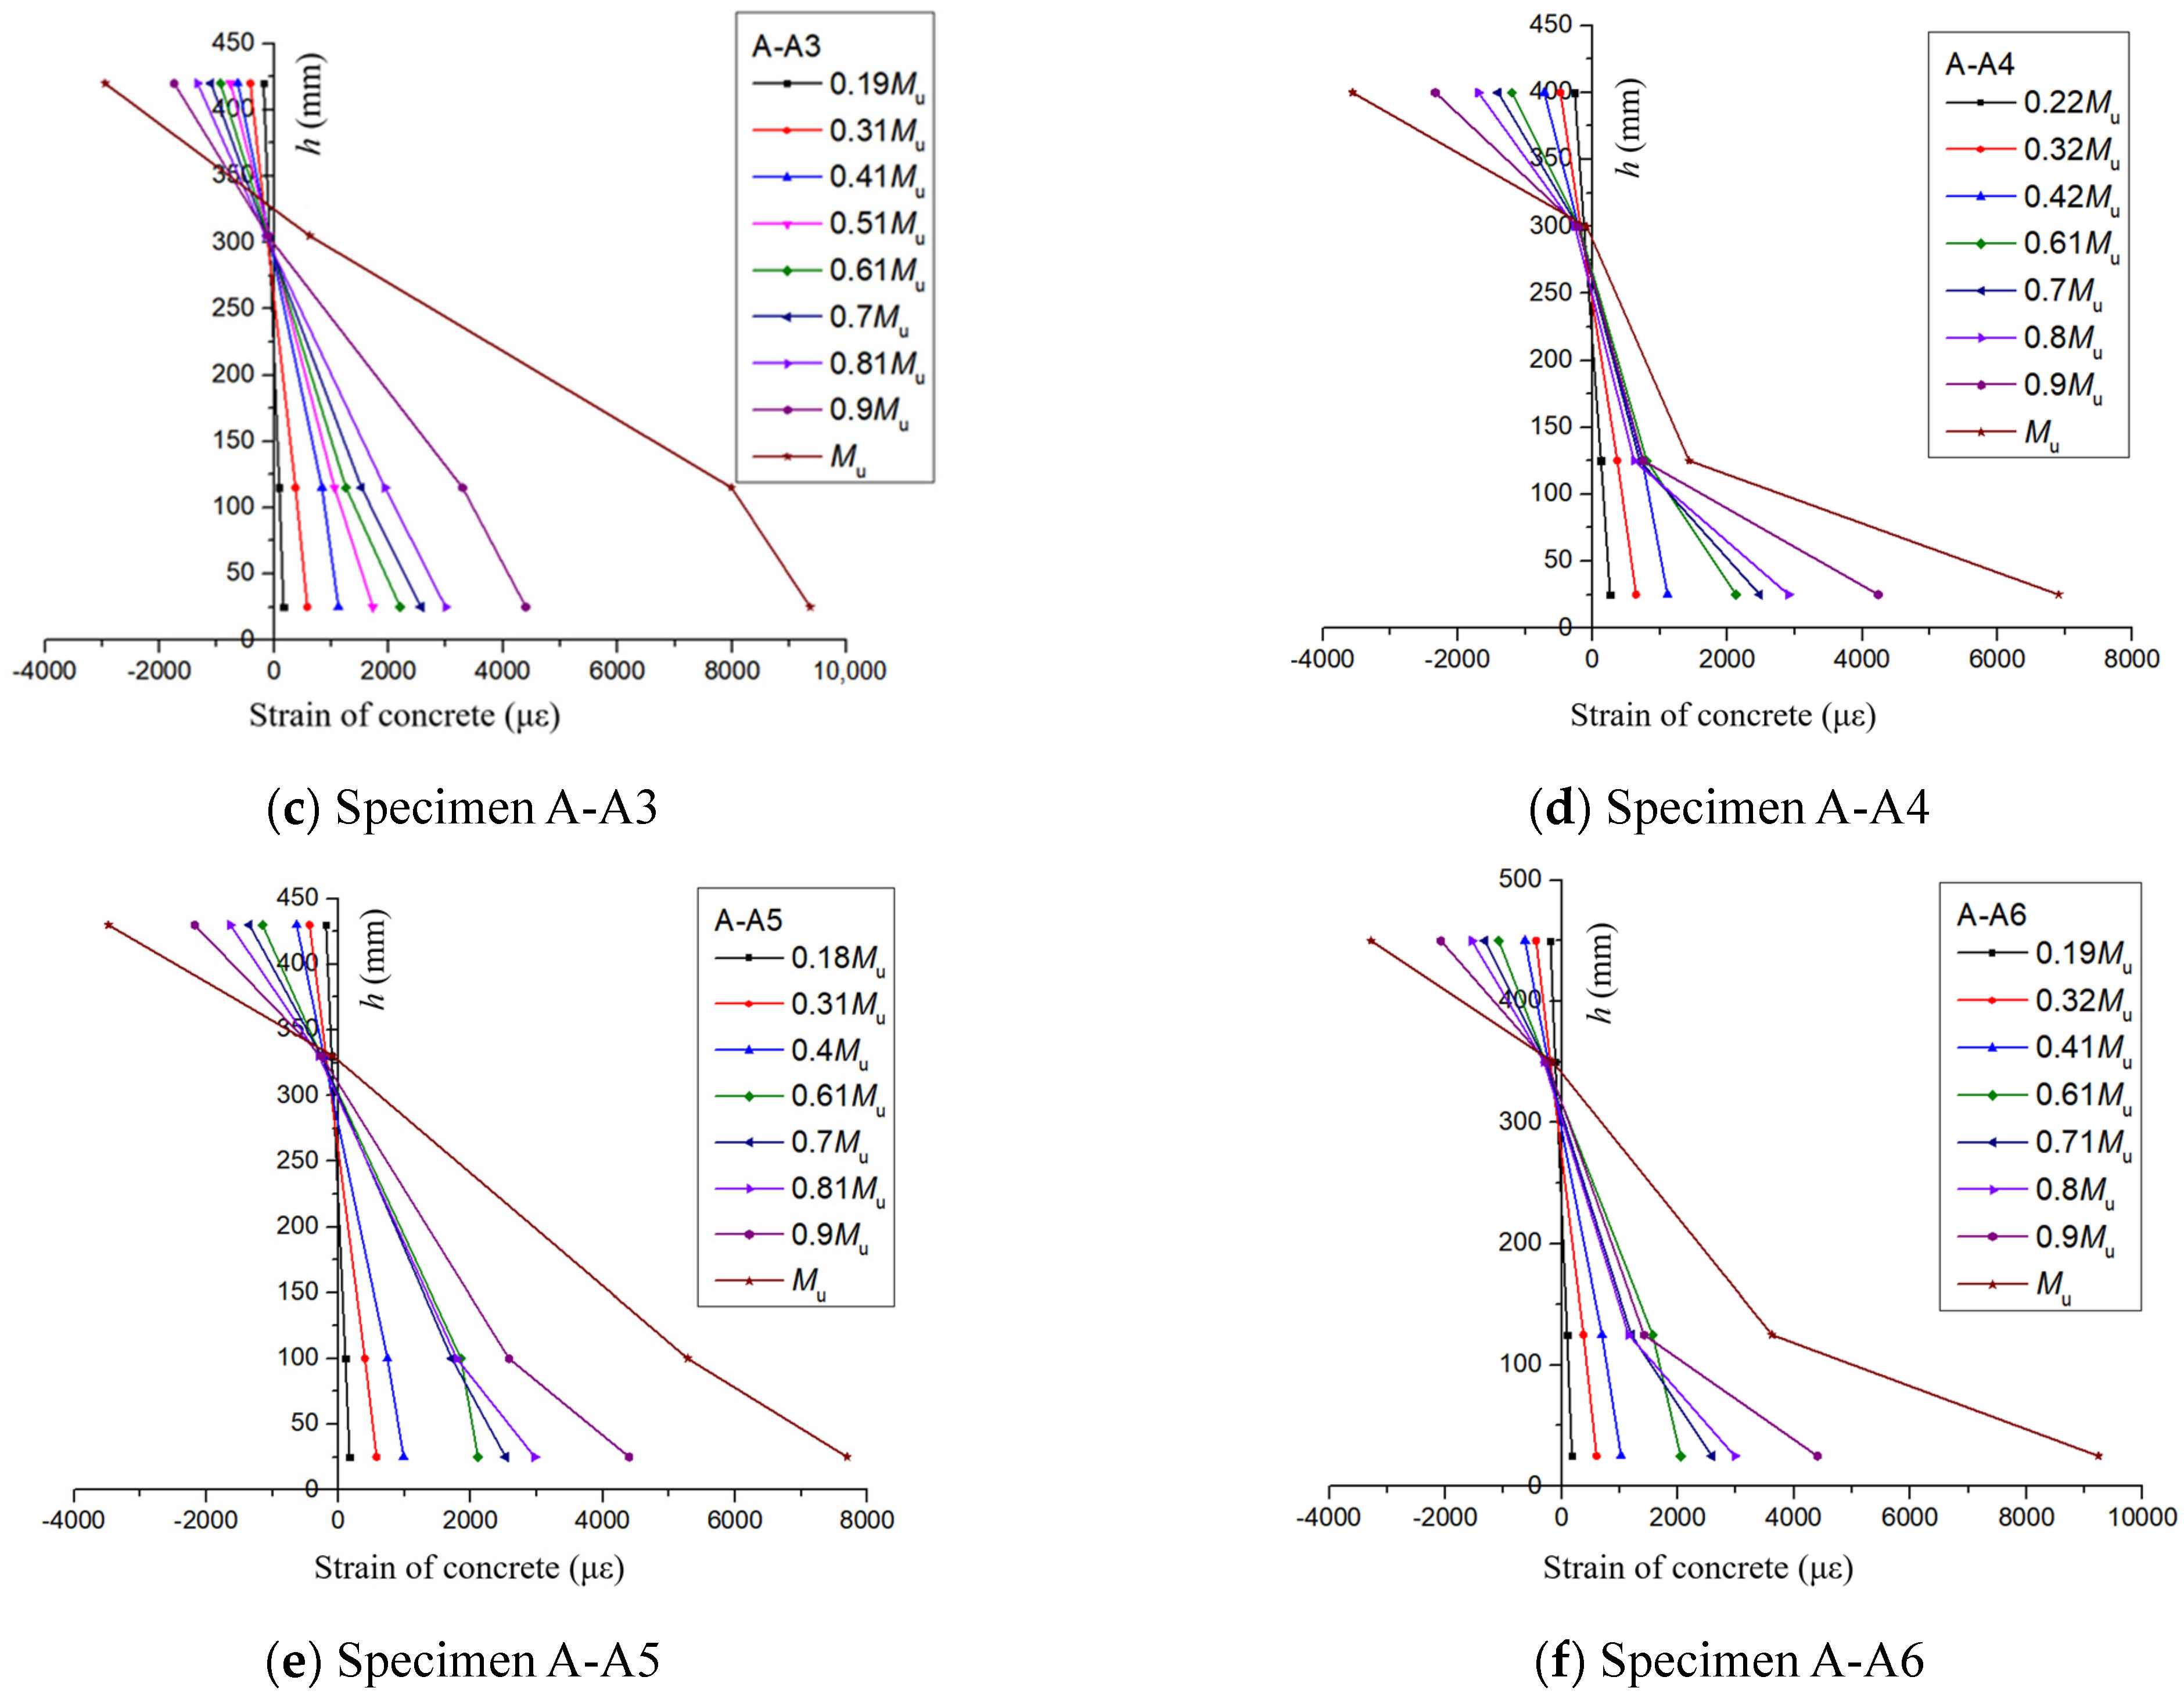
3.2.2. Strain Curve of Concrete
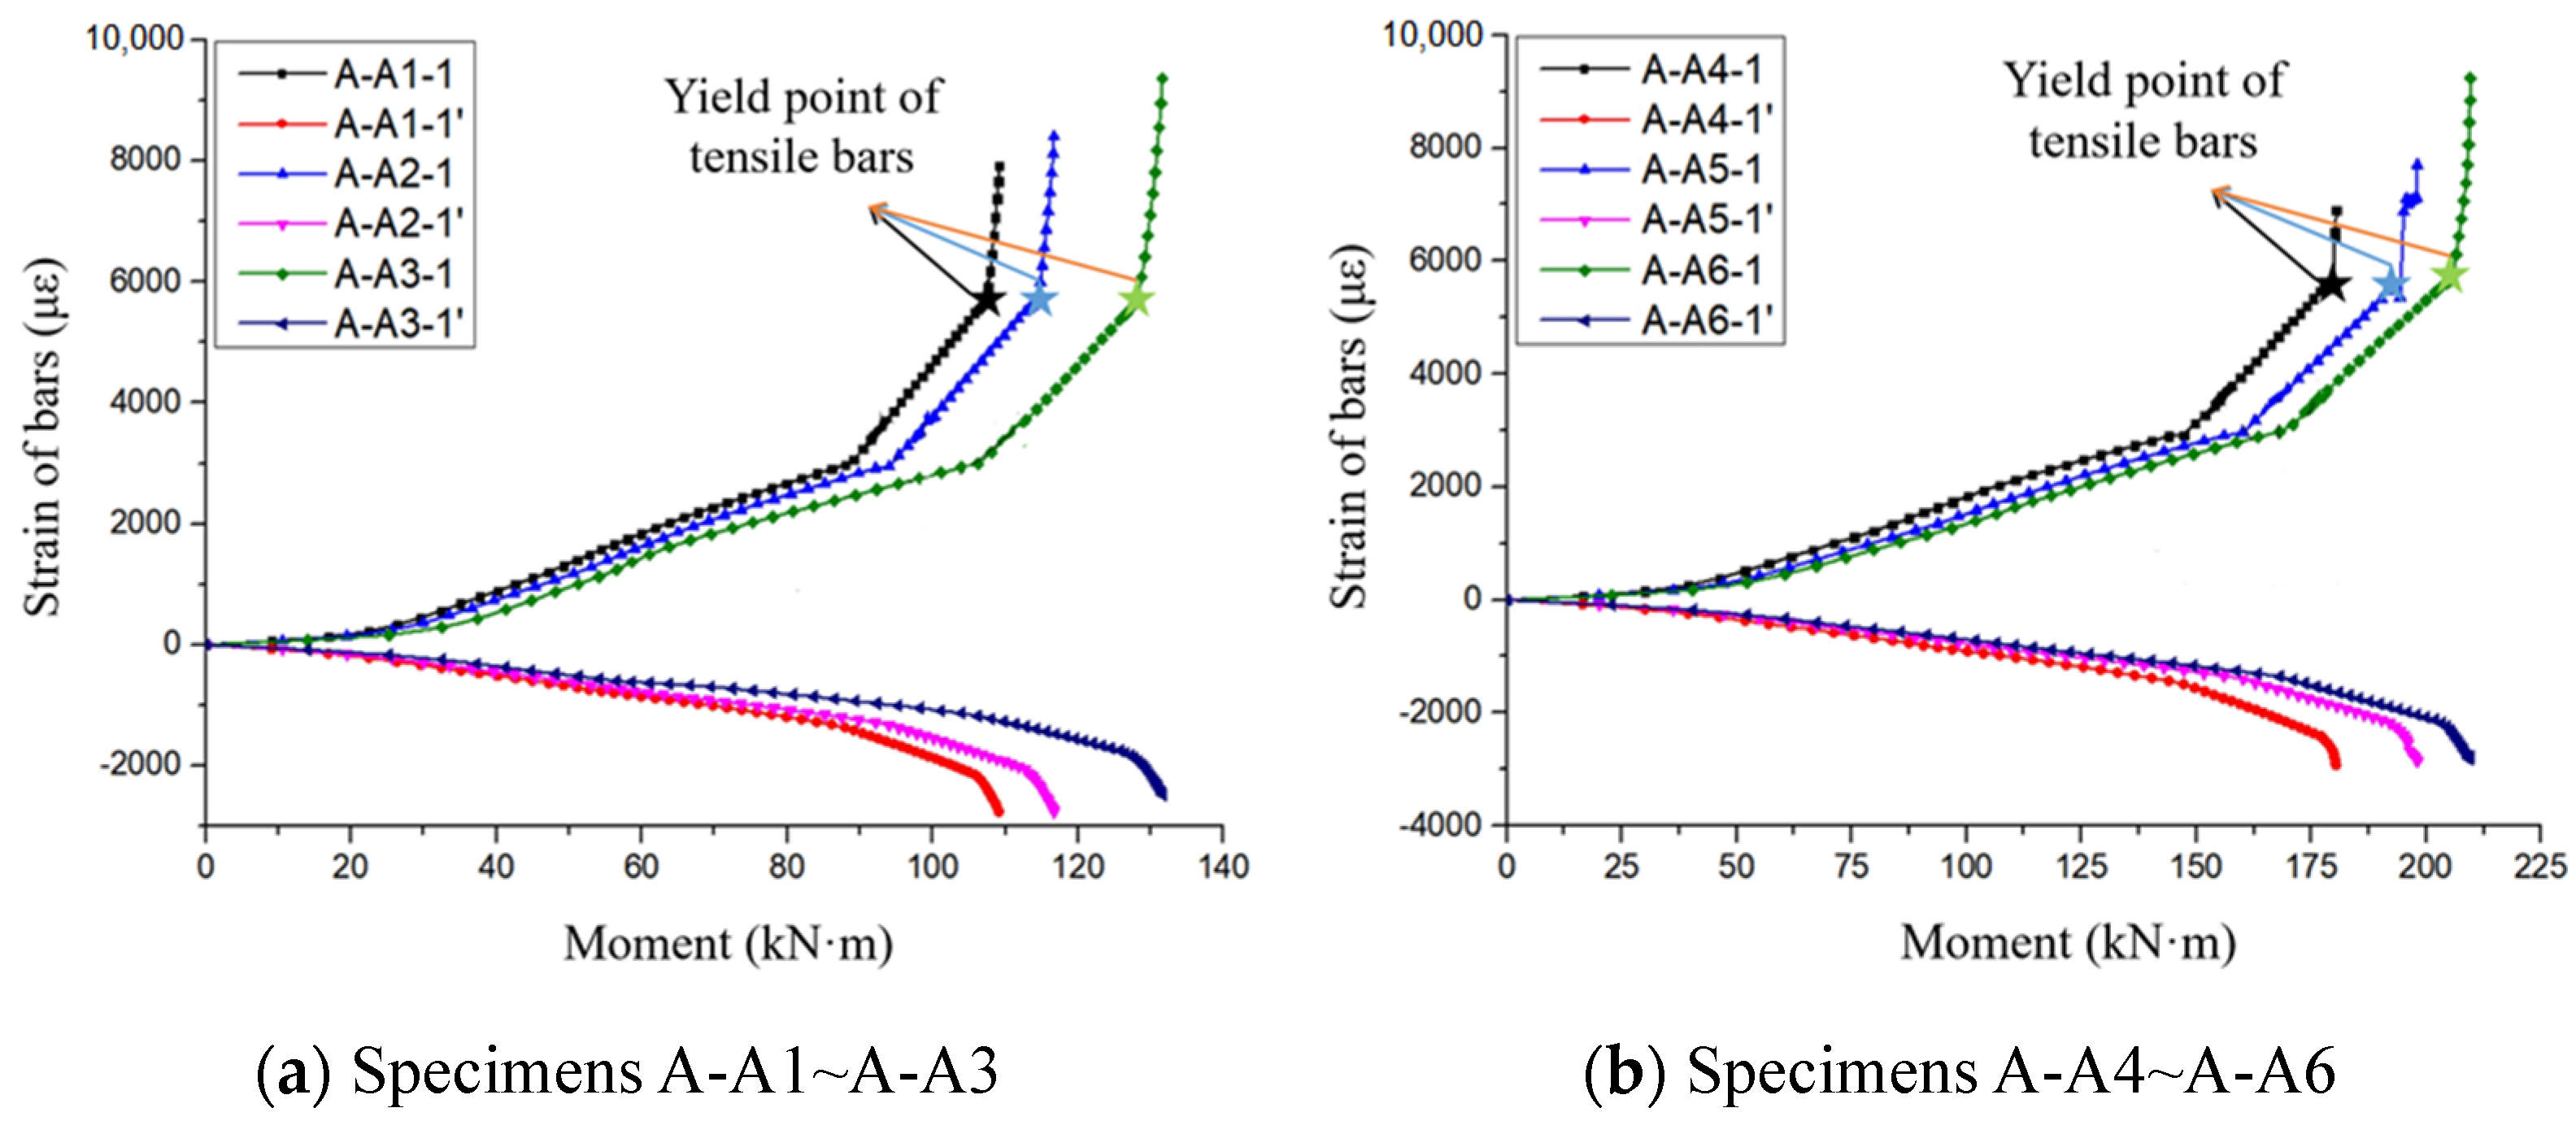
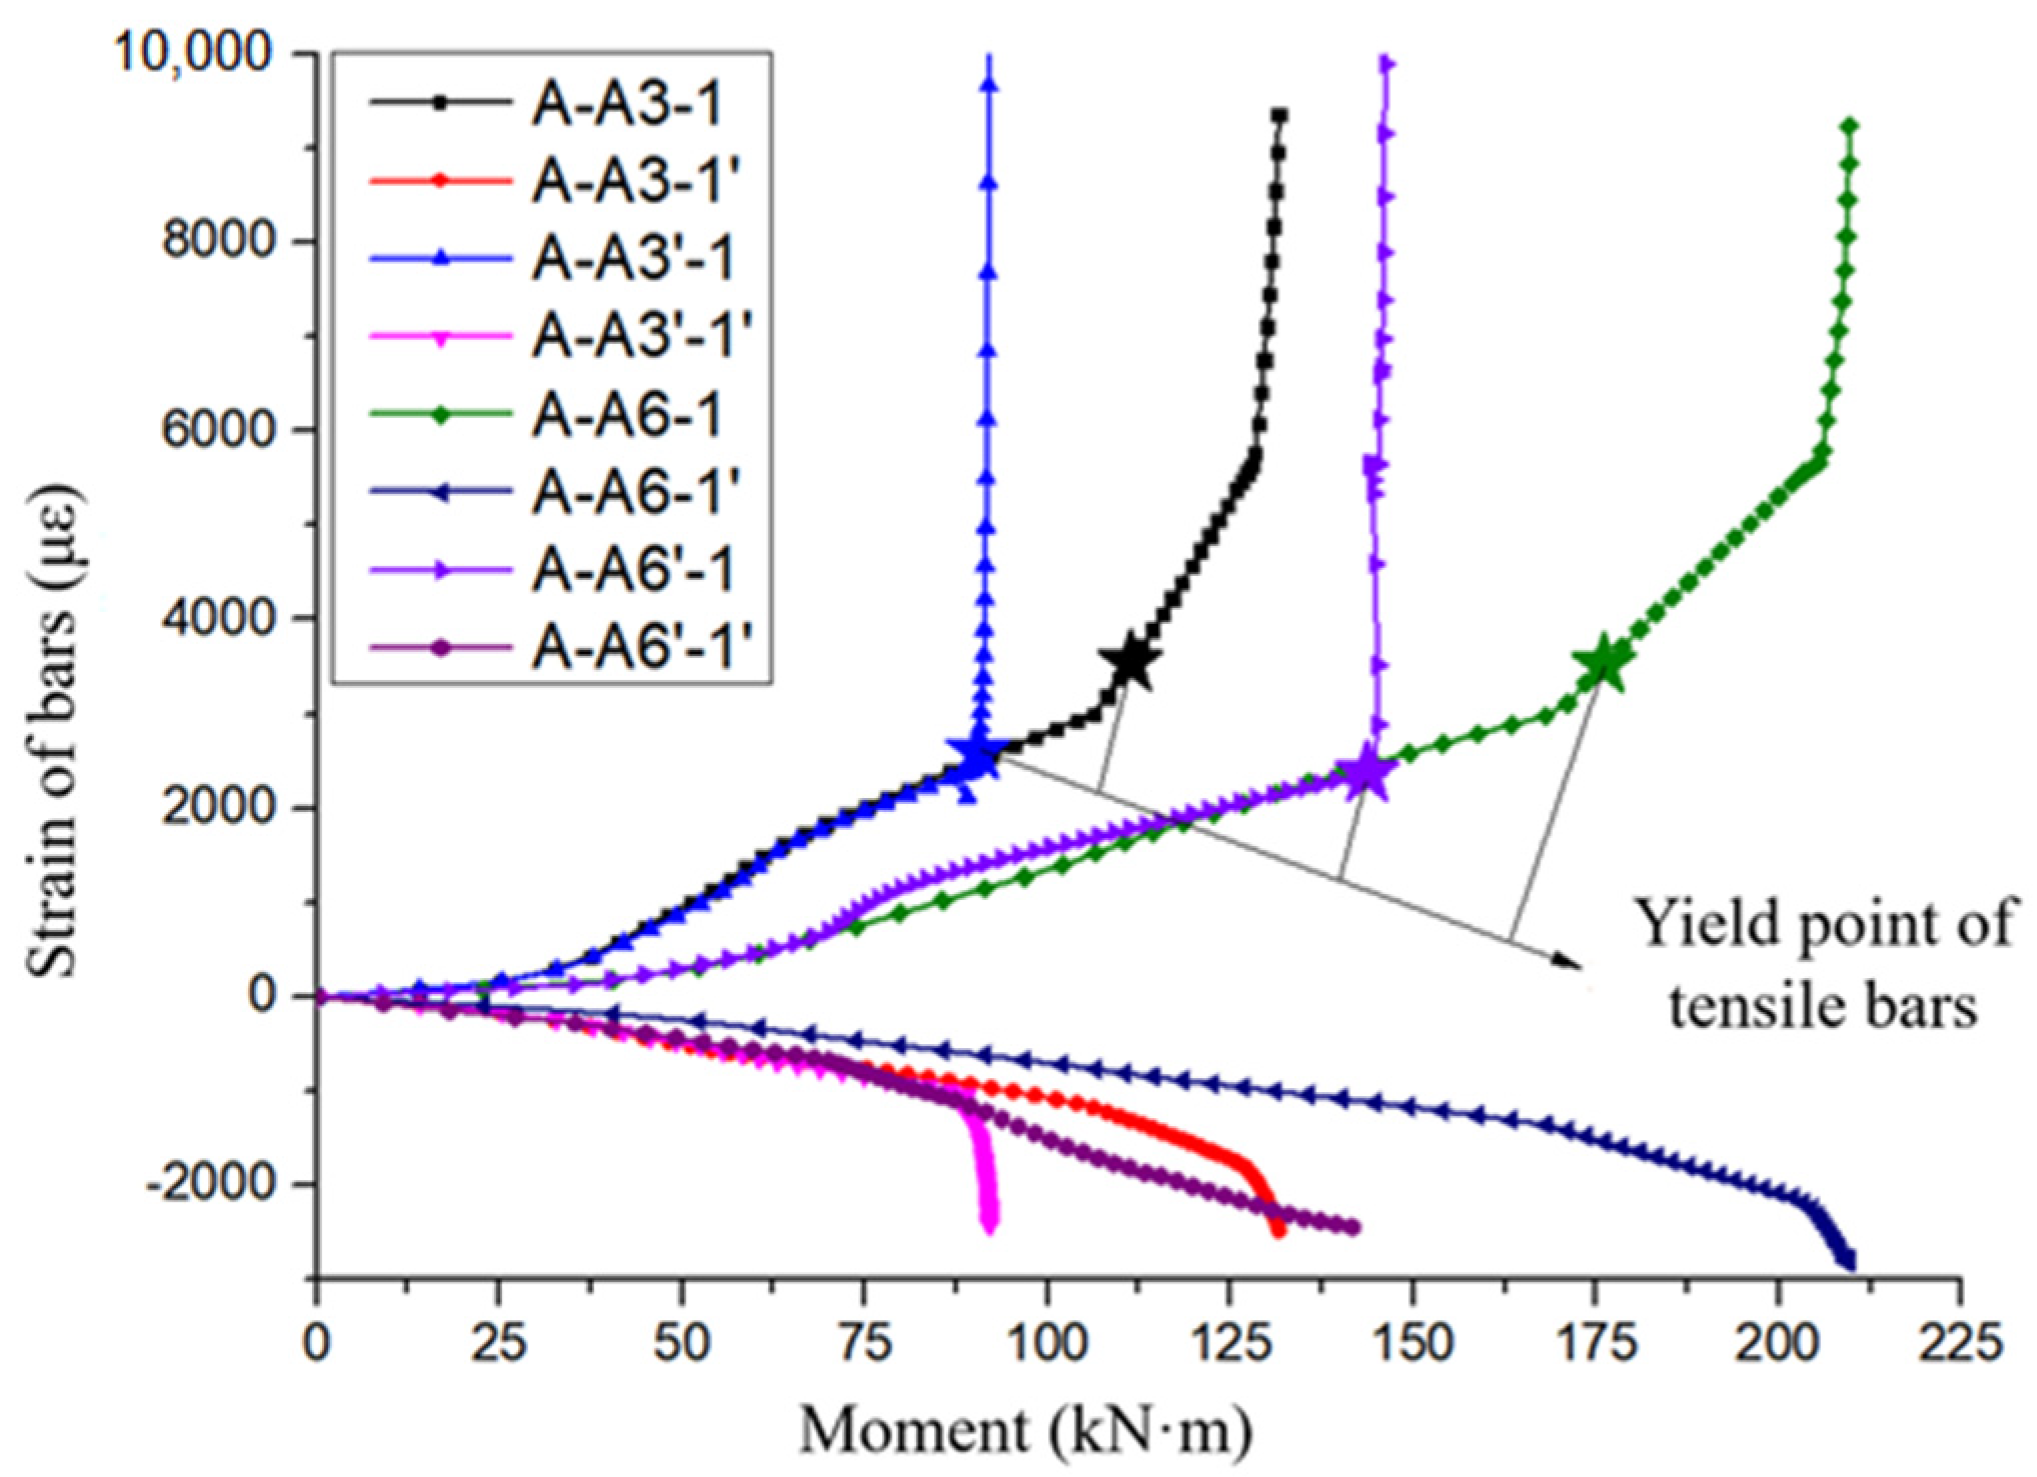
3.2.3. Strain Curve of Steel Bars
4. Theoretical Analysis
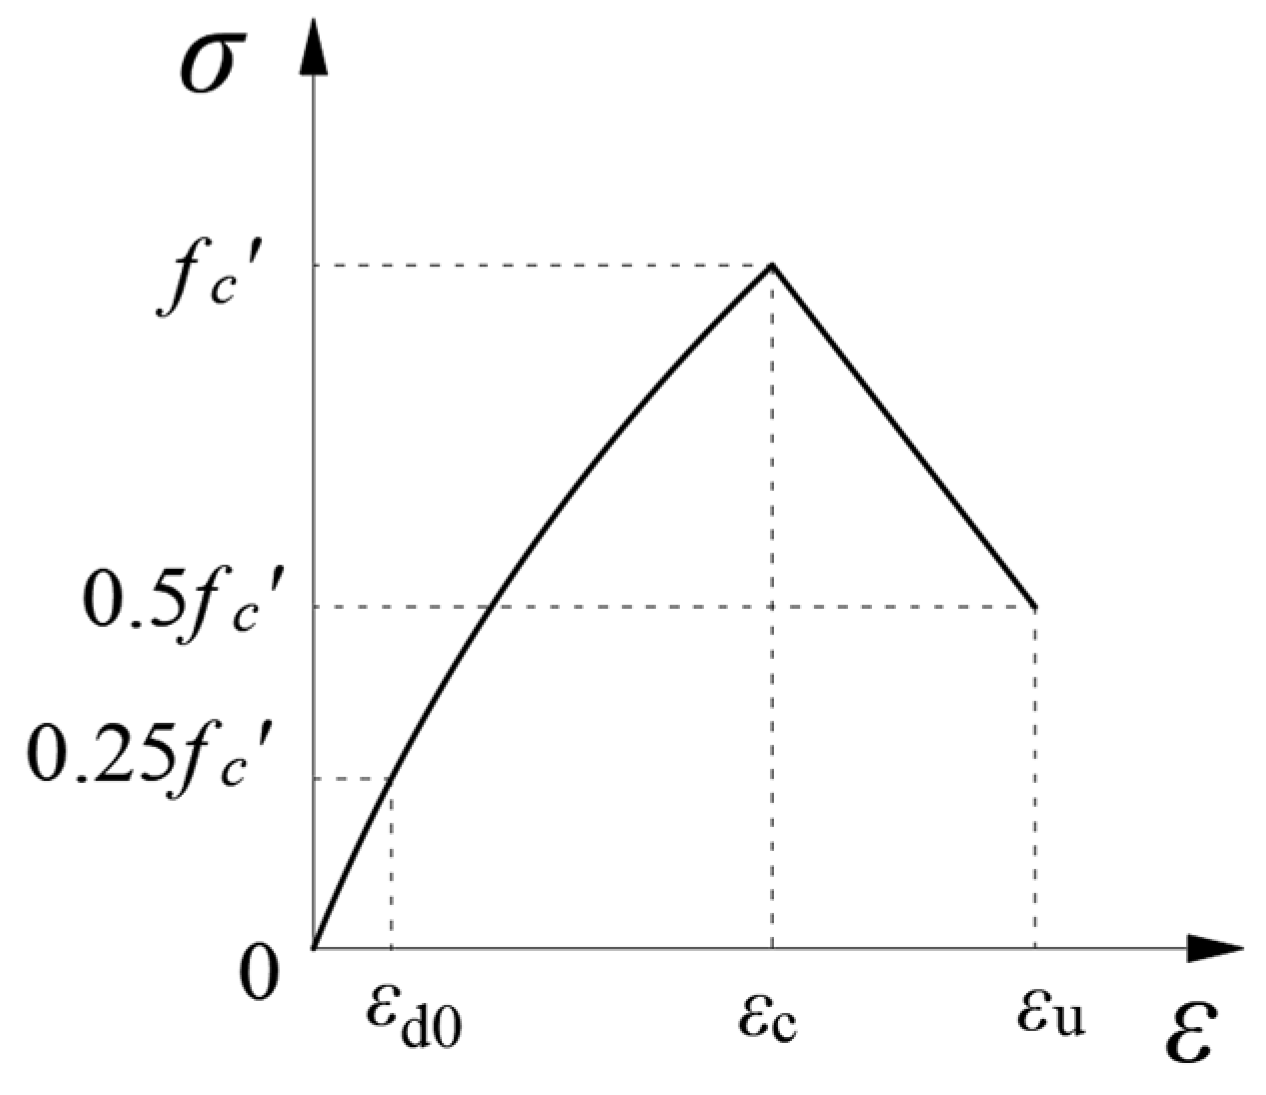
4.1. Basic Assumptions and Constitutive Relation Model
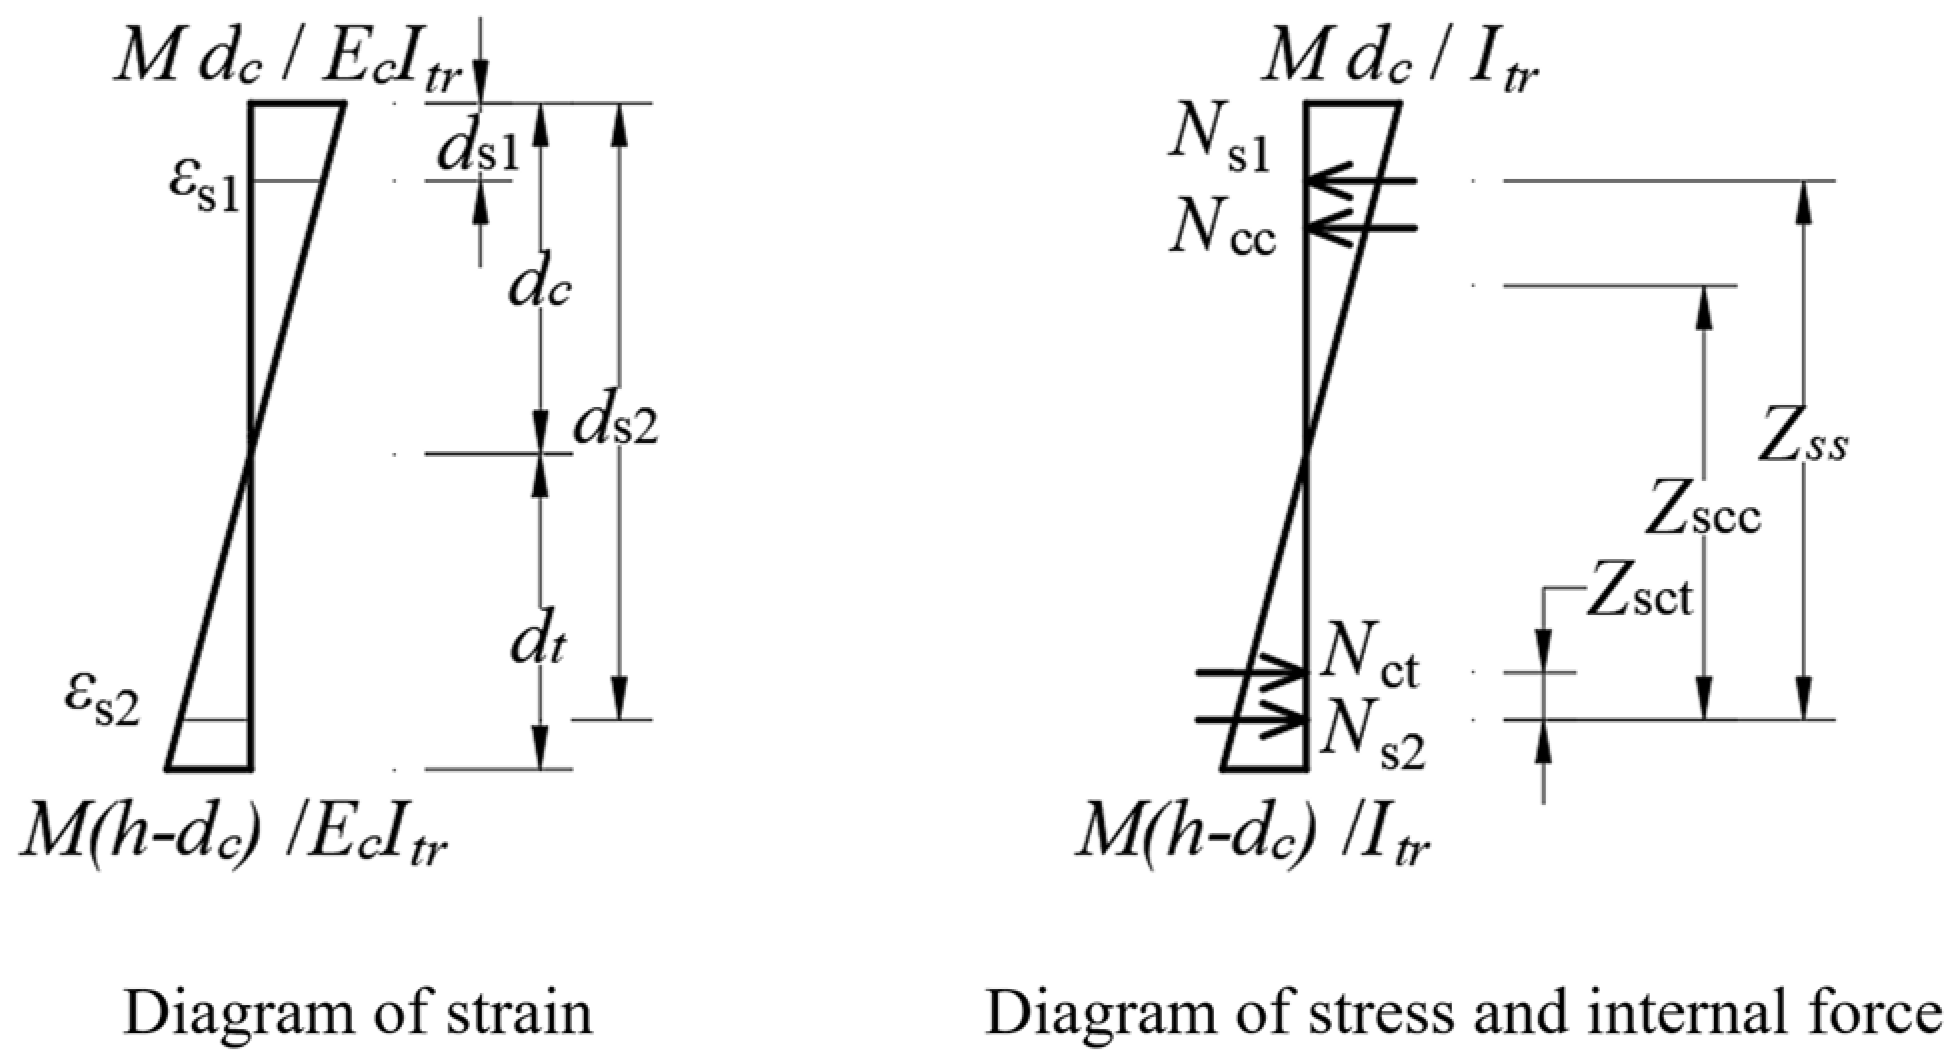
4.2. Analysis of Forces and Deformations in the Linear Elastic Phase
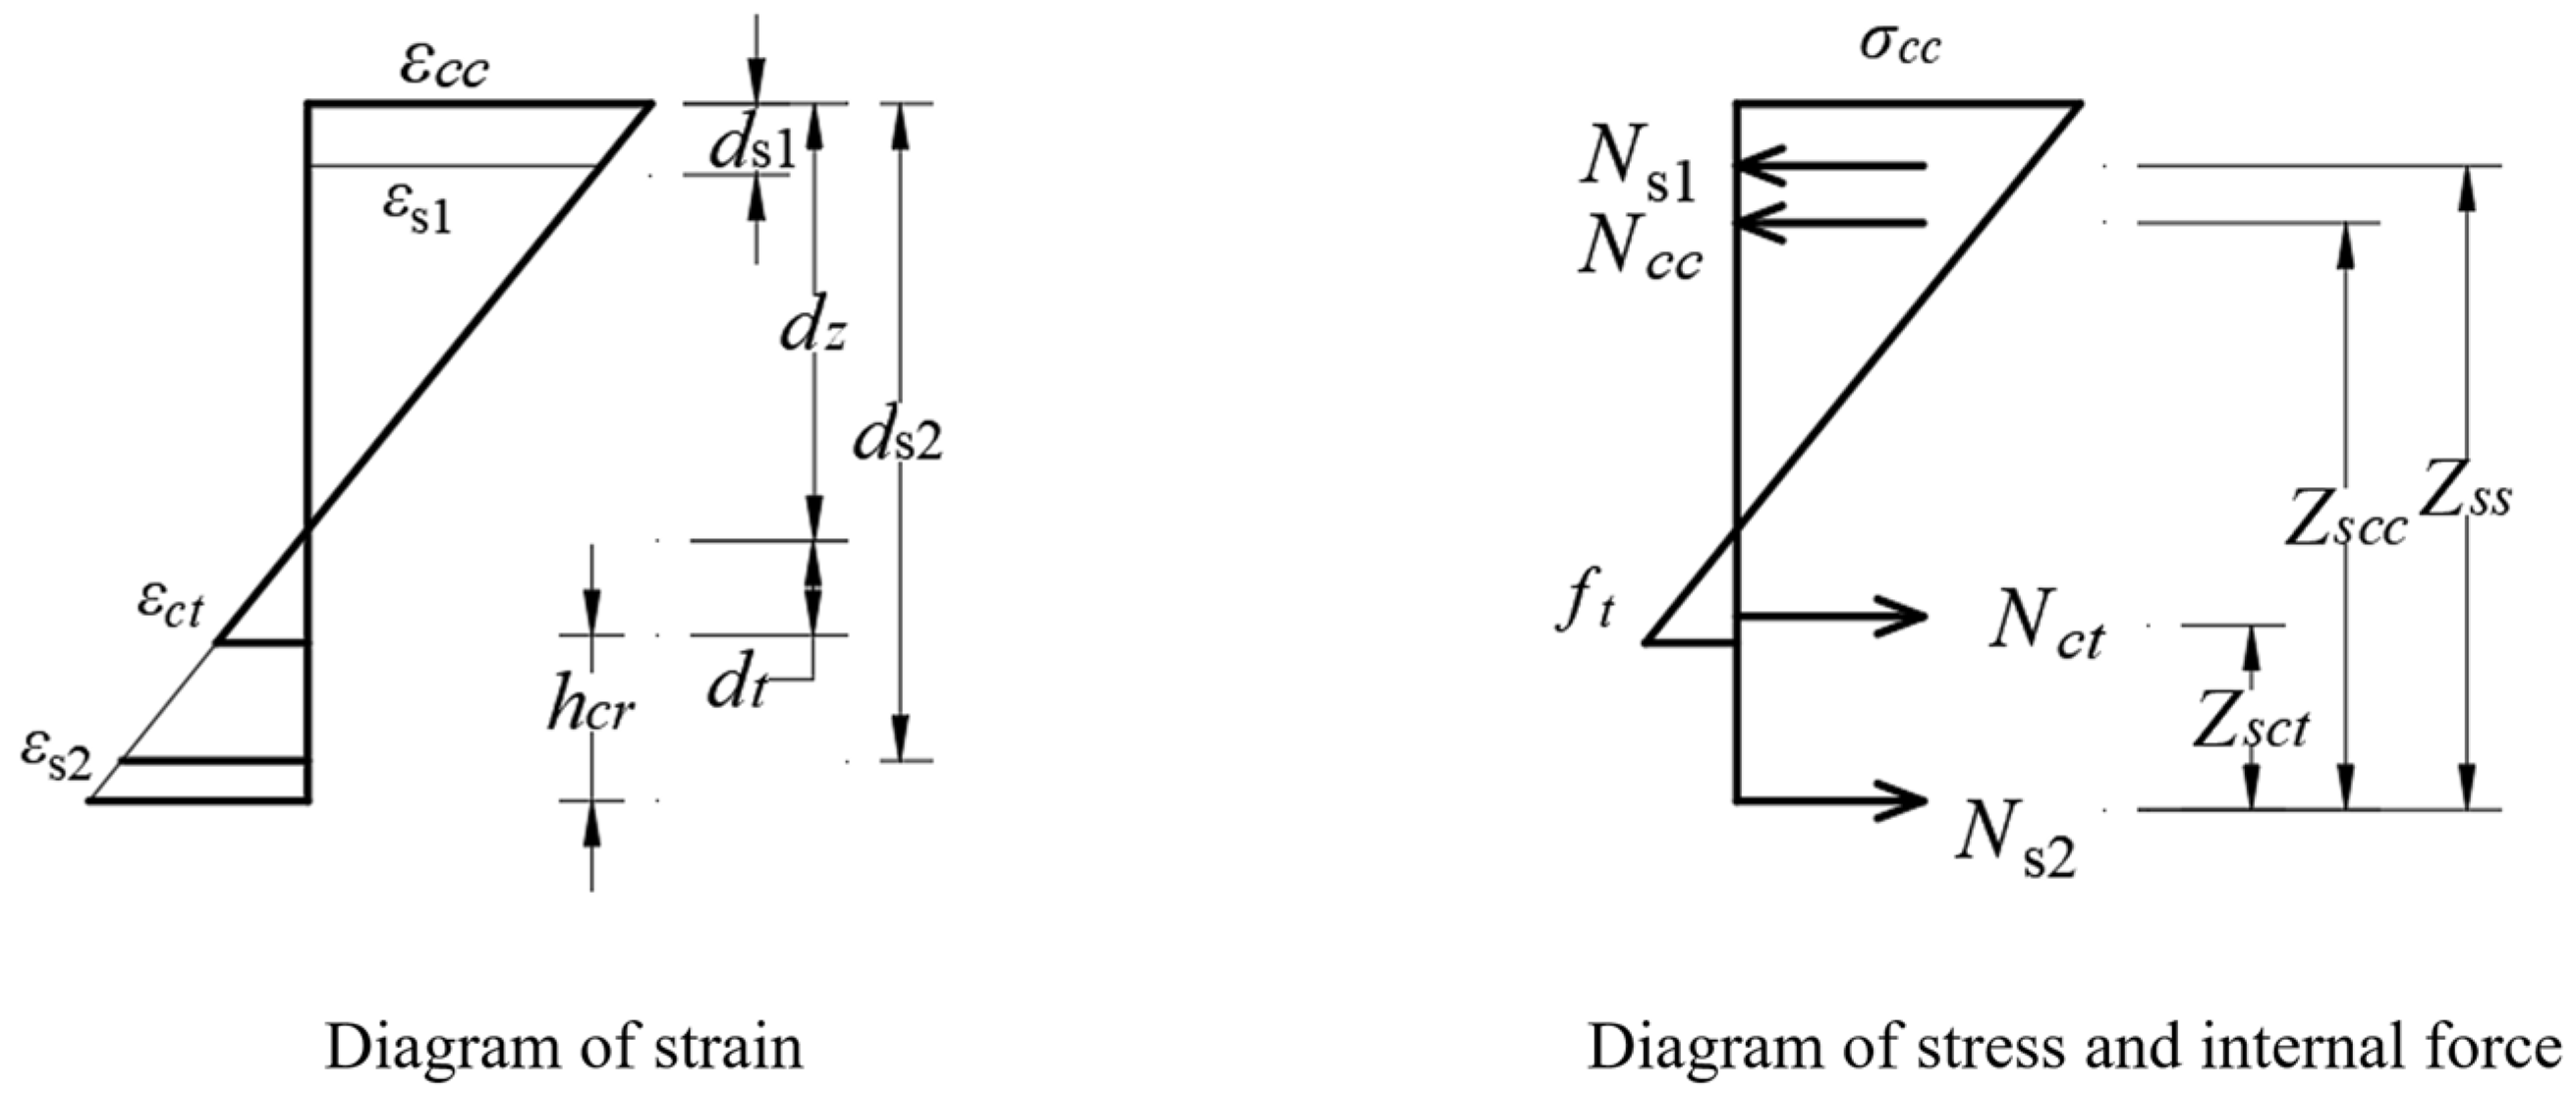
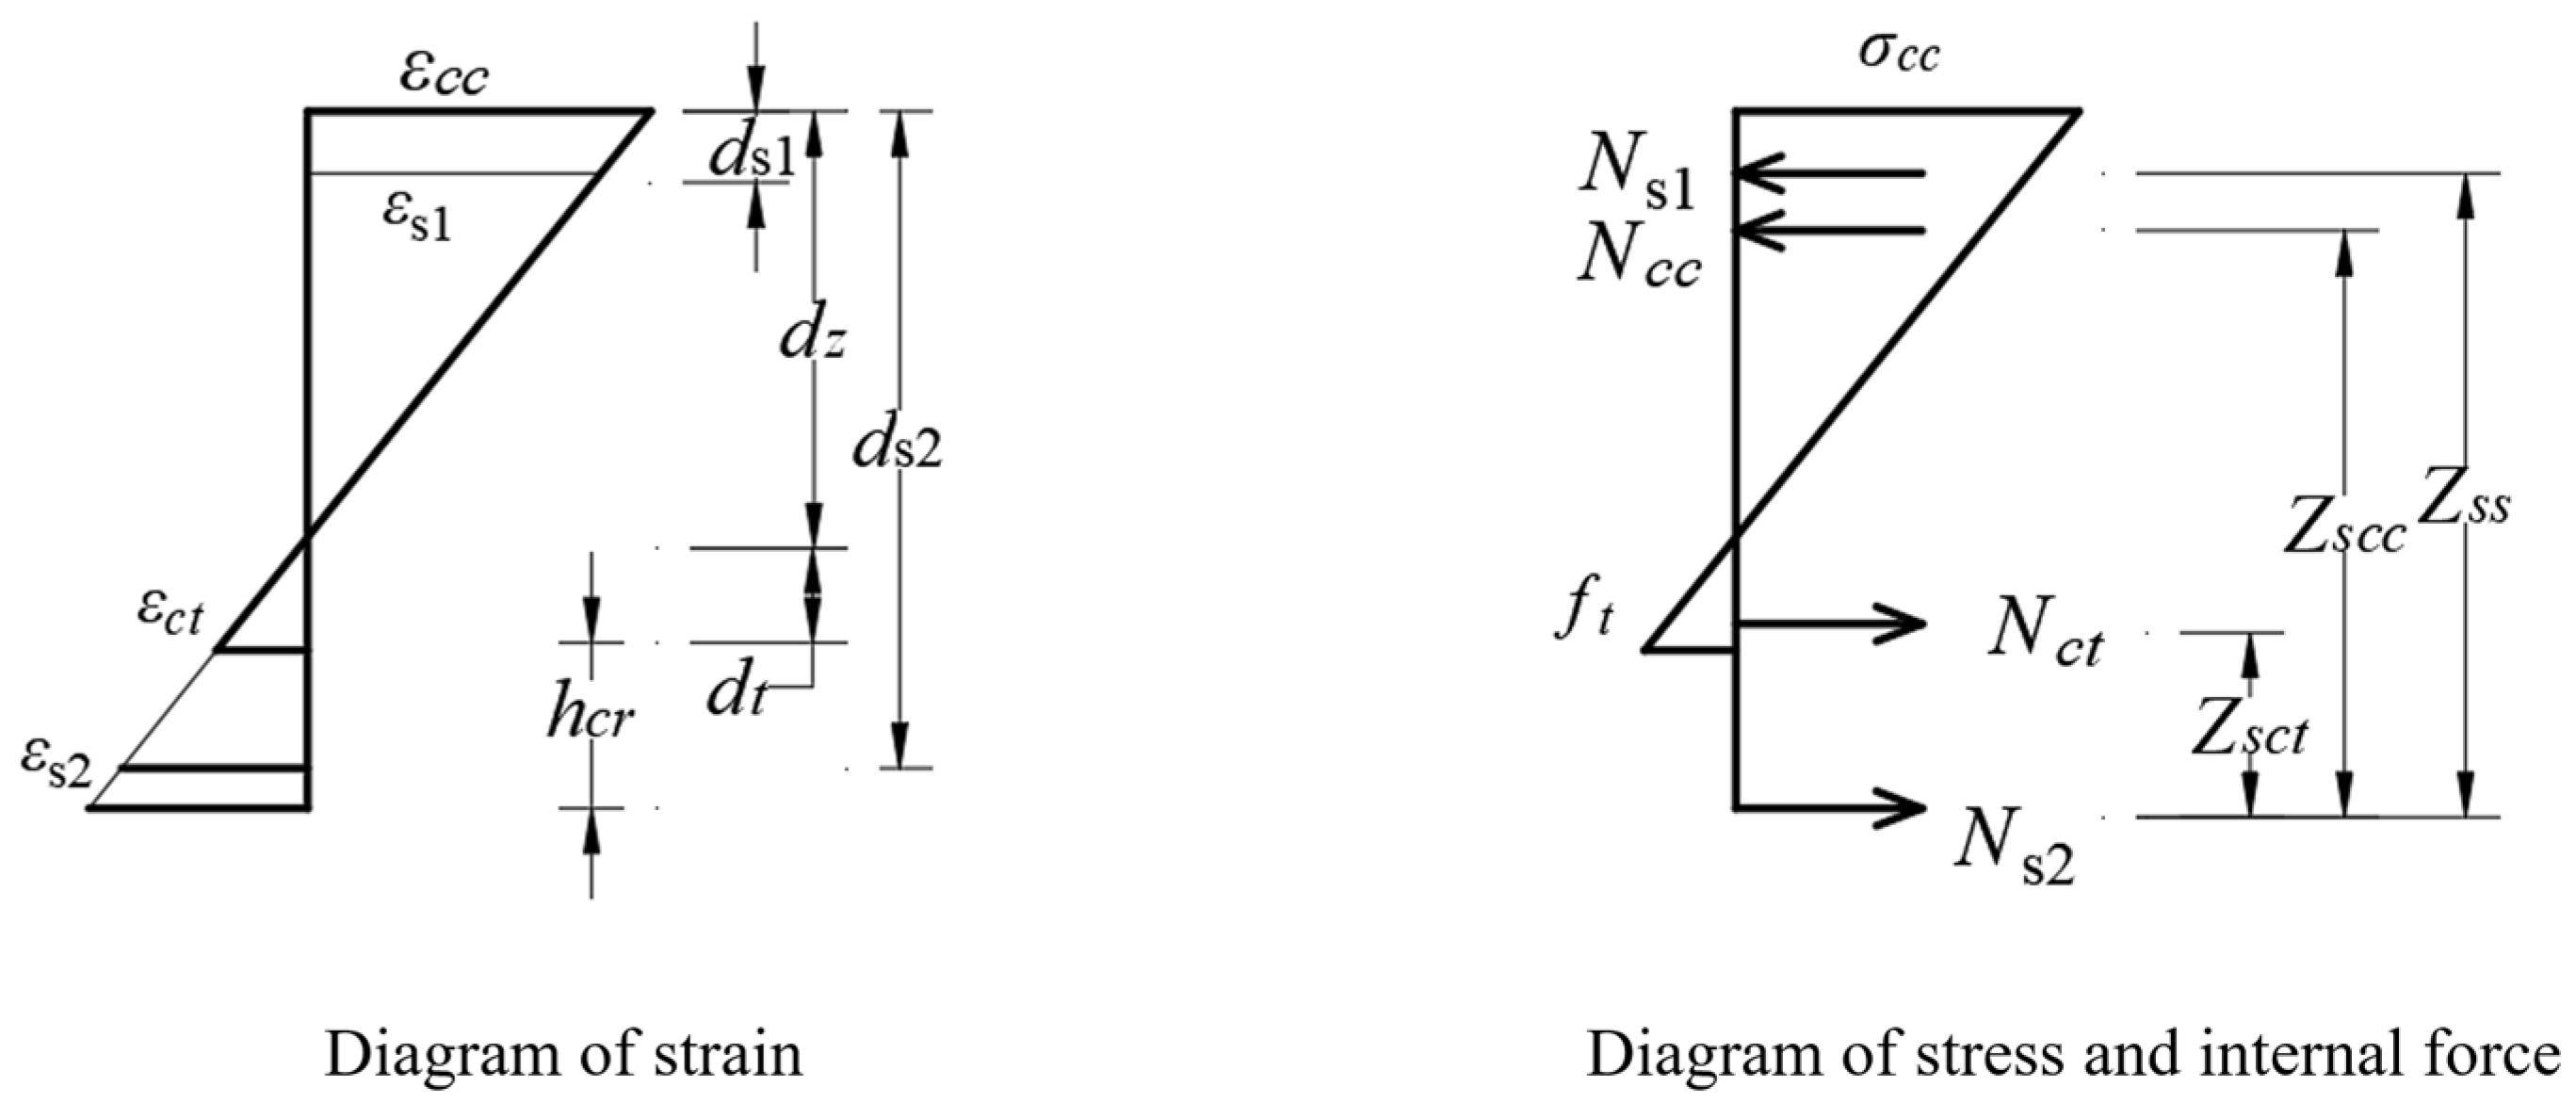
4.3. Analysis of Forces and Deformations during the Working Phase with Cracks
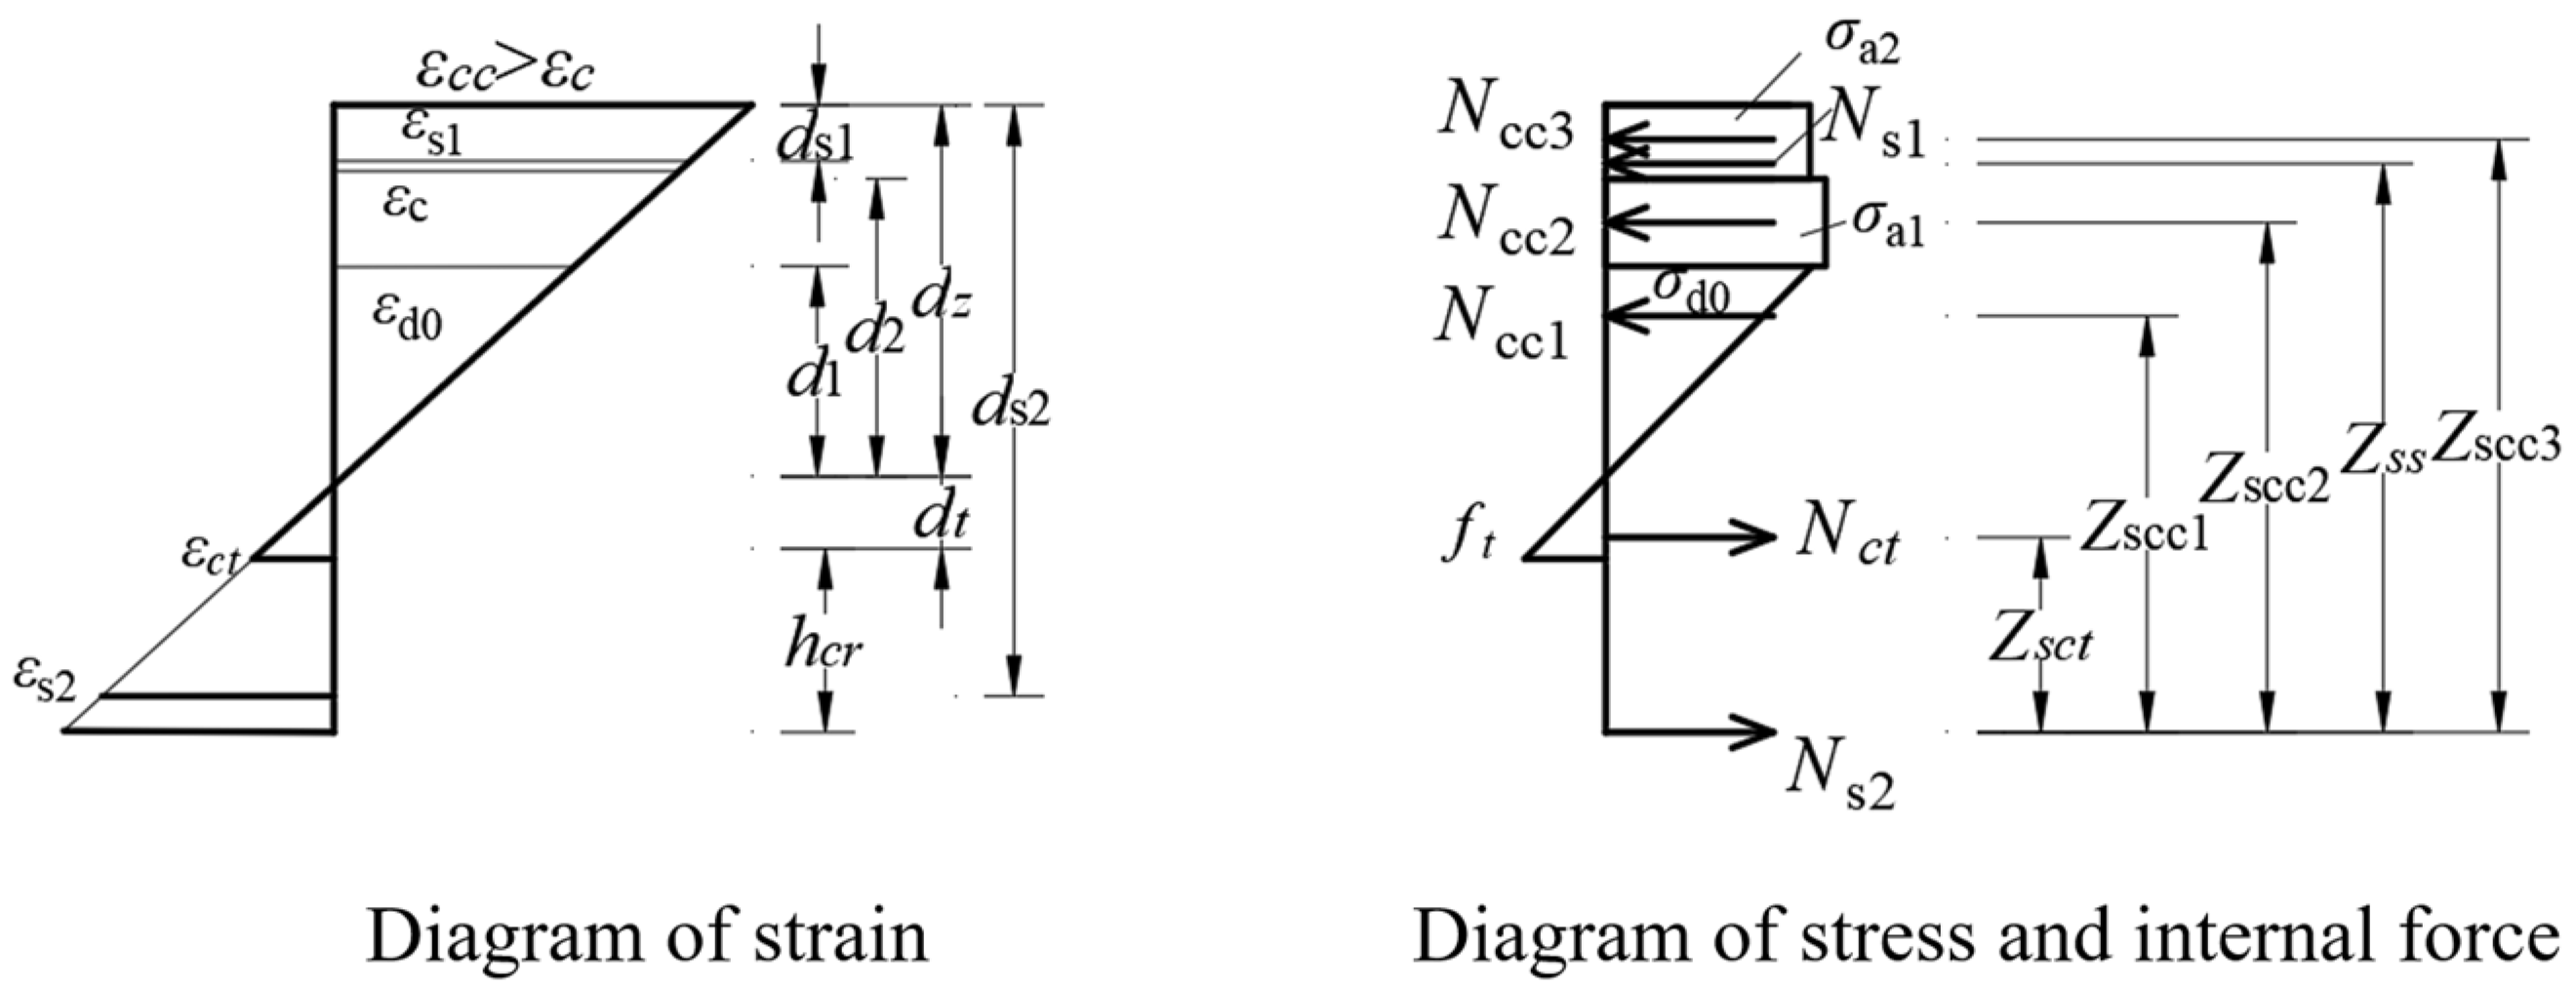
4.4. Analysis of Forces and Deformations in the Extreme Failure Stage
4.5. Theoretical Model Validation
4.6. Application and Discussion
5. Conclusions
- (1)
- When appropriate reinforcement failure occurs, the force characteristics of CRE-reinforced concrete beams are the same as those of ordinary reinforced concrete beams, i.e., yielding of tensile reinforcement occurs; the tensile reinforcement yields first at the time of failure, followed by crushing of concrete in the compression zone.
- (2)
- The cracking resistance and load-carrying capacity of CRE-reinforced concrete beams are improved with decreasing shear–span ratio for the same width. For the same shear–span ratio, the cracking and ultimate loads of the specimen with a section height of 420 mm are 67% and 20.58% higher, respectively, than those of the specimen with a section height of 360 mm.
- (3)
- Under the same conditions, the load-carrying capacity of CRE-reinforced concrete beams is higher than that of HRB-reinforced concrete beams, with the former having about 43% higher ultimate load than the latter. In addition, the difference in cracking moments between the two is not significant.
- (4)
- In case of structural failure, CRE reinforcement used as tensile reinforcement can reach its yield strength and utilize its tensile properties, but CRE reinforcement used as compressive reinforcement cannot reach its yield strength.
- (5)
- Comparison of measured and theoretical values of forces and deformations of each member at the critical stage shows that the calculation method proposed in this paper for the bending performance of CRE-reinforced concrete beams can calculate the mechanical response of such members efficiently and safely, and the results of the calculations have good accuracy. Through theoretical analysis, prioritizing increasing the area of tensile CRE reinforcement and reinforcing the concrete at the top can enhance the load-carrying capacity of the structure.
Author Contributions
Funding
Data Availability Statement
Acknowledgments
Conflicts of Interest
References
- Zhou, Y.; Hu, D.; Wang, T.; Tian, H.; Gan, L. Decoupling effect and spatial-temporal characteristics of carbon emissions from construction industry in China. J. Clean. Prod. 2023, 419, 138243. [Google Scholar] [CrossRef]
- Zhang, X.; Ding, Y.; Wang, X.; Sun, L. Study on eccentric compressive behavior of concrete columns reinforced with CRE735 high-strength steel bars. Buildings 2023, 13, 188. [Google Scholar] [CrossRef]
- Zhang, X.; Han, F.; Wang, X.; Sun, L.; Wang, Q.; Wang, P. Research on seismic performance of 735 MPa high-strength reinforced concrete frame joints. Buildings 2023, 13, 320. [Google Scholar] [CrossRef]
- En, L.K.; Rahiman, N.A.; Othman, N.; Ali, K.N.; Wah, L.Y.; Moayedi, F.; Dzahir, M.A.M. Quantification process of carbon emissions in the construction industry. Energy Build. 2023, 289, 113025. [Google Scholar]
- Zhao, J.; Jiang, Y.; Li, X. Flexural behavior of concrete beams reinforced with high-strength steel bars after exposure to elevated temperatures. Constr. Build. Mater. 2023, 382, 131317. [Google Scholar] [CrossRef]
- Fu, T.; Zhu, Z.; Li, Y.; Xu, L.; Sun, Y.; Sun, Y.; Meng, L.; Sun, Z. Restoring force model of hollow prefabricated square pier with grouted sleeves connection and high-strength steel bars. Soil Dyn. Earthq. Eng. 2023, 169, 107868. [Google Scholar] [CrossRef]
- GB 50010-2010; Code for Design of Concrete Structures. Standards Press of China: Beijing, China, 2010. (In Chinese)
- Li, Y.; Li, S.; Qiao, J.; Pan, J. Experimental research on bond behaviour between high-strength steel bars and ultra-high-performance fibre-reinforced concrete. Structures 2023, 50, 859–869. [Google Scholar] [CrossRef]
- EN 1992-2:2004; Eurocode 2: Design of Concrete Structures. British Standard: London, UK, 2004.
- American Concrete Institute (ACI). Building Code Requirements for Structural Concrete (ACI 318-19) and Commentary (ACI 318R-19); American Concrete Institute: Farmington Hills, MI, USA, 2019. [Google Scholar]
- Zhang, Y.; Xiong, X.; Liang, Y.; He, M. Study on flexural behavior of concrete beams reinforced with hybrid high-strength and high-toughness (HSHT) and ordinary steel bars. Eng. Struct. 2023, 285, 115978. [Google Scholar]
- Gao, Y. Auxetic metamaterials and structures. J. Mater. Eng. 2021, 49, 38–47. (In Chinese) [Google Scholar]
- He, M.C.; Li, C.; Gong, W.L.; Wang, J.; Tao, Z. Support principles of CRE bolts/cables and control techniques of large deformation. Chin. J. Rock Mech. Eng. 2016, 35, 1513–1529. [Google Scholar]
- He, M.; Du, S.; Gong, W.; Nie, W. Mechanical characteristics and engineering applications of bolt/cable with negative poisson’s ratio. Mech. Eng. 2022, 44, 75–87. [Google Scholar]
- He, M.; Guo, Z. Mechanical property and engineering application of anchor bolt with constant resistance and large deformation. Chin. J. Rock Mech. Eng. 2014, 33, 1297–1308. [Google Scholar]
- Wang, Q.; Xu, S.; Xin, Z.; He, M.; Wei, H.; Jiang, B. Mechanical properties and field application of constant resistance energy-absorbing anchor cable. Tunn. Undergr. Space Technol. 2022, 125, 104526. [Google Scholar]
- Wang, Q.; Xu, S.; He, M.; Jiang, B.; Wei, H.; Wang, Y. Dynamic mechanical characteristics and application of constant resistance energy-absorbing supporting material. Int. J. Min. Sci. Technol. 2022, 32, 447–458. [Google Scholar]
- Wang, Q.; He, M.C.; Xu, S.; Xin, Z.X.; Jiang, B.; Wei, H.Y. Mechanical properties and engineering application of constant resistance energy absorbing bolt. J. China Coal Soc. 2022, 47, 3397–3407. [Google Scholar]
- Wang, Q.; Wu, W.; Wang, Y.; He, M.; Xue, H.; Wei, H. Evolution and control mechanism of rockburst in rock anchored by new energy-absorbing material. Rock Mech. Rock Eng. 2023, 56, 4569–4582. [Google Scholar] [CrossRef]
- Jiang, B.; Xin, Z.; Zhang, X.; Deng, Y.; Wang, M.; Li, S.; Ren, W. Mechanical properties and influence mechanism of confined concrete arches in high-stress tunnels. Int. J. Min. Sci. Technol. 2023, 33, 829–841. [Google Scholar] [CrossRef]
- Shao, S.W.; Shang, H.S.; Feng, H.B.; Wang, W.Z. Study on the mechanical properties of NPR steel bars and the bonding properties with marine concrete. Constr. Build. Mater. 2022, 316, 125721. [Google Scholar] [CrossRef]
- Yang, X.; Yuan, H.; Li, C.; Wu, L.; Wang, P.; Liu, Y.; Jiang, B.; Wang, Q.; Zhang, X.; Liu, F.; et al. Experimental studies on behavior of failed CRB750 steel bars reinforced concrete beams retrofitted with steel plate. Eng. Struct. 2021, 243, 112539. [Google Scholar] [CrossRef]
- GB/T 50152-2012; Standard for Test Method of Concrete Structures. Standards Press of China: Beijing, China, 2012. (In Chinese)


| Specimen | Width × Height (mm2) | Shear–Span Ratio λ | Hoop | Longitudinal Bars in Compression Zone | Longitudinal Bars in Tensile Zone |
|---|---|---|---|---|---|
| A-A1 | 150 × 360 | 4.57 | CRE Φ8@100 | CRE 2Φ8 | CRE 2Φ18 |
| A-A2 | 150 × 380 | 4.31 | CRE Φ8@100 | CRE 2Φ8 | CRE 2Φ18 |
| A-A3 | 150 × 420 | 3.87 | CRE Φ8@100 | CRE 2Φ8 | CRE 2Φ18 |
| A-A3′ | 150 × 420 | 3.87 | HRB400 Φ8@100 | HRB400 2Φ8 | HRB400 2Φ18 |
| A-A4 | 200 × 400 | 4.07 | CRE Φ8@100 | CRE 2Φ8 | CRE 3Φ18 |
| A-A5 | 200 × 430 | 3.77 | CRE Φ8@100 | CRE 2Φ8 | CRE 3Φ18 |
| A-A6 | 200 × 450 | 3.59 | CRE Φ8@100 | CRE 2Φ8 | CRE 3Φ18 |
| A-A6′ | 200 × 450 | 3.59 | HRB400 Φ8@100 | HRB400 2Φ8 | HRB400 3Φ18 |
| Material | Diameter (mm) | Yield Strength fy (MPa) | Yield Strain εy (%) | Ultimate Tensile Strength fs,u (MPa) | Ultimate Tensile Strain εs,u (%) | Elastic Modulus Es (GPa) |
|---|---|---|---|---|---|---|
| CRE750 | 8 | 750.2 | 0.568 | 853.6 | 20.34 | 200.90 |
| 18 | 759.8 | 0.580 | 929.7 | 23.10 | 201.45 | |
| HRB400 | 8 | 522.67 | 0.502 | 701.3 | 18.35 | 200.10 |
| 18 | 478.67 | 0.478 | 689.5 | 20.55 | 200.15 |
| Specimen | Measured Cracking Moment Mcr,r (KN·m) | Measured Cracking Deflection ycr,r (mm) | Measured Yield Moment My,r (kN·m) | Measured Yield Deflection yy,r (mm) | Measured Ultimate Moment Mu,r (kN·m) | Measured Ultimate Deflection yu,r (mm) |
|---|---|---|---|---|---|---|
| A-A1 | 12.00 | 0.70 | 93.00 | 19.57 | 109.13 | 22.40 |
| A-A2 | 16.00 | 0.84 | 99.00 | 19.40 | 116.69 | 24.80 |
| A-A3 | 20.00 | 0.61 | 111.00 | 16.00 | 131.59 | 22.20 |
| A-A3′ | 19.00 | 0.74 | 88.00 | 11.00 | 92.02 | 12.95 |
| A-A4 | 24.00 | 0.76 | 156.00 | 17.51 | 180.35 | 24.38 |
| A-A5 | 22.00 | 0.62 | 168.00 | 16.60 | 198.03 | 20.00 |
| A-A6 | 35.00 | 0.79 | 176.00 | 15.00 | 209.60 | 20.00 |
| A-A6′ | 33.00 | 0.77 | 145.00 | 11.00 | 146.69 | 12.00 |
| Specimen | Measured Cracking Moment Mcr,r (kN·m) | Theoretical Cracking Moment Mcr,e (kN·m) | Mcr,e/ Mcr,r | Measured Yield Moment My,r (kN·m) | Theoretical Yield Moment My,e (kN·m) | My,e/ My,r | Measured Ultimate Moment Mu,r (kN·m) | Theoretical Ultimate Moment Mu,e (kN·m) | Mu,e/ Mu,r |
|---|---|---|---|---|---|---|---|---|---|
| A-A1 | 12.00 | 14.52 | 1.21 | 93.00 | 94.50 | 1.02 | 109.13 | 100.66 | 0.92 |
| A-A2 | 16.00 | 16.05 | 1.00 | 99.00 | 100.39 | 1.01 | 116.69 | 120.16 | 1.03 |
| A-A3 | 20.00 | 19.32 | 0.97 | 111.00 | 111.14 | 1.00 | 131.59 | 135.77 | 1.03 |
| A-A3′ | 19.00 | 23.89 | 1.00 | 88.00 | 155.73 | 1.00 | 92.02 | 187.76 | 1.04 |
| A-A4 | 24.00 | 27.31 | 1.24 | 156.00 | 170.48 | 1.01 | 180.35 | 205.32 | 1.04 |
| A-A5 | 22.00 | 29.71 | 0.85 | 168.00 | 178.19 | 1.01 | 198.03 | 217.00 | 1.04 |
| A-A6 | 35.00 | 19.30 | 1.02 | 176.00 | 91.62 | 1.04 | 209.60 | 92.21 | 1.00 |
| A-A6′ | 33.00 | 29.67 | 0.90 | 145.00 | 148.49 | 1.02 | 146.69 | 148.65 | 1.01 |
| Average value | 1.02 | 1.02 | 1.01 | ||||||
| Variation coefficient | 0.133 | 0.012 | 0.040 |
| Specimen | Measured Cracking Deflection ycr,r (mm) | Theoretical Cracking Deflection ycr,e (mm) | ycr,e/ ycr,r | Measured Yield Deflection yy,r (mm) | Theoretical Yield Deflection yy,e (mm) | yy,e/ yy,r | Measured Ultimate Deflection yu,r (mm) | Theoretical Ultimate Deflection yu,e (mm) | yu,e/ yu,r |
|---|---|---|---|---|---|---|---|---|---|
| A-A1 | 0.97 | 0.70 | 1.39 | 17.96 | 19.57 | 0.92 | 19.15 | 22.40 | 0.86 |
| A-A2 | 0.92 | 0.84 | 1.10 | 16.83 | 19.40 | 0.87 | 20.21 | 24.80 | 0.81 |
| A-A3 | 0.83 | 0.61 | 1.36 | 14.79 | 16.00 | 0.92 | 18.15 | 22.20 | 0.82 |
| A-A3′ | 0.88 | 0.76 | 1.15 | 15.96 | 17.51 | 0.91 | 19.30 | 24.38 | 0.79 |
| A-A4 | 0.82 | 0.62 | 1.33 | 14.79 | 16.60 | 0.89 | 17.87 | 20.00 | 0.89 |
| A-A5 | 0.78 | 0.79 | 0.98 | 13.92 | 15.00 | 0.93 | 17.02 | 20.00 | 0.85 |
| A-A6 | 0.83 | 0.74 | 1.12 | 12.16 | 11.00 | 1.11 | 12.40 | 12.95 | 0.96 |
| A-A6′ | 0.78 | 0.77 | 1.01 | 11.59 | 11.00 | 1.05 | 11.67 | 12.00 | 0.97 |
| Average value | 1.18 | 0.95 | 0.87 | ||||||
| Variation coefficient | 0.135 | 0.09 | 0.077 |
Disclaimer/Publisher’s Note: The statements, opinions and data contained in all publications are solely those of the individual author(s) and contributor(s) and not of MDPI and/or the editor(s). MDPI and/or the editor(s) disclaim responsibility for any injury to people or property resulting from any ideas, methods, instructions or products referred to in the content. |
© 2023 by the authors. Licensee MDPI, Basel, Switzerland. This article is an open access article distributed under the terms and conditions of the Creative Commons Attribution (CC BY) license (https://creativecommons.org/licenses/by/4.0/).
Share and Cite
Zhang, X.; Sun, Y.; Yang, X.; Sun, L.; Wang, P. Study on the Bending Performance of High-Strength and High-Ductility CRE-Reinforced Concrete Beams. Buildings 2023, 13, 2746. https://doi.org/10.3390/buildings13112746
Zhang X, Sun Y, Yang X, Sun L, Wang P. Study on the Bending Performance of High-Strength and High-Ductility CRE-Reinforced Concrete Beams. Buildings. 2023; 13(11):2746. https://doi.org/10.3390/buildings13112746
Chicago/Turabian StyleZhang, Xiao, Youkun Sun, Xiaoxia Yang, Lele Sun, and Peijun Wang. 2023. "Study on the Bending Performance of High-Strength and High-Ductility CRE-Reinforced Concrete Beams" Buildings 13, no. 11: 2746. https://doi.org/10.3390/buildings13112746