Article

Seismic Performance of Rectangular Hollow Section X-Joints Subjected to In-Plane Bending Moment

1
College of Civil Engineering, Zhejiang University of Technology, Hangzhou 310023, China
2
Zhejiang Key Laboratory of Civil Engineering Structures & Disaster Prevention and Mitigation Technology, Hangzhou 310023, China
*
Author to whom correspondence should be addressed.
Buildings 2023, 13(10), 2503; https://doi.org/10.3390/buildings13102503
Submission received: 29 June 2023 / Revised: 4 August 2023 / Accepted: 9 August 2023 / Published: 2 October 2023
(This article belongs to the Special Issue Advances in Steel Structures: Testing, Modelling and Design)

Abstract

:
This paper presents a study on the seismic performance of rectangular hollow section (RHS) X-joints subjected to in-plane bending moment (IPBM). The study began by testing two RHS joint specimens with varying brace-to-chord width ratios (β) under quasi-static cyclic IPBM loading. The results showed that the final failure mode of the specimen with the large β value (β = 1.0) is the tearing of the weld near the brace root, while the specimen with the medium β value (β = 0.83) failed due to the tearing of both the weld and the adjacent chord face. The seismic performance of the X-joints depended considerably on the β value. The increase in β remarkably improved the strength of the X-joints but at the cost of energy dissipation capability, deformability and ductility. Our experimental results also demonstrated that the current code equations remarkably underestimate the flexural strength of RHS X-joints, while the modified equations that take the weld size into account can predict it well. In addition, the reason behind the experimental observation can be further explained by FE analysis and the proposed elastic-support plate analytical model.

1. Introduction

Unstiffened rectangular hollow section (RHS) joints, RHS brace members welded to the faces of the RHS chord members, are widely used in all kinds of tubular structures, such as large-span roof structures, offshore platform structures, etc. The stress characteristic of these unstiffened joints is that the load is finally born by the chord wall, so the bearing capacity of the joints is often lower than that of the adjacent member (brace) [1,2]. In addition, the unstiffened joints can also be assumed to be semi-rigid joints [3]. This indicates that these unstiffened joints play a crucial role in ensuring the overall stability and load-carrying capacity of such structures, e.g., joint stiffness will influence the stability of the large-span roof with single-layer latticed structures [4]. Therefore, understanding their behavior under different loading conditions, including cyclic loading, is of great importance for the design and safety of these structures. So far, there have been many studies on the static strength of the RHS joints [5,6,7]. According to the literature available to the authors, Jubb and Redwood [8] first proposed the yield line (plastic hinge) model to calculate the strength of RHS T-, Y- and X-joints under the axial load of the brace. In their model, the yield lines were only arranged on the chord face (the chord wall that connected the brace), where four yield lines and two yield lines were assumed around the brace edges and the chord face edges, respectively. After that, this model was improved by many researchers, for example, a yield line model that considered the fillet weld size was proposed by Zhao and Hancock [9], and a yield line model that considered the chord axial load was proposed by Cao et al. [10]. In addition to the RHS joints made of ordinary strength steel, RHS joints made of stainless steel and high-strength steel have also received attention in recent years. Feng and Young [11] studied the axial strengths of the stainless steel RHS T- and X-joints and proposed theoretical models for predicting the strength of the joints. The results showed that the axial strengths predicted by the theoretical models can agree well with the laboratory test and finite element (FE) results. Havula [12] studied the flexural performance of the RHS T-joints made of the steel with a yield strength ranging from 420 Mpa to 700 Mpa and found that the high-strength steel T-joints exhibited both high strength and good deformation. Similarly, the test and numerical analysis results of Young et al. [13,14] showed that RHS T- or X-joints with high-strength steel exhibit both high axial strength and good deformation capacity. Moreover, the above results indicate that the code (e.g., EC3 [15]) underestimates the strengths of these RHS joints made of high-strength steels. Apart from RHS joints, yield line models were also applied to evaluate the strength of the joints consisting of RHS (or square hollow sections) and other components, such as blind-bolted endplates and square tubular column joints [16].
Apart from the traditional RHS joints, which consist of the RHS members and where the chord axis and each brace axis intersected, other types of RHS joints have also been investigated. Zhao et al. [17] proposed a kind of eccentric RHS X-joint whose brace axis does not intersect with the chord axis. According to the deformation characteristics from the test results, two analytical models and the corresponding equations were established to predict the strength and stiffness of the eccentric joints subjected to out-of-plane moment. Mashiri and Zhao [18] conducted static in-plane bending moment (IPBM) loading tests on the T-joints made up of circular hollow section (CHS) braces and square hollow section (SHS) chords and proposed a yield line model to calculate the bending strength of these CHS-to-SHS T-joints. It was found that the equation derived from the model can predict the ultimate moment of tests quite well. The performance of these CHS-to-SHS (or RHS) joints composed of other materials have received attention recently, such as the high-strength steel X-joints studied by Pandey and Young [19] and the stainless steel joints studied by Fen et al. [20]. In the effort to improve the strength of the RHS joints, many strengthening measures have received attention. For example, collar plate strengthening for the T-joints was studied by Chang et al. [21], sidewall plate strengthening for the T-joints was studied by Gomes et al. [22], and the seismic behavior of a prefabricated steel-braced frame structure with hinged joints was studied by Jia et al. [23]. It was found that these strengthening measures could effectively increase the strength of the RHS joints.
Moreover, the seismic performance of the tubular joints has also been considered, but most of the existing studies on seismic performance are in relation to the CHS joints [24,25,26,27,28]. In addition, many studies have been performed on the seismic behavior of the concrete-filled square (rectangular) steel tubular columns, such as that performed by Luo et al. [29]. However, there are few studies that have considered the seismic behavior of RHS joints. An RHS cross-type (X-type) joint is a common and simple tubular connection applied in various steel tube structures. This paper will report an experimental investigation of two RHS X-joints with different β (the brace-to-chord width ratio) subjected to cyclic IPBM loading. The effect of β on the strength, energy dissipation and ductility of the RHS X-joints are evaluated. Moreover, the inherent mechanisms behind the experimental observation were further explored via the numerical simulation analysis and an analytical model of load transferring. The in-plane flexural seismic behavior of the RHS X-joints under cyclic loading is the novelty of this paper since it has not been extensively studied before. The research results can help engineers obtain a more profound understanding of the seismic performance of the RHS joints.

2. Experimental Procedure

2.1. Design of the Specimens

Two RHS joint specimens are designed for cyclic IPBM loading tests, and their geometric characteristics and details are presented in Figure 1 and Table 1. The chord has a length of lct = 1860 mm between the holes of the two end-connectors, leading to the length-to-depth ratio of the chord being 2lct/H = 20.6. The brace between the load center and the chord face has a length of lbt = 1170 mm, making the length of braces about 6.5 or 7.8 times that of the brace depth h. The arrangement of these lengths can avoid the influence of the end constraint effects on the connection so it can fully reflect the actual conditions of the joints in the engineering practice. Here, the end-connector is the author’s previous specially designed device [26], which is used to connect the chord end to the support column and ensure the chord end rotates freely in-plane. In Table 1, the suffixes of ‘0.83’ and ‘1.0’ of first column represent the two specimens with the brace-to-chord width ratios of 0.83 and 1.0, respectively; the second and the third columns denote the cross-section sizes (depth × width × thickness) of the chord and brace of each specimen, respectively. The fourth to eighth columns are geometric dimensionless parameters of the RHS joints, representing the brace-to-chord width ratio (β), brace depth-to-the chord width ratio (β1), chord width-to-thickness ratio (γ), brace-to-chord thickness ratio (τ), and chord depth-to-width ratio (χ). The selected parameters represent the two typical RHS X-joints with medium β and large β values, which are widely applied in the tube structures. Moreover, the structural characteristics of the two joints lead to obvious differences in their force transfer modes. As for the connection between braces and chord, two braces were welded to the chord walls using a combination of partial groove butt welds and fillet welds, and the size of the fillet weld was equal to the brace thickness (i.e., hf = t), as shown in Figure 2. The welds were constructed in accordance with the Chinese welding code GB 50661-2011 [30]. The yield strength (fy), ultimate strength (fu), elastic modulus (E), and fracture elongation (ζ) of the RHS tubes were acquired by the tensile coupon tests, listed in Table 2.

2.2. Loading System, Loading Procedure and Measurement Arrangement

The loading system is the same as that of the author’s previous in-plane bending moment (IPBM) loading test on the CHS X-joints [26]; that is, the two end-connectors of the chord were connected to the support columns by the pin shaft, and two servo hydraulic actuators were attached to the two loading connectors, which fixed to the two brace ends using high-strength bolts, as depicted in Figure 3. The vertical loads at two brace ends, producing the cyclic IPBM loading effect under earthquake, are applied by simultaneous down and up movement of the actuators.
Similar to the previous test [26], this test also adopts displacement-controlled cyclic loading, which is based on the load center displacement (i.e., the displacement of the actuator), denoted as Δ. Specimen RHS-0.83 was tested first, and the displacement amplitudes of the beginning two cycles were taken as ±4.5 mm and ±9 mm, and 9 mm is the displacement corresponding to the first yield load, which was acquired from the finite element (FE) simulation analysis on the specimen RHS-0.83 before the test. The loading process involves incrementally increasing the displacement level increased by 3 mm from the previous level until the specimen failed, and one cycle for every level in the loading process. To maintain the consistency of comparison, specimen RHS-1.0 shares the same loading regime as specimen RHS-0.83.
For each specimen, a series of displacement sensors is strategically placed to acquire the relative deformation of the brace end and then to obtain the rotation under IPBM, as illustrated in Figure 4a. Specifically, sensors D1 and D2 are used to measure the vertical displacement of the brace ends, sensors D3 and D4 are used to measure the horizontal displacement resulting from the flexural deformation of the chord due to the possible concentrated moment at the chord middle, where the concentrated moment is produced by possible incomplete synchronously loaded by the two actuators. The sensor D5 is utilized to measure the displacement resulting from the axial deformation of the chord. Sensors D6 and D7, which are provided by the two actuators, are used to control the displacement loading. A series of strain gauges are placed on the chord faces, chord sidewalls, and brace walls in the joint-zone to measure the strain distribution at these critical locations and then to investigate the plastic development of the braces and the chord, as shown in Figure 4b. Moreover, strain gauges are also positioned at the mid-length of the two braces to monitor the loading condition of the two brace ends.

3. Experimental Results

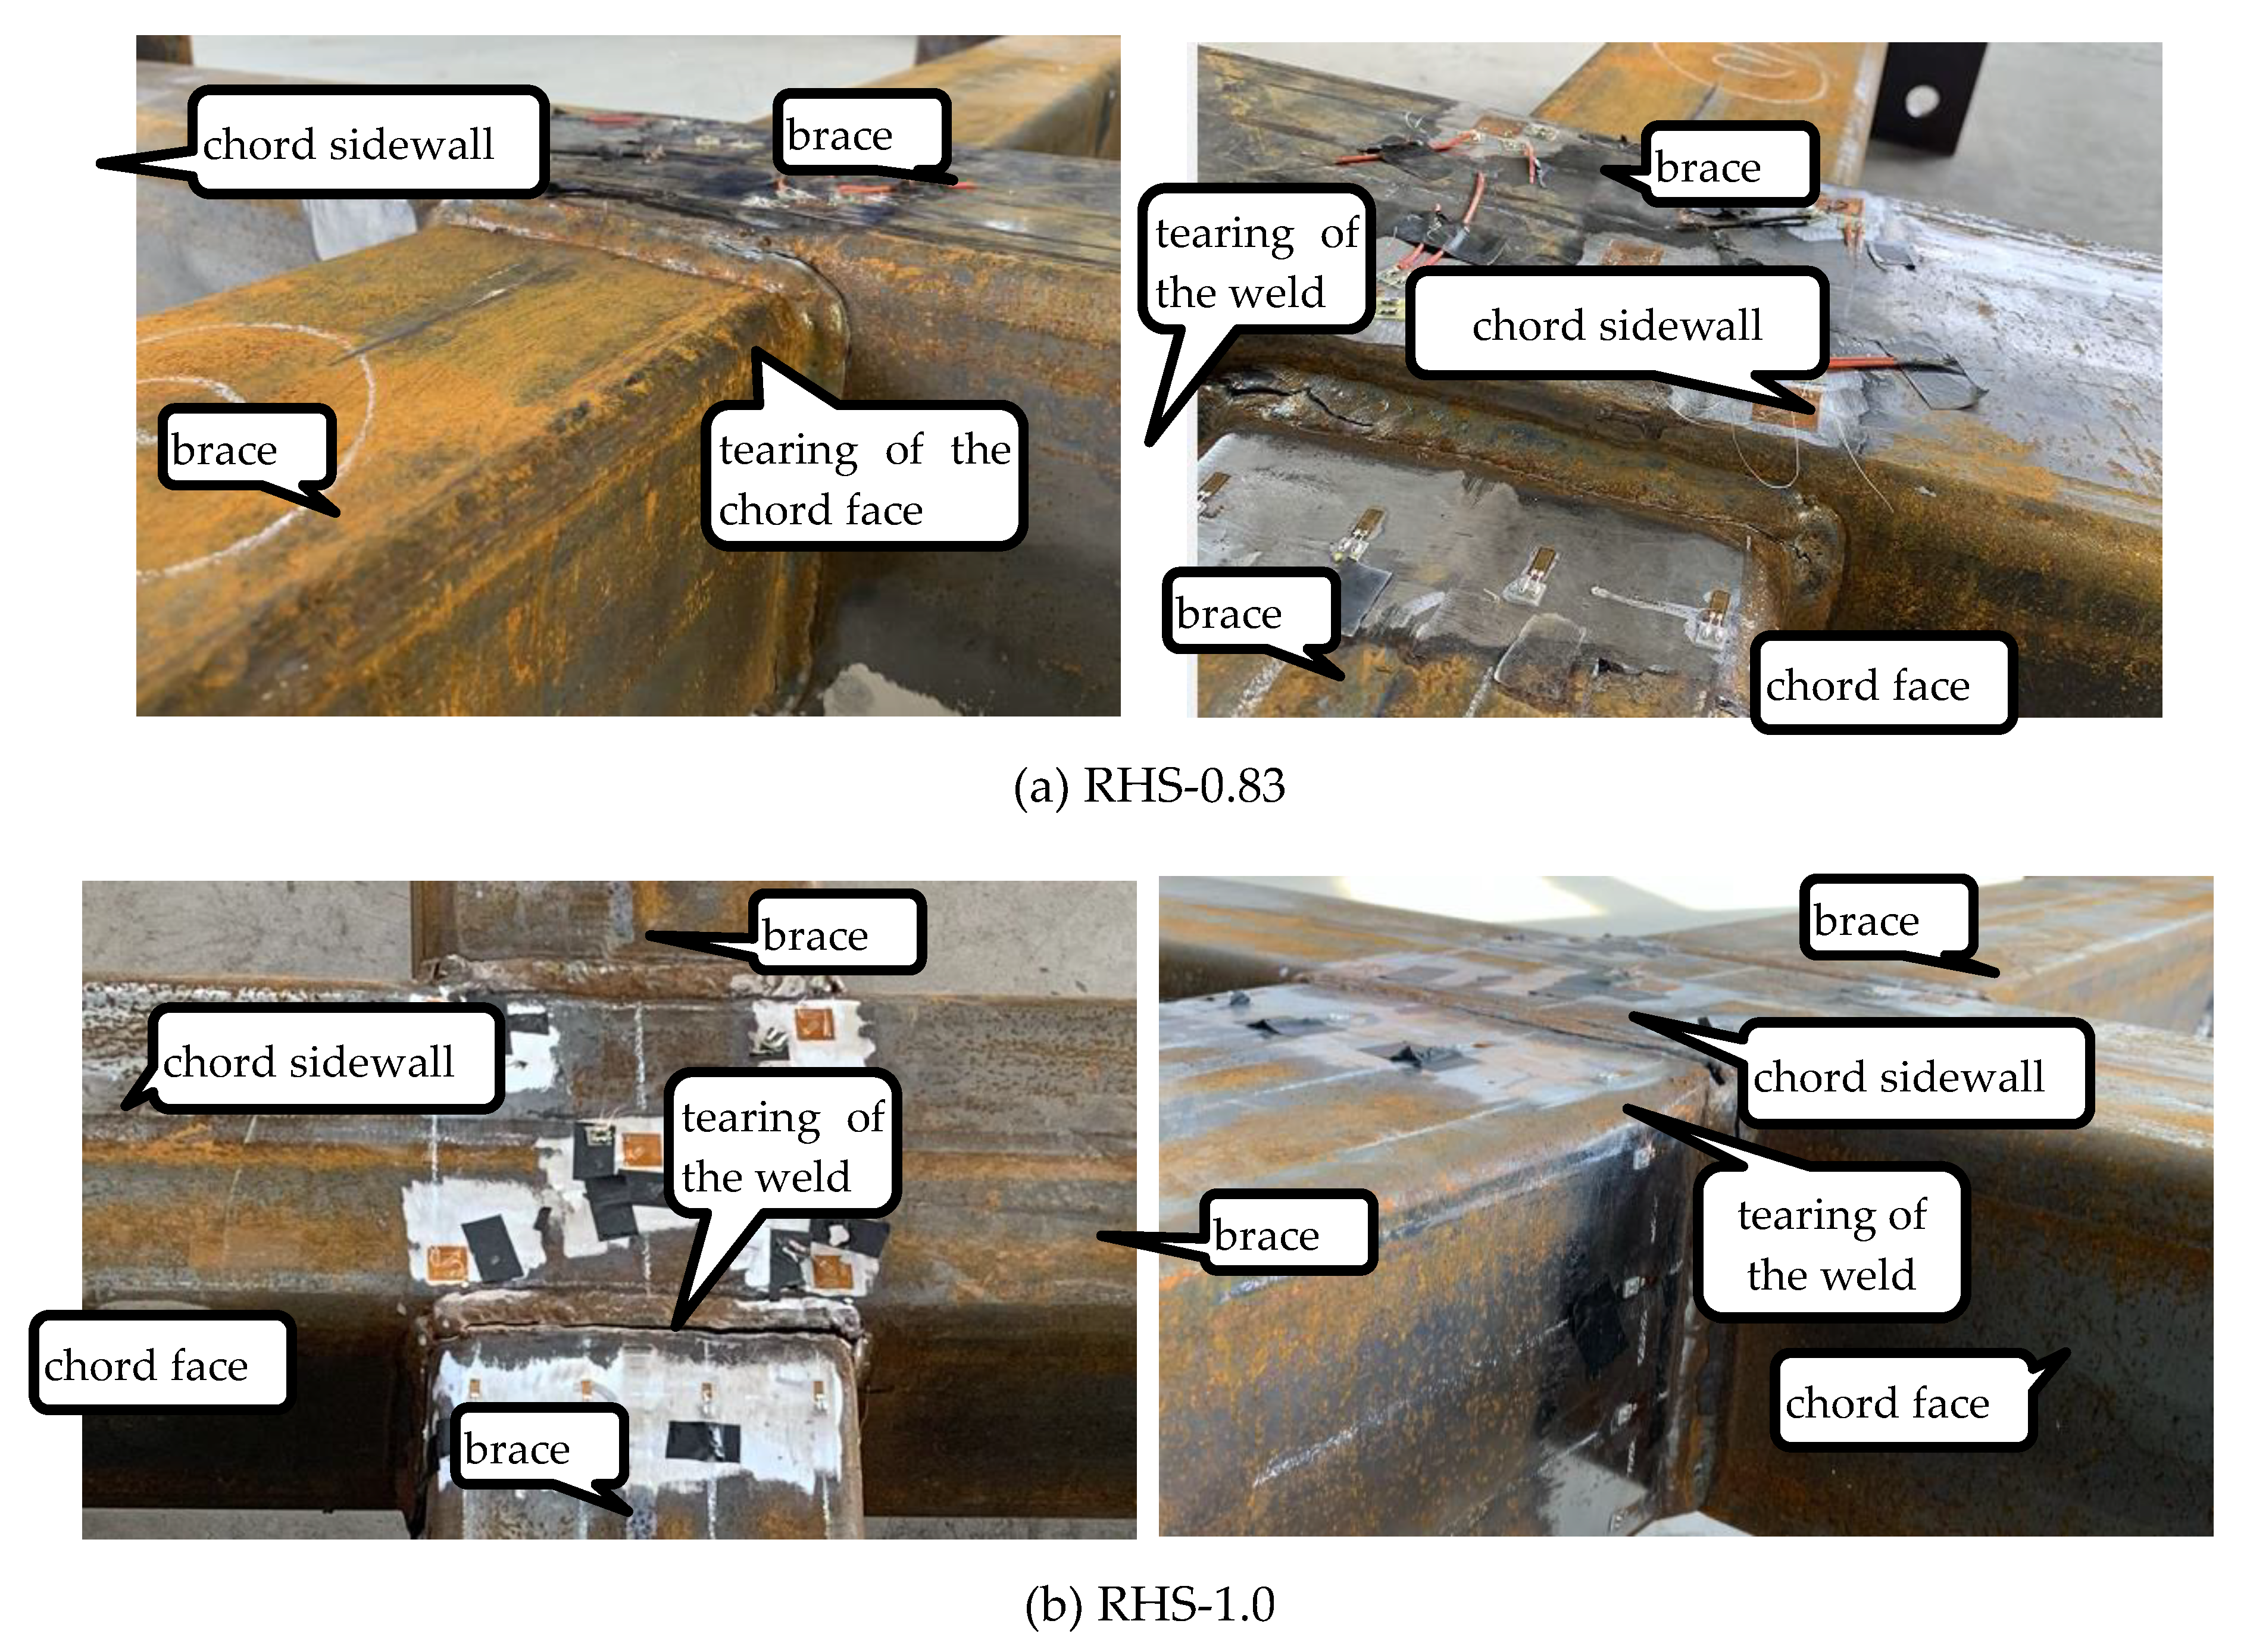
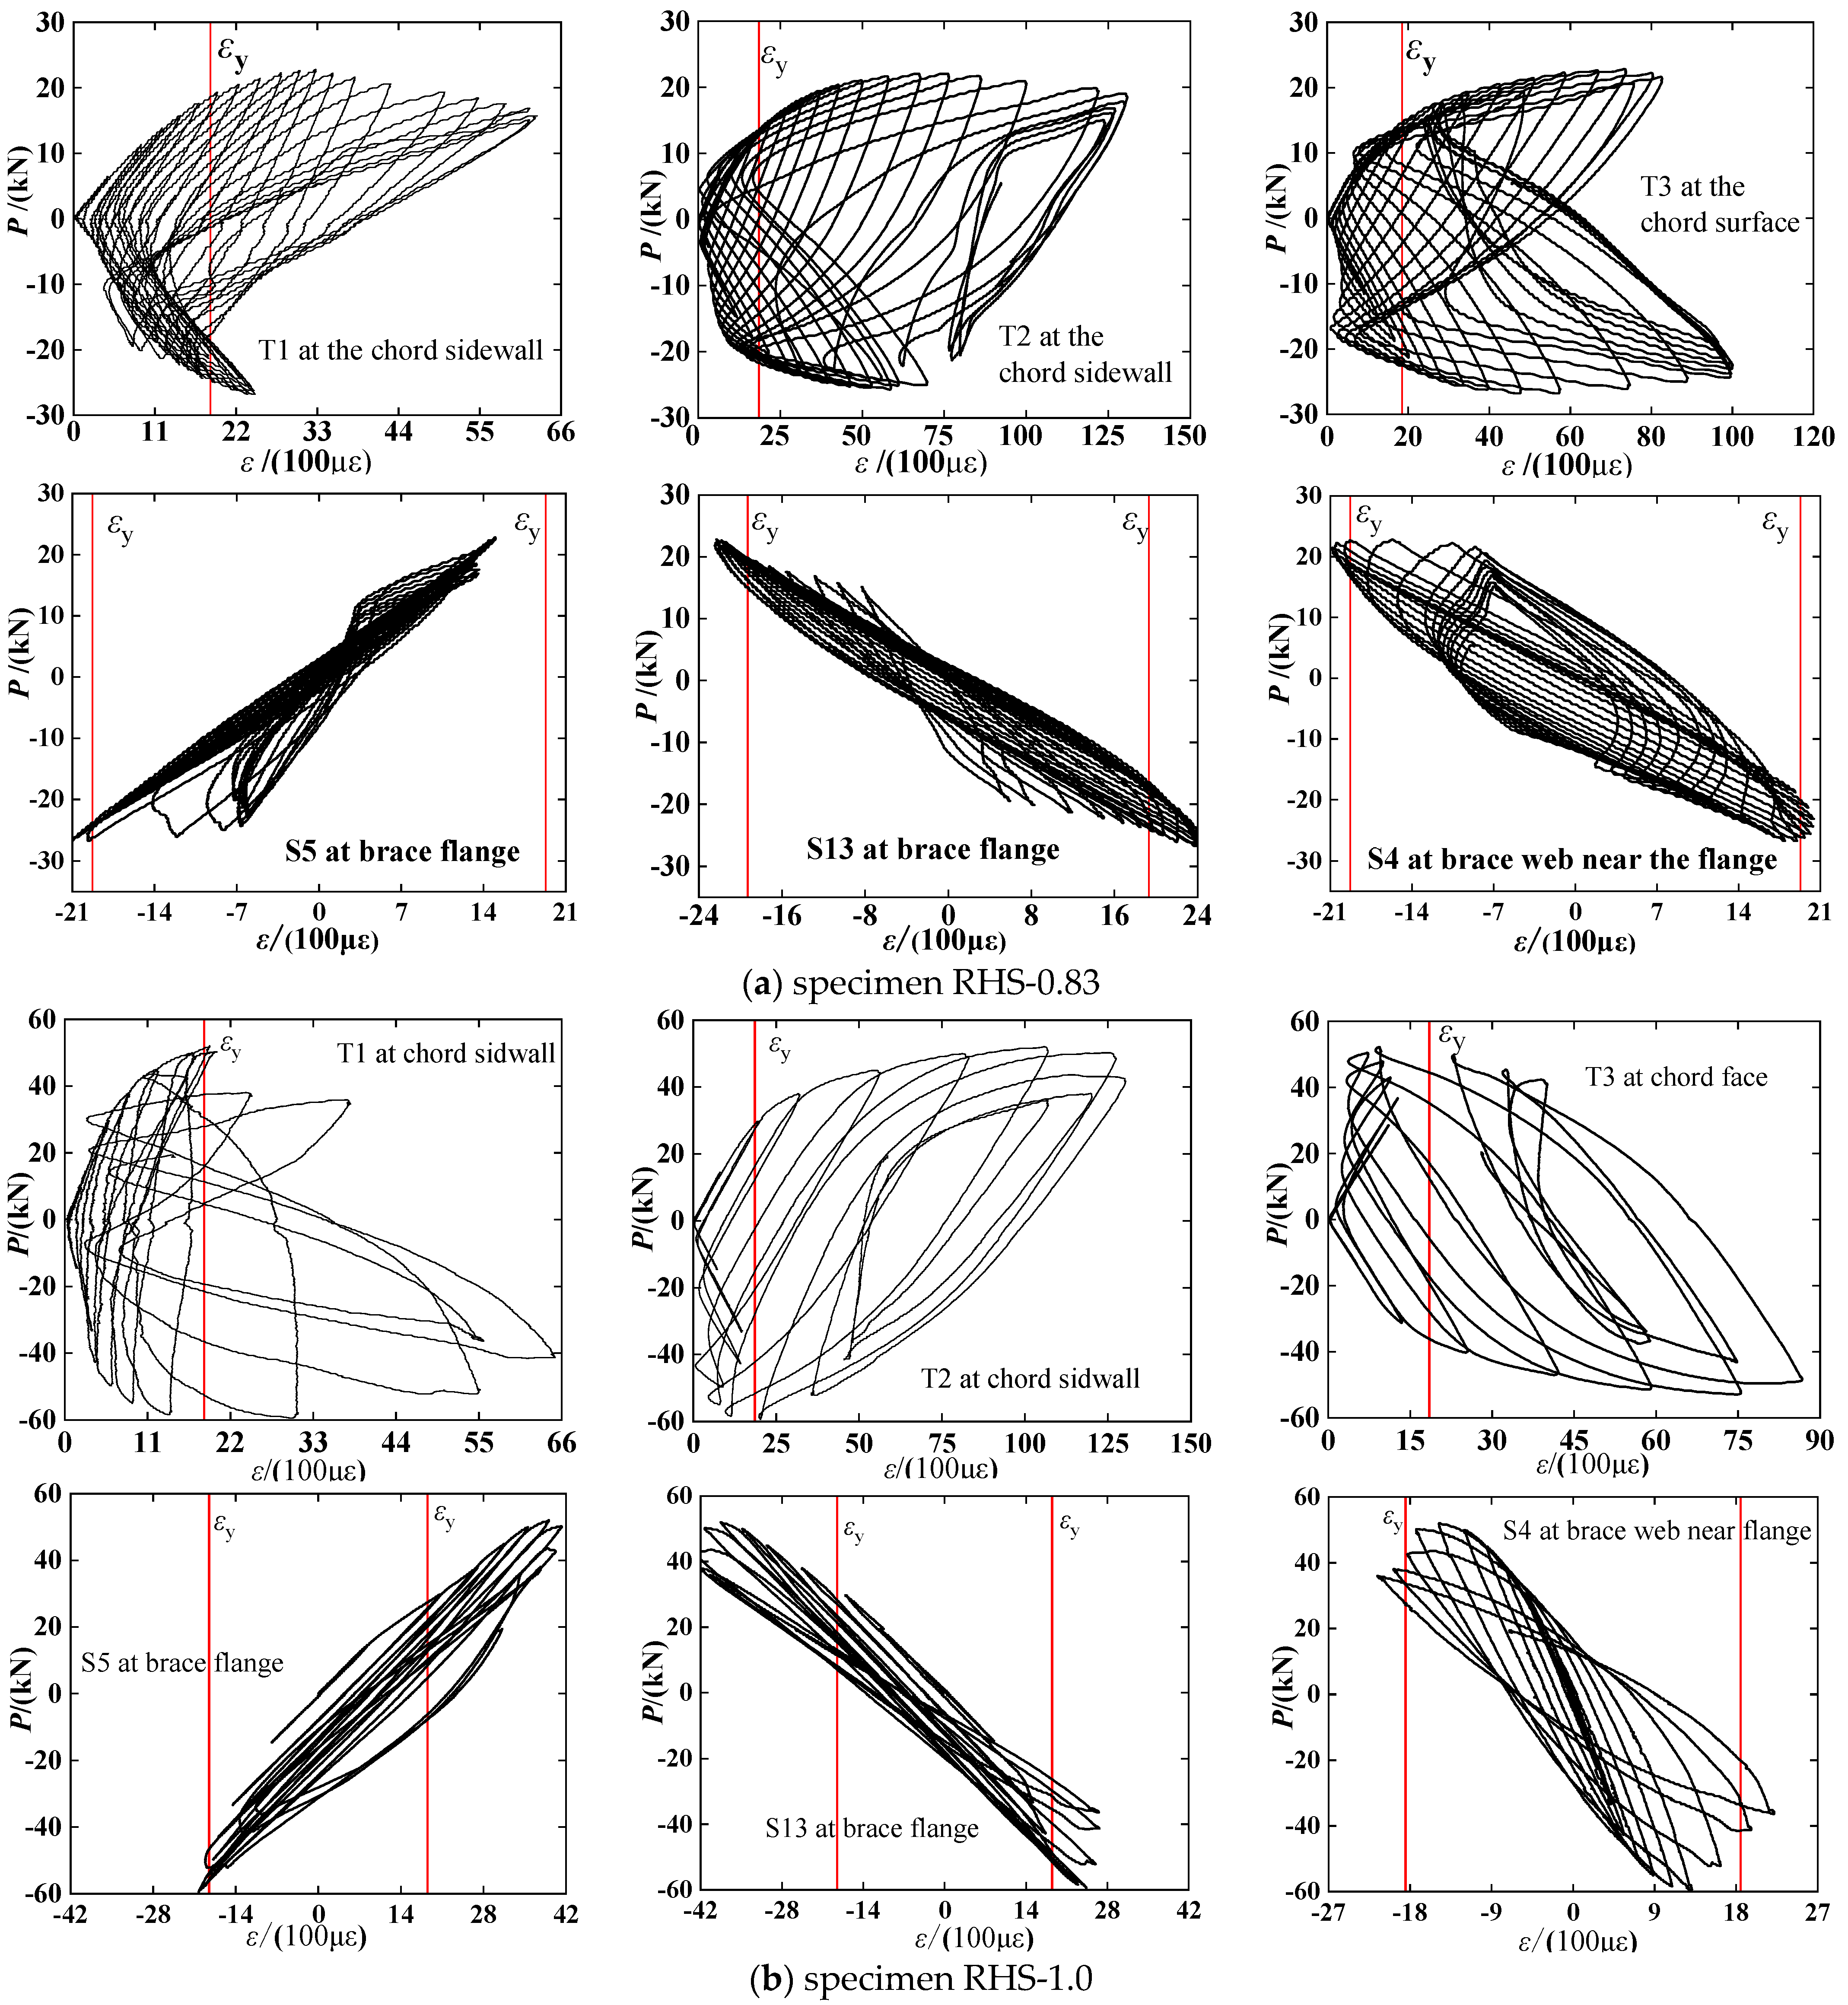
3.1. Phenomena and Failure Modes
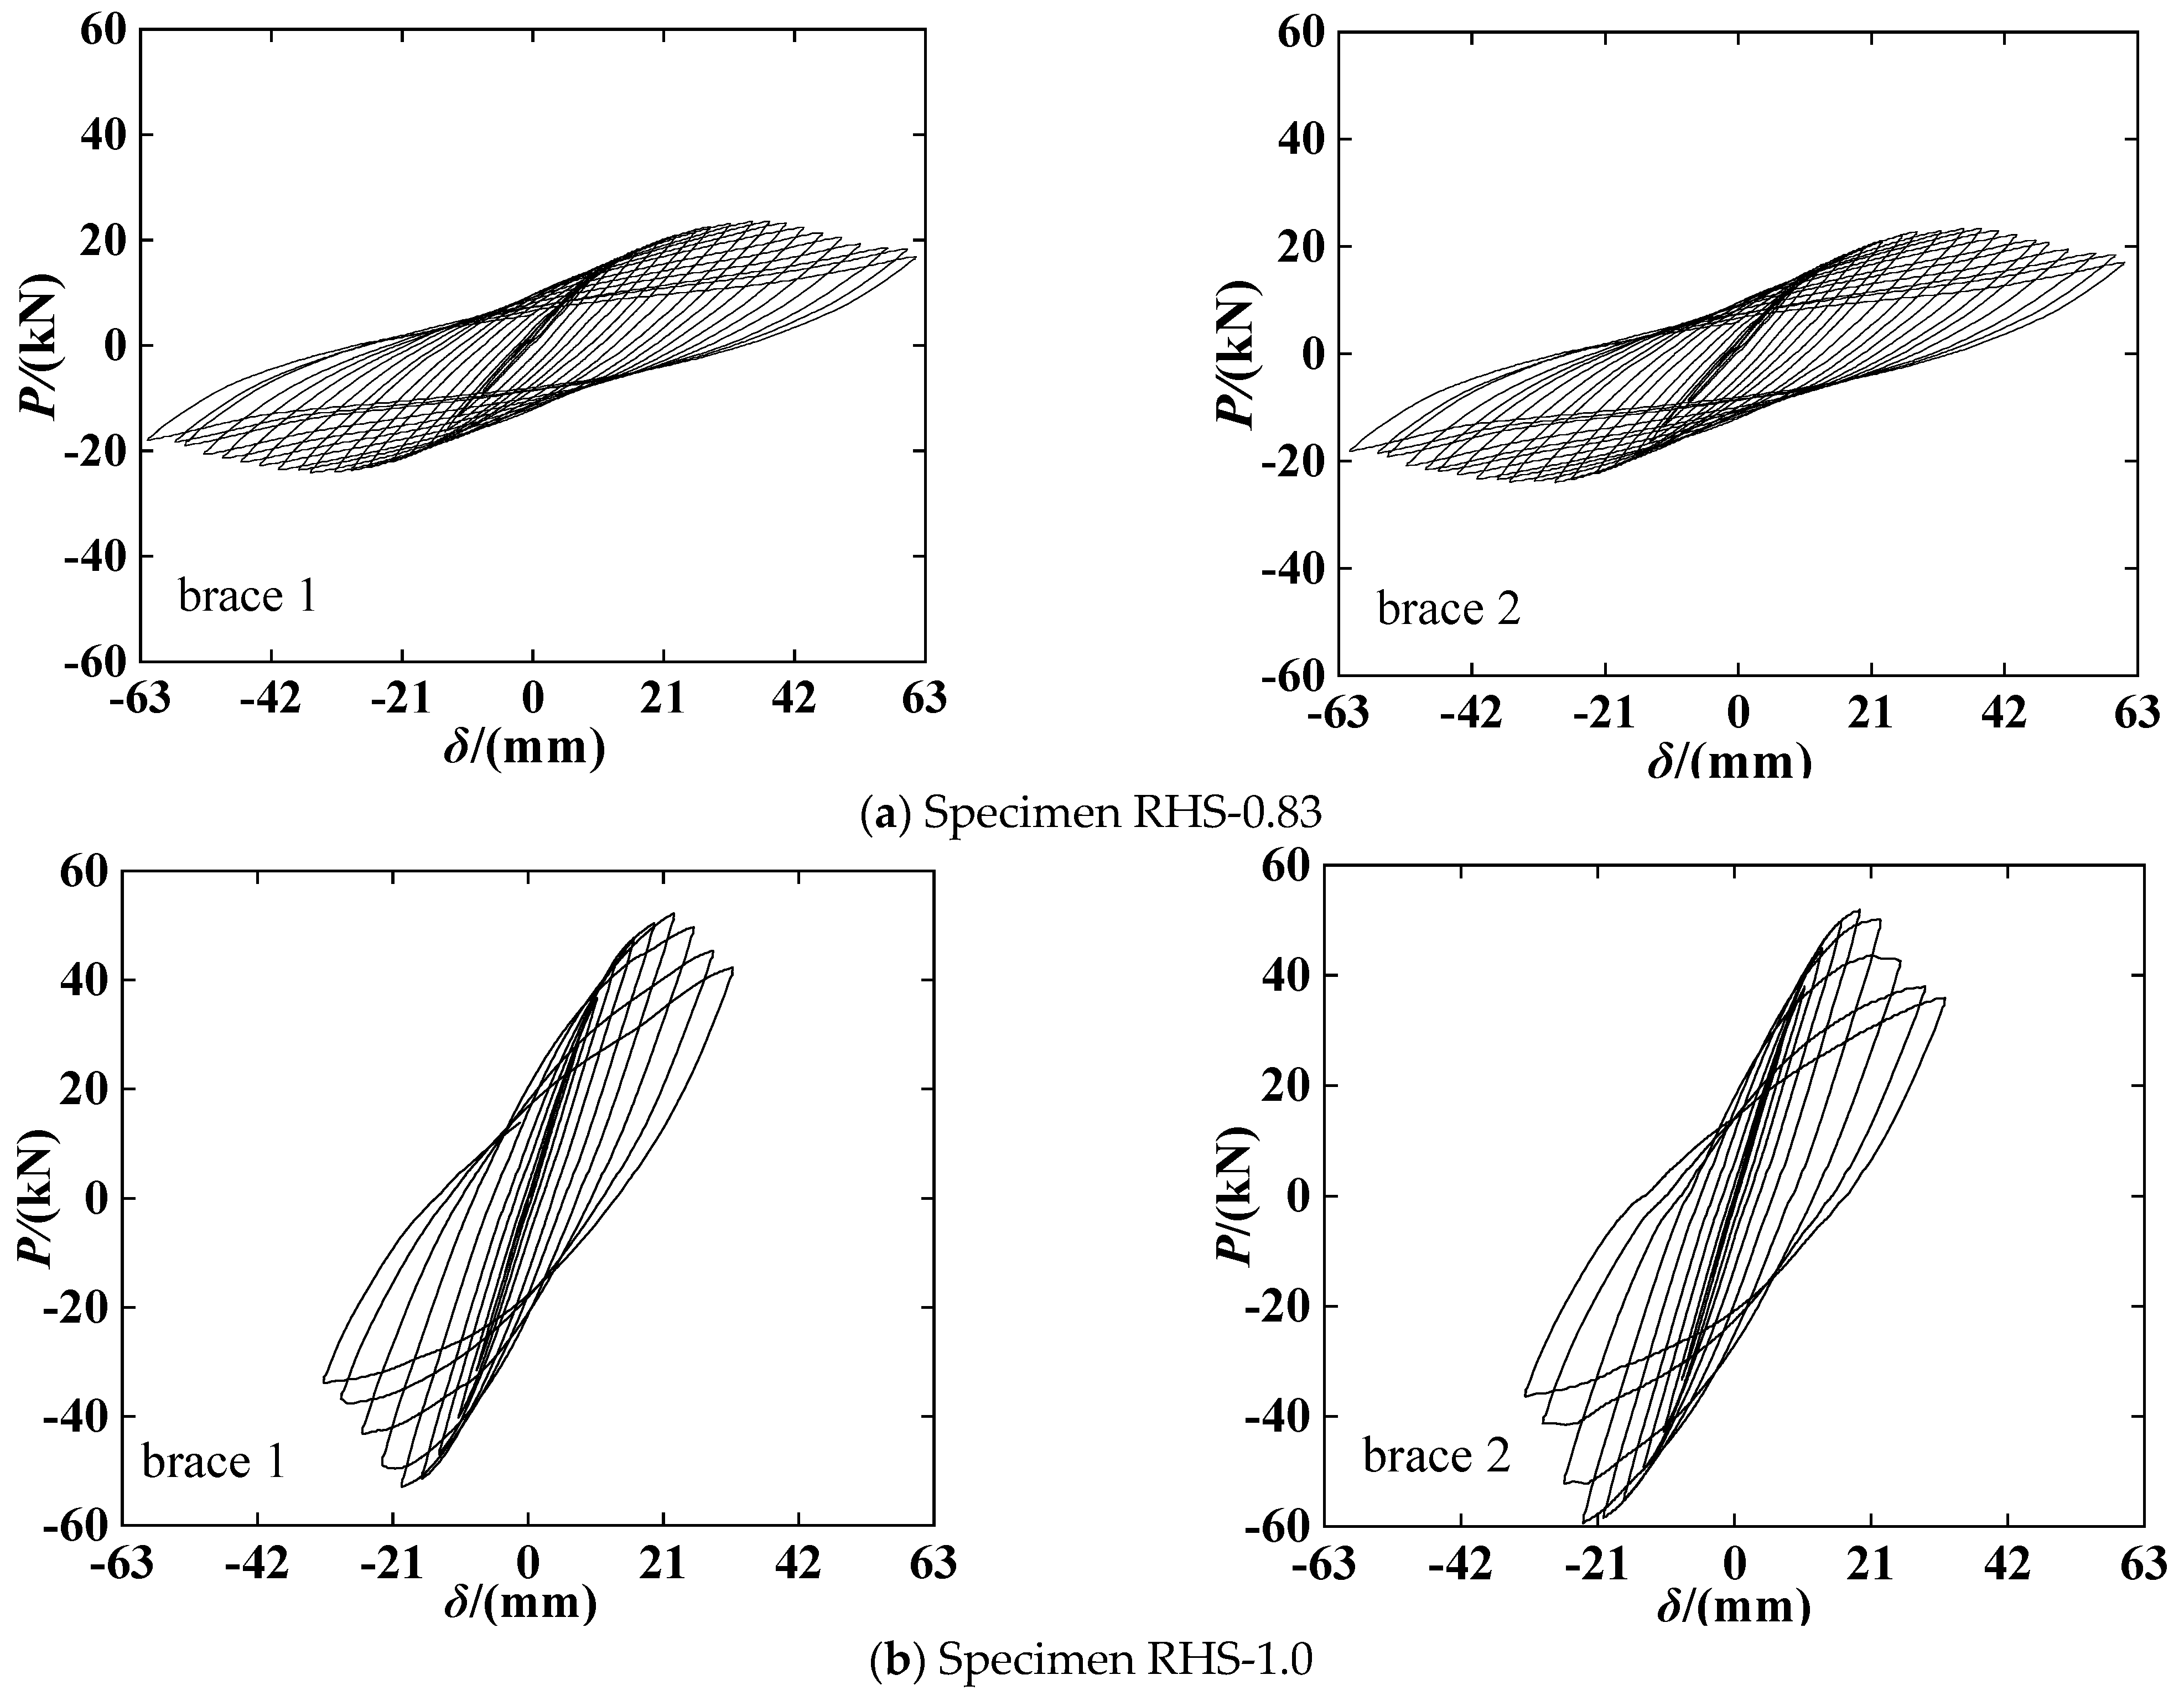
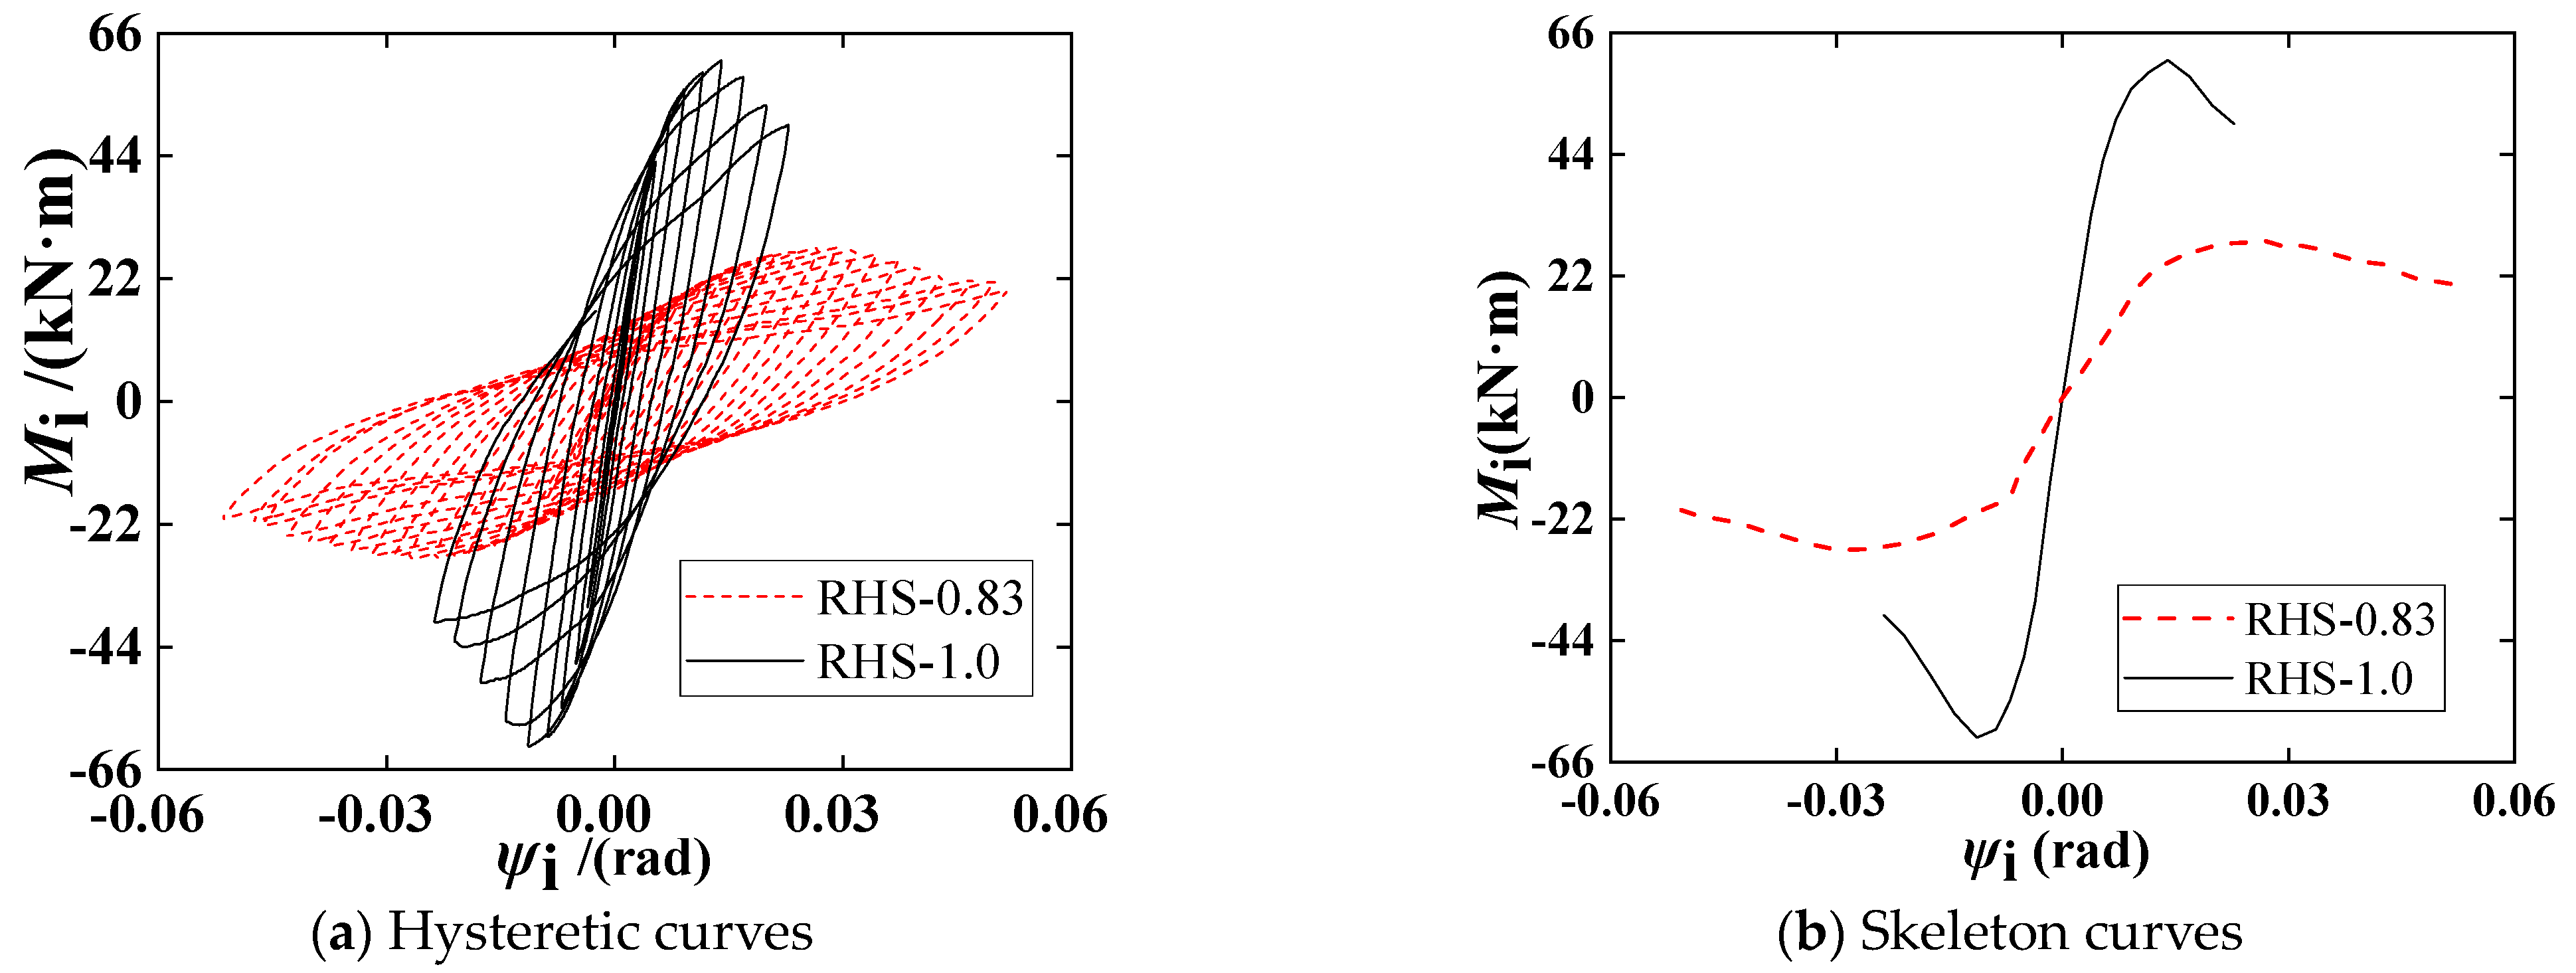
For specimen RHS-0.83, the yielding is first monitored at the chord face near the intersection in the second cyclic loading, and the load (P) and displacement (Δ) of the actuator end are 10.8 kN and 8.9 mm, respectively. The chord sidewall is also detected as yielding in the third cycle. In the next cycles, the plasticity degree of the chord walls (including faces and sidewalls) in the joint-zone increases with the increase in Δ. When Δ reaches the level of ±36 mm, the actuator reaches the peak load (about 24 kN), and the chord walls will have experienced a significant plasticization. Immediately, two tiny cracks are observed at the chord face near the intersection and the weld near the corner of the brace root. Thereafter, as Δ increases, the load of the two actuators gradually decreases due to the crack propagation. The actuator load decreased 37% from its peak as Δ reaches the level of ±63 mm, and the test was stopped. Specimen RHS-0.83 failed owing to the tearing of both the chord face and the weld near the brace flange, and the faces and sidewalls of the chord had serious plastic softening before the tearing failure, as shown in Figure 5a.
For specimen RHS-1.0, the yielding is first monitored at the chord face near the intersection in the second cyclic loading, and the corresponding P and Δ are 27.1 kN and 8.0 mm, respectively. The actuator reaches the peak load (about 58 kN) as Δ reaches the level of ±21 mm, and a tiny crack is observed at the weld near the corner of the brace root. In the subsequent cyclic loading, the loads of the actuators decrease at a fast rate as the crack propagates quickly, and the crack tends to propagate along the weld near the brace web rather than near the brace flange. When Δ reached ±33 mm, the actuator load decreased by more than 30% from its peak, and the test was stopped. Finally, specimen RHS-1.0 failed owing to the tearing of the weld, and the chord wall in join-zone had experienced remarkable plastic development before the tearing failure, as shown in Figure 5b.
By comparing the two specimens, the failure modes of specimen RHS-0.83 (the RHS X-joints with medium β (β = 0.83)) exhibited both weld tearing and the chord face tearing near the intersection, while the failure modes of specimen RHS-1.0 (the RHS X-joints with large β (β = 1.0)) exhibited weld tearing. The load resistance ultimate of the joints with large β is remarkably higher than that of the joints with medium β, but this is achieved at the cost of the yielding and failure appeared in advance. After cracking, the load resistance degradation rate of the specimen RHS-1.0 is remarkably faster than that of the specimen RHS-0.83.

3.2. Curves

The resistance force-relative deflection (P-δ) curves at the brace ends are depicted in Figure 6. Where, the ordinate is P obtained from the reading of the hydraulic actuator, which is defined as negative when the actuator moves up. The abscissa is the deflection of the brace end relative to the intersection, δ, acquired by subtracting the brace end displacement from the chord axial displacement. For instance, if the relative deflection of brace 1 is δ = δ1δ5, δ1 and δ5 are the displacements measured by the sensors D1 and D5 (see Figure 4). From Figure 6, it can be observed that two specimens generally exhibit plump hysteretic curves. The peak resistances (Pu) of the specimens RHS-0.83 and RHS-1.0 are about 24 kN and 58 kN, respectively, which are remarkably smaller than the resistances corresponding to the theoretical yield moment of the brace (i.e., Pby = Mby/lbt) of the two specimens: 52.4 kN and 77.3 kN, respectively. This implies that most parts of the braces except near the joint-zone maintained elastic stress condition during test, and hence contribute little to the energy dissipation. P-δ curves and strain gauge reading indicate that the plasticity development is only provided by a limited region of the faces and sidewalls of the chord, which plays a dominant role in energy dissipation of the RHS joints. Although the two specimens failed due to cracking caused by low-cycle fatigue, they differ remarkably in ultimate bearing capacity (Pu), connection efficiency (Pu /Pby), strength deterioration after cracking, and energy dissipating capacity. Specimen RHS-0.83 exhibits a smaller capacity (Pu = 24 kN), smaller connection efficiency (Pu/Pby = 0.46), and smaller stiffness, but with slow strength deterioration after cracking. In contrast, specimen RHS-1.0 shows the opposite. The comparison between the two specimens indicates that increasing the ratio β can considerably improve the strength and stiffness of RHS X-joints. However, it compromises deformation capacity and aggravates the strength degradation rate after cracking, which is not conducive to the stability of the hysteresis curve after cracking. The difference in hysteretic performance between the two specimens is mainly attributed to the load transfer mechanism, and the influence of β on the load transfer mechanism will be discussed in detail in Section 4.3.
The deflection at brace end (δ) can be divided into three components: δa, δb and δc. Here, δa represents the deflection due to the bending deformation of the chord caused by the incomplete synchronous loading of the two actuators. The test results show that the horizontal displacements δ3 and δ4 (measured by the sensors D3 and D4) before the bearing capacity degradation are close to zero, indicating complete synchronous loading of the two actuators. Although δ3 and δ4 are not zero after the capacity degradation due to different damage the two chords face near the two brace roots, the deflection δa (=(δ3δ4)lbn/l34) is far smaller than that of the other two components of δb and δc, where l34 is the distance between sensors D3 and D4. Therefore, δa is ignored for simplification. The component δb represents the deflection resulting from the bending deformation of the brace, which can be determined using elastic beam theory since most of the brace in an elastic stress state. The component δc is the deflection caused by the rotation (ψi) relating to the stiffness (Ki) of the RHS joints. The relationship between ψi and δc is as follows: ψi = δc/lbn = (δδb)/lbn, where lbn represents the brace net length (see Figure 1). As a result, the moment–rotation (Miψi) curves are presented in Figure 7, which only shows the results of brace 1 (brace 2 is similar). In Figure 7, the abscissa is ψi, and the ordinate is the connection moment and expressed as Mi = Plbt, where lbt is the brace length (see Figure 1). The results of the Mi-ψi curves again confirm that the parameter β has a remarkable impact of the connection stiffness, ultimate strength and ductility of the RHS X-joints.
To investigate the plastic development of the specimens, the strain intensities (εi) at the critical locations of the tube walls are presented in Figure 8, where, ordinates and abscissas are the resistance force and the strain intensity, respectively; T1 to T3 are three representative strain rosettes on the sidewalls and faces of the chord; and S4, S5, and S13 are three representative strain gauges on the flange and web of the brace root. Moreover, the yield strain (εy) is also plotted to visualize the plasticization degree of the chord and the braces in the joint-zone. Figure 8 demonstrates that the strains at both faces and sidewalls of the chord are significantly larger than εy, while the strain measured from most gauges of the brace root is less than εy, and only a few gauges show that the strain slightly larger than εy. This result confirms that the plastic deformation is concentrated in the limited region of the chord walls, which play a significant role in energy dissipation.

3.3. Strength

The ultimate flexural strengths of the two specimens are listed in Table 3, denoted as Miu-test, which takes the average of the positive and negative peak moments of the two braces. Table 3 also lists the corresponding strengths predicted by the equations of the code EC3 [15] based on the chord face plastic failure mode and the chord sidewall crushing failure mode, respectively, as expressed in the following Equation (1) and Equation (2), respectively.
M iu - EC 3 - FP = f cy T 2 h 1 2 β 1 + 2 1 β + β 1 1 β
M iu - EC 3 - SC = 0.5 f ck T h + 5 T 2 = 0.4 f cy T h + 5 T 2
Here, fcy is chord yield strength (see Table 2), fck is the buckling stress of the chord sidewall, and others parameters (e.g., T) are the geometric characteristics of the RHS X-joint specimens (see Table 1). In addition, the subscripts ‘FP’ and ‘SC’ indicate the chord face plastic failure and the chord sidewall crushing failure. Equation (1) is applicable to the RHS with β not being larger than 0.85, and Equation (2) is applicable to the RHS joints with β near to 1.0. It should be noted that both Equations (1) and (2) need to be multiplied by the influence coefficient of compressive stress of the chord: kn = 1.3 − 0.4σc/(βfy0) ≤ 1.0. However, the chord pressure stress (σc) is too small, leading to the coefficient kn being 1.0.
Table 3 exhibits that the prediction-to-test strength ratio of the two specimens are 0.77 and 0.66, respectively, indicating that Equations (1) and (2) underestimate the flexural strengths of the two specimens. The idea of the prediction equation of the axial strength of RHS T-joints was borrowed, and the weld size was taken into account, as was instructed by Zhao and Hancock [9]. The two ratios of β (=b/B) and β1 (=h/B) in Equation (1) are replaced by β’ (=(b + 2hf)/B ≤ 0.85) and β1 (=(h + 2hf)/B), respectively, and h in Equation (2) is replaced by (h + 2hf), where hf is weld size (see Figure 2) and equal to the brace thickness. Moreover, the buckling stress fck in Equation (2) is replaced by the yield strength fcy; that is, it is believed that the chord sidewalls are yielded when the chord sidewall crushing failure occurs. As a result, the new predicted strengths of the specimen RHS-0.83 and specimen RHS-1.0 are 26.3 kN·m and 57.1 kN·m, respectively, which are 93% and 92% of the corresponding test results, respectively. This implies that the equation considering the favorable influence of weld size can better predict the flexural strength of RHS X-joints.

3.4. Ductility Evaluation

Table 4 gives the ductility and deformation capacity evaluation results of the two specimens. In Table 4, μ is the ductility evaluation index, which is named as the ductility ratio and defined as μ = ψiu/ψiy. Here, ψiy is the yield rotation obtained by the method of Kurobane et al. [31], ψiu represents the ultimate rotation corresponding to a 20% decrease in moment from the peak moment. Moreover, the subscripts + and − indicate the positive and negative loading directions. Table 4 demonstrates that the ratio μ of the specimen RHS-0.83 is remarkably higher than that of the specimen RHS-1.0, mainly because the rotation ψiu of the former is significantly larger than that of the latter. Table 4 also indicates that the yield rotation ψiy of the specimen RHS-0.83 is larger than that of the specimen RHS-1.0. Therefore, an increasing β value causes the RHS X-joints to yield and fail prematurely, and seriously reduces the ductility.

3.5. Energy Dissipation Evaluation

Table 5 presents an overview of the evaluation outcomes of the energy dissipation characteristics, encompassing the cumulative energy dissipation ratio (ηtot) and the energy dissipation ratio of a typical P-δ hysteretic loop (ηa). The two ratios (evaluation indexes) were defined by reference [30,31,32] and expressed as follows:
η tot = E tot / E y = i = 1 n E i / 0.5 P y + δ y + + 0.5 P y - δ y -
η a = E a / E tri = E a / 0.5 P u + δ u + + 0.5 P u - δ u -
Here, Ei is energy dissipation of the ith cycle, which is defined as the area enclosed by the ith loop of P-δ curve; Etot is the accumulative energy dissipation, i.e., the sum of each loop energy dissipation Ei, where total number is n, and the last cycle is defined as the cycle in which the resistance is reduced to 80% of the peak resistance. Ey represents the elastic energy defined as 0.5Py+δy+ + 0.5Py−δy−, where Py+ and Py− are the positive and negative resistances corresponding to the yield rotations ψiy+ and ψiy−, respectively, and δy+ and δy− are the two deflections corresponding to the rotations ψiy+ and ψiy−, respectively. Ea represents the energy dissipation of a typical Pδ loop, which taken as the loop with peak resistance; Etri (=0.5Pu+δu+ + 0.5Pu−δu−) is the corresponding elastic energy, where δu+ and δu− represent the maximum positive and negative deflections of the Pδ loop, respectively, and Pu+ and Pu− are the two resistances corresponding to δu+ and δu−, respectively. It should be noted that the specific value of each above quantity (e.g., Etot) is taken as the average value of two braces.
Table 5 demonstrates that specimen RHS-0.83 dissipates more energy compared to the specimen RHS-1.0 throughout the whole test process, which is mainly due to the remarkably more cycles caused by slower strength deterioration. Table 5 also shows that the two ratios (ηtot and ηa) of the specimen RHS-0.83 are significantly larger than those of the specimen RHS-1.0, indicating that increasing β (from the medium value 0.83 to the large value 1.0) is not beneficial to energy dissipation characteristics of RHS X-joints.

4. Numerical Study

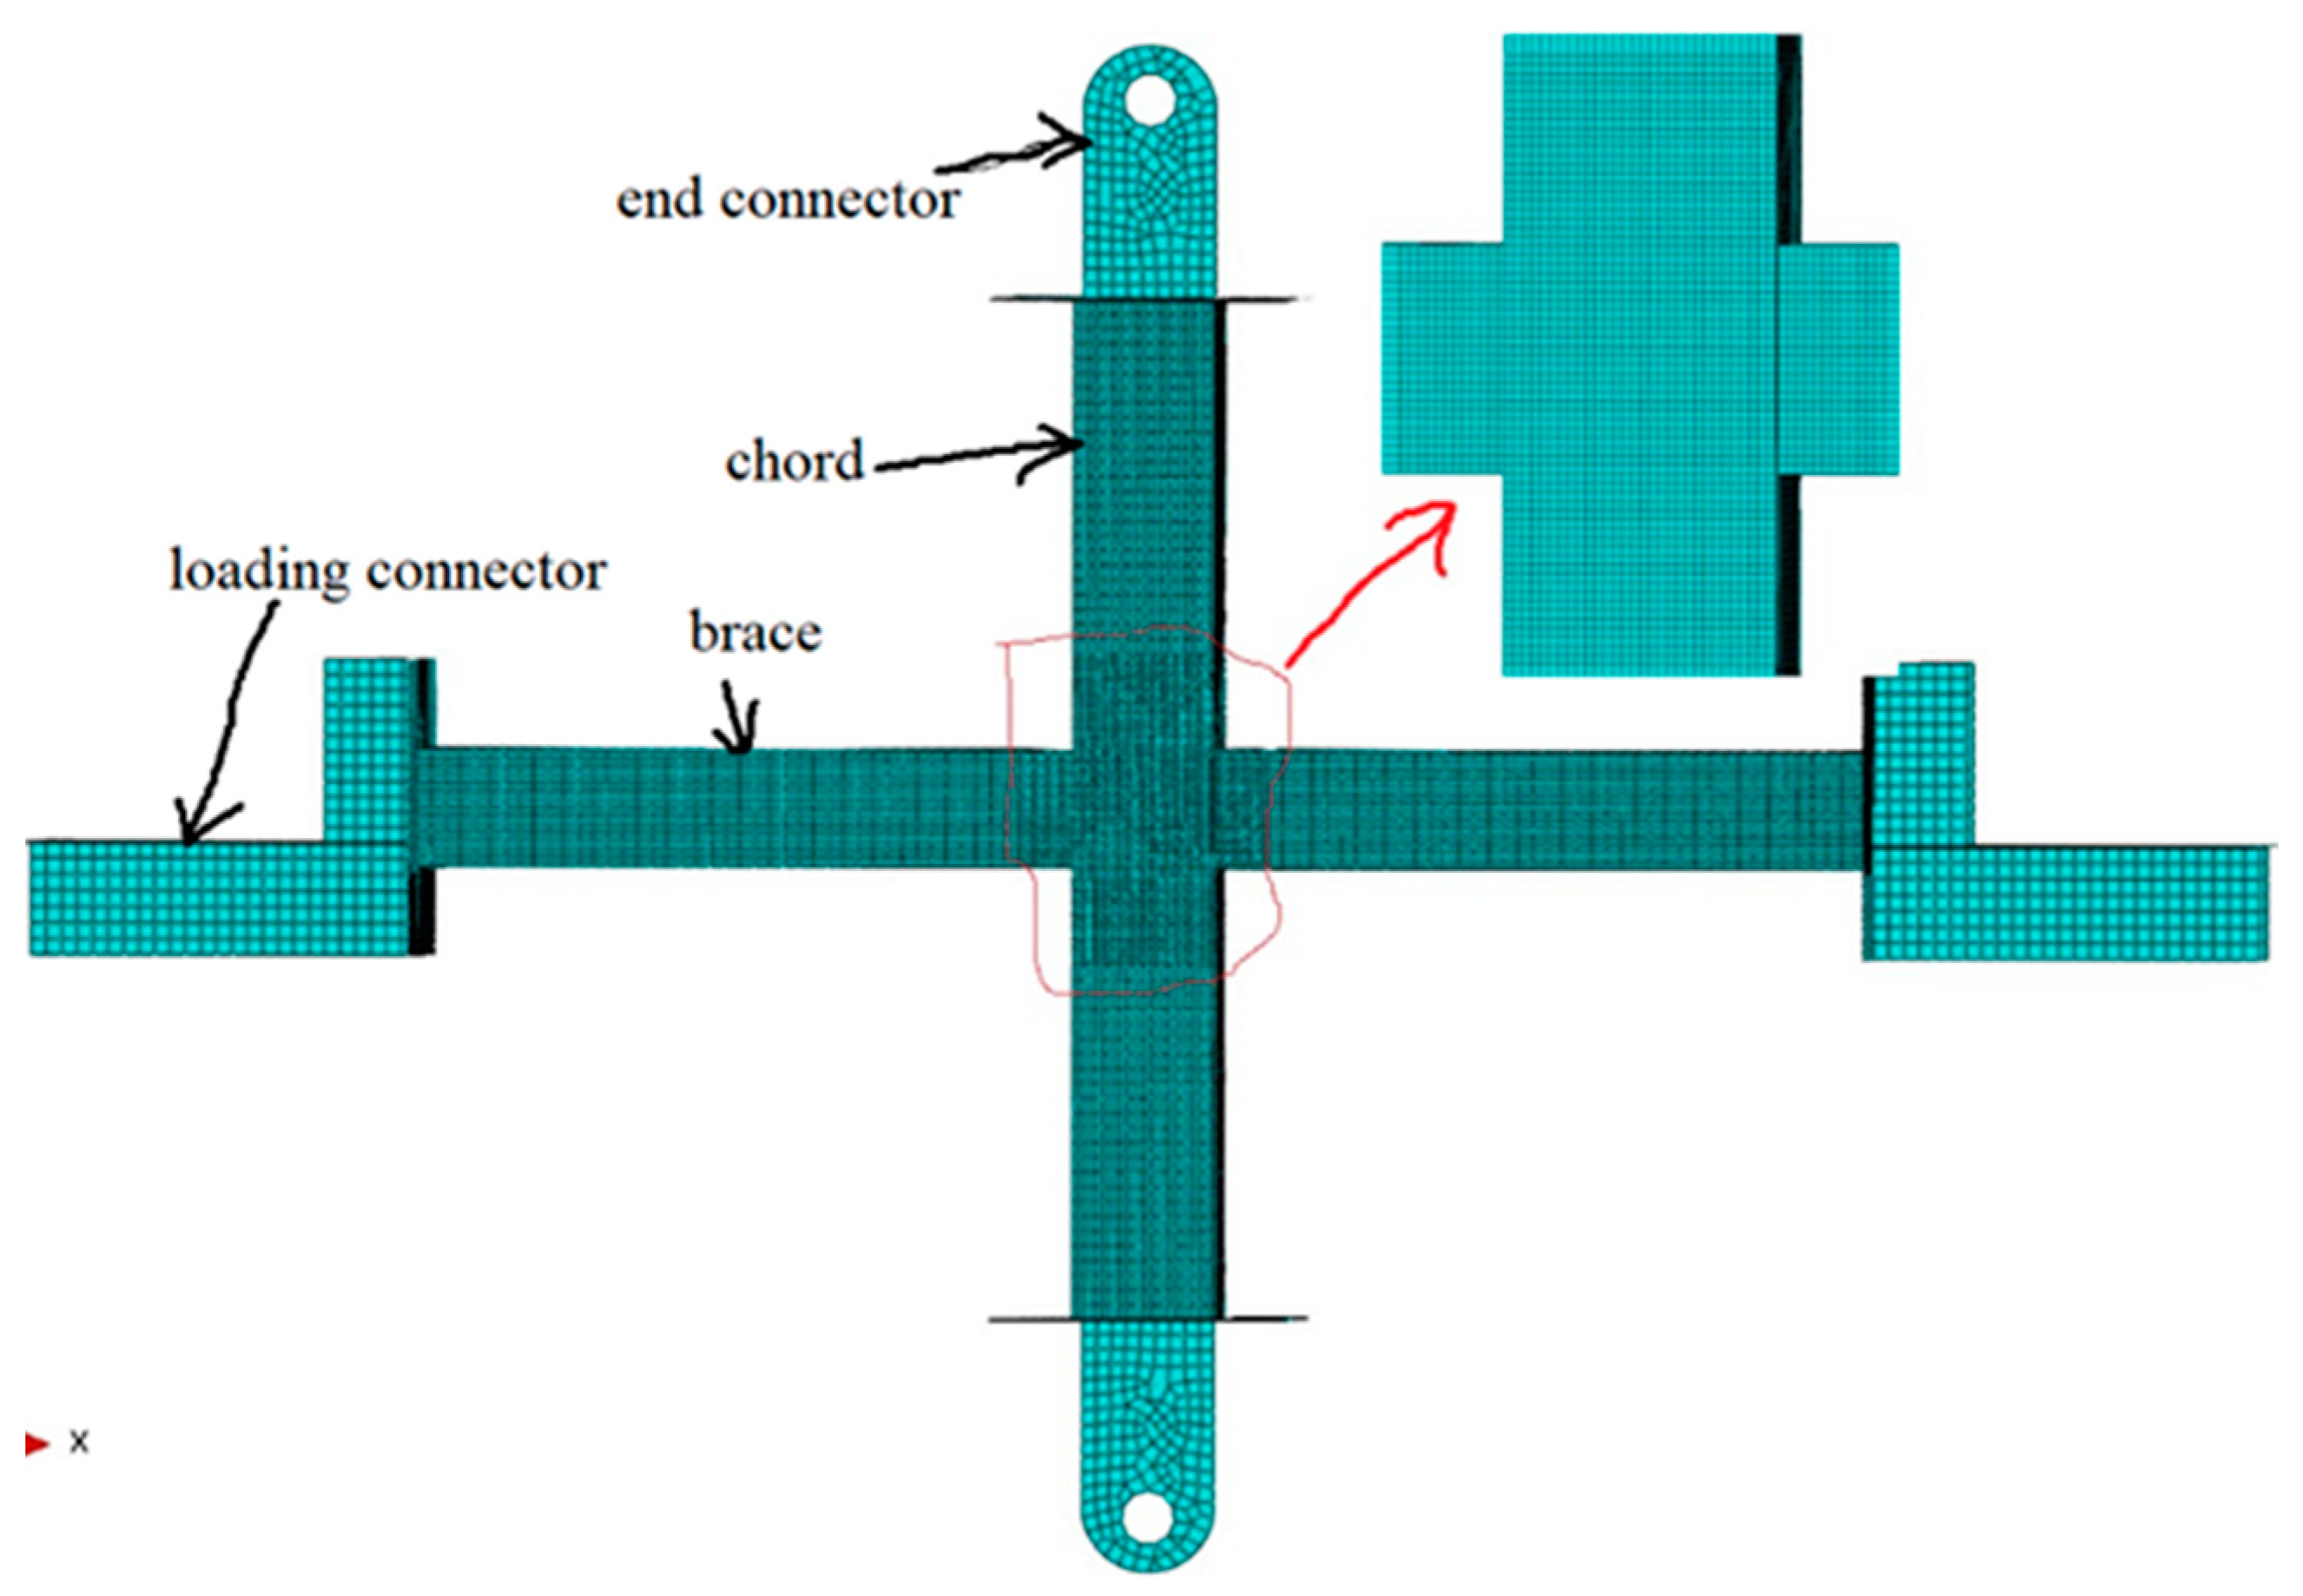
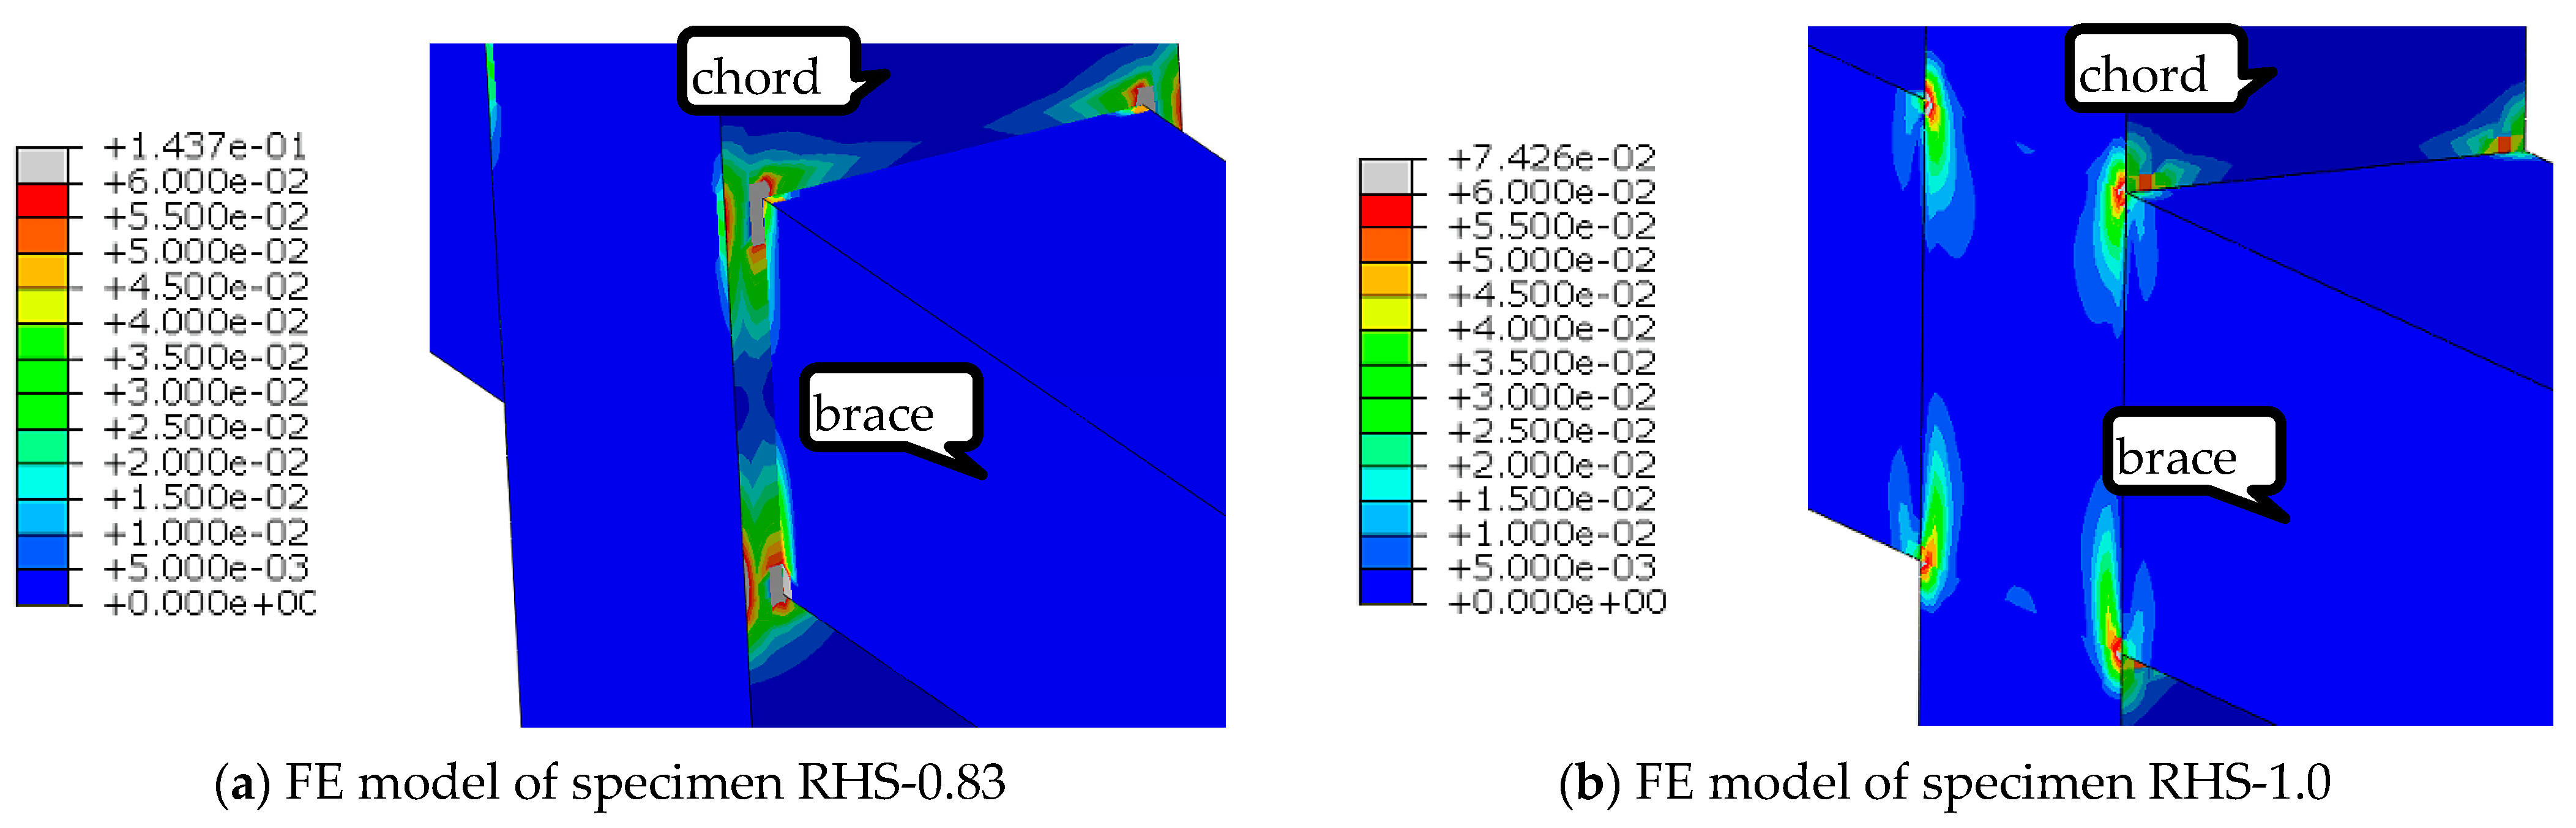
4.1. Finite Element (FE) Models

Following the test study, a finite element (FE) investigation is performed to further discuss the effects of β (the brace-to-chord width ratio) on the behavior of the RHS X-joints subjected to in-plane bending moment (IPBM). Figure 9 illustrates the FE model for the simulation of the specimen RHS-0.83 (the simulation of specimen RHS-1.0 is similar), which is based on the geometric size of the specimen and established by the program ABAQUS [33]. In FE models, a simple ‘tie constraint’ [33] is used to simulate the bolted connection between the end-connector and the chord end-plate in the physical test. A Similar simplification technique is applied to the connection between the loading connectors and the brace end-plates. The holes of two end-connectors are hinges to simulate the boundary conditions applied in the test, and the vertical displacement loads are applied to the two loading connectors to simulate the loads of the two hydraulic actuators. In the finite element (FE) model, the welds near the brace/chord intersection are not simulated. This decision is based on the following reason: the beneficial effects of weld geometry (e.g., improved strength) are counterbalanced by the adverse effects of weld residual stresses, while the exact determination of weld residual stresses is challenging and requires sophisticated analysis techniques. Since the beneficial and adverse effects of welds are complex and difficult to quantify precisely, they are disregarded in the FE model to simplify the analysis and avoid potential inaccuracies. As for the element type and mesh, since FE models employ four-node reduced integration shell elements (S4R) [33], finer meshes with the size of T (the chord thickness) are employed for the braces and chord in the joint-zone region to accurately capture the stress distribution.
During the FE calculation, geometric nonlinearity is accounted for using the NLGEOM option in ABAQUS 6.12 [33]. Material nonlinearity is modeled using a metal plasticity model with Von Mises yield criterion, associated plastic flow, and linear kinematic hardening. The elastic modulus (E) and yielding strength (fy) are taken from the results of Table 2, and the tangent modulus (Et) is taken as 0.01E. In addition, to simulate the effect of the damage and fracture, the ‘ductility damage’ option in ABAQUS is also applied in material of the FE models. In the option, the three parameters of the initial damage criterion are as follows. The first parameter is named the fracture strain, which is equivalent plastic strain at initial damage, calculated as εifpl = ln(A0/Af) (refer to Seo et al. [34]). Here, A0 is the initial cross-section area of the tensile coupon test specimen, and Af is the cross-section area after fracture. The second parameter is named the strain rate, which is zero due to static analysis; that is, material strain rate sensitivity is not taken into account. The third parameter is stress triaxiality (ηtr), which is defined as the ratio of the mean stress to the von Mises equivalent stress (σm/σe). It can be calculated by the approximate equation of ηtr = 1/3 + ln(1 + 0.5a1/R1), which was proposed by Bridgman [35], where a1 is the radius of cross-section at notch root of the tensile coupon specimen, R1 is the radius of the notch, and R1 tends to infinity for a smooth coupon specimen. Based on result of the tensile coupon test, εifpl are 0.18 and 0.182 for the RHS tubulars with cross-section of 180 × 180 × 6 (width × depth × thickness) and 150 × 150 × 6, respectively, in the FE simulation, and ηtr = 1/3 in the FE simulation. For the ‘damage evolution’ option, it adopts the displacement type with linear softening, and the ultimate displacement at complete fracture can be approximate calculated by the equation uf = cfpl (refer to Zhou [36]). Here, L is the feature length of the element, εcfpl is the plastic strain at complete fracture, and g and ζ are the gauge length and fracture elongation of the tensile coupon specimen, respectively. As a result, for the two RHS tubulars with the section sizes of 150 × 150 × 6 and 180 × 180 × 6, uf is 18.6 mm and 18.5 mm, respectively.

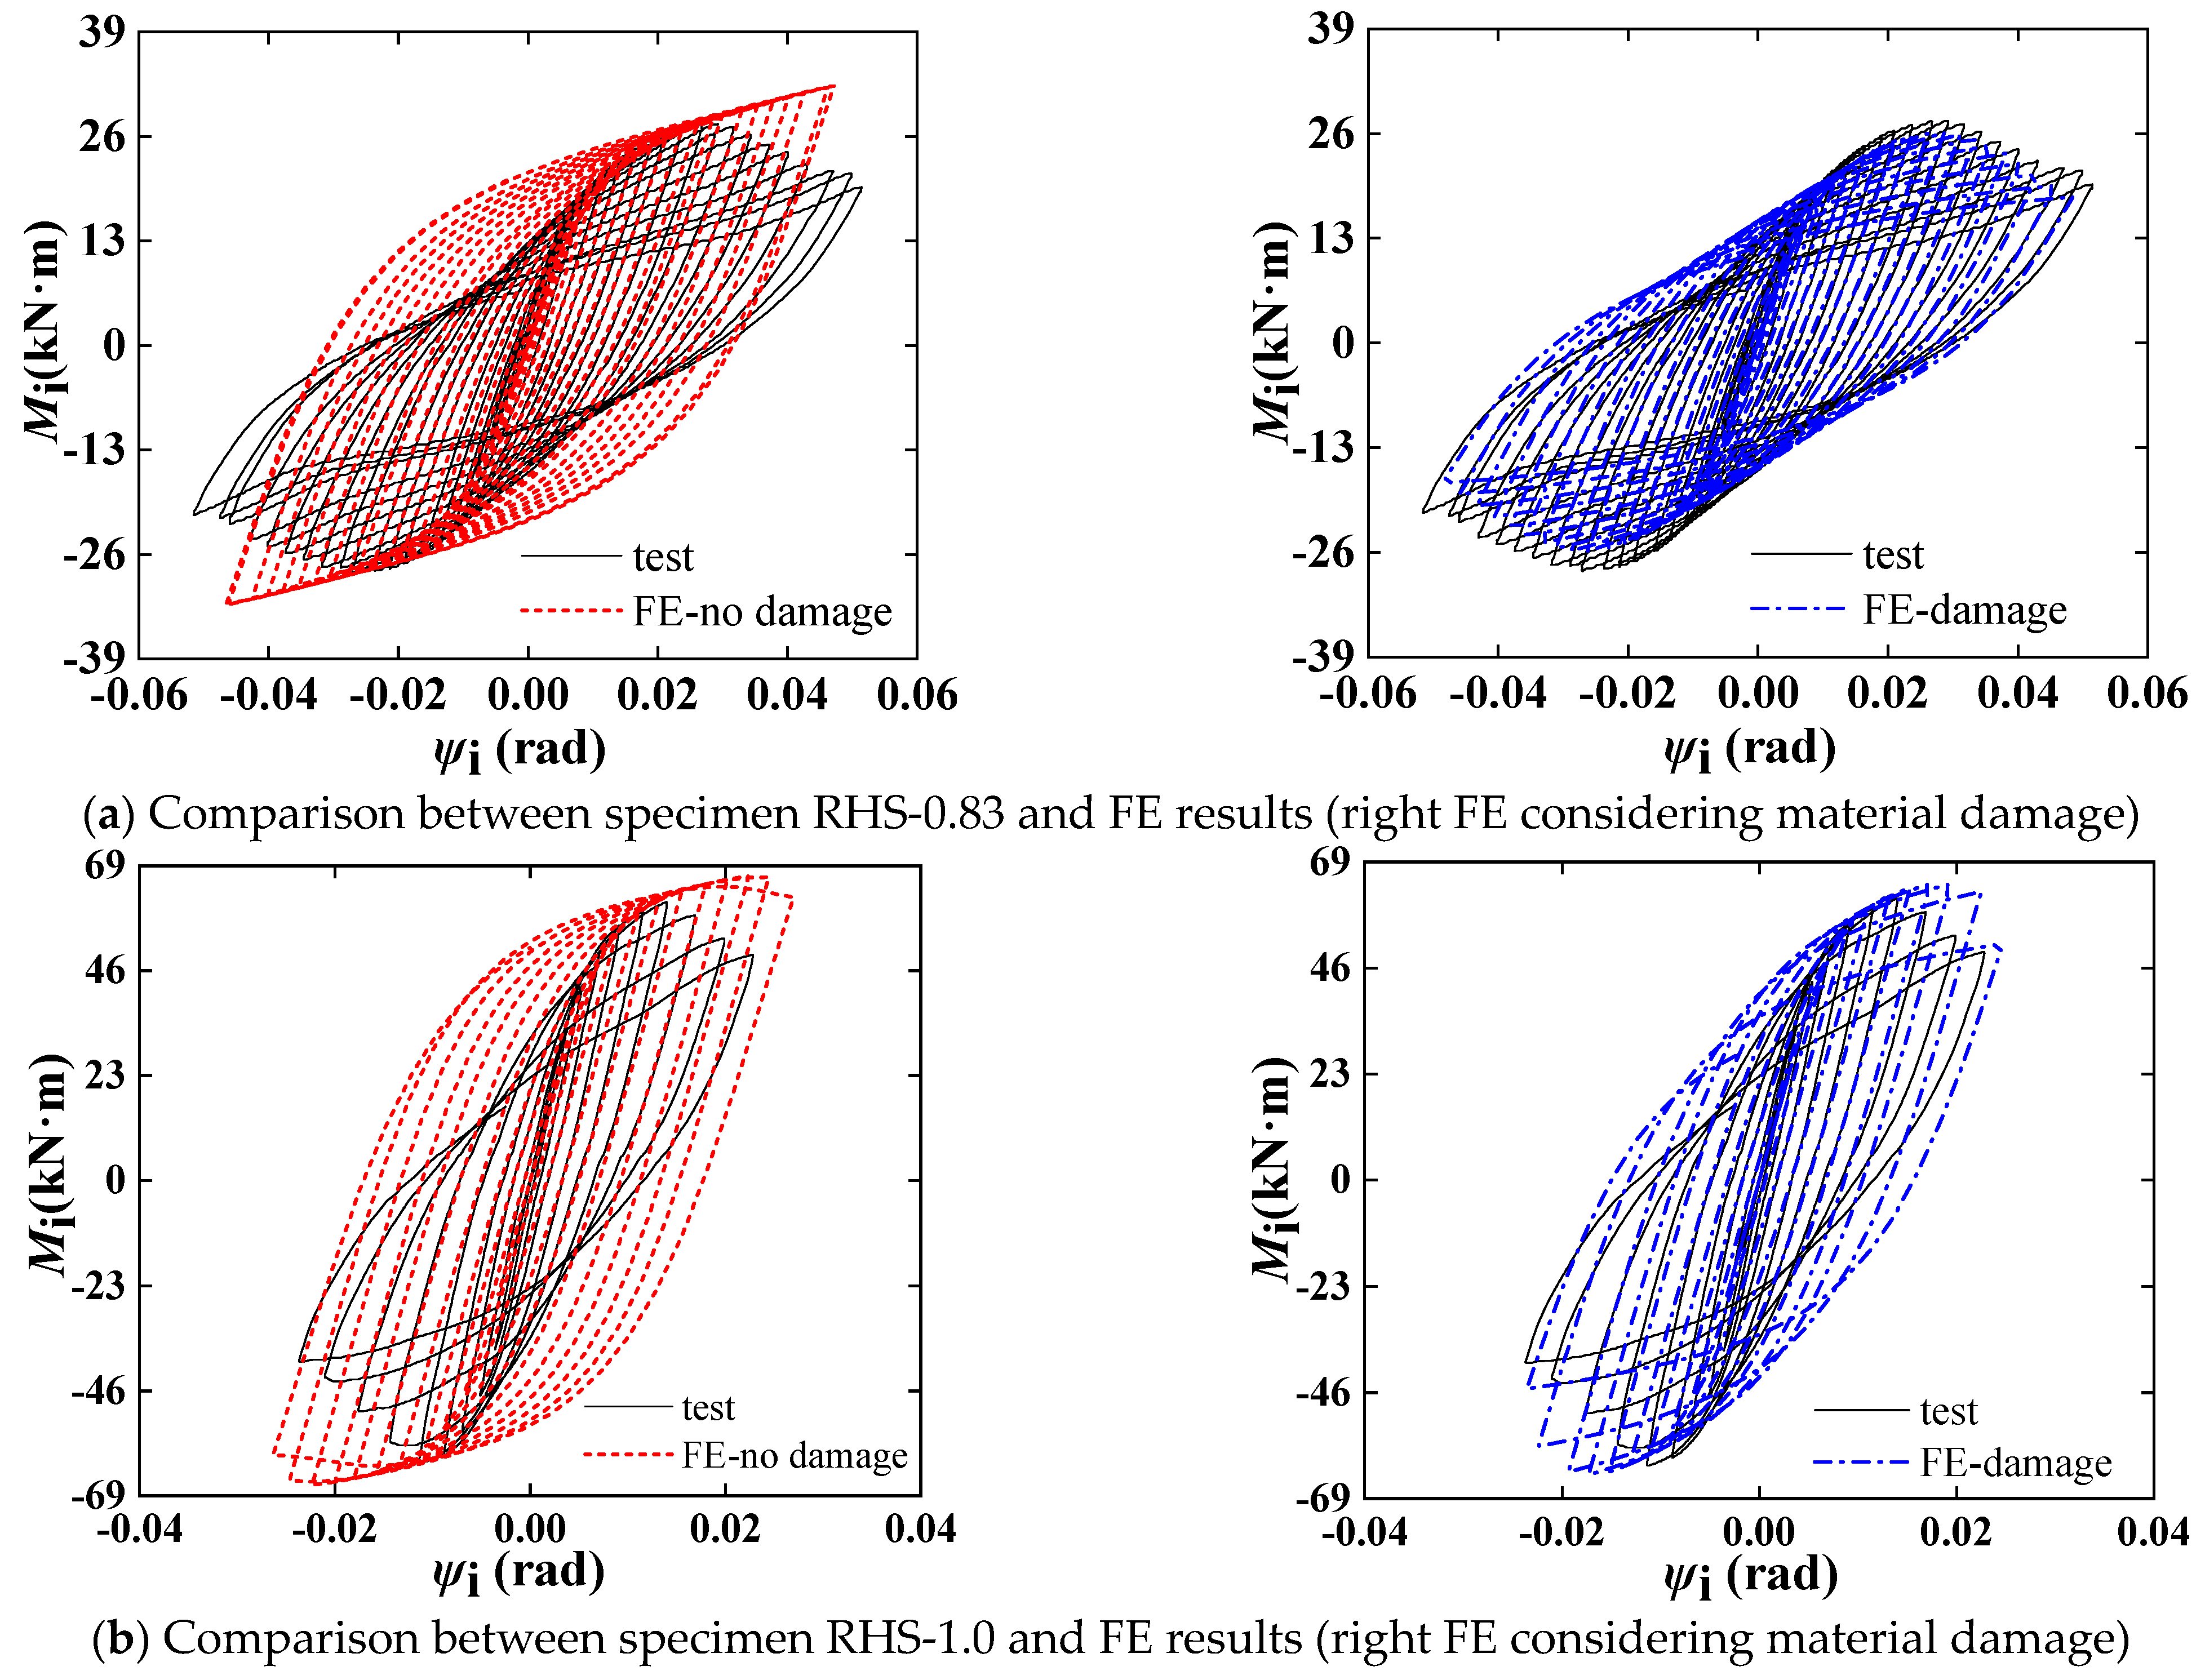
4.2. Compared with Test Results

Figure 10 presents the moment–rotation (Mi-ψi) curves of the FE results based on whether the material was considered damage or not, as well as the test result comparison. In Figure 10, ‘test’ represents the test results (only the results of brace 1 are shown, with brace 2 following a similar pattern); ‘FE-no damage’ represents the FE results, in which the material does not consider damage; and ‘FE-damage’ represents the FE results, in which the material considers damage. Figure 10 illustrates that there are considerable disparities between test results and the FE simulations without considering material damage because the FE cannot reflect the strength degradation and the pinching effect of the curve after cracking. In contrast, the FE results that consider material damage can simulate the strength degradation caused by the damage and fracture, so it is close to the test results. However, there are some differences in the pinching effect, which is mainly due to the complex damage evolution being simplified as the displacement linear softening mode in the FE models. This simplified damage evolution model cannot accurately capture the effect of cumulative damage accumulation over multiple cycles of loading and unloading, resulting in discrepancies between the FE simulations and experimental observations. In addition, it is difficult to accurately reflect the complex damage evolution of the RHS joints under cyclic load even if a more complex damage evolution model (which needs some parameters that cannot be obtained by tensile coupon tests) is used for simulation, not to mention the welding residual stress will also affect the damage of the RHS joints.

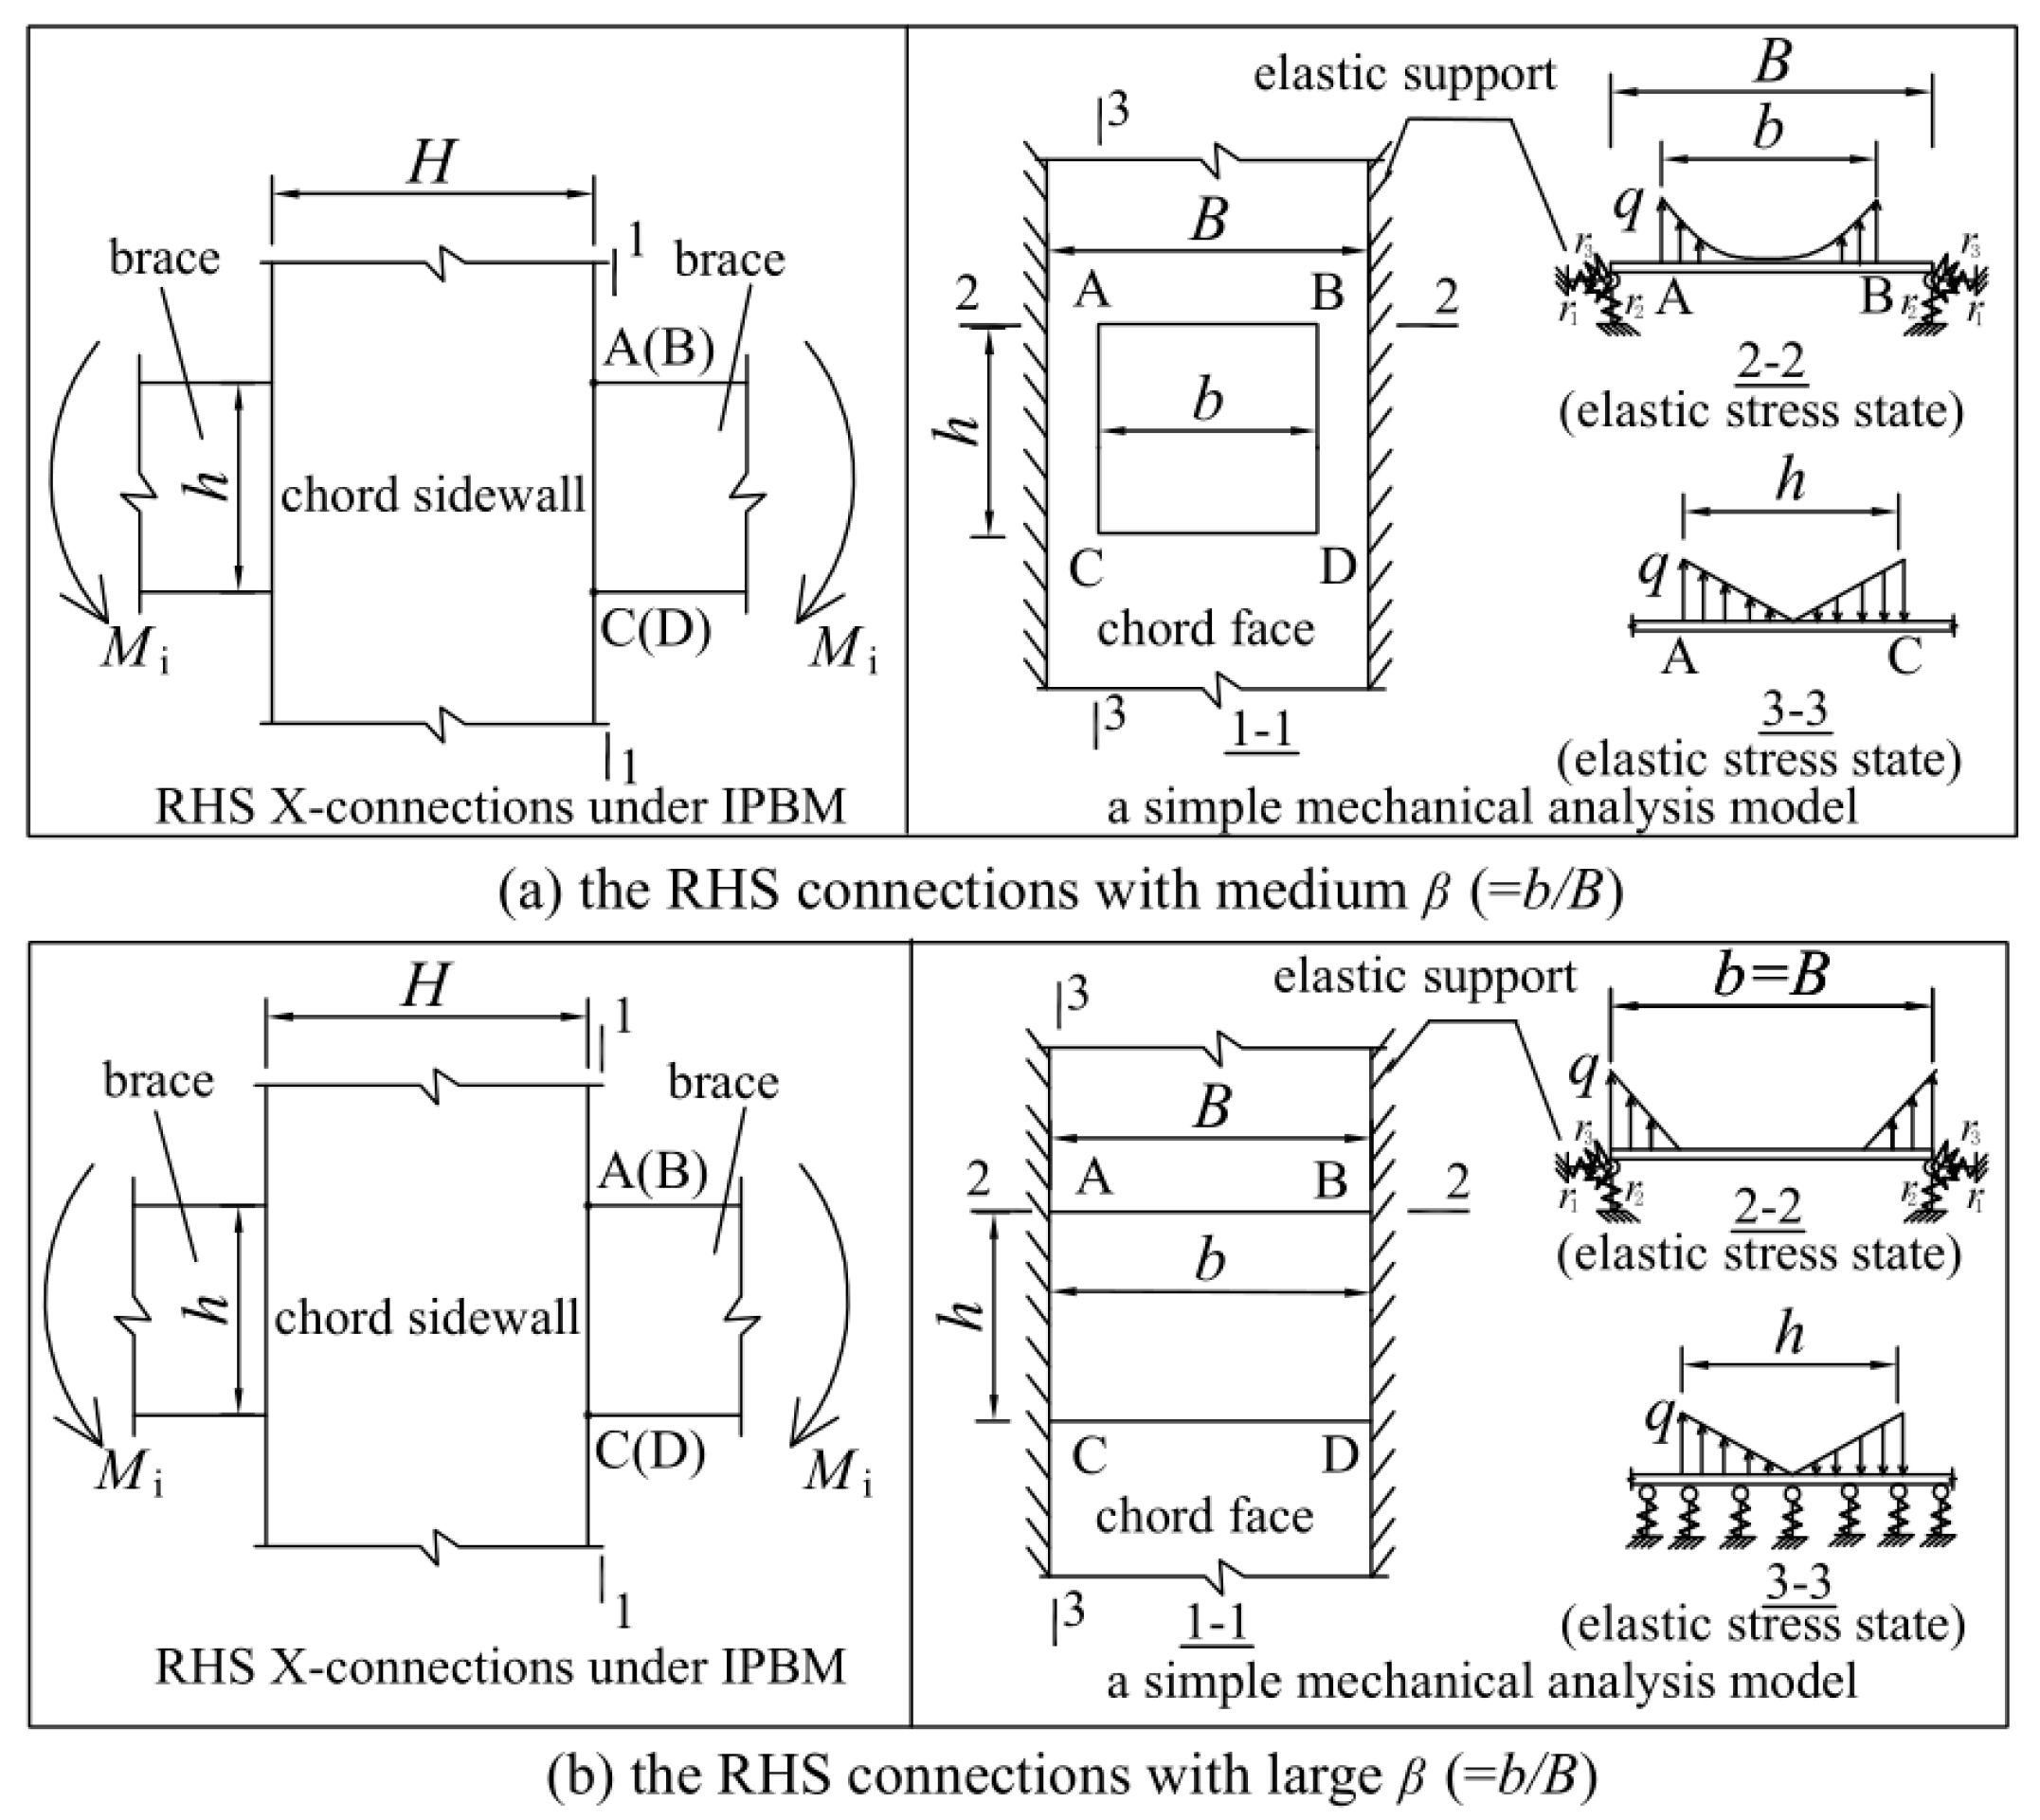
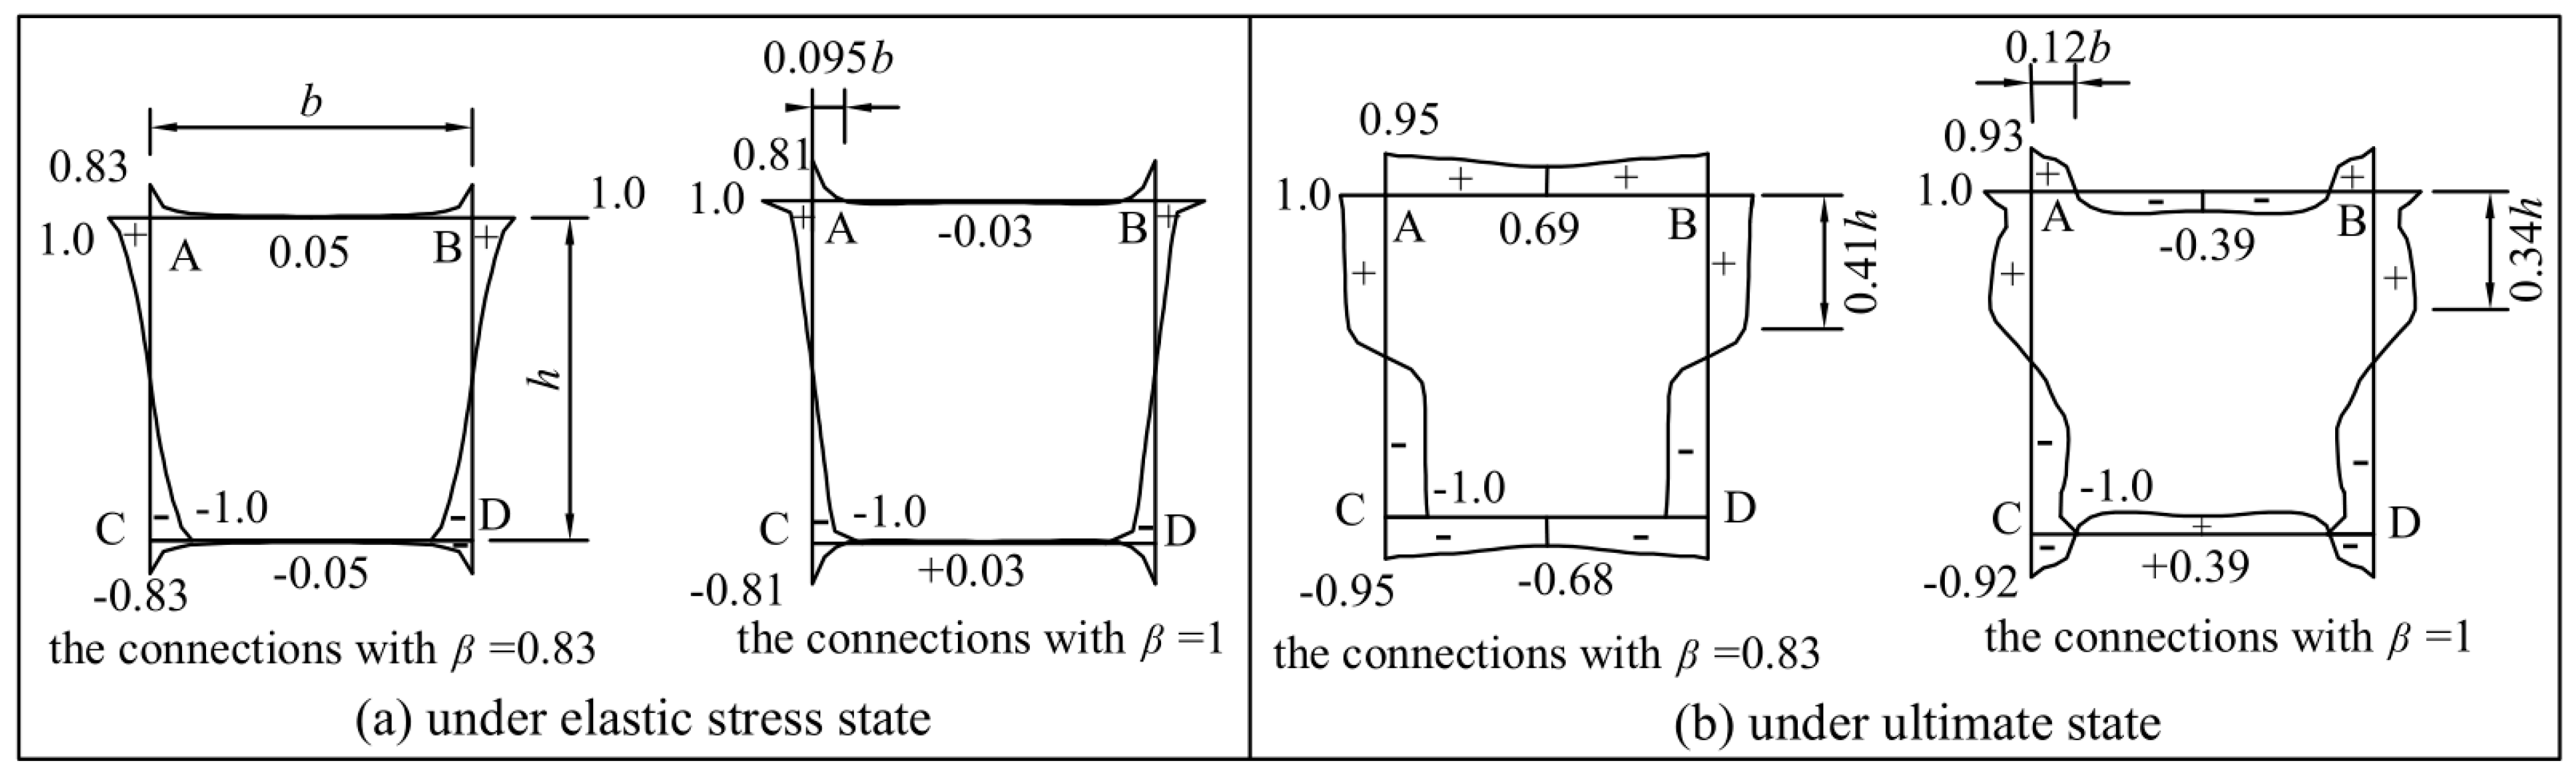
4.3. Load Transfer Mechanism Analysis

A load transfer model is introduced to provide a deeper understanding of the remarkable difference in the flexural performance between the two RHS joints with medium β and large β. Under in-plane bending moment (IPBM) loading, the connection region of the chord face of the RHS joint can be simplified as a narrow plate with continuous elastic supports (reflecting the constraint action of the chord sidewalls) at two ends, as shown in the profile section 1-1 of Figure 11. The in-plane moment (Mi) can be represented by the load q, which is distributed on the brace/chord intersections (i.e., lines AB, BD, CD, and AC in Figure 11). For the RHS joints with medium β, the load along the brace web-to-chord face intersection (i.e., lines AC and BD) is large at two ends and zero in the middle, and the load along the brace flange-to-chord face intersection (i.e., lines AB and CD) is large at two ends due to being near the elastic supports, as shown in the section 2-2 and section 3-3 of Figure 11a. For the RHS joints with large β (β = 1), the load q from Mi is mainly distributed along the lines AC and BD due to being supported by the elastic supports, as shown in the section 2-2 and section 3-3 of Figure 11b.
The above load transfer mechanism is confirmed by the FE simulation results of the two specimens (specimens RHS-0.83 and RHS-1.0), as shown in Figure 12a which plots the stress component along the brace axis σ11 (using relative value) of each element of the brace wall near the intersection under elastic stress condition. As for the stress distribution under the ultimate state (i.e., under the moment Mi just prior to initial cracking in the physical test), the stress is redistributed due to the plastic development of the plate with elastic supports, but the redistribution effect of the two plates is different, the results are as shown in Figure 12b. For the RHS joints with medium β, the plastic redistribution causes the load to be evenly distributed along the four lines (the lines AB, BD, CD, and AC). For the RHS joints with large β, the plastic distribution only causes the load to be evenly distributed along the two lines (the lines BD and AC), while the load along another two lines (the lines AB and CD) is large at the ends, and small and opposite in the middle. This indicates that for the RHS joints with large β (β = 1), the tensile stress is concentrated near the corner of the brace root (e.g., point A) while also larger along the brace webs (i.e., the lines AC and BD in Figure 12b), which leads to the corner cracking and the crack extends along the brace webs. This is consistent with the crack expansion of the specimen RHS-1.0 in the physical test. For the RHS joints with medium β, although the tensile stress is the largest at the corner connected to the chord face (the corner not supported by the chord sidewall), the tensile stress at the middle flange of the brace root is not small. Therefore, the flange of the brace root and the chord face near the corner will crack at the same time, which is consistent with the crack development trend of the specimen RHS-0.83 in the physical test.
The load transfer mechanism suggests that for the RHS joints with large β, the load (q) is mainly borne by the elastic supports, implying that the bearing capacity depends on the capacity of the elastic support (the axial bearing capacity of the chord sidewall). For the RHS joints with medium β, the load (q) is mainly borne by the plate, implying that the capacity depends on the flexural capacity of the plate (the chord face). Therefore, the bearing capacity of RHS joints with large β is remarkably larger than that of the RHS joints with medium β.
Figure 13 illustrates the contour of equivalent plastic strain (εep) of the joint-zone of the two specimens at the moment just prior to the initial cracking of the physical test When comparing the specimen RHS-0.83 (β = 0.83), which develops more extensive region of the high εep (gray and red regions) both in the chord wall near the corner and in the brace flange near the corner, to the specimen RHS-1.0 (β = 1), which only develops high εep in the limited region near the corner. Therefore, the specimen RHS-0.83 is cracked at both the chord wall and the brace root (where there is a weld in the physical specimen), while specimen RHS-1.0 is only cracked at the brace root near the corner (where there is a weld in the physical specimen), and the former demonstrates superior energy dissipation and ductility compared to the later.

5. Conclusions

This study has investigated the seismic behavior of RHS X-joints subjected to in-plane bending moment (IPBM). Two joint specimens with different brace-to-chord width ratio (β) are experimentally subjected to cyclic IPBM loading, and the subsequent FE analysis and the load transferring mechanism are subjected again to further interpret the test observations. The main conclusions are as follows:
  • Two RHS X-joint specimens have different failure mode: the X-joint with large β (β = 1.0) is failed by the tearing of the weld near the brace root, while the X-joint with medium β (β = 0.83) finally failed owing to the tearing of the weld and the adjacent chord face. Both two X-joints experienced remarkable plastic development on the faces and sidewalls of the chord before the tearing failure.
  • An increase in β (from 0.83 to 1.0) can remarkably increase the flexural strength of the X-joints but compromises the deformation capacity, energy dissipation capability, and ductility ratio.
  • The current code equations provide a conservative prediction of the strength of the RHS X-joints subjected to IPBM. In contrast, the modified equations, which consider the influence of weld size provide a well prediction of the strength.
  • The FE models, considering material damage, can simulate the strength degradation behavior of the hysteretic curves after the cracking of the RHS joints, so its hysteretic curves are close to the test results.
  • A load transfer mechanism of the RHS joints and FE strain analysis results are used to further interpret the reasons behind the experimental observations.
The most significant tendency observed in this study is the impact of the brace-to-chord width ratio (β) on the seismic behavior of RHS X-joints under cyclic IPBM. The findings of this study lay the foundation for further research and exploration in several key areas related to the seismic behavior of RHS X-joints. There are some potential next steps for future study, as follows: The first is the seismic behavior of RHS joints under other loading, e.g., cyclic out-of-plane bending moment, cyclic axial force of the brace, even the combination of the axial force and moment. This will be particularly useful for understanding the seismic behavior of the RHS joints applied in the tubular structures. Secondly, flexural behavior of the X-joints is studied extensively by parametric analysis, the parameter including the chord thicknesses, material yield strength, etc. This will provide a deeper understanding for the seismic behavior of the RHS joints and will also enable the identification of optimal configurations that offer a balance between strength, deformation capacity, and ductility.

Author Contributions

Conceptualization, B.Z.; methodology, B.Z.; validation, C.L. and S.L.; writing—original draft, B.Z.; writing—review and editing, C.L. and R.W. All authors have read and agreed to the published version of the manuscript.

Funding

This search was supported by the Natural Science Foundation of Zhejiang Province (No. LY20E080020). This research was also supported by Engineering Research Center of Ministry of Education for Renewable Energy Infrastructure Construction Technology.

Data Availability Statement

Data are contained within the article.

Conflicts of Interest

The authors declare no conflict of interest.

Nomenclature

H, B, Tdepth, width and thickness of the chord, respectively
h, b, tdepth, width and thickness of the brace, respectively
βbrace-to-chord width ratio (b/B)
β1brace depth-to-the chord width ratio (h/B)
γchord width-to-thickness ratio (B/T)
ζfracture elongation
τbrace-to-chord thickness ratio (t/T)
χchord depth-to-width ratio
fuultimate strength
fcyyield strength of the chord
E, Etelastic and tangential hardening modulus of steel, respectively
Miin-plane bending moment (IPBM); Miu ultimate flexural strength under IPBM
ψy, ψuyield rotation and the ultimate rotation
μductility ratio of the joints (ψu /ψy)
Preaction force at brace end
δtotal vertical deflection of the load center with respect to the chord
Etotaccumulative energy dissipation
Eyelastic energy of the specimens
ηtotaccumulative energy dissipation ratio (Etot /Ey)
ηaenergy dissipation ratio
ηtrstress triaxiality

References

  1. Zhao, B.; Sun, C.; Zheng, Y.; Cai, Y. Effects of adjacent brace interaction on the out-of-plane flexural behavior of CHS connections. Eng. Struct. 2021, 231, 111711. [Google Scholar] [CrossRef]
  2. Zhao, B.; Shao, Z.; Liu, C.; Wu, X.; Chen, Y. Influence of brace-to-chord angle on the seismic behavior of circular hollow section X-joints under in-plane bending. Eng. Struct. 2022, 264, 114419. [Google Scholar]
  3. Zhao, B.; Liu, C.; Wu, H.; Ge, Y.; Yang, J.; Yi, Q. Study on out-of-plane flexural stiffness of unstiffened multi-planar CHS X-Joints. Eng. Struct. 2019, 188, 137–146. [Google Scholar] [CrossRef]
  4. Han, Q.H.; Liu, Y.M.; Xu, Y. Stiffness characteristics of joints and influence on the stability of single-layer latticed domes. Thin-Walled Struct. 2016, 107, 514–525. [Google Scholar] [CrossRef]
  5. Pandey, M.; Young, B. Effect of member orientation on static strengths of cold-formed high strength steel tubular X-joints. Thin-Walled Struct. 2022, 170, 108501. [Google Scholar] [CrossRef]
  6. Pandey, M.; Young, B. Numerical analysis and design of cold-formed high strength steel RHS X-joints at elevated temperatures. J. Constr. Steel Res. 2023, 210, 107892. [Google Scholar] [CrossRef]
  7. Pandey, M.; Young, B. Static performance and design of cold-formed high strength steel rectangular hollow section X-joints. Eng. Struct. 2023, 288, 114997. [Google Scholar] [CrossRef]
  8. Jubb, J.E.M.; Redwood, R.G. Design of joints to box sections. In Conference on Industrial Building and the Structural Engineer; Institution of Structural Engineers: London, UK, 1966. [Google Scholar]
  9. Zhao, X.L.; Hancock, G.J. T-joints in rectangular hollow sections subject to combined actions. J. Struct. Eng. ASCE 1991, 117, 2258–2277. [Google Scholar] [CrossRef]
  10. Cao, J.J.; Packer, J.A.; Yang, G.J. Yield line analysis of RHS connections with axial loads. J. Constr. Steel Res. 1998, 48, 1–25. [Google Scholar] [CrossRef]
  11. Feng, R.; Young, B. Theoretical analysis of cold-formed stainless steel tubular joints. Eng. Struct. 2015, 83, 99–115. [Google Scholar] [CrossRef]
  12. Havula, J.; Garifullin, M.; Heinisuo, M.; Mela, K.; Pajunen, S. Moment-rotation behavior of welded tubular high strength steel T joint. Eng. Struct. 2018, 172, 525–537. [Google Scholar] [CrossRef]
  13. Pandey, M.; Young, B. Structural performance of cold-formed high strength steel tubular X-joints under brace axial compression. Eng. Struct. 2020, 208, 109768. [Google Scholar] [CrossRef]
  14. Lan, X.Y.; Chan, T.M.; Young, B. Testing, finite element analysis and design of high strength steel RHS T-joints. Eng. Struct. 2021, 227, 111184. [Google Scholar] [CrossRef]
  15. EC3. Design of Steel Structures, Part 1.8: Design of Joints; European Committee for Standardization: Brussels, Belgium, 2005. [Google Scholar]
  16. Wang, Z.Y.; Wang, Q.Y. Yield and ultimate strengths determination of a blind bolted endplate connection to square hollow section column. Eng. Struct. 2016, 111, 345–369. [Google Scholar] [CrossRef]
  17. Zhao, B.; Ke, K.; Liu, C.; Hong, L. Computational model for the flexural capacity and stiffness of eccentric RHS X-connections under brace out-of-plane bending moment. J. Struct. Eng. 2020, 146, 04019227. [Google Scholar] [CrossRef]
  18. Mashiri, F.R.; Zhao, X.L. Plastic mechanism analysis of welded thin-walled T-joints made up of circular braces and square chords under in-plane bending. Thin-Walled Struct. 2004, 42, 759–783. [Google Scholar] [CrossRef]
  19. Pandey, M.; Young, B. New design rules of cold-formed high strength steel CHS-to-RHS X-joints. Thin-Walled Struct. 2023, 188, 110642. [Google Scholar] [CrossRef]
  20. Feng, R.; Liu, Y.X.; Zhu, J.H. Tests of CHS-to-SHS tubular connections in stainless steel. Eng. Struct. 2019, 199, 109590. [Google Scholar] [CrossRef]
  21. Chang, H.; Zuo, W.; Yang, J.; Song, X.; Huang, Y. Compressive strength of collar plate reinforced SHS T-joints: Effect of geometrical parameters and chord stress ratio. J. Constr. Steel Res. 2020, 174, 106278. [Google Scholar] [CrossRef]
  22. Gomes, N.V.; de Lima, L.R.; Vellasco, P.D.; Da Silva, A.T.; Rodrigues, M.C.; Costa-Neves, L.F. Experimental and numerical investigation of SHS truss T-joints reinforced with sidewall plates. Thin-Walled Struct. 2019, 145, 106404. [Google Scholar] [CrossRef]
  23. Jia, B.; Zhang, W.; Wu, T.; Wang, Y.; Yu, S. Experimental Study of the Seismic Behavior of a Prefabricated Low-Rise Steel Frame Structure with Hinged Joint. Buildings 2022, 12, 2088. [Google Scholar] [CrossRef]
  24. Soh, C.K.; Fung, T.C.; Qin, F.; Gho, W.M. Behavior of completely overlapped tubular connections under cyclic loading. J. Struct. Eng. 2001, 127, 122–128. [Google Scholar] [CrossRef]
  25. Zhao, X.; Liu, J.; Xu, X.; Sivakumaran, K.S.; Chen, Y. Hysteretic behaviour of overlapped tubular k-connections under cyclic loading. J. Constr. Steel Res. 2018, 145, 397–413. [Google Scholar] [CrossRef]
  26. Zhao, B.; Li, F.; Liu, C.; Huang, Z. Effect of loading patterns on in-plane flexural hysteretic performance of CHS X-connections. J. Build. Eng. 2022, 57, 104839. [Google Scholar]
  27. Huang, X.; Wei, C.; Zhou, J.; Zhao, J.; Ge, J. Experimental and numerical study on ultra low cycle fatigue fracture of X steel tubular joints with CHS braces to SHS chord. Thin-Walled Struct. 2021, 162, 107564. [Google Scholar] [CrossRef]
  28. Xing, J.; Wang, Y.; Hizb, U.S.; Chen, A.; Yang, N. Low cycle fracture behavior of steel members with circular hollow section subjected to eccentric load. Structures 2021, 33, 4269–4285. [Google Scholar] [CrossRef]
  29. Luo, Y.; Zhao, Y.; Chen, Y.; Lin, X.; Yan, J. Experimental Studies on Seismic Performance of UHPSFRC-Filled Square Steel Tubular Columns. Buildings 2022, 12, 798. [Google Scholar] [CrossRef]
  30. GB50661-2011; Code for Welding of Steel Structures. China Architecture Industry Press: Beijing, China, 2012. (In Chinese)
  31. Kurobane, Y.; Makino, Y.; Ochi, K. Ultimate resistance of unstiffened tubular joints. J. Struct. Eng. 1984, 110, 385–400. [Google Scholar] [CrossRef]
  32. Fang, C.; Wang, W.; He, C.; Chen, Y. Self-centring behaviour of steel and steel-concrete composite connections equipped with NiTi SMA bolts. Eng. Struct. 2017, 150, 390–408. [Google Scholar] [CrossRef]
  33. ABAQUS Analysis User’s Manual; Version 6.12; ABAQUS Standard: Vélizy-Villacoublay, France, 2012.
  34. Seo, J.M.; Kim, H.T.; Kim, Y.J.; Yamada, H.; Kumagai, T.; Tokunaga, H.; Miura, N. Effect of strain rate and stress triaxiality on fracture strain of 304 stainless steels for canister impact simulation. Nucl. Eng. Technol. 2022, 54, 2386–2394. [Google Scholar] [CrossRef]
  35. Bridgman, W.P. Studies in Large Plastic Flow and Fracture with Special Emphasis on the Effects of Hydrostatic Pressure; Harvard University Press: Cambridge, MA, USA, 1964. [Google Scholar]
  36. Zhou, T.H.; Li, W.C.; Guan, Y. Damage analysis of steel frames under cyclic load based on stress triaxiality. Eng. Mech. 2014, 31, 146–155. (In Chinese) [Google Scholar]
Figure 1. Geometric sizes of the RHS X-joints specimens (unit: mm).
Buildings 13 02503 g001
Figure 2. The connection welds between the brace and the chord.
Buildings 13 02503 g002
Figure 3. Photo of loading system.
Buildings 13 02503 g003
Figure 4. Arrangement of displacement sensors and strain gauges.
Buildings 13 02503 g004
Figure 5. Failure mode of the two specimens.
Buildings 13 02503 g005
Figure 6. P-δ curves of the two specimens.
Buildings 13 02503 g006
Figure 7. Comparison of in-plane moment versus rotation (M-ψ) curves between specimen RHS-0.83 and specimen RHS-1.0.
Buildings 13 02503 g007
Figure 8. Resistance-strain responses of the specimens at representative critical locations.
Buildings 13 02503 g008
Figure 9. Representative finite element model.
Buildings 13 02503 g009
Figure 10. Moment–rotation curves comparison between test and FE results.
Buildings 13 02503 g010
Figure 11. A simple mechanical analysis model for RHS X-joints under IPBM.
Buildings 13 02503 g011
Figure 12. Stress distribution of the RHS X-joints near the brace/chord intersection.
Buildings 13 02503 g012
Figure 13. Comparison of equivalent plastic strain distributions of the two RHS connection specimen models.
Buildings 13 02503 g013
Table 1. Geometric sizes of two specimens.
SpecimenH × B × T/mmH × b × t/mmββ1γτχ
RHS-0.83180 × 180 × 6150 × 150 × 60.830.833011
RHS-1.0180 × 180 × 6180 × 180 × 61.01.03011
Table 2. Material properties of the tubes of the specimens.
Section (H × B × T/mm3)fy/MPafu/MPaE/GPaζ/(%)
150 × 150 × 6392.5533.120131.1
180 × 180 × 6385.9535.520630.9
Table 3. Comparison of the code predicted results and test results.
Specimens Miu-test/(kN·m)Miu-EC3-FP/(kN·m)Miu-EC3-SC/(kN·m)Miu-EC3-FP/Miu-testMiu-EC3-SC/Miu-test
RHS-0.8328.121.7-0.77-
RHS-1.061.8-40.8-0.66
Table 4. The ductility ratio of specimens.
Specimenψiy+ψiy−ψiu+ψiu−μ+μ
RHS-0.83brace10.01010.01310.04580.04464.533.40
brace20.00980.01270.04490.04424.583.48
RHS-1.0brace10.00750.00850.02280.01983.042.33
brace20.00700.00840.02190.02053.132.44
Table 5. Energy dissipation characteristics of two specimens.
Specimens Etot/(kN·mm)Ey/(kN·mm)Ea/(kN·mm)Etri/(kN·mm)ηtotηa
RHS-0.8311,206155.8110189871.91.23
RHS-1.07993207.61287119838.51.07
Disclaimer/Publisher’s Note: The statements, opinions and data contained in all publications are solely those of the individual author(s) and contributor(s) and not of MDPI and/or the editor(s). MDPI and/or the editor(s) disclaim responsibility for any injury to people or property resulting from any ideas, methods, instructions or products referred to in the content.

