Article

Numerical Investigation of the Behavior of Unstiffened Semi-Rigid Top and Seat Angle Connections under Monotonic Loading

by
Zeynep Fırat Alemdar
*,† and
Yusuf Balaban
Department of Civil Engineering, Yıldız Technical University, Istanbul 34220, Turkey
*
Author to whom correspondence should be addressed.
These authors contributed equally to this work.
Buildings 2023, 13(10), 2425; https://doi.org/10.3390/buildings13102425
Submission received: 2 September 2023 / Revised: 19 September 2023 / Accepted: 22 September 2023 / Published: 23 September 2023
(This article belongs to the Special Issue Advances in Steel Structures: Testing, Modelling and Design)

Abstract

:
In steel structures, unstiffened top and seat angle connections (TSACs) show semi-rigid behavior and transfer both the vertical reaction and some end moment of the beam while also making some degree of rotation. The moment–rotation behavior of TSACs has been evaluated using experimental and numerical analyses under monotonic loading and generally compared in the linear elastic region. In this paper, three-dimensional (3-D) finite element models of the TSACs were developed based on experimental data available from the literature to accurately obtain the moment–rotation results along the curve. The numerical models were verified with the moment–rotation curves of TSACs and the deformed shapes of the angles in the connections. The experimental results show that the finite element model in this study is adequate to predict the moment–rotation behavior of TSACs. The effects of bolt material properties, bolt diameter, bolt pretension load, friction coefficient, and gage distance on the moment–rotation behavior of the connections were investigated using the verified numerical model. The parametric analyses show that almost the same moment–rotation behavior is obtained for the connections by increasing the bolt strength and pretension load and varying the friction coefficients. The ultimate moment capacity of the connections was increased with a decrease in the gage distance.

1. Introduction

One of the most demanded structural systems is the steel framework. The assumptions made for the modeling of structural members and especially the definition of the behavior of beam-to-column connection regions are important factors in the analysis of structural systems. In the conventional analysis and design of steel structures, beam–column connections in a frame system are modeled as either fully rigid or pinned. In a rigid connection, it is assumed that the entire end moment of the beam is transferred to the column and no relative rotation occurs. In a pinned connection, it is assumed that no moment is transferred, and relative rotation is allowed without restriction. Experimental research demonstrates that all steel beam–column connection regions are in between rigid and pinned connections and have some stiffness. In connections considered as rigid, the full cross-sectional area of the beam is welded to the column’s flange. However, the connection exhibits nonlinear behavior and is commonly known as semi-rigid connections if the beam and column members are fastened using top and seat angles and a web plate or all angles, with either bolts or rivets [1]. Overestimating the connection rigidity can lead to an underestimation of the lateral deformation capacity, story drift ratio, and the collapse mechanism, whereas underestimating the rigidity of the connection may result in incorrect reaction forces in the beam and column members [2].
The analysis and design of steel frameworks necessitate a detailed consideration of the moment–rotation (M–θ) behavior of beam–column connection regions. To determine the moment–rotation relation of beam–column connections, various methods are utilized, such as experimental, numerical, empirical, analytical, informational, and mechanical models [3]. The most reliable understanding of the behavior of the connections is obtained from experimental data. However, due to the expense of experimental tests, they are typically conducted for research purposes rather than routine design practice [4]. According to the American Institute of Steel Construction (AISC) Allowable Stress Design (ASD) specifications [5], the top and seat angle connection (TSAC) is defined as the top angle is utilized to offer lateral support for the beam’s compression flange, and the seat angle is designed to solely transmit the shear force on the beam to the column member without imposing a significant restraining moment on the end of the beam member. Based on the experimental findings, TSACs are capable of transferring the vertical forces and a certain amount of end moment from the beam to the column member [5]. TSAC is a semi-rigid connection that transfers both the vertical force and some part of the beam’s end moment reaction while also making some degree of rotation.
Numerous research studies have been performed to experimentally investigate the moment–rotation behavior of TSACs. Azizinamini et al. [6] conducted several experimental tests to determine the static and cyclic performance of bolted and bolted and welded TSACs. The geometric properties that influence the performance of the connections were examined, and the M–θ curves of the connections with analytical models were compared. Fleischman [7] conducted experimental tests on TSACs. The test results were evaluated by considering different bolt pre-tension forces, angle thicknesses, and bolt configurations. Yang and Jeon [8] proposed analytical models to predict the initial rotational stiffness and ultimate moment capacity of TSACs. The analytical models considered the moment–rotation relations, plastic hinge lines, failure modes, the prying action effect, and the moment–shear interaction due to a top angle.
Numerical methods are indispensable parts of structural research for their accuracy, efficiency, and cost-effectiveness to conduct comprehensive parametric investigations and to understand significant local effects. In the analysis of steel connections, the geometrical and material nonlinearities of the elements in the connections, bolt pretension force, interaction between bolts and plates, stresses due to compressive interfaces, friction resistance, slips occurring between the bolt and the bolt hole, welds, and imperfections should be considered [3]. Ahmed et al. [9] performed FE analyses of TSACs to investigate the behavior between the column flange and the vertical leg of the top angle and the effect of bolt action on the M–θ response. The effects of parameters, such as the diameter of the bolt, thickness of the angle, gage distance, material properties of the angle and bolt, slip, and bolt pretension force, on the moment–rotation behavior of TSACs were evaluated [10,11,12,13,14,15].
Yang et al. [16] proposed an FE model to determine the initial stiffness and the ultimate moment of TSACs. The initial rotational stiffness and the ultimate moment values obtained from the FE model were compared with those of existing test data. Kong and Kim [17] analyzed the response of TSACs and proposed two new equations to predict the initial rotational stiffness and plastic moment capacity of the connections.
The moment–rotation behavior of unstiffened semi-rigid TSACs obtained from experimental and numerical analyses under static loading is generally evaluated in the linear elastic region. This study aimed to acquire good agreement between the M–θ curves of TSACs determined using the experimental and FE results in both the elastic region and the strain hardening (plastic) region. Displacement-based 3-D FE models of these connections were created in the ABAQUS/CAE v.6.14 Standard module [18]. In the FE models of the connections, separate material properties for steel members and bolts, the interactions between the elements, the pretension force of high-strength bolts, and the coefficient of friction were considered. The moment–rotation curves obtained from the FE models were compared with the experimental results existing in the literature to validate the models. In addition, a parametric study was performed by changing the material properties of the bolt, including bolt diameter, bolt pretension load, friction coefficient, and gage distance to obtain their effects on the M–θ behavior of these connections.

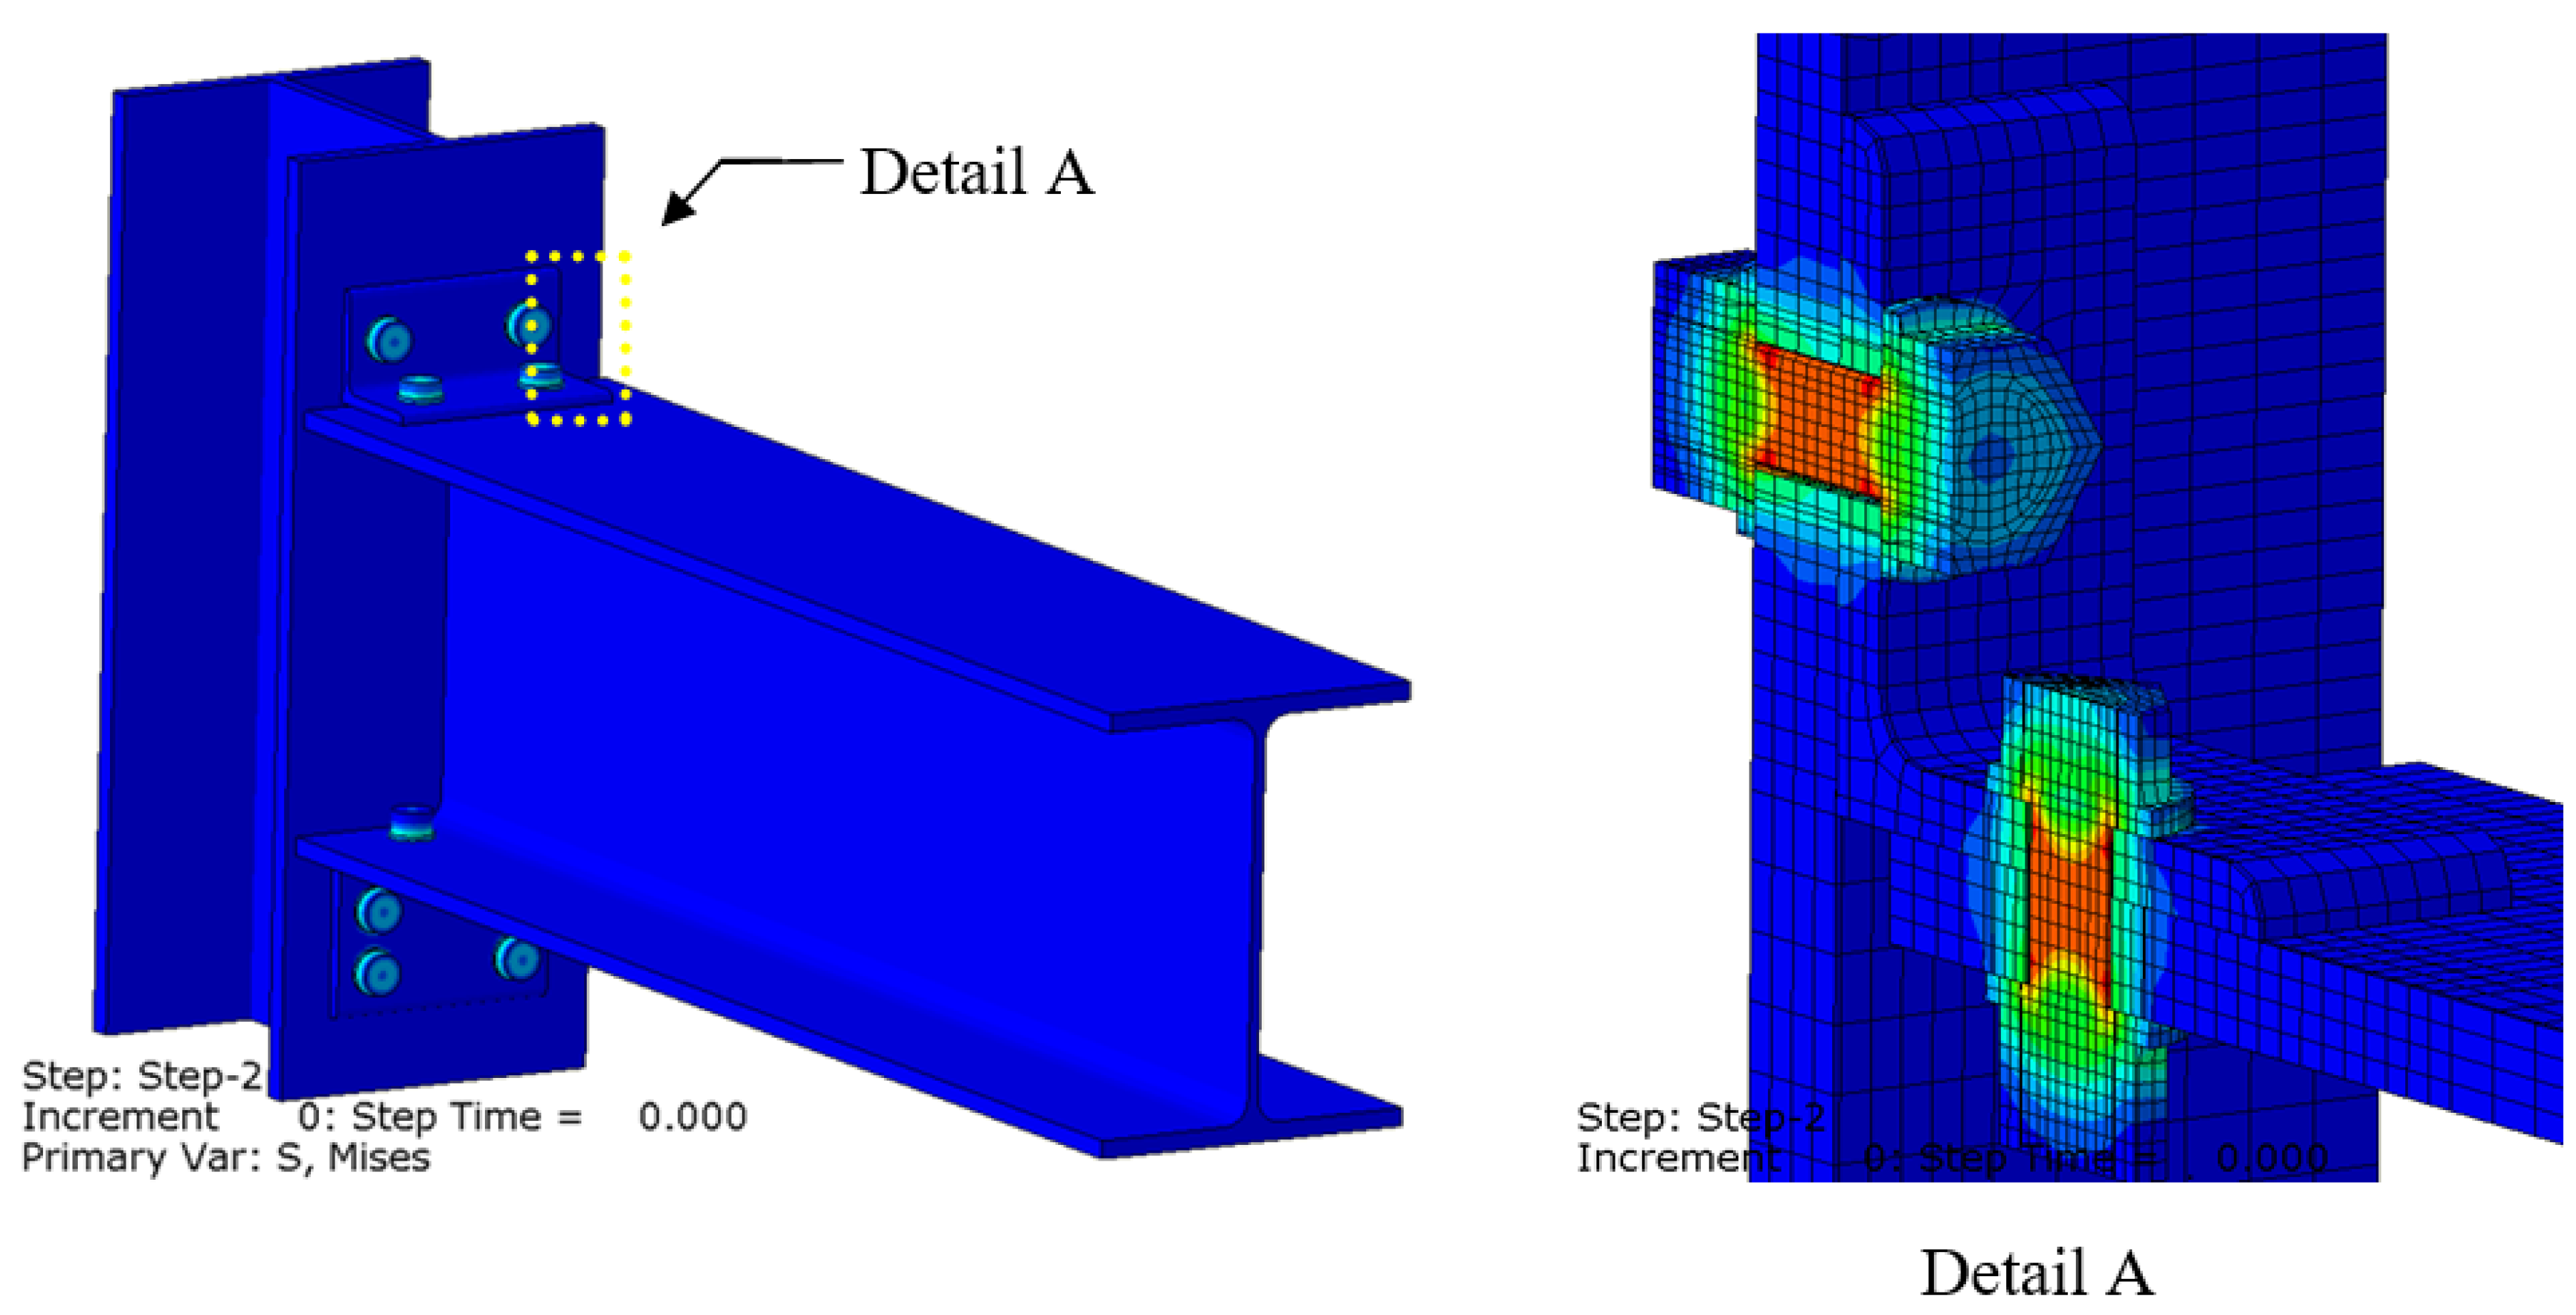
2. Finite Element Modeling of Top and Seat Angle Connections

Four three-dimensional FE models were created in the ABAQUS/CAE Standard to obtain the moment–rotation curves of semi-rigid top and seat angle connections. The accuracy of the M–θ curves for the modeled TSACs was controlled with the experimental studies conducted by Yang and Jeon [8]. Experimental tests for type B connections according to the AISC-Load and Resistance Factor Design (LRFD) Specifications [19] were carried out while changing the angle thickness as a primary parameter. In this study, the angle specimens were assembled to the flanges of the column and beam members using M20 (High Strength Hex Head Bolt-F10T) bolts. The beam, column, and angle specimens were made of S235 (SS400) steel (Fy = 235 MPa, Fu = 400 MPa). The following sections will provide a detailed explanation of the FE modeling method utilized in the present research.

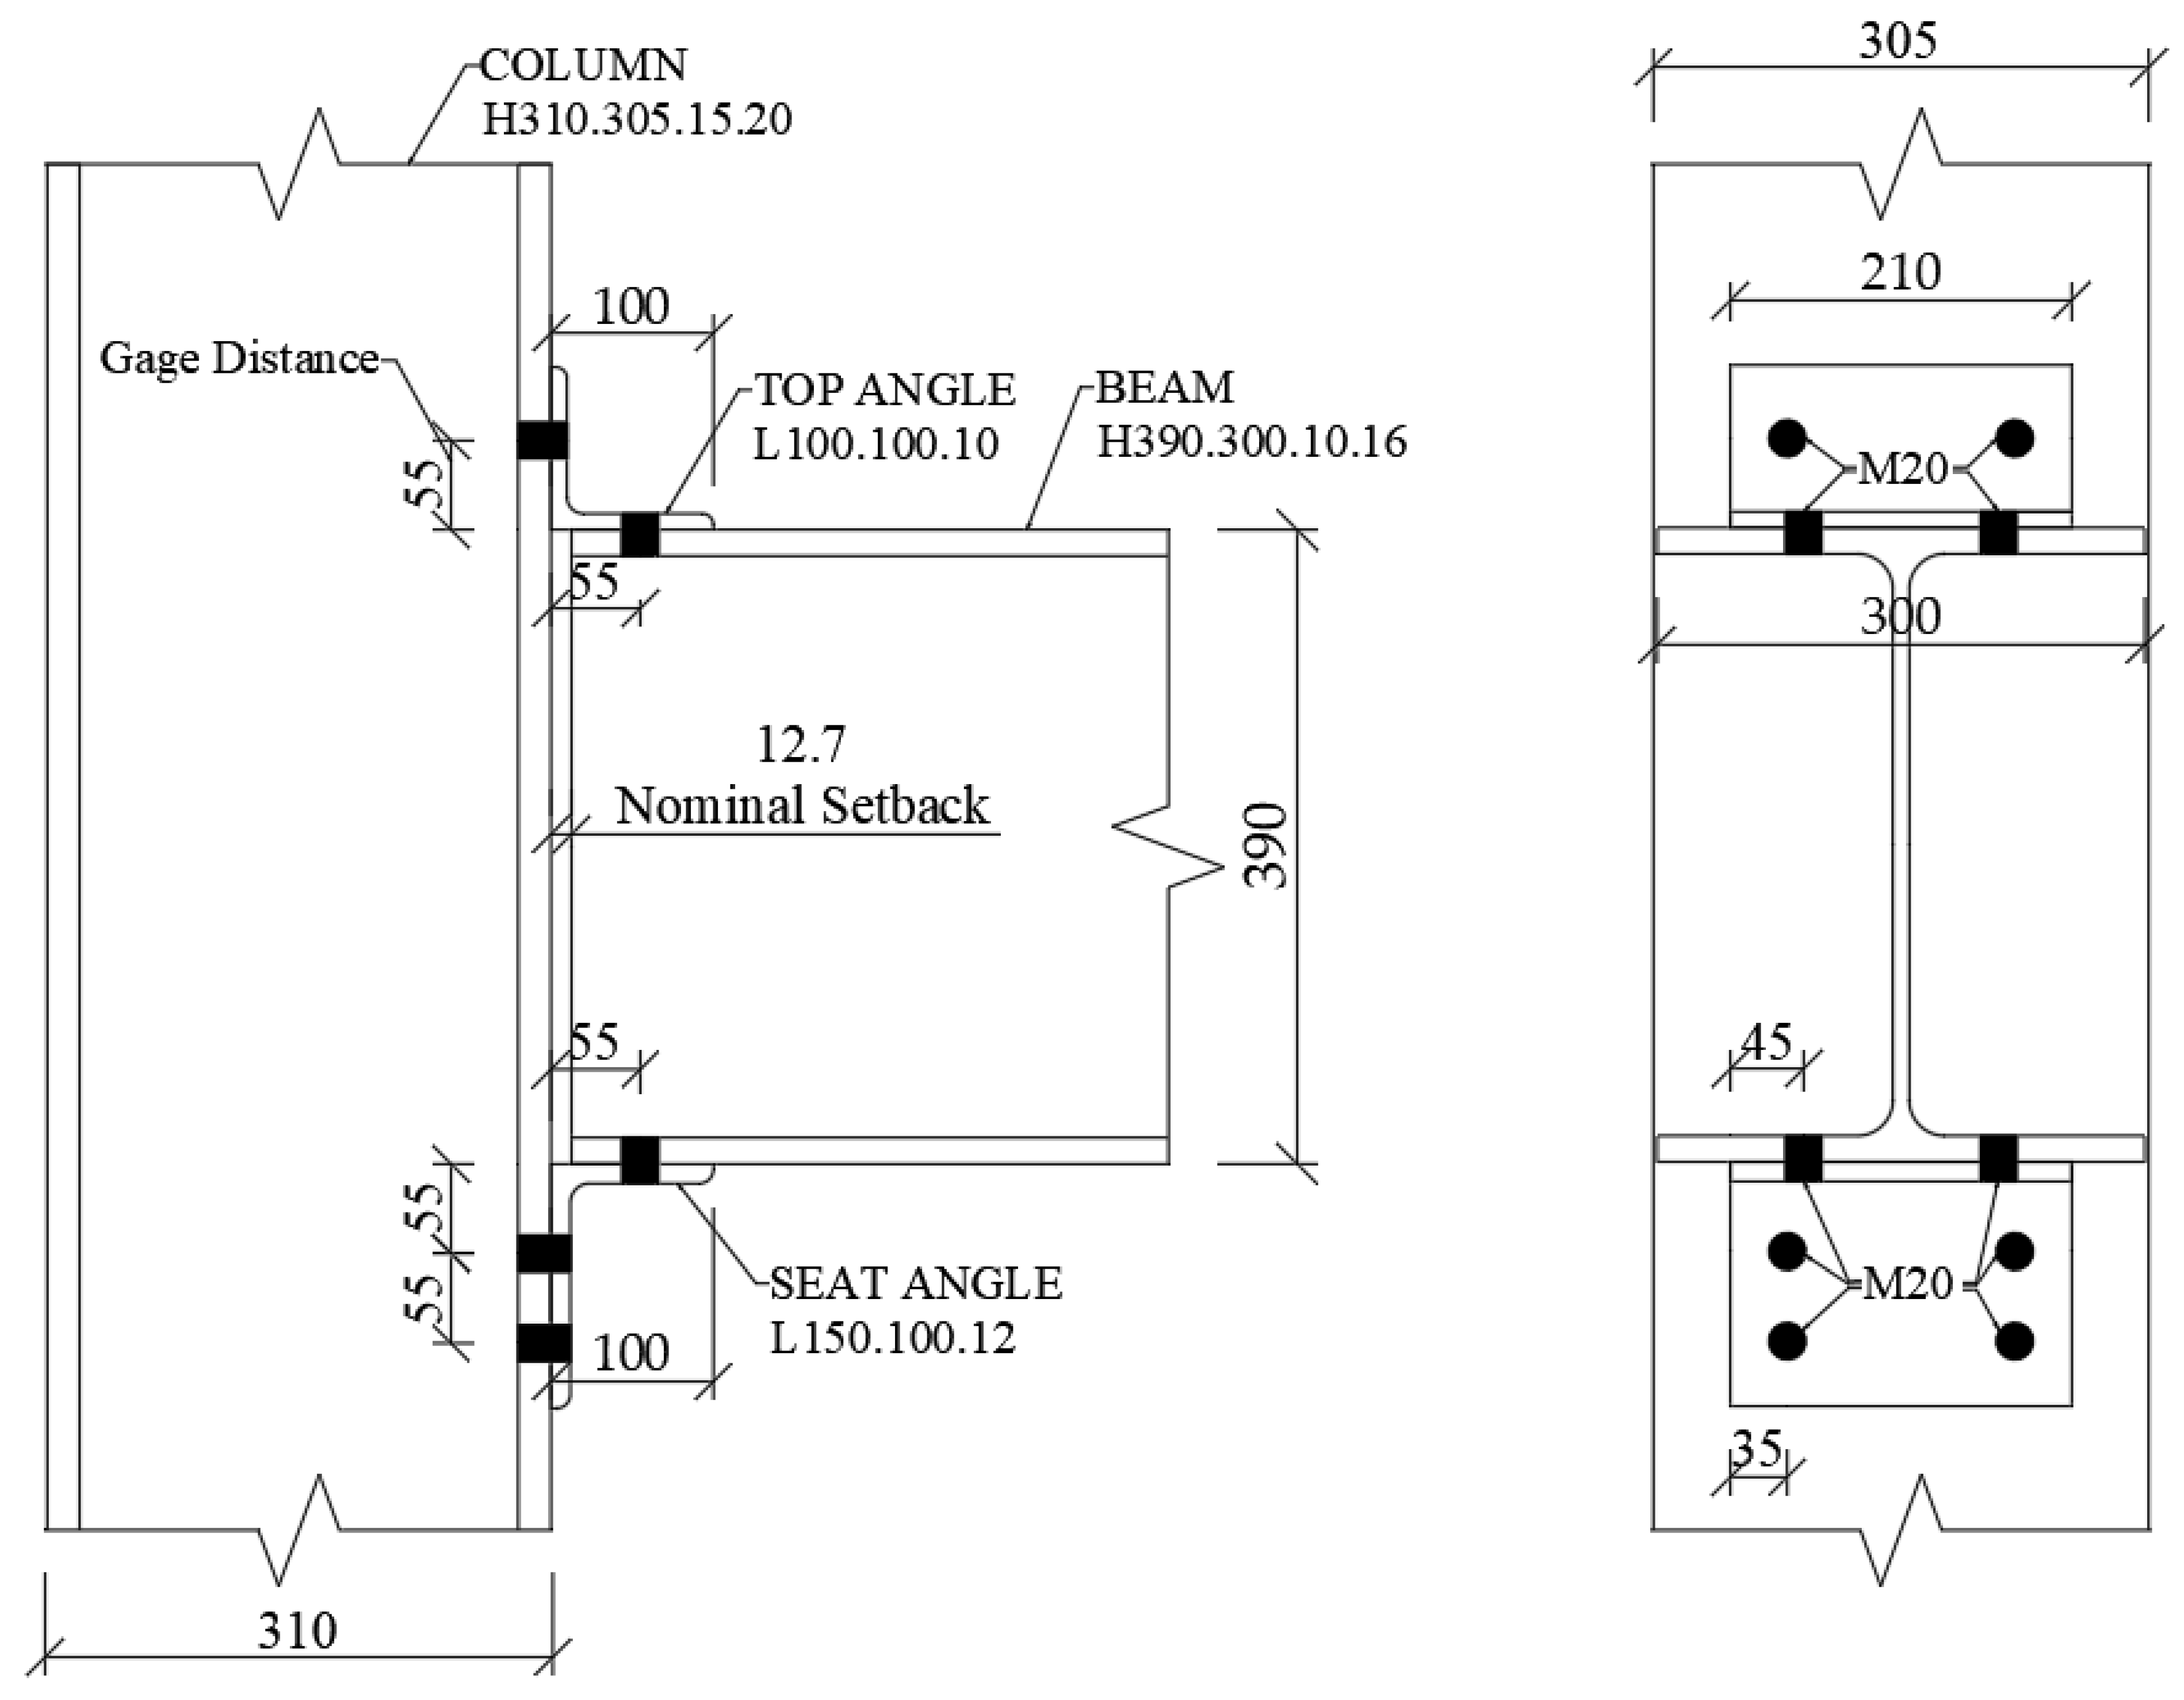
2.1. Geometry of Connections

The geometric properties of four connections with the same beam and column types but different angle thicknesses are given in Table 1. The geometric details for the T10-S12 specimen are illustrated in Figure 1. The diameter of the hole for F10T-M20 bolts was taken as 22 mm.

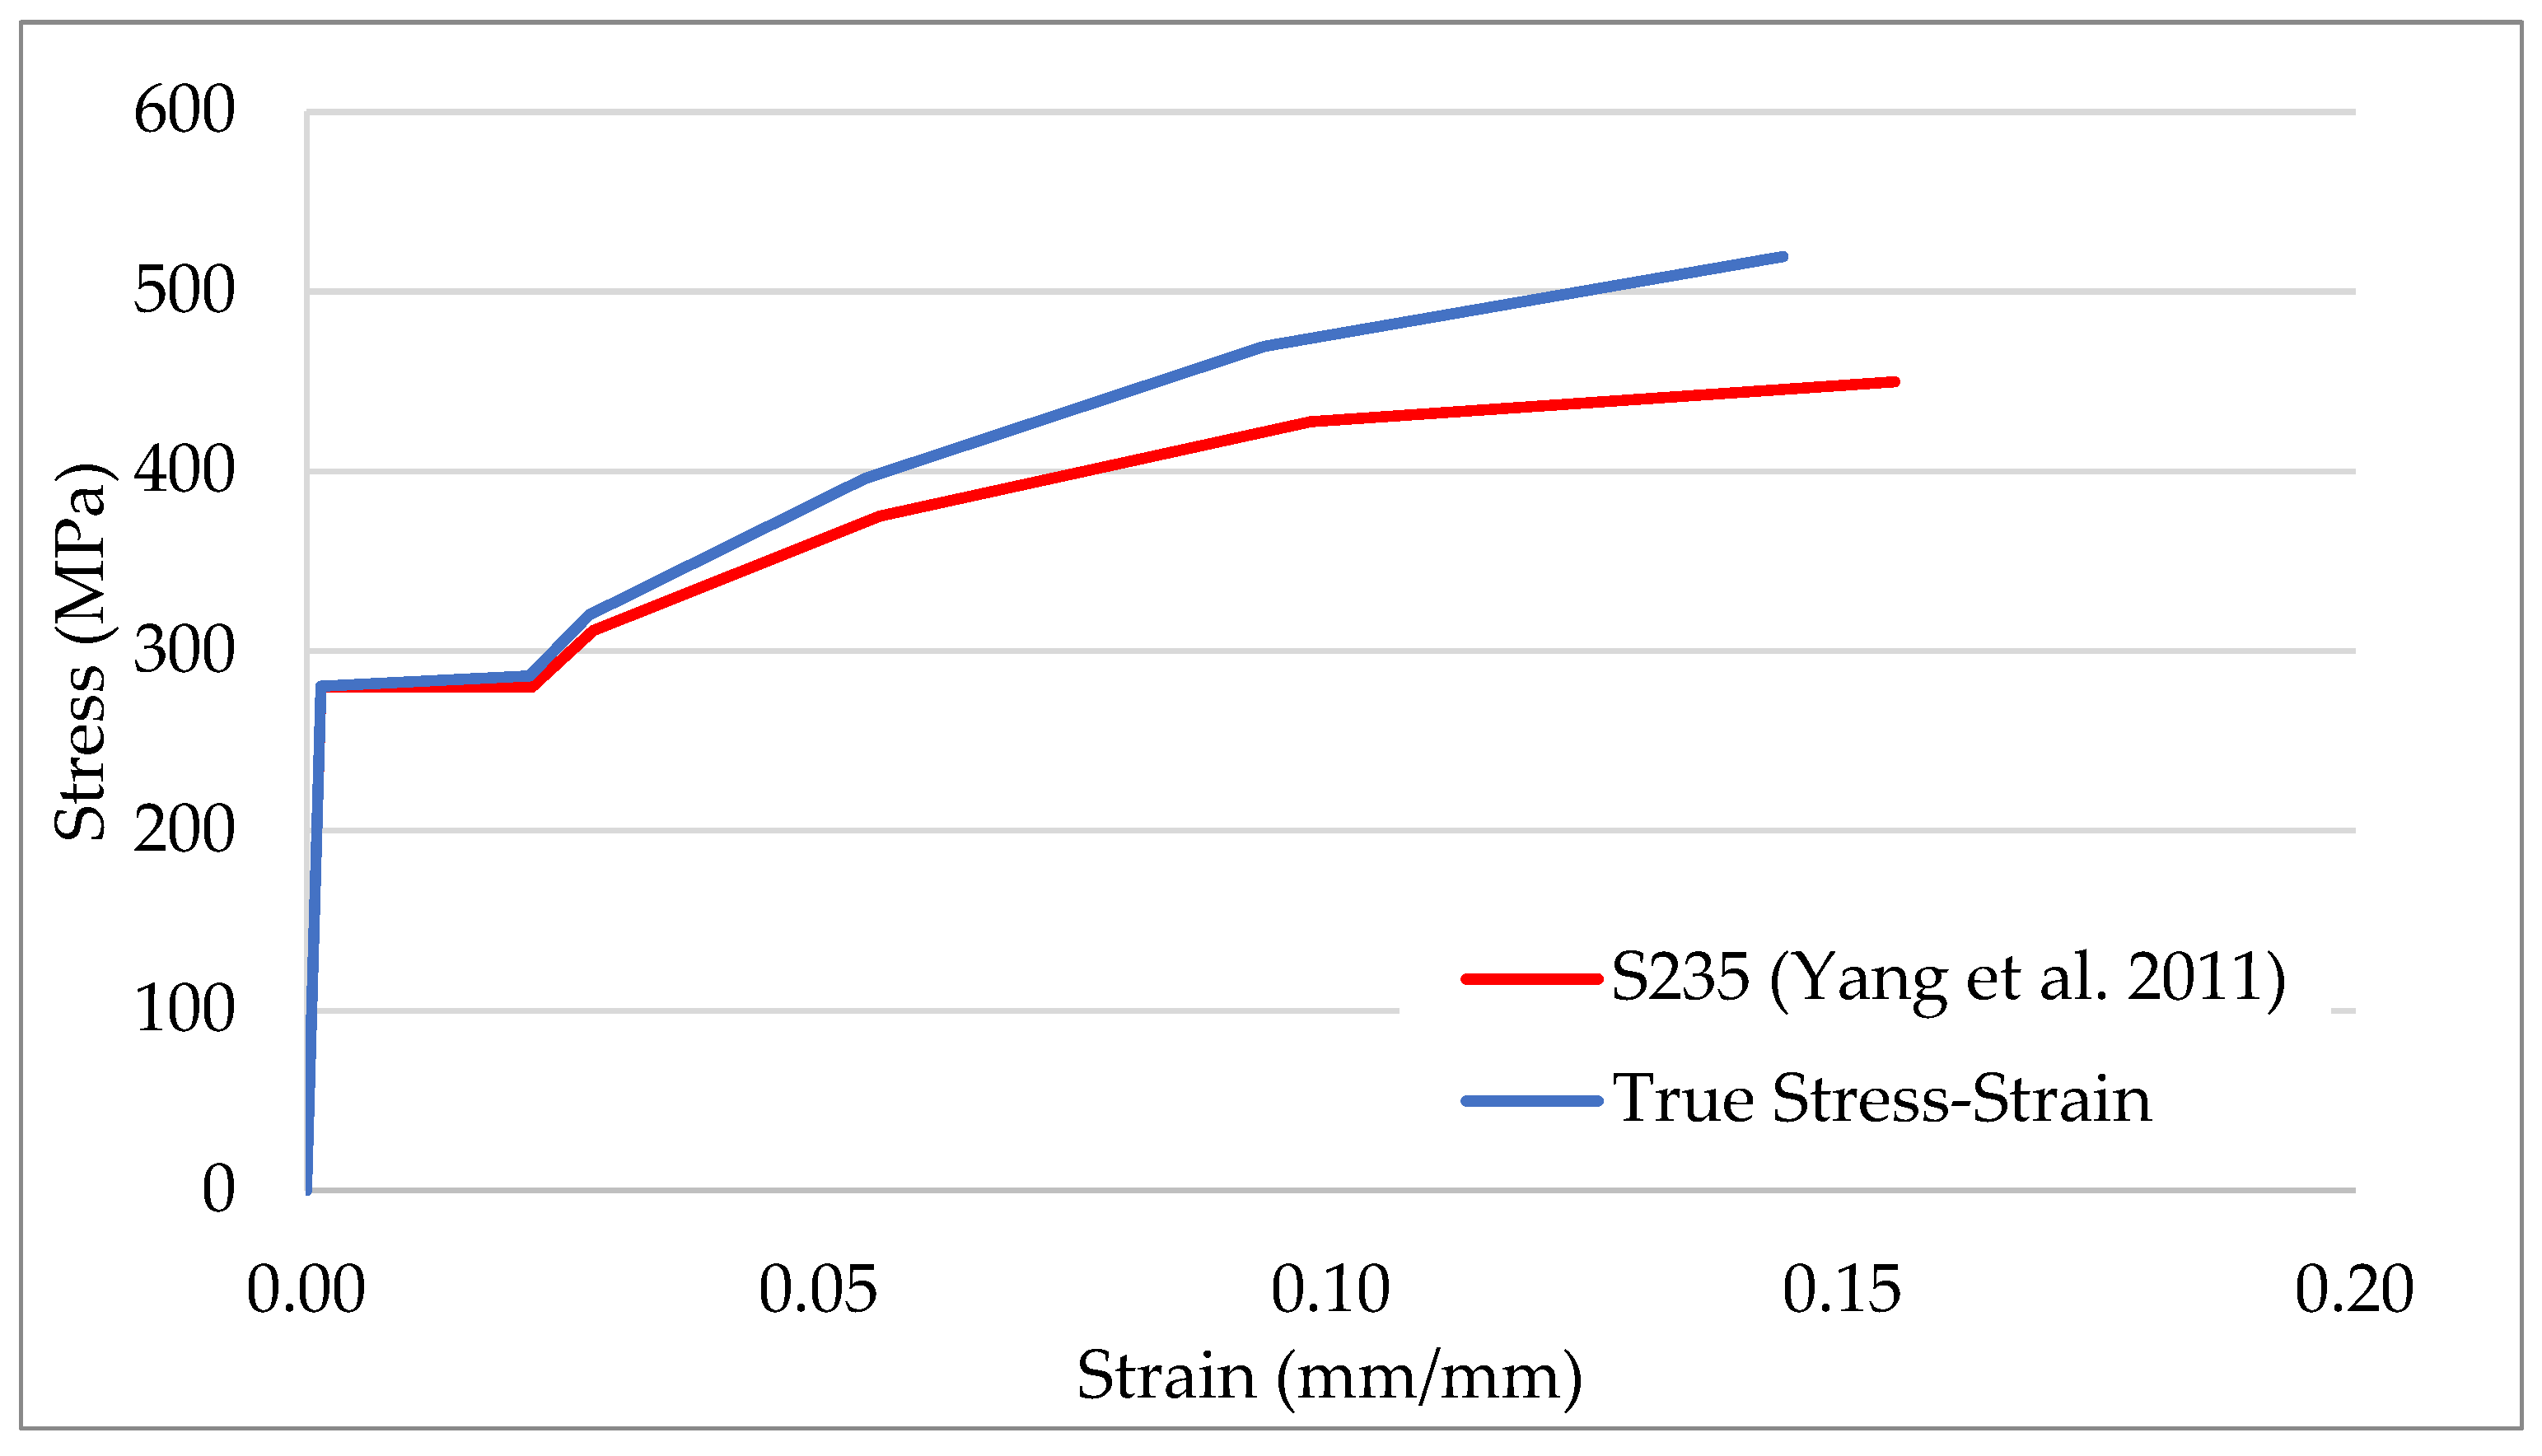
2.2. Material Properties

The material characteristics of the angle specimens obtained through Yang’s coupon tests [8] were utilized in the FE modeling. The average values for the yield stress and the tensile strength of the material were calculated as 280 MPa and 449.8 MPa, respectively. These material properties, which are higher than the nominal values of S235 steel, were utilized for the columns, beams, and angles in the FE models. A multi-linear true stress–strain curve, accurately representing the elastic, yield plateau, and strain hardening stages, was defined in the FE models for all the steel components in the connections, as shown in Figure 2 [16]. The material strength values of the bolts obtained from Yang’s tests were not used in the FE models as they were reported to be lower than the nominal values of F10T bolts. The material characteristics of the F10T-M20 bolts used in the connections were assumed to be the same as those obtained from the coupon tests conducted by Yang et al. [16].

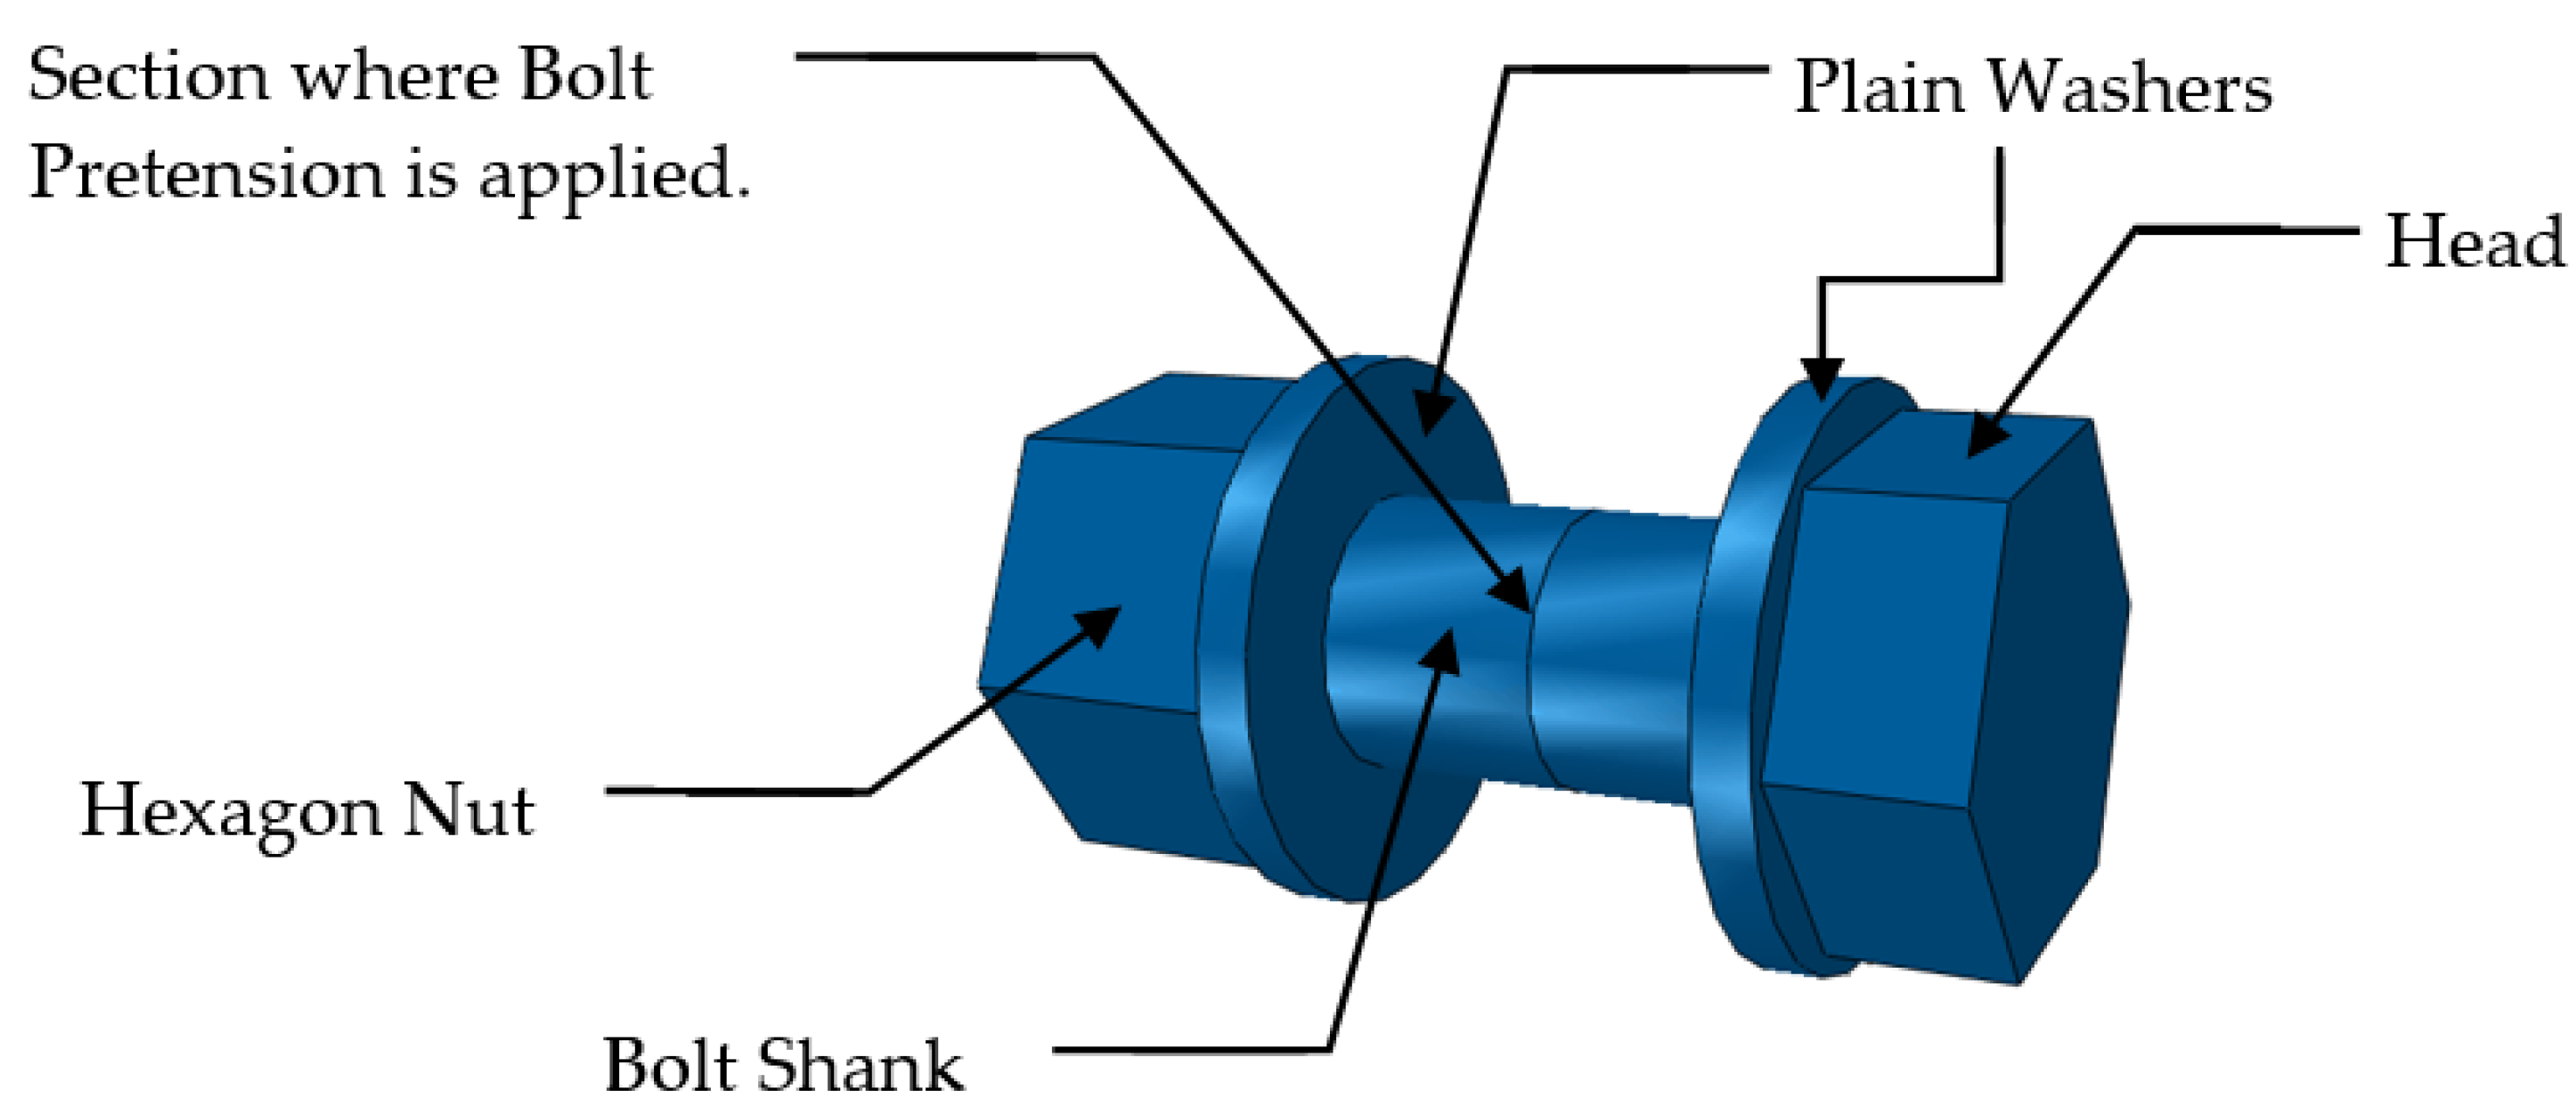
2.3. Contact Surface Modelling

A surface-to-surface contact-type algorithm was defined for all the connected parts, such as between the column flange and the angles’ vertical legs, between the beam flanges and the angles’ horizontal legs, between the washers and components, and between the bolts and the bolt hole. A finite sliding formulation was chosen between the main surface and the secondary surface. The tangential behavior of the contact was defined as a penalty function for the friction formulation. In the slip critical condition, the faying surfaces of class A were accepted for the bolts in the models and the coefficient of friction was set to 0.3 [5]. The normal behavior of the contact between the surfaces was defined as hard contact, and the surfaces were allowed to separate after the interaction.

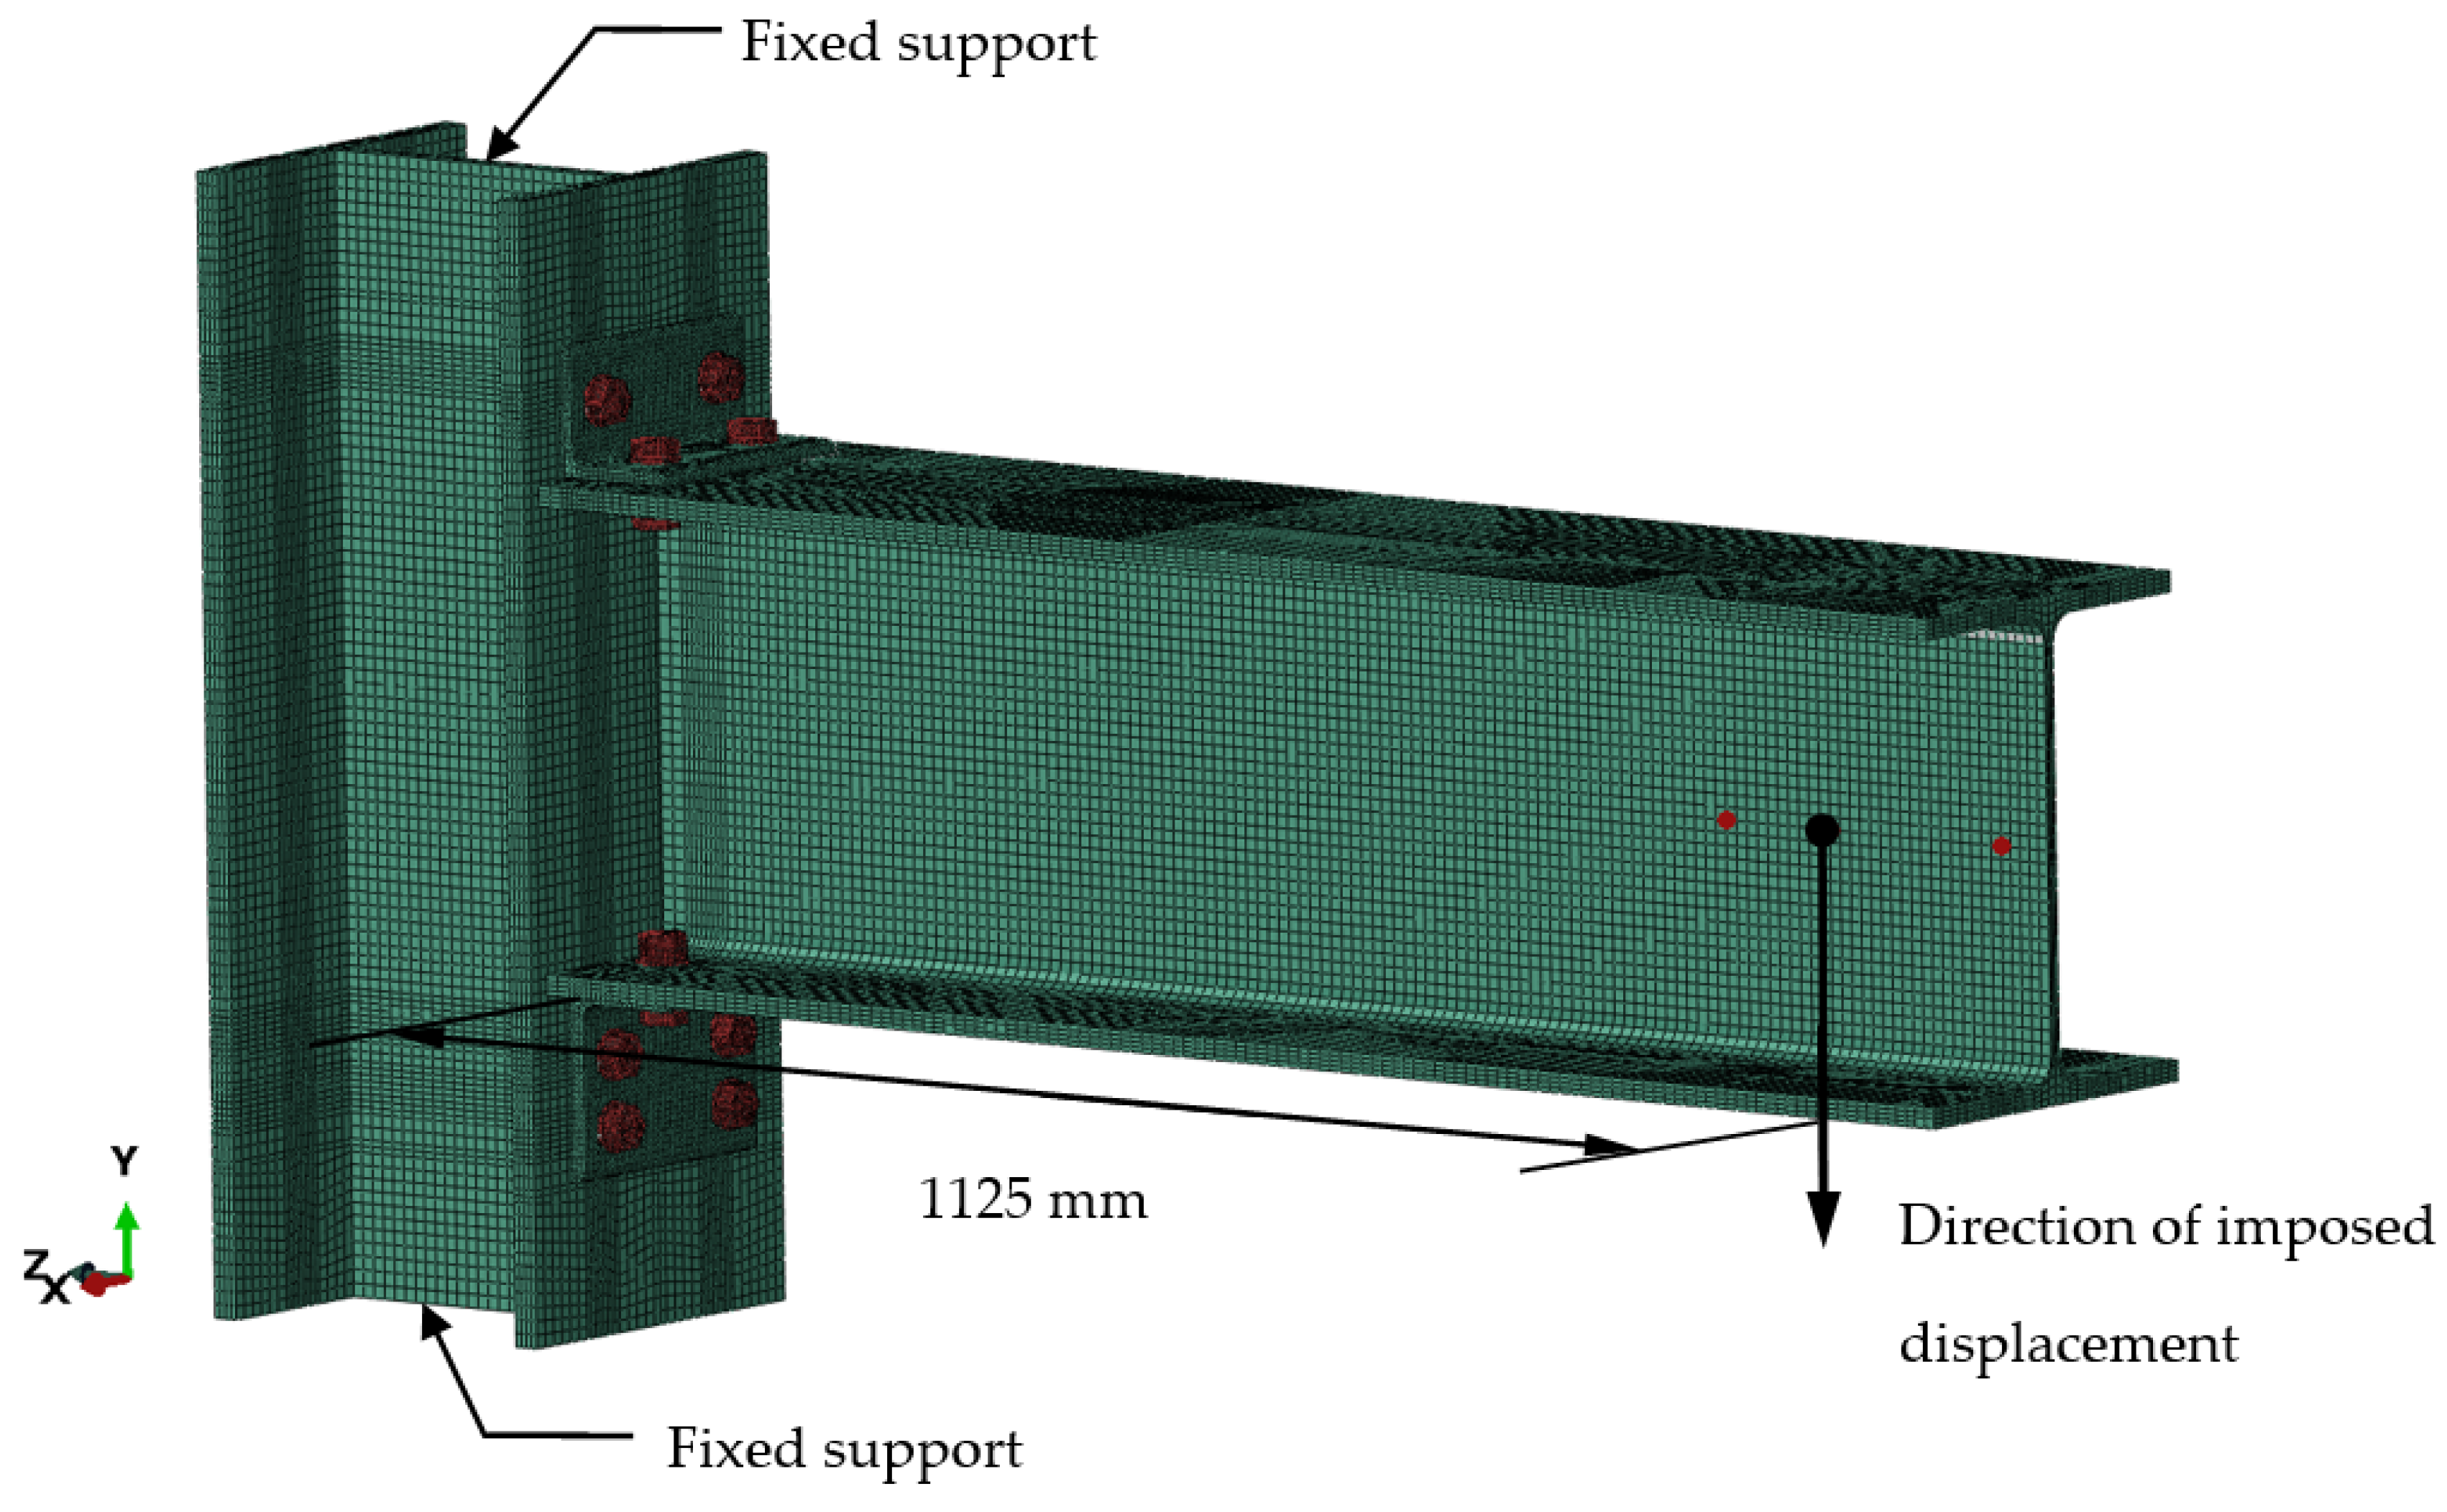
2.4. Boundary Conditions and Loadings

All the nodes along the bottom and top cross-sections of the column member were restrained to satisfy the fixed-support conditions, as shown in Figure 3. The analyses were performed in two loading stages. In the first stage, the bolts were loaded with a pretension force of 162 kN using the bolt load command in the ABAQUS program (Figure 4). The bolt pretension loads generated in the first step were modified for the second step using the “fix at current length” method. At the beginning of the second step, the bolt pretension force application was completed to reflect the fully tightened bolts realistically, as in the experiment. The pre-stress was transferred from the bolt to the top angle, column, and beam flanges as illustrated in Figure 5. In the second load step, 100 mm displacement was applied to the beam’ free end at a distance 1125 mm from the rotation center of the connection, as shown in Figure 3. In the experiment conducted by Yang and Jeon [8], static shear forces were applied at a rate of 1.5 mm/min using an actuator. In the FE model, the displacement loading was gradually increased up to 100 mm using the automatic load increment scheme to simulate the experimental tests, and the loading increment rate was controlled to prevent any numerical convergence problems. The out-of-plane movement was restricted at the location of the applied displacement to prevent the overall instabilities of the beam member [20]. The distance between the instantaneous center of rotation located on the seat angle’s horizontal leg and the application point of the displacement at the end of the beam was multiplied by the reaction force of the imposed displacement to determine the connection moment (M), as shown in Figure 6. The difference between horizontal displacements, δt and δs, was obtained from the FE analysis and, the connection relative rotation (ϕr) shown in Figure 6 was calculated.

2.5. Mesh Generation

The element type of an eight-node linear brick C3D8R (with reduced integration and hourglass control) was selected for all the components in the connections. The shape of the C3D8R element was preferred as a structural mesh (hex). A mesh sensitivity analysis was performed for the C3D8R elements. The approximate dimension of the mesh was set to 10 mm for the beams and columns, 5 mm for the top and seat angles, and 3 mm for the bolts, corresponding to three mesh along the thickness of the elements. In the regions where the bolts met the structural members, the approximate dimension of the mesh size was decreased for accurate results, as represented in Figure 5.

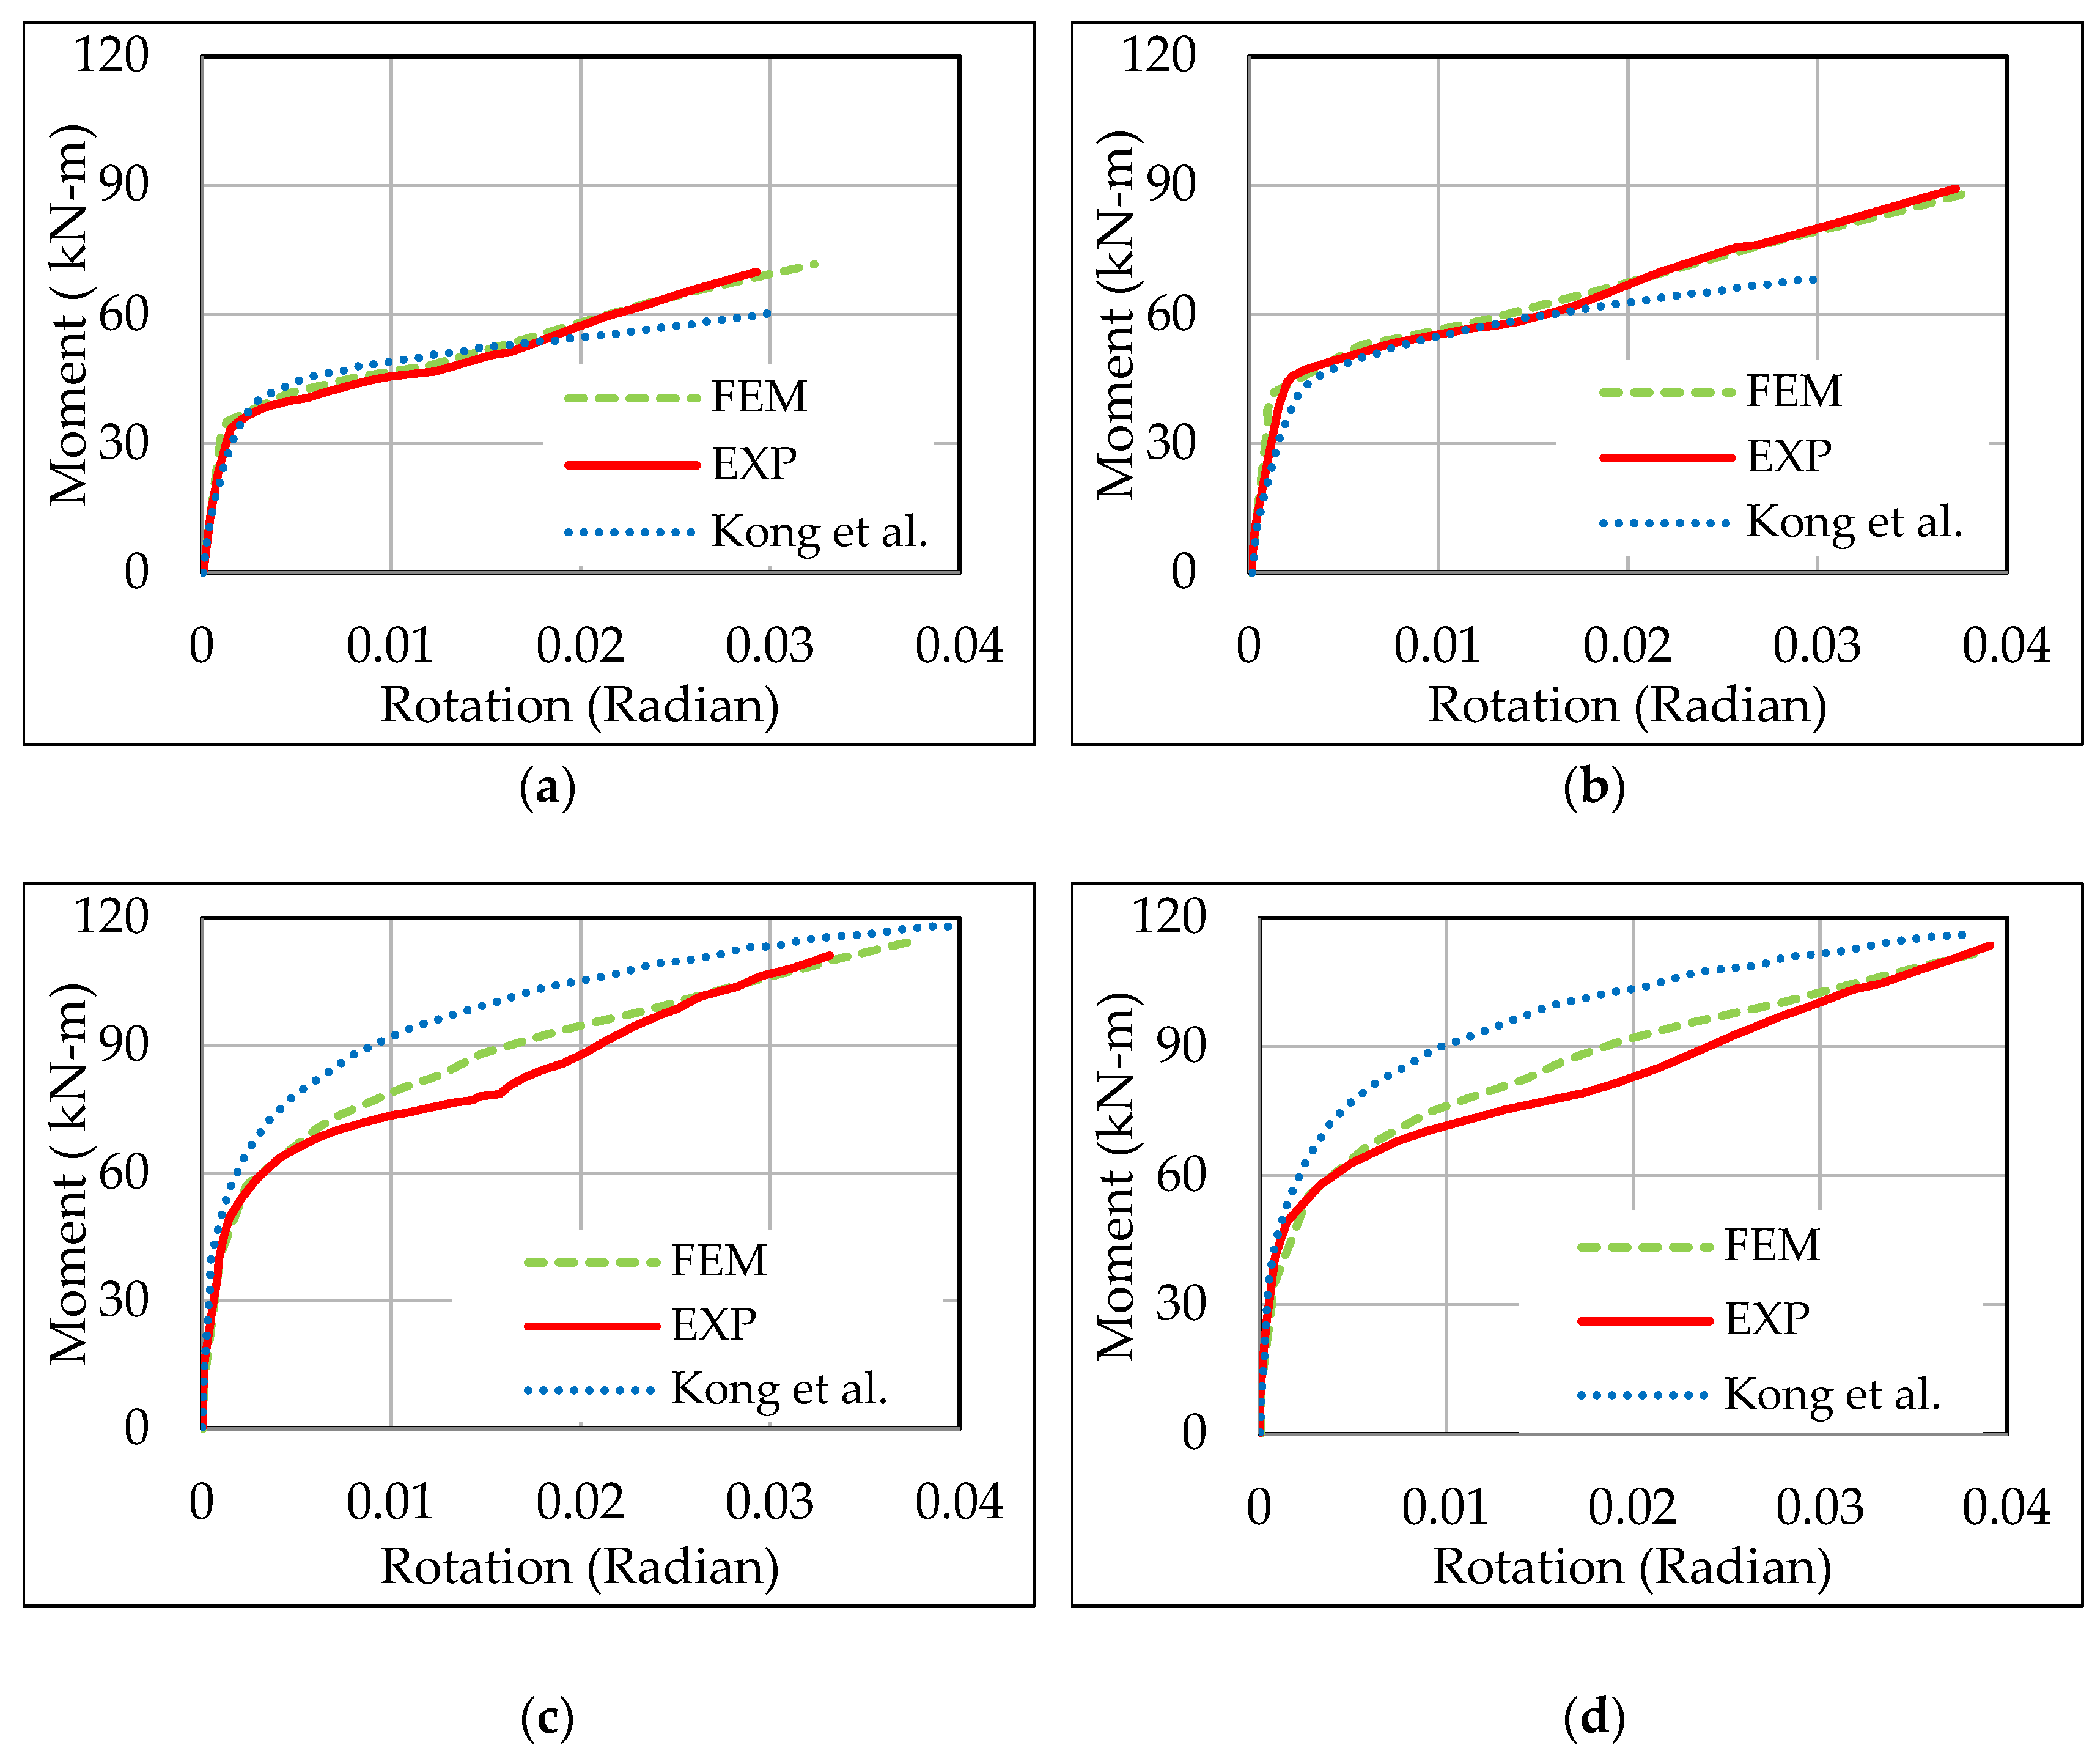
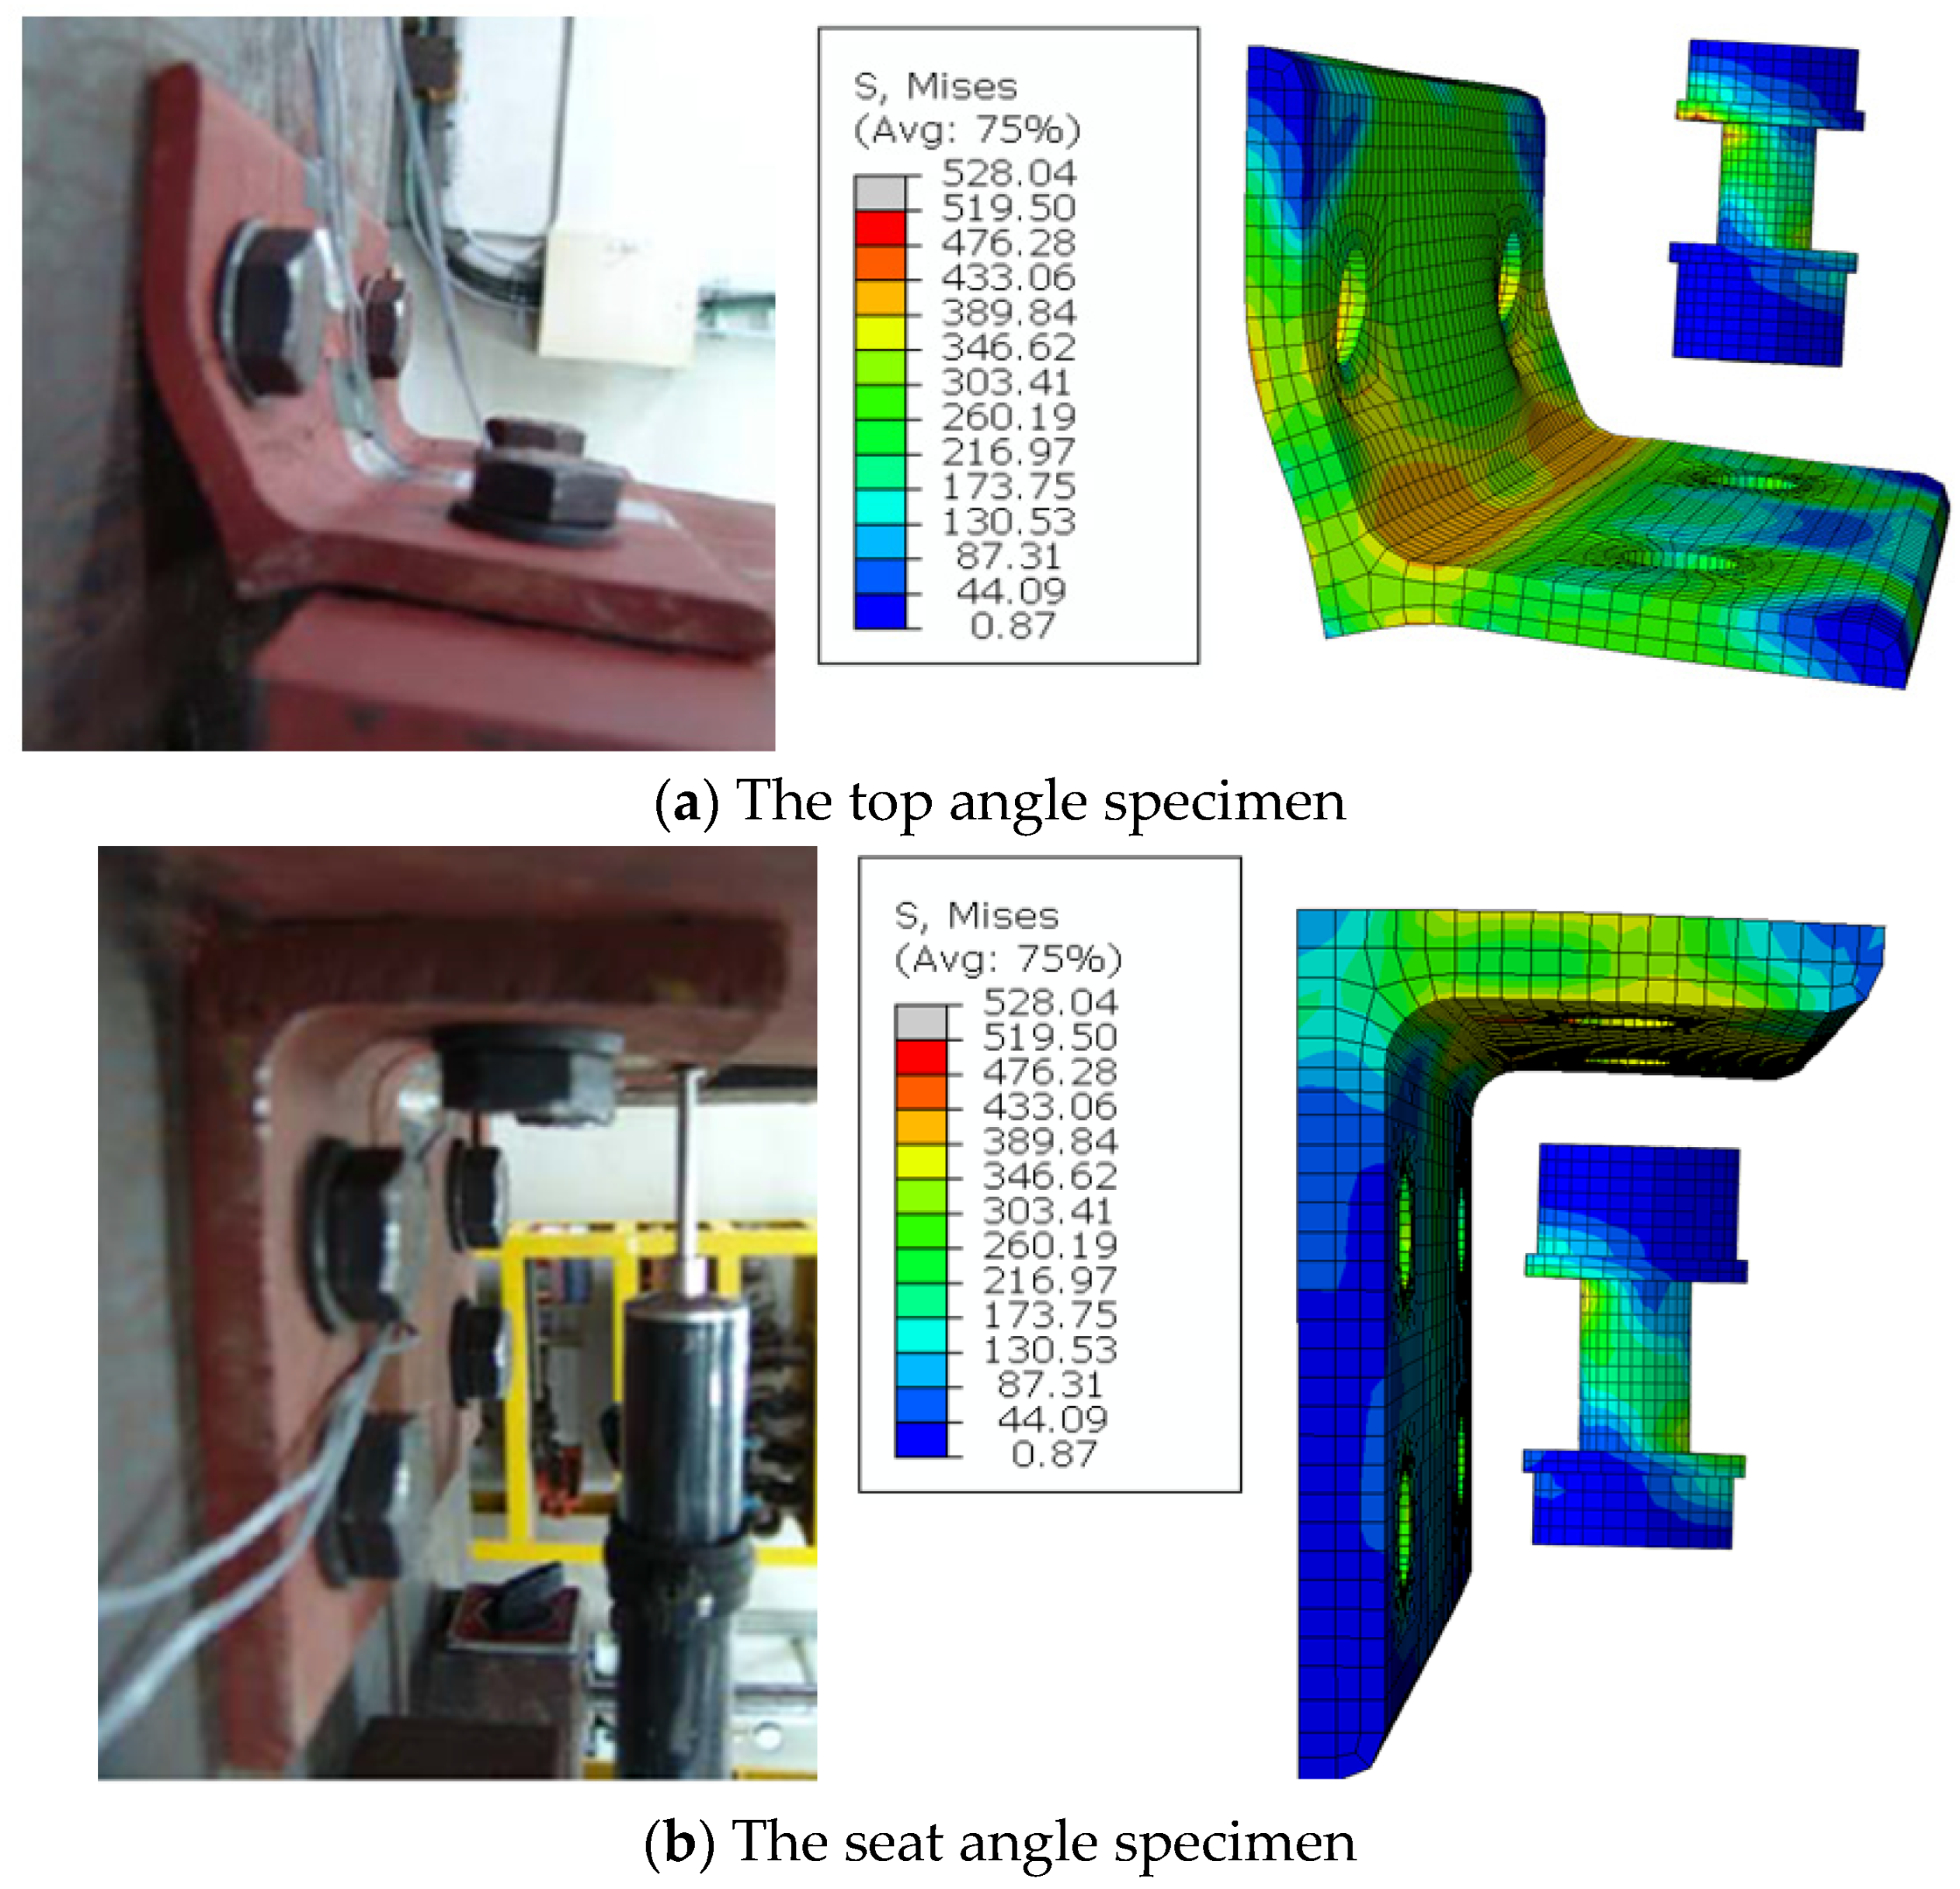
3. Verification of the FE Models

The moment–rotation curves of the TSACs determined through the FE model results were verified using the FE analysis data from Kong and Kim [17] and the experimental test results of Yang [8]. The comparisons in Figure 7a,b demonstrate that the M–θ responses obtained from the FE models of the T10–S12 and T10–S15 connections are almost the same as the test results obtained in the linear elastic, early plastic, and late plastic stages. The moment–rotation curves of the T13–S12 and T13–S15 specimens show good agreement with the test results obtained in the linear elastic and late plastic ranges, as shown in Figure 7c,d. However, the curves determined from the FE results of Kong and Kim yield lower moment values than the experimental results for the T10–S12 and T10–S15 specimens in the later plastic ranges, as shown in Figure 7a,b. In addition, the FE model results of Kong and Kim were overestimated compared to the test data for the T13–S12 and T13–S15 connections. In Yang’s study [8], the static loading was removed for safety reasons when the observed rotation reached about 0.035 radians. For all the specimens, the ultimate moment results obtained at the end of the tests and determined from the FE models gave the same values. Additionally, when the moments of the TSACs were compared at 0.02 rad, according to the AISC [21], a very good agreement was observed for the specimens.
The deformed shape of the T10–S15 angle connection in its ultimate loading stage is shown in Figure 8. Similar to the observations in Yang’s experimental study, the vertical leg of the top angle assembled to the flange of the column began moving up, perpendicular to the applied load, as shown in Figure 9a. On the contrary, Figure 9b illustrates that the horizontal leg of the seat angle connected to the bottom flange of the beam moved down along the same axis with the applied force. A gap was formed between the top flange of the beam and the top angle leg at the end of the test. All comparisons, including those of the deformations of angles in Figure 9a,b, show that the FE models can accurately simulate the response of TSACs.
The yielding in the connection occurs first in the angles and then the components around the bolt holes at the beginning of the nonlinear stage of the M–θ curve. The yielding of the bolts begins in the later stages, as presented in Figure 9a,b.

4. Parametric Study

In the parametric study, the material properties of the bolt, including the bolt diameter, pretension loads for the bolts, coefficient of friction, and bolt gage distance are considered as variables to observe their effects on the M–θ relation of TSACs. The FE model for the T10–S12 connection was chosen for the parametric analysis. The bolt pretension force was applied to a pre-defined section, as illustrated in Figure 4. According to JIS B 1186 [22], the axial tension of the F10T–M20 bolts is recommended to be between 155 kN and 209 kN [22]. In Yang’s experimental study, each bolt was fully tightened up at a value of 162 kN [8]. According to ANSI/AISC 360-16 [21], the minimum bolt pretension force is 179 kN for a Grade A490M bolt, which is considered to be equivalent to an F10T bolt. This value is equal to 70% of the minimum tensile capacity of the bolts [21]. In this study, a pretension force of 202 kN, which is close to the upper limit value according to JIS B 1186, and a bolt pretension force of approximately 245 kN, which is close to the minimum tensile capacity of the bolts according to ANSI/AISC 360-16 [21], were applied to evaluate the influence of bolt pretension on the M–θ relation of TSACs. The moment values are almost the same in the linear and late plastic stages; however, only a slight increase is obtained in the early plastic stage as the applied bolt pretension force increases, as seen in Figure 10.
The M–θ behavior of TSACs was examined by varying the friction coefficient from 0.30 to 0.35 and 0.25 for all contact surfaces. As shown in Figure 11, no significant effect occurred in the M–θ curve when the friction coefficient was changed. In addition, the change in the curves was evaluated when a friction coefficient of 0.30 was defined between the bolts and the bolt holes and between the washers and components, and friction coefficients of 0.1 and 0.2 were utilized along the surfaces between the beam and the angle and between the column and the angle. These FE models were performed since the friction coefficient between steel–steel surfaces and steel–bolt surfaces can be different. However, Figure 12 indicates that the curves are almost identical to each other.
The material characteristics of F10T class hex head bolts were replaced with the stress–strain properties of F13T bolts obtained through the experimental tests conducted by Kim et al. [23]. The yield stress and tensile capacity values of the F13T bolt were defined as 1150 and 1281 MPa, respectively, in the FE model. The increase in the strength of the bolts did not yield any improvement in terms of the moment–rotation behavior, except that it gave a small increase in the ultimate moment capacity at the end of the plastic stage, as shown in Figure 13.
In the FE models, M22 bolts were defined to evaluate the effect of bolt diameter on the M–θ curve. A hole size of 24 mm was considered for the M22 bolts. The geometric properties of the M22 bolts were taken from the JIS B 1186 standard [22], and the pretension forces for the bolts remained at 162 kN to determine the bolt diameter effect only. Figure 14 illustrates the impact of the bolt geometric properties on the connection’s strength and stiffness. The initial slope of moment–rotation curve of the model with M22 bolts is the same with that of the model with M20 bolts. However, the ultimate moment capacity increases by around 8% with the increment in bolt diameter, as expected.
The gage distance, which is the distance between the heel of the top angle and the center of a high-strength bolt on the vertical leg, is shown as 55 mm in Figure 1. In the parametric FE models, the bolts’ gage distance was changed to 45 mm and 65 mm. Figure 15 demonstrates the effect of the bolt gage distance on the M–θ curve. It is shown that when the bolts’ gage distance decreases, the stiffness and strength properties of TSACs improve by approximately 20%.

5. Conclusions

The moment–rotation response of the unstiffened semi-rigid top and seat angle connections was investigated under monotonic loading. FE models were defined for the TSAC specimens studied in earlier experimental research, and a nonlinear analysis was conducted to validate the FE models with the experimental data. The M–θ curves, as well as the deformed shapes of the angles in the connections, showed very good agreement with the test data. The parametric studies were performed while considering the bolt material strength, bolt diameter, bolt pretension load, friction coefficient, and gage distance to investigate their effects on the M–θ curve. The following results were obtained through the FE analysis:
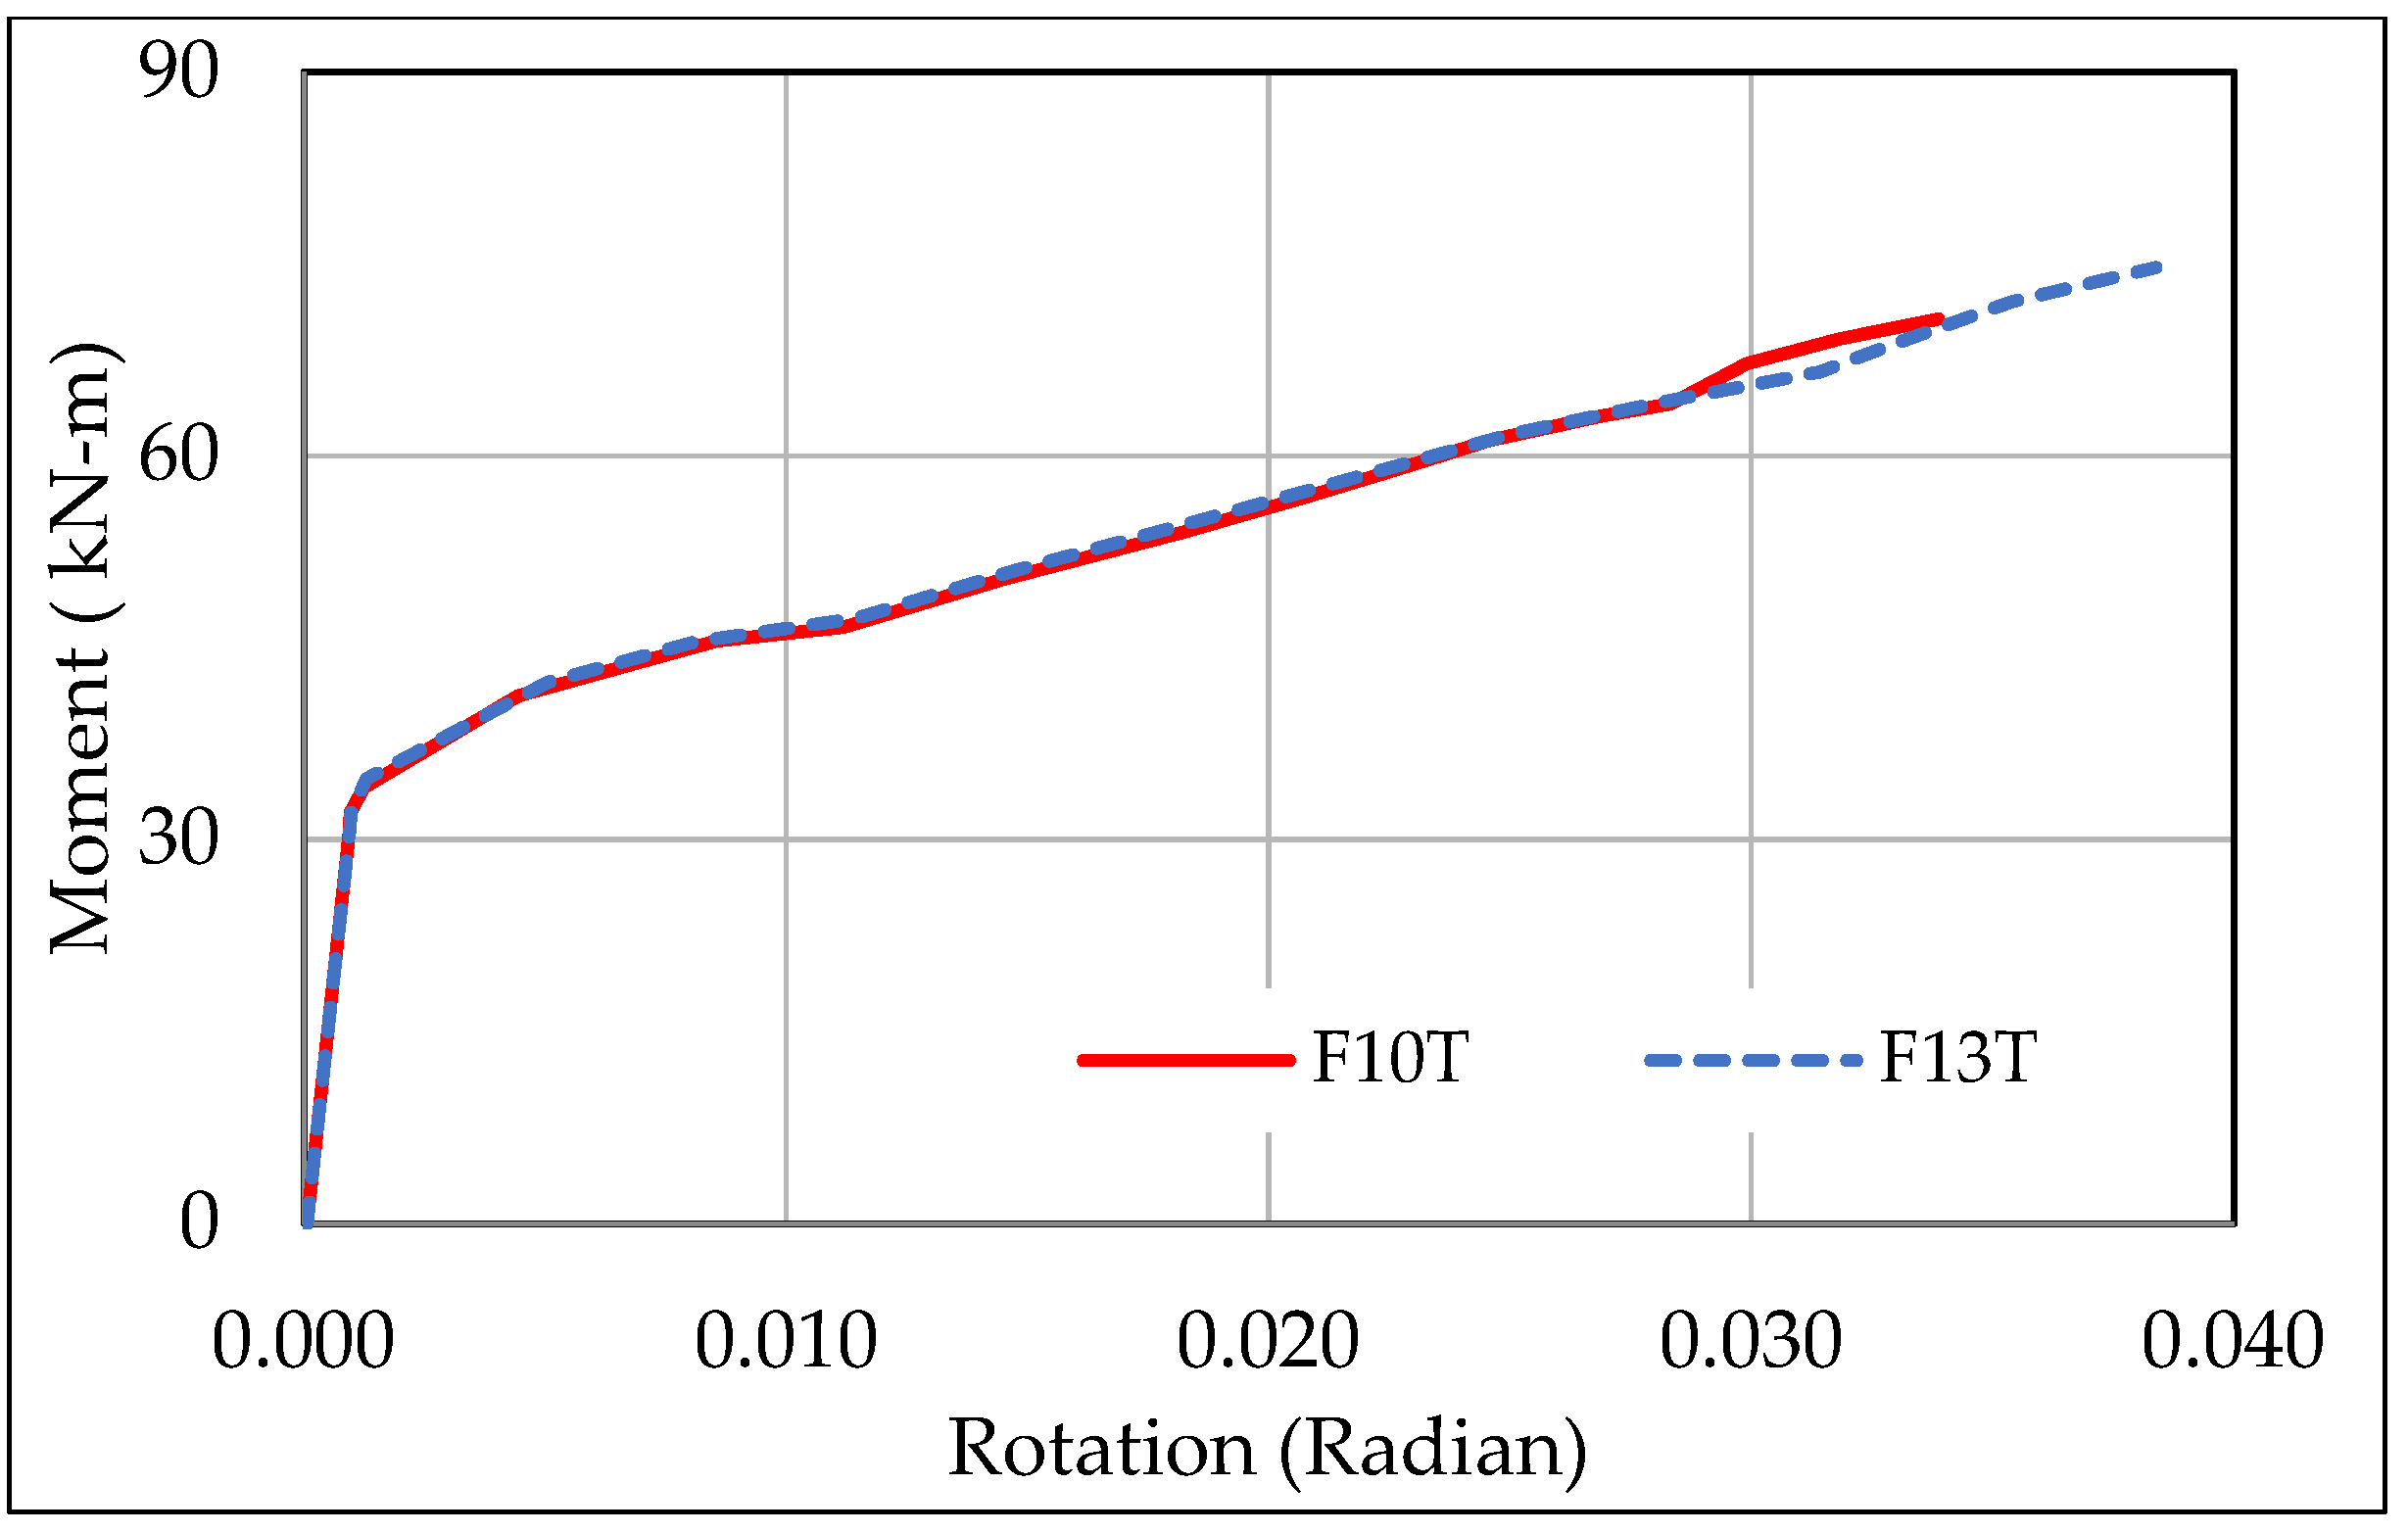
  • The yielding of angles in the connections and the yielding around the bolt holes in the components occur in the early steps of the nonlinear range of the M–θ curve, while the bolts yield occurs in the later stages. When the yield strength of bolts decreases, a small drop in the ultimate moment value is observed in the final portion of the curve. However, if the bolt satisfies a sufficient yield strength, which is the crucial criteria recommended in the AISC 360-16 standard [21], any increase in bolt strength will not influence the M–θ curve.
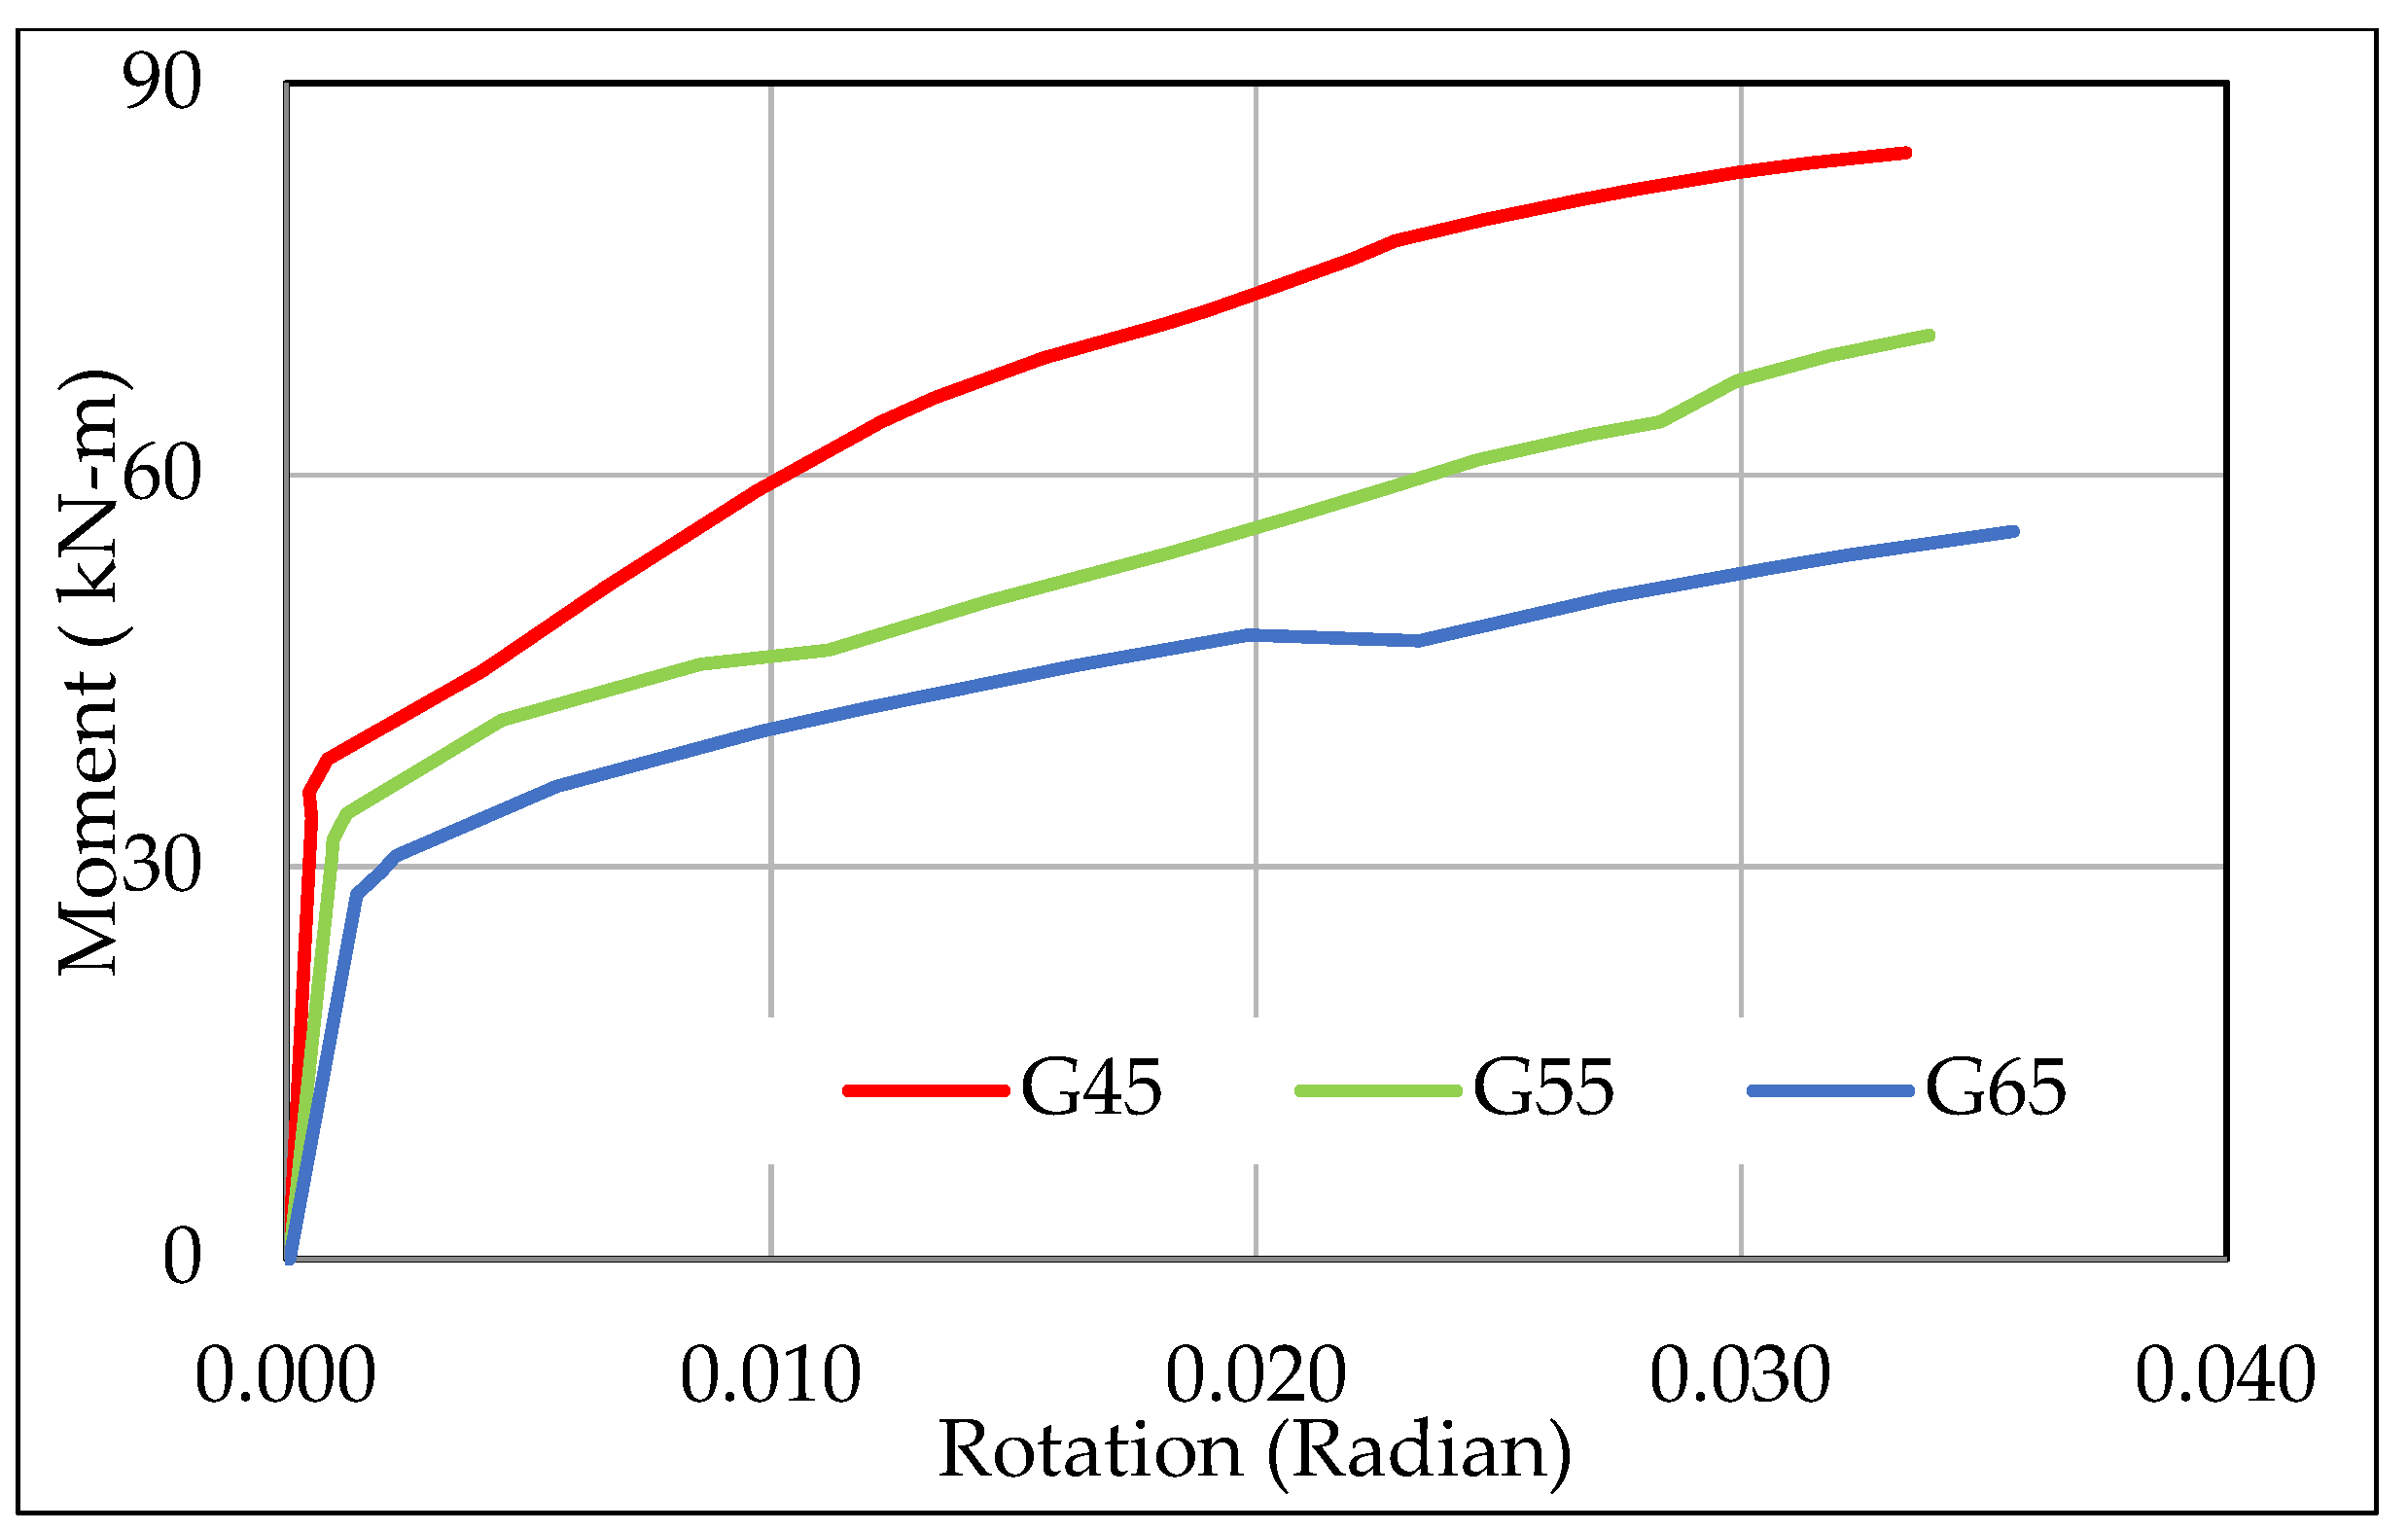
  • The ultimate moment value of the FE model defined by a 45 mm gage distance yielded 20% more capacity than the model with a 55 mm gage distance. On the other hand, the ultimate moment capacity of the model with a 65 mm distance was 23% less t than the result of the model with a 55 mm gage length.
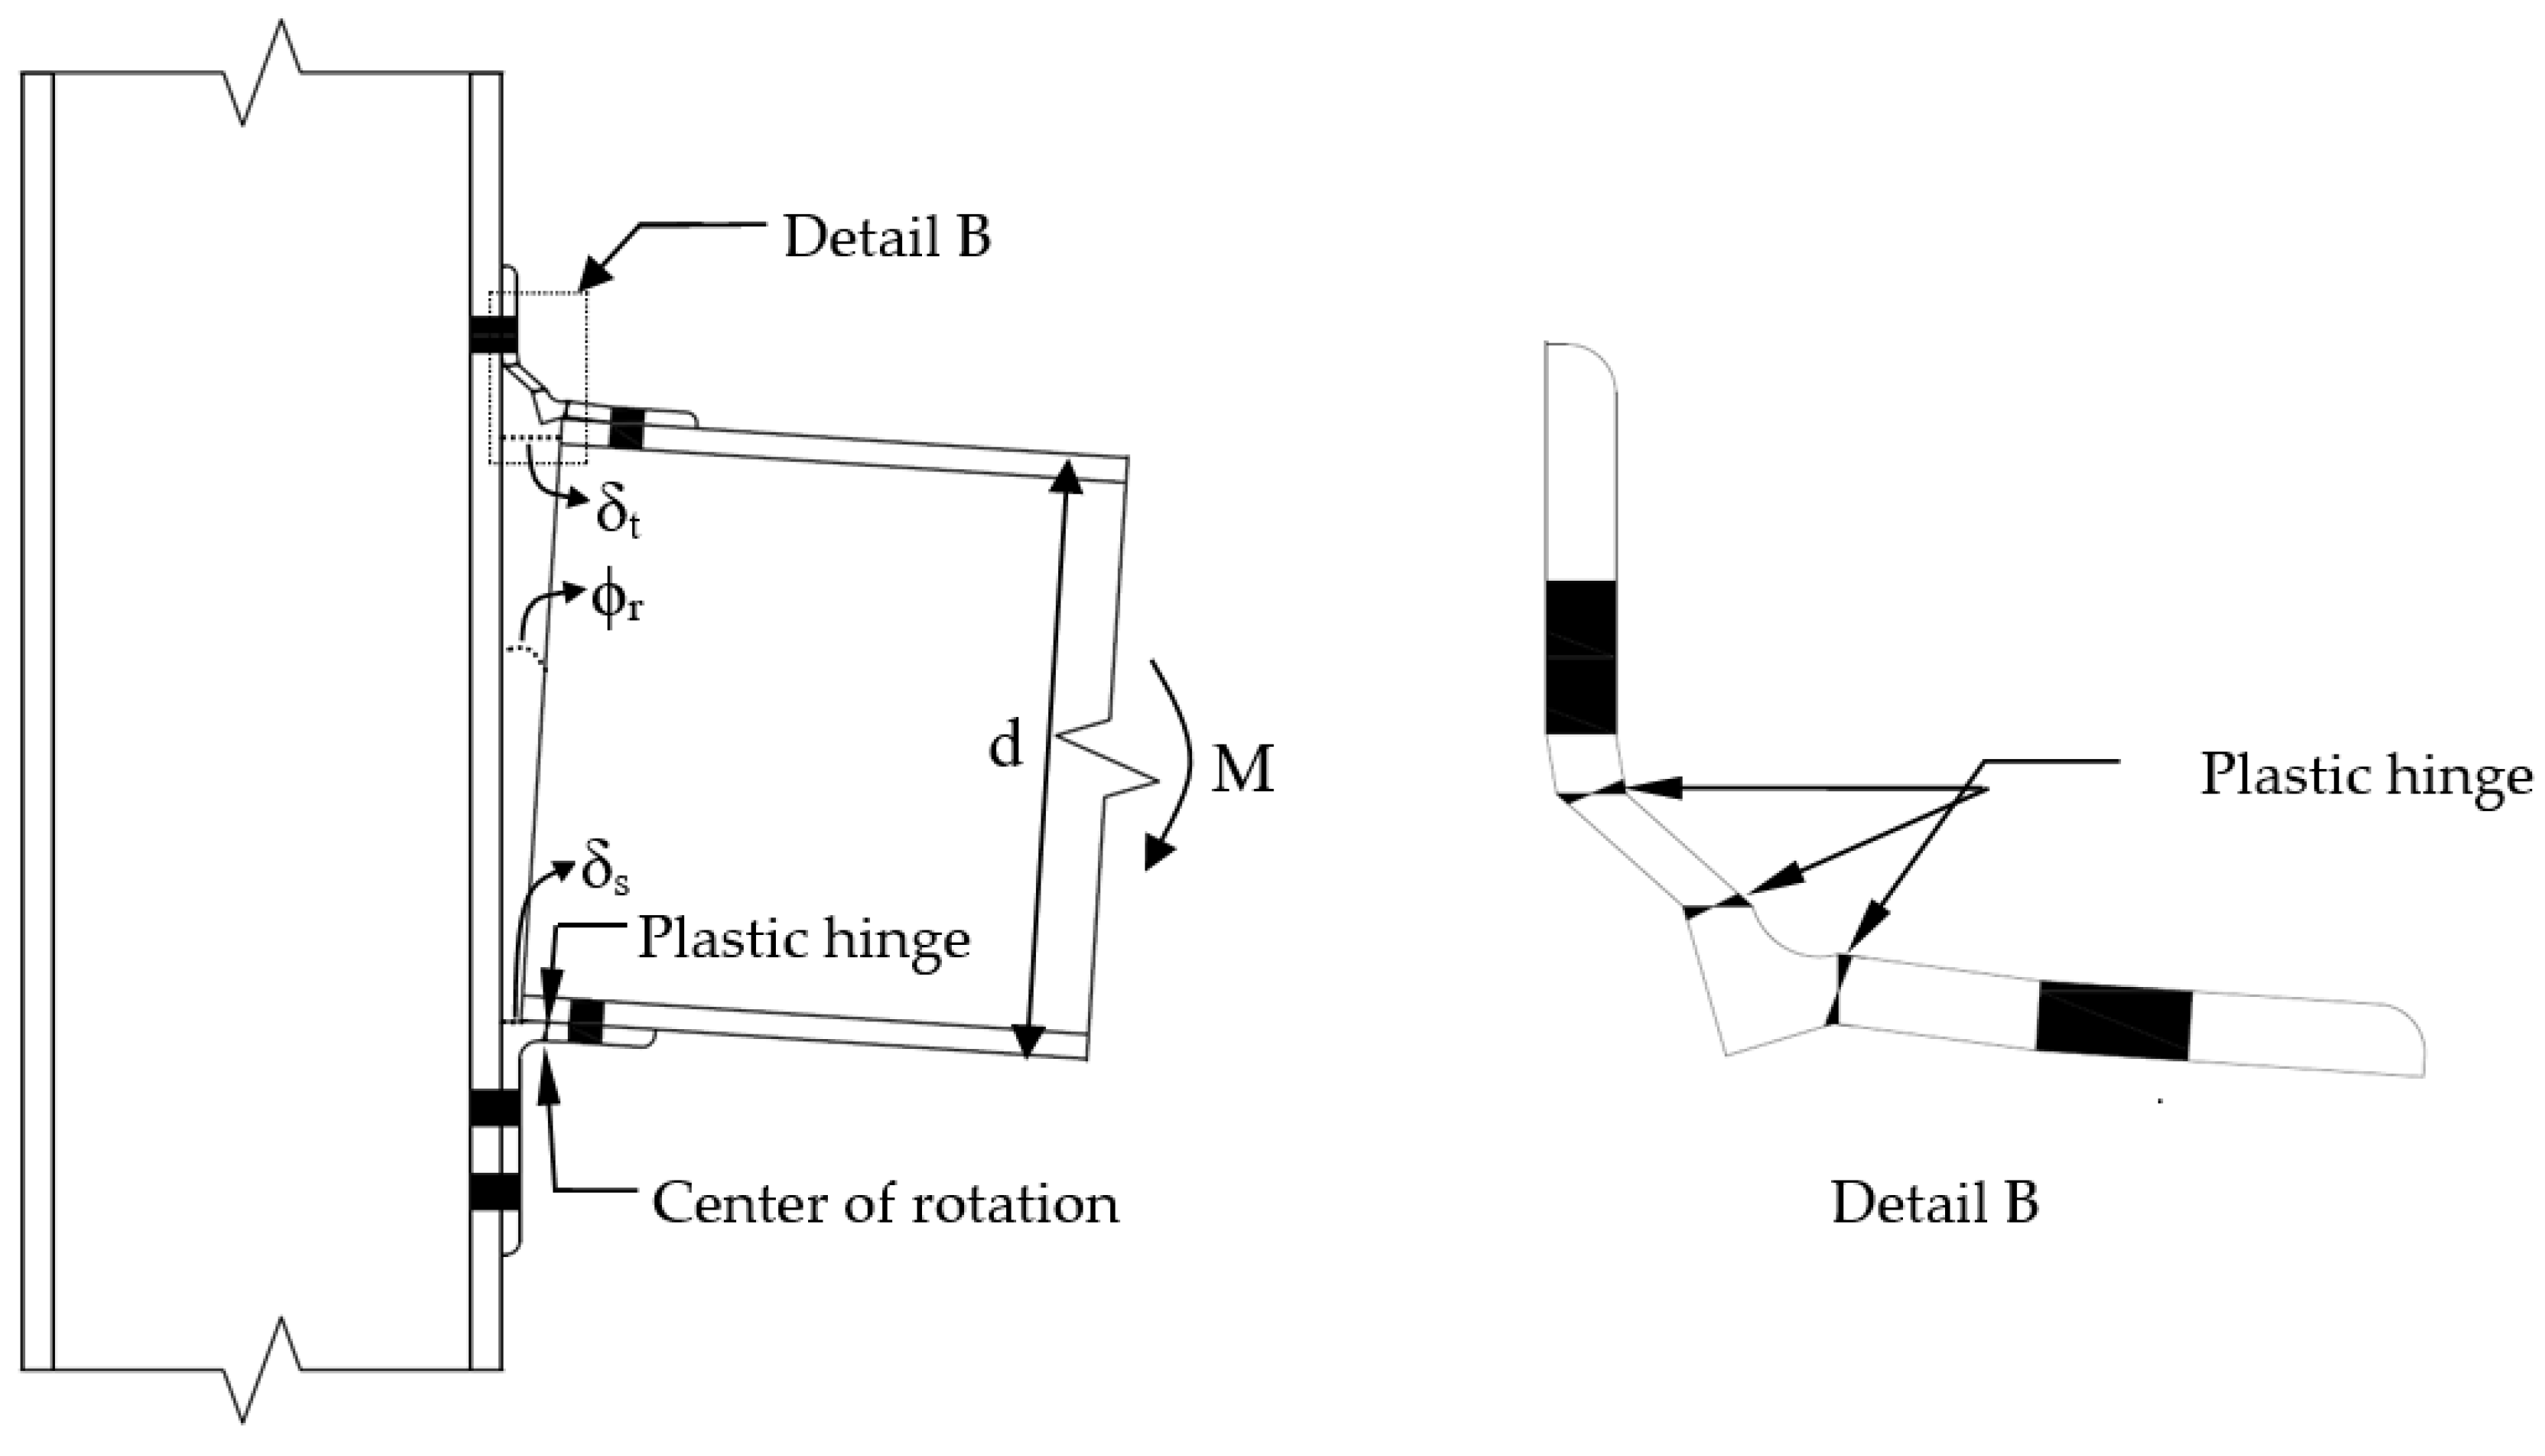
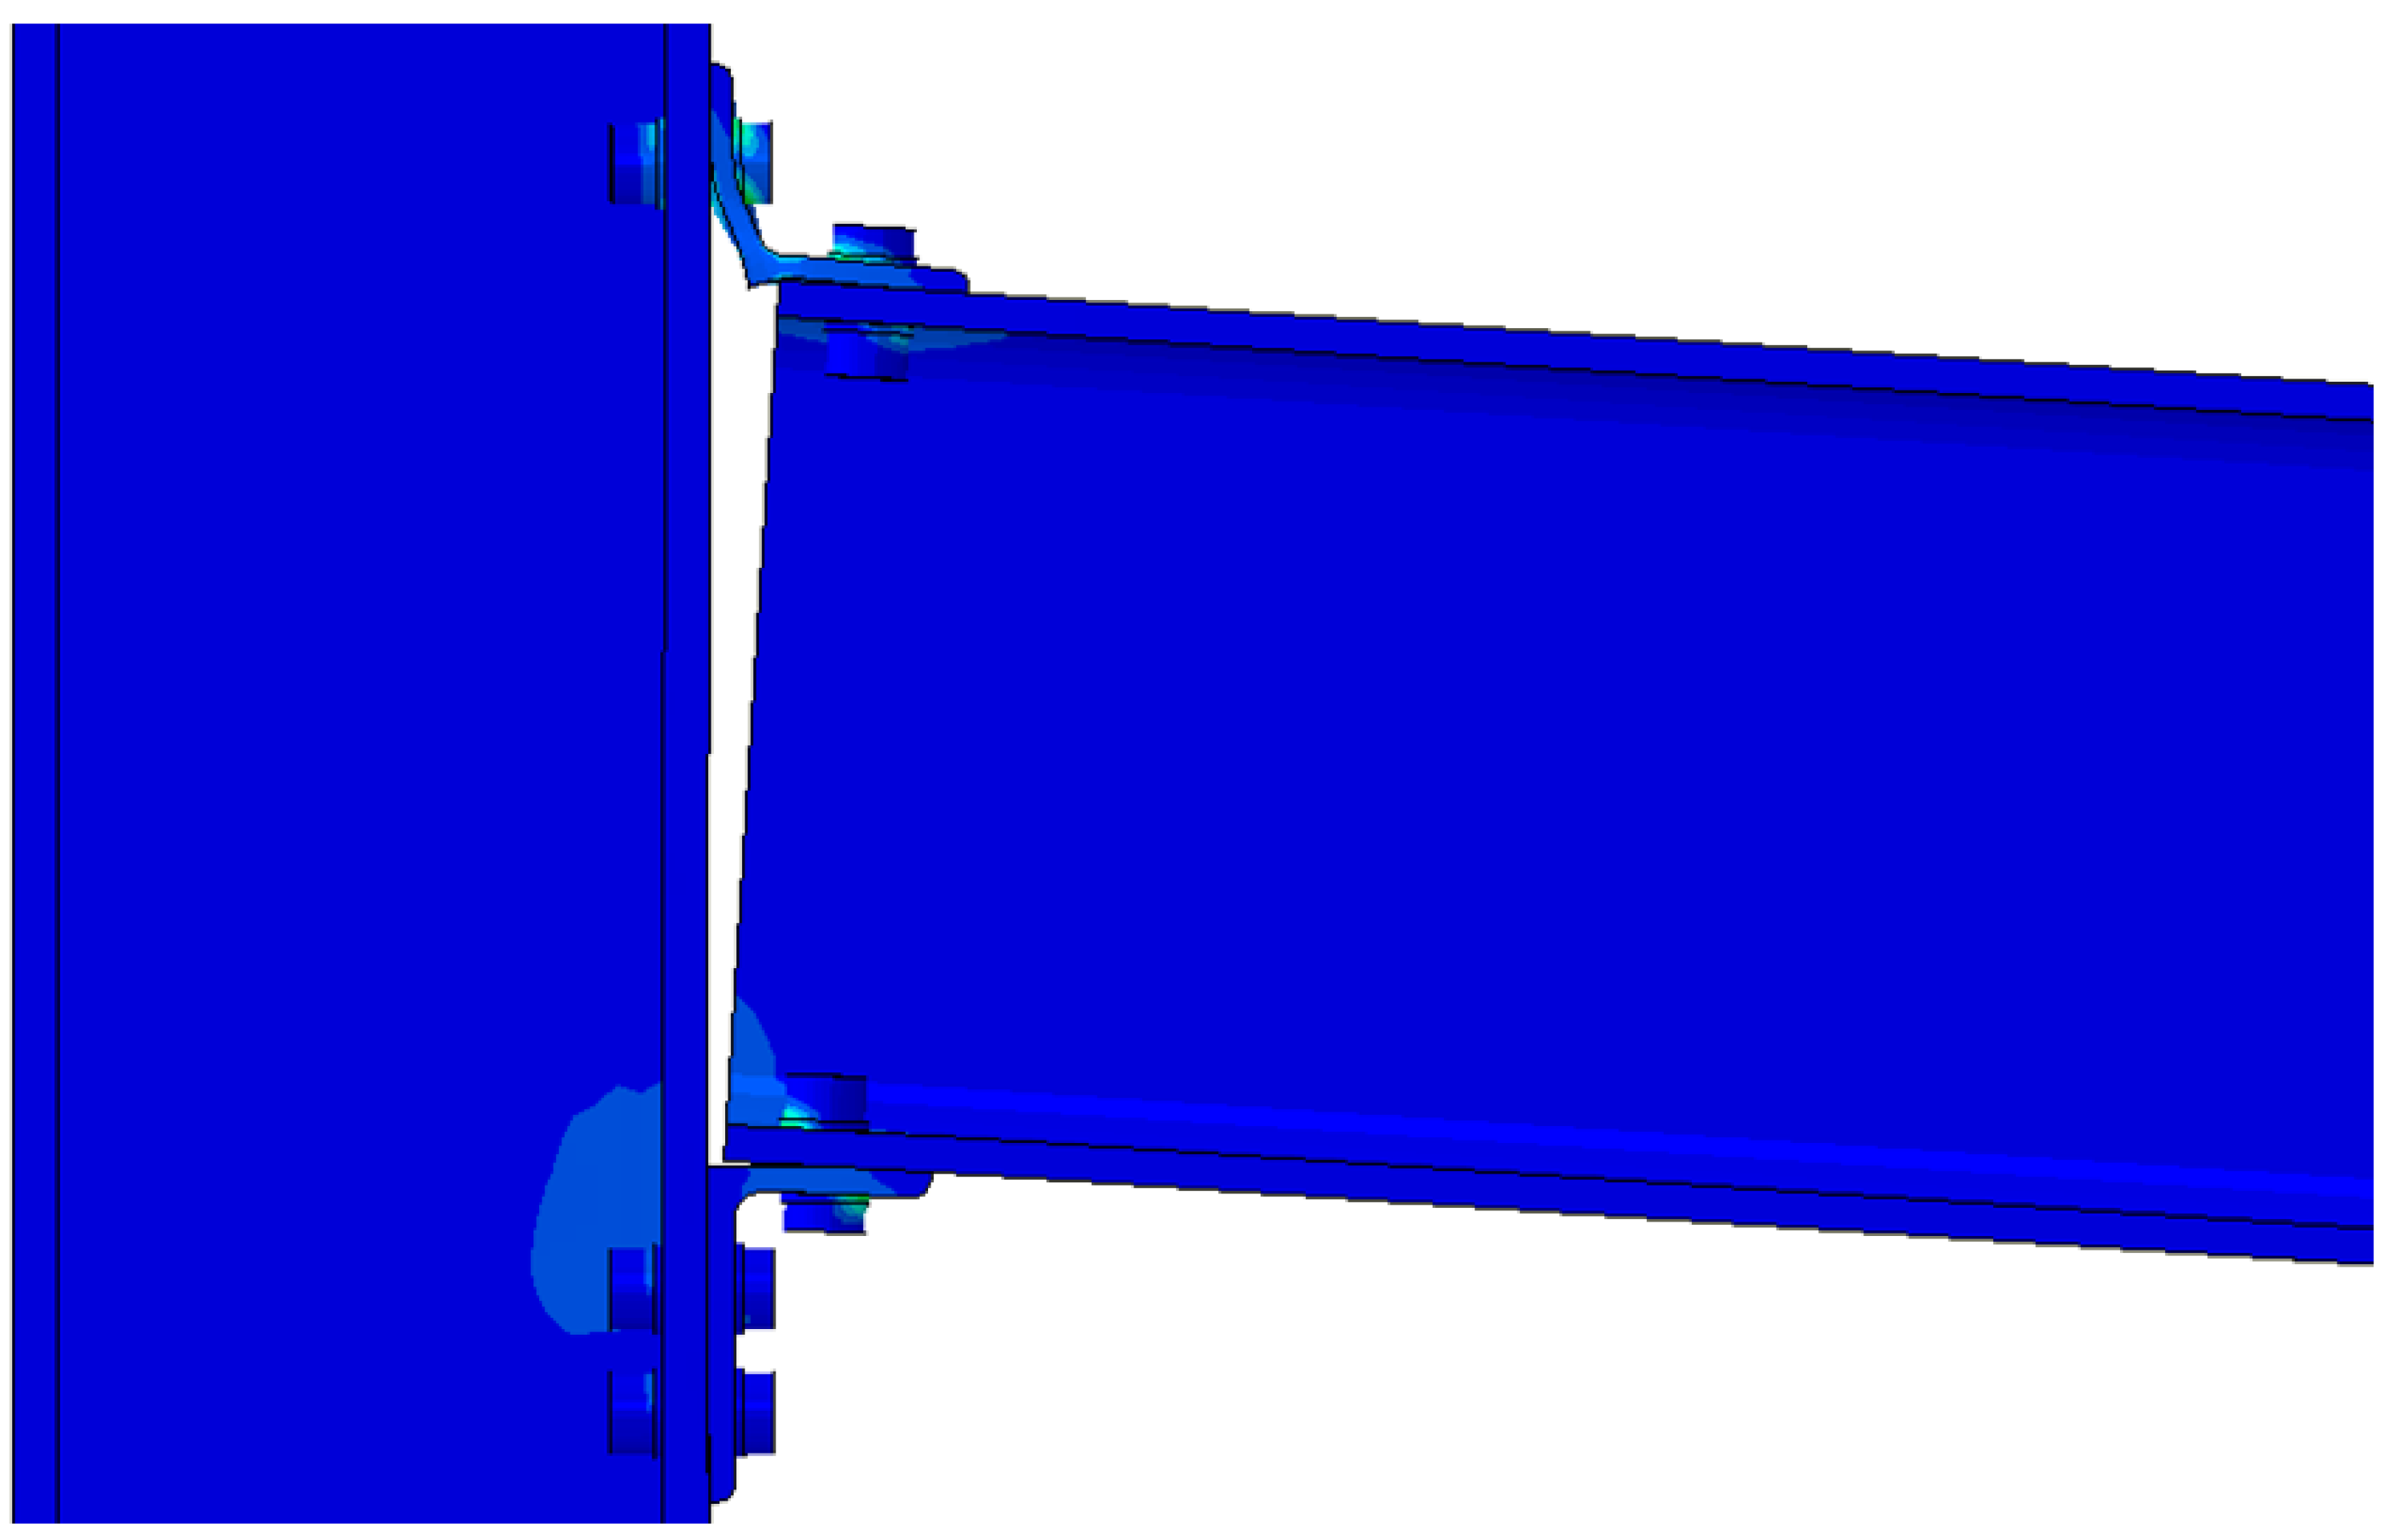
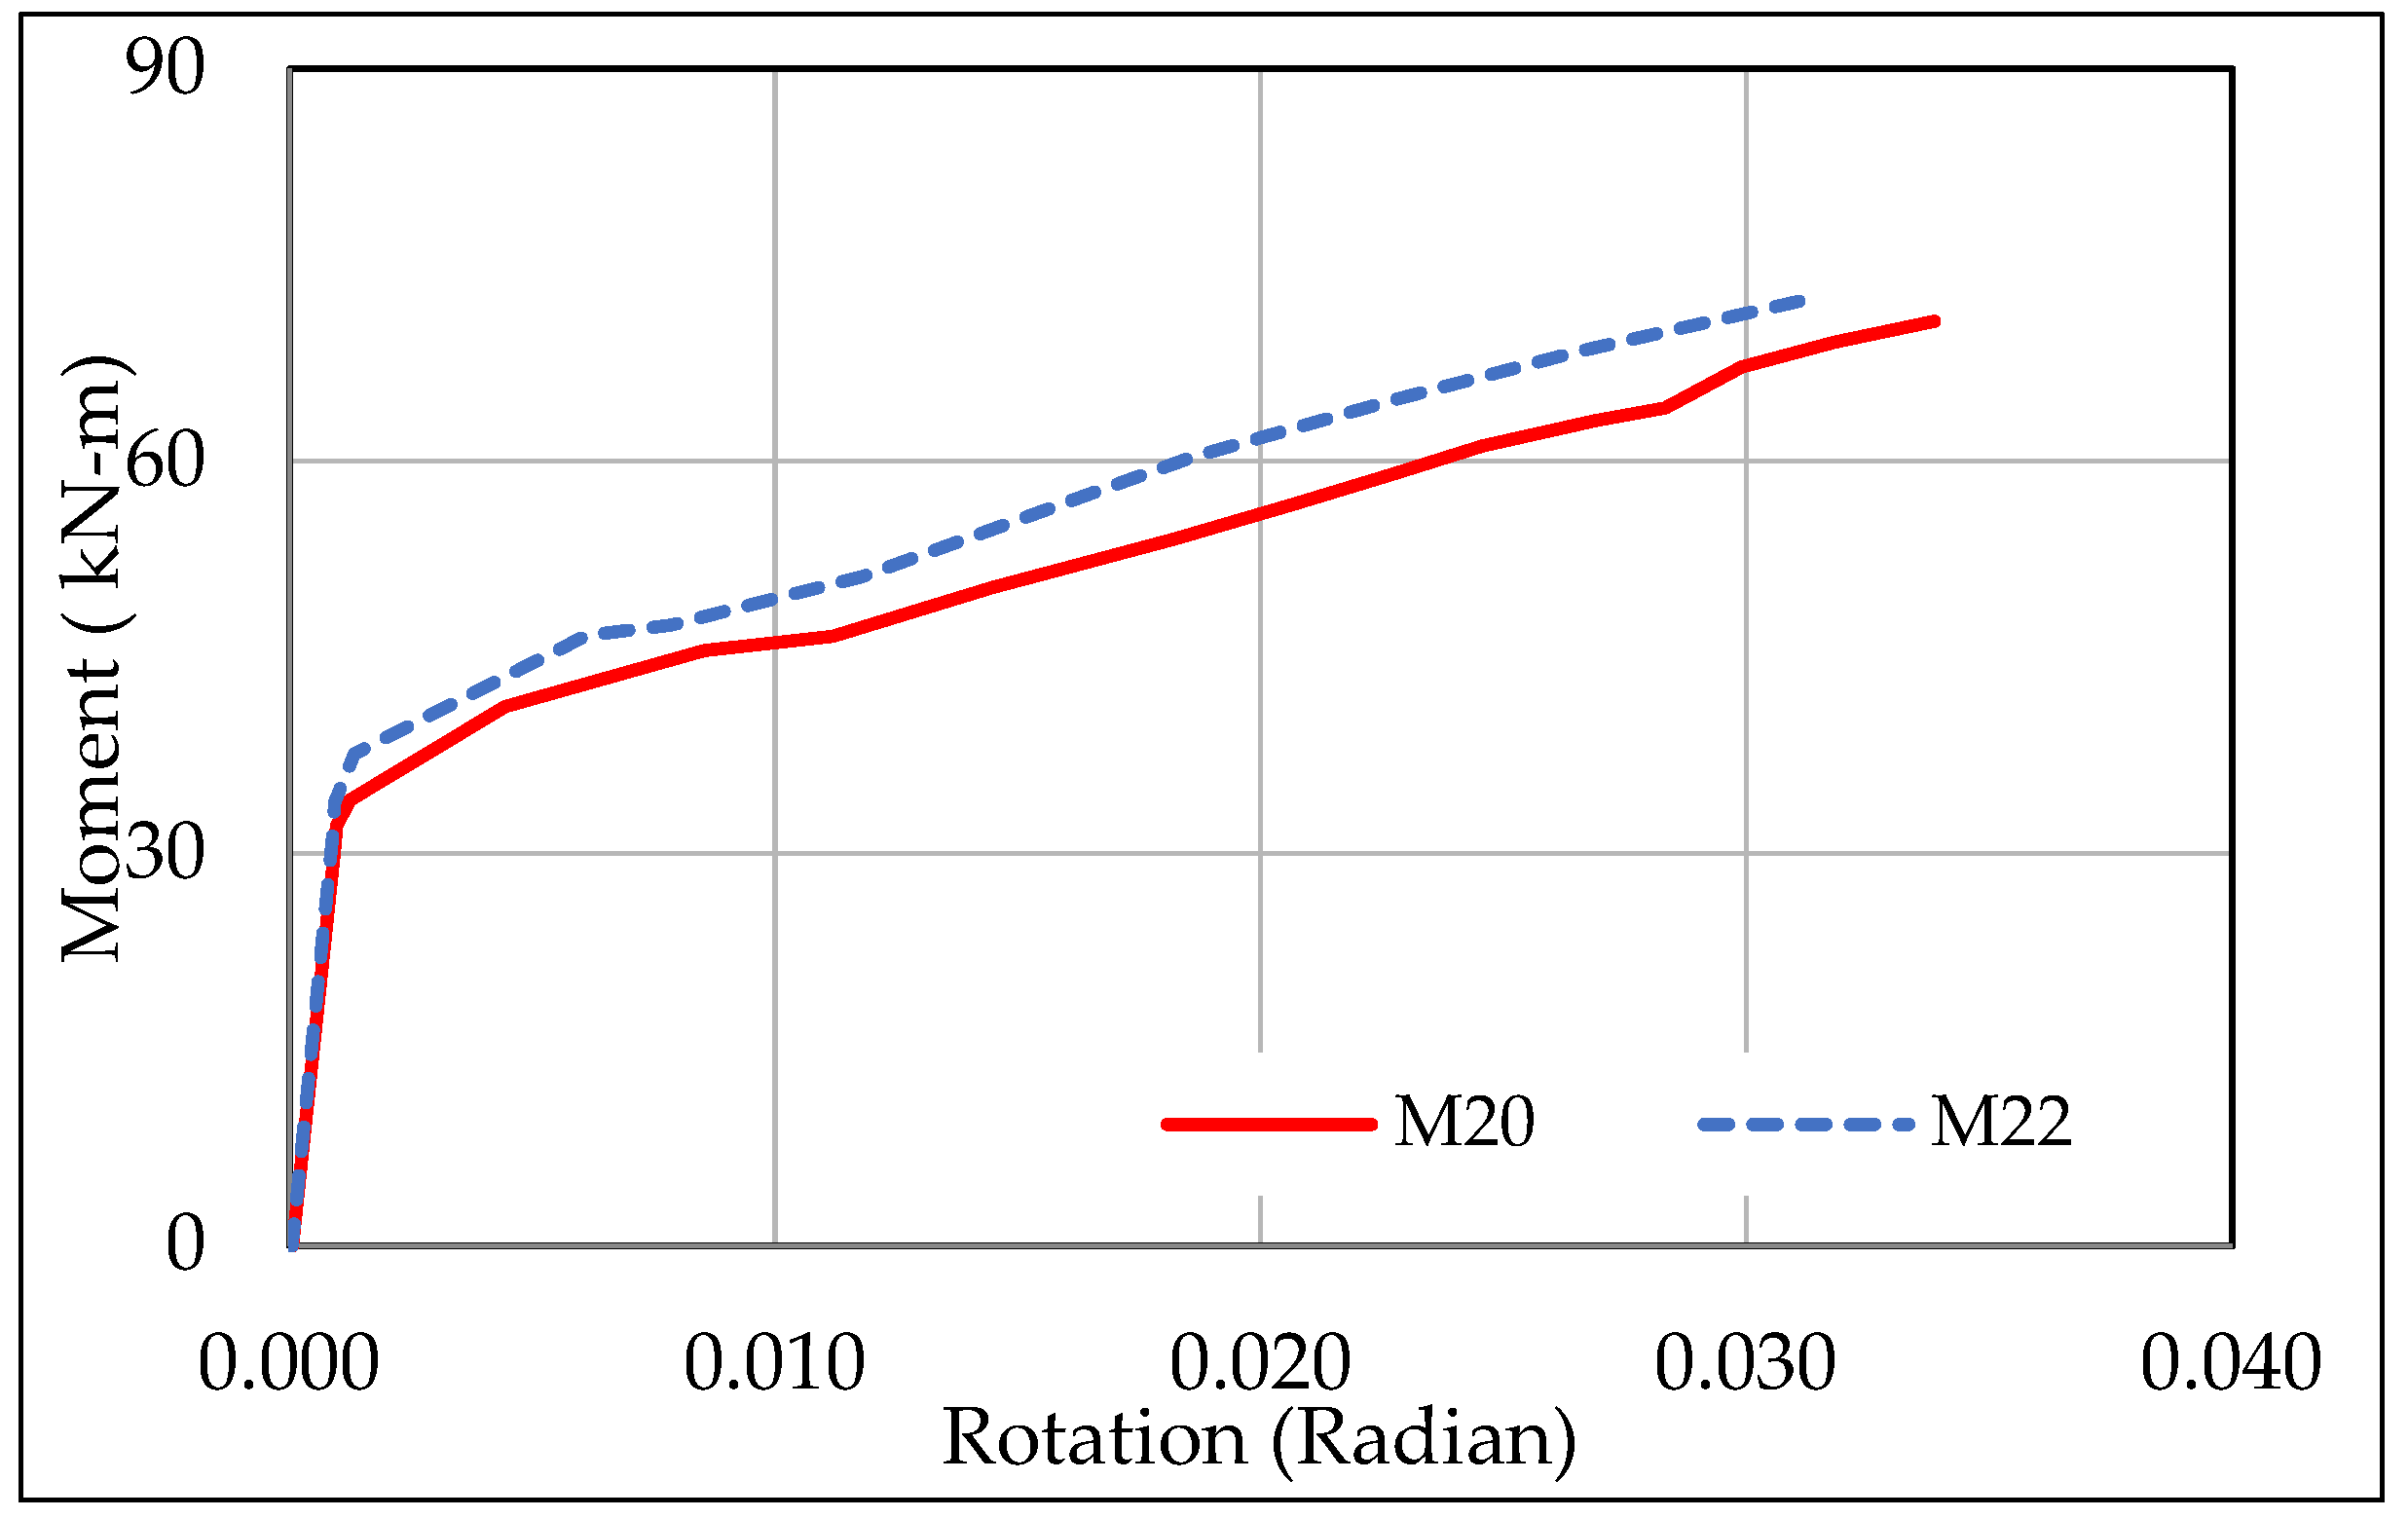
  • Within the nonlinear region of the M–θ curve, the yielding of the angles followed by the yielding of the bolts leads to the formation of plastic deformations and eventually to the connection reaching its ultimate moment. In this range, an increase in bolt diameter results in higher strain hardening stiffness and moment capacity.
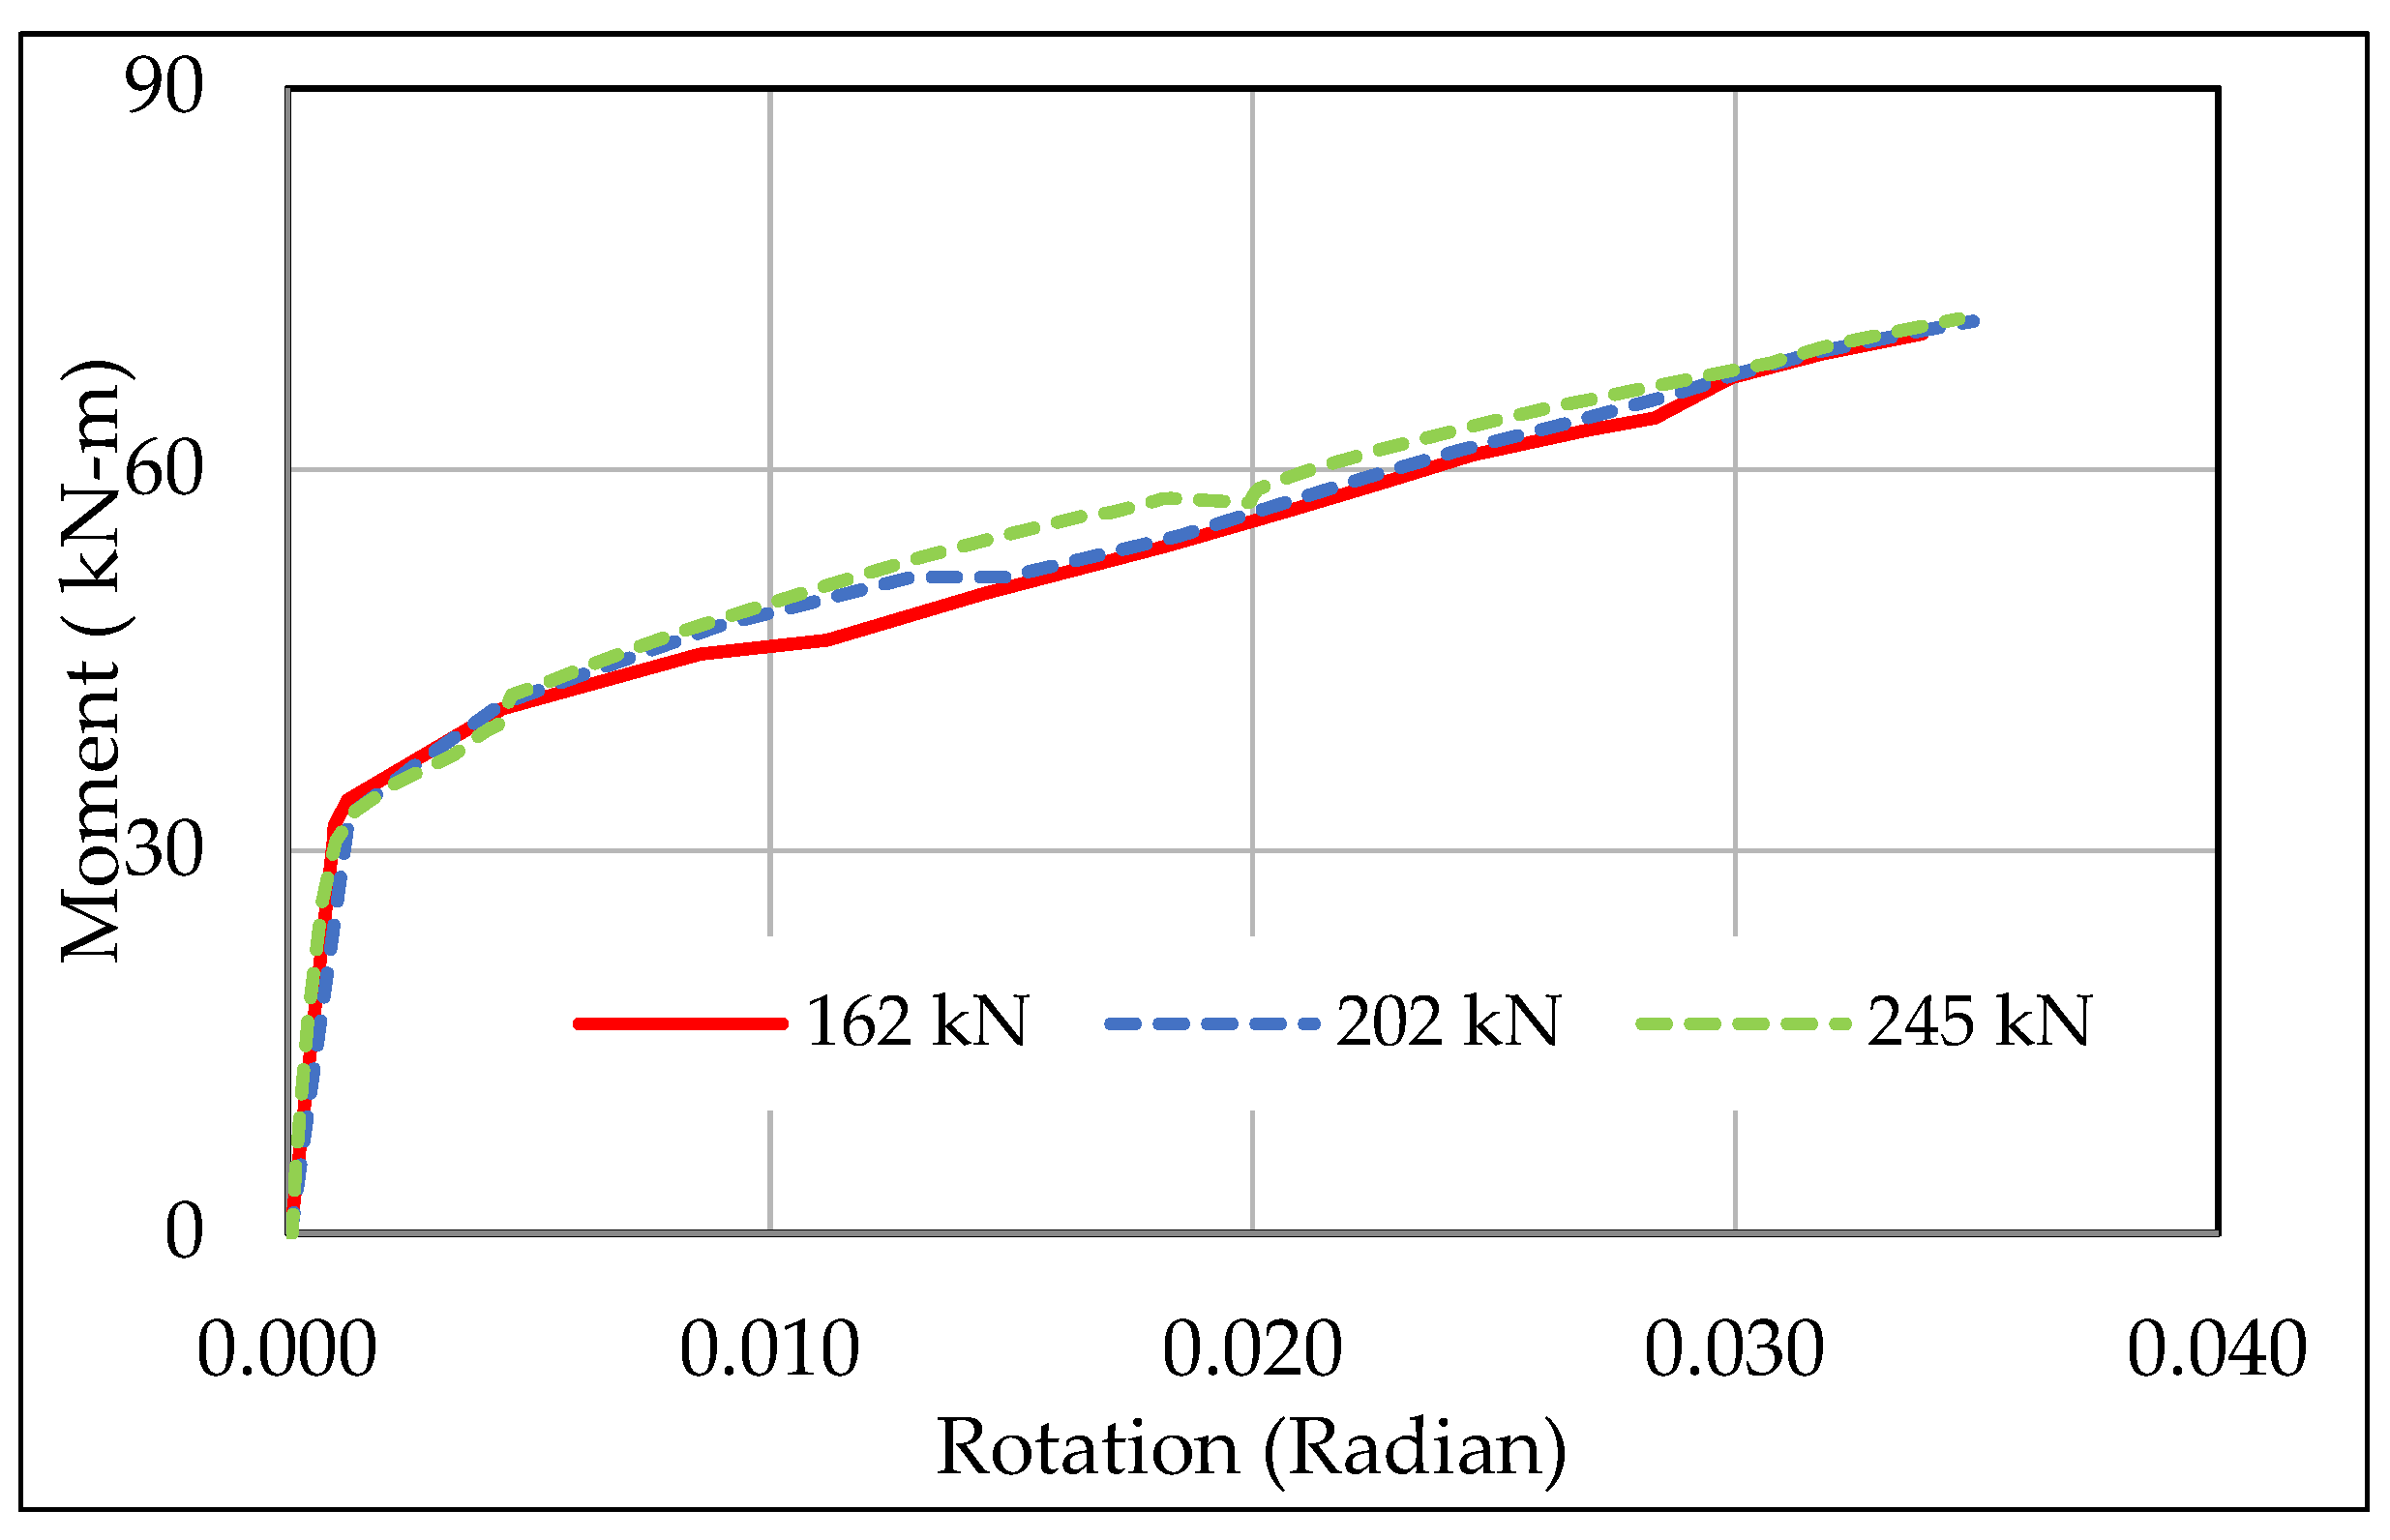
  • There was no significant influence observed on the initial rotational stiffness and the ultimate moment value of TSACs due to the increase in bolt pretension force.
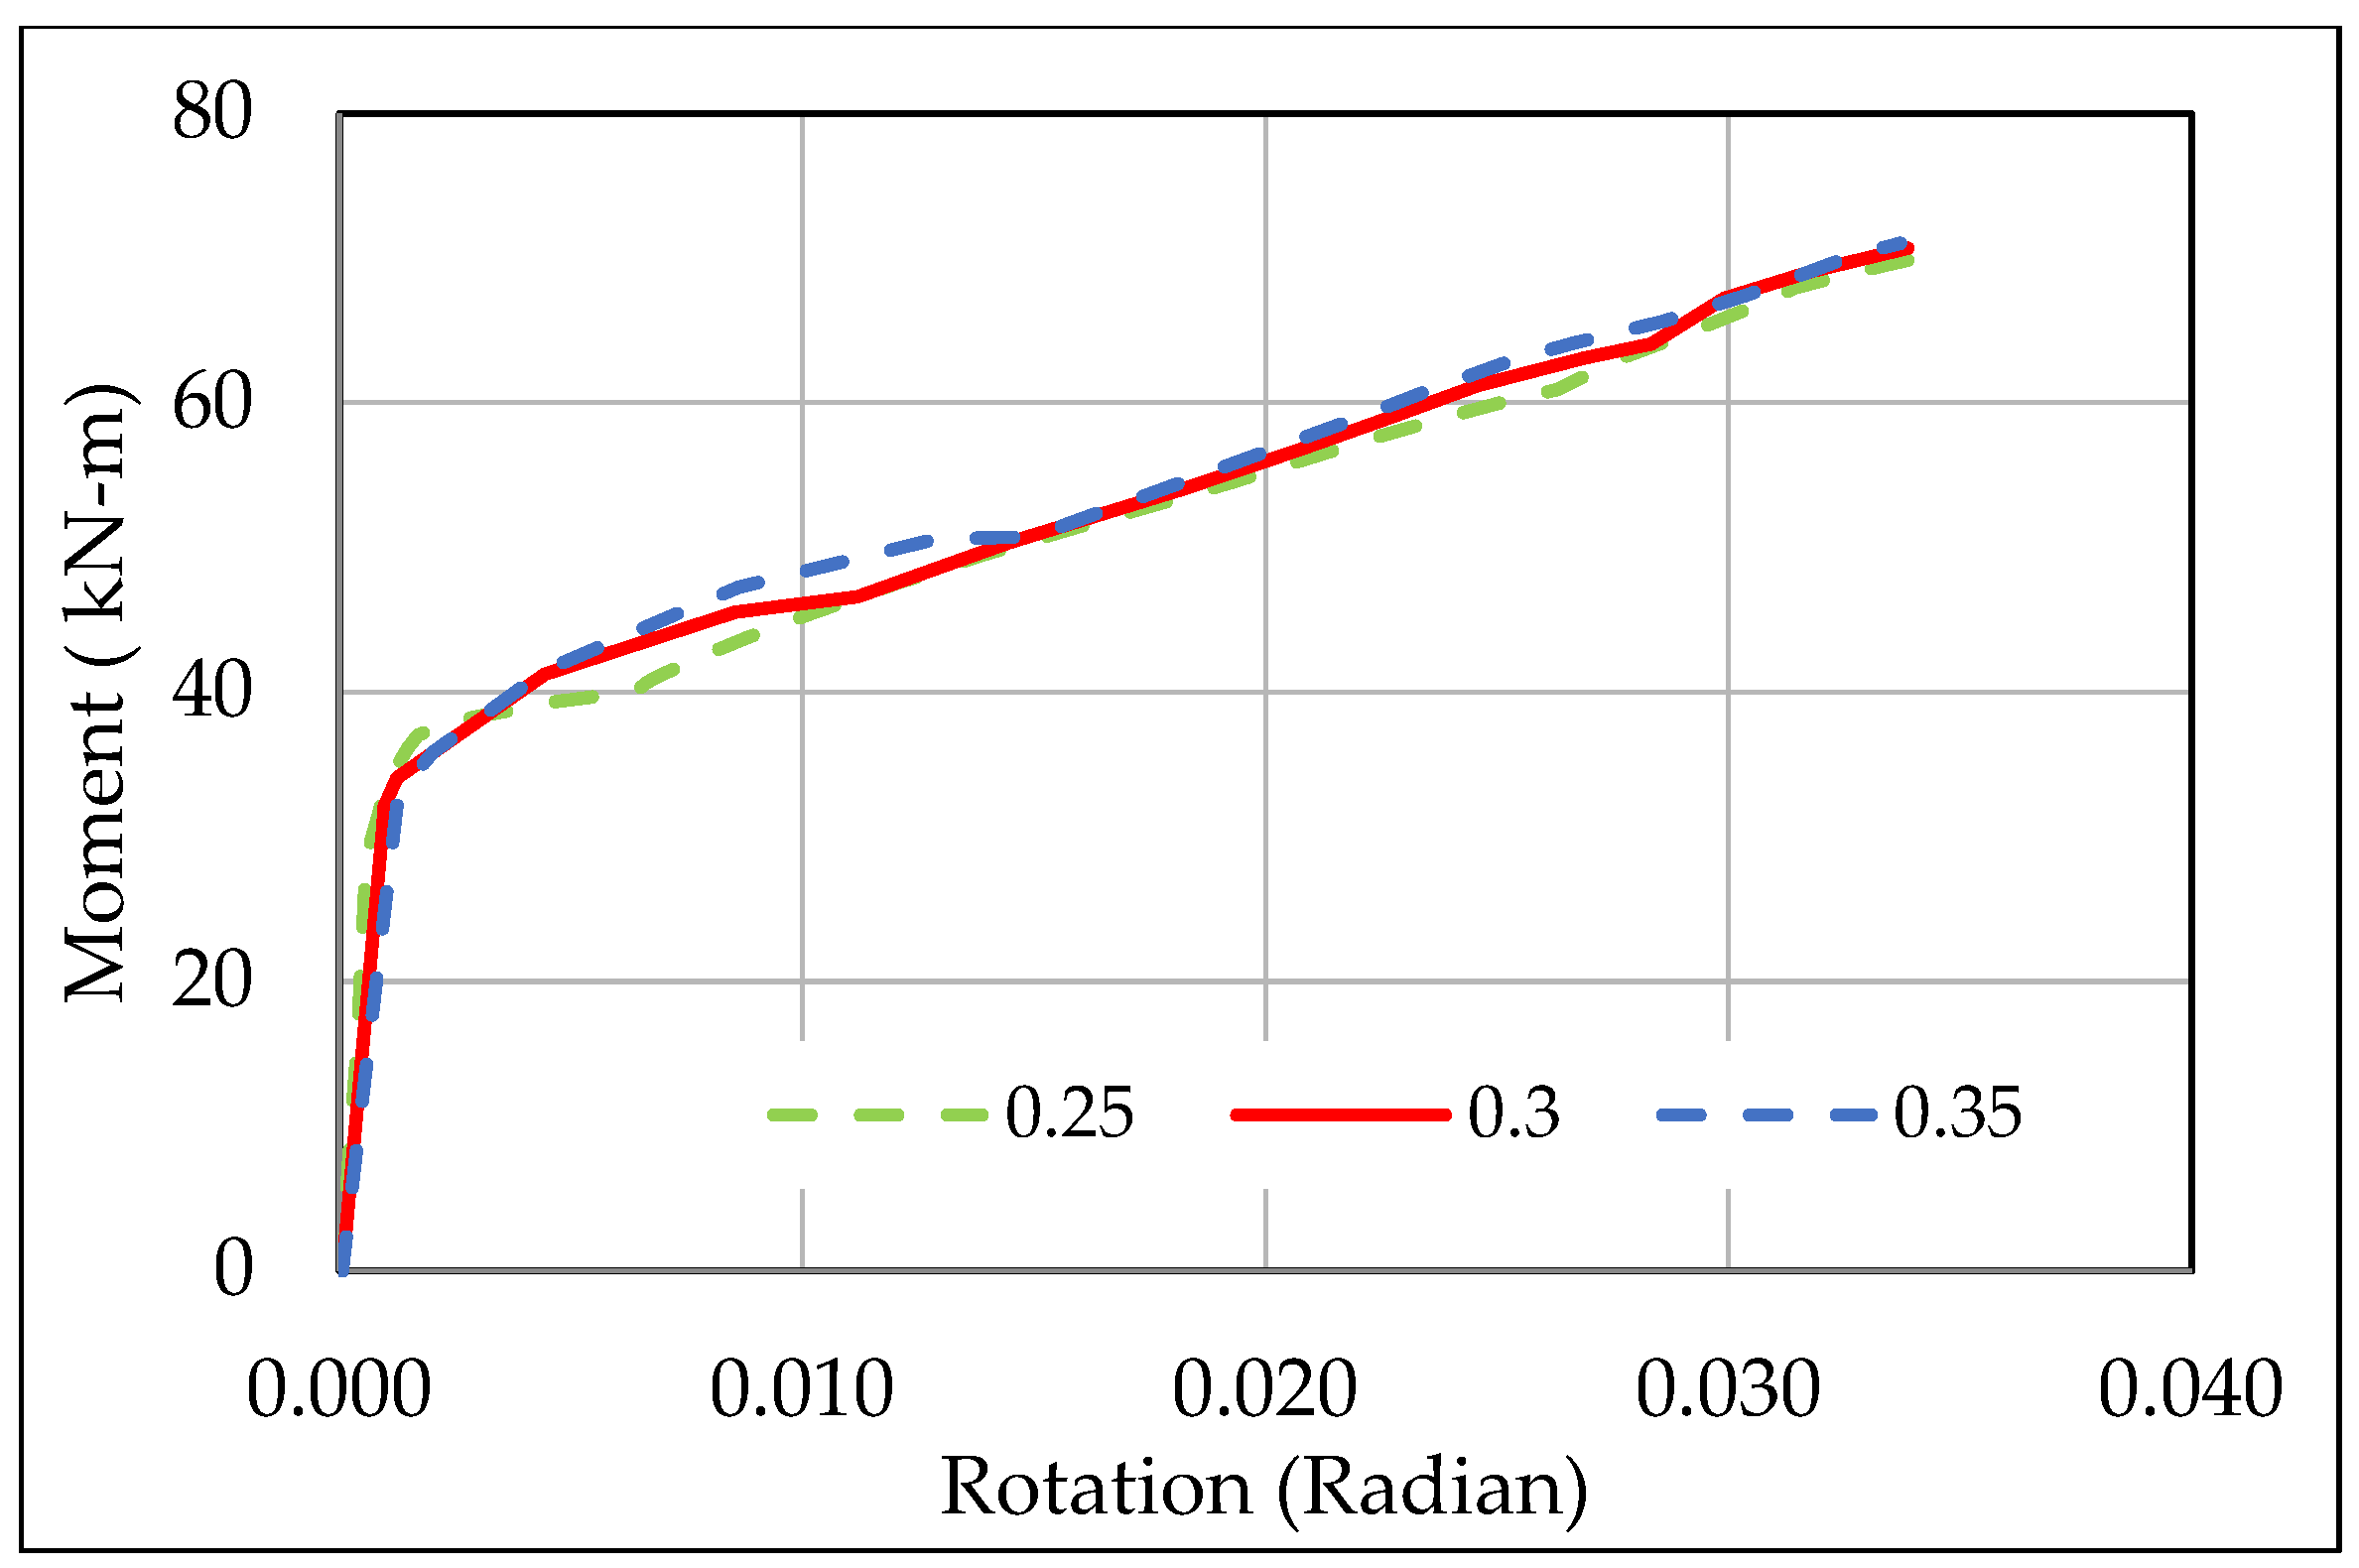
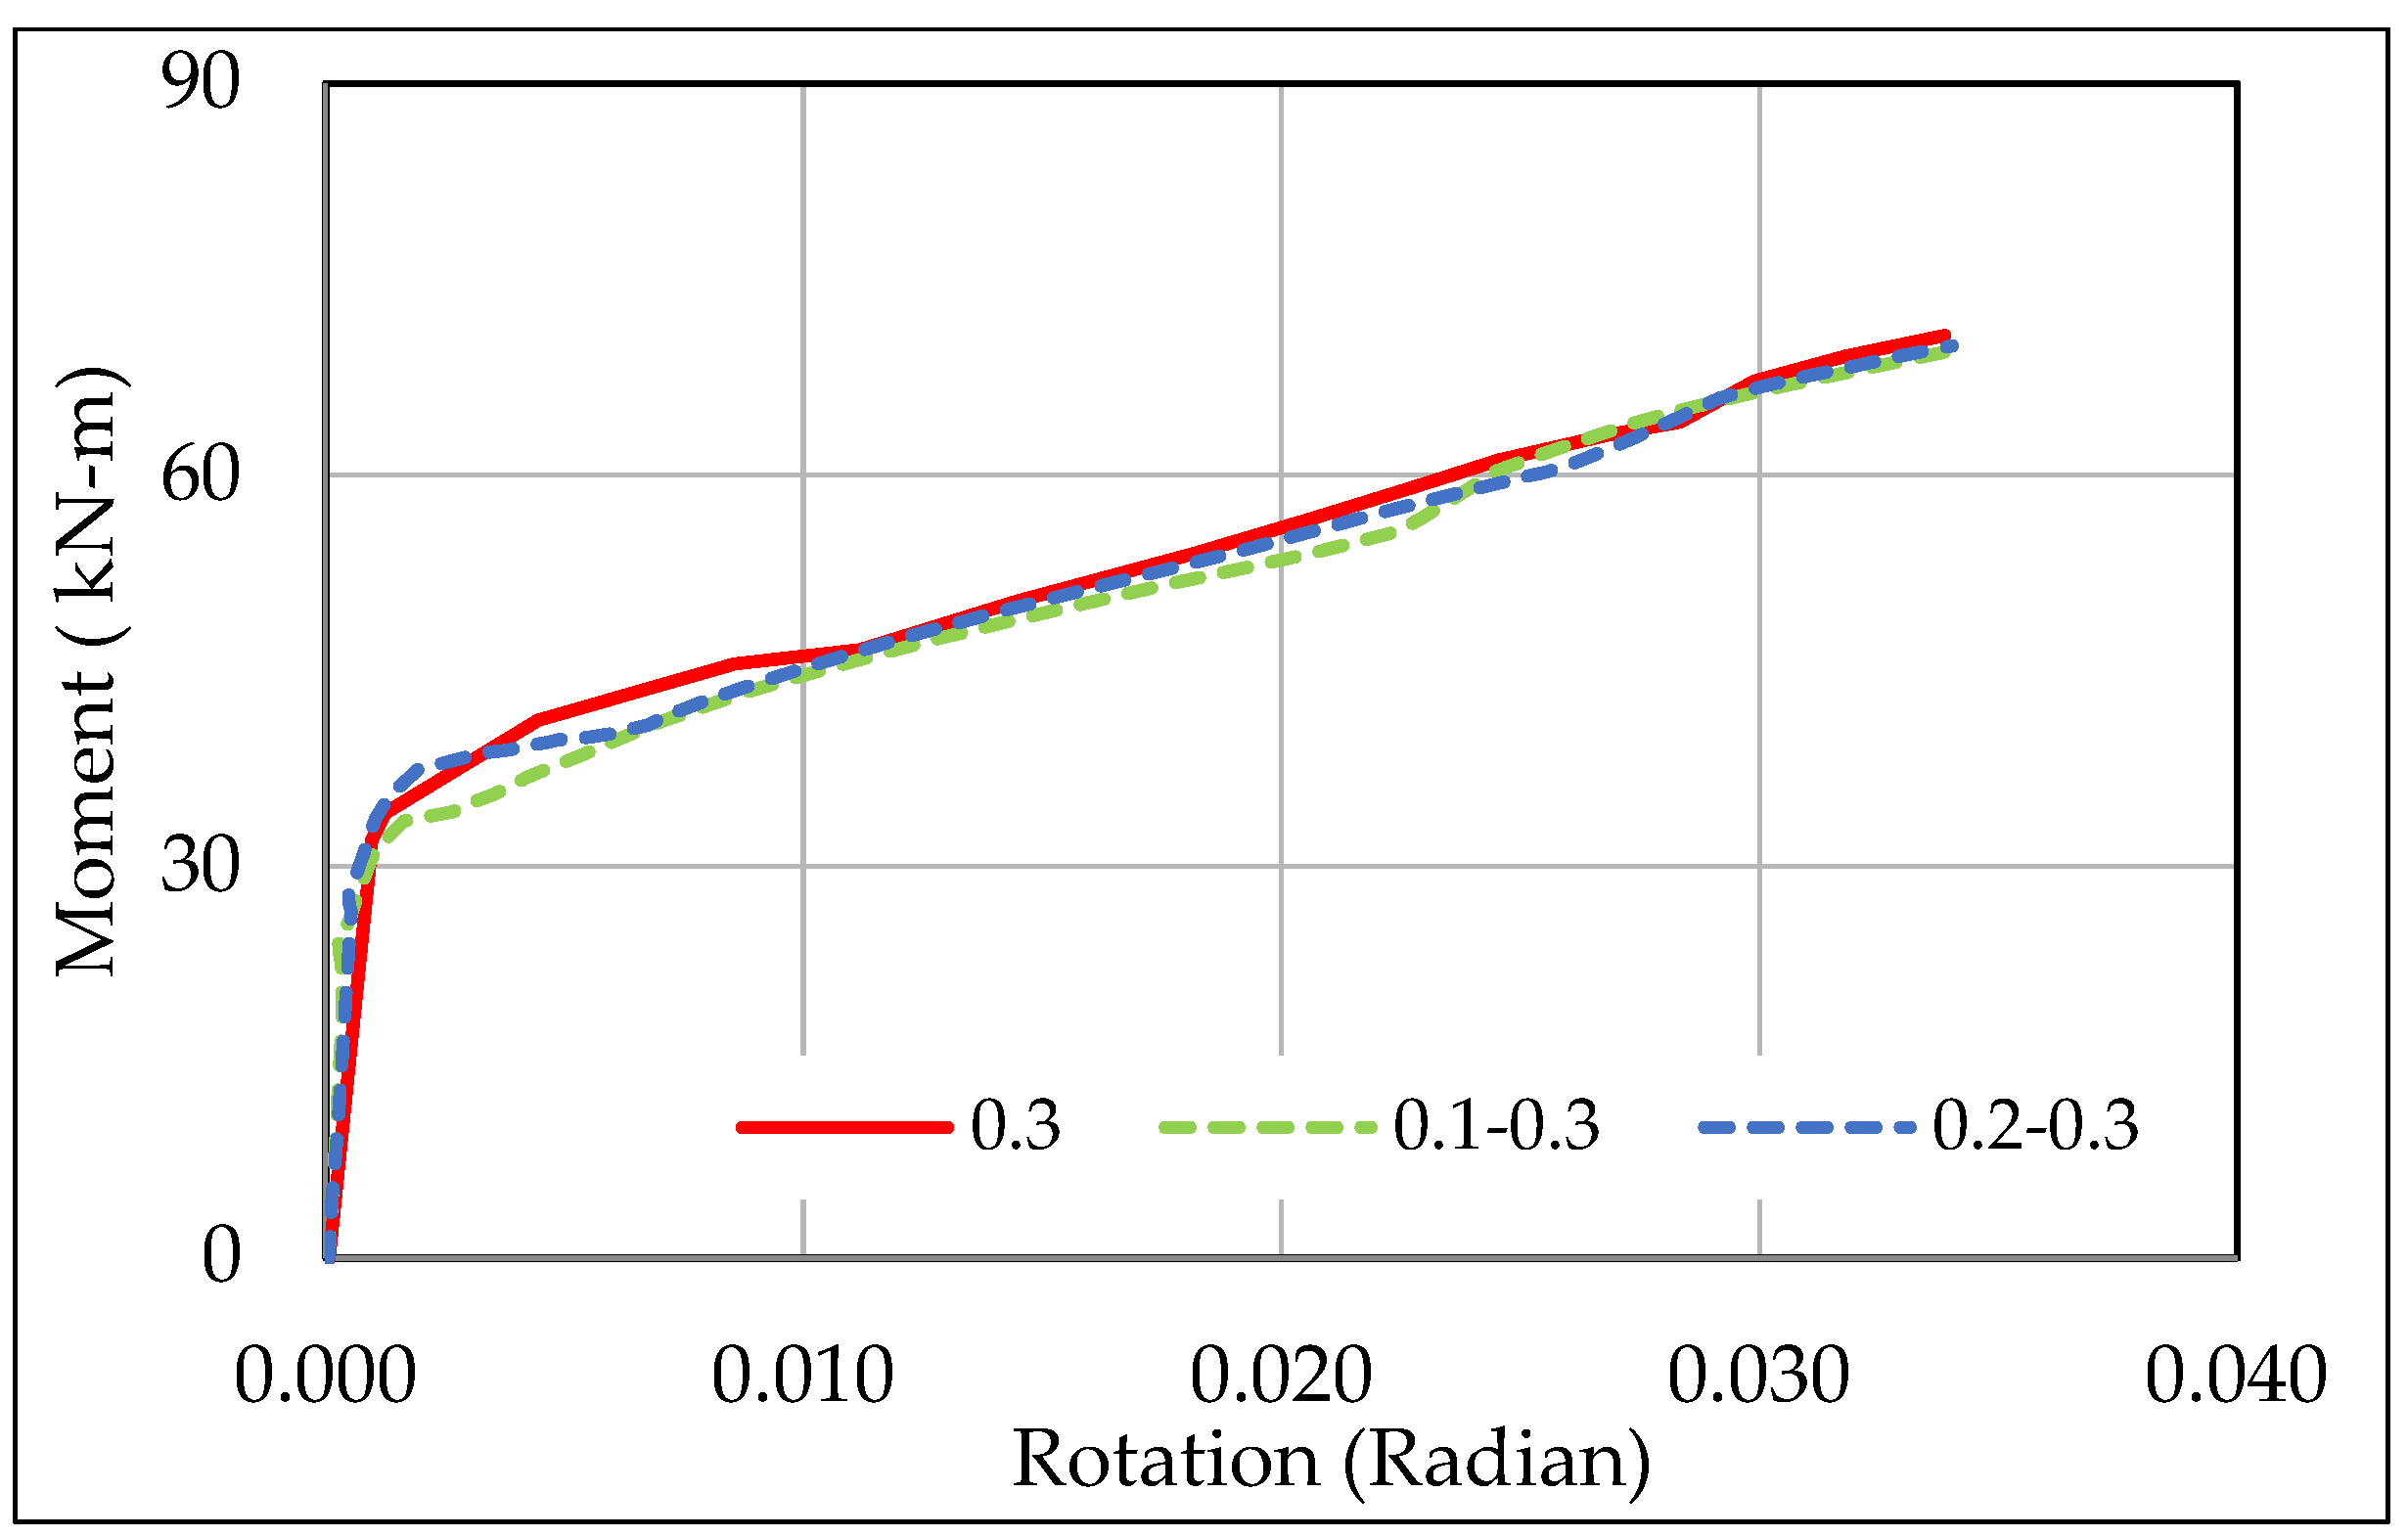
  • When the friction coefficient was reduced, a slight increase in the initial stiffness was obtained in the linear range of the M–θ curve, while a decrease in the ultimate moment of TSACs was observed. Conversely, when the friction coefficient was increased, a small decrease in the initial stiffness was determined, whereas the ultimate moment value for the TSAC was similar to that of the model with a friction coefficient of 0.3. Additionally, using two different friction coefficients between connection components in the FE model resulted in a little increase in the initial rotational stiffness, however, the ultimate moment values were almost the same.
The moment–rotation behavior of different TSACs under static loading was obtained using the validated FE models. However, there are various types of semi-rigid connections that were not discussed in this study. Further research on experimental and FE studies of these connections is necessary, and thus, a design optimization of the semi-rigid connections can be proposed.

Author Contributions

Conceptualization, Z.F.A.; Methodology, Z.F.A. and Y.B.; Software, Y.B.; Validation, Z.F.A. and Y.B.; Investigation, Z.F.A. and Y.B.; Writing—original draft, Y.B.; Writing—review & editing, Z.F.A.; Supervision, Z.F.A. All authors have read and agreed to the published version of the manuscript.

Funding

This research did not receive any specific grant from funding agencies in the public, commercial, or not-for-profit sectors.

Data Availability Statement

The data presented in this study are available in this article.

Conflicts of Interest

The authors declare no conflict of interest.

References

  1. Chen, W.-F. Semi-Rigid Connections Handbook; J. Ross Publishing: Plantation, FL, USA, 2011. [Google Scholar]
  2. Hadianfard, M.; Razani, R. Effects of semi-rigid behavior of connections in the reliability of steel frames. Struct. Saf. 2003, 25, 123–138. [Google Scholar] [CrossRef]
  3. Díaz, C.; Martí, P.; Victoria, M.; Querin, O.M. Review on the modelling of joint behaviour in steel frames. J. Constr. Steel Res. 2011, 67, 741–758. [Google Scholar] [CrossRef]
  4. Faella, C.; Piluso, V.; Rizzano, G. Structural Steel Semirigid Connections: Theory, Design, and Software; CRC Press: Boca Raton, FL USA, 1999. [Google Scholar]
  5. AISC. Allowable Stress Design and Plastic Design Specifications for Structural Steel Buildings, 9th ed.; American Institute of Steel Construction: Chicago, IL, USA, 1989. [Google Scholar]
  6. Azizinamini, A.; Bradburn, J.; Radziminski, J. Static and Cyclic Behavior of Semi-Rigid Steel Beam-Column Connections; University of South Carolina Columbia: Columbia, SC, USA, 1985. [Google Scholar]
  7. Fleischman, R.B. Experimental and Theoretical Analysis of Component Behavior in Top-and-Seat-Angle Connections; Lehigh University: Pennsylvania, PA, USA, 1988. [Google Scholar]
  8. Yang, J.-G.; Jeon, S.-S. Analytical models for the initial stiffness and plastic moment capacity of an unstiffened top and seat angle connection under a shear load. Int. J. Steel Struct. 2009, 9, 195–205. [Google Scholar] [CrossRef]
  9. Ahmed, A.; Kishi, N.; Matsuoka, K.-I.; Komuro, M. Nonlinear analysis on prying of top-and seat-angle connections. J. Appl. Mech. 2001, 4, 227–236. [Google Scholar] [CrossRef]
  10. Citipitioglu, A.; Haj-Ali, R.; White, D. Refined 3D finite element modeling of partially-restrained connections including slip. J. Constr. Steel Res. 2002, 58, 995–1013. [Google Scholar] [CrossRef]
  11. Ahmed, A.; Hasan, R. Effect and evaluation of prying action for top-and seat-angle connections. Int. J. Adv. Struct. Eng. 2015, 7, 159–169. [Google Scholar] [CrossRef]
  12. Li, G.H.; Qi, C.Z.; Luo, J. Research on Ultimate Moment of Top-and-seat Angle Connections in Semi-rigid Steel Frames. Appl. Mech. Mater. 2013, 351, 99–103. [Google Scholar] [CrossRef]
  13. Lin, X.; Hamamoto, N. Prediction of Initial Stiffness of Semirigid Steel Beam-to-Column Connections with Bolts and Angles. In Proceedings of the 14th World Conference on Earthquake Engineering, Beijing, China, 12–17 October 2008; pp. 12–17. [Google Scholar]
  14. Pirmoz, A.; Danesh, F. The seat angle role on moment-rotation response of bolted angle connections. Electron. J. Struct. Eng. 2009, 9, 73–79. [Google Scholar] [CrossRef]
  15. Pirmoz, A.; Khoei, A.S.; Mohammadrezapour, E.; Daryan, A.S. Moment–rotation behavior of bolted top–seat angle connections. J. Constr. Steel Res. 2009, 65, 973–984. [Google Scholar] [CrossRef]
  16. Yang, J.-G.; Choi, J.-H.; Kim, S.M. A finite element model for the prediction of the behavior of an unstiffened top and seat angle connection with various top angle bolt gage distances. J. Asian Archit. Build. Eng. 2011, 10, 367–374. [Google Scholar] [CrossRef]
  17. Kong, Z.; Kim, S.-E. Numerical estimation for initial stiffness and ultimate moment of top-seat angle connections without web angle. J. Struct. Eng. 2017, 143, 04017138. [Google Scholar] [CrossRef]
  18. Abaqus V. 14 Documentation, Dassault Systemes Simulia Corporation 651, 6.2. 2014. Available online: https://www.academia.edu/28334906/Abaqus_Analysis_Users_Guide. (accessed on 25 June 2023).
  19. ANSI/AISC 360-10; Specification for Structural Steel Buildings. American Institute of Steel Construction (AISC): Chicago, IL, USA, 2010.
  20. Nouri, G.; Rayegani, A.; Lavasani, H.H.; Tavakoli, L.; Nasiri, M.; Soureshjani, O.K. Seismic performance of the RBS connection with trapezoidal corrugated web (TCW-RBS). Structures 2023, 56, 105003. [Google Scholar] [CrossRef]
  21. ANSI/AISC 360-16; Specification for Structural Steel Buildings. American Institute of Steel Construction: Chicago, IL, USA, 2016.
  22. JIS B 1186-1995; Sets of High Strength Hexagon Bolt, Hexagon Nut and Plain Washers for Friction Grip Joints. Japanese Standards Association: Tokyo, Japan, 1995.
  23. Kim, J.; Nah, H.; Lee, H. Experimental Study on the Mechanical and Clamping Properties of F13T High Strength Bolt. In Proceedings of the Transactions of the Korean Nuclear Society Autumn Meeting, Gyeongju, Republic of Korea, 2–3 November 2006. [Google Scholar]
Figure 1. Geometry of T10-S12 connection.
Buildings 13 02425 g001
Figure 2. Engineered and true stress–strain curves of S235 steel material [16].
Buildings 13 02425 g002
Figure 3. Boundary conditions and mesh pattern of FE model.
Buildings 13 02425 g003
Figure 4. Details of the bolt used in FE model.
Buildings 13 02425 g004
Figure 5. The pre-stress transfer to the flange and the angle.
Buildings 13 02425 g005
Figure 6. Deformation shape of a TSAC.
Buildings 13 02425 g006
Figure 7. Comparisons of the M–θ curves: (a) T10–S12, (b) T10–S15, (c) T13–S12, (d) T13–S15 [8,17].
Buildings 13 02425 g007
Figure 8. Deformed shape of T10–S15 angle connection.
Buildings 13 02425 g008
Figure 9. Comparisons of deformed shape of T10-S15 angle specimen with the test results [8].
Buildings 13 02425 g009
Figure 10. Effect of the bolt pretension force.
Buildings 13 02425 g010
Figure 11. Effect of different friction coefficient between all the contact surfaces.
Buildings 13 02425 g011
Figure 12. Effect of the different friction coefficients between the beam, column, and angles.
Buildings 13 02425 g012
Figure 13. Effect of bolt strength.
Buildings 13 02425 g013
Figure 14. Effect of bolt diameter.
Buildings 13 02425 g014
Figure 15. Effect of bolt gage distance.
Buildings 13 02425 g015
Table 1. Geometric properties of the Specimens.
SpecimenColumnBeamTop AngleSeat Angle
T10-S12H310.305.15.20H390.300.10.16L100.100.10L150.100.12
T10-S15H310.305.15.20H390.300.10.16L100.100.10L150.100.15
T13-S12H310.305.15.20H390.300.10.16L100.100.13L150.100.12
T13-S15H310.305.15.20H390.300.10.16L100.100.13L150.100.15
Disclaimer/Publisher’s Note: The statements, opinions and data contained in all publications are solely those of the individual author(s) and contributor(s) and not of MDPI and/or the editor(s). MDPI and/or the editor(s) disclaim responsibility for any injury to people or property resulting from any ideas, methods, instructions or products referred to in the content.

