1. Introduction
Building codes, quality standards, benchmarks, good practice guides, and defect databases are approaches used to transfer FM knowledge to the design phase. Even so, many defects are being repeated, with design decisions being the main culprit, impacting downstream maintenance requirements and increasing the lifecycle cost of buildings. Building maintainability, in this regard, refers to the effective utilization of a building throughout its service life. To eliminate such common defects and to minimize downstream maintenance cost through maintainability, software algorithms can be utilized to do maintainability forecasting in an automated manner [
1].
Therefore, the use of software algorithms for automated maintainability forecasting is encouraged by this study. It extends over existing methods and presents a combined methodology providing a structured framework to support risk-informed decision-making while designing and maintaining basement systems. This structured approach ensures that risk information is effectively translated into actionable decisions during the design phase.
2. Analytic Models Used for Reliability-Based Decision Support
2.1. Artificial Neural Networks (ANN)
An ANN model, when properly trained with large enough, reliable historical data, can be used to accurately evaluate causal behaviours and uncertainties of building systems [
10]. They can even be utilized in the continuous and real-time degradation or system health monitoring with the availability of updated system behaviour evidence. As the performance of an ANN model is highly dependent on the quality (how clean) and the quantity of its training data, the scarcity of complete datasets for a complex subject, such as a modern tall building, has hindered the widespread usage of such models. Furthermore, as the definition of the network structure (i.e., the number of hidden nodes and layers) is determined by a trial and error process at a certain case study, it may not be appropriate to generalize an ANN model to wider cases and applications [
11].
2.2. Failure Mode Effect and Criticality Analysis (FMECA)
Rating techniques, such as COMASS, which uses the criticality of the failure mode, can either be qualitative or quantitative in nature. Qualitative failure modes can be calculated using the severity of effects, frequency of occurrence, and probability of detection probability rating [
12]. A quantitative rating can be recommended when adequate data are available. However, this approach takes liberties with unrealistic assumptions on variable importance and expresses risk levels with a priority number rather than calculating probabilities for risks and their impacts [
13].
2.3. Analytic Hierarchy Process (AHP)
AHPs analyse complex decisions based on mathematics and psychology, utilising experts’ experiences to estimate the relative magnitudes of factors through pairwise comparisons. This approach is not widely used for a complex building; it is difficult to recognize causal relationships among different risk events, challenges of handling variability in pairwise comparisons, and computational complexities when involving divergent risks [
14,
15].
2.4. Technique for Order of Preference by Similarity to Ideal Solution (TOPSIS)
The Technique for Order of Preference by Similarity to Ideal Solution (TOPSIS) is an expert multiple criteria decision-making (MCDM) system, apt in risk assessment in uncertain project conditions. It can be used to effectively choose the best alternative using both quantitative and qualitative data [
16]. Rather than computing realistic risk conditions by correlating the variables, the alternatives are selected by comparing the variation from subjective judgement. The limitation of this approach therein lies in the TOPSIS’ reliance on relative importance between variables, which is highly dependent on the subjective expert judgements [
17].
2.5. Structural Equation Modelling (SEM)
Structural equation modelling (SEM) is a quantitative assessment approach to causal modelling. SEM is widely used in risk assessment applications in construction projects [
18,
19]. SEM can be used in problems with large risk networks by combining statistical data with information on causality [
20,
21]. Therefore, SEM is useful in validating theoretical causal relationships. In a data-rich environment, SEM can be used to provide accurate predictions. However, this critical task of eliciting expert data is a lengthy and tedious process [
22]. SEM models linear relationships. If the causal relationships are non-linear, the model predictions can be poor, as the variance cannot be accurately explained then. Hence, the SEM approach had limitations in providing decision support under such conditions [
20].
2.6. Analytical Network Process (ANP)
An analytical network process (ANP) is a generalization of an AHP, where a net model is constructed instead of a hierarchy. Data collected from experts using a pairwise comparison are used to develop a super matrix representing the interdependencies among variables [
23]. Developing a super matrix can be challenging, as obtaining pairwise comparisons from experts for all variables can take a long time, especially when dealing with a large number of variables and decision criteria in the risk network [
10,
22]. Another limitation in both SEM and ANP methods in building comprehensive risk assessment systems is their inability to cater for updating the risk levels with the presence of new data [
22].
2.7. Bayesian Belief Network (BBN)
A BBN is a probabilistic model based on probabilistic causation based on Bayes’ theorem. It consists of a set of interconnected nodes, where each node represents a variable or a risk of interest and the arcs connecting the nodes represent the causal relationships between these variables. It has two components: the qualitative component directed acyclic graph (DAG), describing the causal relationship of the variables, and the conditional probability tables (CPTs) for each child node, quantifying the strength of those dependencies. The underlying concept of BBNs is to compute the probabilities corresponding to the network nodes and produce the CPT for each child node [
22]. It can be considered a factorization of a joint probability distribution, from which the BBN is used to analyse any probabilistic question regarding the modelled variables [
24].
The BBN stands out as an especially relevant method for reliability-based decision support in building basement systems among the different predictive analytic models addressed. While each of the aforementioned models has qualities of its own, a BBN has certain features that make it particularly well-suited for resolving the difficulties presented by intricate building systems and risk-informed decision-making.
A BBN is naturally suited for situations where causal links among variables are important since it excels at capturing and modelling probabilistic causation. Given that it is based on the Bayes theorem, it may successfully include both qualitative and quantitative data, offering a strong framework for evaluating risks and their interdependencies. The capacity of a BBN to elegantly tolerate uncertainty is one of its primary strengths. Building systems are fundamentally dynamic and are susceptible to a variety of uncertainties, including changes in design and environmental variables. As a result of its probabilistic approach, a BBN is able to handle uncertainty and unpredictability in a way that an ANN and TOPSIS might uncover challenges. Additionally, a BBN is a useful tool for thorough risk assessment due to its ability to represent complicated causal interactions inside a network structure. A BBN offers a more adaptable and flexible approach than models like the AHP and SEM, which may have difficulties identifying and displaying complex causal relationships. Another key benefit of a BBN is its capacity to update risk assessments with current data. A BBN allows for dynamic changes to risk levels, ensuring that judgements are informed and updated. This is in contrast to SEM and ANPs, which can be constrained in their ability to absorb incurring information.
3. Research Framework
Despite numerous studies on risk-informed decision-making, a significant gap exists in research focused on the risk analysis of basement defects in buildings. Understanding and mitigating the risks associated with basement defects are of paramount importance in the long-term effectiveness, maintainability, and overall life cycle cost of buildings. Therefore, this paper addressed this gap by investigating the research problem: “How to minimize the risk of building basement defects based on their defect probability?”.
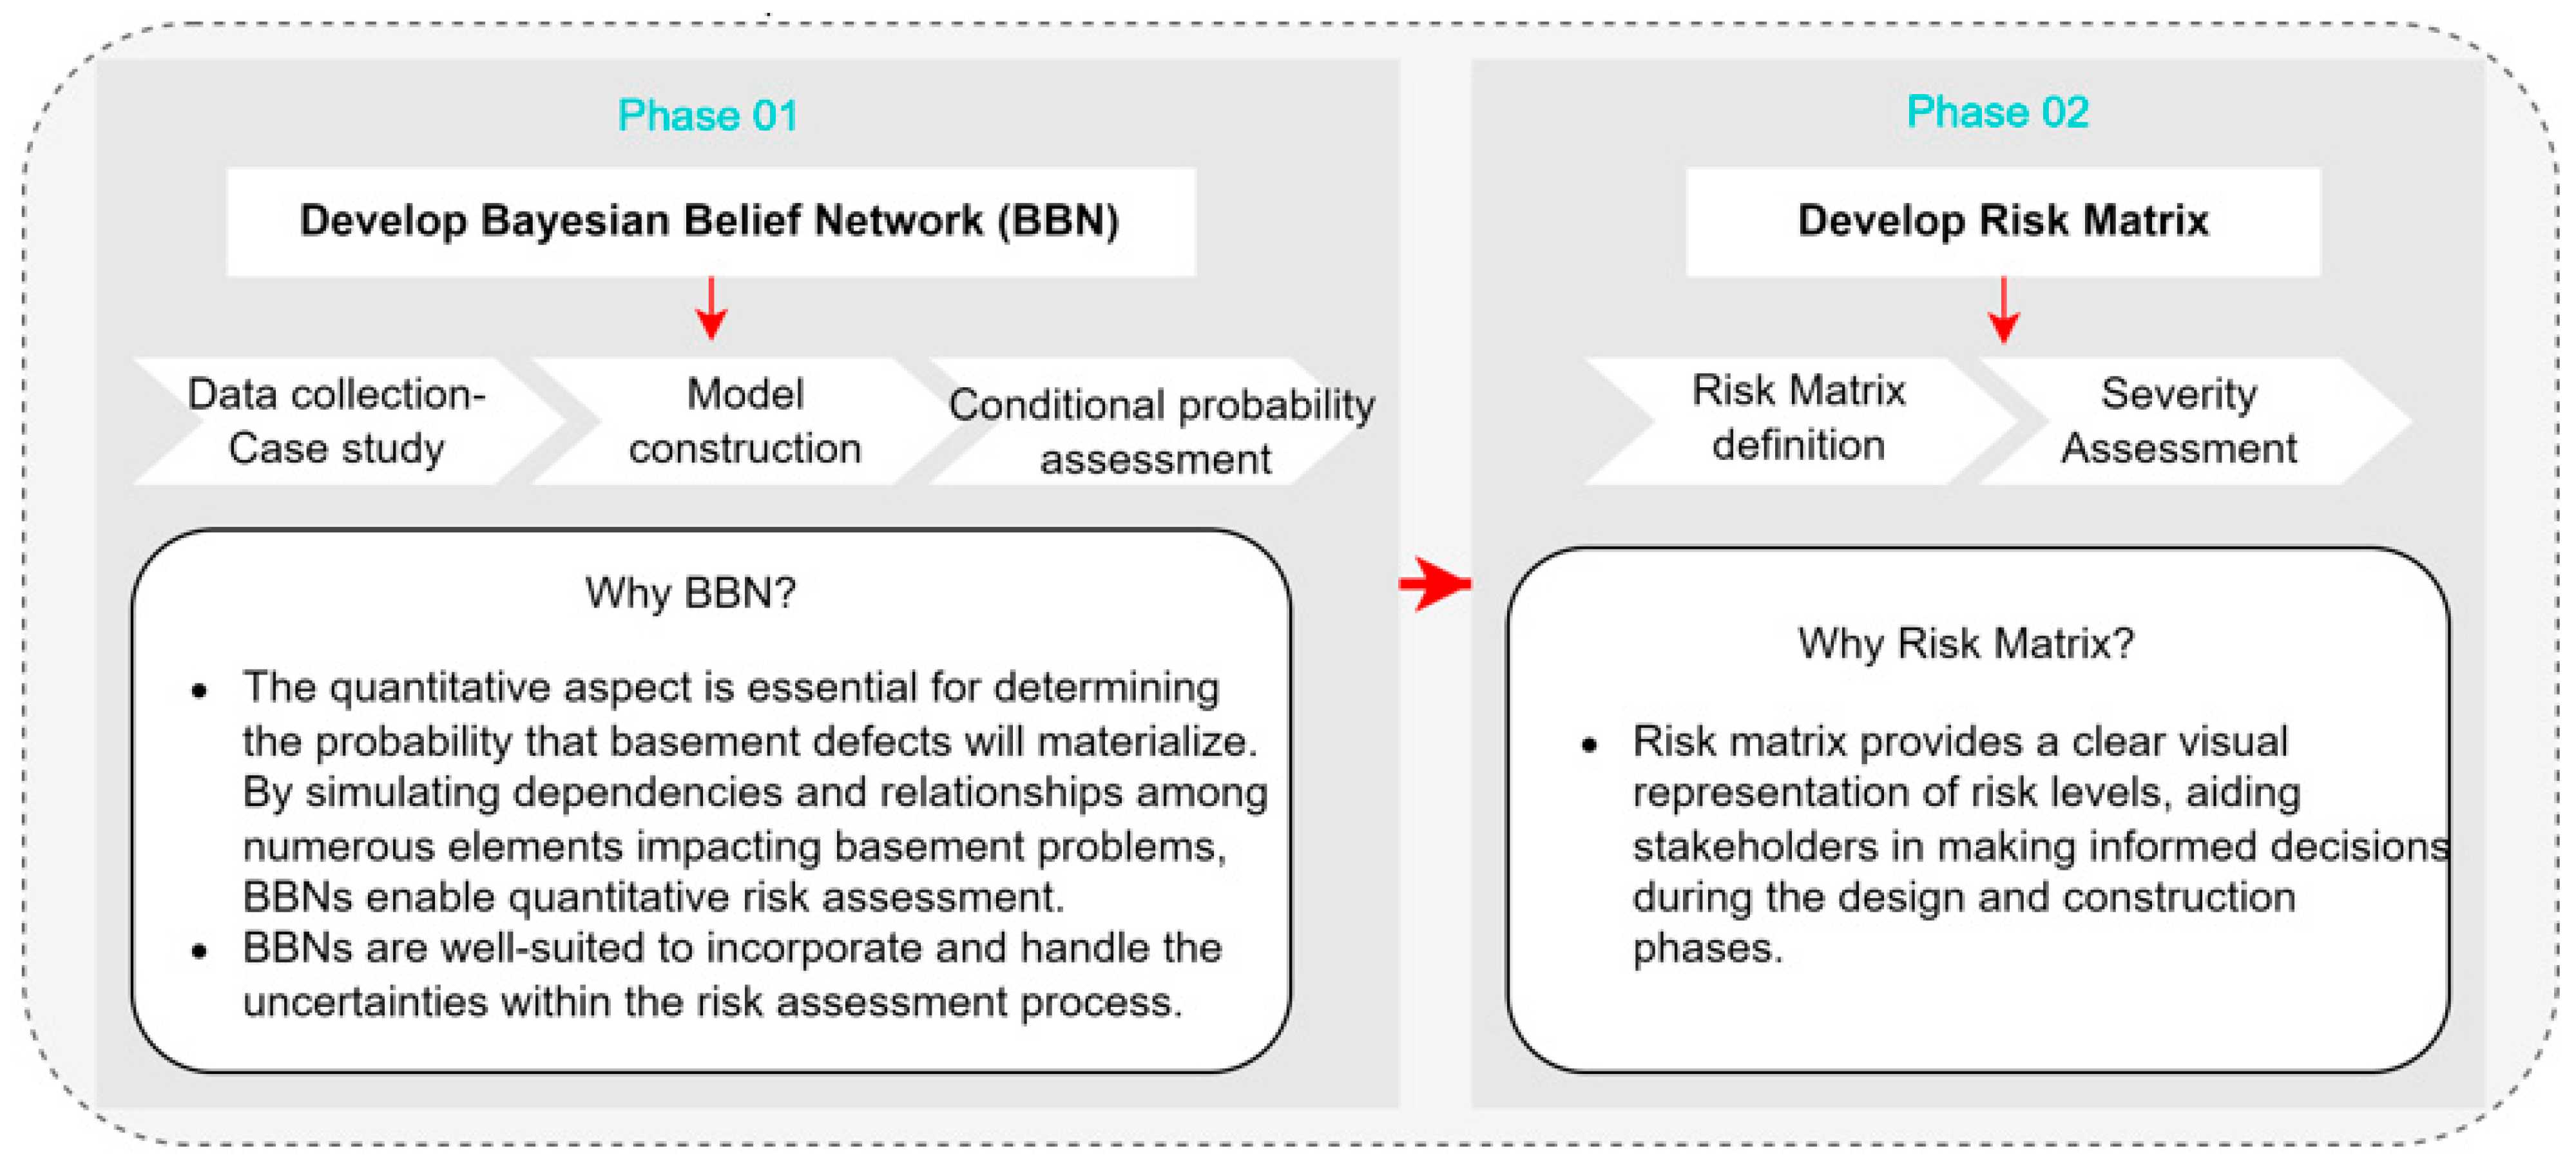
The study sought to quantify the probability of basement defects based on their underlying risk factors; assess the risk levels associated with these defects, considering both their likelihood and severity; and provide a structured framework for risk-informed decision-making in basement systems, emphasizing the importance of reliability and maintainability. As a result, the study employed Bayesian Network and risk matrix methodologies to examine defect probabilities and assess the risk levels associated with building basement defects. The research process involved two key phases, as illustrated in
Figure 1, each serving a distinct but complementary role. These phases were essential for developing a comprehensive risk-informed, reliability-driven model, particularly focusing on evaluating basement defect probability using a BBN.
The two-phased method of BBN development and risk matrix development is critical for creating a strong, risk-informed, reliability-driven model for basement systems, as shown in the above figure. It offers an in-depth assessment of the probability of basement defects while giving stakeholders the insight and tools they need to improve the reliability of the basement system.
Therefore, the novelty of this research stemmed from its holistic approach describing a setup in which a BBN served as a reliability engine while a risk matrix was used as a tool for risk-informed decision-making. Applying existing methods of BBN and risk matrix as a holistic approach for the context of building basement systems added value to this study while addressing practical application effectively.
This study was not limited to risk analysis alone but endeavours to create a comprehensive decision-making system. The integration of Bayesian Belief Networks and a risk matrix empowers stakeholders to navigate complex design alternatives, considering both technical and risk-related factors. Unlike previous studies that primarily focus on risk analysis, this research went beyond creating a practical decision-making framework. It not only quantified risks, but also integrated maintainability as a crucial consideration during the decision-making process, aiming to minimize the lifecycle cost of buildings. This study suggested that this approach can be widely used in the worldwide building sector. The ability to foresee and recognize defects using risk-informed decision support has significant potential for raising the overall quality and efficacy of construction projects worldwide.
4. Case Study: Predicting Building Basement Reliability during Design Stage
To operationalize the research objectives of the current study expert knowledge, historical defect data were used. To begin the risk assessment, five-year (2015–2019) defect data were collected from 95 buildings in Singapore. These data served as the foundation for deriving conditional probabilities, which are essential in building Bayesian networks [
25]. By analysing the defect data and applying counting techniques, probabilities were assigned to different variables, reflecting the likelihood of specific defects occurring.
The proposed risk assessment process using the developed BBN involved the identification of model variables based on factors derived from previous research [
25], involving selecting factors that have a significant impact on building defects. As adopted from previous work [
25], a set of factors were identified based on their relationship strength and prominence (
Figure 2). A set of “core indications”, which significantly affect other variables in the problem space (i.e., independent variable), and a set of “impact factors”, which can only be altered through impacting other criteria (i.e., dependent variable), were used. Accordingly, basement system component durability and reliability outcomes (
Table 2) were elicited based on design for maintainability considerations (
Table 3). Basement systems were selected in this instance stemming from the interest of recent studies [
26] highlighting the importance of developing risk appraisal systems for such building systems.
To validate the results, a suitable and relevant validation approach was taken by way of expert assessments. This validation process involved calculating the predicted probabilities of building defects based on the BBN and comparing them with the actual occurrence of defects. Scenario analysis and axiom-based partial validation were performed to evaluate the robustness of the BBN model. Additionally, expert opinions and feedback were used to assess the accuracy and reliability of the risk assessment results. Six experts were identified using purposive sampling and interviewed for this.
5. Developing BBN
A BBN, the quantitative risk analysis technique, was employed to mathematically model building component failures using design decisions in the current study. BBNs are considered appropriate for this investigation for two key reasons:
Initially, they are extremely excellent in illustrating causal relationships.
Second, this is indeed a probabilistic technique that may better depict the inherent uncertainties associated with risk occurrences, such as faults.
The first step in creating a BBN would be to determine a set of variables that are associated with the problem. That was accomplished in the method explained in the earlier section. The causal links between model variables were determined; then, for every variable, a range of states was defined.
In the model case study, as the first step of this process, common and critical building component defects were identified for basement system components (see
Table 4). Considering an example of the basement waterproofing component, expected common and critical defects and their possible causes were identified and causally linked. Under this component, three common and critical defects were identified, viz. water leakage through joints, water leakage through concrete, and efflorescence.
Next, the basement maintainability benchmarks the designers should comply with were identified using 404 national and international standards, an excerpt from which is shown in
Table 3, where the standards referred to when compiling these benchmarks for building systems and components for the defect “water leakage through joints” are provided. The case study took this approach to causally link each basement defect with the relevant basement maintainability benchmarks to avoid that defect. Variable dependencies between the identified defects and relevant benchmarks were inferred using a similarity query in QSR NVivo software (version 12). The resultant direct relationships are presented in the form of a parent–child relationship between variables, as indicated in
Table 5.
Here, the node identifiers starting with V refer to the variables identified from the basement maintainability benchmarks while D refers to the defects. For example, the independent critical criteria ‘building and construction standard’ is causally linked with the dependent critical criteria ‘reliability’ in this manner. These relationships are graphically represented in what are known as direct acyclic graphs (
Figure 3).
For example, the defect ‘water leakage through joints’ (D121) has three variables affecting it (as provided in the
Table 4), namely V121, V122, and V123. These variables are considered as the parent nodes of the defect D121. Their relationship is graphically illustrated using the variables as nodes in a graph. Similarly, the causal relationships regarding the defects ‘water leakage through concrete’ (D122) and ‘efflorescence’ (D123) were graphically presented. The defect node D122 had three parent nodes (V124, V125, and V126). Further, this defect itself is a parent to the defect D123; as water leakage through concrete leads to subsequent efflorescence occurring on basement floors. Therefore, when considering the parent nodes for D123, they are V126 and D122. Such direct acyclic graphs were drawn for all basement components and the complete BBN for basement systems were developed as shown in
Figure 4.
In the developed BBN, the root nodes are defined to include whether there is zero compliance, moderate compliance, or else full compliance with the basement maintainability benchmarks. This determines whether or not there is a flaw in the target nodes, which represent the defects. Once network topology was established, the conditional probabilities were computed based on case study data gathered from 95 buildings for a five-year period, quantifying the causal dependencies for every node there in the network. This could then enable the displaying of the probability distribution of a child node whenever its parents’ likelihoods were given. The greatest likelihood for every condition of such defect nodes as determined by the Bayesian network is presented for every target node (
Figure 4). The basement system’s entire network topology has twenty-six independent root nodes as well as fourteen dependent target nodes.
6. Validation of the BBN
A scenario analysis was used to test whether the structure of the BBN as well as outcomes behave coherently in fictitious risk scenarios. Various scenario analyses were indeed employed to support the operational validity of said BBN (see
Figure 5 and
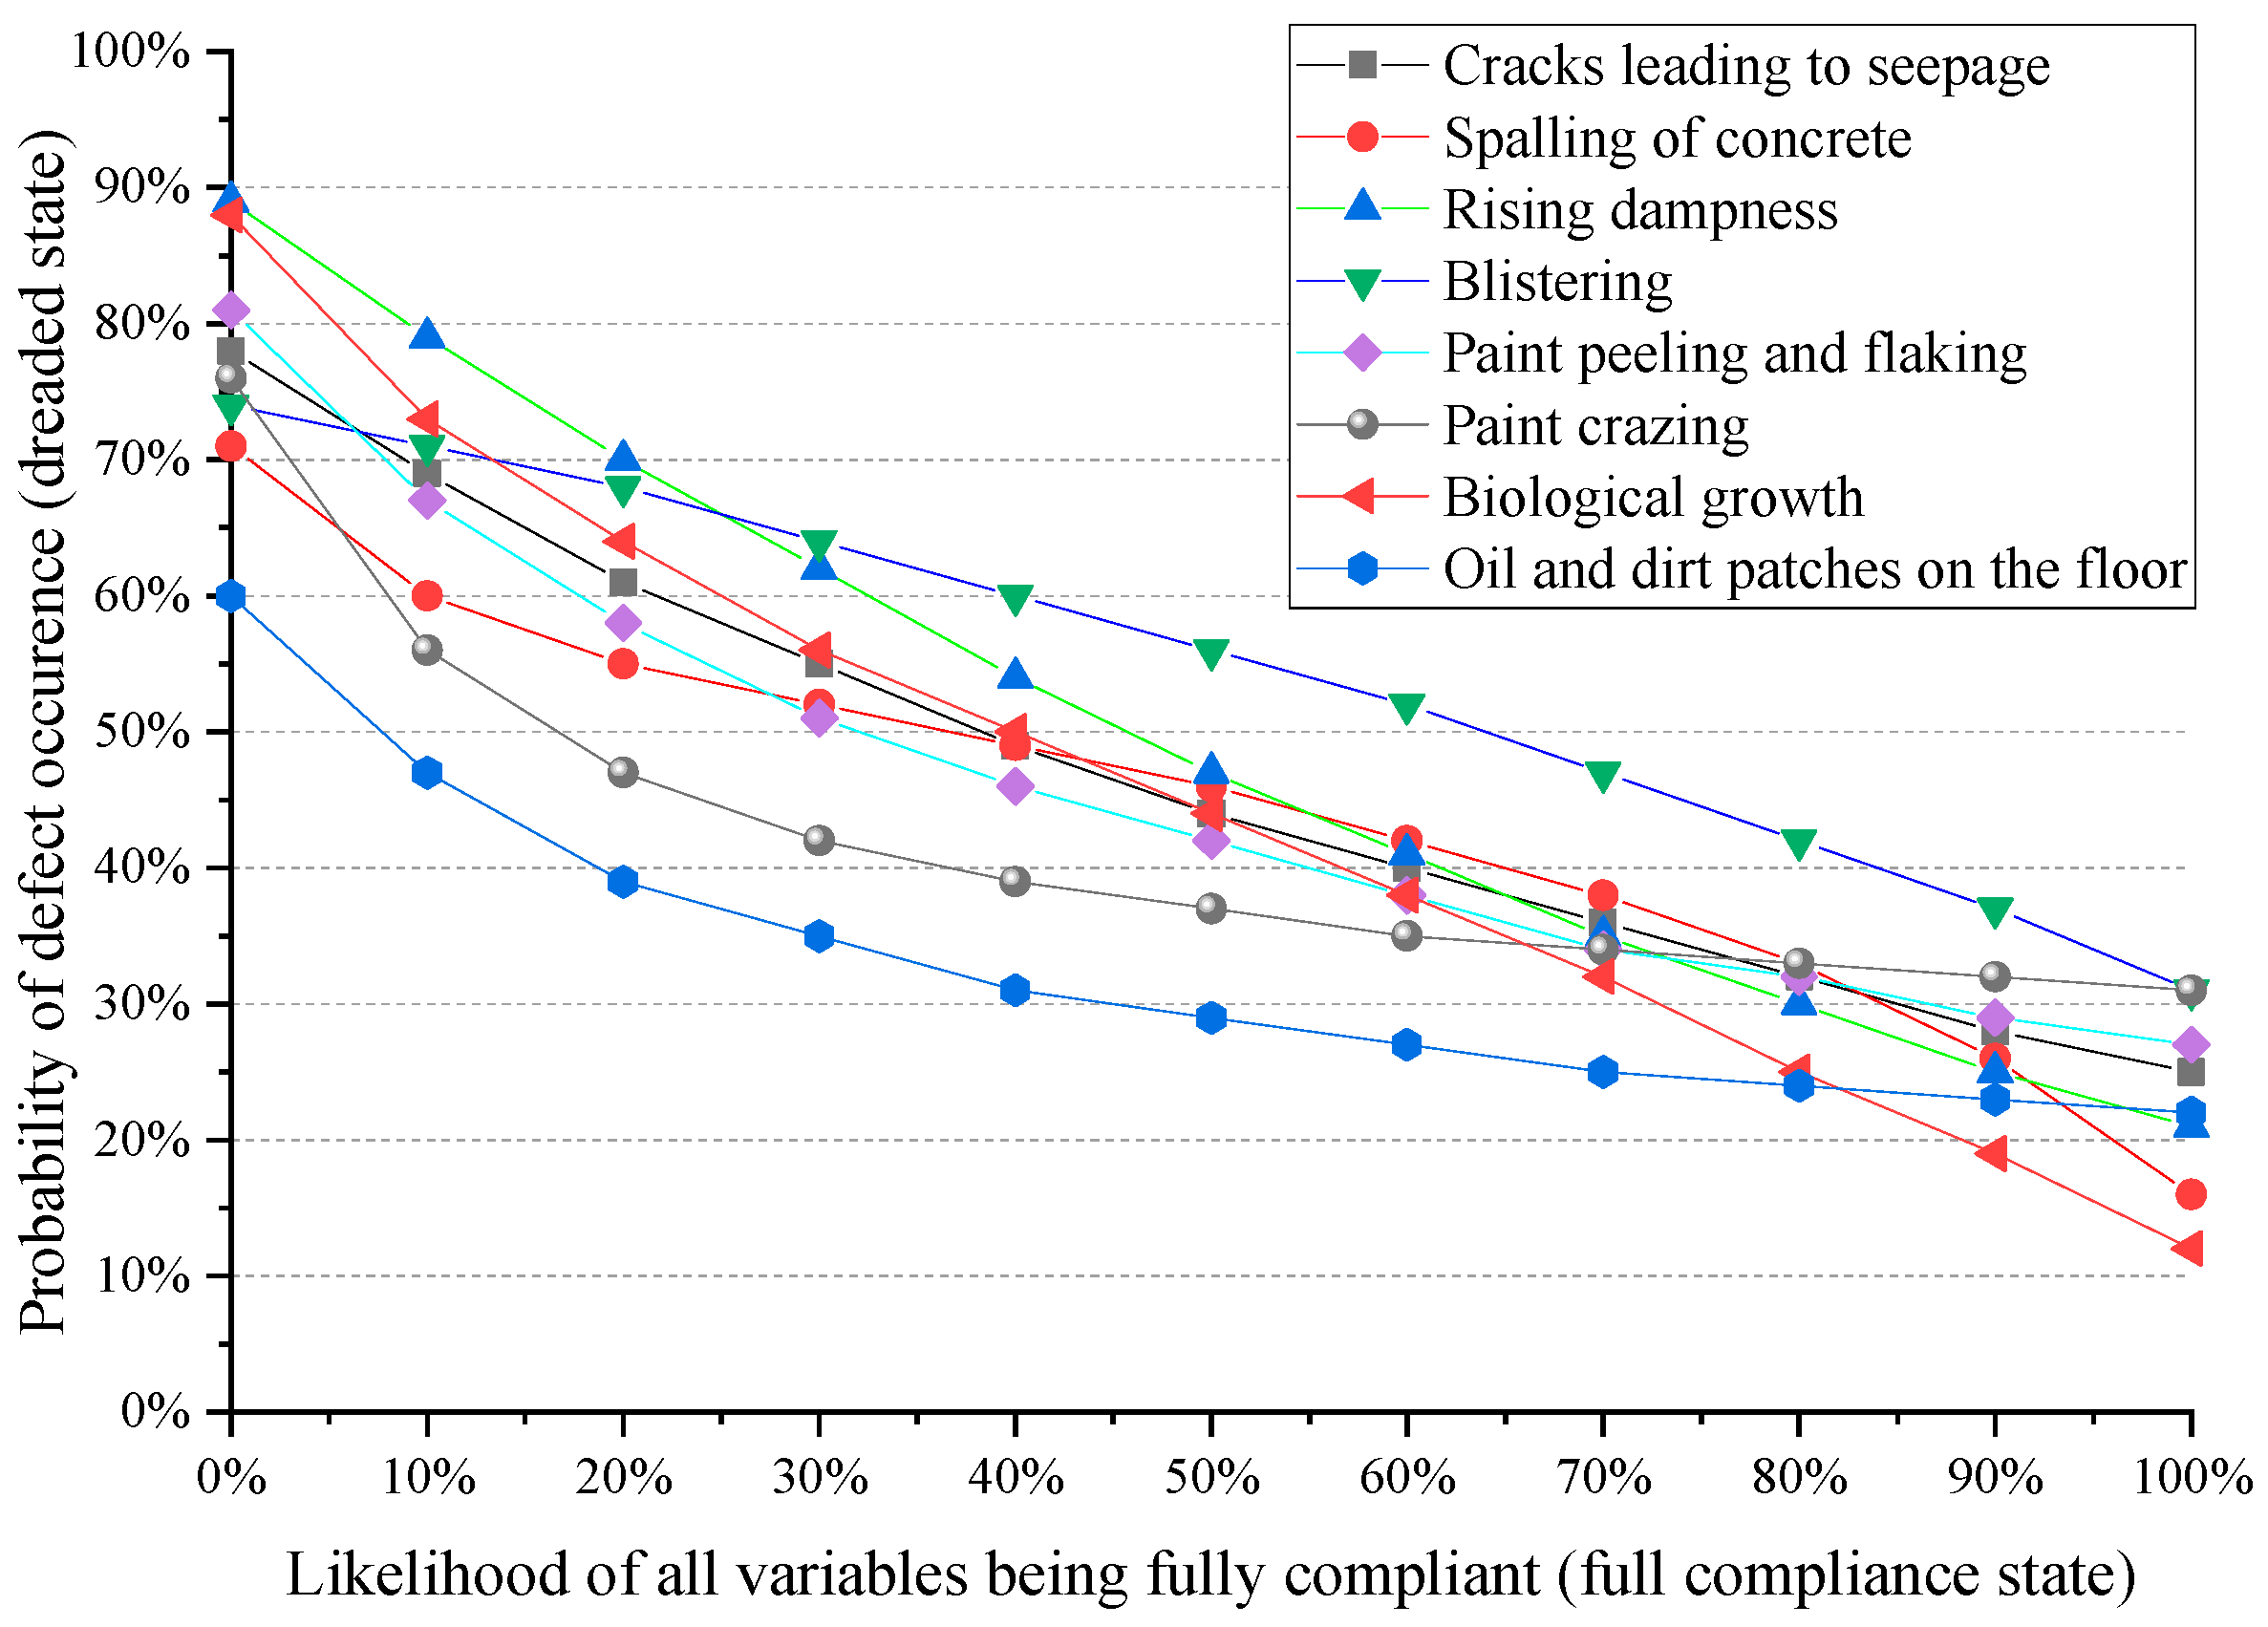
Figure 6). When the probability of each independent node being true is enhanced by 10%, the defect probability distribution gets observed in this situation. The predictive capability of the model is evaluated in both typical and abnormal circumstances by observing the changes there in posterior probabilities. This exercise demonstrates the applicability of the model as well as verifies that the produced models are structurally sound. In this instance, a significant decrease in the possibility of all basement problems occurring can be seen with a rise in the likelihood of complete compliance to basement maintainability criteria (see
Figure 5). In this exercise, the probability of “partial compliance” is deemed to be 0%.
Axiom-based partial validation was used to determine whether each impacting node fulfills the following axioms utilized in [
27]. They are used in the following circumstances: (i) if indeed the prior probability of parent nodes decrease or increase marginally, the associated child node posterior probabilities should also decrease or increase substantially; (ii) the variation in the probability distributions of said parent nodes must have a consistent influence mostly on child nodes; and (iii) the intensity of the entire impact of the mixture of probability fluctuations from m characteristics on values must always be bigger than that resulting from the collection of m-n (n € m) features.
The observed findings from the constructed BBNs meet the 3-axiom-based partial validation method’s parameters. For instance, the chance of the child node not having a defect increases when the corresponding parent node’s probability of the condition ‘full compliance’ is increased. This suggests that the likelihood of the child node posterior has increased. Furthermore, for a range of parent node probability distributions, the size of the impact on child node results was consistent. Whenever the parent nodes’ values are altered, the same outcomes are seen for every other target node. Every parent node ultimately meets the axioms like a result of the expanding process, offering a partial validation of the produced model.
In order to connect the suggested BBN to a risk matrix, it is necessary to combine the advantages of probabilistic and qualitative risk assessment methods. The BBN calculates the probability of various outcomes while representing the interdependencies between distinct risk variables. The risk matrix, on the other hand, provides a systematic visualization of risks based on levels of likelihood and consequence. A thorough risk assessment is produced by mapping BBN probabilities to probability levels and BBN outcomes to consequence levels in the risk matrix. By combining the probabilistic analysis of the BBN with the risk matrix to classify risks according to their severity, this integrated method enables a deeper understanding of risks. The integrated risk evaluation enables us to prioritize high-risk events indicated by the BBN and conduct focused mitigation actions. It also allows for informed decision-making and risk management methods. As a result, the connection between the suggested BBN and risk matrix improves the capacity to recognize, evaluate, and effectively manage risks, resulting in better overall risk management results.
7. Risk Assessment
Based on the proposed BBNs, a BBN-based risk assessment model for critical basement waterproofing defects is developed. As shown in
Table 4, four basement components were selected to develop the model. Accordingly, ISO 31000:2012 Risk management guidelines and principles are adopted for this study. Further, the standard’s guidelines state that risk assessments are divided into three phases that follow one another. These phases are as follows:
Risk identification;
Risk analysis;
Risk evaluation.
Since the risks are identified by conducting a case study and analysed prior using the BBN, only the risk evaluation is carried out in this section with the help of a risk matrix. The purpose of using a risk matrix is to accurately assess the risk level as well as carry out actions targeted at mitigating it.
Risk Matrix
A risk matrix is a structured approach that identifies which risks are more critical to a program and provides a methodology to assess the potential impacts of the risk or set of risks across the life of a program [
22]. Once a risk is identified, the subsequent steps in a risk matrix are to assess its potential program impacts, hypothesize the probability the risk will occur, rate the risk according to the predetermined scale, and document an action plan to manage/mitigate the risk. In addition, setting point values for all ranges of probability values as well as the consequences of defects is necessary for risk appraisal using a risk matrix. Four intervals were proposed to define the consequences of the defects, which were connected to the defects that lead to a prolonged implementation time, whereas five intervals were proposed to define the probability of defects, correlating to the anticipated probability levels.
Table 6 indicates the ranges of probability and consequences of the defects. Risk evaluation involves an estimate of the occurrence or probability of each risk. Accordingly, the proposed risk analysis includes a likelihood relative scale from “rare” to “almost certain”, whereas the impact of the risk is ranged from minor to catastrophic.
Further, the risk management criteria, which is developed for each risk level to indicate the acceptability of the risk, extent of risk management, or mitigation required, is shown in
Table 6, whereas the likelihood relative scales (from rare to almost certain) and risk management action and the description of further action based on the risk ratings are shown in
Table 7 and
Table 8, respectively.
The inclusion of anticipated risk criteria and, thus, the matrix’s impacts is necessary for a risk assessment. A point value as well as colour were also used to further define particular matrix cells, as shown in
Table 9. Furthermore, to enhance the practical utility of the proposed methodology in real-world decision-making processes, discrete values were incorporated to a likelihood severity classification (refer
Table 10). The results of risk assessments can be presented in an approachable way using discrete values. The daunting task of selecting appropriate risk mitigation strategies and actions often faces decision-makers. Discrete values streamline this decision-making process by allowing for decision-makers to focus on specific risk categories. The decision-making process is sped up by this simplicity, which also helps in allocating resources and focusing attention on the risks that are most important.
In addition, the interpretation of the risk rating in respect to the qualitative score is provided in
Table 11.
Subsequently, each of the identified risks is evaluated based on the rating value given by multiplying the likelihood and impact value. The analysis based on the multiplication values is depicted in
Table 12.
8. Discussion
According to the risk evaluation, it is evident that efflorescence (joints and floor), which is identified as a waterproofing issue, and paint peeling and flacking, paint crazing, oil and dirt patches on the floor, which are identified as issues in finishes, are recognized as a low risk. Hence, the implementation of countermeasures may be taken into consideration. Regardless of the fact that the risks are low, it remains essential to make the necessary steps to avoid any possible worsening or aggravation of these issues over the course of time. The attempts to minimize efflorescence must be primarily focused on moisture management. According to findings from the literature, the control of water flow into and out of a concrete floor is the simplest and most affordable method of controlling efflorescence. The longer the deposits continue to stay on the surface, the more difficult it will be to remove them; thus, it is preferable to clean the surface immediately or as soon as possible. Moreover, facilitating draining around the basement, applying water-resistant sealing compounds, and using materials that repel water are some of the other strategies to increase the basement’s water permeability. Further, taking off all loose and peeling paint before sanding the surface and feathering the edges with a scraper or wire brush will help to remove the paint peeling and flacking from the painted surfaces. However, filler could be required if flaking affects multiple painted layers. Moreover, utilizing primer as well as topcoat of a finest quality should stop the recurrence of this defect. The paint crazing is identified as another low risk. Placing a barrier coat between older, shining paint as well as the newer matte emulsion will stop this from happening and developing further. Apart from this, the oil and dirt patches on the floor are also identified as a low risk, which can be prevented by avoiding the use of alkyd-based paint on the concrete surface.
Subsequently, nine defects, which include basement flooding, water ponding, water leakage at service penetrations, water leakage through concrete, water leakage through joints, blistering, biological growth, rising dampness, and spalling of concrete, were identified as moderate risks. Sealing the cracks in the floor and foundations will help to minimize basement flooding. Additionally, as a preventative step, gutters and downspouts should be kept clean of debris to facilitate adequate water drainage. Downspout extensions can be used to extend downspouts away from the foundation. Further, adding more insulation underneath will help to minimize the issue of water ponding. The injection of high-pressure polyurethane will aid in stopping the water leakage at service penetrations. This procedure makes a solid bond with the concrete and a waterproof seal, helping to safeguard the concrete structure and prolong the building’s useful life. Further installation of retrofitting flashing and collars around existing service penetrations helps to reroute water away from points of risk and reduce water infiltration. The water leakage through concrete and joints can be minimized with the help of either a membrane put to the exterior of the foundation or the injection of epoxy resin can seal the joint. The blistering on the painting surfaces can be removed by improving the pretreatment system so that the solvents it uses can effectively remove rust, oil, and grease residues. Further, the biological growth can be minimized or avoided by applying fungi-resistant paint and by maintaining the moisture content of the surface below 6%. Additionally, it is advisable to get rid of any organic items that might act as a food source for mould and other living things. In addition, rising dampness on concrete can be minimized by placing a remedial DPC. Furthermore, injectable damp proofing procedures, which entail injecting a chemical that blocks water thru concrete to produce a waterproof barrier, are recommended. This approach prevents moisture from creeping up via the concrete’s interior capillaries. Concrete can typically receive a surface treatment if the spalling depth is less than one-third of the thickness of the concrete. Subsequently, steel bars will need to be added, though a full depth repair may be necessary for damages that extend beyond one-third of the thickness of the concrete.
Since the cracks causing seepage have been recognized as a high-risk concern, it suggests that there is a substantial possibility of water seepage via these fissures, with potentially catastrophic effects. Under such circumstances, quick responses are required to take remedies to resolve the issue as soon as possible. Holding off on the reaction may cause more water damage, jeopardize the structural integrity of the basement, and necessitate more significant and costly repairs. This can be minimized by providing proper vibration to concrete.
As a result, expert waterproofing services are critical for determining the actual danger and recommending the most effective and reliable remedies. Waterproofing professionals can offer customized solutions based on the particular requirements of the basement. Furthermore, after adopting the remedies, it is recommended that the general condition of the basement be routinely monitored. This ensures that the countermeasures are productive and that any fresh indicators of basement water seepage are treated as soon as possible.
Figure 7 illustrates the visual representation of the proposed risk-informed decision-making process developed using the above findings.
The process combines BBN modelling with the usage of a risk matrix to produce a strong decision support system that equips stakeholders to make wise decisions regarding basement designs and construction. The aforementioned support system’s key component is the development of a BBN. The study develops a BBN to represent the intricate relationship of design choices and their possible influence on the likelihood of known risks that exist, such as basement defects. With this approach, the risk can be quantitatively assessed, which is essential for making sound decisions. As a benefit for stakeholders basing their decisions on it, it offers a systematic and data-driven foundation. The study further provides a risk matrix as a further tool to aid in making decisions based on details regarding risks. The risk matrix provides a structured framework for determining the severity of found defects, with a predetermined likelihood and severity levels. By categorizing risks, this matrix improves stakeholder comprehension. It permits the depiction of risk levels, streamlining the dissemination of complicated risk information to many parties involved in building basement projects.
The outcomes of this process have several facets and offer significant advantages to stakeholders. Stakeholders are better equipped to make informed design and construction decisions as a result of the quantitative assessment of the likelihood of identified defects and their corresponding severity levels. It ensures that potential risks are considered while making decisions. Stakeholders have a thorough grasp of the potential risks connected to certain design decisions. This knowledge is essential for proactive risk management and the avoidance of defects that could have serious negative effects on operations and finances. The research approach delivers a comprehensive overview of possible defects and their underlying causes. Unlike contemporary studies, it uses a BBN to not only identify the likelihoods of these problems, but also to analyse and link their causes. This in-depth understanding of the root causes enables engineers to address issues at their source, resulting in more effective and long-term solutions. The procedure not only pinpoints risks, but also offers suggestions for potential countermeasures. Stakeholders can reduce the frequency and severity of faults by taking proactive measures early in the design phase to identify and mitigate risks. This approach offers a strong emphasis on the need for maintainability in basement designs. Making decisions with maintainability in mind encourages the development of structures that are more long-lasting and economical throughout their lifespan. Facilities engineering and management teams are better able to estimate maintenance requirements because of the combination of the BBN and the risk matrix. Maintenance tasks can be precisely scheduled to minimize unplanned downtime and operational disturbances by evaluating the likelihood of errors and their possible impact on operations. It provides facility managers with a tool to keep compliance with changing regulatory standards and norms. Basement systems can meet or exceed regulatory requirements by continuously monitoring and resolving defects, lowering legal and financial risks.
It is envisioned that this approach promotes communication through a common ground of risk-informed, reliability-driven decision making. This has implications towards interdisciplinary collaboration among various stakeholders involved in construction projects. Architects, engineers, contractors, and risk assessors can work more cohesively by utilizing a common risk-informed decision support framework.
Limitations of the proposed risk-informed decision support system can be categorized into three areas, which need to be recognized such that they can be improved in further research. First, the BBN and risk matrix’s accuracy and efficacy are reliant on the availability and quality of historical data as well as professional opinions. Incomplete or biased data can skew the results; however, during its validation, this was not observed. Second, due to the complexity of building and using BBNs, which requires specialist knowledge in probabilistic modelling, its accessibility to a wider audience might be constrained by its intricacy. This can be improved by maintaining the analytical engine behind an easy-to-use user interface. Third, due to the scope considered under the current study, for other building systems and components, the procedure used herein may need to be modified. As the current models are primarily intended for basement defects.
9. Conclusions
A novel approach is adopted in this study in predicting future operational defects based on the initial design alternatives to anchor the quantitative risk analysis technique using Bayesian networks. The Bayesian networks are developed to identify the probability of the identified defects (risk), and the risk matrix helps to evaluate the defects and their severity. Finally, the risk-informed, reliability-driven decision support system for building basements combines the power of BBNs and risk matrices to provide a structured, data-driven approach to risk assessment and decision support. The proposed BNN-based risk assessment matrix demonstrated its contribution to basement risk prediction and assessment. Further, the diagnostic analysis can also be used as a tool to identify mitigation measures. It may be useful to extend the application scope of the BNN to cover additional building elements and to use the BNN for overall risk diagnoses to enhance the lifetime of building components. This approach provides a comprehensive understanding of basement defects and their root causes, enabling engineers to address issues at their source for more effective, long-term solutions. Further, this empowers facility engineering and management teams to predict maintenance needs accurately, minimizing unplanned downtime and operational disruptions. This approach informs a reliability-based, risk-informed framework for architects, engineers, contractors, and facility managers to enhance project efficiency and communication.
The approach presented in this study can be extended to various areas within the construction industry. The application of this approach can be expanded, adapting the framework for assessing risks and defects in other building elements beyond basements. Combining the BBN and risk matrix with building information modelling (BIM) technology to enhance the real-time risk assessment during the design and construction phases is another extended area of this study.


