Article

Effect of Load Eccentricity on CRC Structures with Different Slenderness Ratios Subjected to Axial Compression

Institute of Concrete Structures, TUD Dresden University of Technology, 01062 Dresden, Germany
*
Author to whom correspondence should be addressed.
Buildings 2023, 13(10), 2489; https://doi.org/10.3390/buildings13102489
Submission received: 3 September 2023 / Revised: 20 September 2023 / Accepted: 25 September 2023 / Published: 30 September 2023
(This article belongs to the Special Issue Research on the Performance of Non-metallic Reinforced Concrete)

Abstract

:
The use of nonmetallic reinforcement in concrete aims at the decrease in material consumption by reducing the component sizes when compared to conventional reinforced concrete structures, which inherently results in very filigree structures. Although intensive basic research has been carried out on textile-reinforced concrete for about 30 years, the subject of stability behavior has hardly been investigated so far. This study focuses the fundamental understanding of the structural behavior of slender carbon-reinforced concrete (CRC) structures subjected to axial compression. Therefore, buckling experiments have been carried out in order to quantify the influence of two parameters: the slenderness ratio of the specimens (varying between 60 and 130) and the load eccentricity (0, 2, and 4 mm). The results of the specimens that were tested with the initial load eccentricities revealed a good overall agreement with those obtained by a second-order theory approach throughout all of the investigated slenderness ratios. For the centrally pressed samples that featured high slenderness ratios, the failure stresses could successfully be predicted with Euler’s buckling formula, whereas this theory overestimated the results of the specimens with intermediate to low slenderness ratios due to the plastic buckling phenomenon. The presented study emphasizes that the consideration of the stability problem is inevitable when designing material-efficient structures made of textile-reinforced concrete.

1. Introduction

1.1. Motivation

The construction sector is responsible for 40% of worldwide material consumption [1], and the demand for building materials continuous to grow drastically. While the availability of raw materials on our planet becomes increasingly scarce, the awareness of a conscious handling of our remaining resources is more important than ever before. As the most common material used for building worldwide [2] and being thus indispensable for modern construction, concrete opens up the potential to have a major positive impact if used in a more sustainable way.
The use of nonmetallic reinforcement enables a reduction in material consumption, since typical thick concrete covers—which are required in conventional concrete structures due to the susceptibility of the steel reinforcement to corrosion—can be omitted [3]. The combination of nonmetallic reinforcement and concrete results in a high-performance composite material that allows for force-flow-oriented, resource-efficient designs with a concurrently increased service life of the structures [4,5,6,7]. Since nonmetallic reinforcement does not require an alkalinity, as is the case for steel reinforcement, novel binders can be used for the concrete. By using alkali-activated binders and/or binders with a reduced amount of Portland clinker, the CO2 footprint of the concrete structures can be reduced substantially [8,9]. Another approach that finally enables the realization of very slender and lightweight constructions with large material and CO 2 savings is chemical prestressing [10].
However, in order to use the full capacity of the composite material and, at the same time, meet the serviceability requirements for filigree structures, it is necessary to strive for material-appropriate designs that ensure high material utilization while maintaining low deformations [11]. Current research within the collaborative research center/transregio CRC/TRR280 “Design strategies for material-minimized carbon-reinforced concrete structures” [12] is aiming at exploiting the load-bearing principles of thin-walled components with cross-sections that are internally dissolved, e.g., by shell-shaped or folded structures [13,14]. The demand for high stiffness with minimal material consumption leads to structures that transfer loads predominantly through pairs of normal forces rather than out-of-plane bending. Since membrane stresses are efficient for one particular load case, structures need to be found that enable many possible load transfer paths based on normal force. While the high performance of nonmetallic reinforcement allows for an efficient load transfer of tensile normal force, compressive loads must be transferred by concrete.
Previous research on the fundamental behavior of fine-grained concretes for textile-reinforced composites subjected to compressive stress is mostly limited to the experimental investigation of the parameters affecting the material strength [15,16,17,18]. However, the significantly thinner cross-sections result in increased slenderness ratios in components of nonmetallically reinforced concrete structures. Since members under compressive loads may collapse prematurely due to large lateral deflections caused by the loss of equilibrium—before the compressive strength is reached [19]—the stability failure needs to be considered.

1.2. Slender Structures Subjected to Compressive Stresses

In civil engineering, it is generally permissible to calculate internal forces from equilibrium conditions on the undeformed system according to the theory of elasticity (first-order theory) [20]. The simplified assumption is that the occurring deformations are negligible compared to the lever arms of the loads or support forces and that the material behaves in a linear elastic manner, i.e., Hooke’s law can be applied. This law states that stresses and strains are always proportional to the applied load. However, these simplifications become inadmissible for slender structures subjected to compression, as the induced stresses and strains are at risk of increasing much faster than the loads due to second-order theory effects [19]. The typical failure manifests itself as lateral bending with large deformations and is referred to as flexuralbuckling, i.e., [21,22]. It usually occurs abruptly and at a stress level below the actual compressive strength of the cross-section.
In 1744, Leonhard Euler—who is considered the founder of the classical stability theory—presented the first analytical description of the linear elastic buckling problem for columns, which made it possible to determine the critical load F c r above which the equilibrium changes from a stable to an unstable state [23]. It depends on the buckling length l 0 (the distance between the two inflection points of the bending line), the decisive moment of inertia I of the cross-section, and the modulus of elasticity E of the utilized material. For a column with hinged ends, where l 0 corresponds to the actual column length L, the equation is given by the following:
F c r = π 2 L 2 · E I .
Instead of the critical load, it is also common to indicate the critical buckling stress by dividing Equation (1) by the cross-sectional area A:
σ c r = π 2 L 2 · I A · E = π 2 λ 2 · E .
All of the geometric values are summarized by the dimensionless parameter λ 
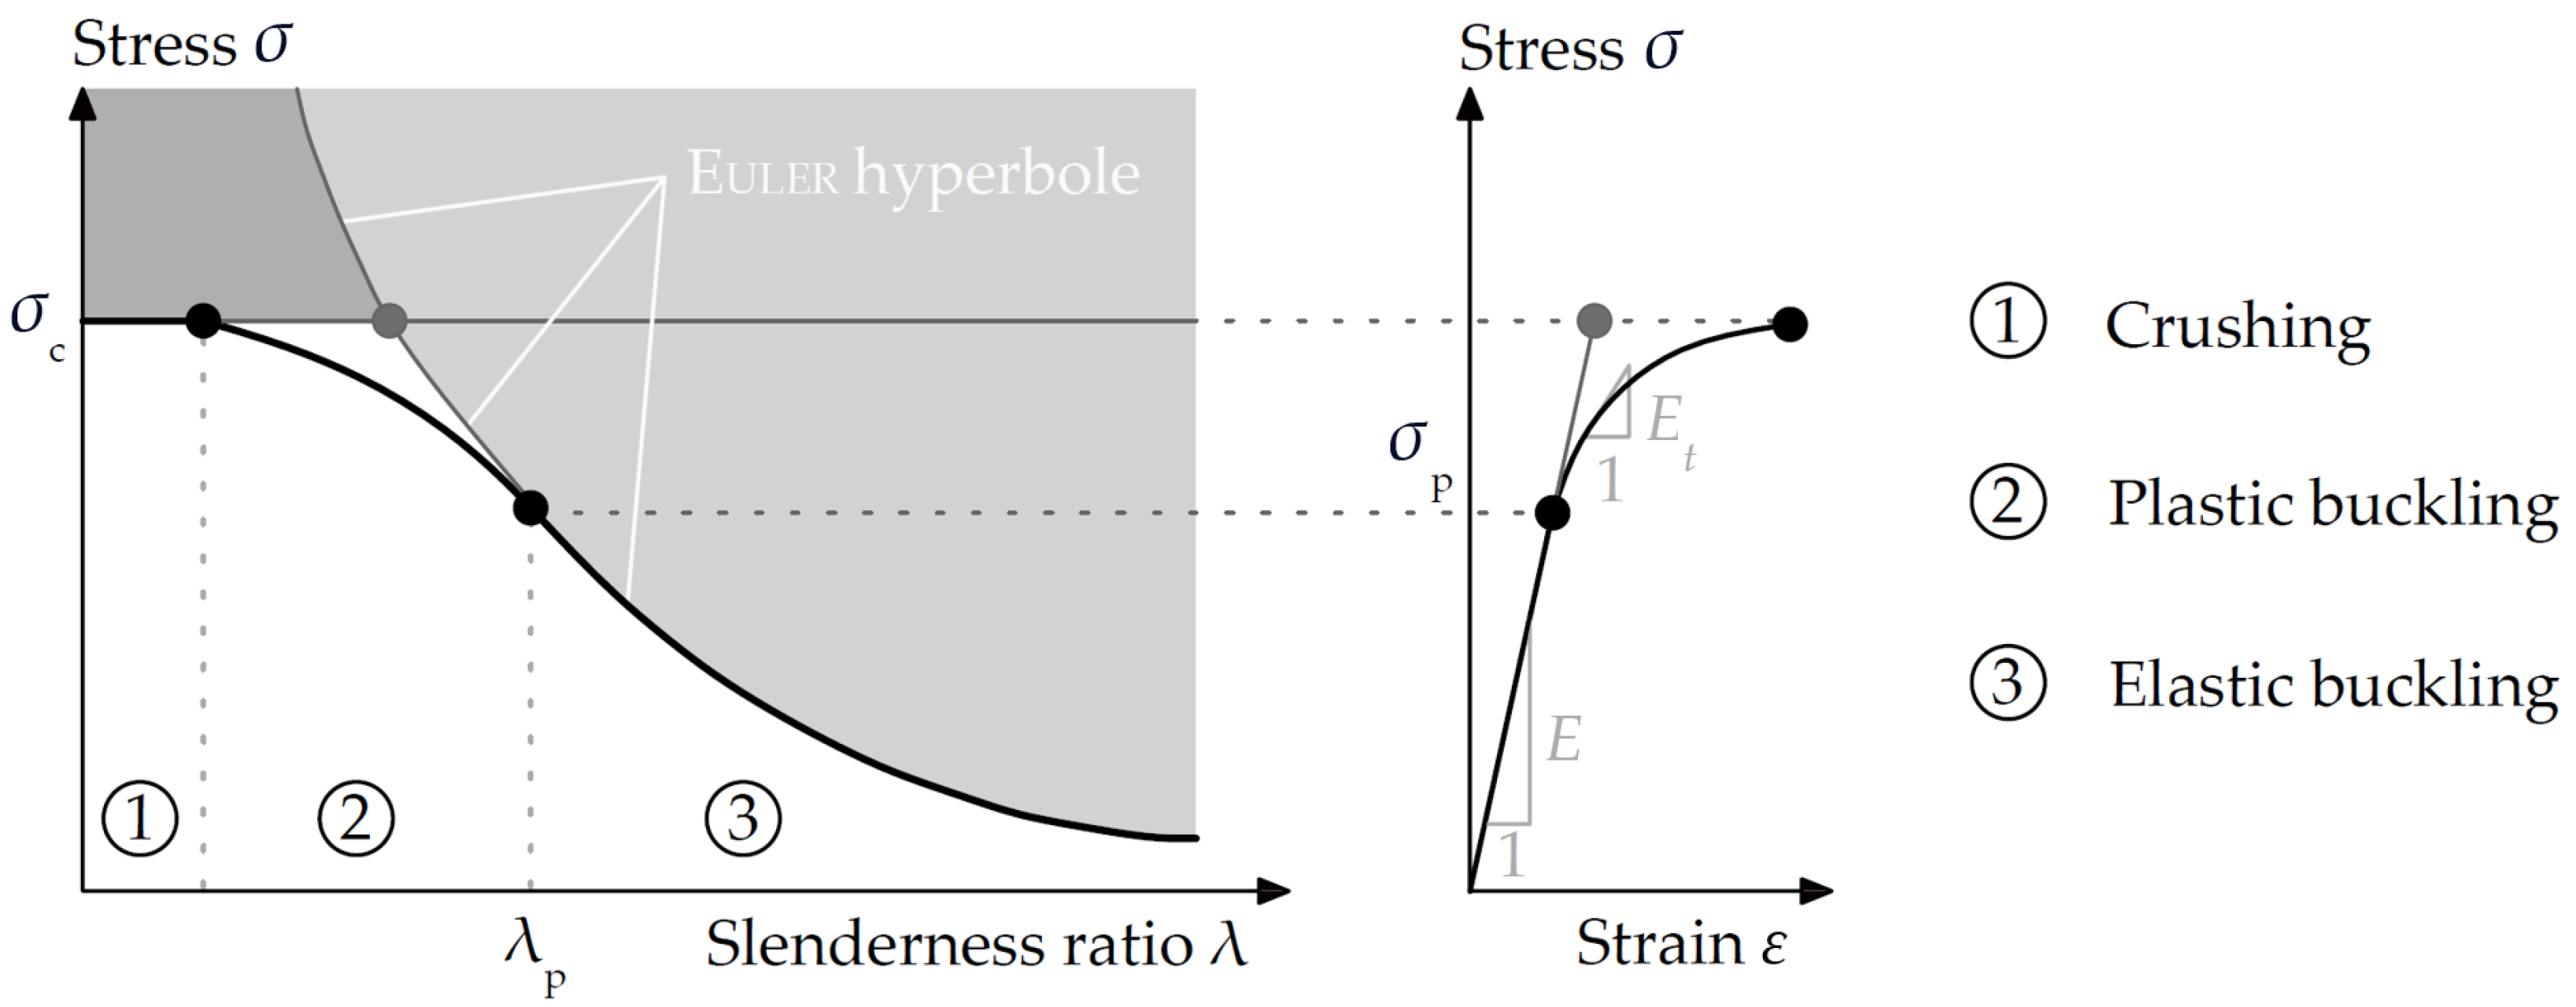
, which is also referred to as the slenderness ratio. The failure boundary line resulting from the buckling stress formulation can be plotted in a σ λ diagram, together with the material failure limit ( σ c ), as shown in 
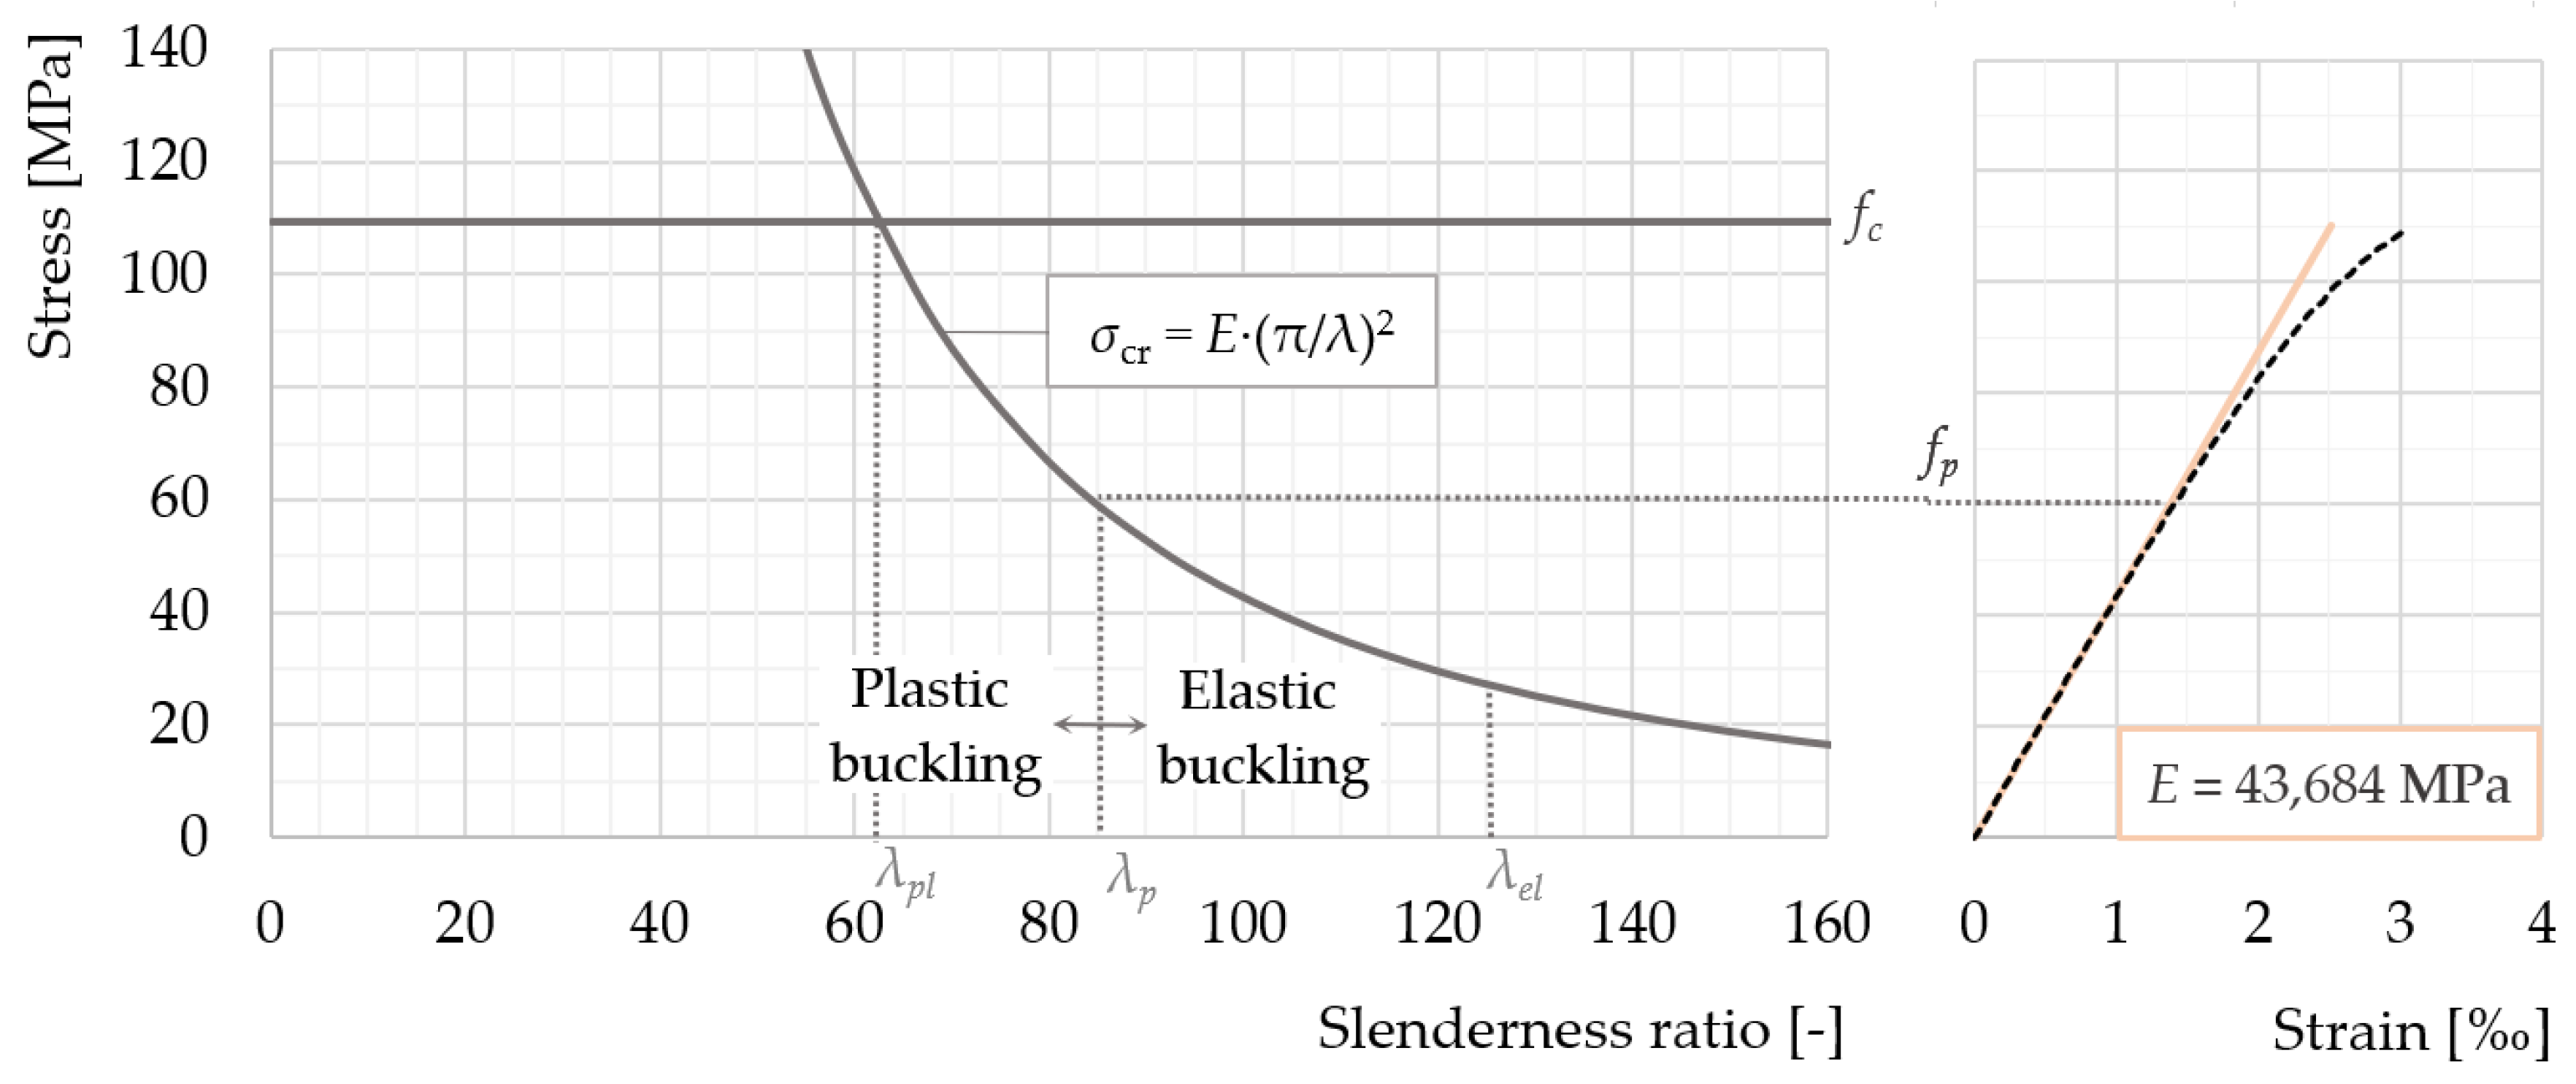
Figure 1. The point where both lines intersect illustrates the slenderness ratio at which the buckling failure theoretically becomes critical compared to the material failure under ideal conditions. With regard to the material properties, it is important to note that the stability failure exclusively depends on the modulus of elasticity of the material, whereas the compressive strength determines the material failure.
Since the actual material behavior is not taken into account in Euler’s buckling equation, the sudden transition from the material to stability failure can exclusively occur for columns made of linear elastic material. Concrete exhibits an approximate linear elastic behavior only at lower stress levels, thereby changing into nonlinear behavior with increasing stresses, which is when Equation (2) can no longer be applied. Depending on the proportionality limit σ p of the material, the corresponding threshold value for the slenderness ratio can be determined with Equation (3):
λ p = π · E σ p .
For values below λ p within the range of medium slenderness ratios (② in Figure 1), the failure mechanism is referred to as plastic buckling. Many column buckling theories have been proposed for this phenomenon by various researchers since the end of the nineteenth century [24]. The approach found in most of the current literature sources is based on the Engesser–Shanley theory: If the elastically determined critical buckling stress (Equation (2)) is greater than the proportional limit of the material, the stresses run according to the curved stress–strain ( σ ϵ ) line with a correspondingly reduced material stiffness so that the Young’s modulus E is replaced by the smaller tangent modulus E t = d σ / d ϵ . Since E t depends on the unknown critical buckling stress, the equation usually has to be solved iteratively.
For the range of small slenderness ratios (① in Figure 1), failure under uniaxial compressive loading occurs by crushing when the compressive strength σ c is reached.
Figure 1. Effects of nonlinear material behavior on the σ λ diagram; graphic adapted from [25].
Buildings 13 02489 g001
Considering the range of high slenderness ratios (③ in Figure 1) in a mathematical sense, the critical Euler load (Equation (
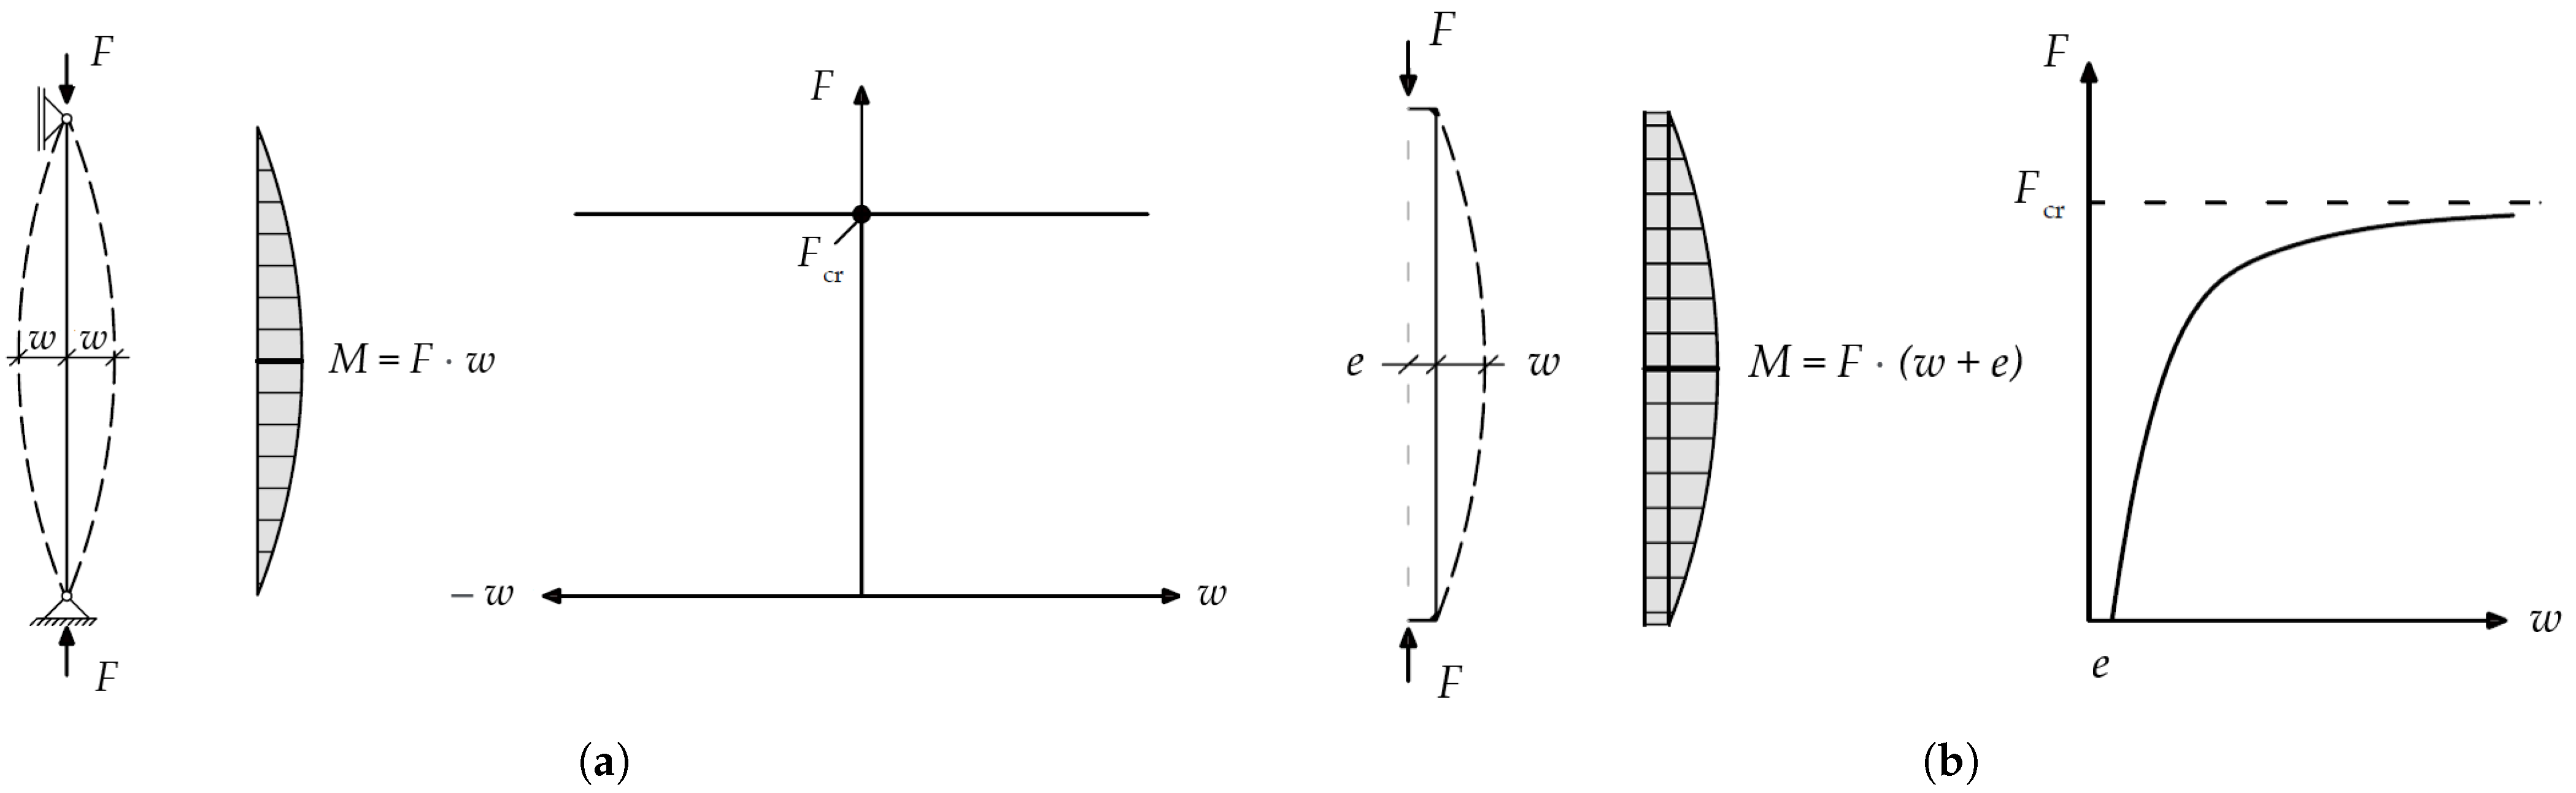
1)) describes the first eigenvalue of the differential equation for the bending line of the buckling bar. The equilibrium bifurcates at this point, which is why elastic buckling is also called a bifurcation-type problem. According to 
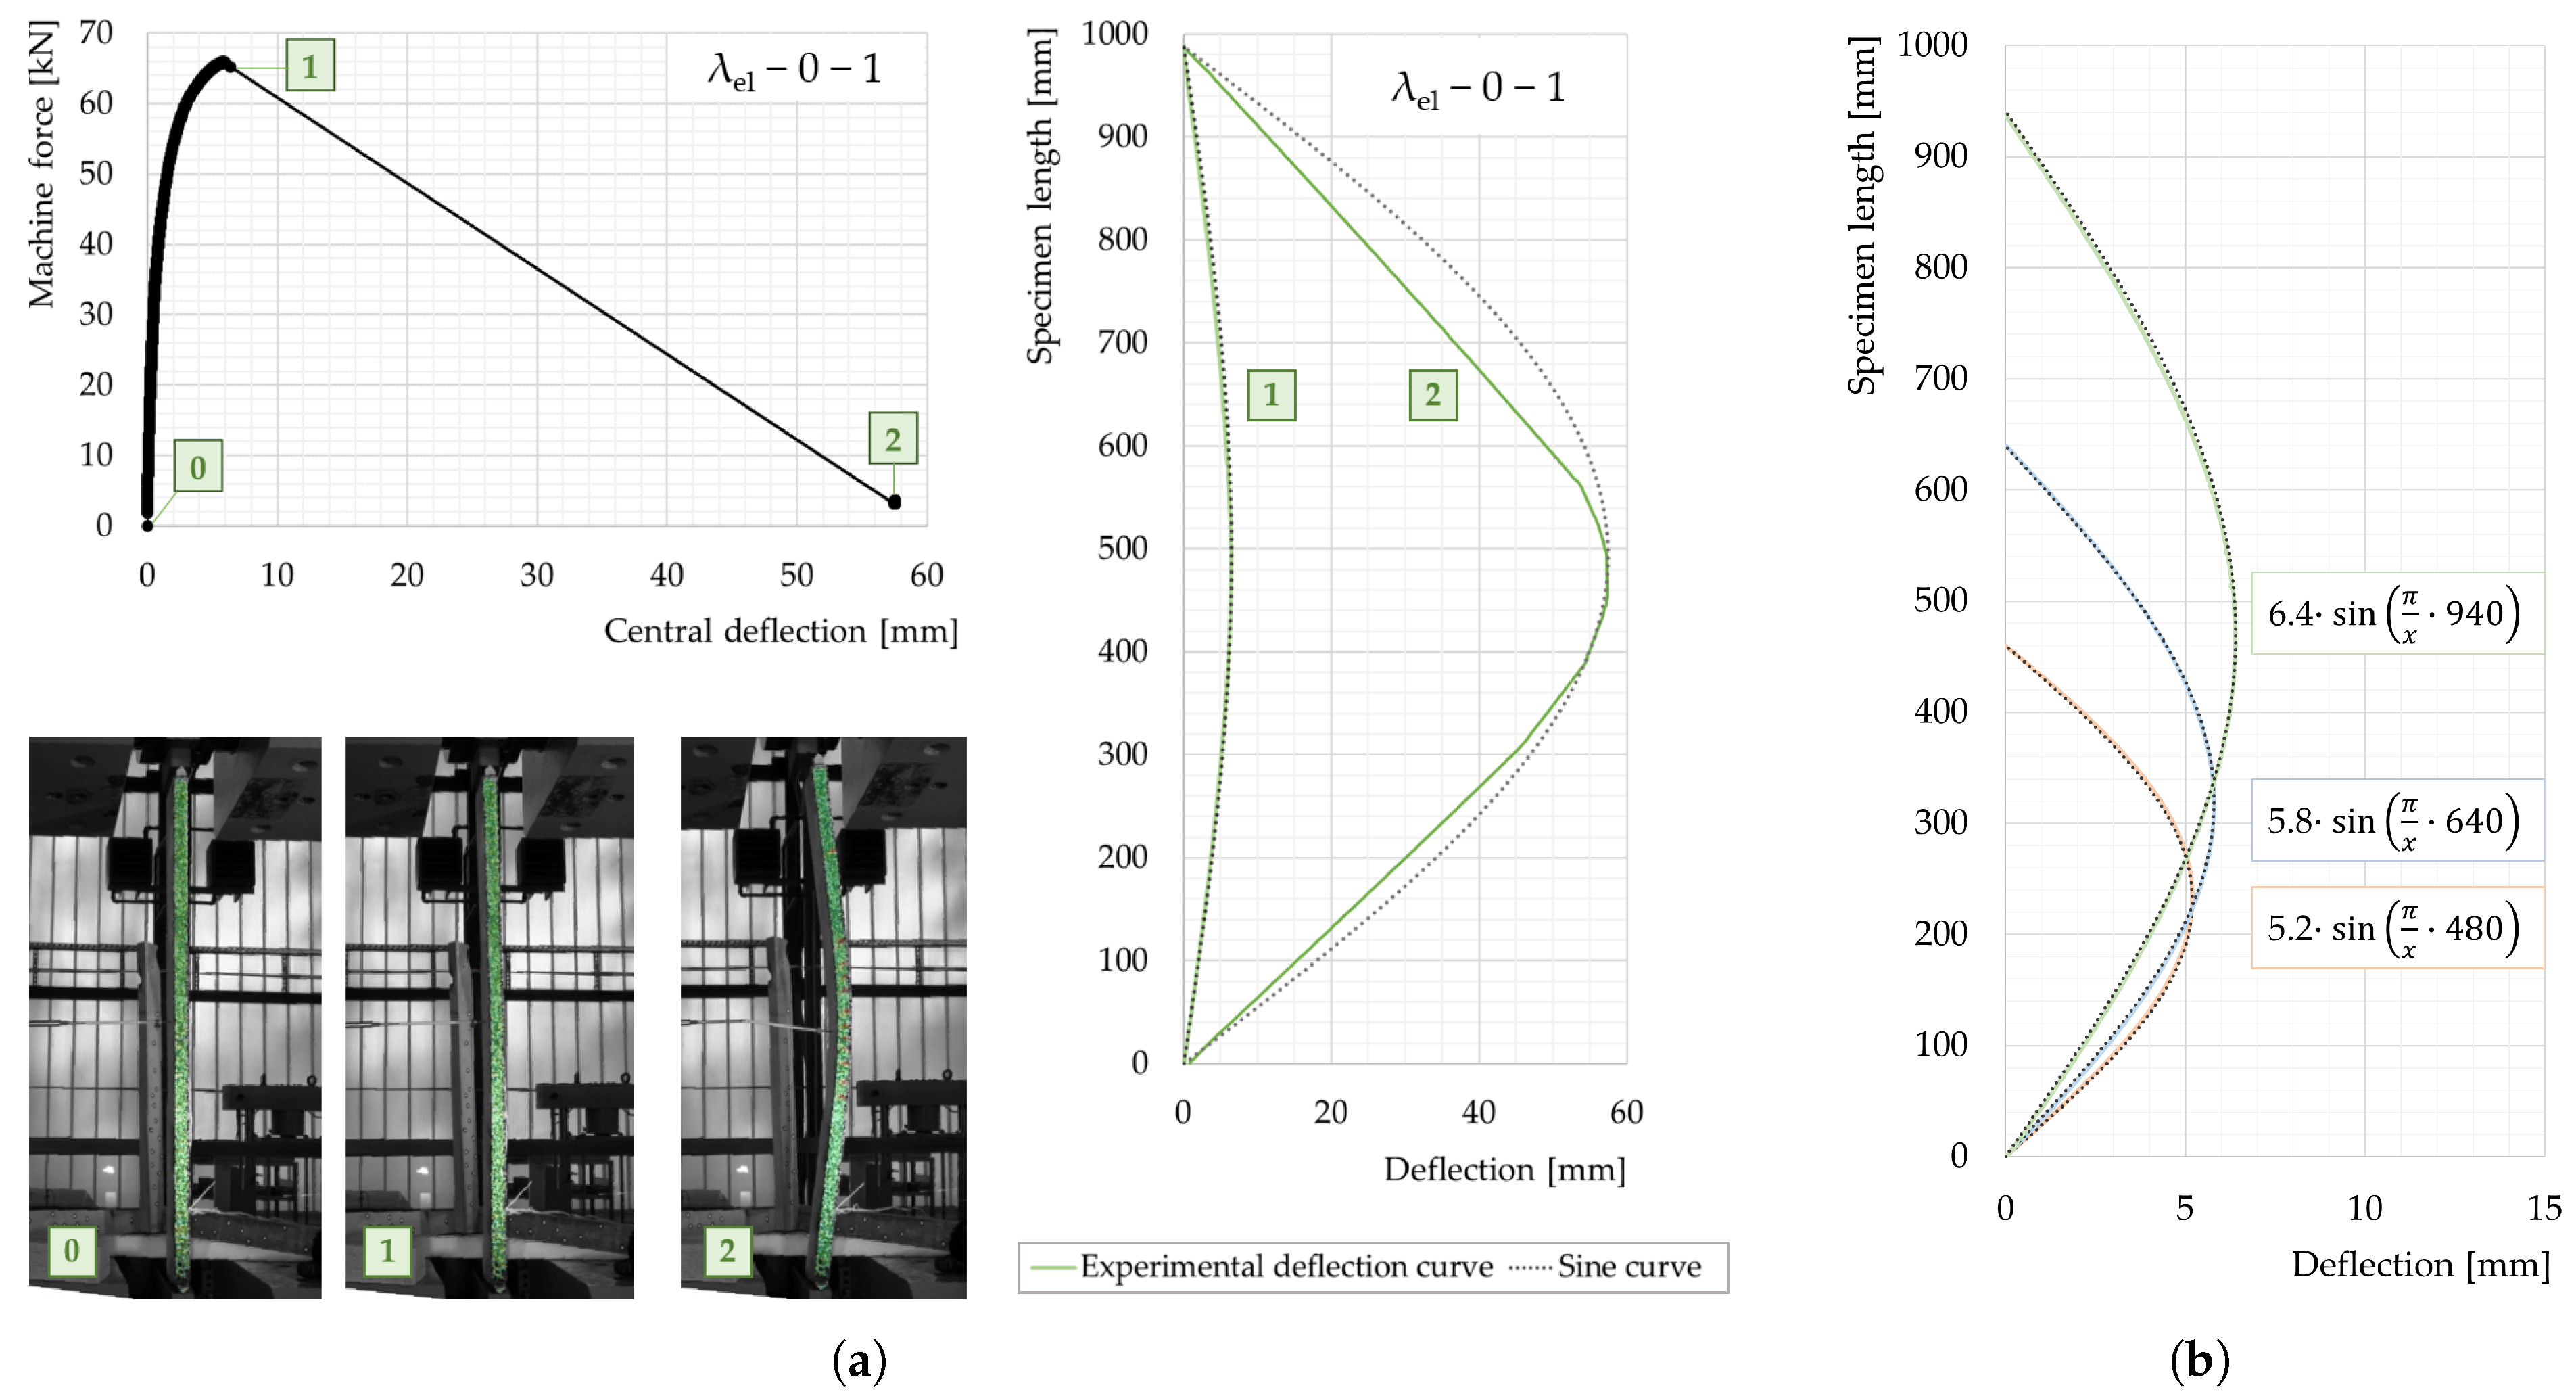
Euler’s theory, there is no lateral deformation as the load increases until the critical load is reached, which is when sudden, large deflections occur (Figure 2a). The progression of the deflection curve w ( x ) is characterized by the eigenmode corresponding to the first eigenvalue, thus resulting in a half-sinusoidal wave shape:
w ( x ) = w x , m a x · s i n π L · x .
As the maximum deflection w x , m a x at the center of the compression member ( x = L / 2 ) is an integration constant, its magnitude is indeterminate. Moreover, for axially symmetric cross-sections, the direction of buckling cannot be predicted.
However, Euler buckling formulations are usually considered to be an idealized upper limit, since they are conceptual relations, which—in addition to the fact that the material must be homogeneous and obey Hooke’s law—are valid only for further strict assumptions [19]:
  • The column is perfectly straight with a constant cross-sectional area.
  • The resultant of the compressive loading passes through the central axis of the column.
Even in a laboratory setting, it is highly unlikely that these conditions will be met perfectly, since real structures are always fraught with unavoidable imperfections, e.g., due to the manufacturing process. In fact, the existing imperfections will cause a deflection as soon as a load is applied (Figure 2b). As the bending deformation increases rapidly, so does the moment M, according to the second-order theory, until the structure collapses under the combined effect of the internal normal force and moment (deflection-amplification-type buckling). For vanishingly small imperfections, failure occurs below but close to F c r .
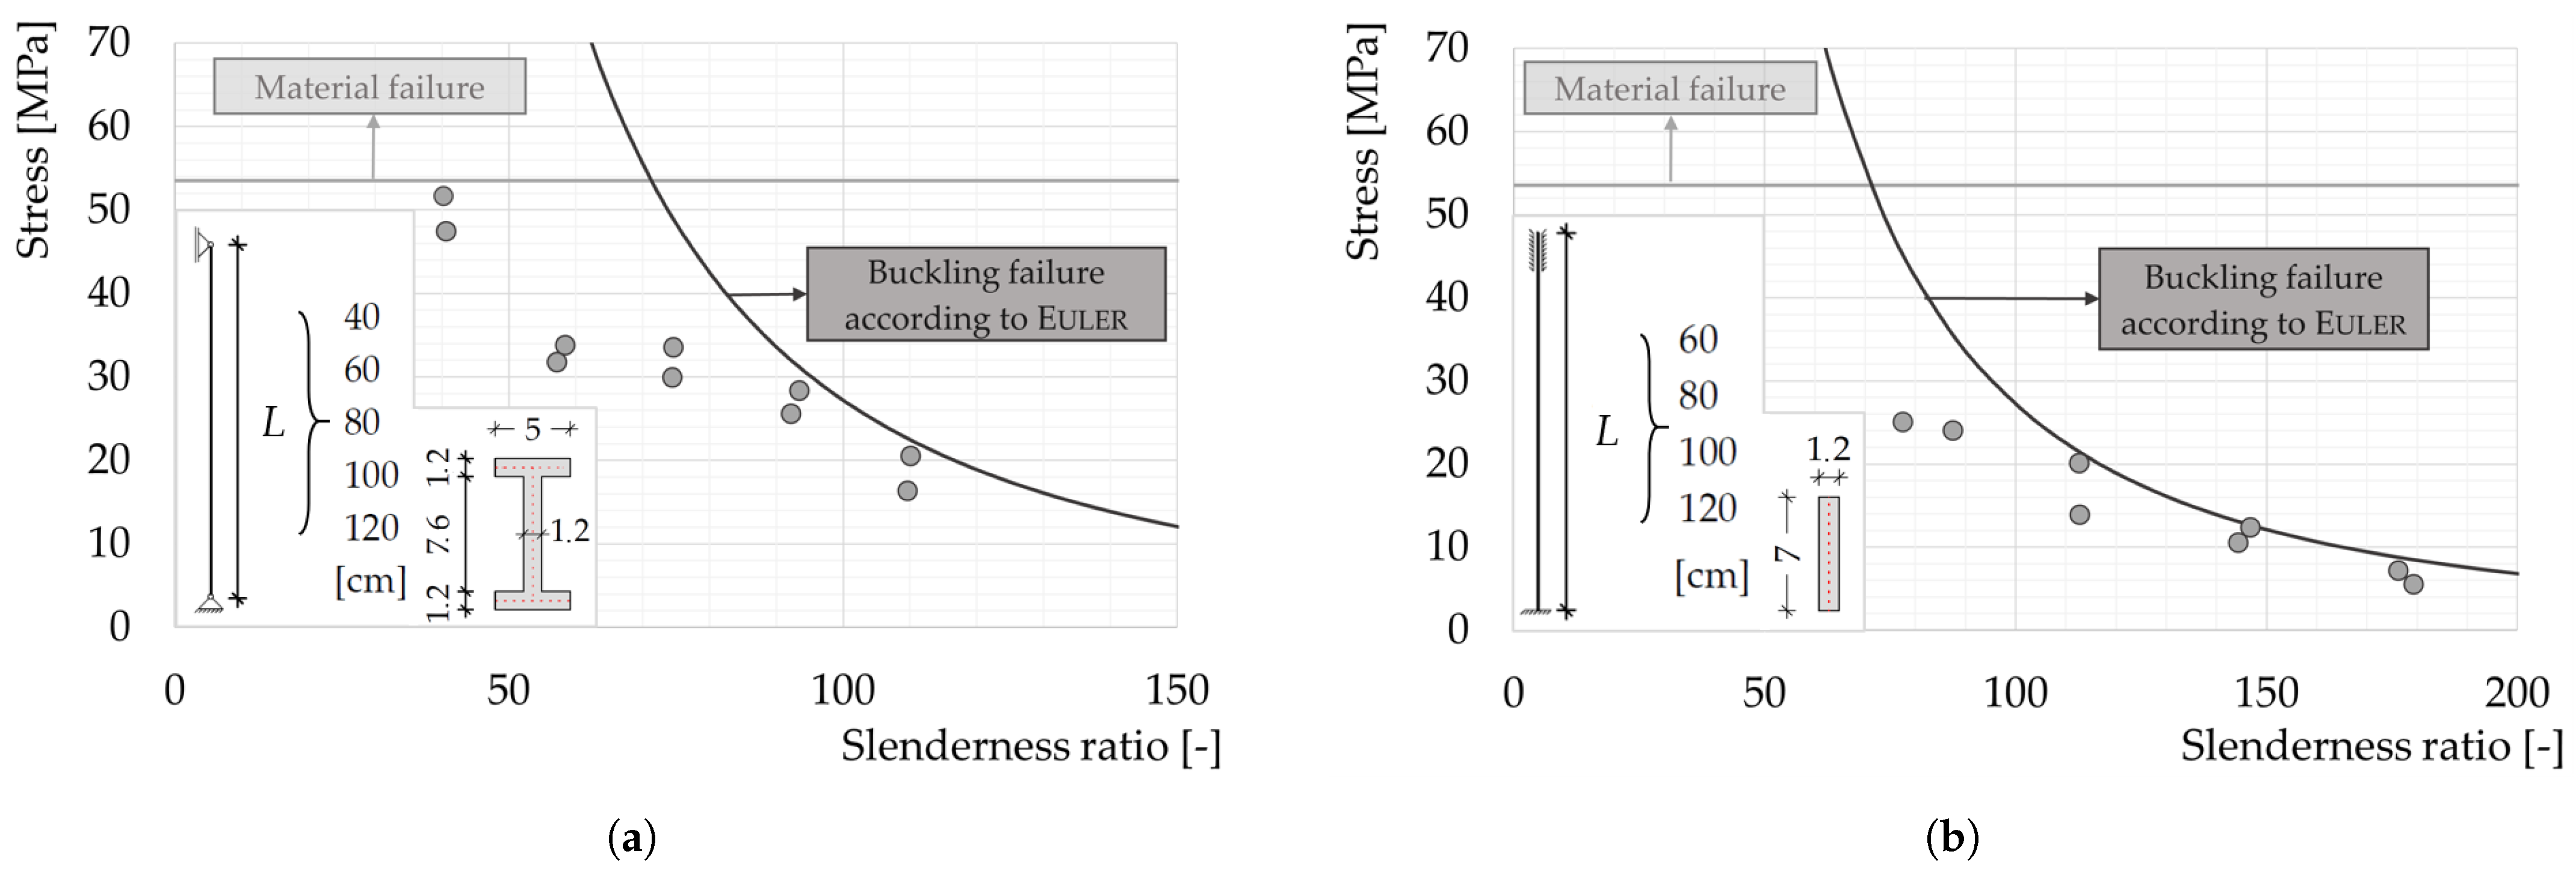
The existing database providing insight into the buckling stability behavior with respect to slender structures made of nonmetallically reinforced concrete is very limited. The first investigations on a total of 18 carbon-reinforced concrete (CRC) columns with varying lengths (resulting in 40 < λ < 180) conducted by C.F. Alonso dos Santos [26] showed the expected reduction in the load-bearing capacity with rising slenderness ratios. In Figure 3, the results of the two series, in which I-section columns with hinged ends (a) and rectangular cross-section columns with clamped ends (b) were studied, are displayed in a σ λ diagram, along with the corresponding ideal failure limit lines. For high slenderness ratios ( λ > 90), the ability to achieve an overall fair agreement between the actual failure stresses and Euler’s buckling theory could be demonstrated. In contrast, for the specimens with an intermediate slenderness ratio (50 < λ < 90), significantly lower results were obtained. The large deviation of the two specimens of L = 60 cm in the first series (Figure 3a) was attributed to undesired load eccentricities, while the general scatter between the two columns of one investigated length was attributed to small manufacturing-related imperfections, e.g., misalignment of the carbon reinforcement grid and the deviation of specimen thickness or straightness [26]. The results emphasized a non-negligible sensitivity of these filigree structures to small deviations from the ideal state. Therefore, the extent to which inevitable imperfections affect the buckling behavior of slender CRC members subjected to compression needs to be determined in systematic investigations.
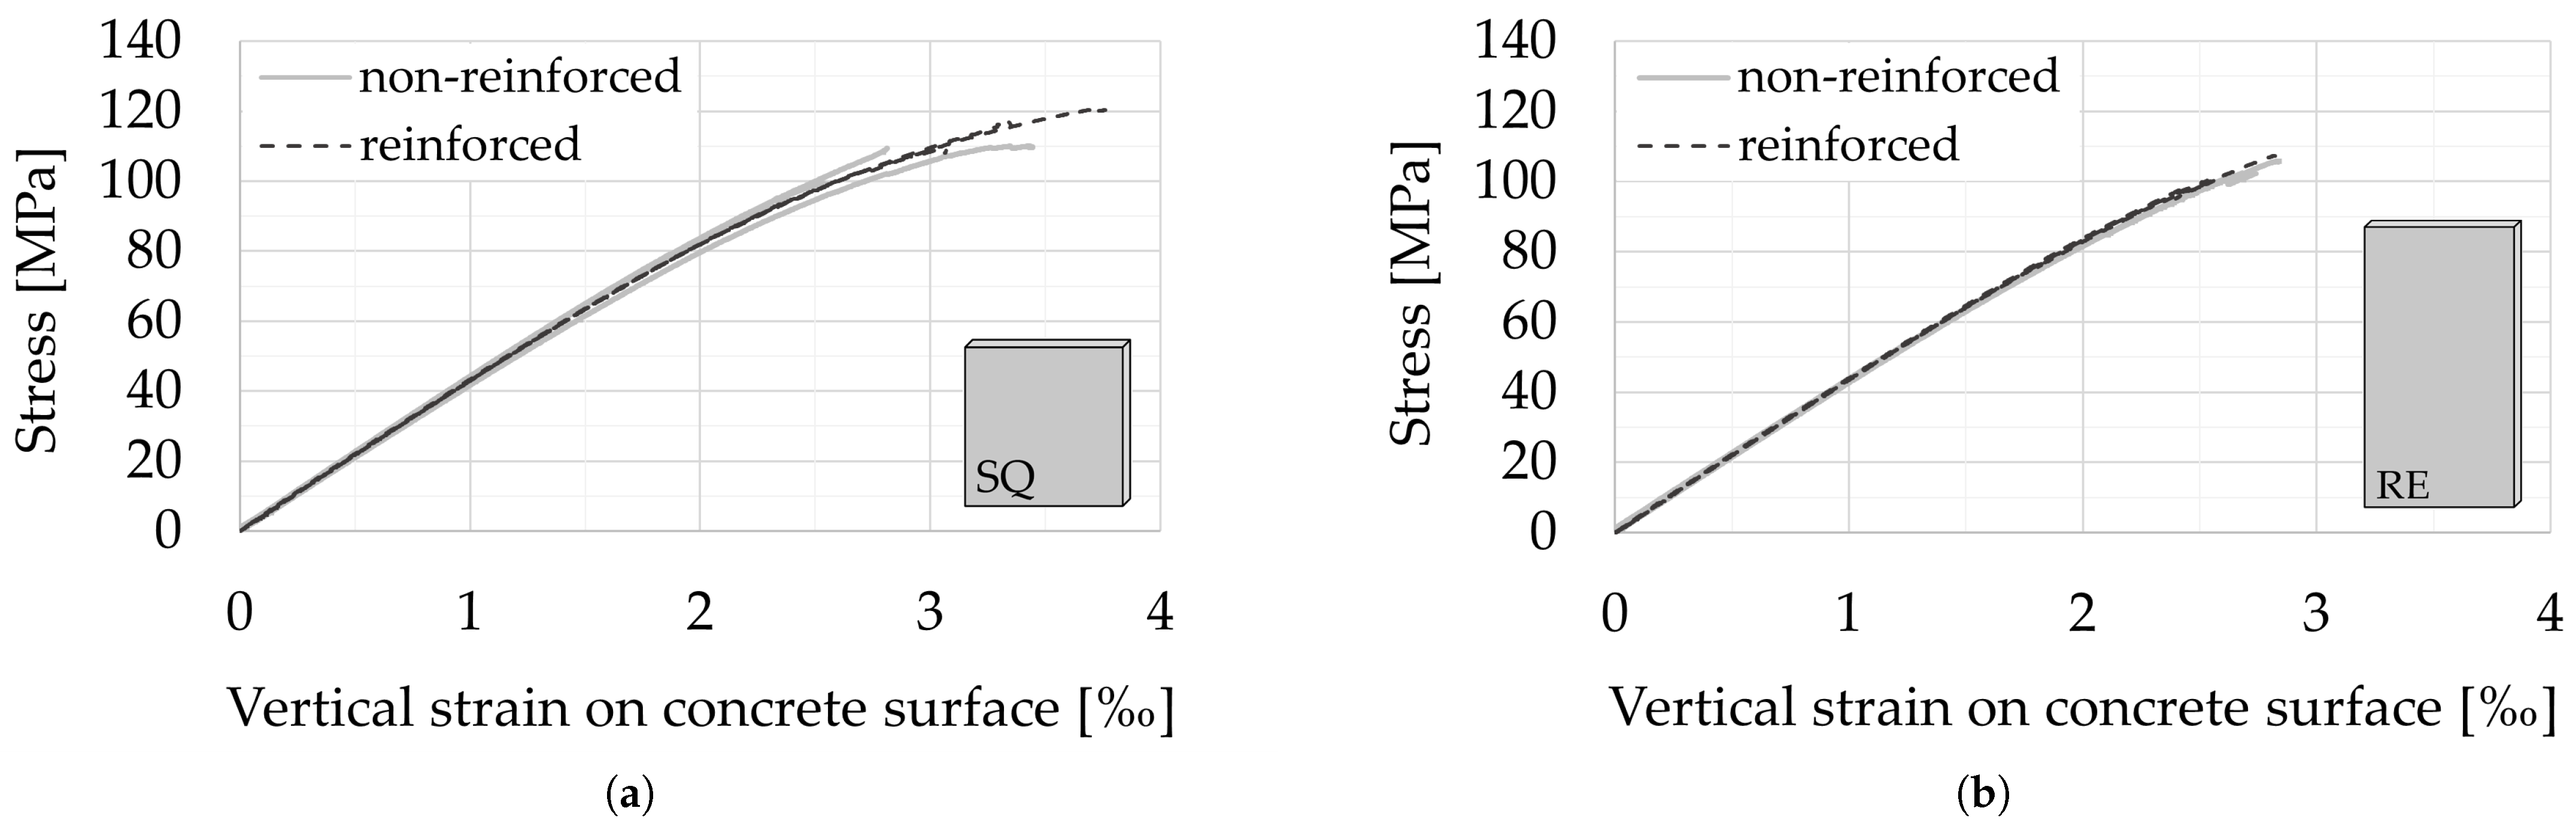
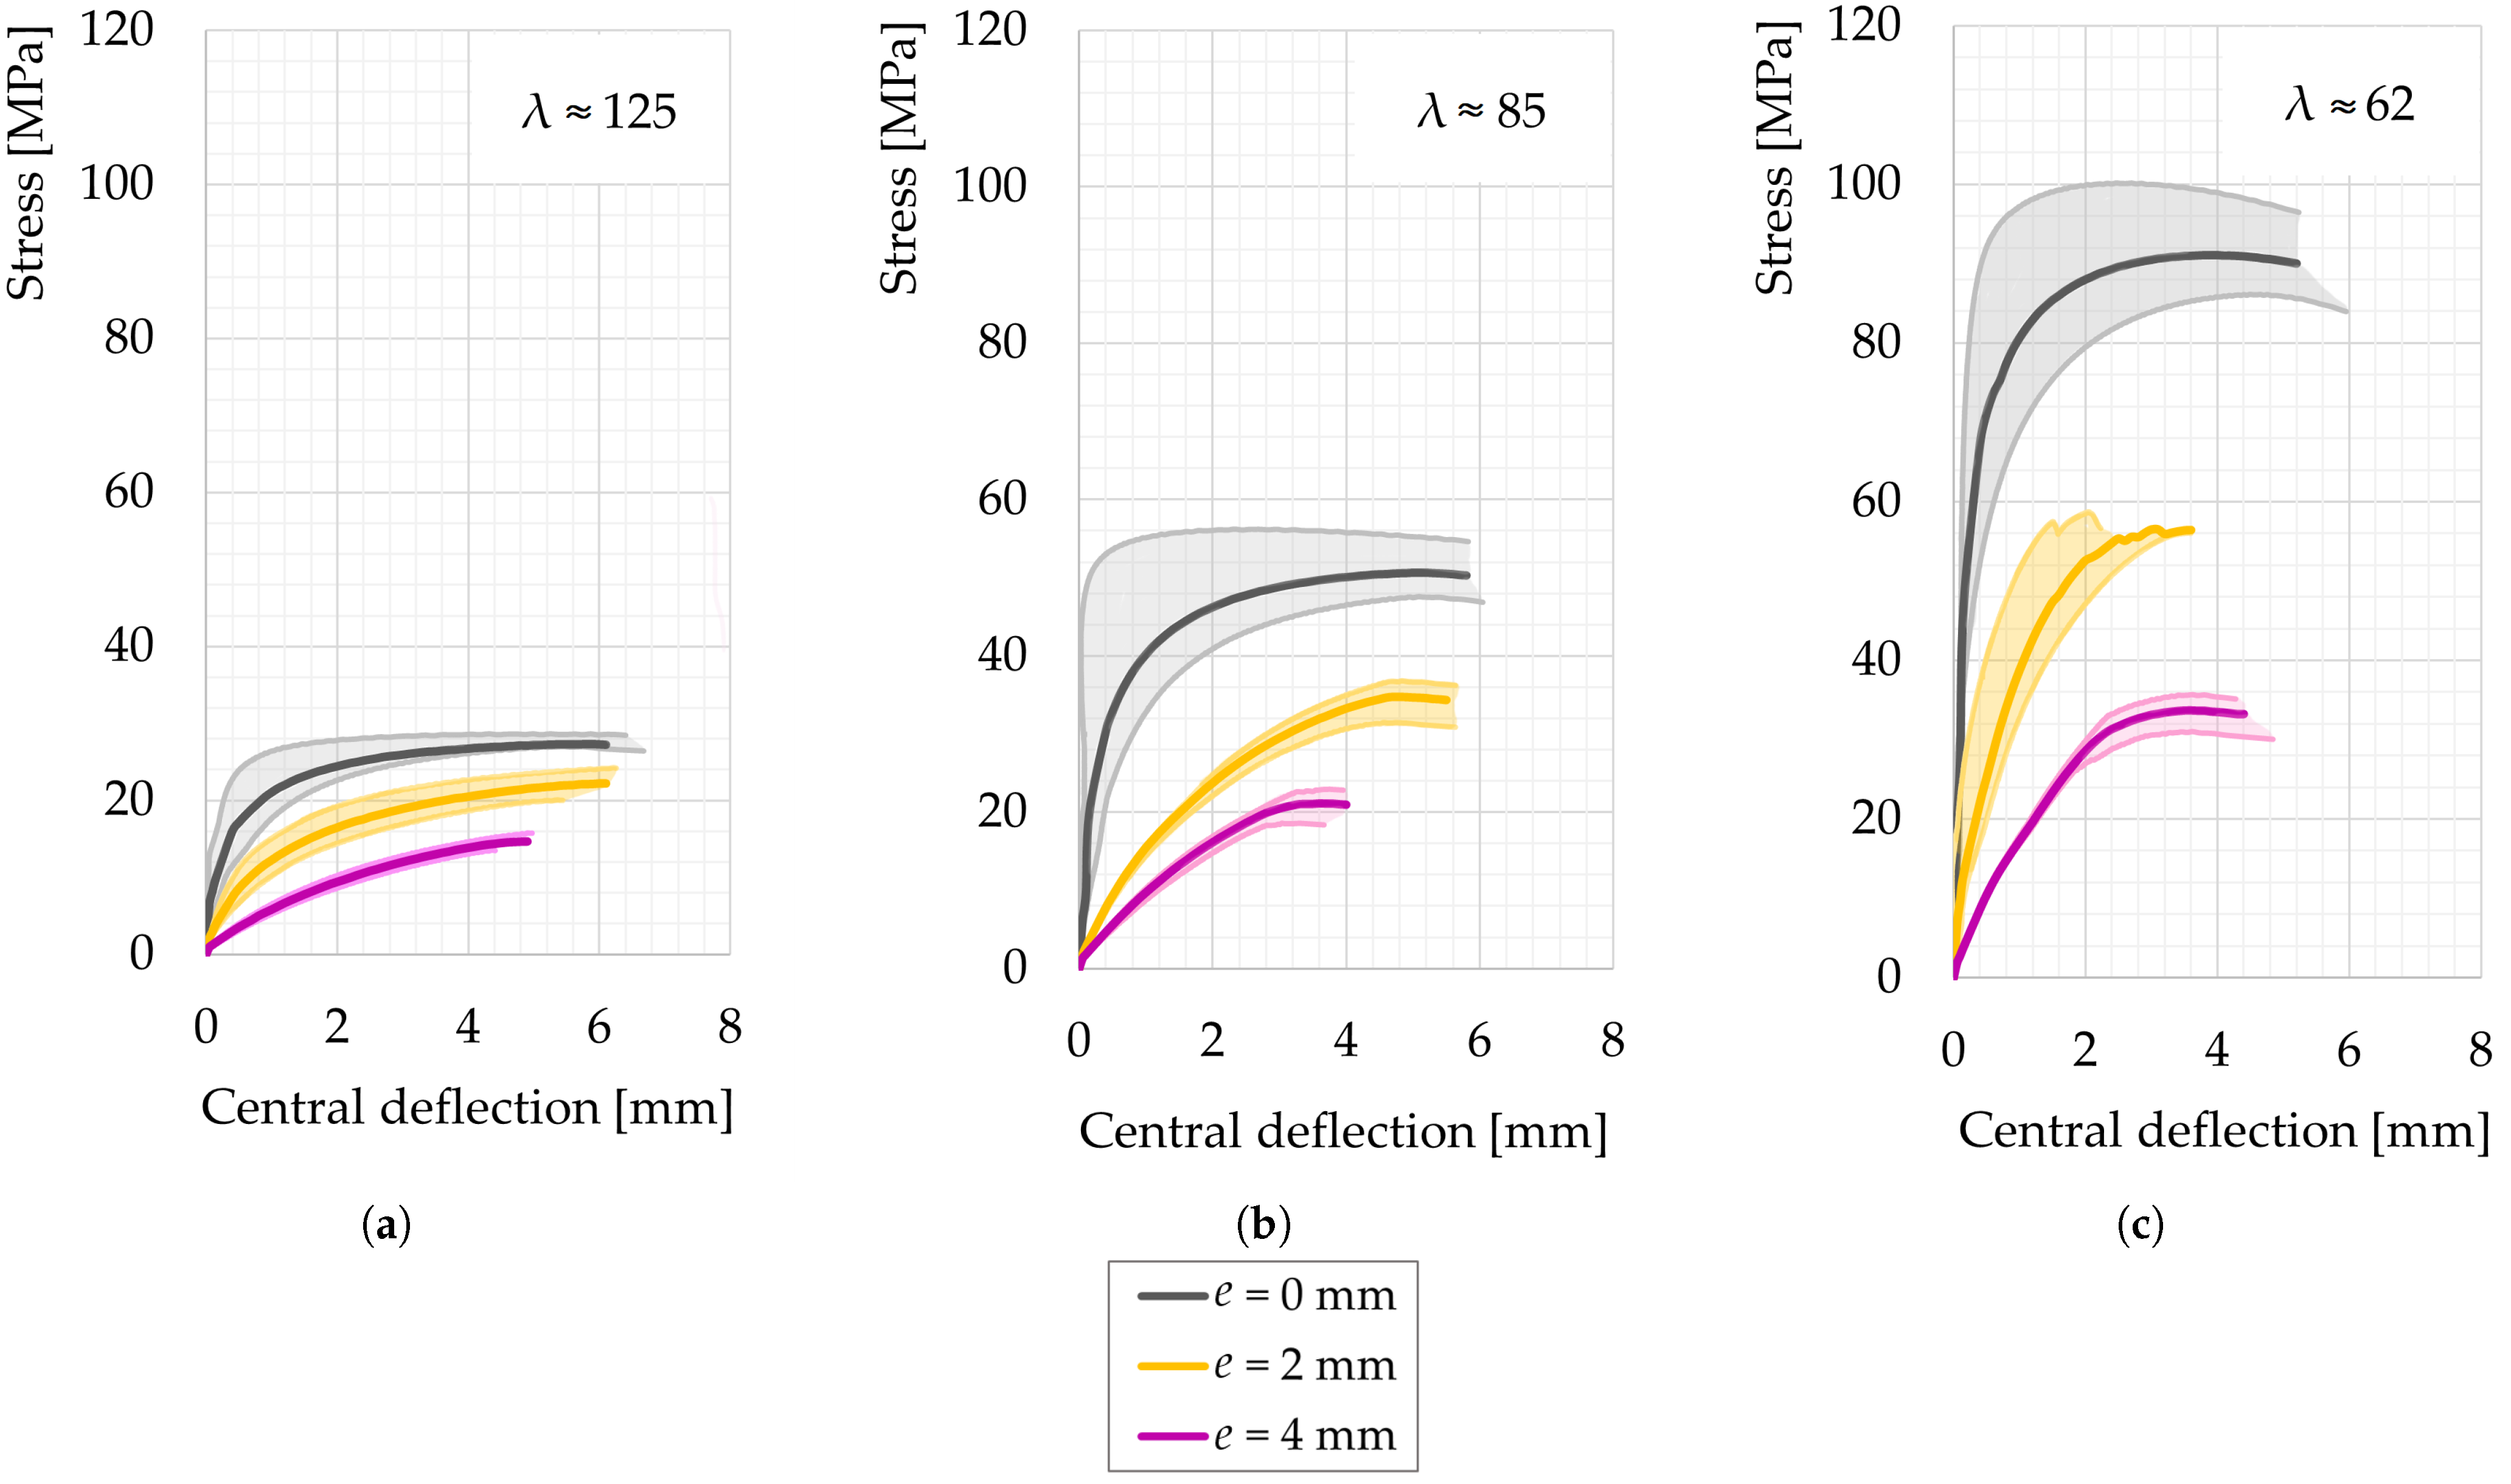
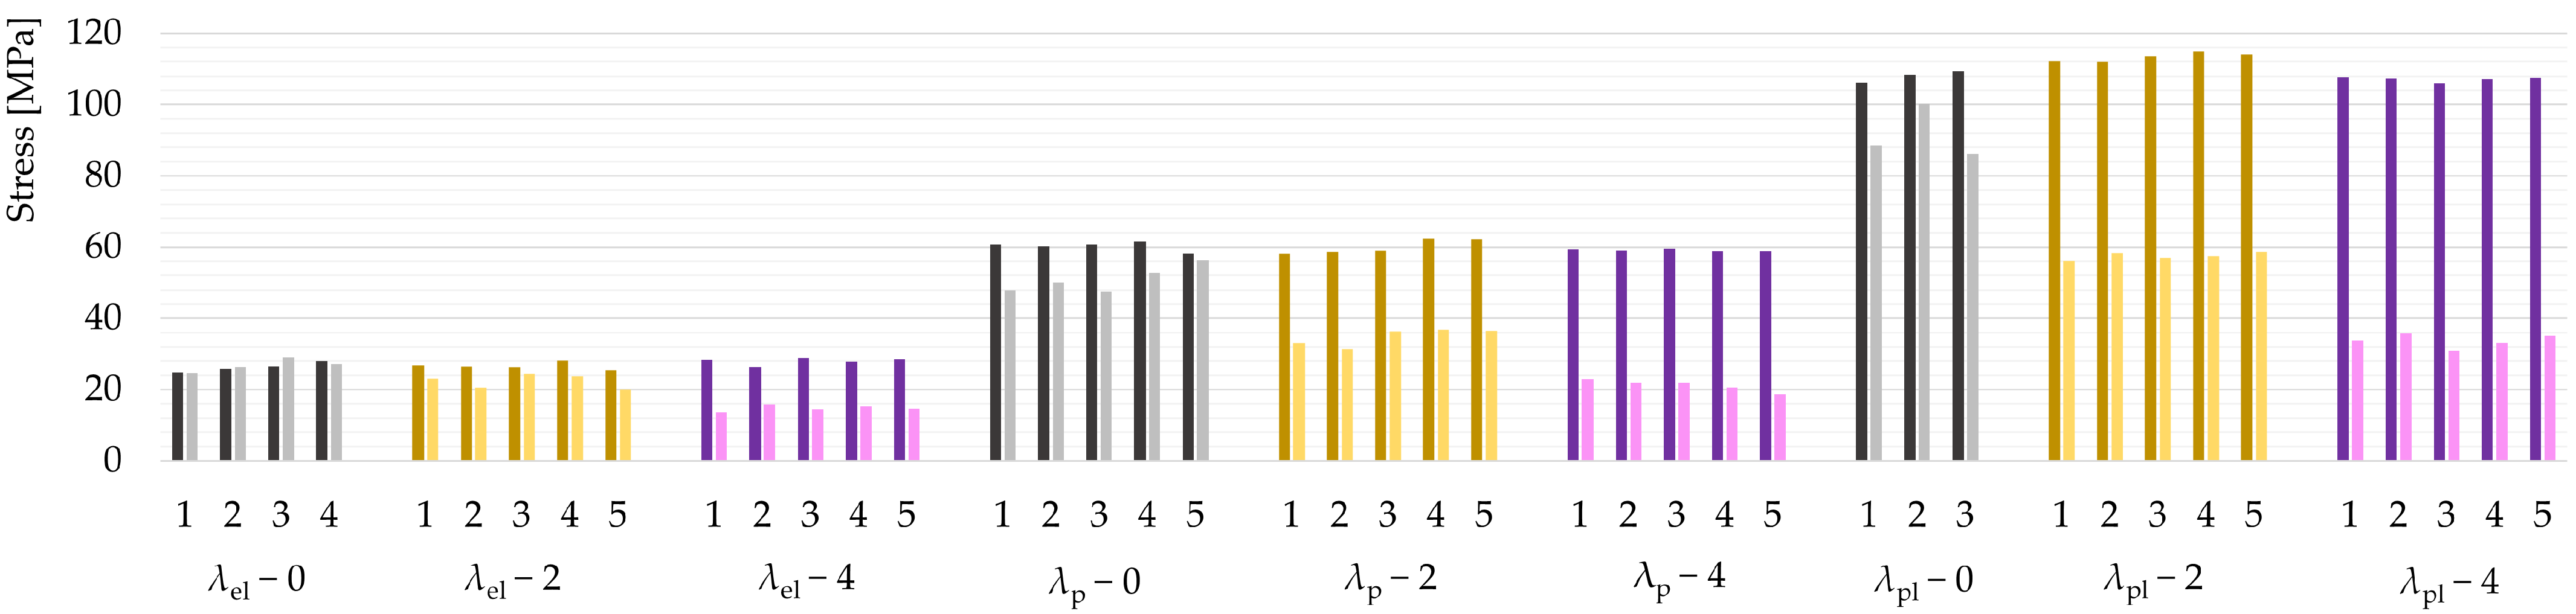
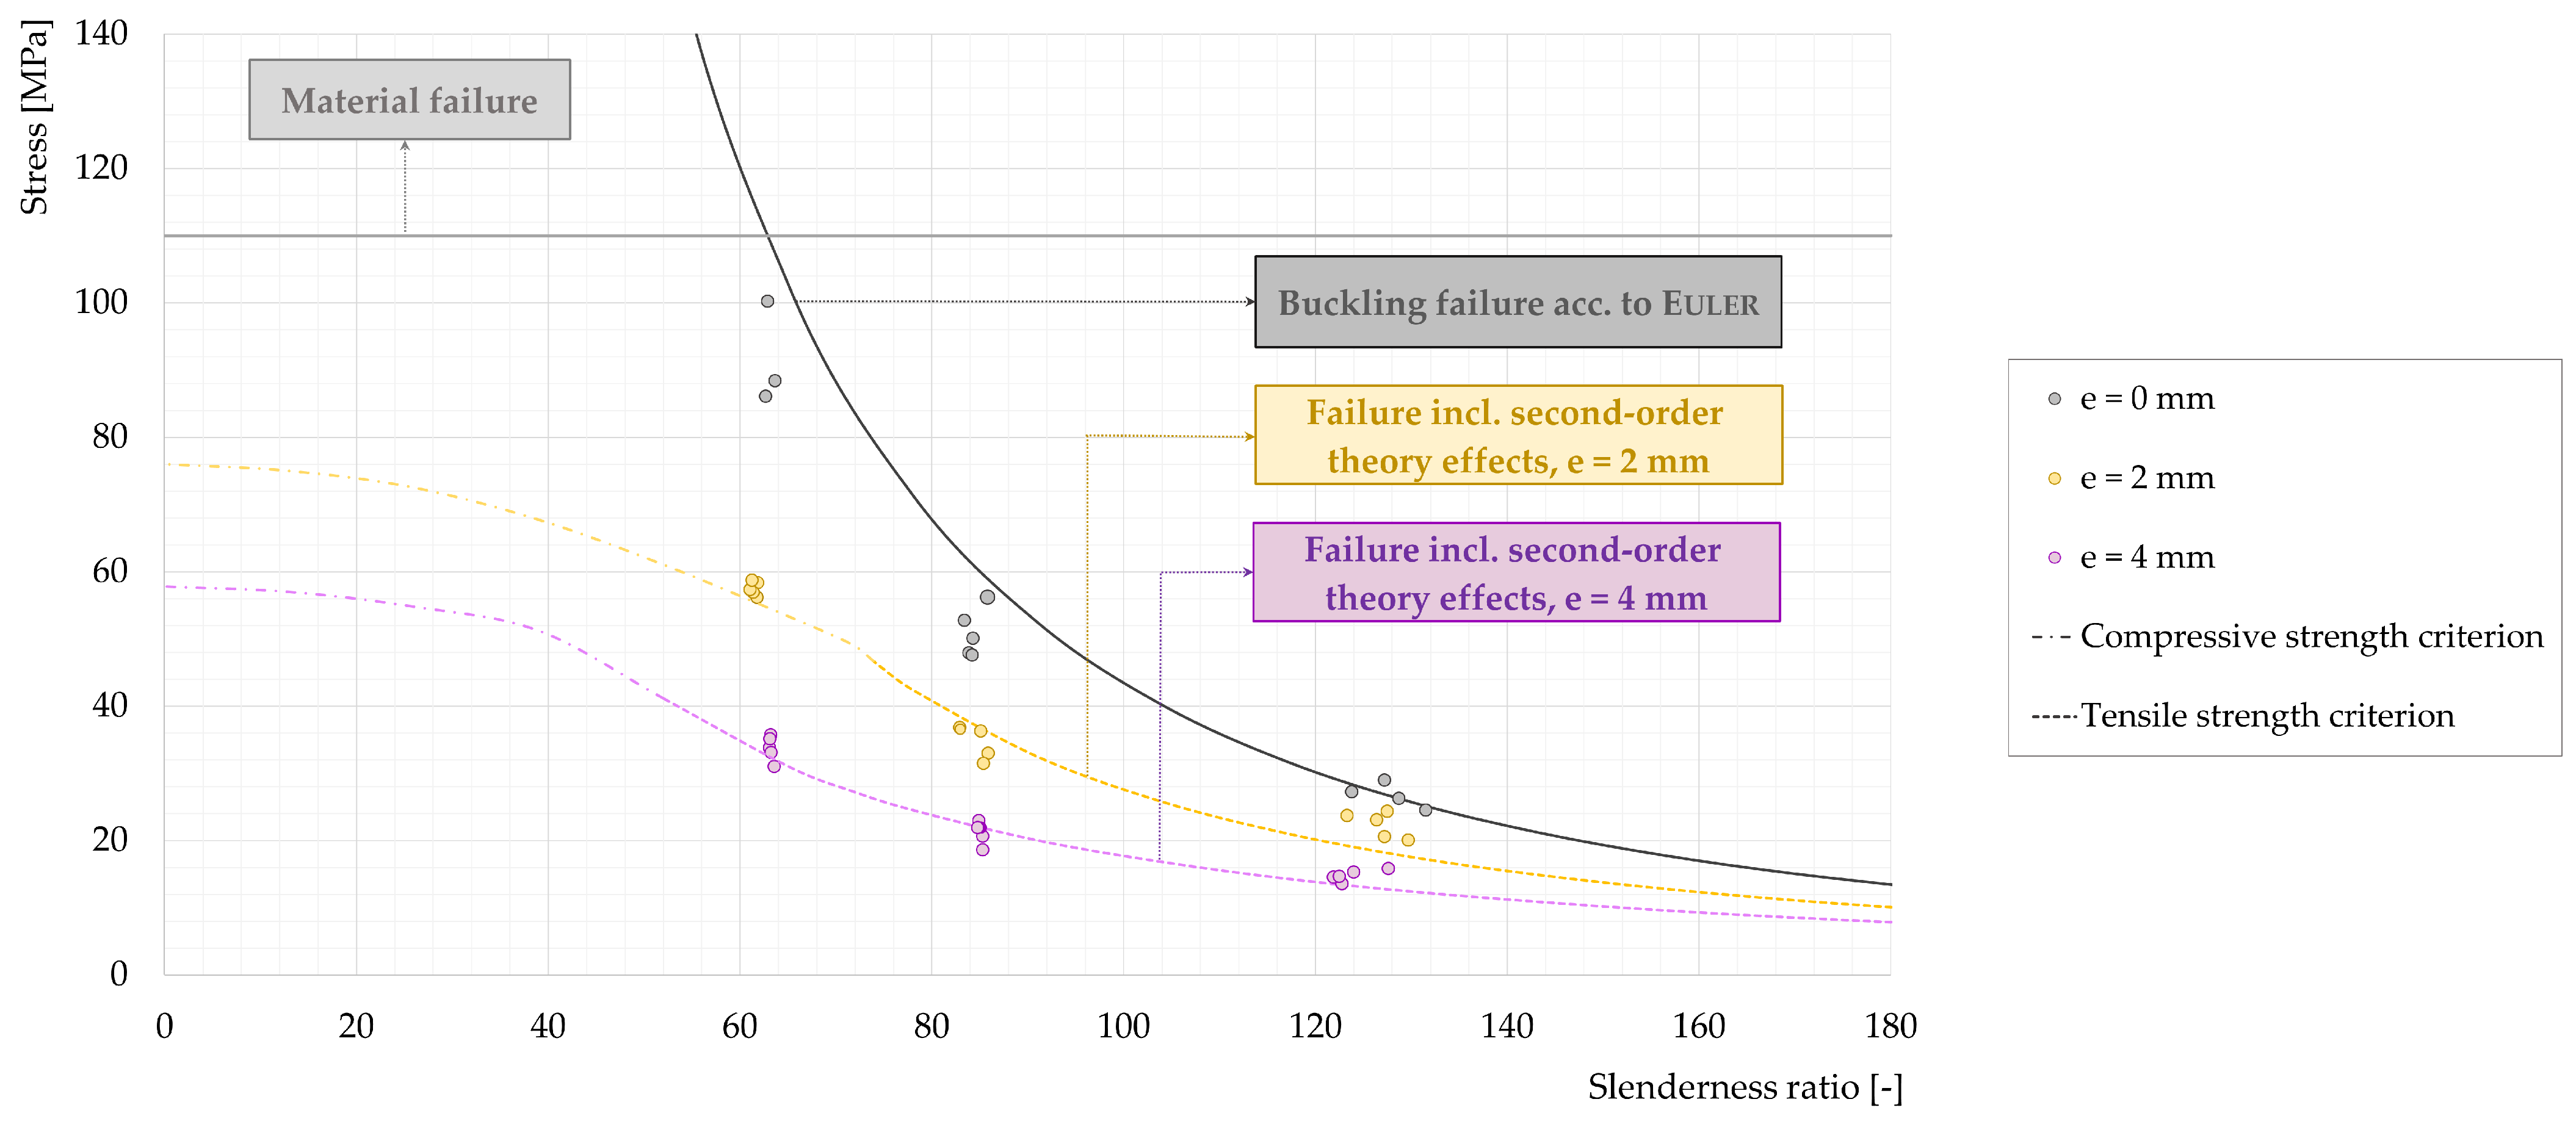
The current study presents the results of buckling tests carried out on slender carbon-reinforced concrete (CRC) specimens with hinged ends and rectangular cross-sections of different lengths, thereby observing the deformation behavior under uniaxial compressive loading. The main objective of the tests was to gain further insight into the effects of varying slenderness ratios, as well as the effects of purposefully applied initial load eccentricities, on the stability of CRC specimens. In addition to the analysis of the failure process, the results are compared to the ideal buckling load according to Euler and to the stress equation according to second-order theory. Compression tests on short specimens preceded the buckling tests in order to characterize the compressive material properties and to determine the slenderness ratios of interest for the buckling investigations.

2. Materials and Methods

2.1. Materials

As for the reinforcement, a biaxial warp-knitted grid made of carbon fiber yarns with an epoxy resin coating was used. The axial fiber strand spacing and the yarn cross-sectional area were the same for both the warp (longitudinal) and the weft (transverse) directions, thus accounting for a symmetrical reinforcement area of 85 mm 2 /m. The ultimate stress and modulus of elasticity were determined in uniaxial tensile tests according to [27] for ten single warp yarns that were extracted from the grid. Details about the geometrical and mechanical characteristics of the grid are listed in Table 1.
The specimens were cast with a self-compacting cementitious matrix developed specifically for the application of textile-reinforced concrete (TRC) by the Institute of Construction Materials (IfB) of TU Dresden [29]. The mix is composed of a binder concept (which is based on Portland cement, slag, and limestone flour), fine quartz sand, sand, a high-performance superplasticizer, and water. See Table 2 for details on the mix design.
According to the definition of the DIN EN 206 [30], a mixture with a maximum aggregate size of 2 mm—as used for this study—is classified as mortar. Due to its high strength, the term fine-grained concrete has been established in the context of TRC. However, the material strength was determined on prisms (160 × 40 × 40 mm 3 ) according to the standard test method for mortar [31]. For each concrete batch, the compressive strength f c and the flexural tensile strength f c t , f l were determined on three prisms on the day of testing (age 28 to 32 days). Cylindrical specimens (h/d = 300 mm/150 mm) were used to identify the mean modulus of elasticity E c of the cementitious matrix according to [32]. The results of the material tests are summarized in Table 3.

2.2. General Procedure and Experimental Program

The present study focused on flexural buckling, i.e., bending about the axis of least resistance, of slender CRC specimens with hinged ends. One main objective was to investigate the buckling behavior of the samples in terms of load–displacement characteristics for three different slenderness ratios:
  • Within the range of elastic buckling λ e l (③ in Figure 1);
  • Within the range of plastic buckling λ p l (② in Figure 1);
  • Around the threshold slenderness ratio ( λ p in Figure 1).
Since the cross-sectional dimensions remained the same for all samples, the slenderness ratio of the specimens was controlled by their lengths. In order to specify the slenderness ratios for the buckling experiments, it was necessary to gain insight into the stress–strain relation of the material combination. Therefore, uniaxial compression tests (Section 2.4.1) were carried out on small reinforced and nonreinforced disk-shaped samples with the same cross-sectional dimensions as the planned buckling samples (Section 2.3) and a length-to-width ratio of L / W 1 (square disk—SQ) and 2 (rectangular disk—RE). Three specimens were examined for each configuration, thus resulting in a total of 12 samples (Table 4). After determining the relevant parameters for the σ λ diagram, the suitable λ values were identified and used to calculate the corresponding lengths with the following equation:
L = λ · I A for rectangular cross sections : L = λ · d 12 = 0.289 · λ · d .
Subsequently, a total of 43 buckling tests (Section 2.4.2) were performed on slender CRC samples. In addition to investigating the three different slenderness ratios of interest, initial load eccentricities of 2 and 4 mm were purposefully applied to the specimens. Table 4 summarizes the number of all combinations examined. Each specimen of the buckling tests is labeled by its slenderness ratio, load eccentricity, and number, as shown below in the table.

2.3. Sample Preparation

The experiments were conducted on both carbon-reinforced and plain concrete specimens with rectangular cross-sections of 105 × 26 mm 2 . The lengths of the samples were varied, thus resulting in different slenderness ratios (Table 5). Section 2.2 explains how the specific values were determined.
The specimens used for this study were produced at the Otto-Mohr-Laboratorium (OML) of TU Dresden. A formwork made of sealed timber (990 × 380 × 26 mm 3 ) was used to cast thin concrete slabs (Figure 4a). In order to secure the position of the reinforcement, the grid was clamped in between steel strips that were adjusted along the long edges of the formwork (Figure 4b).
The slabs were kept damp to prevent moisture evaporation until the formwork was removed three days after concreting. Afterwards, they were stored in water for another four days in order to minimize shrinkage cracking and uneven drying. On the seventh day, three samples were cut from each slab using a circular wet saw. Each sample that was reinforced contained one layer of the carbon grid with five warp yarns, thereby resulting in a reinforcement ratio of about 3‰ in the longitudinal direction. Until the day of testing, the specimens remained in a climatic chamber at 20 °C and 65% relative humidity.

2.4. Test Setup and Instrumentation

2.4.1. Compression Tests

The experiments were carried out using a testing machine with a compressive load capacity of 5 MN. It featured a special construction to enable a uniform load application, which consisted of two brushes made of several high-strength steel bristles with a cross-sectional area of 4 × 4 mm2 separated by small gaps (Figure 5a). They have proven to be an effective tool to achieve a homogeneous stress state in the specimen during the compressive loading by reducing the lateral constraint of the loaded surfaces due to the deformability of the bristles [18,33].
The load was applied in a path-controlled manner at a loading rate of 0.002 mm/s until failure, while the vertical and horizontal strains were recorded at a measuring rate of 5 Hz on both sides of the sample by strain gauges placed crosswise in the center of the concrete surface, as displayed in Figure 5b,c.

2.4.2. Buckling Tests

Based on the results of the uniaxial compression tests, the three slenderness ratios of interest were determined to be λ = 125, 85, and 62. The buckling tests—which were technically also uniaxial compression tests—were carried out on CRC specimens with hinged-end supports. These were implemented by attaching small, tapered steel profiles to the two contact surfaces of the specimens using an epoxy-based adhesive. The tips at the top and bottom were inserted into the notch of a steel block mounted in the testing machine in order to reduce undesired friction to a very small contact area (Figure 6a).
Three different configurations of the steel profiles were fabricated to allow for both centric ( e = 0 mm) and eccentric ( e = 2 mm and 4 mm) load introduction (Figure 6b). In case of application of the asymmetrical profiles, they were arranged with their tip being closer to the concreting side. Hence, buckling was provoked to the opposite formwork side, since the tendency to buckle in this direction had been observed in preliminary tests on specimens with centric load introduction.
The specimens were path-controlled loaded in a servohydraulic testing machine (max. load of 2.5 MN) with a load rate of 0.01 mm/s until buckling failure occurred. The machine force F, as well as the vertical machine displacement w z , were recorded during the experiments. In order to measure the horizontal deflection w x , an inductive displacement sensor (linear variable differential transformer—LVDT) was installed in the midheight of the specimen where the maximum displacement was expected (Figure 7a). The measuring rate was 5 Hz.
In addition, an optical, photogrammetric measurement system was used to enable a contactless observation of the specimen surface with high resolution and accuracy. A stereo camera system (5 MP cameras) was set up to record one narrow front side of the specimen (Figure 7c) in order to examine the deformation behavior of the samples during loading. The investigated surface was prepared by creating a stochastic speckle pattern. For this study, a white primer coat with a black pattern was applied to elevate contrast (Figure 7b). The calibration process was performed under constant room temperature and light. In order to maintain uniform measurement conditions without heating, blue LED light was used.

3. Results and Discussion

3.1. Compression Tests

The experiments were conducted in order to determine three values from the σ ϵ relation of the material: the compressive strength, the modulus of elasticity, and the proportionality limit. Therefore, the lengths of the specimens were chosen to ensure material failure due to the induced compressive stress. Figure 8a shows a photograph of the typical failure pattern of the samples examined. They either failed due to the spalling of the concrete surface near the top or bottom or due to splitting (usually along the reinforcement layer, if existent), and sometimes they failed due to a combination of both phenomena.
Reinforced and nonreinforced specimens were tested and compared, because previous studies of fine-grained concrete under compressive loading have shown that the use of textile reinforcement may affect the ultimate strength of the matrix. While yarns impregnated with a coating of lower stiffness, e.g., styrol butadiene kautschuk or polyacrylate, can lead to a reduction in the maximum bearable load, coatings of higher stiffness, e.g., epoxy resin as it was used in this study, can slightly increase the compressive strength [16]. This tendency was also observed for the square disks, but it could not be detected for the rectangular disks, as shown in Figure 8b, where the achieved compressive strengths of all 12 specimens are summarized. On average, the samples achieved a failure stress of 108 MPa, which is in good agreement with the mean compressive strength of the standard prisms (see Section 2.1). The average strength of 109.4 MPa, corresponding to the six disk specimens containing the carbon grid, was used as the reference strength of the reinforced matrix for evaluating the buckling test results.
In Figure 9, the relationship between the experimentally applied compressive stresses and the vertical strains at the concrete surfaces (calculated as mean values of the two strain gauges) is displayed for the square and the rectangular disks. In general, the σ ϵ curves represent the typical behavior of a high-strength concrete, thereby showing a large linear portion (until up to ϵ 1.4‰), a high stiffness, and brittle failure. Apart from the slightly higher strengths obtained for the reinforced square disk specimens, which are also associated with higher strains, the specimens behaved very homogeneously. The fact that the difference in the load-bearing behavior between the samples with and without reinforcement was very small can be attributed to the low geometrical reinforcement ratio of 0.3%. Noticeable effects caused by the textile grids were observed, particularly for larger reinforcement ratios of <2% [16]. The details of the test results are listed in Table 6.
The σ λ diagram on the left in Figure 10 shows the two limit lines for the compression failure and buckling failure that correspond to the composite material used for this study. The Euler hyperbole was calculated from Equation (2). As for the modulus of elasticity E, a linear slope between 10% and 30% of the compressive strength was assumed in accordance with the DIN EN 12390 [32]. E was determined to be 43,684 MPa based on the observed mean σ ϵ behavior of the six reinforced disk specimens. This mean curve, as well as the linear regression line for E, are plotted in the σ ϵ diagram on the right in Figure 10. The proportionality limit f p can be defined as the highest stress up to which the σ ϵ curve remains linear, but the determination of this characteristic point is very subjective, as there are no standards [16]. Kaplan [34] proposed to choose the moment when the measured values deviated from a linear regression line by more than 0.002 mm/m. Based on this suggestion, the samples exhibited linear elastic behavior up to a stress of 60 MPa, i.e., approximately 0.55 · f c , which is significantly higher than normal-strength concrete, which already starts to exhibit nonlinear behavior at about 30–40% of its compressive strength [35]. The corresponding slenderness ratio was determined to be about 85 ( λ p ).
Furthermore, a high slenderness ratio of 125 ( λ e l ) was chosen in order to be far from the threshold value and to guarantee elastic buckling. The third slenderness ratio for the investigations was supposed to be within the plastic buckling range. It was defined as 62 ( λ p l ), as this is the slenderness ratio where the two ideal failure limit lines intersect (Figure 10), thus marking the theoretical transition from material to buckling failure.

3.2. Buckling Tests

The force–deflection diagram on the left in Figure 11a shows the typical behavior over the course of the buckling test, which is exemplarily plotted for the sample λ e l 0 1 . The specimens began to buckle as soon as the load was applied, and the bending deformation grew slowly with an increasing load. As the load approached the critical (maximum) value, it gradually declined its increase until it either stagnated or even slightly decreased. When the ultimate load was exceeded (No. 1 in Figure 11a), sudden and significantly larger deflections occurred, while, in turn, the bearable load decreased to nearly zero (No. 2 in Figure 11a). While most specimens exhibited the described behavior, ending in a highly deflected position with multiple cracks on the tensile side, some samples collapsed due to rupture after exceeding the ultimate load. This phenomenon will be further discussed later.
The displacements of the sample λ e l 0 1 were computed from the photogrammetric images of the narrow front surface using the commercial software GOM ARAMIS. The right diagram in Figure 11a shows the bending lines (deflection at each length coordinate of the specimen) corresponding to the significant points 1 and 2 compared to a sine curve with the same maximum deflection in the middle calculated from Equation (4). For the moment when the ultimate load was reached, the experimental bending line showed very good agreement with the ideal sinusoidal shape of the deflection curve according to Euler (Section 1.2). At the end of the test, the experimental bending line deviated from the theoretical sinusoidal curve, thus showing remarkably larger curvatures in the central part of the specimen due to cracks that formed mainly in the middle third on the stretched side.
Since the transition of the states from point 1 to point 2 was usually captured by only one measurement point (see the left diagram in Figure 11a), which resulted in a large scatter of the deflection values at the end of the tests, the specimen behavior was examined only until the sudden, large deformation occurred (or until the rupture of the specimens). Figure 11b shows three example bending lines—with one from each investigated slenderness ratio at the moment of ultimate load application. They all exhibited a sinusoidal deformation, thereby confirming that the hinged support construction served its purpose.
Figure 12 displays the mean stress–deflection graphs for the investigated slenderness ratios and load eccentricities surrounded by the respective scatter of the experimental curves. An unavoidable scatter resulted from the manufacturing process, since even with great effort, the actual specimen dimensions individually deviated from the planned geometry, thereby leading to small differences in the slenderness ratios. In particular, the scatter for the tests with the intended centric load application showed larger expansions, probably due to additional small deviations from the perfect load introduction that were inevitable, despite the great care that was taken when attaching the steel profiles.
Table 7 gives an overview of the results of all of the buckling tests, thereby listing the achieved critical stress σ e x p (calculated as the quotient of the experimentally determined maximum force F to the respective mean cross-sectional area A) for each specimen. For the assessment of the values, the critical stresses of an ideal Euler column with the corresponding slenderness ratio were calculated with Equation (2) and related to the experimental results.
Moreover, the maximum measured deflections w x , m a x at the center of the specimens corresponding to the ultimate bearing loads are given. Note that specimen Nos. 1–3 of the series λ p 0 were the only ones that buckled into the opposite direction compared to all other samples of this study. While for the specimens with eccentric load introduction, the buckling direction was predetermined by the arrangement of the steel profiles; the occurrence of both of the possible buckling directions (around the weak axis of the cross section) should in theory be stochastically equally distributed in the case of ideal specimens without load eccentricity. Most of the samples with e = 0 (six out of nine samples) buckled in the direction of their original formwork side, which may have been due to possible shrinkage effects leading to a slight precurvature of the samples. Within the scope of another study, it was observed that the position of the reinforcement layer within the cross-section of the CRC sample affected the buckling direction; when the carbon grid was placed closer to one side of the specimen, samples tended to buckle in that direction [36]. Since no significant deviations in the carbon grid position from the central line could be detected in the present study, the behavior cannot be attributed to this kind of imperfection here. The authors believe that the direction of buckling was influenced by slight differences in the position of the steel profiles, which resulted in very small load eccentricities affecting the deflections from the beginning of the experiment.
The bar chart in Figure 13 compares the ideal stresses with the experimental critical stresses. Although all of the samples started to bend as soon as the load was applied (Figure 12), for the experiments with high slenderness ratios in the elastic buckling range and an intended centric load application (series λ e l 0 ), the ultimate bearable stresses could be calculated very accurately using Euler’s buckling equation, since they did not exceed the approximately linear material behavior. This finding is in agreement with the study of Alonso dos Santos [26]. However, for the specimens tested with lower slenderness ratios, the results were on average about 15% below the ideal buckling stress. It can be concluded that even the transition from approximately linear to nonlinear material behavior affected the attainable critical buckling stress values of the CRC specimens. Thus, the plastic buckling range appeared to include the identified threshold slenderness ratio λ p . A concordance between the experimental results and the tangent modulus theory (Section 1.2) could not be clearly established at this point.
The results of the other experiments reveal a clear trend of diminishing buckling resistance with increasing load eccentricity. This effect appeared to be stronger with decreasing slenderness ratios (Figure 13). Compared to the stresses obtained with centric loading, the load-bearing capacity decreased by 15% and 50% for the series λ e l due to the load eccentricities of 2 mm and 4 mm, respectively. Furthermore, the critical load was reduced by 32% ( e = 2 mm) and 50% ( e = 4 mm) for the series λ p , as well as by 40% ( e = 2 mm) and 62% ( e = 4 mm) for the series λ p l (average values).
From a mechanical point of view, the failure of the slender (reinforced) concrete columns was initiated by the loss of stability, but it can be limited by stress exceedance. Based on the normal stress equation for uniaxial bending, Schmidt and Curbach [37] derived an expression to determine the stress that either leads to the failure of the compression side or to failure on the tensile side of the cross-section due to a certain load eccentricity, including second-order theory effects. In the case of a column with hinged ends, the equation is defined as follows:
f c ( t ) m = F A ± M W = σ ± 3 · e L · λ · σ cos σ E · λ 2
with:
f c m / f c t m = Failure stress on the compressed/stretched cross-sectional side
F , M = Normal force, Moment
A , W = Cross-sectional area, Section modulus
L , λ = Column length, Slenderness ratio
σ , E = Uniformly distributed compressive stress, Modulus of elasticity
e= Load eccentricity
Using the material properties of the concrete from Table 3, the critical stress can be plotted in a σ λ diagram. In Figure 14, the corresponding failure limits for the eccentricities of 2 and 4 mm are represented by the yellow and purple lines, respectively. The changes in the directions of the curves mark the changes in the governing failure mechanisms.
All of the critical stresses determined from the experiments are also displayed in Figure 14, which are marked by gray, yellow, and purple dots. Except for the gray results ( e = 0 mm) from the series λ p and λ p l , they showed good overall agreement with the corresponding failure limit lines. Looking at the results from the tests with the load eccentricity, it can be seen that most of them were close to the dashed lines of the failure curves, which indicates that the exceeding of the tensile strength was responsible for failure. All of the corresponding specimens failed due to large deflections in the same way as what was shown in Figure 11a. This also applied to the samples of the series λ e l 0 . It is assumed that these specimens were prevented from undergoing local failure by the carbon reinforcement. All of the other samples failed due to rupture, usually with prior concrete spalling. It can be concluded that, regardless of the slenderness ratio, the failure mechanisms that occurred correlated with the maximum stresses reached.

4. Conclusions

Numerous studies of nonmetallically reinforced concrete have focused on the fundamental cross-sectional behavior under tension, compression, bending, and shear, but experimental data and systematic investigations of the stability behavior are sparse.
In this paper, the structural behavior of specimens under uniaxial compressive loading has been investigated. First, a small experimental study was conducted on nonreinforced and carbon-reinforced short, disk-shaped samples with two different length-to-width ratios, where typical brittle material failures under high stresses were observed. The tests served for the material characterization, which made it possible to subsequently determine the slenderness ratios of interest for the buckling tests.
Afterwards, a larger campaign was performed on slender specimens to evaluate the buckling behavior. The presented study shows the results of buckling tests on CRC specimens with different slenderness ratios. A wide range between 61 < λ < 131.5 was chosen for this investigation, as it is not yet clear what slenderness ratios we will be dealing with in the future with the newly developed design strategies in carbon-reinforced concrete construction. Based on the DIC measurements, the functionality of the support construction was evaluated, thus proving that the specimens featured hinged ends. Hence, it was considered that the effective buckling length corresponded to the actual distance between the end supports. The samples exhibited the predicted behavior of slender, imperfect members subjected to compression, with lateral displacements from the beginning of the load application. Despite the sudden occurrence of the large deflections or even the rupture of the specimens, the failure was indicated by an increasingly stagnant load growth. It could be proven that centrally pressed CRC specimens with high slenderness ratios behave in a good approximation to the mechanical buckling theory according to Euler. The variation in the load eccentricity resulted in a reduction of the load bearing capacity due to larger induced bending moments. Nevertheless, these results were satisfactory, as the failure stresses from the CRC specimens could be calculated with sufficient accuracy using a second-order theory approach.
Further experimental investigations are required in order to gain deeper insight into the plastic buckling behavior of CRC specimens. Moreover, other geometrical and structural imperfections, such as the precurvature of the sample, the misalignment of the nonmetallic reinforcement, or a varying grain distribution across the cross section, will be investigated in the future to examine their effects on the maximum bearable buckling load and to provide a comprehensive assessment of the buckling behavior of slender CRC members subjected to compressive stress. Based on the investigations, the reduction factors for predicting the decrease in the buckling strength compared to ideal structures will be proposed.
The slenderness ratio above which stability failure becomes critical to material failure depends essentially on the concrete quality. In particular, higher-strength concretes, such as those used with nonmetallic reinforcement, are significantly more susceptible to stability failure, because the elastic modulus grows more slowly relative to the compressive strength as the concrete strength class increases. Thus, for slender members under compression, the high strength of the material is far from being exploited. Therefore, future studies will also focus on the prestressing of slender CRC members, as this provides an indirect increase in the stiffness of the component due to the additional compressive stresses that cause cracking to occur only at much higher bending loads. A promising method for thin CRC structures is chemical prestressing. In this technique, a special additive is added to the concrete mix, thus causing the cementitious matrix to expand and the reinforcement to stretch. As a result, compressive stresses are applied to the concrete. Their application in CRCs is currently being investigated and optimized within the framework of the CRC/TRR280.

Author Contributions

Conceptualization, M.C., J.G. and B.B.; methodology, M.C. and J.G.; validation, J.G.; formal analysis, J.G.; investigation, M.C. and J.G.; resources, M.C. and S.M.; data curation, J.G.; writing—original draft preparation, J.G.; writing—review and editing, B.B.; visualization, J.G.; supervision, F.S. and M.C.; project administration, F.S.; funding acquisition, M.C., B.B. and F.S. All authors have read and agreed to the published version of the manuscript.

Funding

The research work presented in the publication has been funded by the Deutsche Forschungsgemeinschaft (DFG, German Research Foundation)—CRC/TRR 280; project ID: 417002380.

Data Availability Statement

The data presented in this study are available upon request from the corresponding author. The data are not publicly available due to this work being part of an ongoing study.

Acknowledgments

The project is funded by the Deutsche Forschungsgemeinschaft (DFG, German Research Foundation)—CRC/TRR 280 (project ID 417002380, project C04). The authors would like to thank the funding authority for their financial support, as well as the staff of the OML, for their support extended during the experimental works carried out in the laboratory.

Conflicts of Interest

The authors declare no conflict of interest. The funders had no role in the design of the study; in the collection, analyses, or interpretation of data; in the writing of the manuscript; or in the decision to publish the results.

References

  1. Sizirici, B.; Fseha, Y.; Cho, C.S.; Yildiz, I.; Byon, Y.J. A Review of Carbon Footprint Reduction in Construction Industry, from Design to Operation. Materials 2021, 14, 6094. [Google Scholar] [CrossRef]
  2. Monteiro, P.J.M.; Miller, S.A.; Horvath, A. Towards sustainable concrete. Nat. Mater. 2017, 16, 698–699. [Google Scholar] [CrossRef]
  3. Reichenbach, S.; Preinstorfer, P.; Hammerl, M.; Kromoser, B. A review on embedded fibre-reinforced polymer reinforcement in structural concrete in Europe. Constr. Build. Mater. 2021, 307, 124946. [Google Scholar] [CrossRef]
  4. Valeri, P.; Guaita, P.; Baur, R.; Fernández Ruiz, M.; Fernández-Ordóñez, D.; Muttoni, A. Textile reinforced concrete for sustainable structures: Future perspectives and application to a prototype pavilion. Struct. Concr. 2020, 21, 2251–2267. [Google Scholar] [CrossRef]
  5. Spelter, A.; Bergmann, S.; Bielak, J.; Hegger, J. Long-Term Durability of Carbon-Reinforced Concrete: An Overview and Experimental Investigations. Appl. Sci. 2019, 9, 1651. [Google Scholar] [CrossRef]
  6. Dahlhoff, A.; Morales Cruz, C.; Raupach, M. Influence of Selected Impregnation Materials on the Tensile Strength for Carbon Textile Reinforced Concrete at Elevated Temperatures. Buildings 2022, 12, 2177. [Google Scholar] [CrossRef]
  7. Kalthoff, M.; Raupach, M.; Matschei, T. Extrusion and Subsequent Transformation of Textile-Reinforced Mortar Components—Requirements on the Textile, Mortar and Process Parameters with a Laboratory Mortar Extruder (LabMorTex). Buildings 2022, 12, 726. [Google Scholar] [CrossRef]
  8. Bhattacherjee, S.; Basavaraj, A.S.; Rahul, A.; Santhanam, M.; Gettu, R.; Panda, B.; Schlangen, E.; Chen, Y.; Copuroglu, O.; Ma, G.; et al. Sustainable materials for 3D concrete printing. Cem. Concr. Compos. 2021, 122, 104156. [Google Scholar] [CrossRef]
  9. Mota, B.; Matschei, T.; Scrivener, K. Impact of sodium gluconate on white cement-slag systems with Na2SO4. Cem. Concr. Res. 2019, 122, 59–71. [Google Scholar] [CrossRef]
  10. Dhahir, M.K.; Kalthoff, M.; Neef, T.; Friese, D.; Beckmann, B.; Chokri, C.; Matschai, T.; Mechtcherine, V.; Marx, S. Developing the Chemical Prestressing Technology for Textile Carbon Reinforced Concrete. In Proceedings of the Fib Symposium 2023—Building for the Future: Durable, Sustainable, Resilient, Istanbul, Turkey, 5–7 June 2023; Ilki, A., Çavunt, D., Çavunt, Y.S., Eds.; Springer: Cham, Switzerland, 2023; pp. 1273–1282. [Google Scholar] [CrossRef]
  11. Spartali, H.; Hegger, J.; Chudoba, R. Phenomenological comparison between the flexural performance of steel- and CFRP-reinforced concrete elements. Eng. Struct. 2023, 294, 116755. [Google Scholar] [CrossRef]
  12. Beckmann, B.; Bielak, J.; Bosbach, S.; Scheerer, S.; Schmidt, C.; Hegger, J.; Curbach, M. Collaborative research on carbon reinforced concrete structures in the CRC/TRR 280 project. Civ. Eng. Des. 2021, 3, 99–109. [Google Scholar] [CrossRef]
  13. Vakaliuk, I. Use of pervading internal shell-type substructures to dissolve compact components. In Proceedings of the Beiträge zum 61. Forschungskolloquium mit 9. Jahrestagung des DAfStb, Dresden, Germany, 26–27 September 2022; TU Dresden: Dresden, Germany, 2022; pp. 179–184. [Google Scholar] [CrossRef]
  14. Chudoba, R.; Spartali, H.; Niemeyer, A.C.; Robertz, D.; Plesken, W. Description of the origami waterbomb cell kinematics as a basis for the design of thin-walled oricrete shells. In Inspiring the Next Generation, Proceedings of IASS 2020/21, Guilford, UK, 23–27 August 2021; Behnejad, A., Parke, G., Samavati, O., Eds.; IASS: Madrid, Spain, 2021; pp. 2681–2689. [Google Scholar] [CrossRef]
  15. Brockmann, T. Mechanical and Fracture Mechanical Properties of Fine Grained Concrete for Textile Reinforced Composites. Ph.D. Dissertation, RWTH Aachen University, Aachen, Germany, 2006. [Google Scholar]
  16. Bochmann, J. Carbonbeton unter Einaxialer Druckbeanspruchung. Ph.D. Dissertation, Technische Universität Dresden, Dresden, Germany, 2019. [Google Scholar]
  17. Bosbach, S.; Bielak, J.; Schmidt, C.; Hegger, J.; Classen, M. Influence of Transverse Tension on the Compressive Strength of Carbon Reinforced Concrete. In Proceedings of the 11th International Conference on Fiber-Reinforced Polymer (FRP) Composites in Civil Engineering (CICE 2023), Rio de Janeiro, Brazil, 23–26 July 2023. [Google Scholar] [CrossRef]
  18. Betz, P.; Marx, S.; Curbach, M. Einfluss von Querzugspannungen auf die Druckfestigkeit von Carbonbeton. Beton Stahlbetonbau 2023, 118, 524–533. [Google Scholar] [CrossRef]
  19. Yoo, C.H.; Lee, S.C. Stability of Structures: Principles and Applications; Elsevier; Butterworth-Heinemann: Amsterdam, The Netherlands, 2011. [Google Scholar]
  20. Leonhardt, F.; Mönnig, E. (Eds.) Vorlesungen über Massivbau; Springer: Berlin/Heidelberg, Germany, 1973. [Google Scholar] [CrossRef]
  21. Agüero, A.; Pallarés, L.; Pallarés, F.J. Equivalent geometric imperfection definition in steel structures sensitive to flexural and/or torsional buckling due to compression. Eng. Struct. 2015, 96, 160–177. [Google Scholar] [CrossRef]
  22. Ferreira Filho, J.O.; Tankova, T.; Carvalho, H.; Martins, C.; Da Simões Silva, L. Experimental and numerical flexural buckling resistance of high strength steel columns and beam-columns. Eng. Struct. 2022, 265, 114414. [Google Scholar] [CrossRef]
  23. Euler, L. Methodus Inveniendi Lineas Curvas Maximi Minimive Proprietate Gaudentes: Additamentum I: De Curvis Elasticis; Marcum-Michaelem Bousquet: Lausanne, Switzerland; Geneva, Switzerland, 1744. [Google Scholar]
  24. Shamass, R. Plastic Buckling Paradox: An Updated Review. Front. Built Environ. 2020, 6, 35. [Google Scholar] [CrossRef]
  25. Mang, H.A.; Hofstetter, G. Festigkeitslehre, 4th ed.; Springer: Berlin/Heidelberg, Germany, 2013. [Google Scholar]
  26. Alonso dos Santos, F.C. Behavior of Textile Reinforced Concrete (TRC) Slender Columns Subject to Compression. Master’s Dissertation, Pontifíca Universidade Católica do Rio de Janeiro, Rio de Janeiro, Brazil, 2018. [Google Scholar]
  27. Deutscher Ausschuss für Stahlbeton. DAfStb-Richtlinie Betonbauteile mit nichtmetallischer Bewehrung. In Proceedings of the 61. Forschungskolloquium mit 9. Jahrestagung des DAfStb, Dresden, Germany, 26–27 September 2022. [Google Scholar]
  28. Solidian GmbH. Data Sheet of Solidian GRID Q85-CCE-21-E5; Solidian GmbH: Albstadt, Germany, 2021. [Google Scholar]
  29. Schneider, K.; Butler, M.; Mechtcherine, V. Carbon Concrete Composites C3—Nachhaltige Bindemittel und Betone für die Zukunft. Beton Stahlbetonbau 2017, 112, 784–794. [Google Scholar] [CrossRef]
  30. DIN EN 206:2021-06; Concrete—Specification, Performance, Production and Conformit. Deutsches Institut für Normung: Berlin, Germany, 2021.
  31. DIN EN 196-1:2016-11; Methods of Testing Cement—Part 1: Determination of Strength. Deutsches Institut für Normung: Berlin, Germany, 2016.
  32. DIN EN 12390-13:2021-09; Testing Hardened Concrete—Part 13: Determination of Secant Modulus of Elasticity in Compression. Deutsches Institut für Normung: Berlin, Germany, 2021.
  33. Bochmann, J.; Curbach, M.; Jesse, F. Experimental Determination of the Stress-Strain Relation of Fine Grained Concrete under Compression. In Proceedings of the Eleventh High Performance Concrete (11th HPC) and the Second Concrete Innovation Conference (2nd CIC), Tromso, Norway, 6–8 March 2017. [Google Scholar]
  34. Kaplan, M. Strains and Stresses of Concrete at Initiation of Cracking and Near Failure. ACI J. Proc. 1963, 60, 853–880. [Google Scholar] [CrossRef]
  35. Chen, W.F.; Saleeb, A.F. Constitutive Equations for Engineering Materials, Revised Edition; Studies in Applied Mechanics; Elsevier: Amsterdam, The Netherlands, 1994; Volume 37A. [Google Scholar]
  36. Giese, J.; Spartali, H.; Beckmann, B.; Schladitz, F.; Chudoba, R. Experimental Investigation on the Buckling Behavior of Slender TRC Structures. In Proceedings of the Fib Symposium 2023—Building for the Future: Durable, Sustainable, Resilient, Istanbul, Turkey, 5–7 June 2023; Ilki, A., Çavunt, D., Çavunt, Y.S., Eds.; Springer: Cham, Switzerland, 2023; pp. 1398–1407. [Google Scholar] [CrossRef]
  37. Schmidt, A.; Curbach, M. Zentrische Druckversuche an schlanken UHPC-Stützen. Beton Stahlbetonbau 2016, 111, 588–602. [Google Scholar] [CrossRef]
Figure 2. Types of buckling problems: (a) Bifurcation-type buckling; (b) Deflection-amplification-type buckling.
Buildings 13 02489 g002
Figure 3. The σ λ diagram with results of a study on the buckling stability of CRC columns by Alonso dos Santos [26], including ideal failure limit lines. (a) I-section and hinged ends. (b) Rectangular cross-section and clamped ends.
Buildings 13 02489 g003
Figure 4. Production of the CRC samples. (a) Casting process. (b) Clamping of nonmetallic reinforcement grid on the edge of the formwork.
Buildings 13 02489 g004
Figure 5. Uniaxial compression tests. (a) Steel brush used for load application (photo: S. Groeschel, TU Dresden). (b) Sample configurations. (c) Test setup with CRC sample (20 × 10 × 2.6 cm3).
Buildings 13 02489 g005
Figure 6. Construction for load application. (a) Close-up of support situation with symmetrical steel profile for centric load introduction. (b) Variations in the steel profiles for different load eccentricities.
Buildings 13 02489 g006
Figure 7. Setup for buckling tests. (a) Schematic sample setup. (b) Specimen ( λ = 125) with speckle pattern in the testing machine. (c) Whole test setup with 1—CRC sample; 2—LDTV; 3—stereo camera system; and 4—blue LED light.
Buildings 13 02489 g007
Figure 8. Results of compression tests. (a) Rectangular disk specimen after compression failure. (b) Ultimate stresses of specimens.
Buildings 13 02489 g008
Figure 9. Stress–strain relations. (a) Square disk specimens. (b) Rectangular disk specimens.
Buildings 13 02489 g009
Figure 10. Derivation of the threshold slenderness ratio λ p separating plastic and elastic buckling (left— σ λ diagram), which was derived from the proportionality limit σ p of the mean CRC stress–strain behavior (right— σ ϵ diagram).
Buildings 13 02489 g010
Figure 11. Comparison of experimental and theoretical (sinusoidal) bending lines. (a) Right before and after failure; displayed for sample λ e l 0 1 . (b) Before failure; displayed for one sample of each investigated slenderness ratio.
Buildings 13 02489 g011
Figure 12. Stress–deflection curves for different load eccentricities and slenderness ratios: (a) λ 125; (b) λ 85; and (c) λ 62.
Buildings 13 02489 g012
Figure 13. Comparisons of ideal critical stress (left bar) and actual ultimate stress (right bar).
Buildings 13 02489 g013
Figure 14. Experimental results with failure limits according to second-order theory in comparison with the ideal limits for Euler buckling and material failure.
Buildings 13 02489 g014
Table 1. Carbon reinforcement characteristics for solidian grid Q85/85-CCE-38-E5.
Geometrical Properties Acc. to [28] Warp and Weft Directions
Axial yarn spacing[mm]21
Yarn density[tex]3200
Cross-sectional area per yarn[mm2]1.81
Cross-sectional area of grid[mm2/m]85
Material properties (mean values) Determination on warp yarns
Ultimate tensile strength[MPa]4048
Ultimate strain[‰]16.1
Modulus of elasticity[MPa]245,500
Table 2. Mix design of the cementitious matrix for HF-2-190-2.
SubstanceContent [kg/m3]
Binder concept Variodur C Dyckerhoff815
Fine silica sand340
Sand 0–2 mm965
Superplasticizer17
Water190
Table 3. Material properties of the utilized cementitious matrix.
Material PropertyMean Value [MPa]CoV [%]
Compressive strength111.52.66
Bending tensile strength12.613.65
Modulus of elasticity43,3752.36
Table 4. Number of experiments conducted for each test setup.
Compression Tests Buckling Tests
Reinforcement Load Eccentricity e
WithoutWith 0 mm2 mm4 mm
SQ33 λ e l 455
RE33 λ p 555
λ p l 355
12 43
Buildings 13 02489 i001
Table 5. Variation in sample lengths and resulting slenderness ratios.
Samples Compression TestsBuckling Tests
Length[mm]100200500 *680 *980 *
Slenderness ratio[-] 62 ( λ p l )85 ( λ p )125 ( λ e l )
* The value includes an additional length of 40 mm due to steel profiles that have been attached to the samples for the load application construction (see Section 2.4.2).
Table 6. Results of the uniaxial compression tests.
Series Square DisksRectangular Disks
NonreinforcedReinforcedNonreinforcedReinforced
Samples 123123123123
F u [kN]260.9301.0301.2309.7293.1306.7281.1294.6275.4261.7265.7291.4
A c [mm2]261826722737264926762540265527852688260226222714
σ u [MPa]99.7112.6110.1116.9109.5120.8105.9109.7102.5100.6101.3107.4
ϵ u [‰]2.562.813.443.353.073.762.842.942.742.552.602.82
Table 7. Results of the buckling tests.
SeriesLoad EccentricityNumberSlenderness RatioCritical Stress Acc. to EulerExperimental Critical StressStress RatioCentral Deflection
e  λ σ cr σ exp σ exp / σ cr w x , max
[mm][-][-][MPa][MPa][-][mm]
λ e l 01128.725.926.281.026.4
2127.226.528.981.096.4
3123.827.927.230.976.7
4131.524.824.530.996.4
21126.426.823.090.866.4
2127.226.520.560.786.3
3127.526.324.360.926.7
4123.328.223.730.846.7
5129.725.520.060.796.0
41122.828.413.540.484.8
2127.626.315.800.605.6
3121.928.814.520.505.0
4124.027.815.310.555.4
5122.528.514.650.515.6
λ p 0184.060.747.870.79−6.3 *
284.360.350.070.83−6.0 *
384.060.747.600.78−5.1 *
485.858.256.220.975.8
583.461.652.730.866.4
2185.958.033.000.575.5
285.458.731.480.545.6
385.159.136.280.615.6
482.962.336.820.595.6
583.062.236.500.595.5
4184.959.422.940.394.0
285.159.121.950.374.1
384.859.521.880.374.0
485.358.820.620.353.9
585.358.818.620.323.7
λ p l 0163.6106.088.400.836.2
262.9108.4100.200.925.2
362.7109.386.100.796.0
2161.8112.256.10.503.8
261.8112.058.40.524.1
361.4113.756.90.503.2
461.0114.957.30.503.1
561.3114.158.70.512.2
4163.1107.633.80.314.9
263.2107.235.70.334.3
363.6106.031.00.294.8
463.3107.033.10.314.4
563.1107.535.10.334.3
* These samples buckled in the opposite direction.
Disclaimer/Publisher’s Note: The statements, opinions and data contained in all publications are solely those of the individual author(s) and contributor(s) and not of MDPI and/or the editor(s). MDPI and/or the editor(s) disclaim responsibility for any injury to people or property resulting from any ideas, methods, instructions or products referred to in the content.

