Article

Fresh and Hardened Properties of Cementitious Composites Incorporating Firebrick Powder from Construction and Demolition Waste

by
Ozer Sevim
1,*,
Erdinc H. Alakara
2 and
Selahattin Guzelkucuk
3
1
Department of Civil Engineering, Kırıkkale University, Kırıkkale 71451, Türkiye
2
Department of Civil Engineering, Tokat Gaziosmanpasa University, Tokat 60150, Türkiye
3
Department of Civil Engineering, Kırsehir Ahi Evran University, Kırsehir 40360, Türkiye
*
Author to whom correspondence should be addressed.
Buildings 2023, 13(1), 45; https://doi.org/10.3390/buildings13010045
Submission received: 21 October 2022 / Revised: 13 December 2022 / Accepted: 20 December 2022 / Published: 25 December 2022

Abstract

:
Firebricks are generally used in furnace basins where glass, ceramics, and cement are produced. Firebricks have an important place in construction and demolition waste (CDW). However, there is a limited understanding of the effects on fresh and hardened state properties of cementitious composites. This study investigates the mechanical, physical, and microstructural properties of cementitious composites incorporating firebrick powder (FBP) from CDW. In this regard, the FBP was used at 5, 10, 15, 20, and 25% replacement ratio by weight of cement to produce cementitious composites. The consistency, setting characteristics, and 3, 7, and 28 days compressive and flexural strength tests of produced cementitious composites were performed. In addition, ultrasonic pulse velocity, water absorption, porosity, unit weight, and microstructure analysis of cementitious composites were conducted. As a result, the 28-day compressive strength of the cementitious composite mortars containing up to 10% firebrick powder remained above 42.5 MPa. The flow diameters increased significantly with the increase of the FBP. Therefore, it has been determined that the FBP can be used up to 10% in cementitious composites that require load-bearing properties. However, FBP might be used up to 25% in some cases. Using waste FBP instead of cement would reduce the amount of cement used and lower the cost of producing cementitious composites.

1. Introduction

Today, the construction sector is one area that benefits greatly from the developments in industry and technology. Concrete is the most preferred building material in construction [1]. Concrete, produced in more than 10 billion tons in the world every year, has many advantages in terms of workability, strength, and durability compared to other building materials [2]. One of the most important components determining the properties of concrete is cement. Cement is also the material with the highest cost in concrete production [3]. Cement production is a process that has huge environmental impacts in terms of raw material consumption, energy consumption, and high CO2 emissions. Approximately one ton of CO2 is released into the atmosphere during each ton of ordinary Portland cement (OPC) production [2]. Global cement production, responsible for around 8% of worldwide CO2 emissions, has increased more than 30 times since 1950 [4]. The high CO2 emissions of cement production have motivated researchers to conduct various research for a sustainable environment [5,6,7,8]. At the beginning of these studies is using construction and demolition wastes (CDW) together with cement. The most important aim of CDW is to reduce cement costs and CO2 emissions.
Technological developments in the construction industry have facilitated the demolition of structures. Large amounts of CDW occur during the demolition and rehabilitation phases in the construction industry [9]. CDW accounts for 30–40% of total municipal solid waste, corresponding to 10 billion tons of CDW each year worldwide [10]. Concrete and ceramic wastes constitute more than 50% of the total CDW worldwide [11]. These wastes cause adverse effects such as energy consumption, greenhouse gas emissions, water pollution, raw material consumption, and land occupation [12]. Brick wastes occupy an important place in CDWs. There are many studies on the use of different types of brick waste [13,14,15,16]. One of these wastes is firebrick (FB).
FBs, which have completed their service life and are demolished yearly to be replaced with new ones, have an important place in CDWs. FB is generally used in furnace basins where glass, ceramics, and cement are produced [17]. Therefore, recycling these wastes is of great importance for a sustainable environment. One of the best ways to deal with FB wastes is to use these wastes as aggregate or cement-based complementary material in concrete production. Nematzadeh et al. [18] investigated the compressive behavior of concrete containing fine recycled FB aggregate together with calcium aluminate cement (CAC) and polyvinyl alcohol (PVA) fibers under an acidic environment. In general, the results showed that the samples containing CAC together with PVA fibers showed suitable mechanical properties in terms of corrosion control against acid attack, while the samples containing fine FB aggregate performed quite poorly in this regard. Khattab et al. [19] investigated the high-temperature addition of FB aggregates, substituting 20% as coarse aggregate into concrete mixes. It has been determined that FB aggregate substituted concretes improve compressive strength at high temperatures. Kavas et al. [20] investigated using FB aggregate as a fine aggregate in mortar mixes. The high-temperature performance of the mortars prepared with FB aggregate containing magnesium chromite showed better performance when compared to the HCl absorption percentages control mortars. El-Didamony et al. [21] studied the pozzolanic activity of FBs containing calcium oxide. It has been determined that FB powder (FBP) used by substituting up to 20% by mass of ordinary Portland cement (OPC) has pozzolanic activity. Substitution of 5–10% FBP to OPC provided higher compressive strength than control mixes up to 90 days of cure time.
Firebricks have an important place in construction and demolition waste (CDW). However, there is a limited understanding of the effects on fresh and hardened state properties of cementitious composites. The literature studies on FB showed limited studies on using the powder form of firebrick obtained by grinding this waste as a supplementary cementitious material (SCM) [21,22,23]. In the studies, FB was generally used as an aggregate. In addition, in the studies conducted, no studies were found on the effect of FBP on the physical and mechanical properties such as setting time, workability, porosity, water absorption, unit weight, ultrasonic pulse velocity, flexural and compressive strength, and microstructure analyzes on cementitious composites.

2. Experimental Program

2.1. Materials

CEM I 42.5 R (OPC), ground waste FBP, standard sand, and tap water were used in cementitious composite production. The physical and chemical properties of the cement and FBP are given in Table 1. Table 1 shows that the ratios of SiO2 and Al2O3, which are important for pozzolanic reactions, are 51.43% and 37.46%, respectively.
Firebrick powder used in cementitious composite mortar mixtures was obtained by grinding waste firebricks from CDW. For this, the material, which was first turned into small pieces in the jaw crusher, was further reduced with the help of the mill. Finally, it was pulverized using a ball mill. Figure 1 shows the production of firebrick powder.

2.2. Methods

2.2.1. Sample Preparation

Cementitious composite mortars were produced per EN 196-1 [24] by substituting FBP at 0% (Control), 5, 10, 15, 20, and 25% by weight of cement. The water : binder ratio of the cementitious composite mortars remains constant at 0.50 in all mixture groups. A summary of the mixing proportions for different mixtures is given in Table 2.

2.2.2. Setting Time Test

Setting characteristics for cementitious composites incorporating FBP are determined according to EN 196-3 [25] standard. The initial and final setting times of six different cement composites were determined.

2.2.3. Consistency

This test aims to determine the workability of cementitious composite mortars incorporating FBP. The mortar mixtures, prepared according to the EN 196-1 [24] standard, were filled into the truncated cone mold on the flow table in two layers and were tamped twenty-five times in each layer. After the filling, the truncated conical mold was slowly lifted. Then flow table was stroked 25 times in 15 s per EN 12350-5 [26] by turning the shaking device. Finally, the flow diameters in both directions of the mortar were measured, and the average of these two results was accepted as the final flow diameter.

2.2.4. Unit Weight, Water Absorption, and Porosity Tests

Unit weight, water absorption, and porosity of all mixture groups were determined according to EN 480-5 [27]. The samples were kept in water curing for 28 days and removed from the curing pool. After the surfaces of the samples were dried with a cloth, the saturated surface dry weights were measured (W1). Then, to determine the weight of the samples in the air, they were dried in an oven at 110 °C for 24 h. After the samples taken out of the oven were cooled to room temperature, their weight in the air was measured (W0). W2 represents the weight of the sample in water. Then, unit weight, water absorption, and porosity results were calculated with the help of the formulas given in Equations (1)–(3). All measurements were carried out using three samples for each mixture group, and the obtained results were averaged to get the final result.
Unit   weight = W 0 V ,   ( g / cm 3 )
Water   absorption = W 1 W 0 W 0 × 100 ,   ( % )
Porosity = W 1 W 0 W 1 W 2 × 100 ,   ( % )  

2.2.5. Determination of Flexural and Compressive Strengths and Ultrasonic Pulse Velocity

The flexural and compressive strengths of the cementitious composite mortars incorporating FBP were determined per EN 196-1 [24]. The flexural strength results of 40 × 40 × 160 mm prismatic cementitious composite mortars were measured after water curing for 3, 7, and 28 days. Compressive strength results were measured using 40 × 40 mm samples obtained after the flexural strength test. Flexural and compressive strength tests were carried out at loading rates per EN 196-1 [24]. Ultrasonic pulse velocity of the cementitious composite mortars incorporating FBP was determined per EN 12504-4 [28]. An ultrasonic pulse velocity test of the cementitious composites was performed using the Proceq Pundit Lab+.

2.2.6. Microstructure Analysis

The microstructural analyses of 7- and 28-day Control, FBP5, and FBP10 samples were performed with scanning electron microscopy (SEM). Microstructure analyses of the cementitious composites were conducted using a Zeiss EVO 40XP SEM device. SEM analyses were performed on small samples obtained after compressive strength. Small samples were coated with gold to obtain clear images in SEM analyses.

3. Results and Discussion

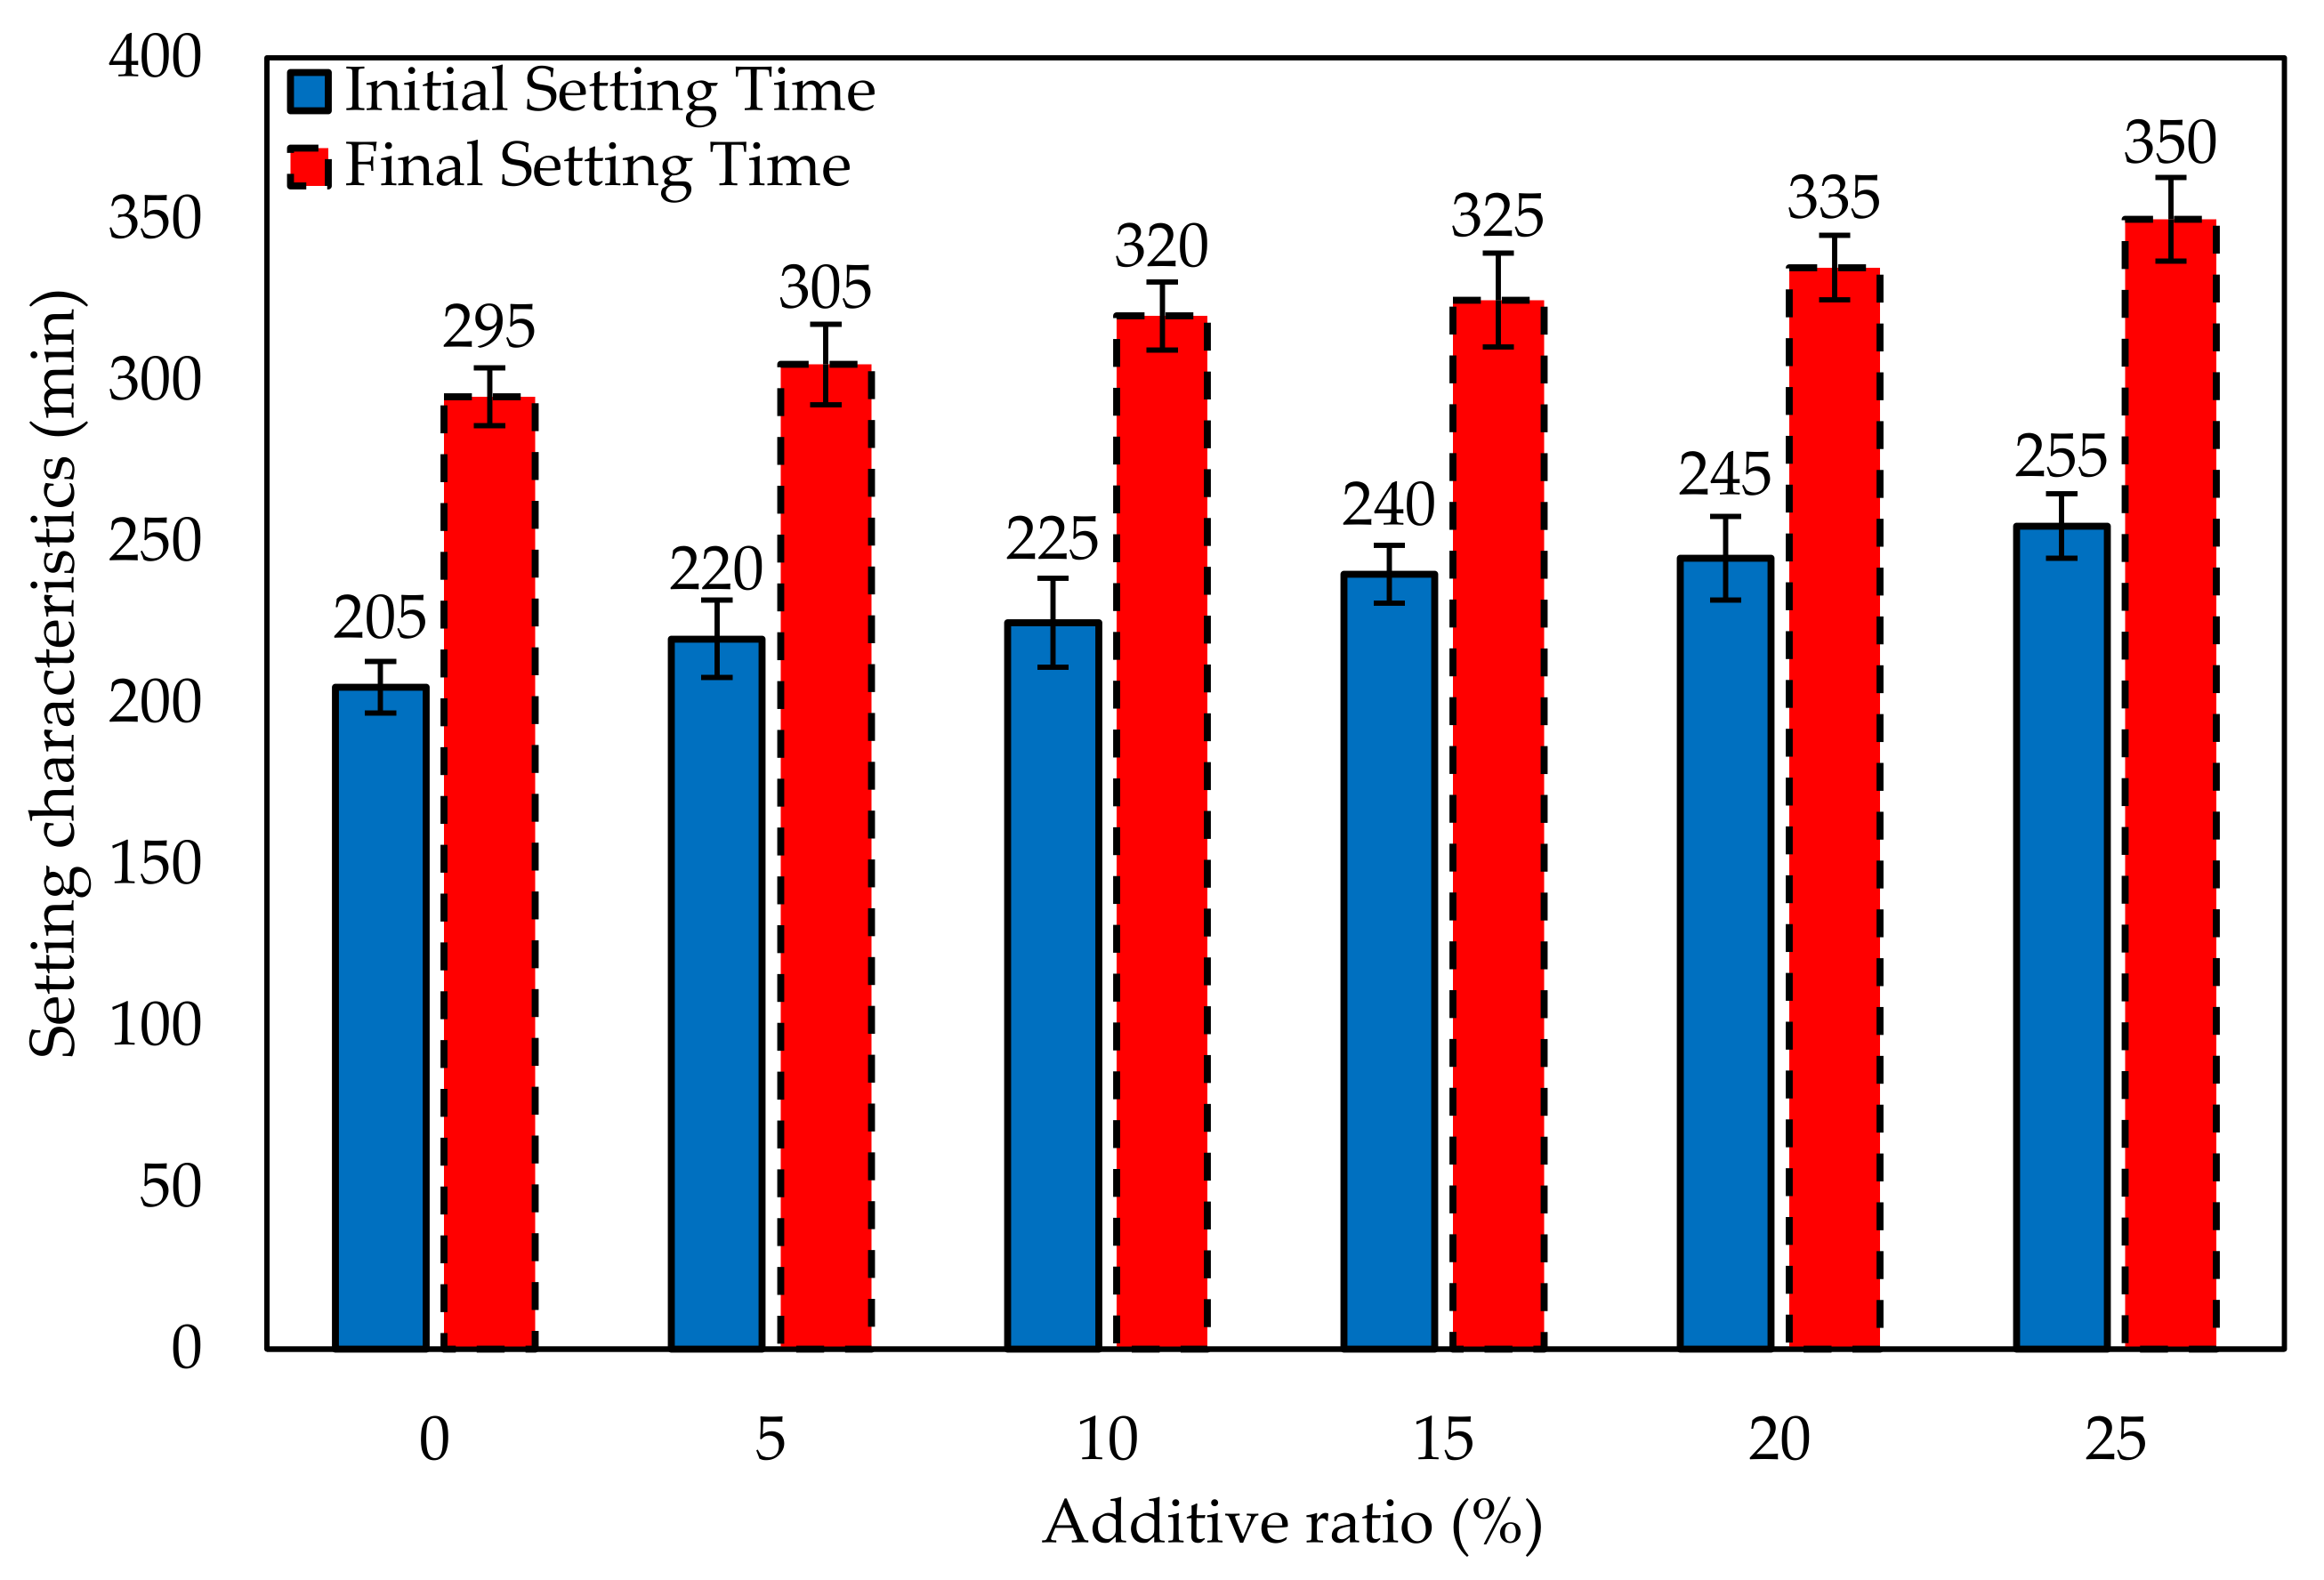
3.1. Setting Characteristics of Cementitious Composites

The test results of the initial and final setting times of cement composites incorporating FBP performed in complying with EN 196-3 [25] are shown in Figure 2.
As shown in Figure 2, it was observed that the initial and final setting times were prolonged with the increase in the FBP ratio. The main reason for this situation is the delayed beginning of hydration and the prolongation of setting times of pozzolans. Initial setting times of 5%, 10%, 15%, 20%, and 25% FBP substituted cement composites increased by 7.32, 9.76, 17.07, 19.51, and 24.39%, respectively, while the final setting times of 5, 10, 15, 20, and 25% FBP substituted cement composites increased by 3.39, 8.47, 10.17, 13.56, and 18.64%, respectively, compared to cement composites without FBP. Since the specific surface area of FBP is lower than that of cement and the particle size is larger, the initial and final times were prolonged as the FBP replacement ratio increased. This situation was similar to the studies conducted in [29,30] on the effect of SCM on the setting time of cement pastes.

3.2. Consistency of Results

The flow diameters of cementitious composite mortars incorporating FBP are shown in Figure 3. The results of the FBP-substituted cementitious composites show that the flow diameters increase with the replacement ratio. This situation is thought to be due to the specific surface area of FBP, as stated in [21]. The fact that the specific surface area of FBP is lower than cement reduces the water requirement for mortar mixtures. Since the amount of water was kept constant in all mixture groups, the flow diameters increased with the FBP replacement ratio. Flow diameters of FBP5, FBP10, FBP15, FBP20, and FBP25 samples increased by 7.69, 15.38, 19.23, 26.92, and 30.77%, respectively, compared to control mortars. FBP is a pozzolanic material and provides secondary hydration. As the pozzolanic reactions take place over long periods and are delayed, an excess of water is present during mixing and placement. This situation increases workability, as stated in [31,32].

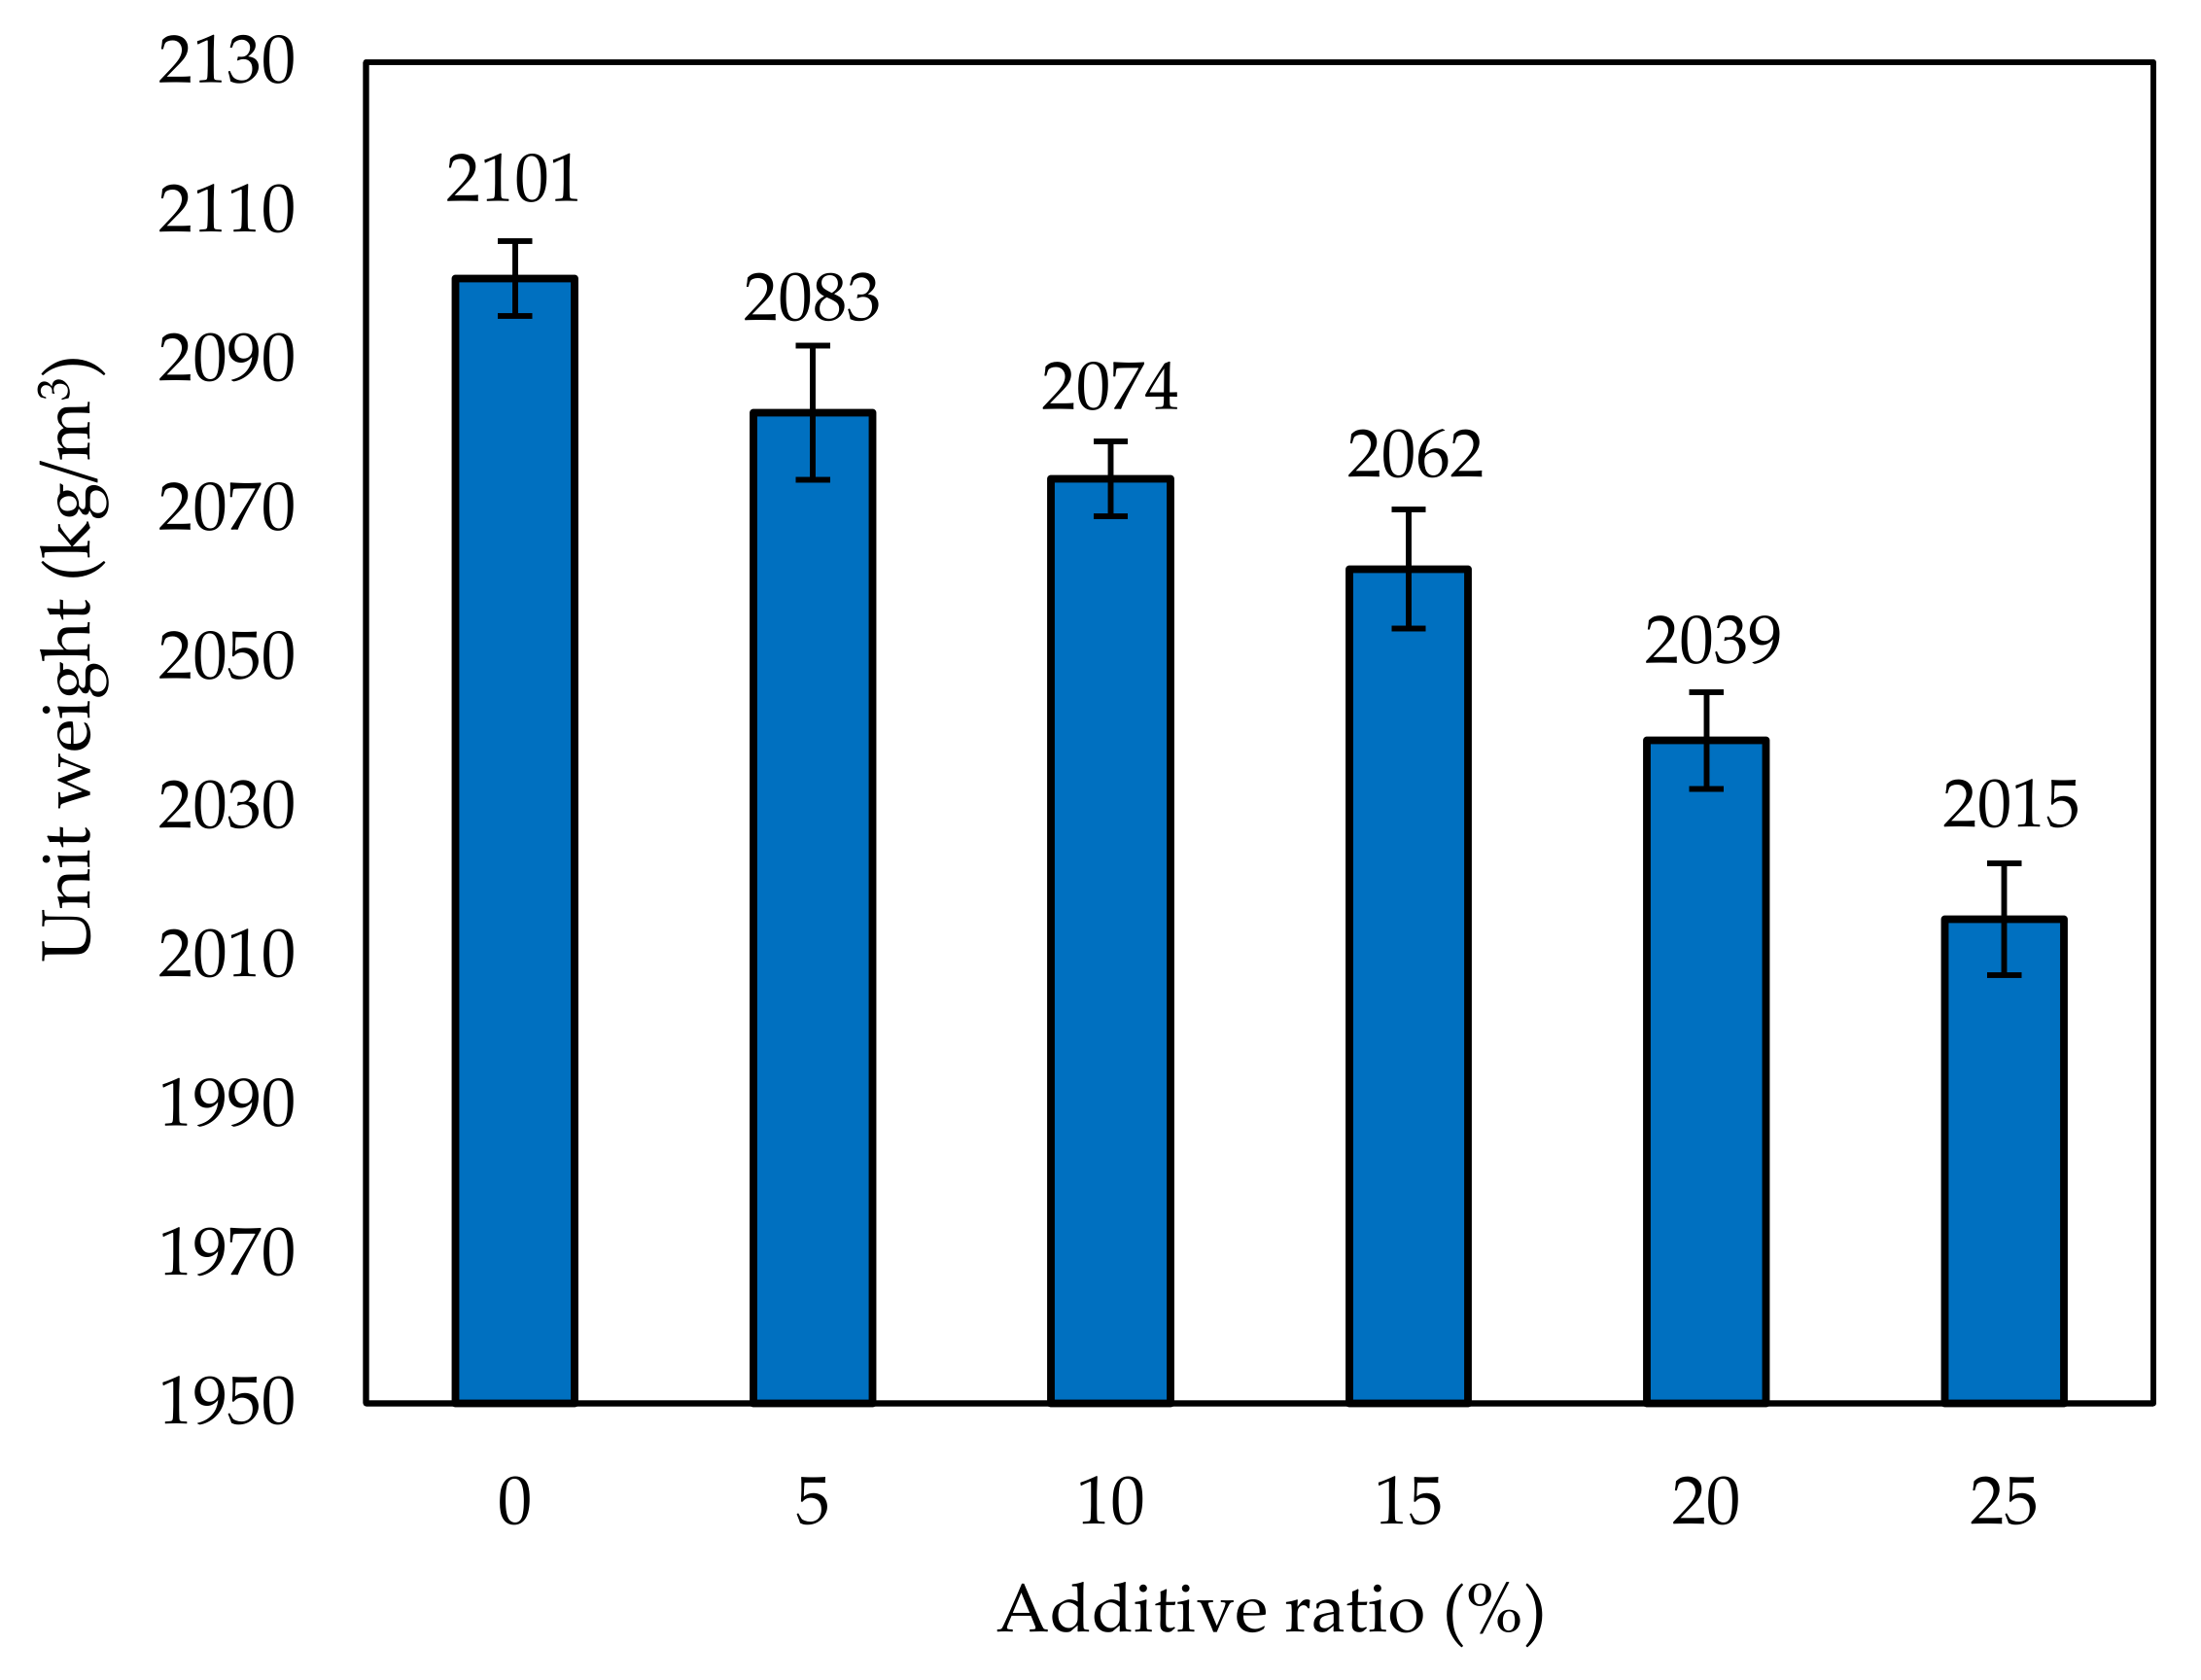
3.3. Unit Weight, Water Absorption, and Porosity Test Results

The porosity test results of the cementitious composite mortars incorporating FBP are shown in Figure 4. It was observed that the porosity results of the FBP-substituted cementitious composites increased with the increase in the FBP replacement ratio. The porosity test results of FBP5, FBP10, FBP15, FBP20, and FBP25 samples increased by 1.76, 4.57, 6.45, 8.63, and 11.15%, respectively, compared to control mortars.
The water absorption test results of the cementitious composite mortars incorporating FBP are given in Figure 5. It was observed that an increase was observed in the porosity results. It was observed that 25% FBP substituted cementitious composite mortars had the maximum water absorption results. It was also observed that there was an increase of 3.83, 6.47, 7.64, 11.31, and 14.51%, respectively, for 5, 10, 15, 20, and 25% FBP additive ratios, compared to the control sample.
Figure 6 shows the relationship between porosity and water absorption. The result showed a strong relationship between these two physical properties of the cementitious composite samples incorporating FBP.
The unit weight test results of the cementitious composite mortars incorporating FBP are shown in Figure 7. Since the unit weight is inversely proportional to the porosity and water absorption data, it is seen that the unit weight test results of the FBP substituted cementitious composite mortars, having high porosity and water absorption, are low. The highest unit weight result was obtained from the control sample without FBP. The unit weight test results of FBP5, FBP10, FBP15, FBP20, and FBP25 samples decreased by 0.86, 1.29, 1.86, 2.95, and 4.09%, respectively, compared to control mortars. With the increase in the FBP replacement ratio, the unit weights of cementitious composites decrease. This situation can be attributed to the fact that FBP has lower specific gravity than cement. Reducing the unit weight reduces dead loads in the structures, which is a beneficial effect, as mentioned in [33].
The results of porosity, water absorption, and unit weight are evaluated. The increase in porosity and water absorption values and decrease in unit weights with the rise of the FBP replacement ratio was attributed to the dilution of the OPC by FBP, which is present in higher amounts in the cementitious composite [21]. With increasing FBP content, C-S-H and C-A-S-H amounts decrease, hydration development slows down, and the porosity of cementitious composites increases.

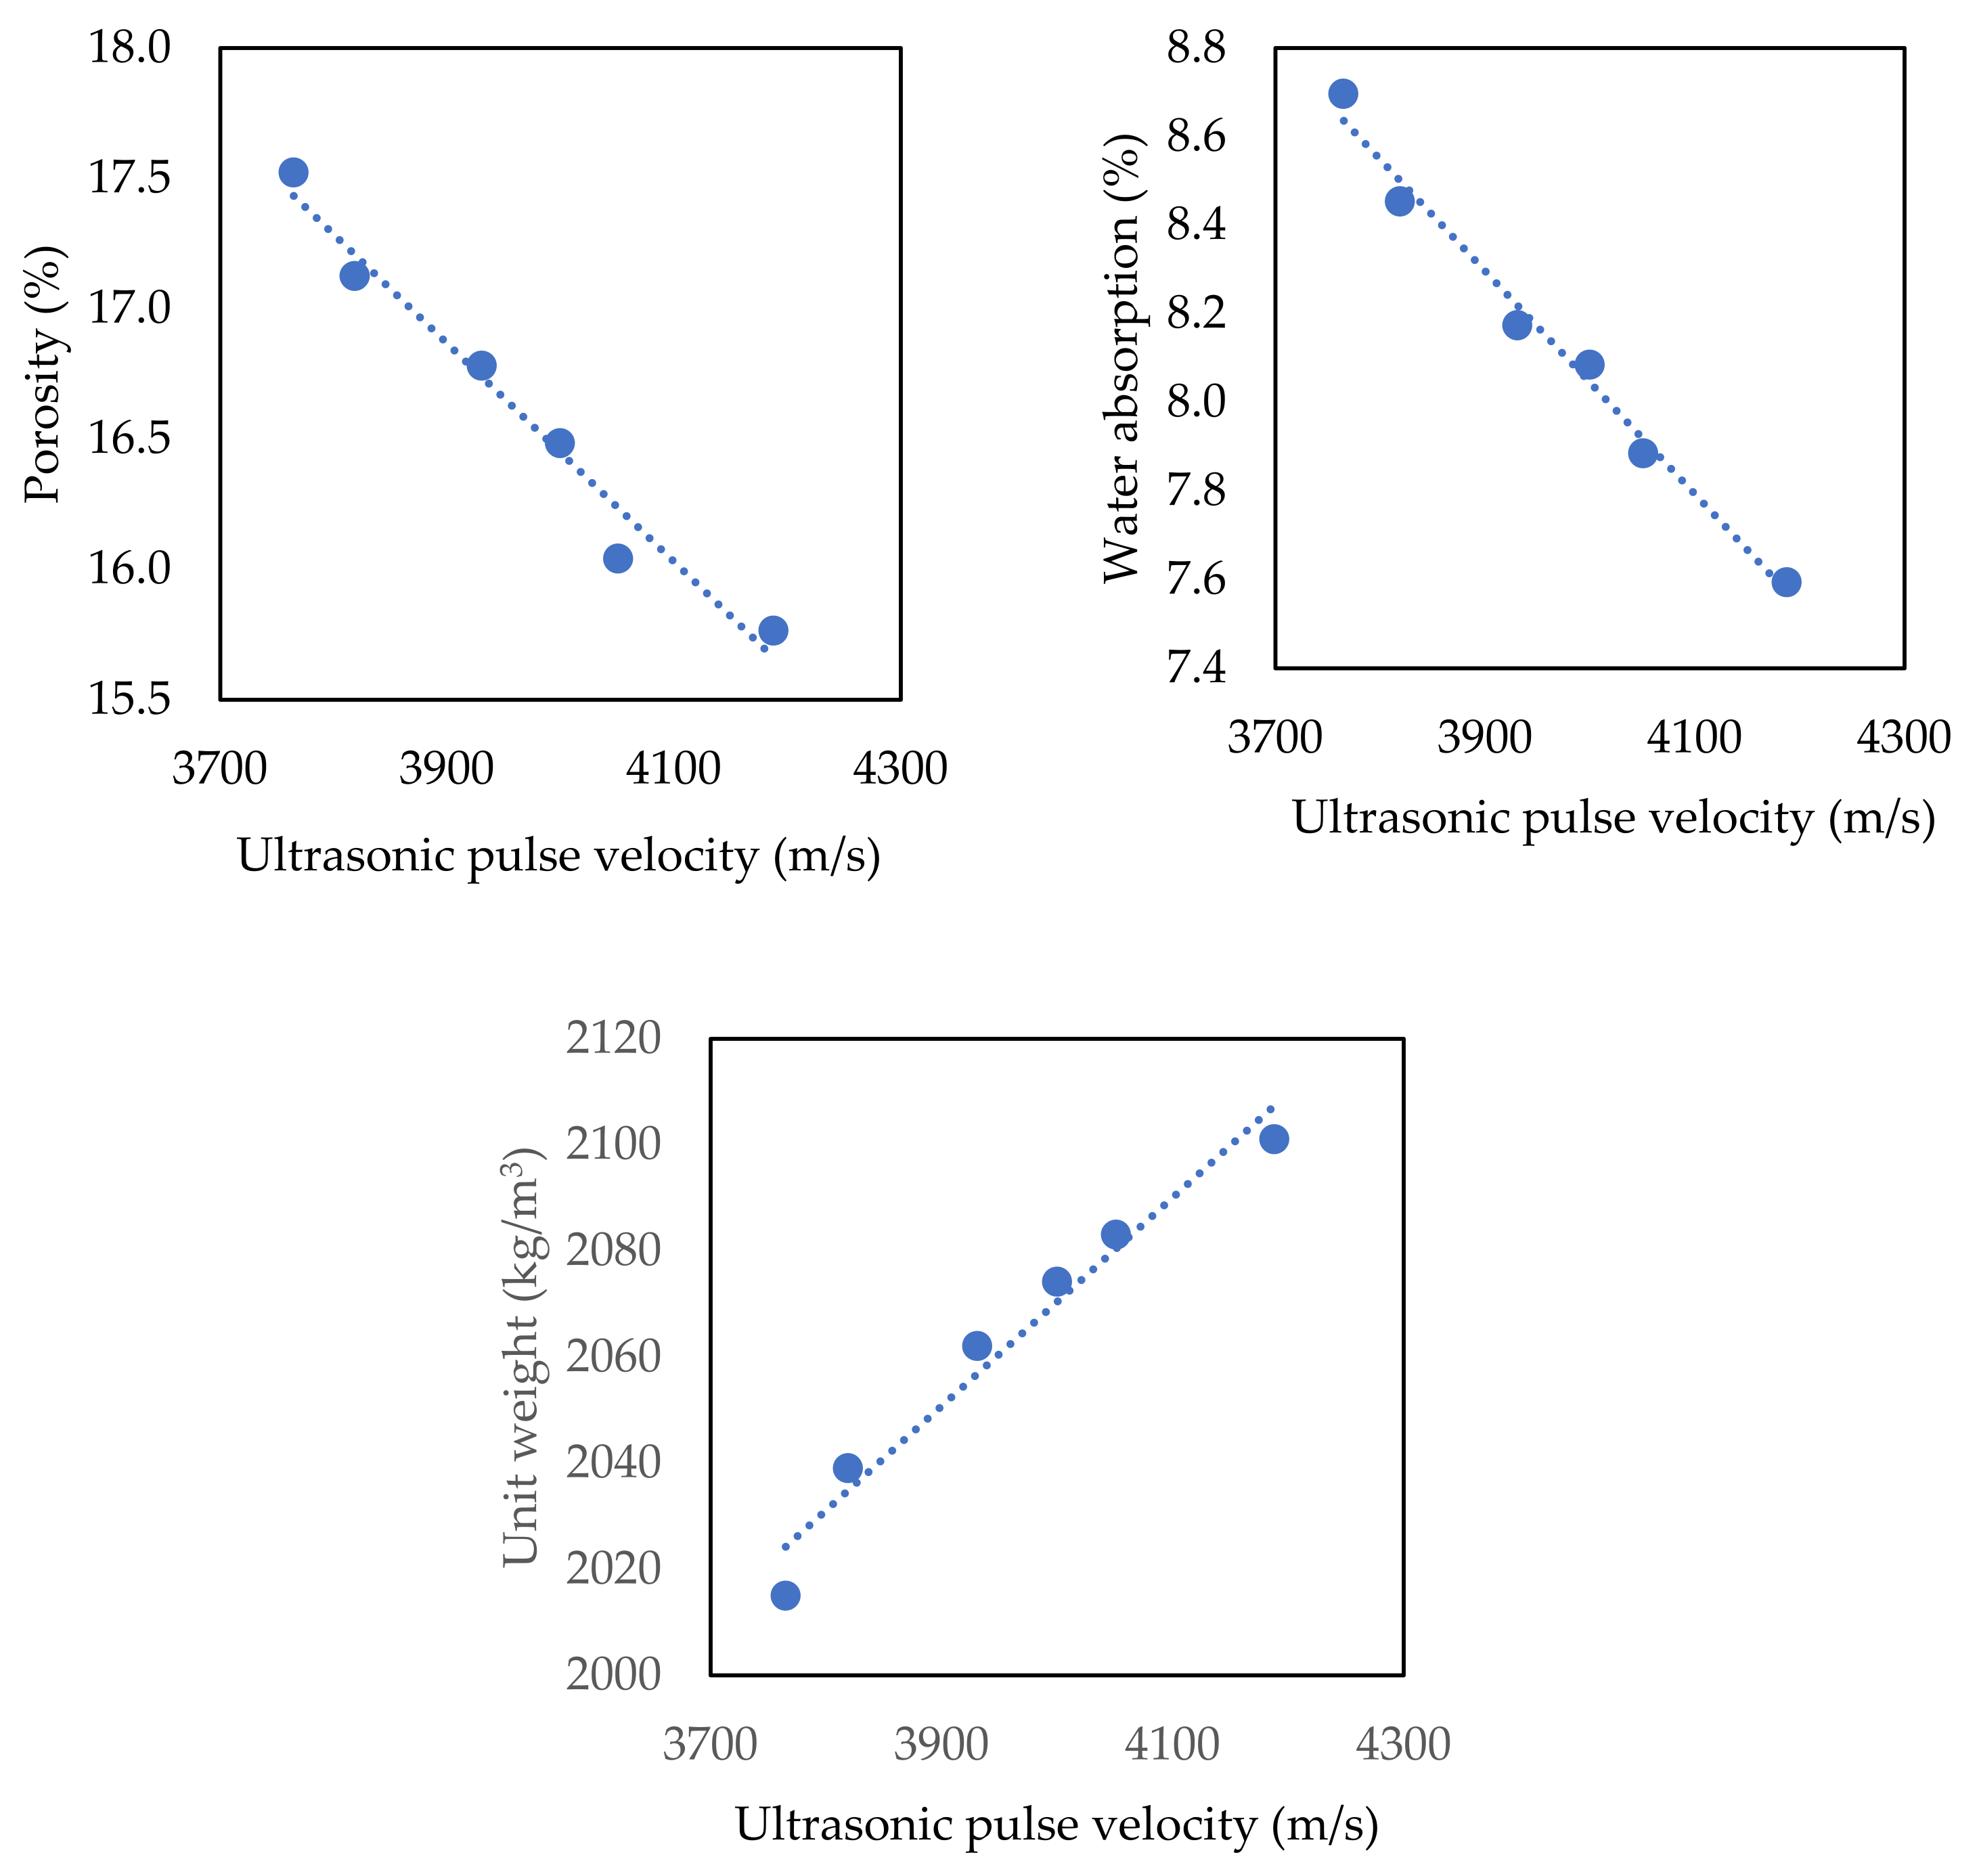
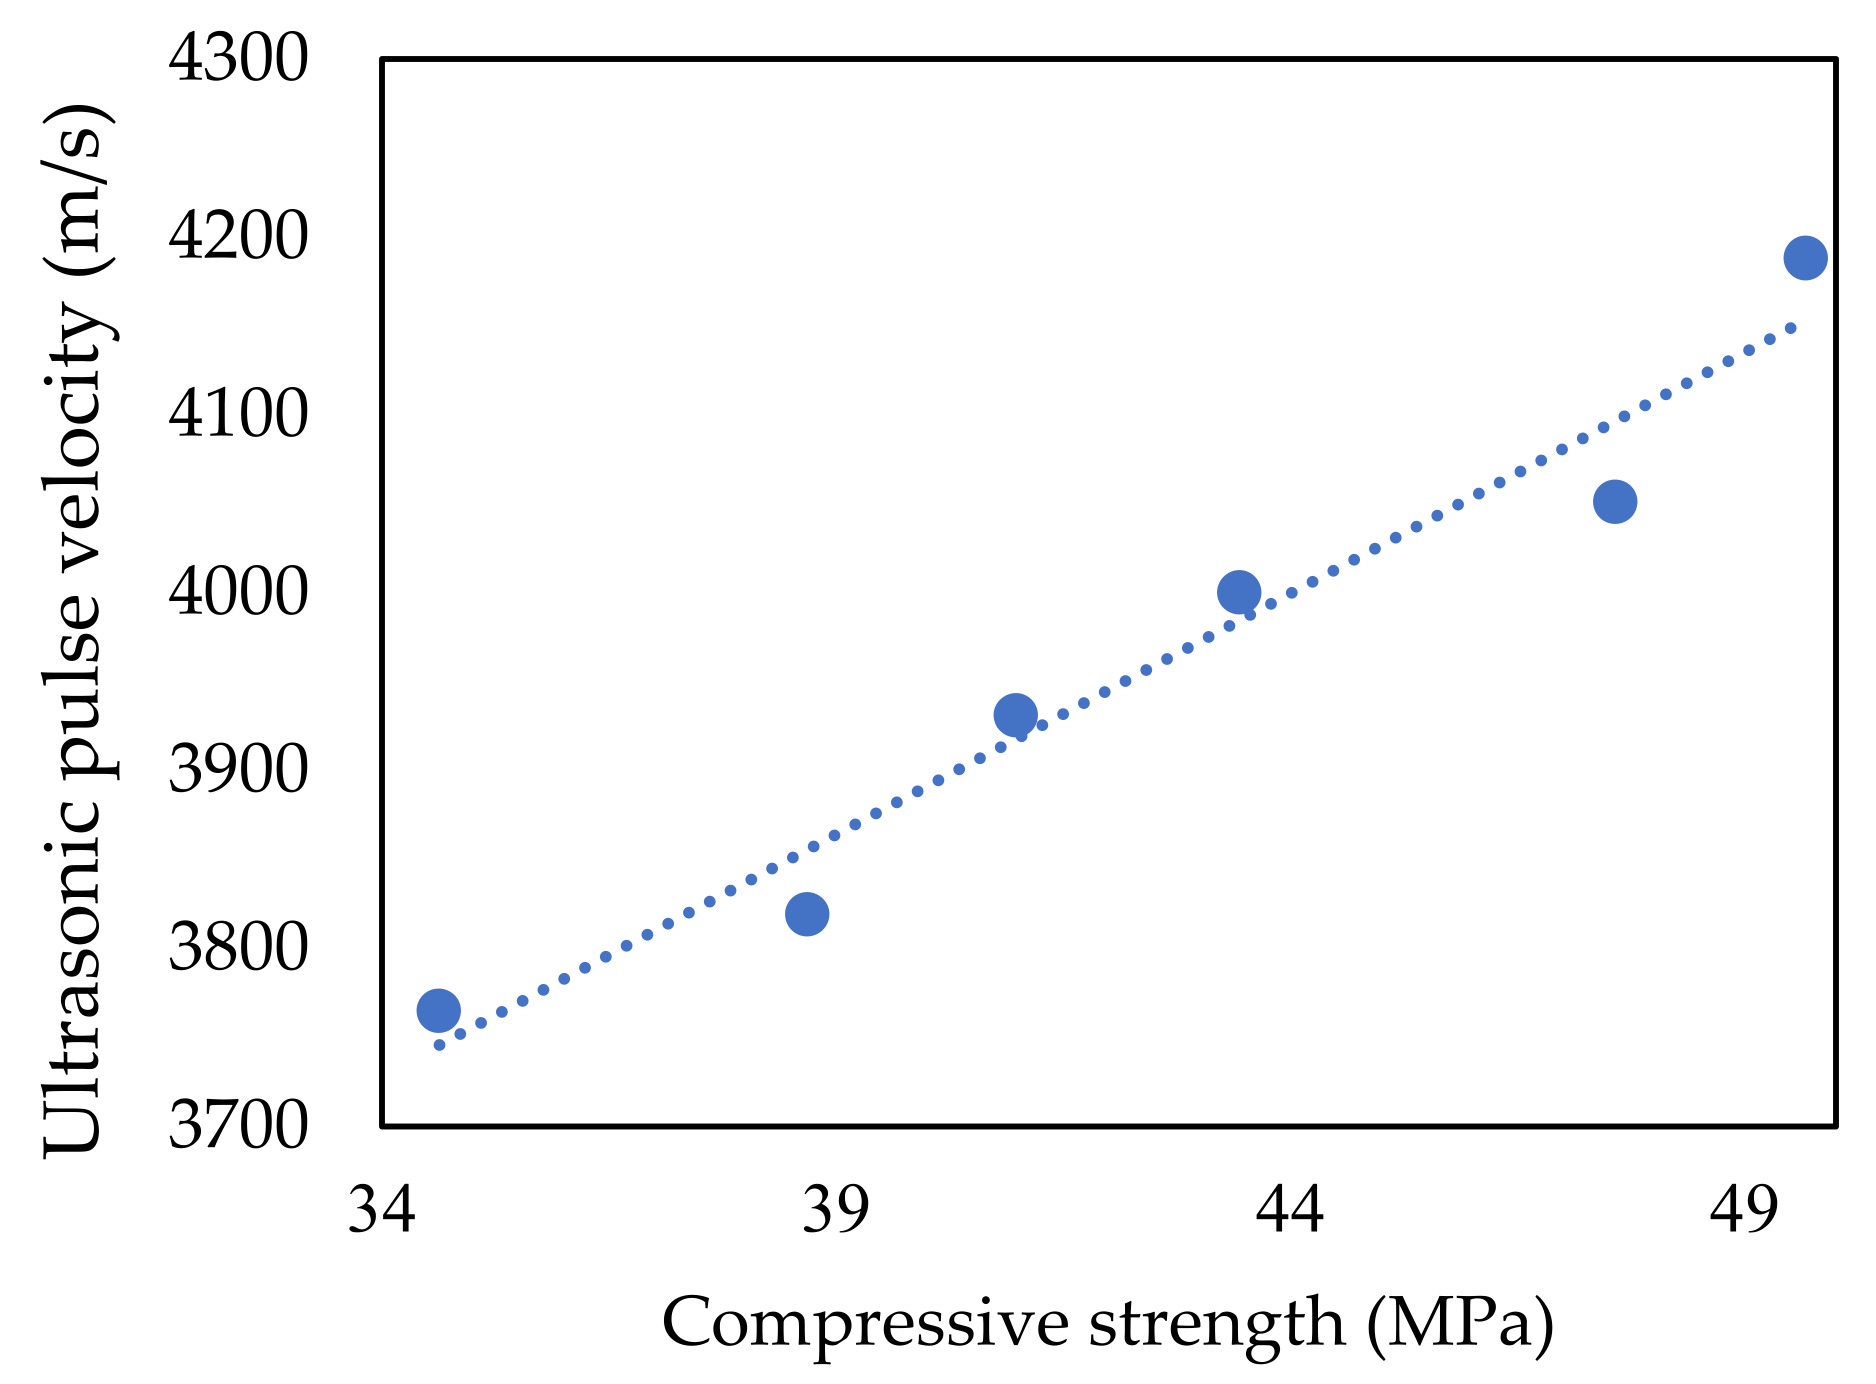
3.4. Ultrasonic Pulse Velocity Results

The ultrasonic pulse velocity test results performed on cementitious composite mortar samples incorporating FBP that have completed their 28-day curing period are shown in Figure 8. With the increase of FBP replacement ratios, decreases in ultrasonic pulse velocity test results were observed.
The relationship between the ultrasonic pulse velocity and the porosity, water absorption, and unit weight results are shown in Figure 9. Results showed a strong relationship between the physical properties of the cementitious composites incorporating FBP and the ultrasonic pulse velocity test results.
The ultrasonic pulse velocity (UPV) is transmitted through the solid phases. The UPV of cementitious materials has an inverse relationship to porosity, proportional to the volume fraction of the solid phase [34,35]. Therefore, as in Figure 9, UPV increased with increasing unit weight and decreasing porosity and water absorption. However, UPV has a nonlinear relationship with the FBP replacement ratio, as shown in Figure 8. In addition, the UPV of cementitious composites significantly depends on the microstructure and the densities of the samples as a result of the chemical reaction between cement, FBP, and water, as explained in [36].

3.5. Flexural Strengths Results

Figure 10 shows the flexural strength test results of cementitious composite mortars incorporating FBP after 3, 7, and 28 days of water curing, with the error bar indicating the standard deviation.
Results showed that the flexural strengths decreased as the FBP replacement ratio increased. While the 3-day flexural strength test results of FBP5, FBP10, FBP15, FBP20, and FBP25 samples decreased by 4.38, 11.35, 15.46, 19.56, and 25.99%, respectively, the 7-day flexural strength test results were reduced by 3.35, 6.47, 11.50, 15.69, and 19.88%, respectively, compared to control mortar. The 28-day flexural strength test results decreased by 2.17, 4.35, 8.70, 13.04, and 15.22% for FBP5, FBP10, FBP15, FBP20, and FBP25, respectively. When the reduction rates of flexural strength test results of cementitious composite mortars incorporating FBP compared to control mortar are examined, it is seen that the reduction rates decrease with increasing curing time. This situation proves that the strength of pozzolans increases over the 3-day strength. When the results of Figure 10 are evaluated, the flexural strength test results decreased with the increase of the FBP replacement ratio, but the strength gain rate showed continuous growth. This situation shows that the flexural strength test results of cementitious composites incorporating FBP can catch up to that of the control mortars at later ages [23]. In addition, the results proved once again that pozzolans complete their hydration late. The flexural strengths were similar to the study by Zeghad et al. [22]. Since there are limited studies on replacing FBP in cement, this section was evaluated by considering other studies on brick powder in the literature. Naceri and Hameri [37] reported that as the brick powder replacement ratio increased, the 7- and 28-day flexural strengths decreased compared to the reference mortars. They also determined that mortars containing 5 and 10% brick powder had higher flexural strength than reference mortars at 90-day flexural strengths. The linear decrease in the 28-day flexural strengths with the increase in the brick powder replacement rate was also seen in similar studies by Liu [38] and Xue et al. [39].

3.6. Compressive Strength Results

Figure 11 shows the compressive strength test results of cementitious composite mortars incorporating FBP after 3, 7, and 28 days of water curing, with the error bar indicating the standard deviation.
When the results were examined, the compressive strength decreased as the FBP replacement ratios increased. While the 3-day compressive strength test results of FBP5, FBP10, FBP15, FBP20, and FBP25 samples decreased by 6.88, 14.44, 18.73, 24.21, and 35.39%, respectively, the 7-day compressive strength test results decreased 5.99, 13.22, 17.55, 22.78, and 31.88%, compared to the control mortar. The 28-day compressive strength test results decreased by 4.21, 12.54, 17.50, 22.13, and 30.28%, respectively. This situation proves that the strength of pozzolans increases over the 3-day strength. Figure 12 shows the increment rate in compressive strength test results for each mixture group.
As shown in Figure 12, the 7-day increase rate percentages represent the increase according to 3-day compressive strength, while the 28-day increase rate percentages represent the increase according to 7-day compressive strength. Looking at the increase rates, both the 7-day and 28-day increase rates are higher than that of the control sample with the increase in FBP. Especially in the first days (7 days), the increase rate is higher compared to later ages. When the results of Figure 11 and Figure 12 are evaluated, although the compressive strengths decreased with the increase of the FBP replacement ratio, the strength gain rate showed a continuous increase as in the flexural strength. This situation again showed that the compressive strength test results of cementitious composite mortars incorporating FBP at prolonged days could catch up with the compressive strength of control mortars, as in flexural strength [23]. The compressive strength results were similar to the study by Zeghad et al. [22]. When the studies on the use of brick powder in cement-based composites are examined, the 28-day compressive strengths generally decrease with the increase in the brick powder replacement ratio [38,40]. With the rise of the FBP replacement ratio, the OPC in the cement-based composite is diluted, which reduces the amount of C-S-H, C-A-S-H, and CH. For this reason, the compressive strength of cementitious composites with additives decreases [21].
Figure 13 shows the relationship between ultrasonic pulse velocity and 28-day compressive strength results. According to this result, it is possible to say that there is a strong relationship between compressive strength and ultrasonic pulse velocity.

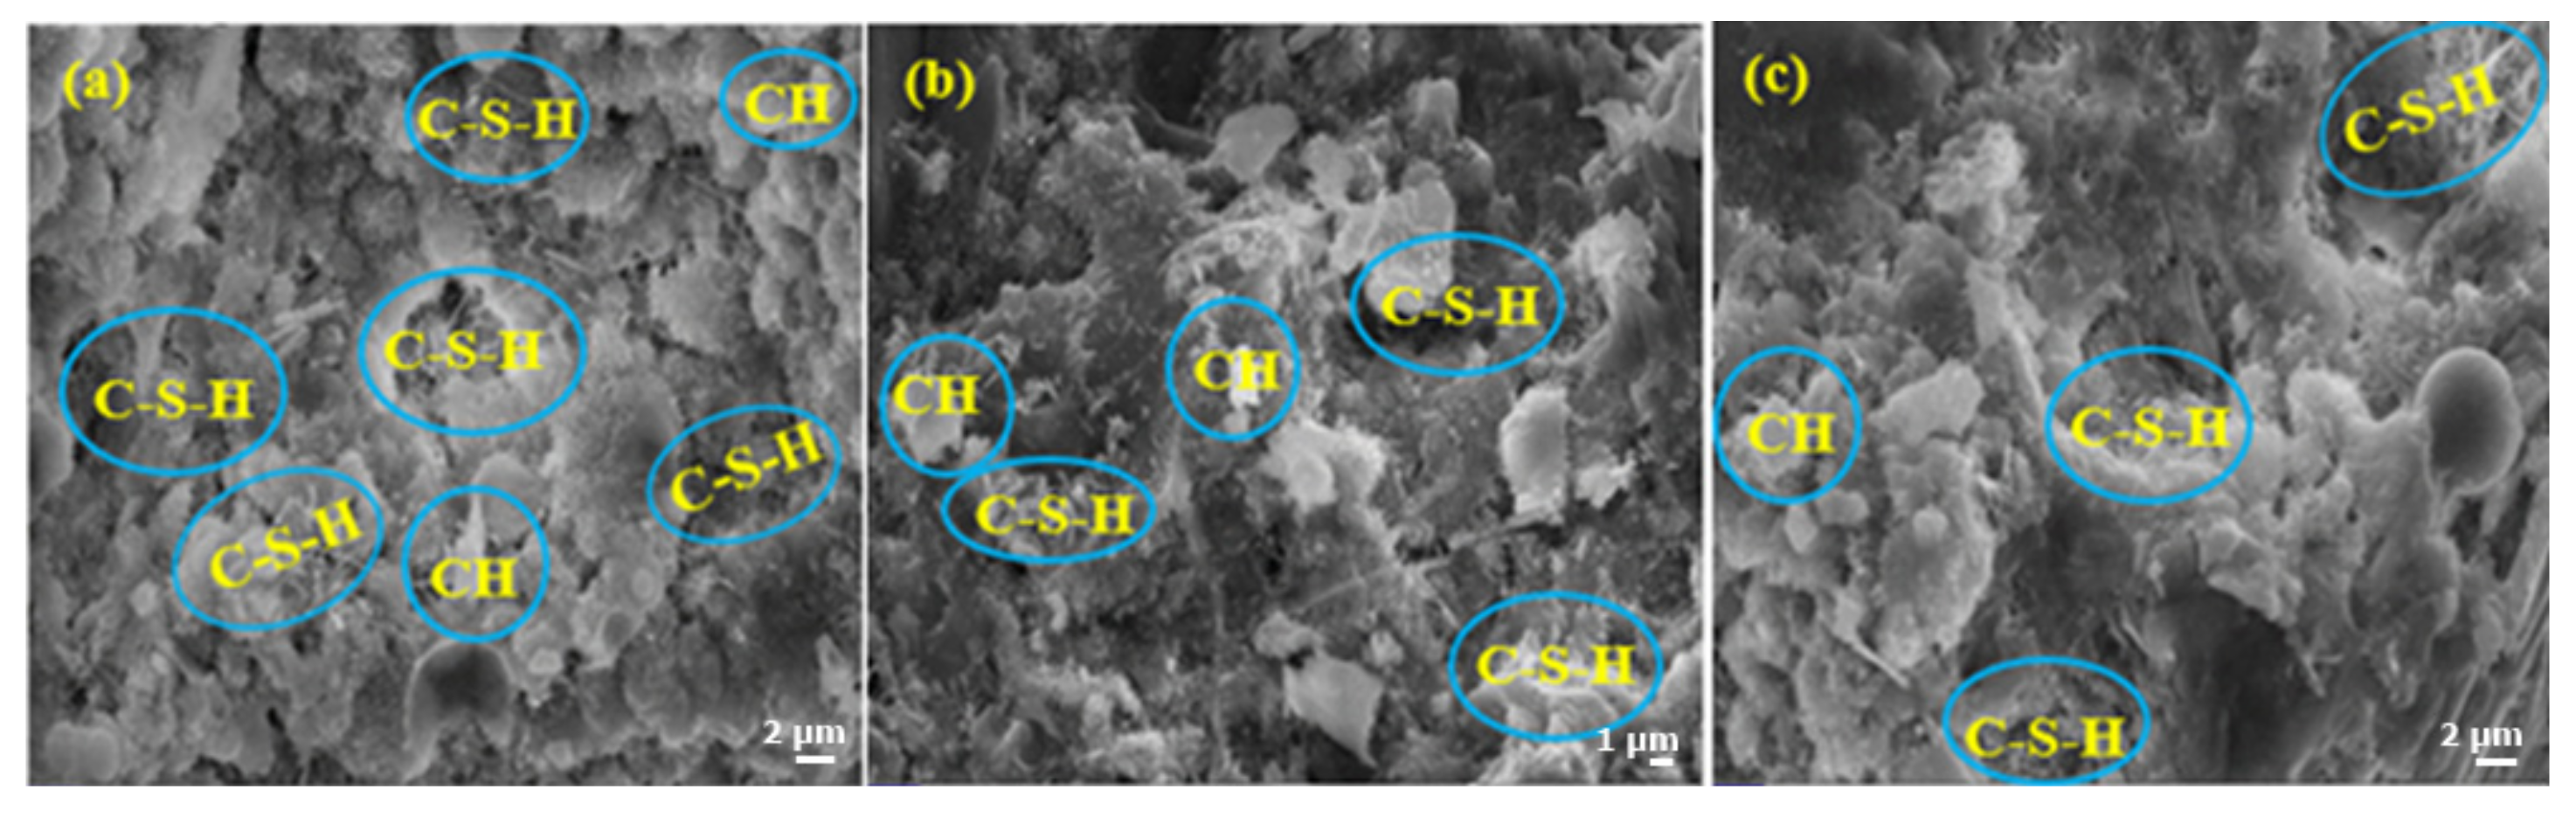
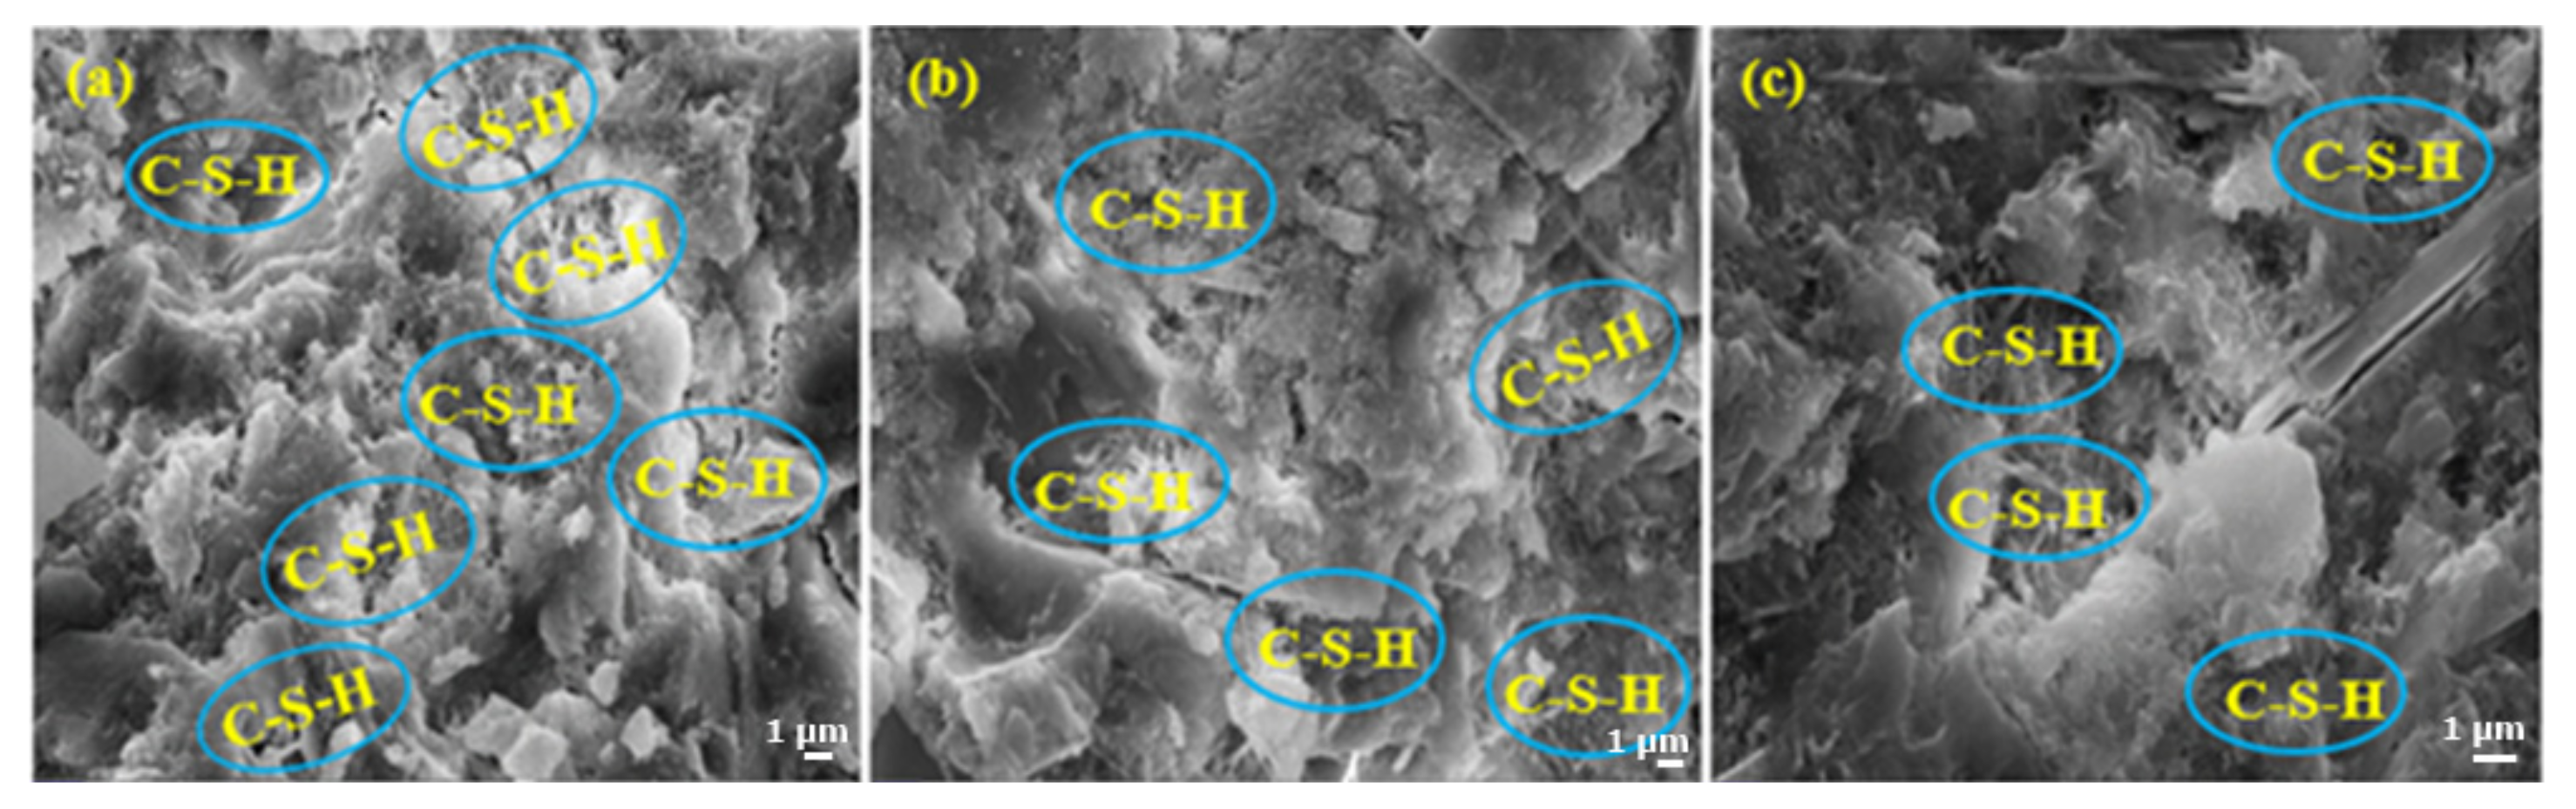
3.7. Microstructure Analysis

Figure 14 shows images of the SEM analyses of control, FBP5, and FBP10 samples after 7 days of water curing. When the SEM images are examined, it is seen that the amount of Calcium silicate hydrate (C-S-H) in the control samples is more intense than in cementitious composite mortars incorporating FBP. The low C-S-H concentration in cementitious composite mortars containing FBP can be attributed to the slow hydration development of pozzolans in the first days. Again, the reason for this situation is the late hydration reactions.
Figure 15 shows images of the SEM analyses of control, FBP5, and FBP10 samples after 28 days of water curing. When SEM images are examined, it is seen that a result similar to the 7-day SEM analysis is obtained. It is seen that the C-S-H density in the control sample is higher than in FBP5 and FBP10 samples. The C-S-H density of FBP5 samples is higher than that of FBP10. When compared to the 7-day SEM images, it is seen that the C-S-H density increases, and the hydration development of the pozzolans are better in the following days. When the results of SEM analyses are evaluated, they are determined to support the compressive and flexural strength results.

4. Conclusions

This study investigated the mechanical, physical, and microstructural properties of cementitious composites incorporating firebrick powder (FBP). In this regard, the firebrick powder was used at 5, 10, 15, 20, and 25% replacement ratio by weight of cement to produce cementitious composites. The consistency, setting characteristics, and 3, 7, and 28 days compressive and flexural strength tests of produced cementitious composites were performed. In addition, ultrasonic pulse velocity, water absorption, porosity, unit weight, and microstructure analysis of cementitious composites were conducted. The key outcomes of the study are as follows:
  • As the FBP ratio increased, the initial and final setting times got longer. This situation shows that the FBP retards the setting characteristics. The main reason for this situation is the delayed beginning of hydration and the prolongation of setting times of pozzolans. The flow diameters increased significantly with the increase of the replacement ratio of the FBP. This shows that the water requirement for workability can be reduced in cementitious composite mortar mixtures thanks to FBP. This situation can be attributed that the specific surface area of FBP being lower than cement.
  • The mechanical strength results decreased as the replacement ratio of FBP increased. However, as the replacement ratio of FBP increased, a general increase in the strength gain rate was observed.
  • It has been observed that the FBP obtained by grinding the waste firebrick can be used up to a 10% replacement ratio in cementitious composites that would require load-bearing properties to comply with the specification. However, FBP might be used up to 25% in some cases. Since cement production causes ~8% of the world’s CO2 emissions and energy, using waste FBP instead of cement would reduce the amount of cement used and lower the cost of producing cementitious composites.
In future studies, FBP can be ground more so that the specific surface area is close to cement and can be substituted for cement in different proportions. This way, the strength decreases can be at a lower level. In addition, no study has been found on using FBP in geopolymer or alkali-activated slag (AAS) mortars. The use of FBP in geopolymer or AAS mortars can also be investigated in future studies.

Author Contributions

Conceptualization, O.S. and E.H.A.; methodology, O.S. and E.H.A.; validation, O.S. and E.H.A.; investigation, O.S. and E.H.A.; resources, O.S., E.H.A. and S.G.; writing—original draft preparation, O.S. and E.H.A.; writing—review and editing, O.S., E.H.A. and S.G.; supervision, O.S. All authors have read and agreed to the published version of the manuscript.

Funding

This research received no external funding.

Institutional Review Board Statement

Not applicable.

Informed Consent Statement

Not applicable.

Data Availability Statement

Not applicable.

Conflicts of Interest

The authors declare no conflict of interest.

References

  1. Mehta, P.K.; Monteiro, P.J.M. Concrete Microstructure, Properties, and Materials, 3rd ed.; McGraw-Hill: New York, NY, USA, 2006. [Google Scholar]
  2. Meyer, C. The greening of the concrete industry. Cem. Concr. Compos. 2009, 31, 601–605. [Google Scholar] [CrossRef]
  3. Dunuweera, S.P.; Rajapakse, R.M.G. Cement types, composition, uses and advantages of nanocement, environmental impact on cement production, and possible solutions. Adv. Mater. Sci. Eng. 2018, 2018, 4158682. [Google Scholar] [CrossRef] [Green Version]
  4. Andrew, R.M. Global CO2 emissions from cement production. Earth Syst. Sci. Data 2018, 10, 195–217. [Google Scholar] [CrossRef] [Green Version]
  5. Tantri, A.; Nayak, G.; Kamath, M.; Shenoy, A.; Shetty, K.K. Utilization of cashew nut-shell ash as a cementitious material for the development of reclaimed asphalt pavement incorporated self-compacting concrete. Constr. Build. Mater. 2021, 301, 124197. [Google Scholar] [CrossRef]
  6. Shaaban, M. Properties of concrete with binary binder system of calcined dolomite powder and rice husk ash. Heliyon 2021, 7, e06311. [Google Scholar] [CrossRef]
  7. Sarıdemir, M.; Çelikten, S.; Yıldırım, A. Mechanical and microstructural properties of calcined diatomite powder modified high strength mortars at ambient and high temperatures. Adv. Powder Technol. 2020, 31, 3004–3017. [Google Scholar] [CrossRef]
  8. Demir, İ.; Sivrikaya, B.; Sevim, O.; Baran, M. A study on ASR mitigation by optimized particle size distribution. Constr. Build. Mater. 2020, 261, 120492. [Google Scholar] [CrossRef]
  9. Wu, H.; Zuo, J.; Zillante, G.; Wang, J.; Yuan, H. Construction and demolition waste research: A bibliometric analysis. Archit. Sci. Rev. 2019, 62, 354–365. [Google Scholar] [CrossRef]
  10. Wu, H.; Zuo, J.; Yuan, H.; Zillante, G.; Wang, J. A review of performance assessment methods for construction and demolition waste management. Resour. Conserv. Recycl. 2019, 150, 104407. [Google Scholar] [CrossRef]
  11. Hwang, C.L.; Yehualaw, M.D.; Vo, D.H.; Huynh, T.P.; Largo, A. Performance evaluation of alkali activated mortar containing high volume of waste brick powder blended with ground granulated blast furnace slag cured at ambient temperature. Constr. Build. Mater. 2019, 223, 657–667. [Google Scholar] [CrossRef]
  12. Ding, Z.; Wang, Y.; Zou, P.X. An agent based environmental impact assessment of building demolition waste management: Conventional versus green management. J. Clean. Prod. 2016, 133, 1136–1153. [Google Scholar] [CrossRef] [Green Version]
  13. Li, L.G.G.; Lin, Z.H.; Chen, G.M.; Kwan, A.K.H. Reutilizing clay brick dust as paste substitution to produce environment-friendly durable mortar. J. Clean. Prod. 2020, 274, 122787. [Google Scholar] [CrossRef]
  14. Zhao, Z.; Grellier, A.; Bouarroudj, M.E.K.; Michel, F.; Bulteel, D.; Courard, L. Substitution of limestone filler by waste brick powder in self-compacting mortars: Properties and durability. J. Build. Eng. 2021, 43, 102898. [Google Scholar] [CrossRef]
  15. Ortega, J.M.; Letelier, V.; Solas, C.; Moriconi, G.; Climent, M.Á.; Sánchez, I. Long-term effects of waste brick powder addition in the microstructure and service properties of mortars. Constr. Build. Mater. 2018, 182, 691–702. [Google Scholar] [CrossRef] [Green Version]
  16. Zhao, Z.; Xiao, J.; Duan, Z.; Hubert, J.; Grigoletto, S.; Courard, L. Performance and durability of self-compacting mortar with recycled sand from crushed brick. J. Build. Eng. 2022, 57, 104867. [Google Scholar] [CrossRef]
  17. Horckmans, L.; Nielsen, P.; Dierckx, P.; Ducastel, A. Recycling of refractory bricks used in basic steelmaking: A review. Resour. Conserv. Recycl. 2019, 140, 297–304. [Google Scholar] [CrossRef]
  18. Nematzadeh, M.; Dashti, J.; Ganjavi, B. Optimizing compressive behavior of concrete containing fine recycled refractory brick aggregate together with calcium aluminate cement and polyvinyl alcohol fibers exposed to acidic environment. Constr. Build. Mater. 2018, 164, 837–849. [Google Scholar] [CrossRef]
  19. Khattab, M.; Hachemi, S.; Al Ajlouni, M.F. Evaluating the physical and mechanical properties of concrete prepared with recycled refractory brick aggregates after elevated temperatures’ exposure. Constr. Build. Mater. 2021, 311, 125351. [Google Scholar] [CrossRef]
  20. Kavas, T.; Karasu, B.; Arslan, O. Utilization of refractory brick wastes in concrete production as aggregates. Sohn. Int. Symp. Adv. Process. Met. Mater. 2006, 5, 479–483. [Google Scholar]
  21. El-Didamony, H.; Amer, A.A.; El-Hoseny, S. Recycling of low-grade aluminosilicate refractory brick waste product in blended cement. J. Therm. Anal. Calorim. 2016, 125, 23–33. [Google Scholar] [CrossRef]
  22. Zeghad, M.; Mitterpach, J.; Safi, B.; Amrane, B.; Saidi, M. Reuse of refractory brick wastes (RBW) as a supplementary cementitious material in a concrete. Period. Polytech. Civ. Eng. 2017, 61, 75–80. [Google Scholar] [CrossRef]
  23. Alakara, E.H.; Sevim, O.; Demir, I.; Şimşek, O. Experimental study on firebrick powder-based cementitious composites under the effect of elevated temperature. J. Build. Eng. 2022, 61, 105277. [Google Scholar] [CrossRef]
  24. TS EN 196-1; Methods of Testing Cement–Part 1: Determination of Strength. Turkish Standards Institution: Ankara, Turkey, 2016.
  25. TS EN 196-3; Methods of Testing Cement-Part 3: Determination of Setting Time and Soundness. Turkish Standards Institution: Ankara, Turkey, 2017.
  26. TS EN 12350-5; Testing Fresh Concrete-Part 5: Flow Table Test. Turkish Standards Institution: Ankara, Turkey, 2019.
  27. TS EN 480-5; Admixtures for Concrete, Mortar and Grout—Test Methods—Part 5: Determination of Capillary Absorption. Turkish Standards Institution: Ankara, Turkey, 2008.
  28. TS EN 12504-4; Testing Concrete in Structures—Part 4: Determination of Ultrasonic Pulse Velocity. Turkish Standards Institution: Ankara, Turkey, 2021.
  29. Brooks, J.J.; Johari, M.M.M.; Mazloom, M. Effect of admixtures on the setting times of high-strength concrete. Cem. Concr. Compos. 2000, 22, 293–301. [Google Scholar] [CrossRef]
  30. Kula, I.; Olgun, A.; Erdogan, Y.; Sevinc, V. Effects of colemanite waste, cool bottom ash, and fly ash on the properties of cement. Cem. Concr. Res. 2001, 31, 491–494. [Google Scholar] [CrossRef]
  31. Rogers, S.B. Evaluation and Testing of Brick Dust as A Pozzolanic Additive to Lime Mortars for Architectural Conservation. Master’s Thesis, University of Pennsylvania, Philadelphia, PA, USA, 2011. [Google Scholar]
  32. Arif, R.; Khitab, A.; Kırgız, M.S.; Khan, R.B.N.; Tayyab, S.; Khan, R.A.; Anwar, W.; Arshad, M.T. Experimental analysis on partial replacement of cement with brick powder in concrete. Case Stud. Constr. Mater. 2021, 15, e00749. [Google Scholar] [CrossRef]
  33. Sutter, L.L.; Hooton, R.D.; Schlorholtz, S. Methods for Evaluating Fly Ash for Use in Highway Concrete; Transportation Research Board: Washington, DC, USA, 2013. [Google Scholar]
  34. Ye, G.; Lura, P.; Van Breugel, K.; Fraaij, A.L.A. Study on the development of the microstructure in cement–based materials by means of numerical simulation and ultrasonic pulse velocity measurement. Cem. Concr. Compos. 2004, 26, 491–497. [Google Scholar] [CrossRef]
  35. Hong, G.; Oh, S.; Choi, S.; Chin, W.J.; Kim, Y.J.; Song, C. Correlation between the compressive strength and ultrasonic pulse velocity of cement mortars blended with silica fume: An analysis of microstructure and hydration kinetics. Materials 2021, 14, 2476. [Google Scholar] [CrossRef]
  36. Bogas, J.A.; Gomes, M.G.; Gomes, A. Compressive strength evaluation of structural lightweight concrete by non–destructive ultrasonic pulse velocity method. Ultrasonics 2013, 53, 962–972. [Google Scholar] [CrossRef]
  37. Naceri, A.; Hamina, M.C. Use of waste brick as a partial replacement of cement in mortar. Waste Manag. 2009, 29, 2378–2384. [Google Scholar] [CrossRef]
  38. Liu, S.; Dai, R.; Cao, K.; Gao, Z. The role of sintered clay brick powder during the hydration process of cement pastes. Iran. J. Sci. Technol. Trans. Civ. Eng. 2017, 41, 159–165. [Google Scholar] [CrossRef]
  39. Xue, C.Z.; Shen, A.Q.; Chang, Y.T.; Liang, D. The study of the construction waste brick powder’s activity. Adv. Mater. Res. 2015, 1079, 309–311. [Google Scholar] [CrossRef]
  40. Lin, K.L.; Chen, B.Y.; Chiou, C.S.; Cheng, A. Waste brick’s potential for use as a pozzolan in blended Portland cement. Waste Manag. Res. 2010, 28, 647–652. [Google Scholar] [CrossRef]
Figure 1. Production stages of firebrick powder.
Buildings 13 00045 g001
Figure 2. Setting characteristics of cement composites.
Buildings 13 00045 g002
Figure 3. Flow diameters of cementitious composites.
Buildings 13 00045 g003
Figure 4. Porosity test results of the cementitious composites.
Buildings 13 00045 g004
Figure 5. The water absorption test results of cementitious composites.
Buildings 13 00045 g005
Figure 6. Relationship between porosity and water absorption.
Buildings 13 00045 g006
Figure 7. The unit weight test results of the cementitious composites.
Buildings 13 00045 g007
Figure 8. The ultrasonic pulse velocity test results of cementitious composites.
Buildings 13 00045 g008
Figure 9. The relationship between the ultrasonic pulse velocity, porosity, water absorption, and unit weight results.
Buildings 13 00045 g009
Figure 10. The flexural strength test results of cementitious composite mortars.
Buildings 13 00045 g010
Figure 11. The compressive strength test results of cementitious composite mortars.
Buildings 13 00045 g011
Figure 12. Change in compressive strength of FBP-based cementitious composites.
Buildings 13 00045 g012
Figure 13. The relationship between ultrasonic pulse velocity and compressive strength.
Buildings 13 00045 g013
Figure 14. 7-days SEM images of (a) Control, (b) FBP5, and (c) FBP10 samples.
Buildings 13 00045 g014
Figure 15. 28-days SEM images of (a) Control, (b) FBP5, and (c) FBP10 samples.
Buildings 13 00045 g015
Table 1. Physical and chemical properties of cement and FBP.
Chemical Composition (%)CementFBP
SiO221.3451.43
Al2O34.5837.46
Fe2O33.852.14
CaO62.260.71
MgO1.730.60
Na2O0.380.32
K2O0.400.35
SO33.690.29
TiO2-4.81
Other elements1.771.89
Physical PropertiesCementFBP
Specific gravity3.142.38
Specific surface area (cm2/g)34102610
Loss on ignition (%)1.836.87
Table 2. Mixing plan of cementitious composite mortars incorporating FBP.
Mix CodingFBP (%)FBP (g)Cement (g)Water (g)Sand (g)
Control00.0450.02251350
FBP5522.5427.52251350
FBP101045.0405.02251350
FBP151567.5382.52251350
FBP202090.0360.02251350
FBP2525112.5337.52251350
Disclaimer/Publisher’s Note: The statements, opinions and data contained in all publications are solely those of the individual author(s) and contributor(s) and not of MDPI and/or the editor(s). MDPI and/or the editor(s) disclaim responsibility for any injury to people or property resulting from any ideas, methods, instructions or products referred to in the content.

