
Development of Ultrafine Mineral Admixture from Magnesium Slag and Sequestration of CO2
 ,
,
Abstract
:1. Introduction
2. Experimental Methodology
2.1. Materials
2.2. The Wet Carbonation Process
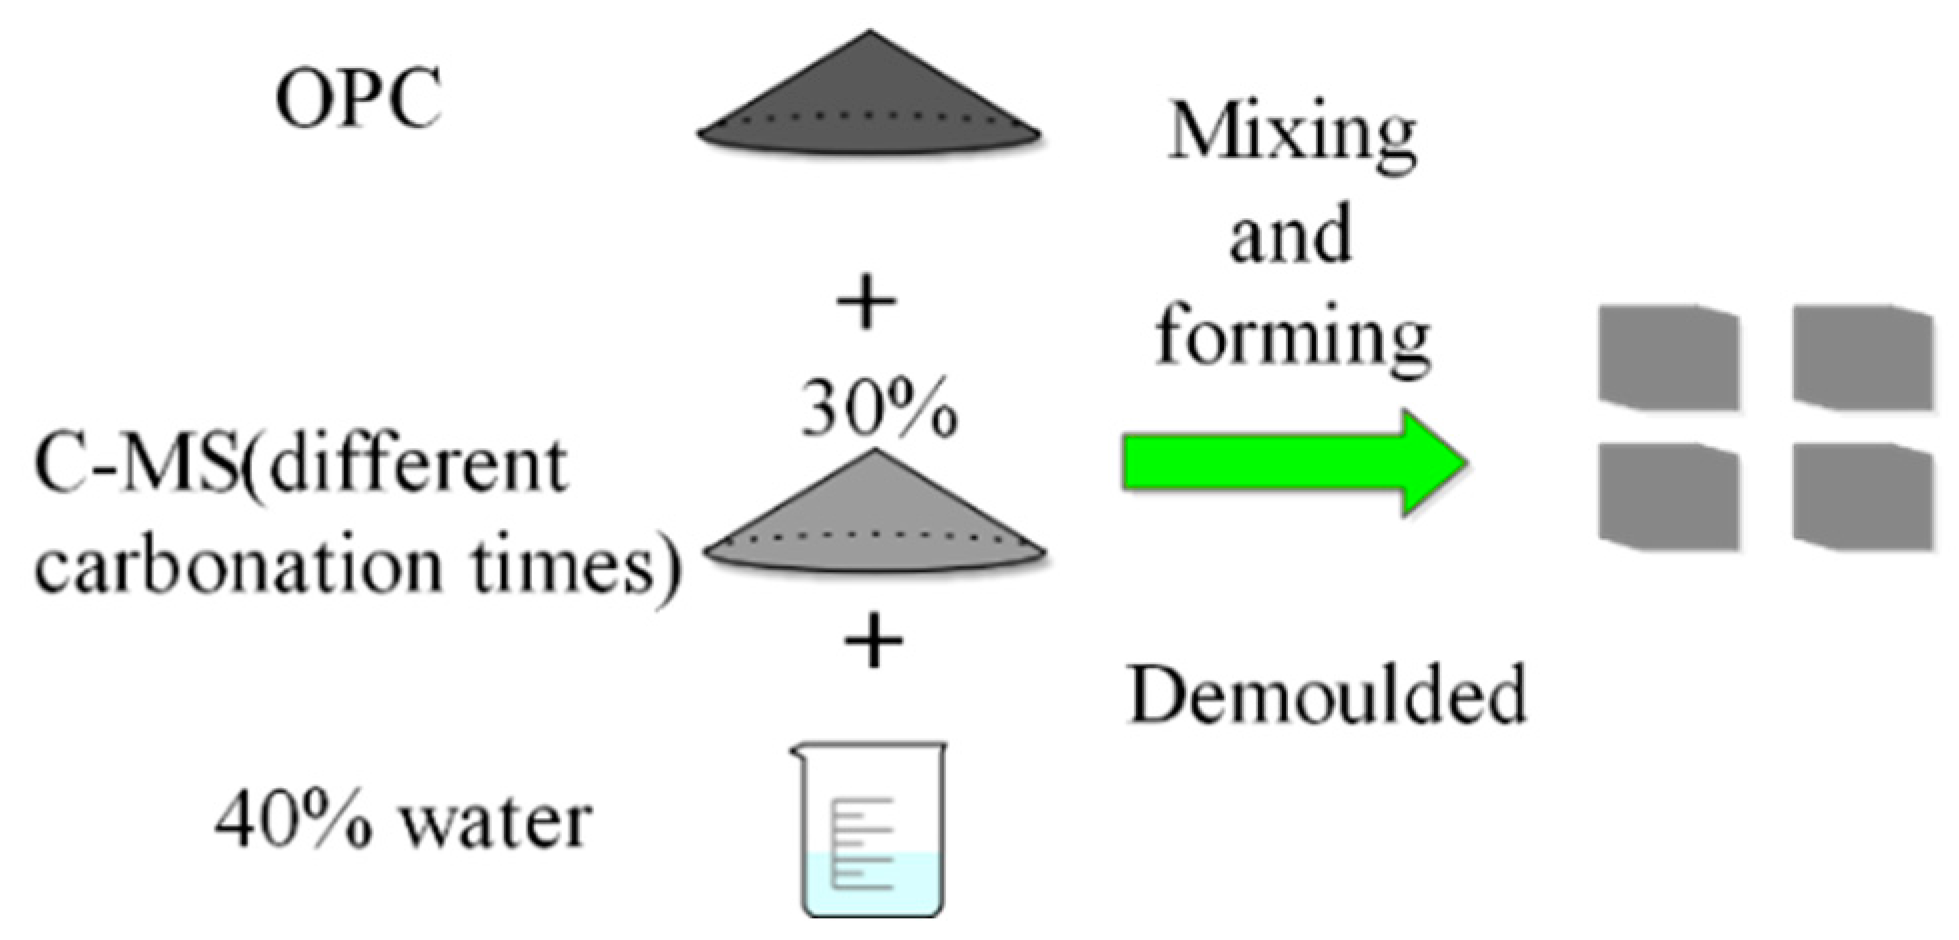
2.3. Preparation and Curing of Composite Cement Paste
2.4. Test Methods
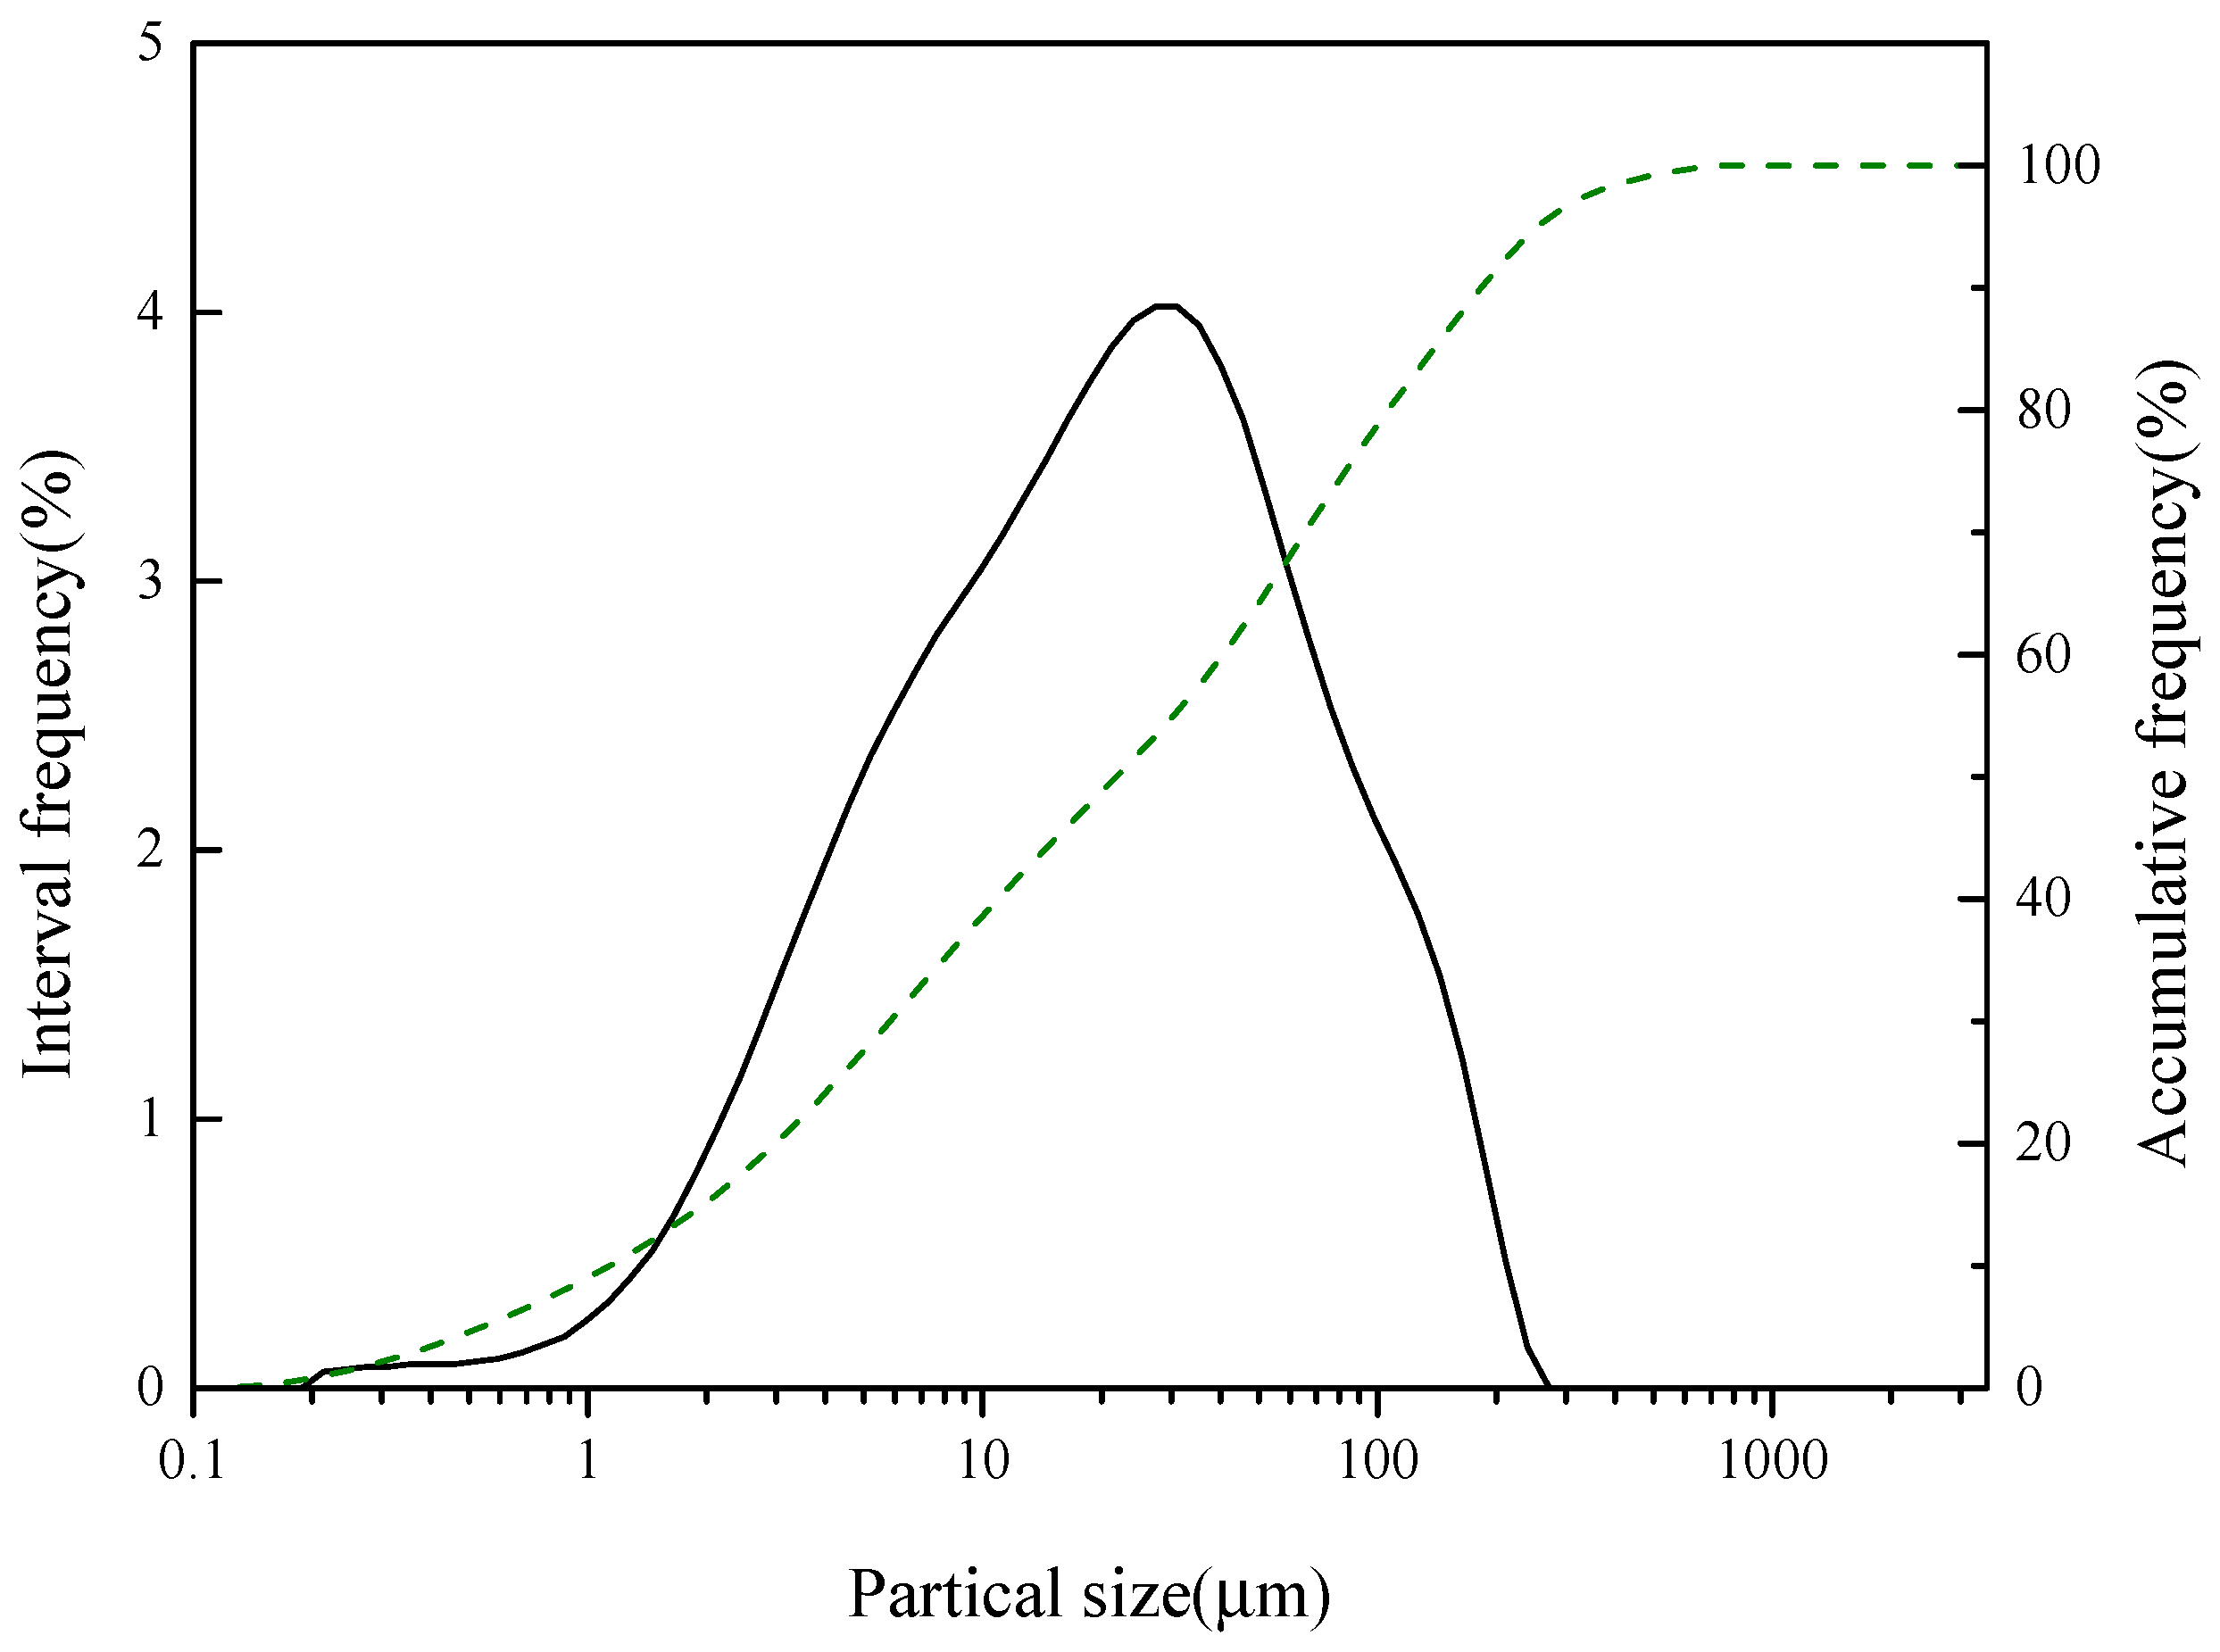
2.4.1. Particle Size Distribution
2.4.2. The pH, Conductivity, and Temperature Changes
2.4.3. Thermal Analysis (TG-DTG)
2.4.4. X-ray Powder Diffraction (XRD)
2.4.5. Fournier Transform Infrared (FTIR) and 29Si NMR Spectroscopy (NMR)
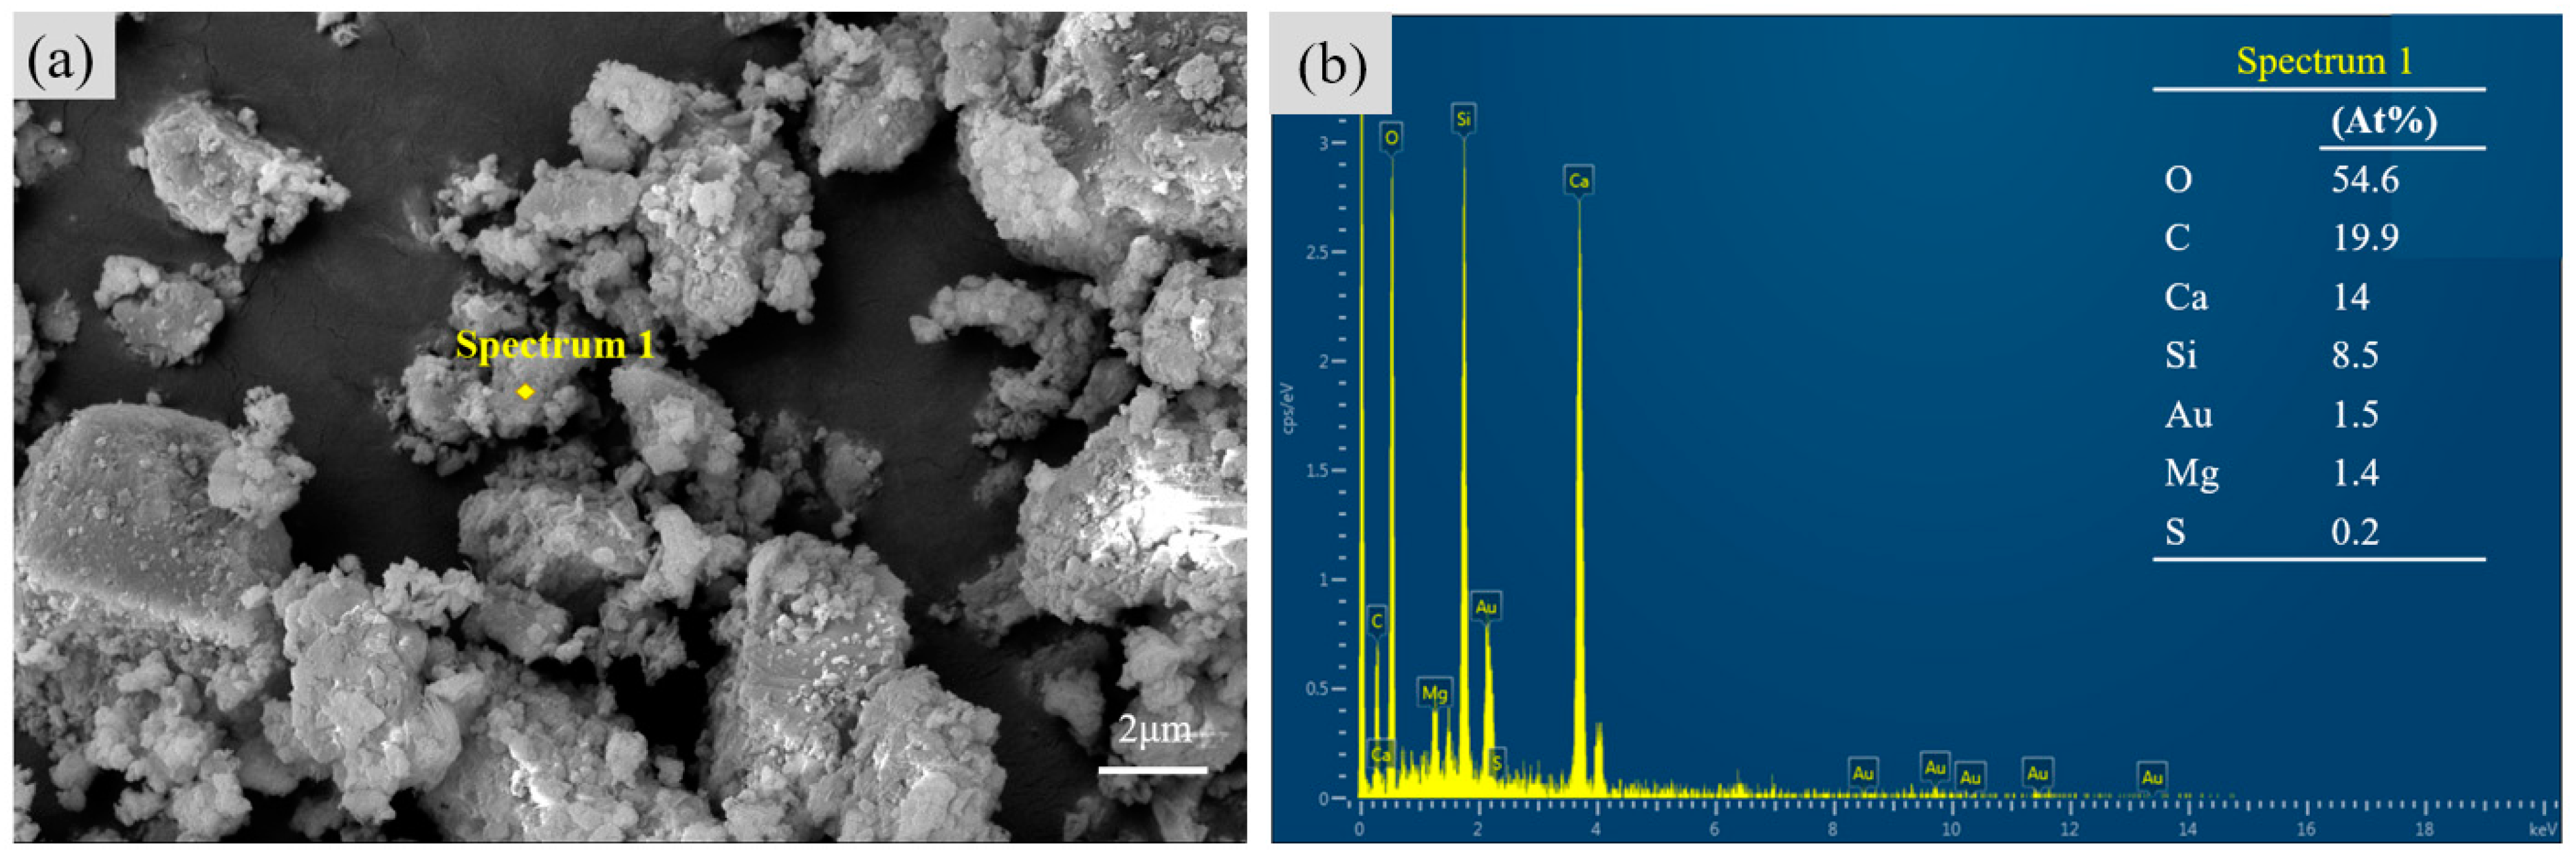
2.4.6. Scanning Electron Microscopy (SEM)
2.4.7. Pore Structure
3. Results and Discussion
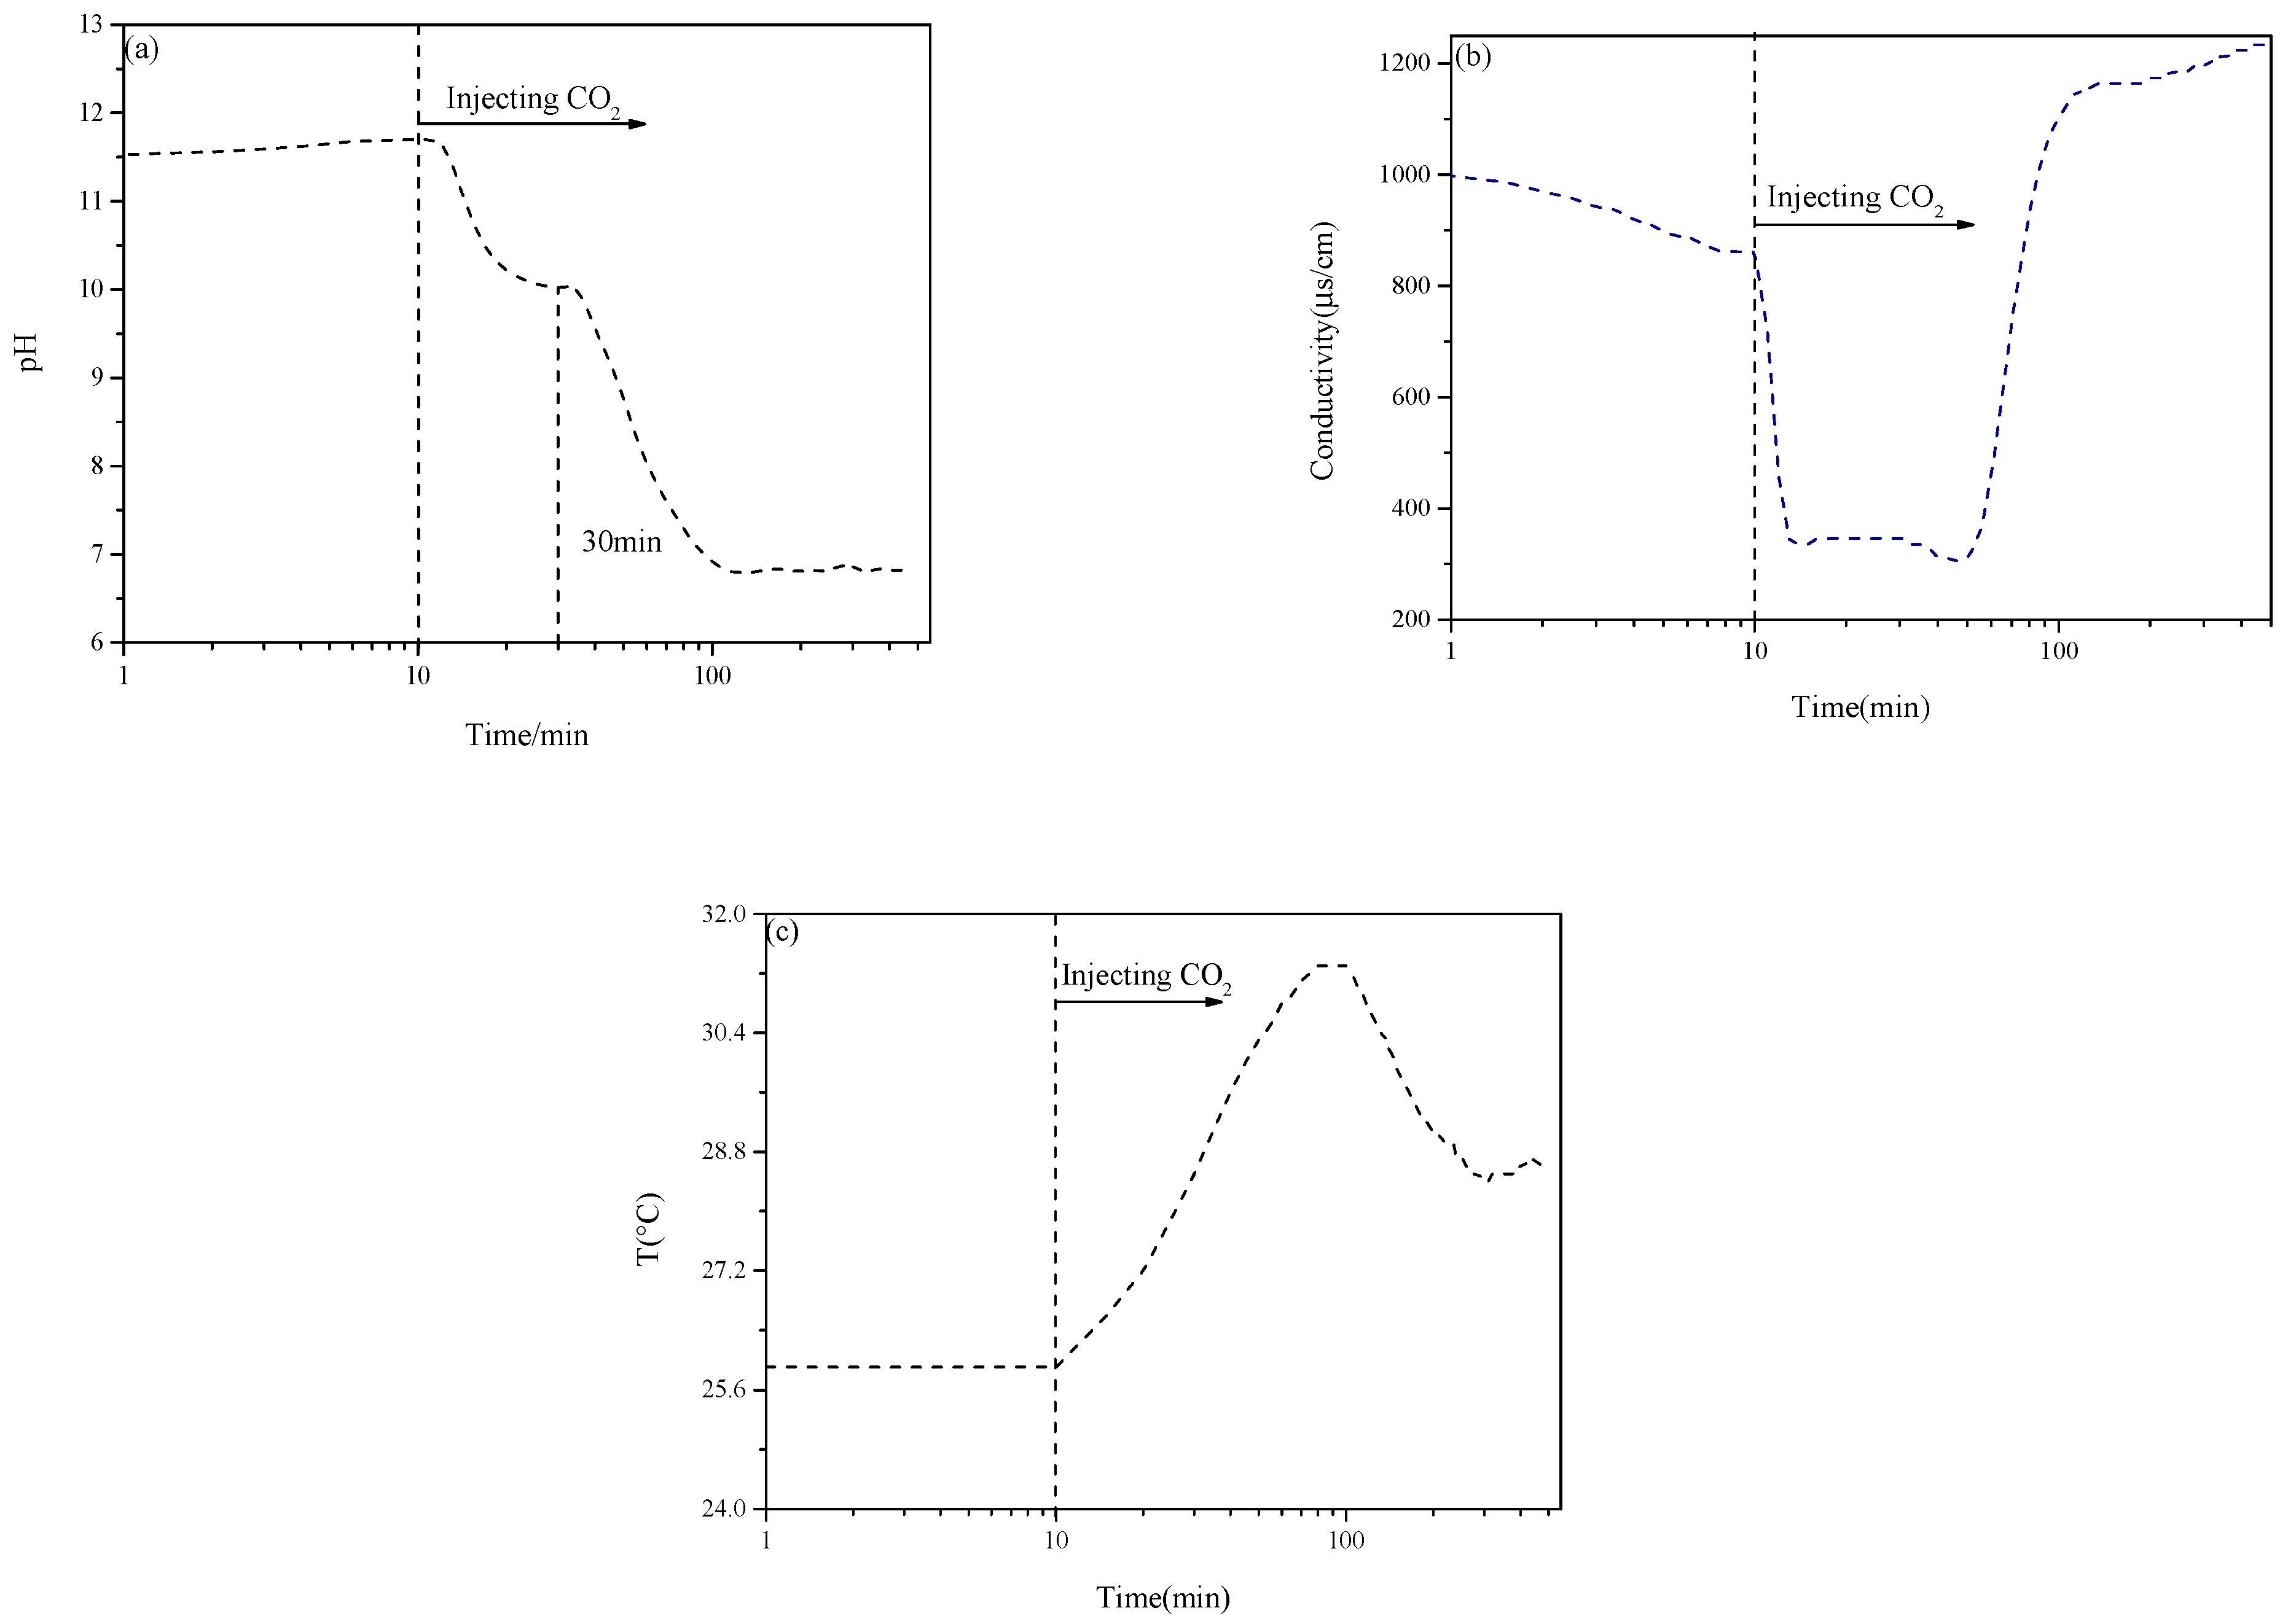
3.1. The Changes in pH, Conductivity, and Temperature of MS Suspension
3.2. Evolution of Calcium-Containing Phase
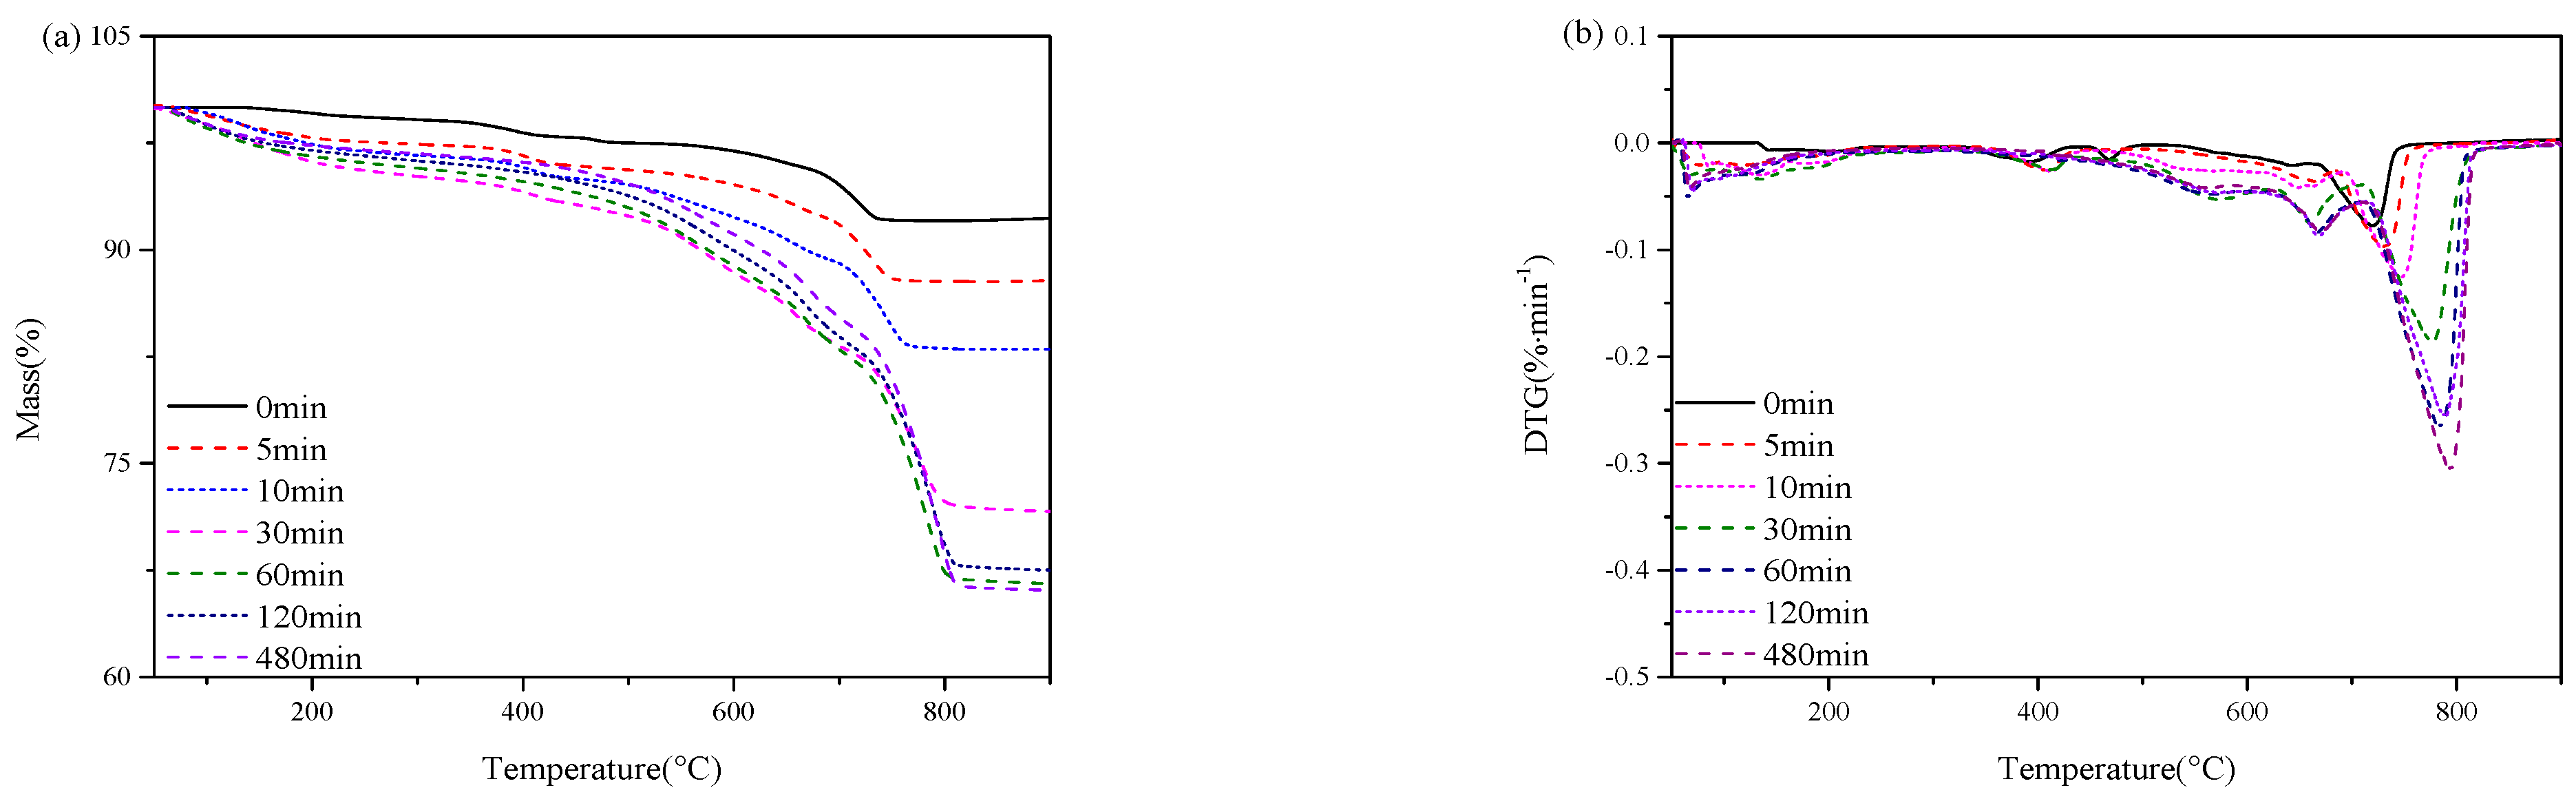
3.2.1. TG/DTG
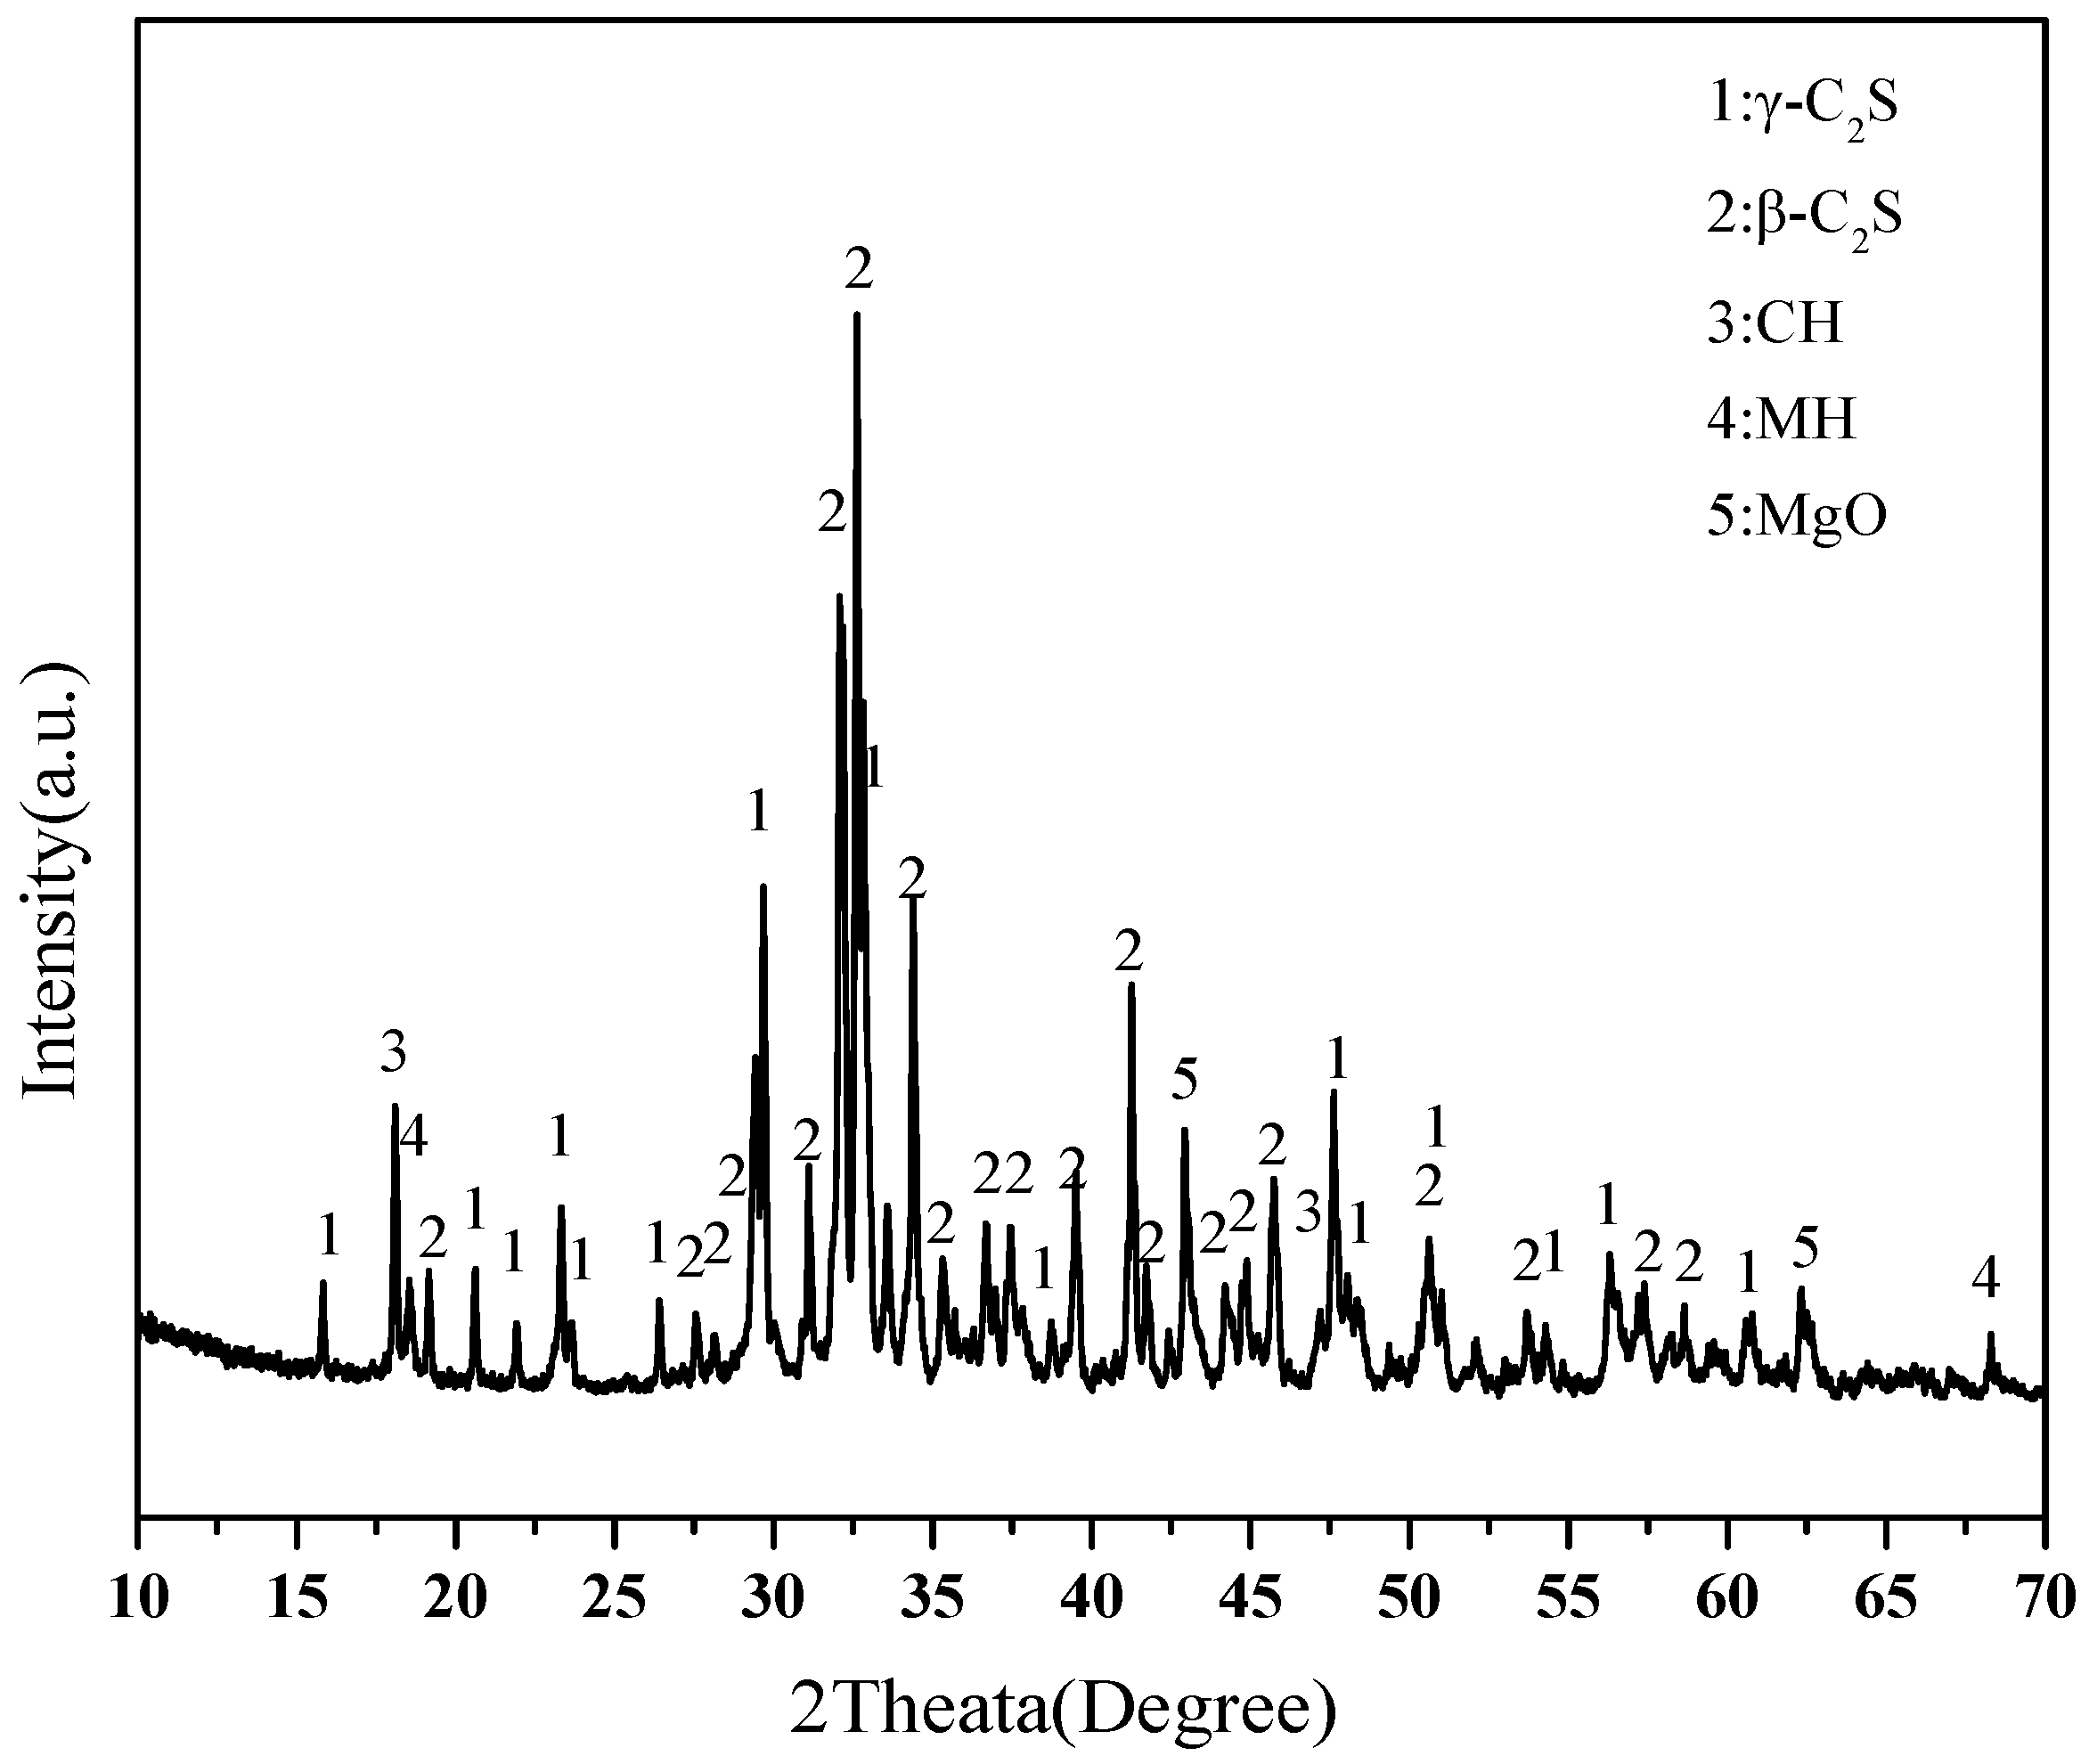
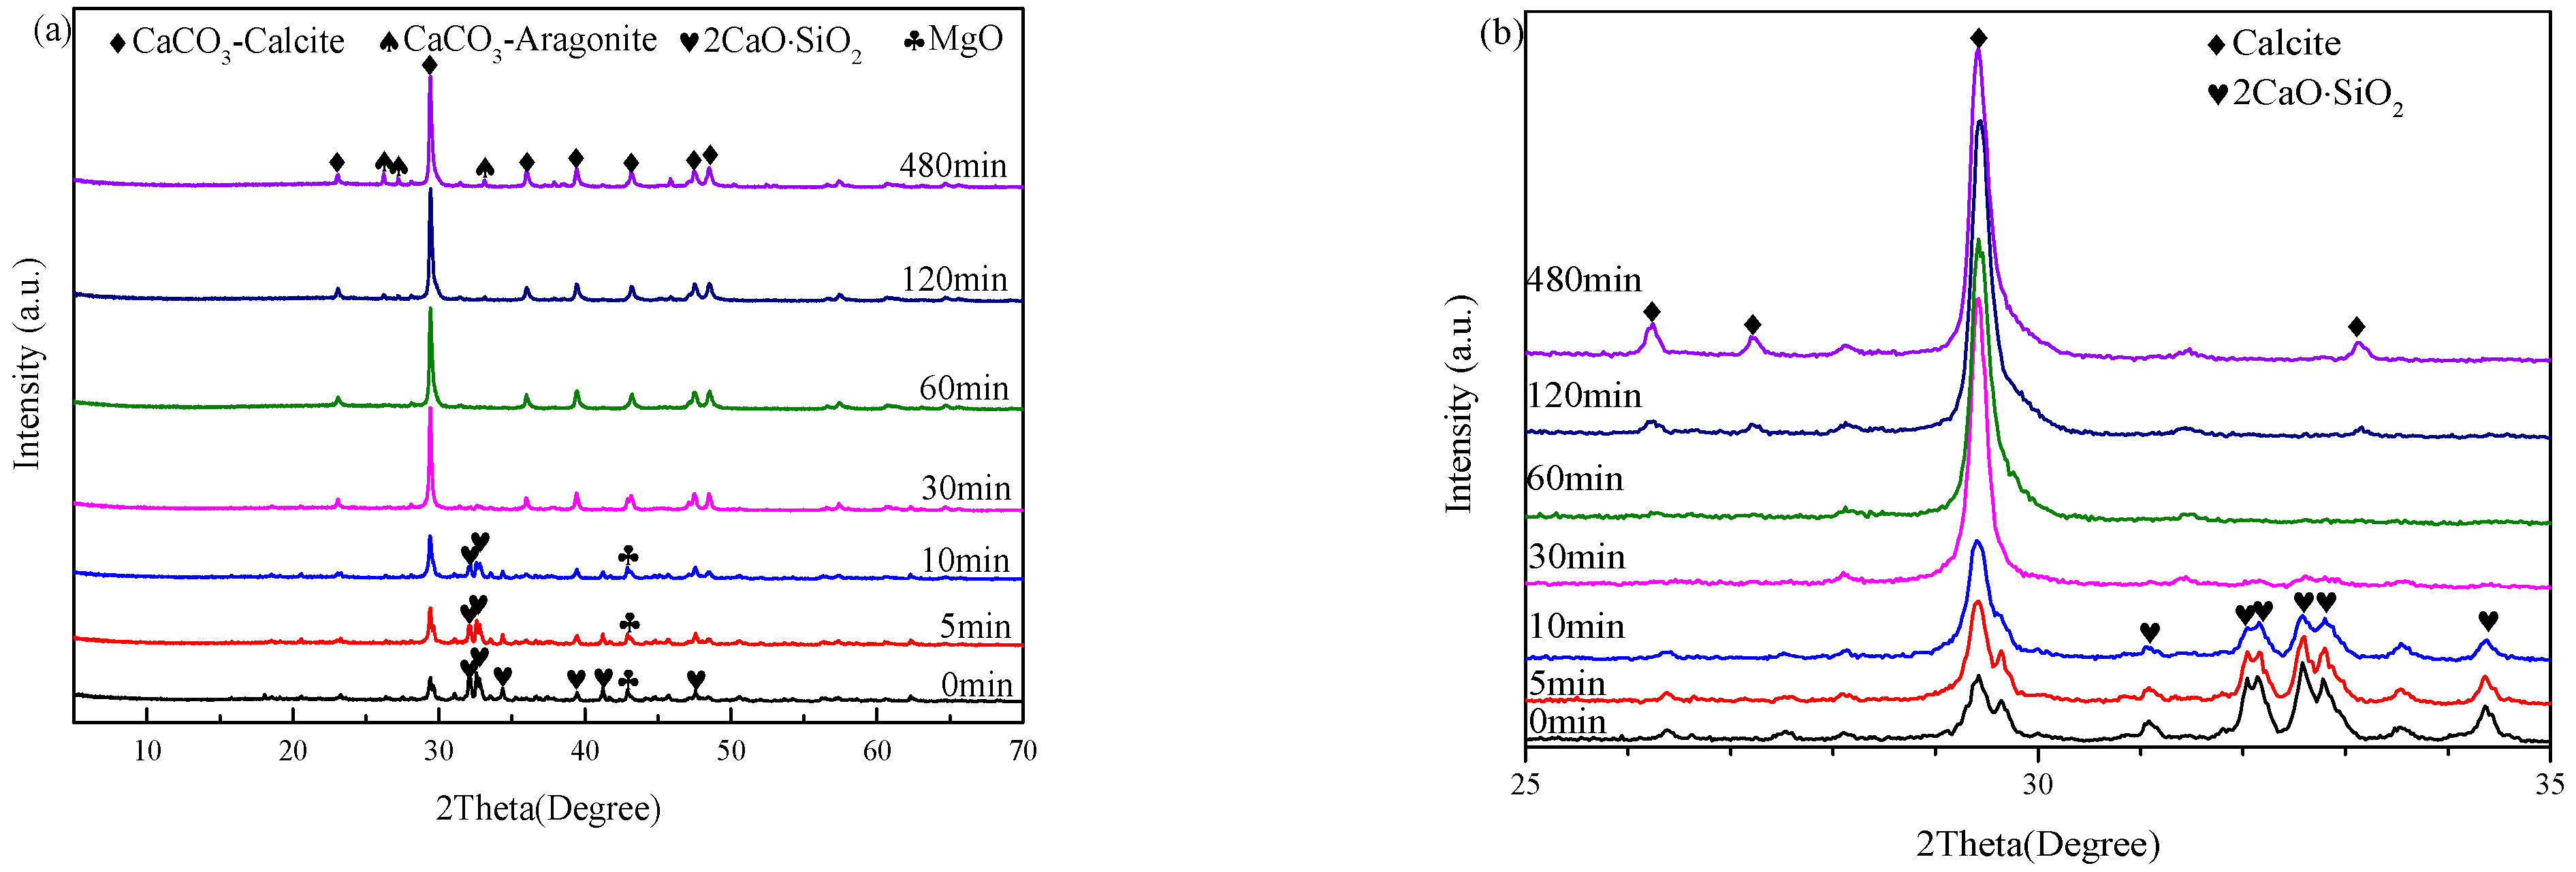
3.2.2. XRD
3.3. Evolution of Silica Phases
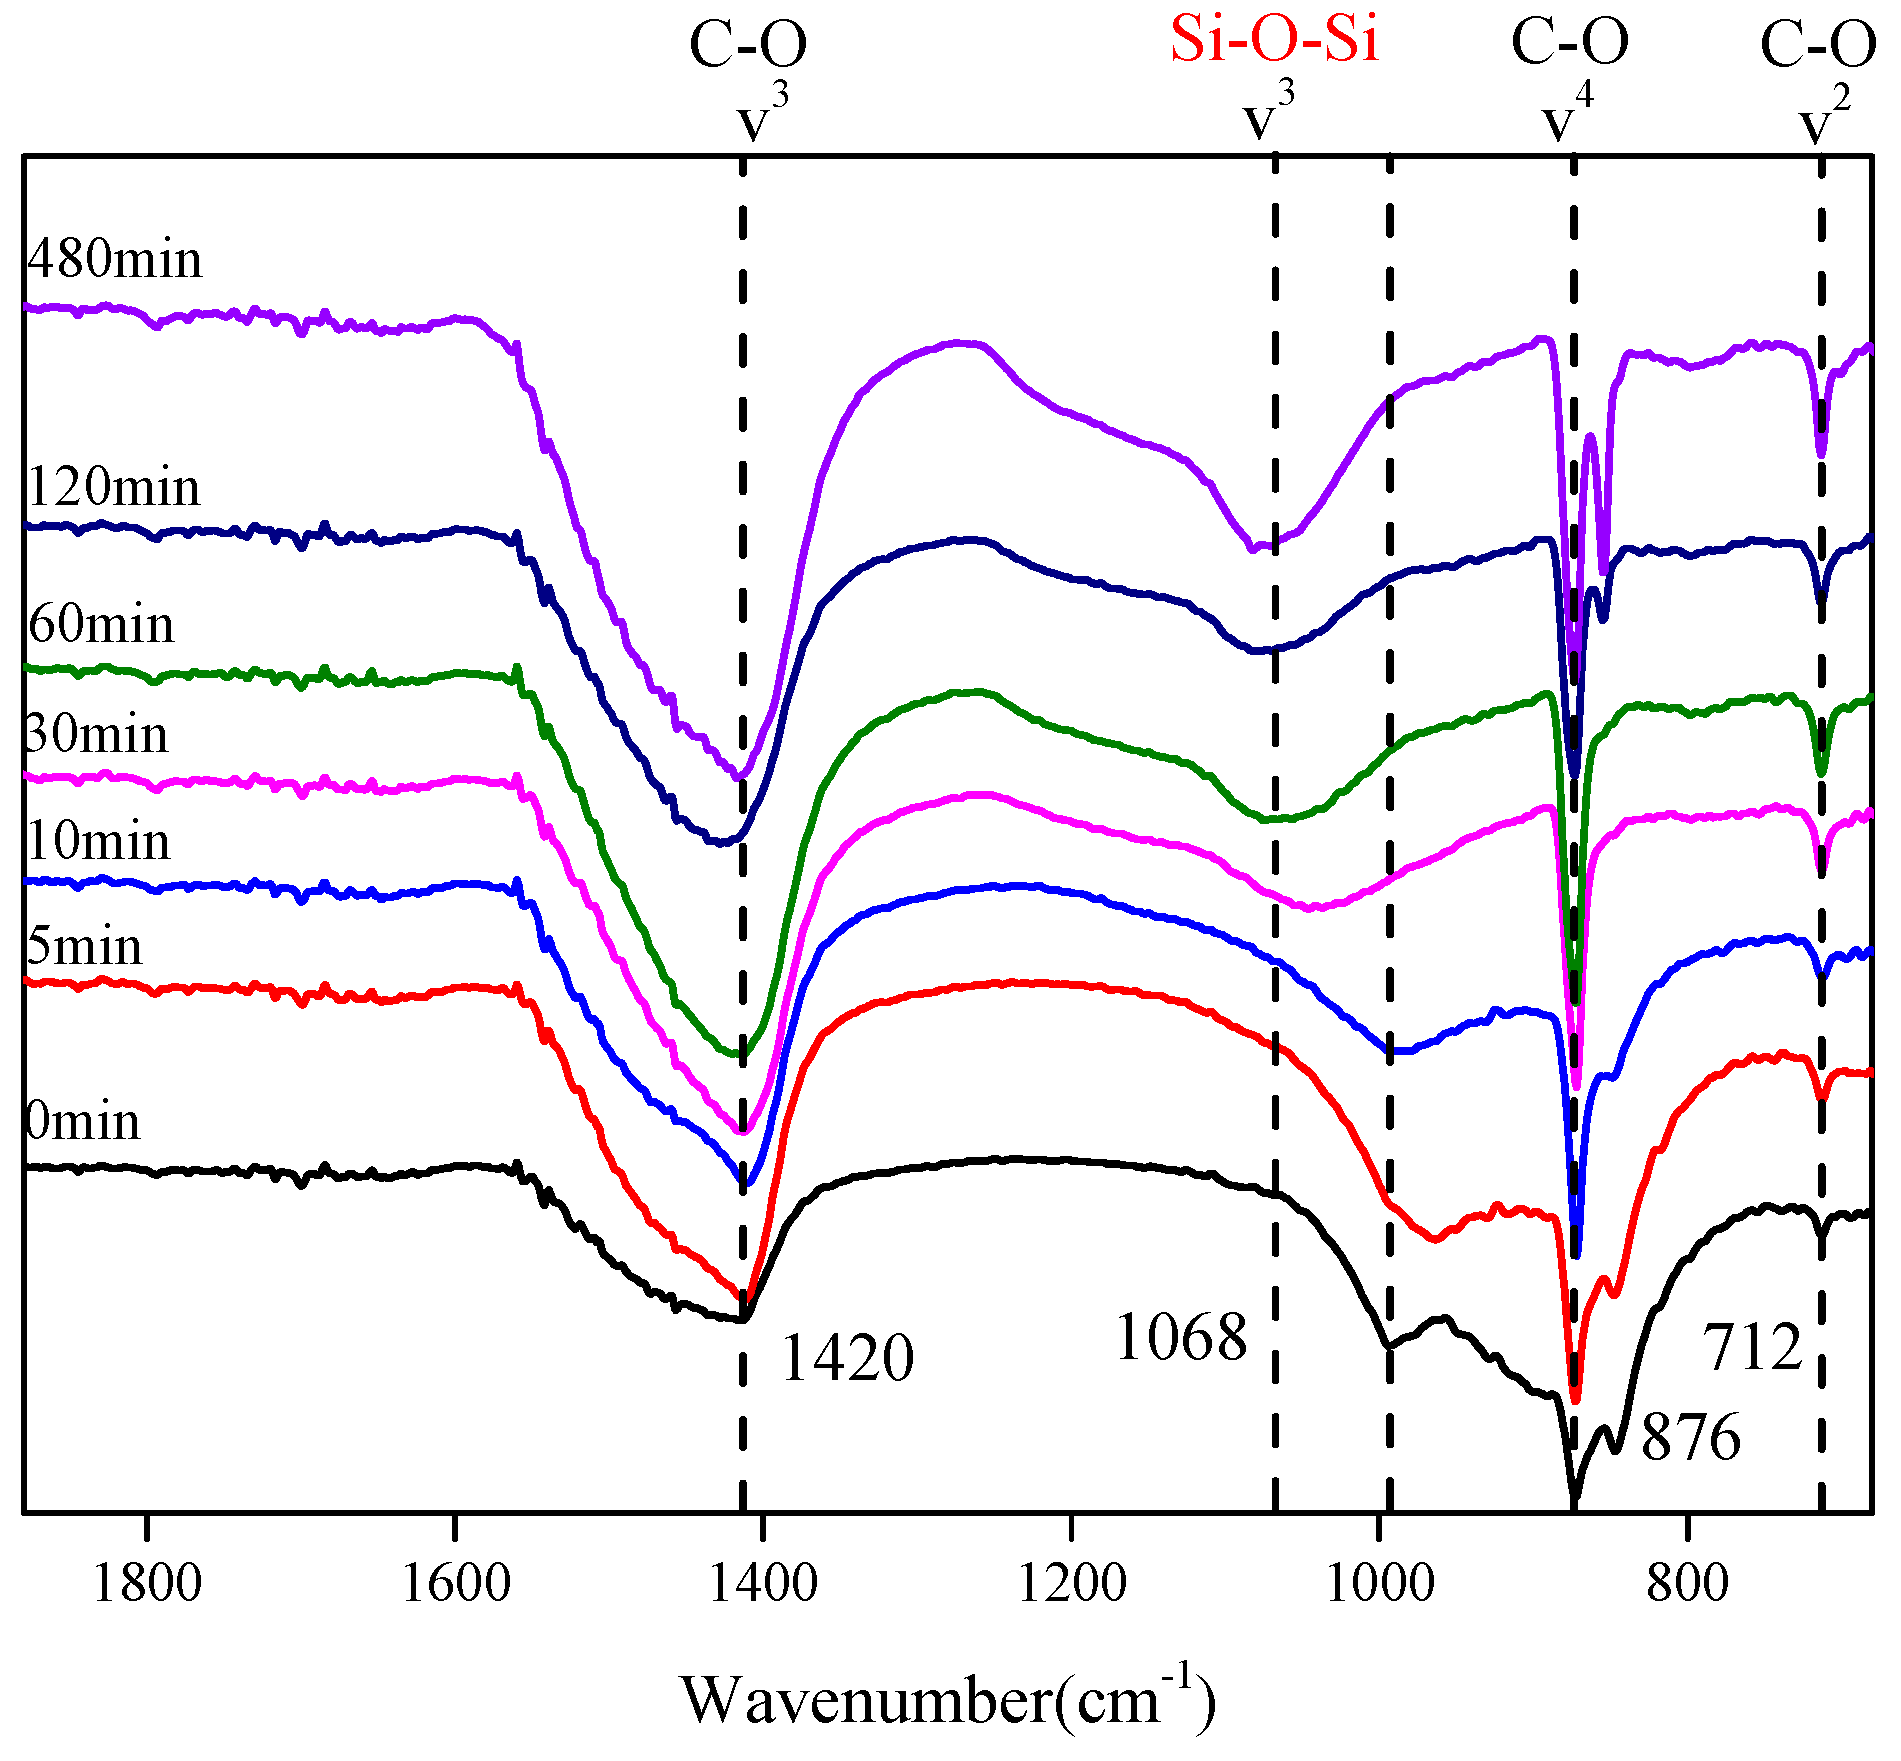
3.3.1. FTIR
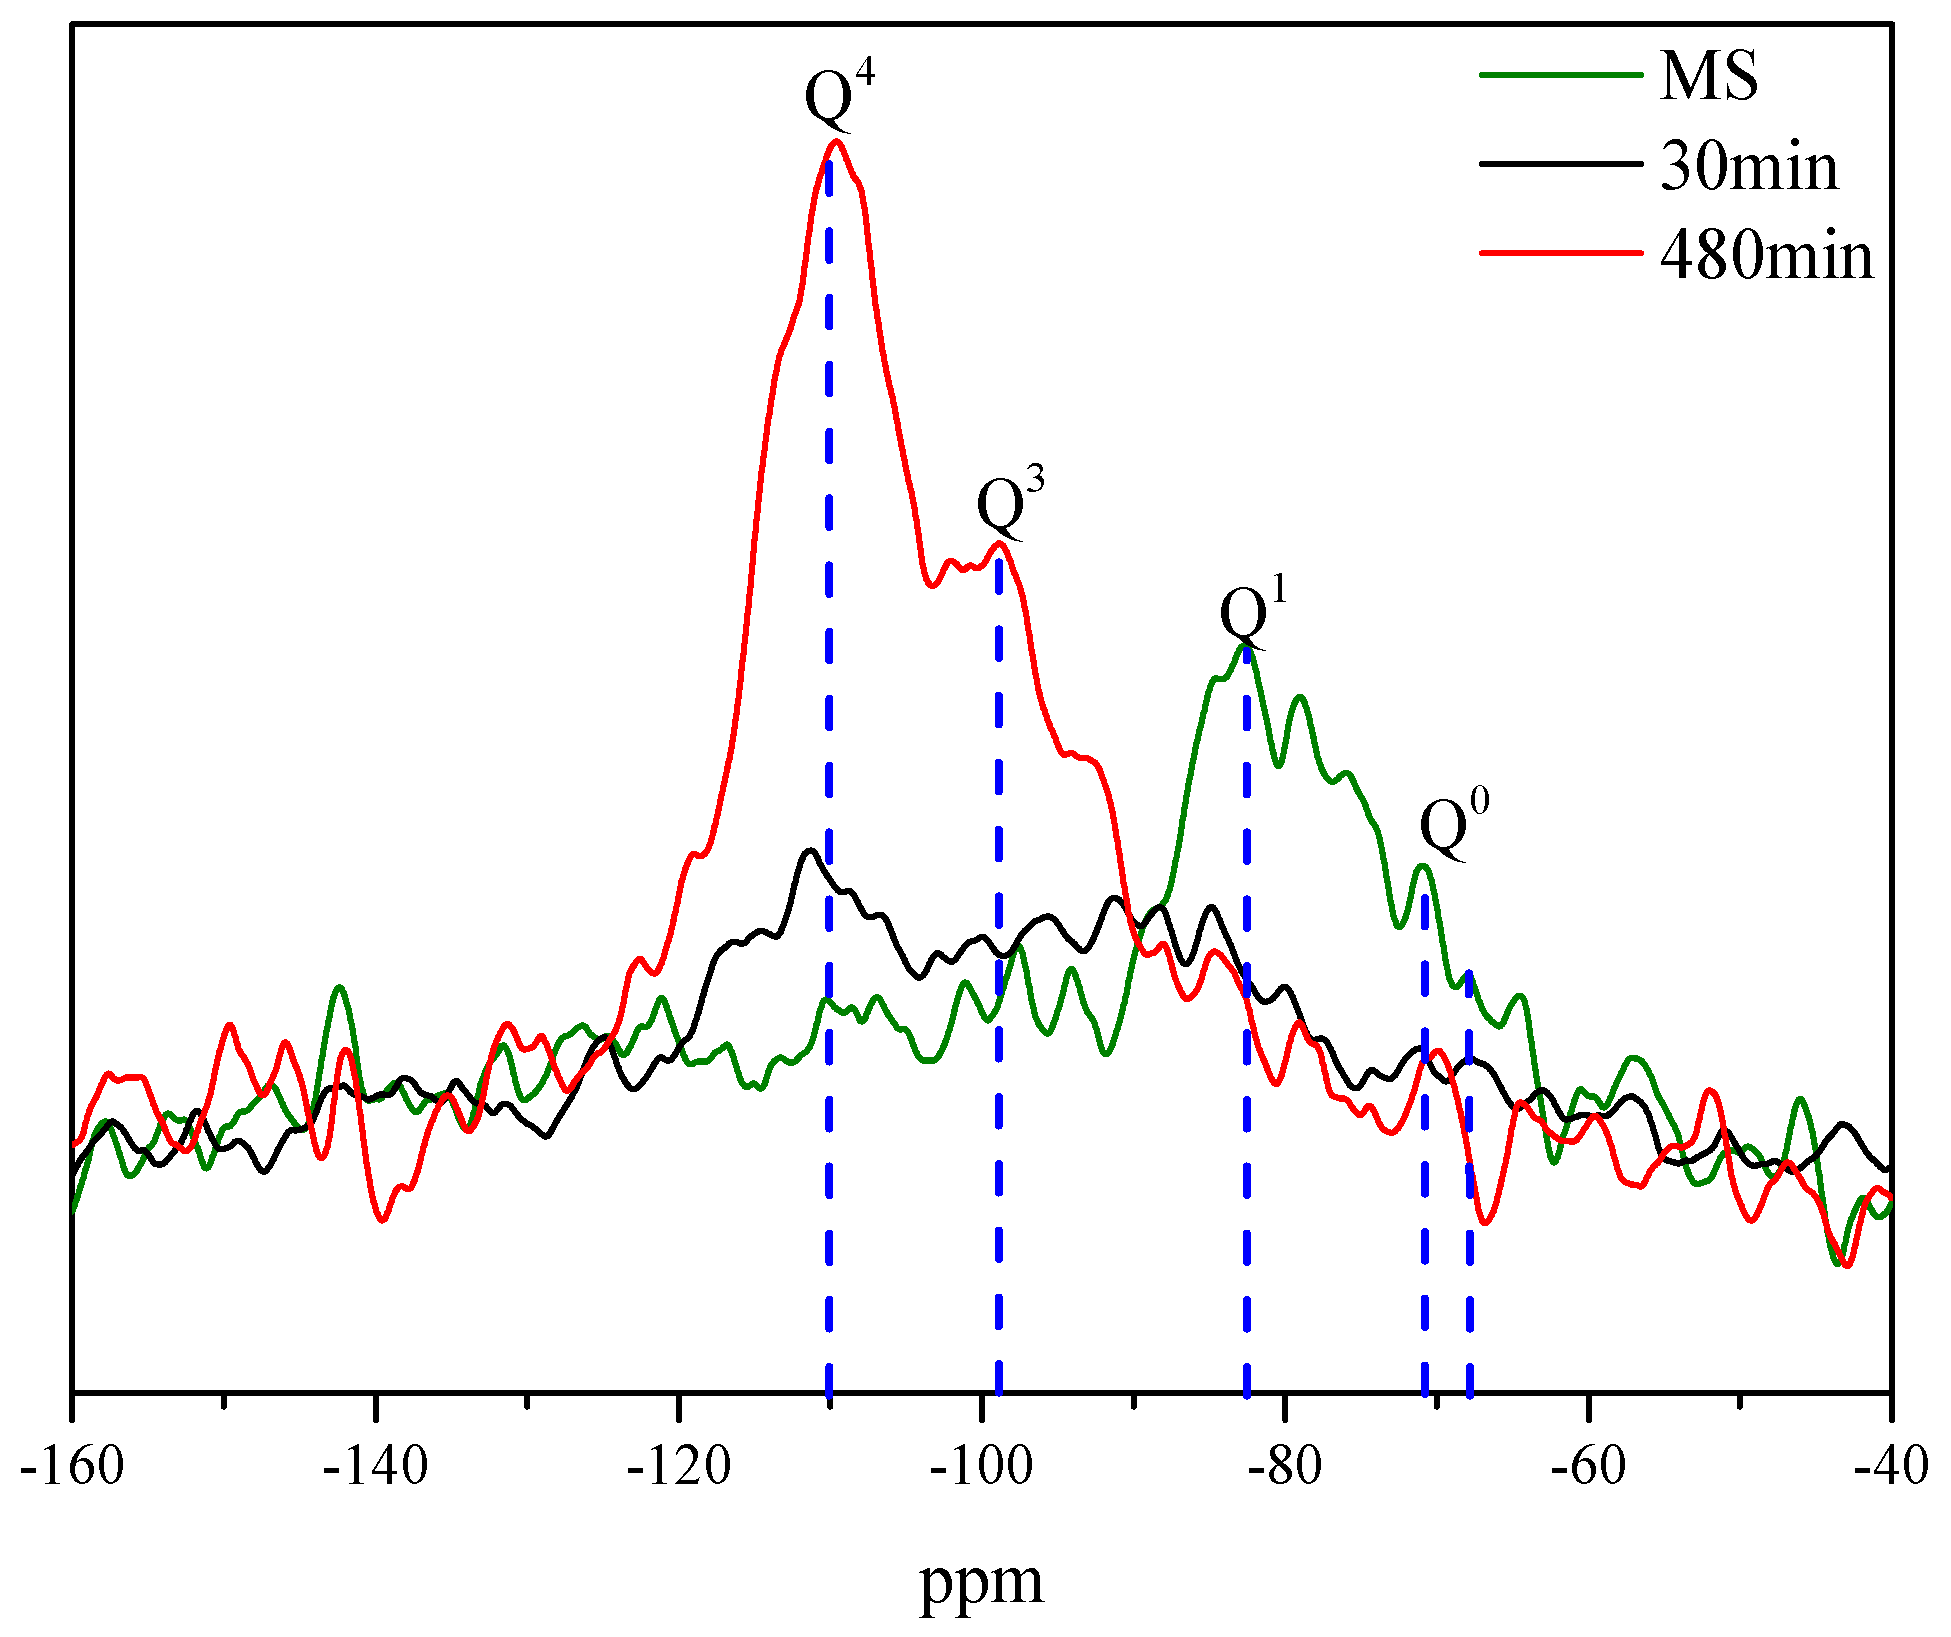
3.3.2. 29Si NMR
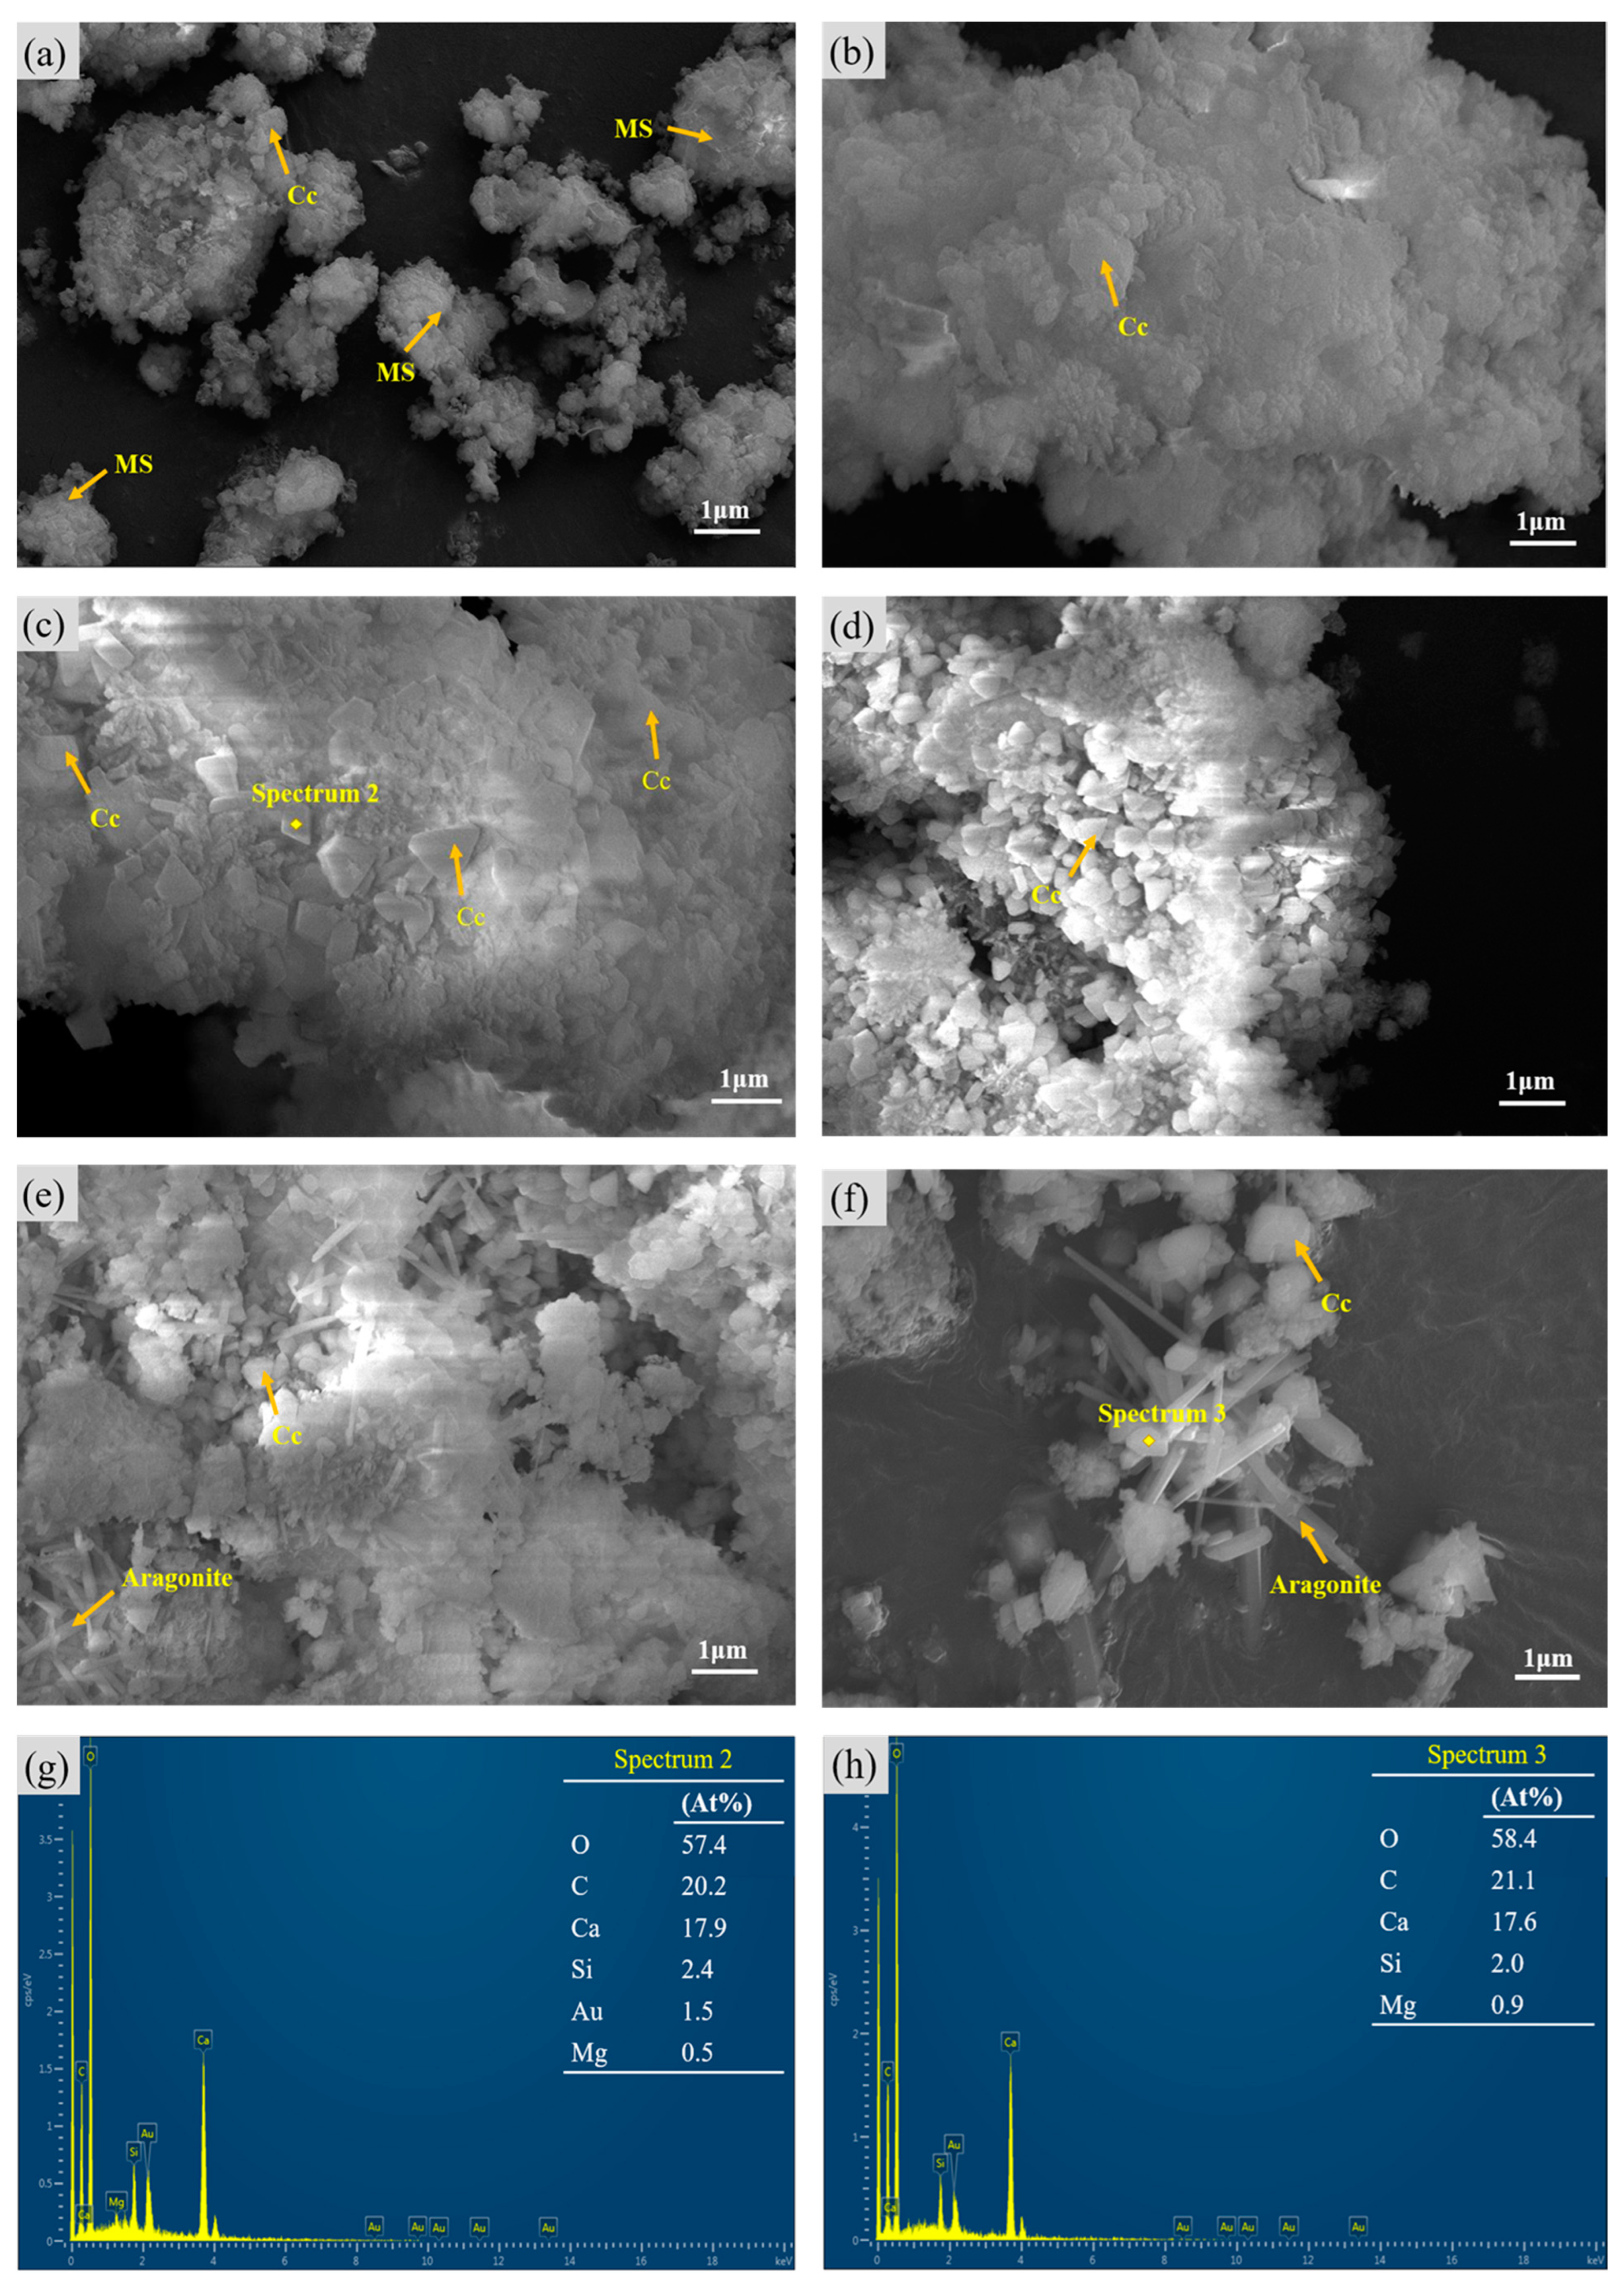
3.4. Microstructure of MS
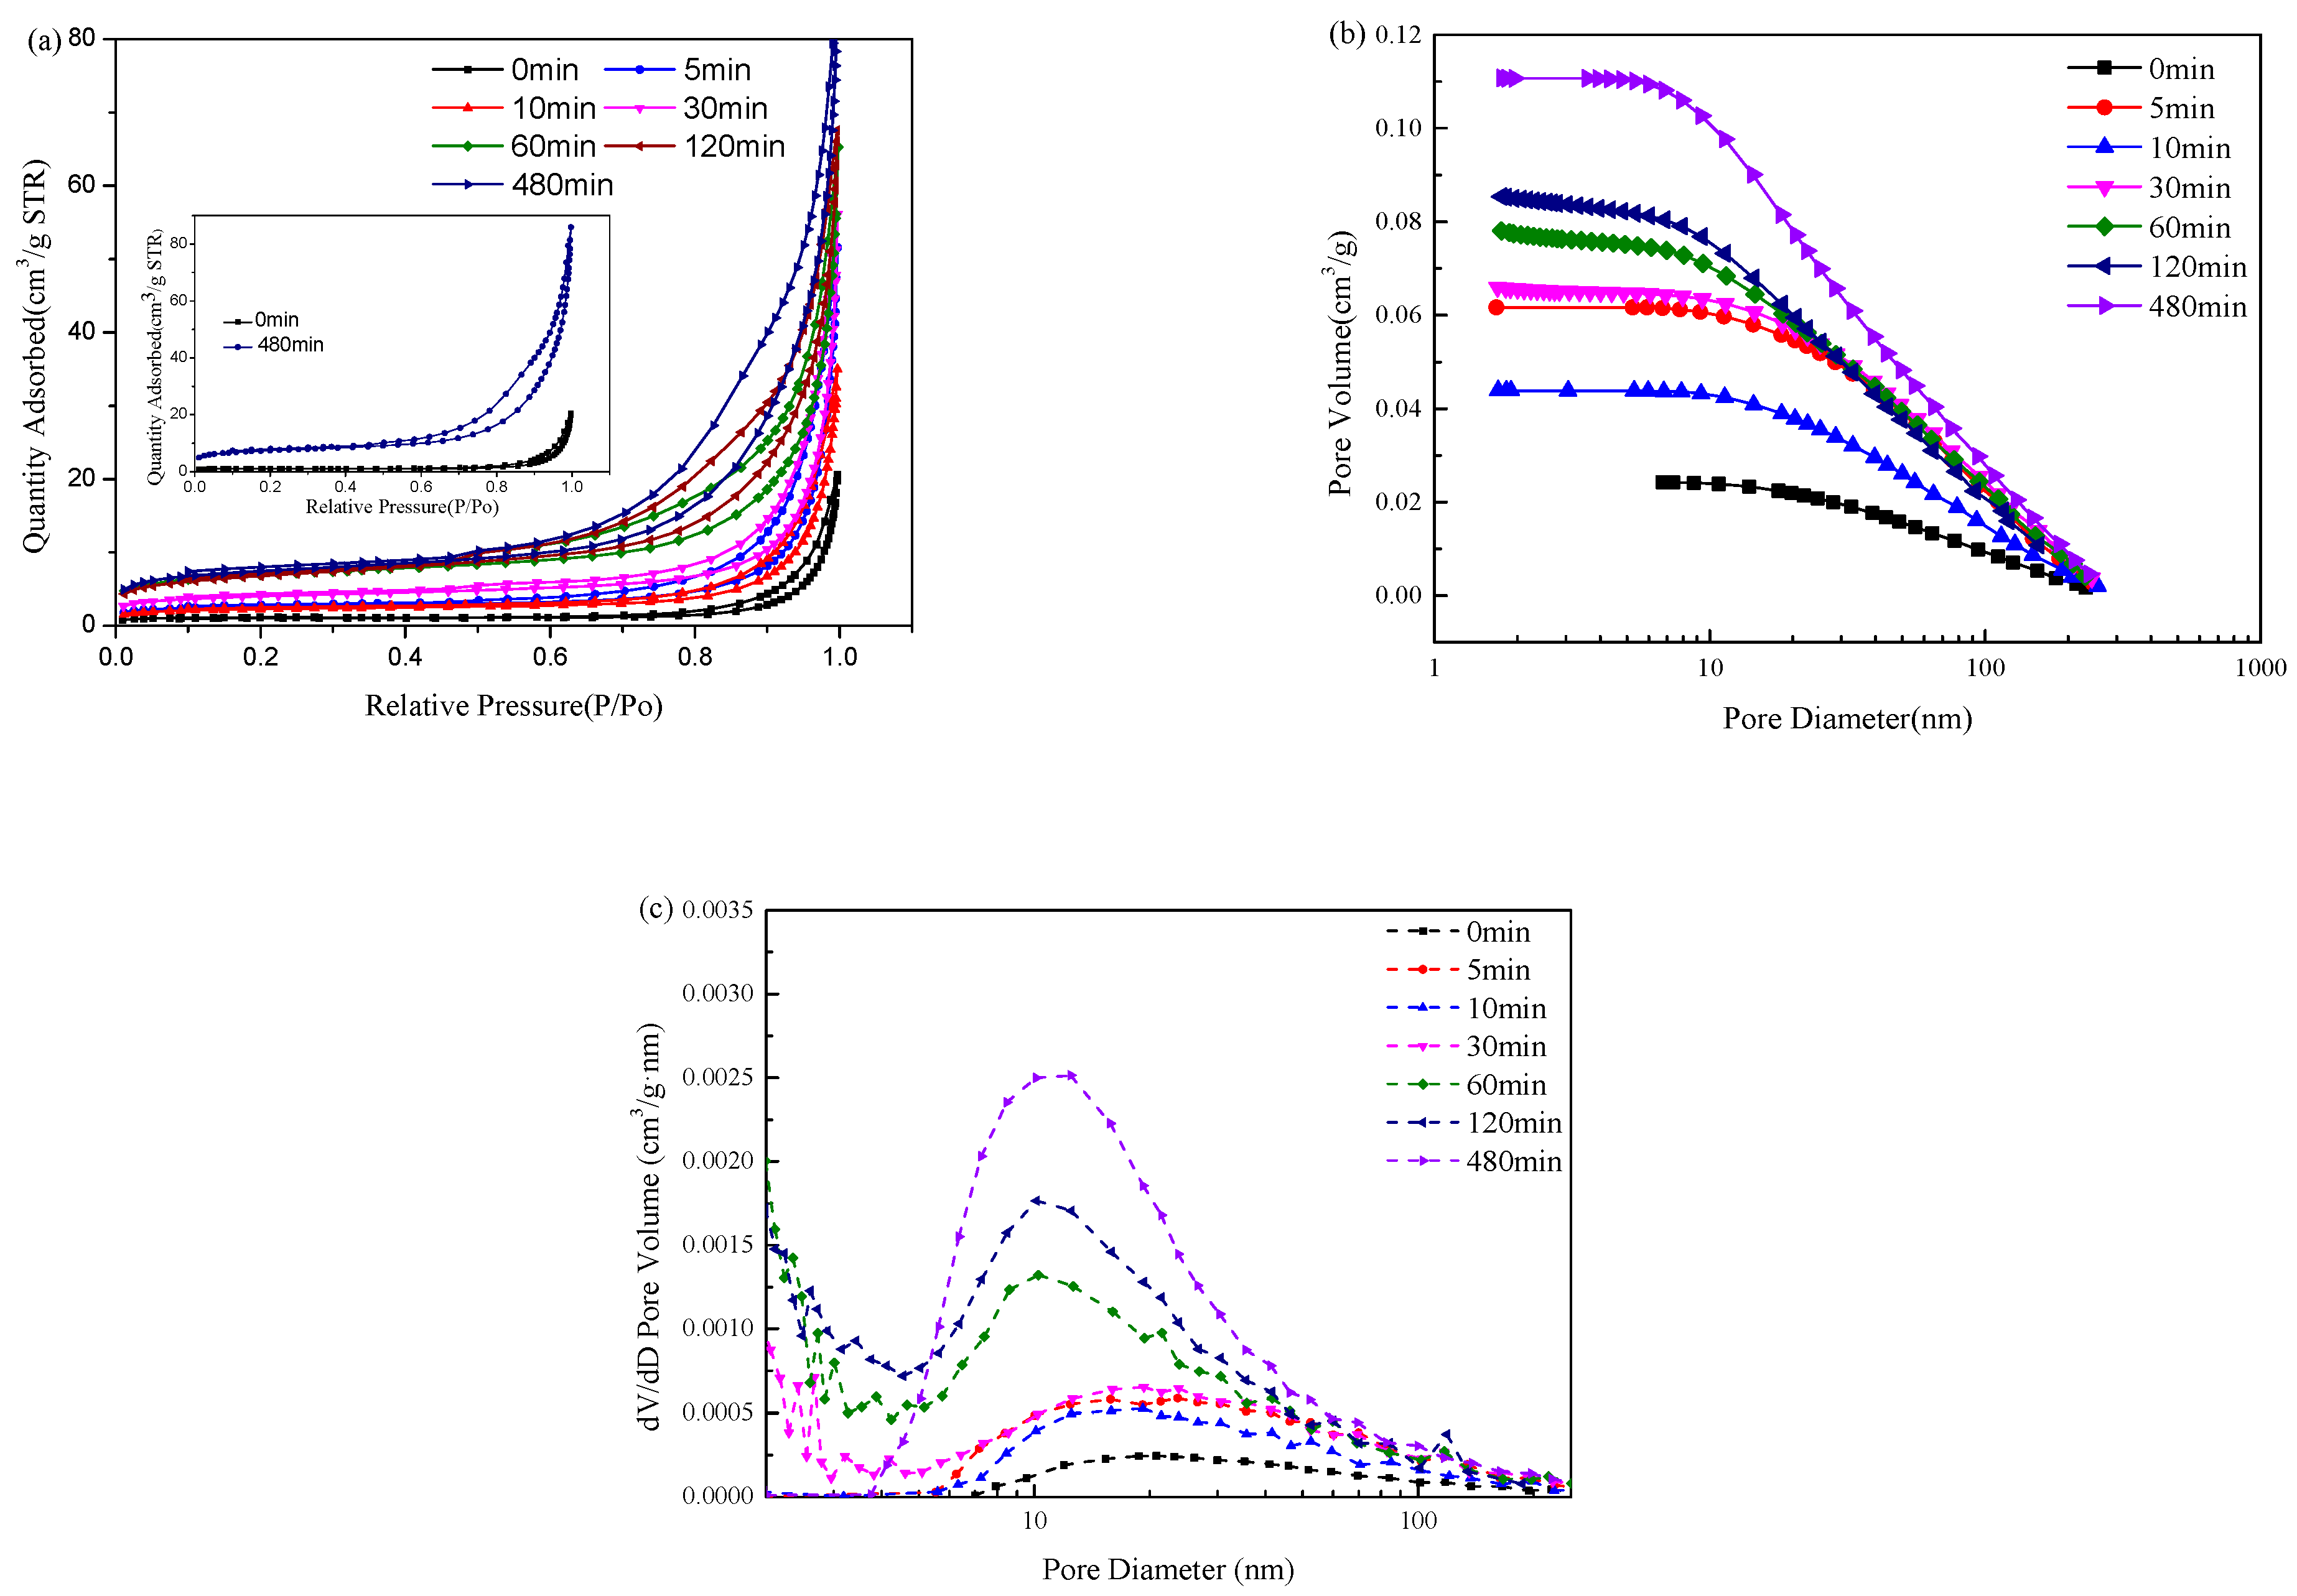
3.5. Pore Structure Evolution of MS
3.6. Feasibility of Using Carbonated MS as Mineral Admixtures
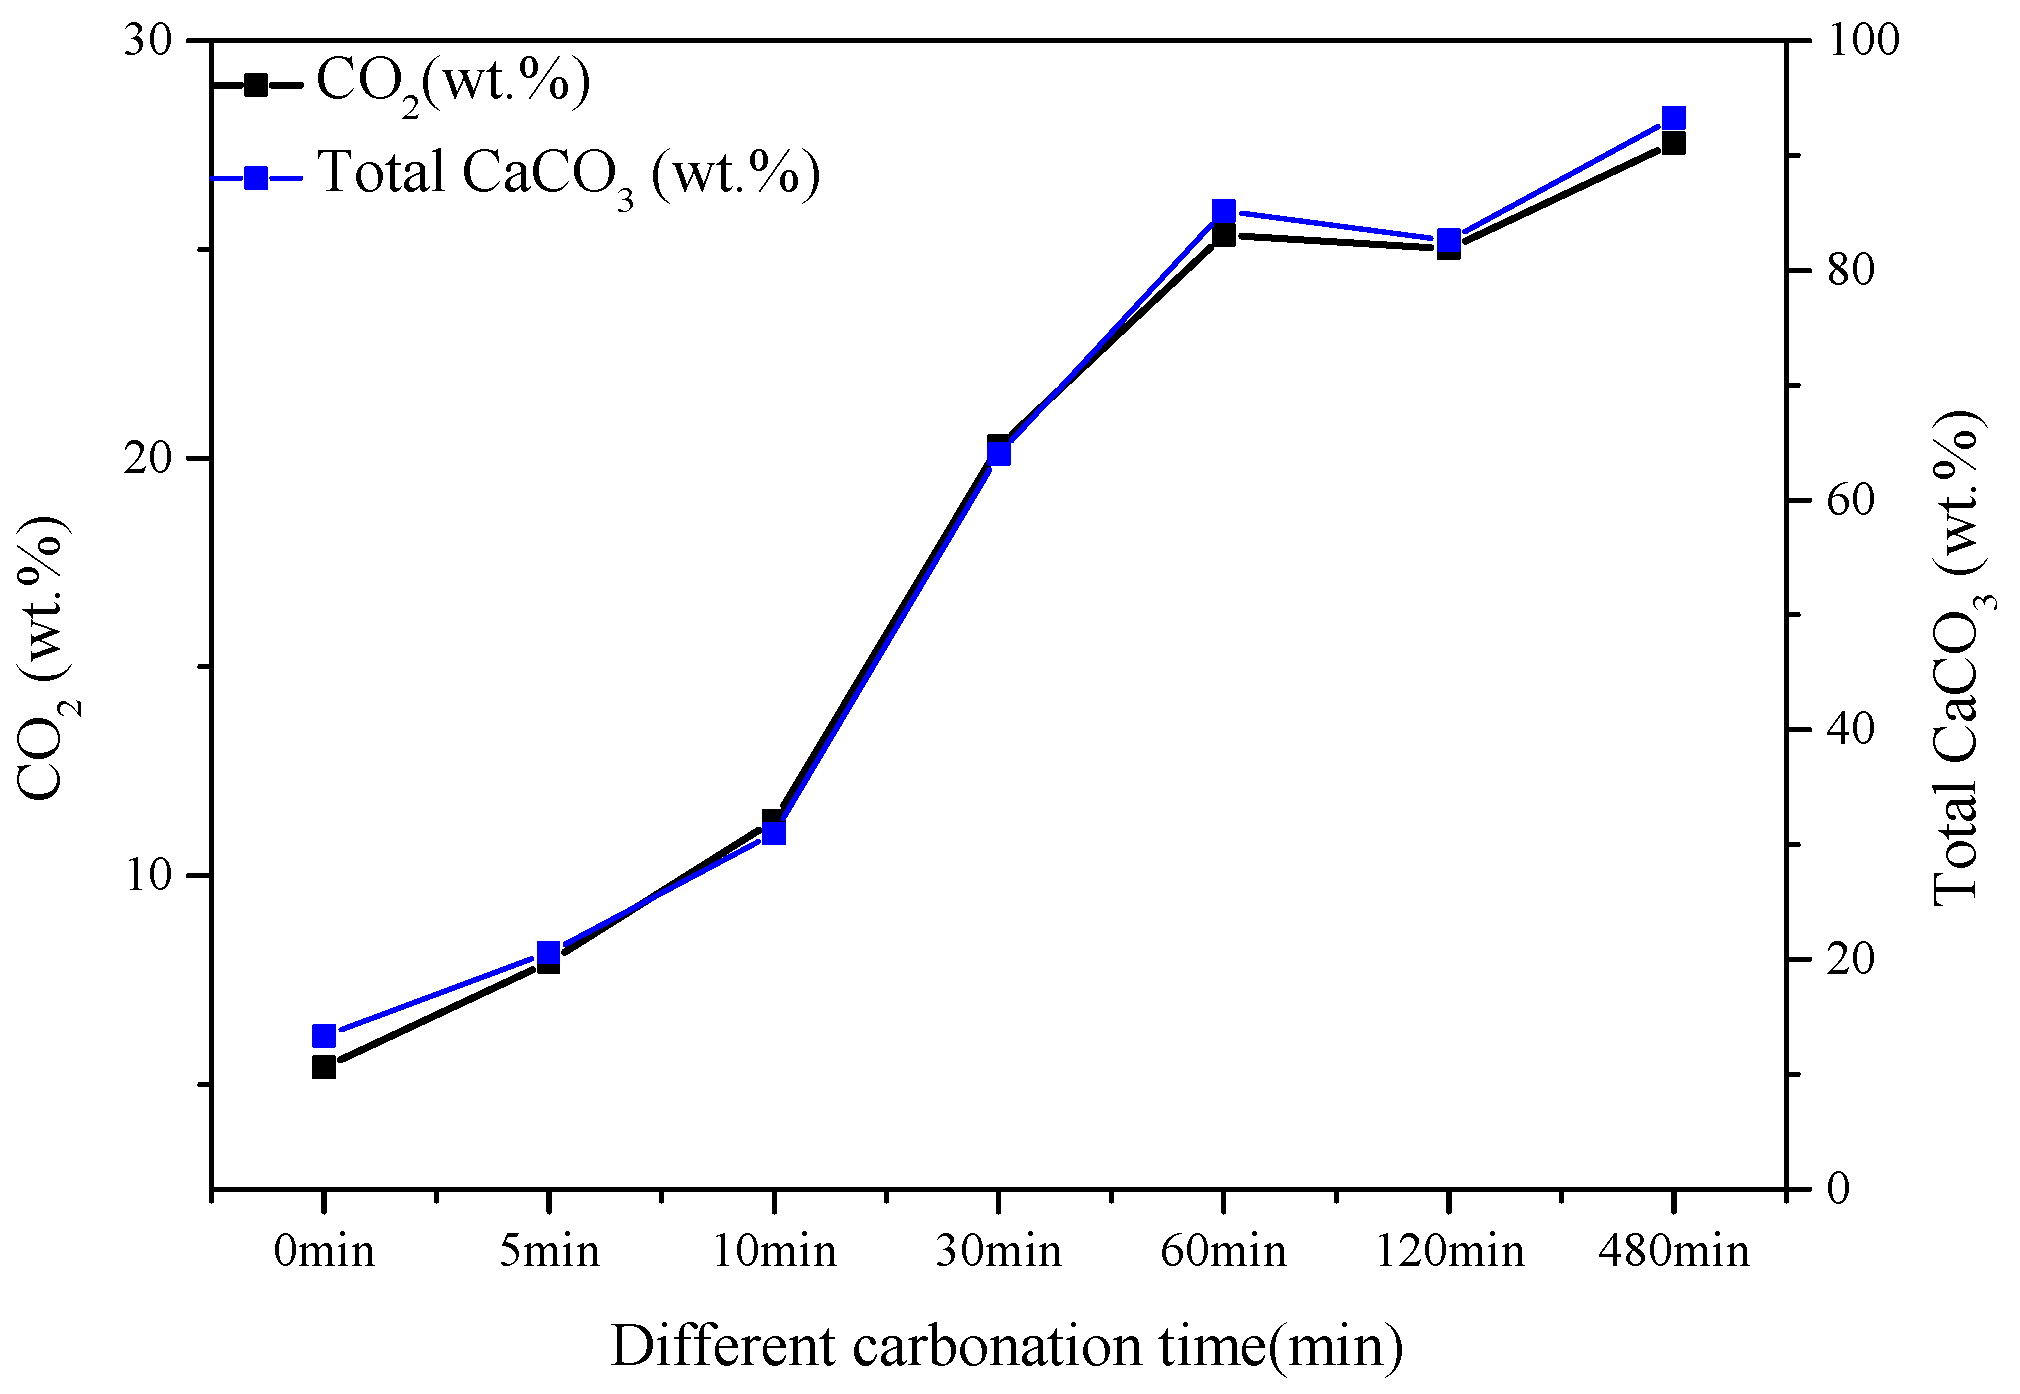
3.7. CO2 Uptake
4. Conclusions
- (1)
- The process of the carbonation reaction of MS in pure water occurs very rapidly. Within the first 30 min of carbonation, about 50% of Cc has been formed. The morphological changes were closely related to the pH evolution of the suspension.
- (2)
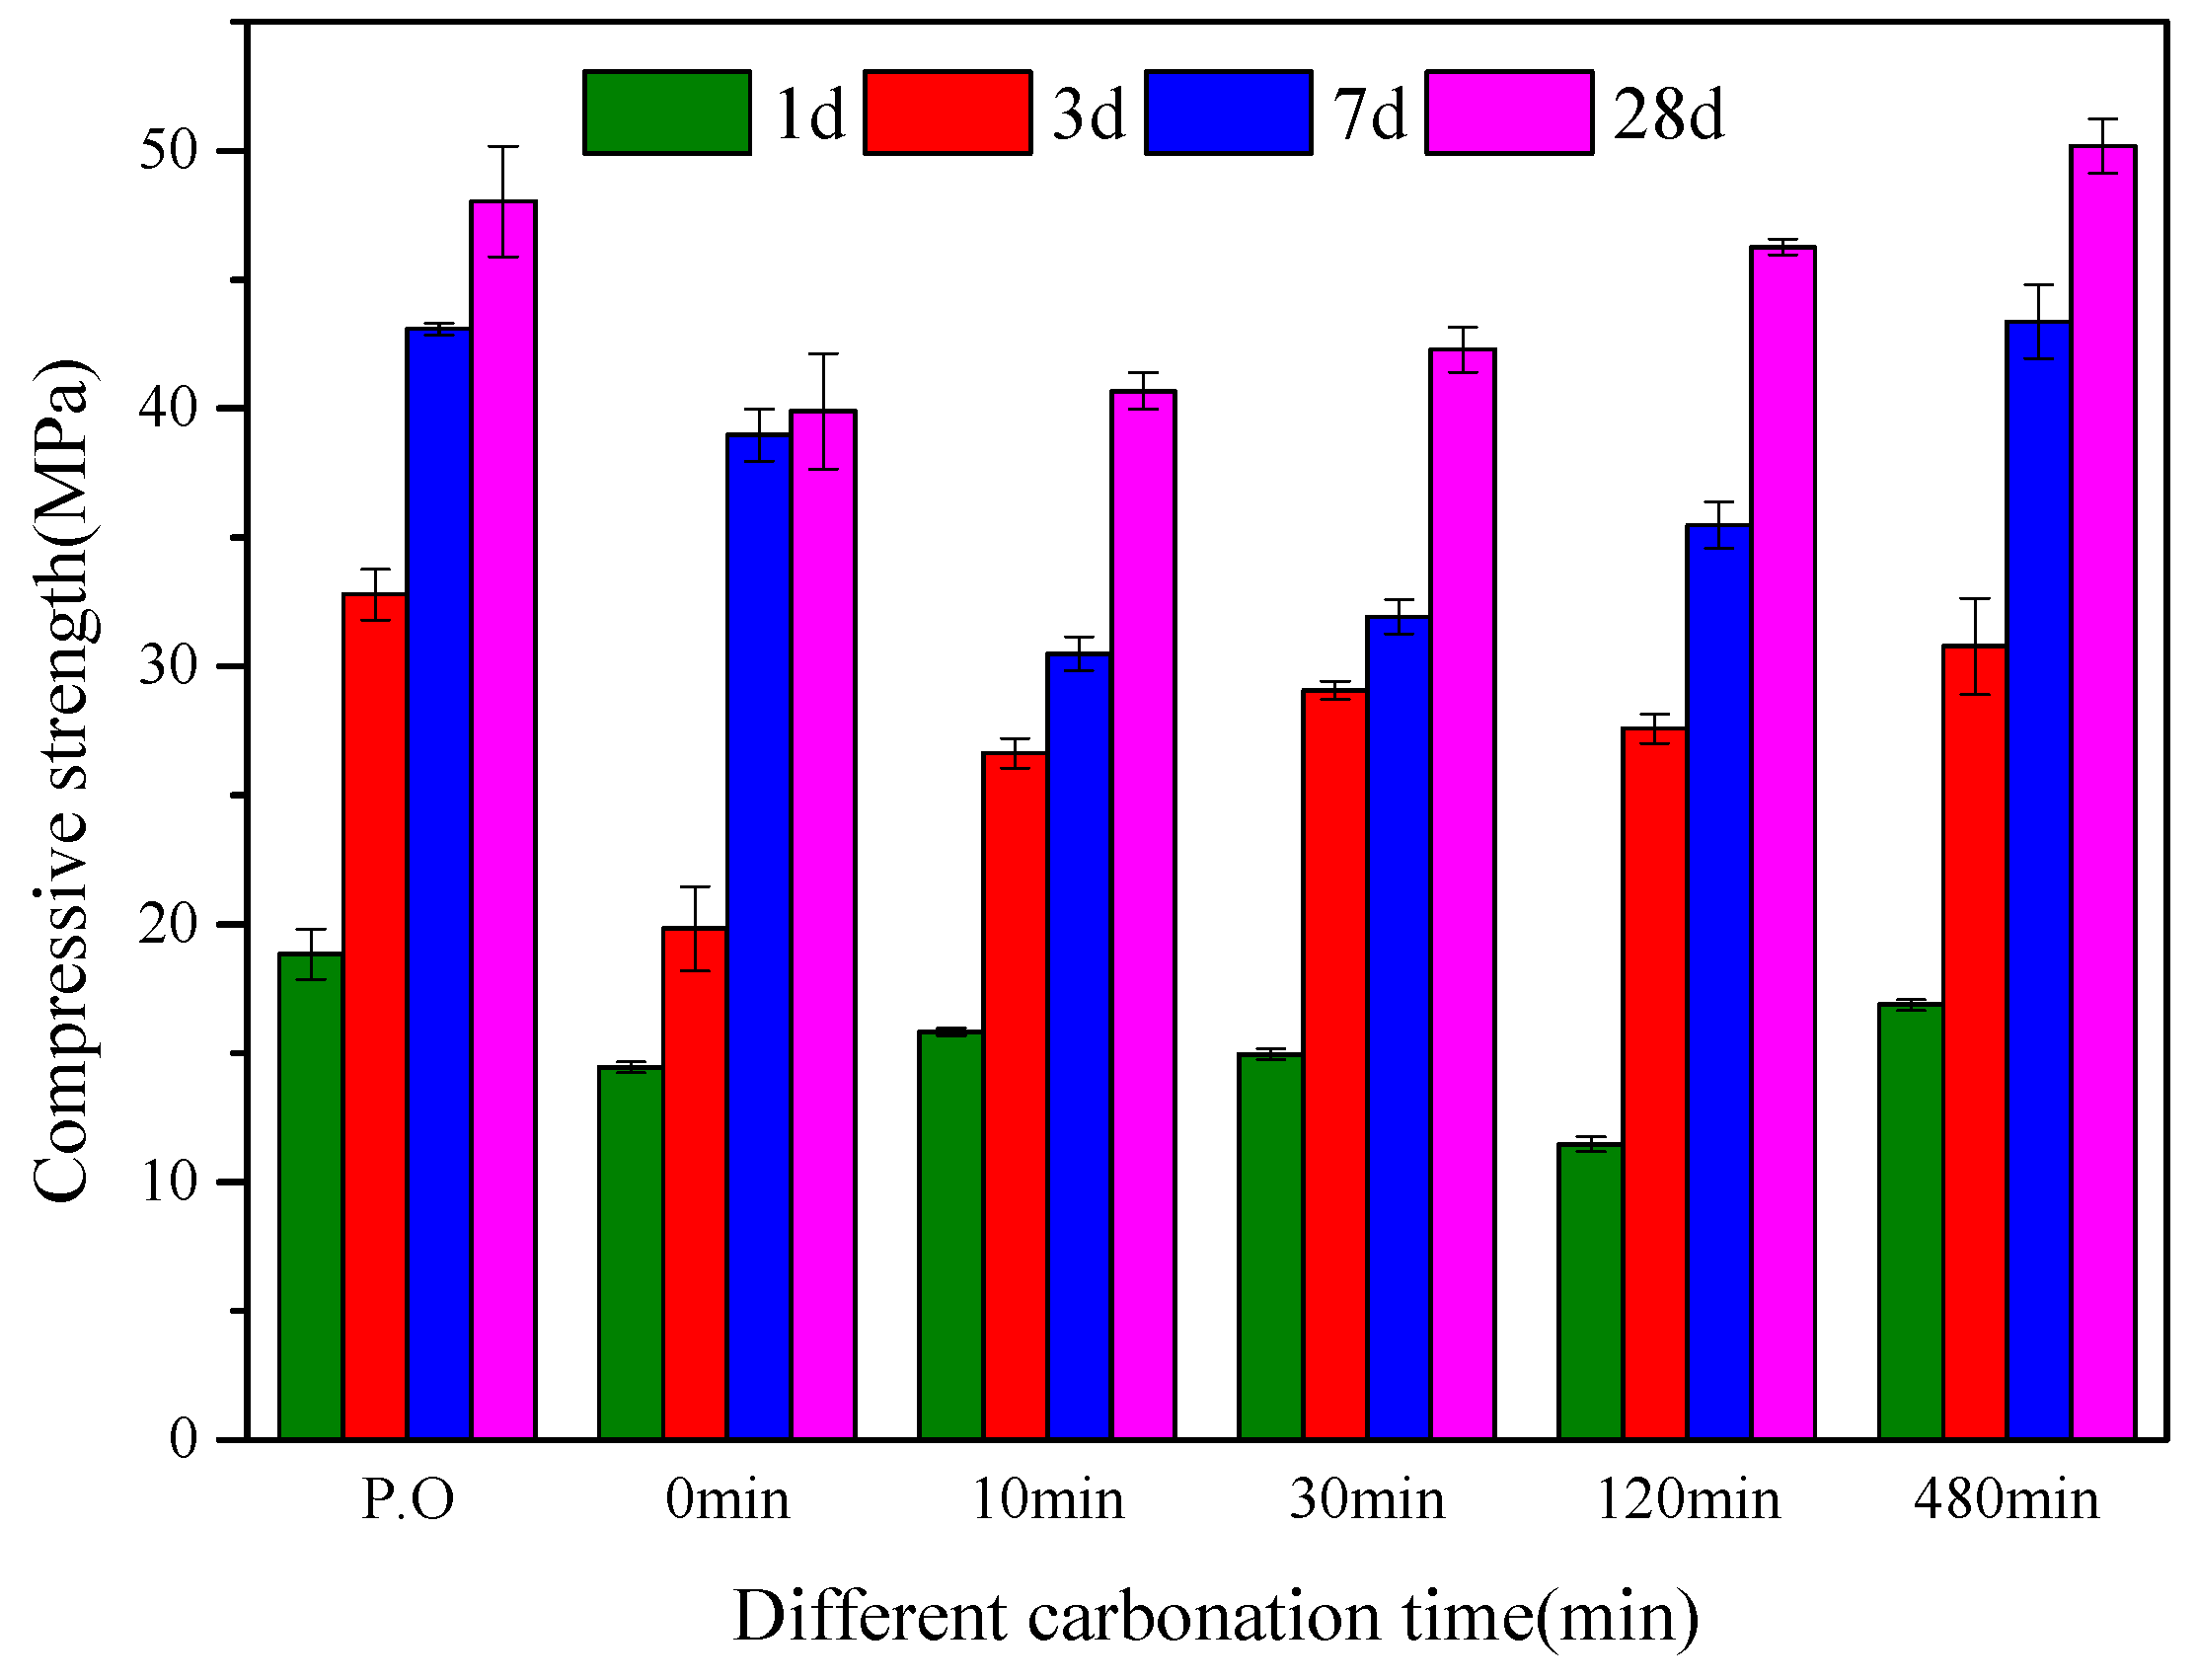
- The carbonation pretreatment of MS generated a large amount of Cc, including calcite and aragonite, and SiO2 gel with a high degree of polymerization, which improved the compressive strength of the cement paste containing C-MS mineral admixtures.
- (3)
- The compressive strengths of the cement paste with 30% C-MS were 43.38 and 50.18 MPa at 7 and 28 days, respectively, which were 11.3 and 25.8% higher than those of the cement paste with 30% MS.
Author Contributions
Funding
Institutional Review Board Statement
Informed Consent Statement
Data Availability Statement
Conflicts of Interest
References
- Wu, L.E.; Han, F.; Liu, G. Comprehensive Utilization of Magnesium Slag by Pidgeon Process; Springer Briefs in Materials; Springer Nature: Singapore, 2021. [Google Scholar]
- Zhang, W.; Luan, Z.; Ren, X.; Ye, J.; Shi, D.; Zhang, H. Influence of alumina modulus on formation of high-magnesium clinker and morphological evolution of MgO. Cem. Concr. Res. 2022, 162, 106986. [Google Scholar] [CrossRef]
- Liu, S.; Guan, X.; Zhang, S.; Dou, Z.; Feng, C.; Zhang, H.; Luo, S. Sintered bayer red mud based ceramic bricks: Microstructure evolution and alkalis immobilization mechanism. Ceram. Int. 2017, 43, 13004–13008. [Google Scholar] [CrossRef]
- Mo, L.; Zhang, F.; Deng, M.; Jin, F.; Al-Tabbaa, A.; Wang, A. Accelerated carbonation and performance of concrete made with steel slag as binding materials and aggregates. Cem. Concr. Compos. 2017, 83, 138–145. [Google Scholar] [CrossRef]
- Xiang, J.; He, Y.; Cui, X.; Liu, L. Enhancement of setting times and hardening of alkali-activated slag binder using CO2-modified slag. Cem. Concr. Compos. 2022, 134, 104797. [Google Scholar] [CrossRef]
- Guo, R.; Wang, J.; Bing, L.; Tong, D.; Ciais, P.; Davis, S.J.; Andrew, R.M.; Xi, F.; Liu, Z. Global CO2 uptake by cement from 1930 to 2019. Earth Syst. Sci. Data 2021, 13, 1791–1805. [Google Scholar]
- Wang, X.; Ni, W.; Li, J.; Zhang, S.; Li, K.; Hu, W. Use of CO2 to Cure Steel Slag and Gypsum-Based Material. Energies 2021, 14, 5174. [Google Scholar] [CrossRef]
- Hou, G.; Yan, Z.; Sun, J.; Naguib, H.M.; Lu, B.; Zhang, Z. Microstructure and mechanical properties of CO2-cured steel slag brick in pilot-scale. Constr. Build. Mater. 2021, 271, 121581. [Google Scholar] [CrossRef]
- Ashraf, W. Carbonation of cement-based materials: Challenges and opportunities. Constr. Build. Mater. 2016, 120, 558–570. [Google Scholar] [CrossRef]
- Morandeau, A.; Thiéry, M.; Dangla, P. Impact of accelerated carbonation on OPC cement paste blended with fly ash. Cem. Concr. Res. 2015, 65, 226–236. [Google Scholar] [CrossRef]
- Khan, R.I.; Haque, M.I.; Ashraf, W.; Shah, S.; Saleh, N. Role of biopolymers in enhancing multiscale characteristics of carbonation-cured cementitious composites. Cem. Concr. Compos. 2022, 134, 104766. [Google Scholar] [CrossRef]
- Duvallet, T.Y.; Mahmoodabadi, M.; Oberlink, A.E.; Robl, T.L.; Jewell, R.B. Production of α’H-belite-CSA cement at low firing temperatures. Cem. Concr. Compos. 2022, 134, 104820. [Google Scholar] [CrossRef]
- Durastanti, C.; Moretti, L. Environmental Impacts of Cement Production: A Statistical Analysis. Appl. Sci. 2020, 10, 8212. [Google Scholar] [CrossRef]
- Mishra, U.C.; Sarsaiya, S.; Gupta, A. A systematic review on the impact of cement industries on the natural environment. Environ. Sci. Pollut. Res. 2022, 29, 18440–18451. [Google Scholar] [CrossRef] [PubMed]
- Kalla, P.; Misra, A.; Gupta, R.C.; Csetenyi, L.; Gahlot, V.; Arora, A. Mechanical and durability studies on concrete containing wollastonite-fly ash combination. Constr. Build. Mater. 2013, 40, 1142–1150. [Google Scholar] [CrossRef]
- Chen, T.; Bai, M.; Gao, X. Carbonation curing of cement mortars incorporating carbonated fly ash for performance improvement and CO2 sequestration. J. CO2 Util. 2021, 51, 101633. [Google Scholar] [CrossRef]
- Li, Q.; Zhang, L.; Gao, X.; Zhang, J. Effect of pulverized fuel ash, ground granulated blast-furnace slag and CO2 curing on performance of magnesium oxysulfate cement. Constr. Build. Mater. 2020, 230, 116990. [Google Scholar] [CrossRef]
- Qu, M.; Liu, P.; Zhao, D.; Wang, F.; Hu, C.; Zhao, C. CO2 capture and conversion by an organosilane-modified cementitious material. Constr. Build. Mater. 2020, 253, 119198. [Google Scholar] [CrossRef]
- Mo, L.; Panesar, D.K. Accelerated carbonation-A potential approach to sequester CO2 in cement paste containing slag and reactive MgO. Cem. Concr. Compos. 2013, 43, 69–77. [Google Scholar] [CrossRef]
- Huang, H.; Guo, R.; Wang, T.; Hu, X.; Garcia, S.; Fang, M.; Luo, Z.; Maroto-Valer, M.M. Carbonation curing for wollastonite-Portland cementitious materials: CO2 sequestration potential and feasibility assessment. J. Clean. Prod. 2019, 211, 830–841. [Google Scholar] [CrossRef]
- Liu, S.; Zhang, L.; Xuan, D.; Shen, P.; Zhu, J.; Guan, X.; Shi, C. Enhanced carbonation reactivity of wollastonite by rapid cooling process: Towards an ultra-low calcium CO2 sequestration binder. Constr. Build. Mater. 2021, 299, 124336. [Google Scholar] [CrossRef]
- Daval, D.; Martinez, I.; Corvisier, J.; Findling, N.; Goffé, B.; Guyot, F. Carbonation of Ca-bearing silicates, the case of wollastonite: Experimental investigations and kinetic modeling. Chem. Geol. 2009, 265, 63–78. [Google Scholar] [CrossRef]
- Shen, Y.; Liu, S.; Wang, Y.; Shen, P.; Xuan, D.; Guan, X.; Shi, C. Hydration-hardening properties of low-clinker composite cement incorporating carbonated waste sintering red mud and metakaolin. Constr. Build. Mater. 2022, 354, 129171. [Google Scholar] [CrossRef]
- Fan, B.-G.; Jia, L.; Han, F.; Huo, R.-P.; Yao, Y.-X.; Qiao, X.-L.; Zhao, C.-W.; Jin, Y. Study on magnesium slag desulfurizer modified by additives in quenching hydration. J. Mater. Cycles Waste Manag. 2019, 21, 1211–1223. [Google Scholar] [CrossRef]
- Raia, A.; Tahwia, A.; Raheem, A.H.A.; Elrahman, M.A. Synergistic influence of metakaolin and slag cement on the properties of self-compacting fiber-reinforced concrete. Innov. Infrastruct. Solut. 2022, 7, 69. [Google Scholar] [CrossRef]
- Ji, G.; Peng, X.; Wang, S.; Hu, C.; Ran, P.; Sun, K.; Zeng, L. Influence of magnesium slag as a mineral admixture on the performance of concrete. Constr. Build. Mater. 2021, 295, 123619. [Google Scholar] [CrossRef]
- Jia, L.; Han, F.; Li, Z.-P.; Guo, J.-R.; Zhang, Y.-Q.; Wang, Y.-L.; Fan, H.-D.; Zhang, L.; Fan, B.-G.; Jin, Y. Influence mechanism of additives on the crystal structure and desulfurization performance of magnesium slag. J. Mater. Cycles Waste Manag. 2021, 23, 1114–1125. [Google Scholar] [CrossRef]
- Hu, L.; Jia, Y.; Chen, Z.; Yao, Y.; Sun, J.; Xie, Q.; Yang, H. An insight of carbonation-hydration kinetics and microstructure characterization of cement paste under accelerated carbonation at early age. Cem. Concr. Compos. 2022, 134, 104763. [Google Scholar] [CrossRef]
- Liu, P.; Zhong, J.; Zhang, M.; Mo, L.; Deng, M. Effect of CO2 treatment on the microstructure and properties of steel slag supplementary cementitous materials. Constr. Build. Mater. 2021, 309, 125171. [Google Scholar] [CrossRef]
- Liu, P.; Zhang, M.; Mo, L.; Zhong, J.; Xu, M.; Deng, M. Probe into carbonation mechanism of steel slag via FIB-TEM: The roles of various mineral phases. Cem. Concr. Res. 2022, 162, 106991. [Google Scholar] [CrossRef]
- Fang, Y.; Su, W.; Zhang, Y.; Zhang, M.; Ding, X.; Wang, Q. Effect of accelerated precarbonation on hydration activity and volume stability of steel slag as a supplementary cementitious material. J. Therm. Anal. Calorim. 2022, 147, 6181–6191. [Google Scholar] [CrossRef]
- Yu, C.; Cui, C.; Zhao, J.; Zheng, J. Carbonation properties of dredged slurry pre-dried with steel slag powder: Effects of clay minerals and organic acids. Constr. Build. Mater. 2022, 353, 129096. [Google Scholar] [CrossRef]
- Rathnarajan, S.; Dhanya, B.S.; Pillai, R.G.; Gettu, R.; Santhanam, M. Carbonation model for concretes with fly ash, slag, and limestone calcined clay-using accelerated and five-year natural exposure data. Cem. Concr. Compos. 2022, 126, 104329. [Google Scholar] [CrossRef]
- Marple, M.A.; Koroglu, B.; Morrison, K.; Crowhurst, J.; Balachandra, A.; Soroushian, P.; Mason, H.E. Accelerated carbonation and structural transformation of blast furnace slag by mechanochemical alkali-activation. Cem. Concr. Res. 2022, 156, 106760. [Google Scholar] [CrossRef]
- Yuan, Q.; Yang, G.; Zhang, Y.; Wang, T.; Wang, J.; Romero, C.E. Supercritical CO2 coupled with mechanical force to enhance carbonation of fly ash and heavy metal solidification. Fuel 2022, 315, 123154. [Google Scholar] [CrossRef]
- Ho, H.; Iizuka, A.; Shibata, E. Utilization of low-calcium fly ash via direct aqueous carbonation with a low-energy input: Determination of carbonation reaction and evaluation of the potential for CO2 sequestration and utilization. J. Environ. Manag. 2021, 288, 112411. [Google Scholar] [CrossRef]
- Van den Heede, P.; Thiel, C.; De Belie, N. Natural and accelerated carbonation behaviour of high-volume fly ash (HVFA) mortar: Effects on internal moisture, microstructure and carbonated phase proportioning. Cem. Concr. Compos. 2020, 113, 103713. [Google Scholar] [CrossRef]
- Justnes, H.; Skocek, J.; Østnor, T.A.; Engelsen, C.J.; Skjølsvold, O. Microstructural changes of hydrated cement blended with fly ash upon carbonation. Cem. Concr. Res. 2020, 137, 106192. [Google Scholar] [CrossRef]
- Zhang, D.; Yang, Q.; Mao, M.; Li, J. Carbonation performance of concrete with fly ash as fine aggregate after stress damage and high temperature exposure. Constr. Build. Mater. 2020, 242, 118125. [Google Scholar] [CrossRef]
- Ke, X.; Bernal, S.A.; Provis, J.L.; Lothenbach, B. Thermodynamic modelling of phase evolution in alkali-activated slag cements exposed to carbon dioxide. Cem. Concr. Res. 2020, 136, 106158. [Google Scholar] [CrossRef]
- Mo, L.; Hao, Y.; Liu, Y.; Wang, F.; Deng, M. Preparation of calcium carbonate binders via CO2 activation of magnesium slag. Cem. Concr. Res. 2019, 121, 81–90. [Google Scholar] [CrossRef]
- Fang, X.; Xuan, D.; Zhan, B.; Li, W.; Poon, C.S. A novel upcycling technique of recycled cement paste powder by a two-step carbonation process. J. Clean. Prod. 2021, 290, 125192. [Google Scholar] [CrossRef]
- Fang, X.; Xuan, D.; Zhan, B.; Li, W.; Poon, C.S. Characterization and optimization of a two-step carbonation process for valorization of recycled cement paste fine powder. Constr. Build. Mater. 2021, 278, 122343. [Google Scholar] [CrossRef]
- Shen, P.; Sun, Y.; Liu, S.; Jiang, Y.; Zheng, H.; Xuan, D.; Lu, J.; Poon, C.S. Synthesis of amorphous nano-silica from recycled concrete fines by two-step wet carbonation. Cem. Concr. Res. 2021, 147, 106526. [Google Scholar] [CrossRef]
- Lu, B.; Shi, C.; Zhang, J.; Wang, J. Effects of carbonated hardened cement paste powder on hydration and microstructure of Portland cement. Constr. Build. Mater. 2018, 186, 699–708. [Google Scholar] [CrossRef]
- Zajac, M.; Skibsted, J.; Durdzinski, P.; Bullerjahn, F.; Skocek, J.; Haha, M.B. Kinetics of enforced carbonation of cement paste. Cem. Concr. Res. 2020, 131, 106013. [Google Scholar] [CrossRef]
- Zajac, M.; Skocek, J.; Durdzinski, P.; Bullerjahn, F.; Skibsted, J.; Haha, M.B. Effect of carbonated cement paste on composite cement hydration and performance. Cem. Concr. Res. 2020, 134, 106090. [Google Scholar] [CrossRef]
- Zajac, M.; Lechevallier, A.; Durdzinski, P.; Bullerjahn, F.; Skibsted, J.; Haha, M.B. CO2 mineralisation of Portland cement: Towards understanding the mechanisms of enforced carbonation. J. CO2 Util. 2020, 38, 398–415. [Google Scholar] [CrossRef]
- Liu, S.; Shen, Y.; Wang, Y.; Shen, P.; Xuan, D.; Guan, X.; Shi, C. Upcycling sintering red mud waste for novel superfine composite mineral admixture and CO2 sequestration. Cem. Concr. Compos. 2022, 129, 104497. [Google Scholar] [CrossRef]
- Luo, S.; Zhao, M.; Jiang, Z.; Liu, S.; Yang, L.; Mao, Y.; Pan, C. Microwave preparation and carbonation properties of low-carbon cement. Constr. Build. Mater. 2022, 320, 126239. [Google Scholar] [CrossRef]
- Ashraf, W.; Olek, J.; Sahu, S. Phase evolution and strength development during carbonation of low-lime calcium silicate cement (CSC). Constr. Build. Mater. 2019, 210, 473–482. [Google Scholar] [CrossRef]
- Zhao, S.; Liu, Z.; Wang, F. Carbonation reactivity enhancement of γ-C2S through biomineralization. J. CO2 Util. 2020, 39, 101183. [Google Scholar] [CrossRef]
- Lu, B.; He, P.; Liu, J.; Peng, Z.; Song, B.; Hu, X. Microstructure of Portland cement paste subjected to different CO2 concentrations and further water curing. J. CO2 Util. 2021, 53, 101714. [Google Scholar] [CrossRef]
- Xue, J.; Liu, S.; Ma, X.; Teng, Y.; Guan, X. Effect of different gypsum dosage on the chloride binding properties of C4AF hydrated paste. Constr. Build. Mater. 2022, 315, 125562. [Google Scholar] [CrossRef]
- Thiery, M.; Villain, G.; Dangla, P.; Platret, G. Investigation of the carbonation front shape on cementitious materials:Effects of the chemical kinetics. Cem. Concr. Res. 2007, 37, 1047–1058. [Google Scholar] [CrossRef]
- Li, H.; Liu, Y.; Yang, K.; Liu, C.; Guan, X.; Liu, S.; Jing, G. Effects of synthetic CSH-tartaric acid nanocomposites on the properties of ordinary Portland cement. Cem. Concr. Compos. 2022, 129, 104466. [Google Scholar] [CrossRef]
- Mo, L.; Panesar, D. Effects of accelerated carbonation on the microstructure of Portland cement pastes containing reactive MgO. Cem. Concr. Res. 2012, 42, 769–777. [Google Scholar] [CrossRef]
- Sevelsted, T.F.; Skibsted, J. Carbonation of C-S-H and C-A-S-H samples studied by 13C, 27Al and 29Si MAS NMR spectroscopy. Cem. Concr. Res. 2015, 71, 56–65. [Google Scholar] [CrossRef]
- Tahwia, A.M.; Abd Ellatief, M.; Heneigel, A.M.; Abd Elrahman, M. Characteristics of eco-friendly ultra-high-performance geopolymer concrete incorporating waste materials. Ceram. Int. 2022, 48, 19662–19674. [Google Scholar] [CrossRef]
- Alsaadawi, M.M.; Amin, M.; Tahwia, A. Thermal, mechanical and microstructural properties of sustainable concrete incorporating Phase change materials. Constr. Build. Mater. 2022, 356, 129300. [Google Scholar] [CrossRef]
- Mel’Gunov, M.S.; Ayupov, A. Direct method for evaluation of BET adsorbed monolayer capacity. Microporous Mesoporous Mater. 2017, 243, 147–153. [Google Scholar] [CrossRef]


| Oxide | SiO2 | Al2O3 | CaO | Fe2O3 | MgO | Others |
|---|---|---|---|---|---|---|
| MS | 29.88 | 1.06 | 50.98 | 3.52 | 11.27 | 3.29 |
| OPC | 23.17 | 5.37 | 61.86 | 3.32 | 2.78 | 3.5 |
| Time/min | 0 min | 5 min | 10 min | 30 min | 60 min | 120 min | 480 min |
|---|---|---|---|---|---|---|---|
| Cc wt.% | 7.9 | 30.6 | 43.5 | 92.8 | 93.2 | 90.2 | 83.2 |
| Carbonation Time | Surface Area a (m2/g) | Pore Volume b (cm3/g) |
|---|---|---|
| 0 min | 3.5305 | 0.024245 |
| 5 min | 8.4097 | 0.061703 |
| 10 min | 7.3247 | 0.043953 |
| 30 min | 13.1911 | 0.066004 |
| 60 min | 22.7523 | 0.078075 |
| 120 min | 22.8674 | 0.085418 |
| 480 min | 24.5005 | 0.110765 |
Disclaimer/Publisher’s Note: The statements, opinions and data contained in all publications are solely those of the individual author(s) and contributor(s) and not of MDPI and/or the editor(s). MDPI and/or the editor(s) disclaim responsibility for any injury to people or property resulting from any ideas, methods, instructions or products referred to in the content. |
© 2023 by the authors. Licensee MDPI, Basel, Switzerland. This article is an open access article distributed under the terms and conditions of the Creative Commons Attribution (CC BY) license (https://creativecommons.org/licenses/by/4.0/).
Share and Cite
Ye, J.; Liu, S.; Zhao, Y.; Li, Y.; Fang, J.; Zhang, H.; Guan, X. Development of Ultrafine Mineral Admixture from Magnesium Slag and Sequestration of CO2. Buildings 2023, 13, 204. https://doi.org/10.3390/buildings13010204
Ye J, Liu S, Zhao Y, Li Y, Fang J, Zhang H, Guan X. Development of Ultrafine Mineral Admixture from Magnesium Slag and Sequestration of CO2. Buildings. 2023; 13(1):204. https://doi.org/10.3390/buildings13010204
Chicago/Turabian StyleYe, Junhao, Songhui Liu, Yue Zhao, Yuan Li, Jingrui Fang, Haibo Zhang, and Xuemao Guan. 2023. "Development of Ultrafine Mineral Admixture from Magnesium Slag and Sequestration of CO2" Buildings 13, no. 1: 204. https://doi.org/10.3390/buildings13010204