
Developing Low-pH 3D Printing Concrete Using Solid Wastes
Abstract
:1. Introduction
2. Materials and Methods
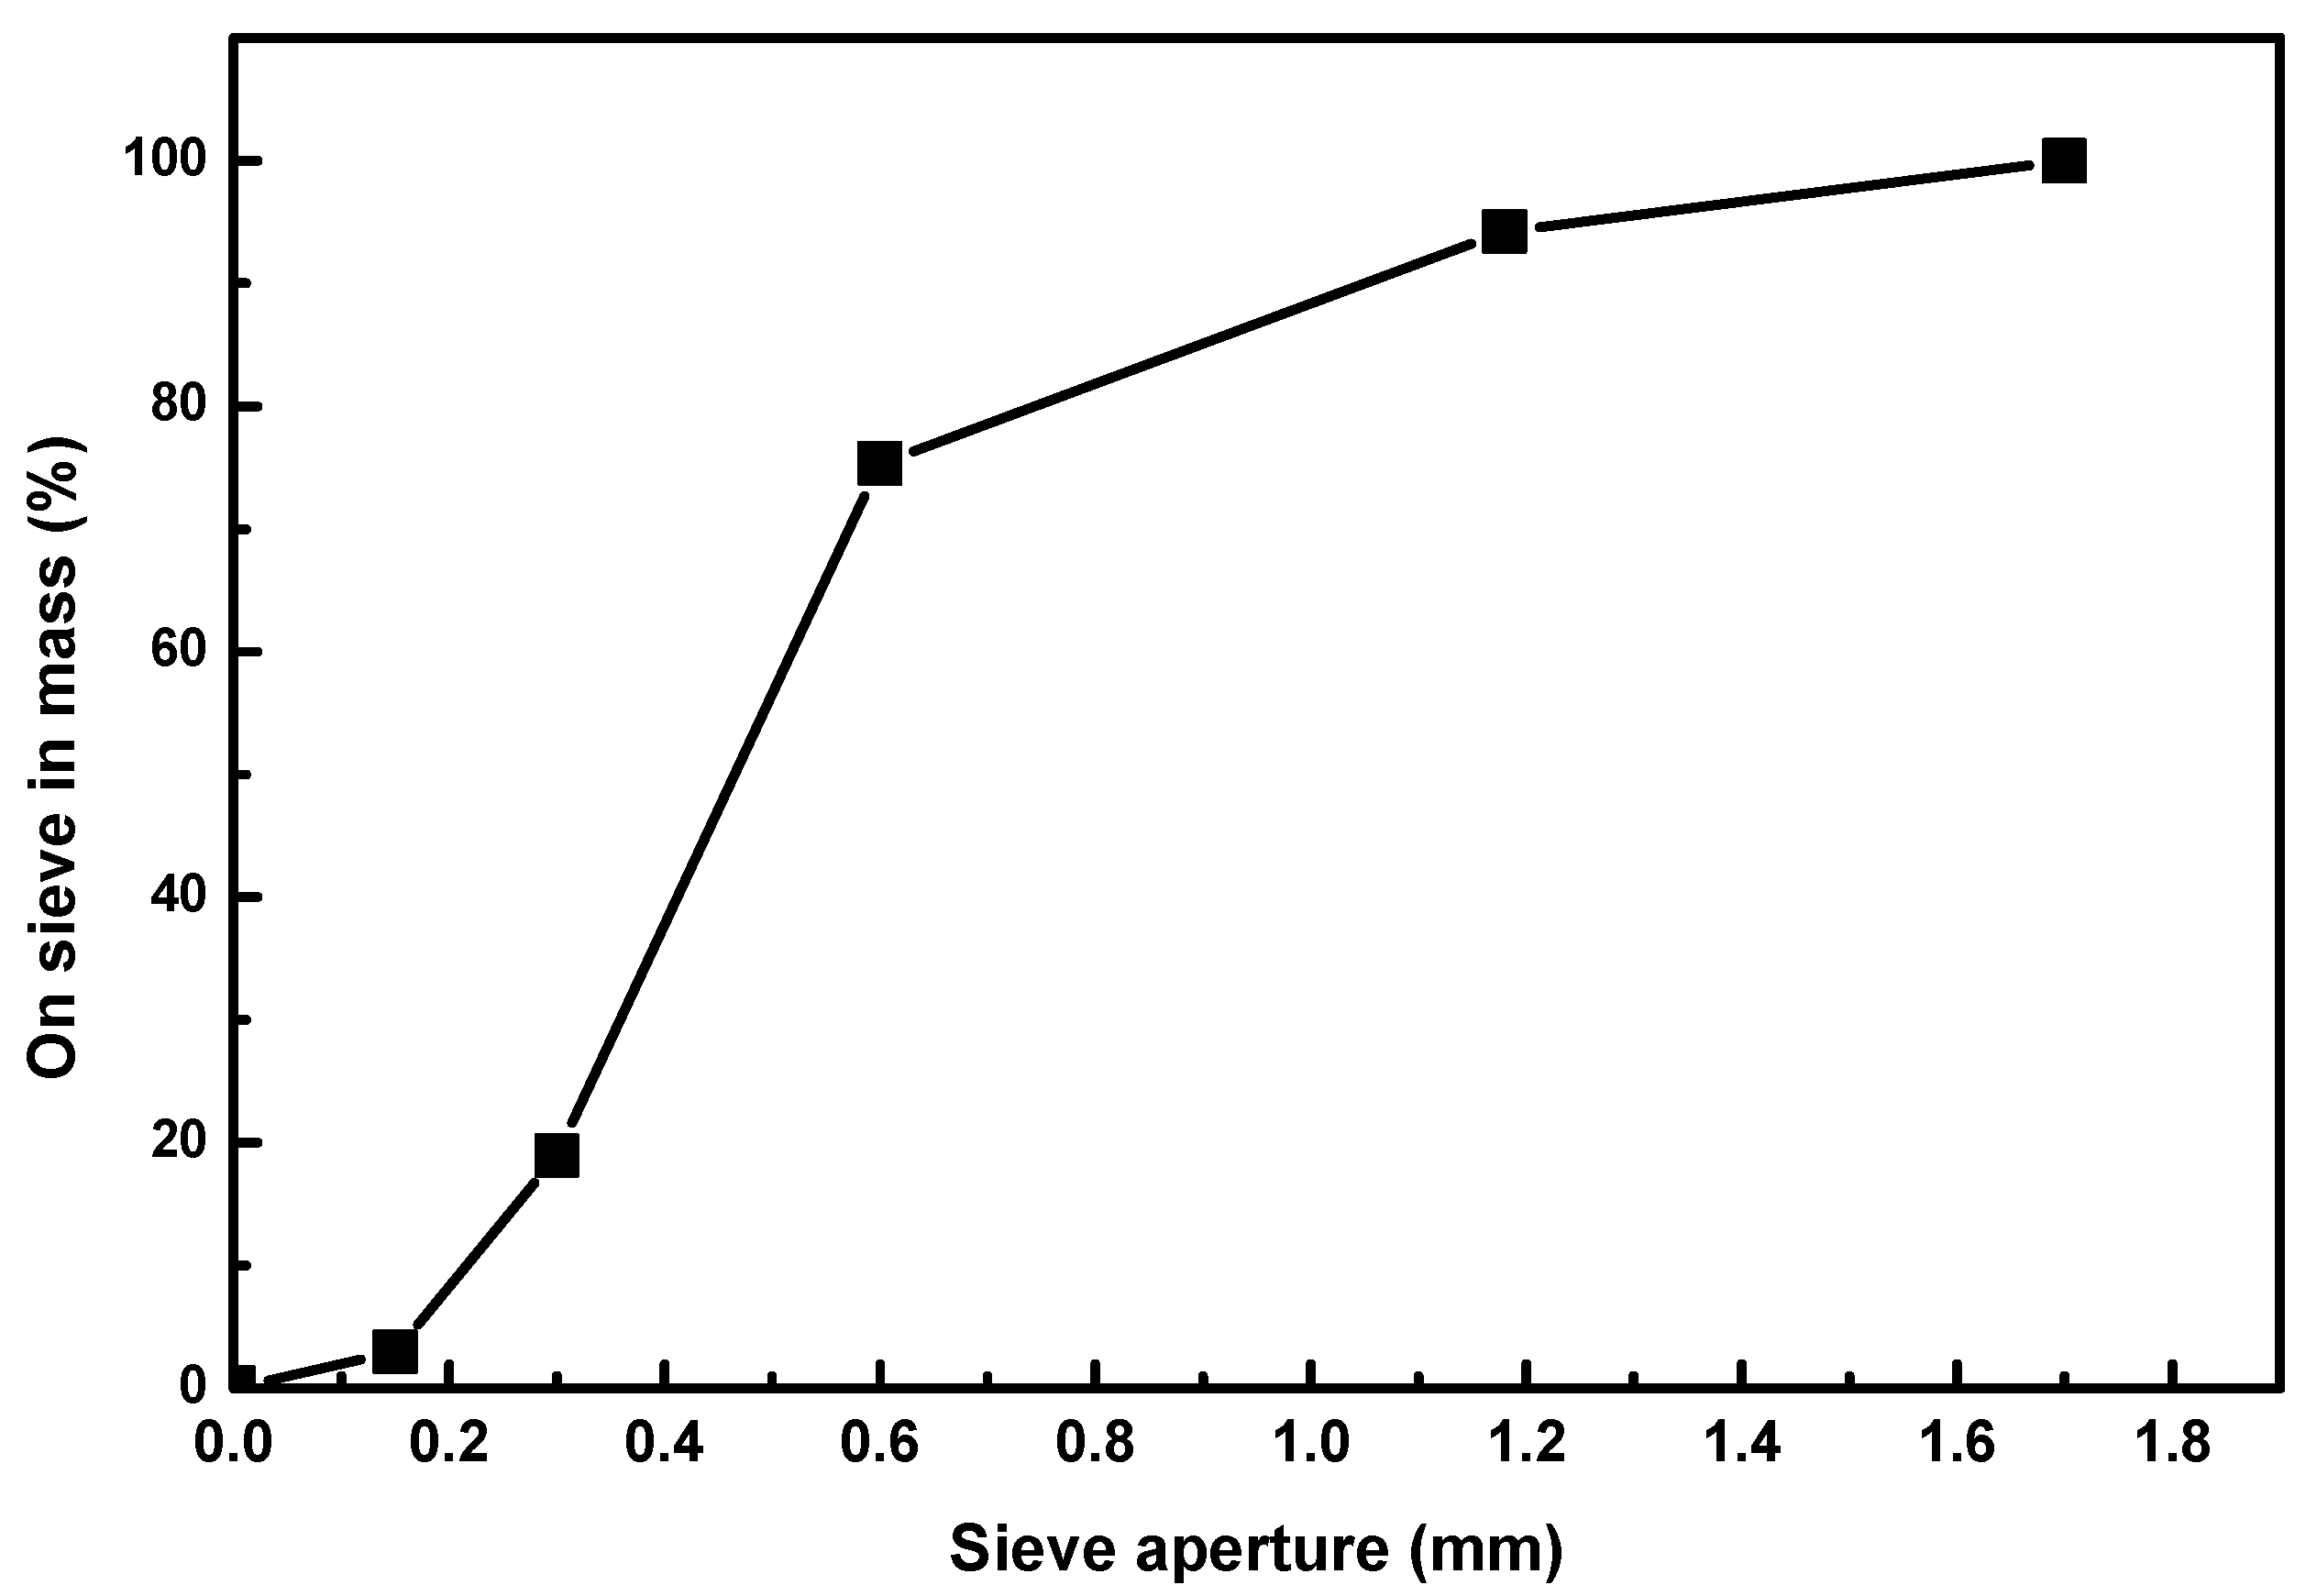
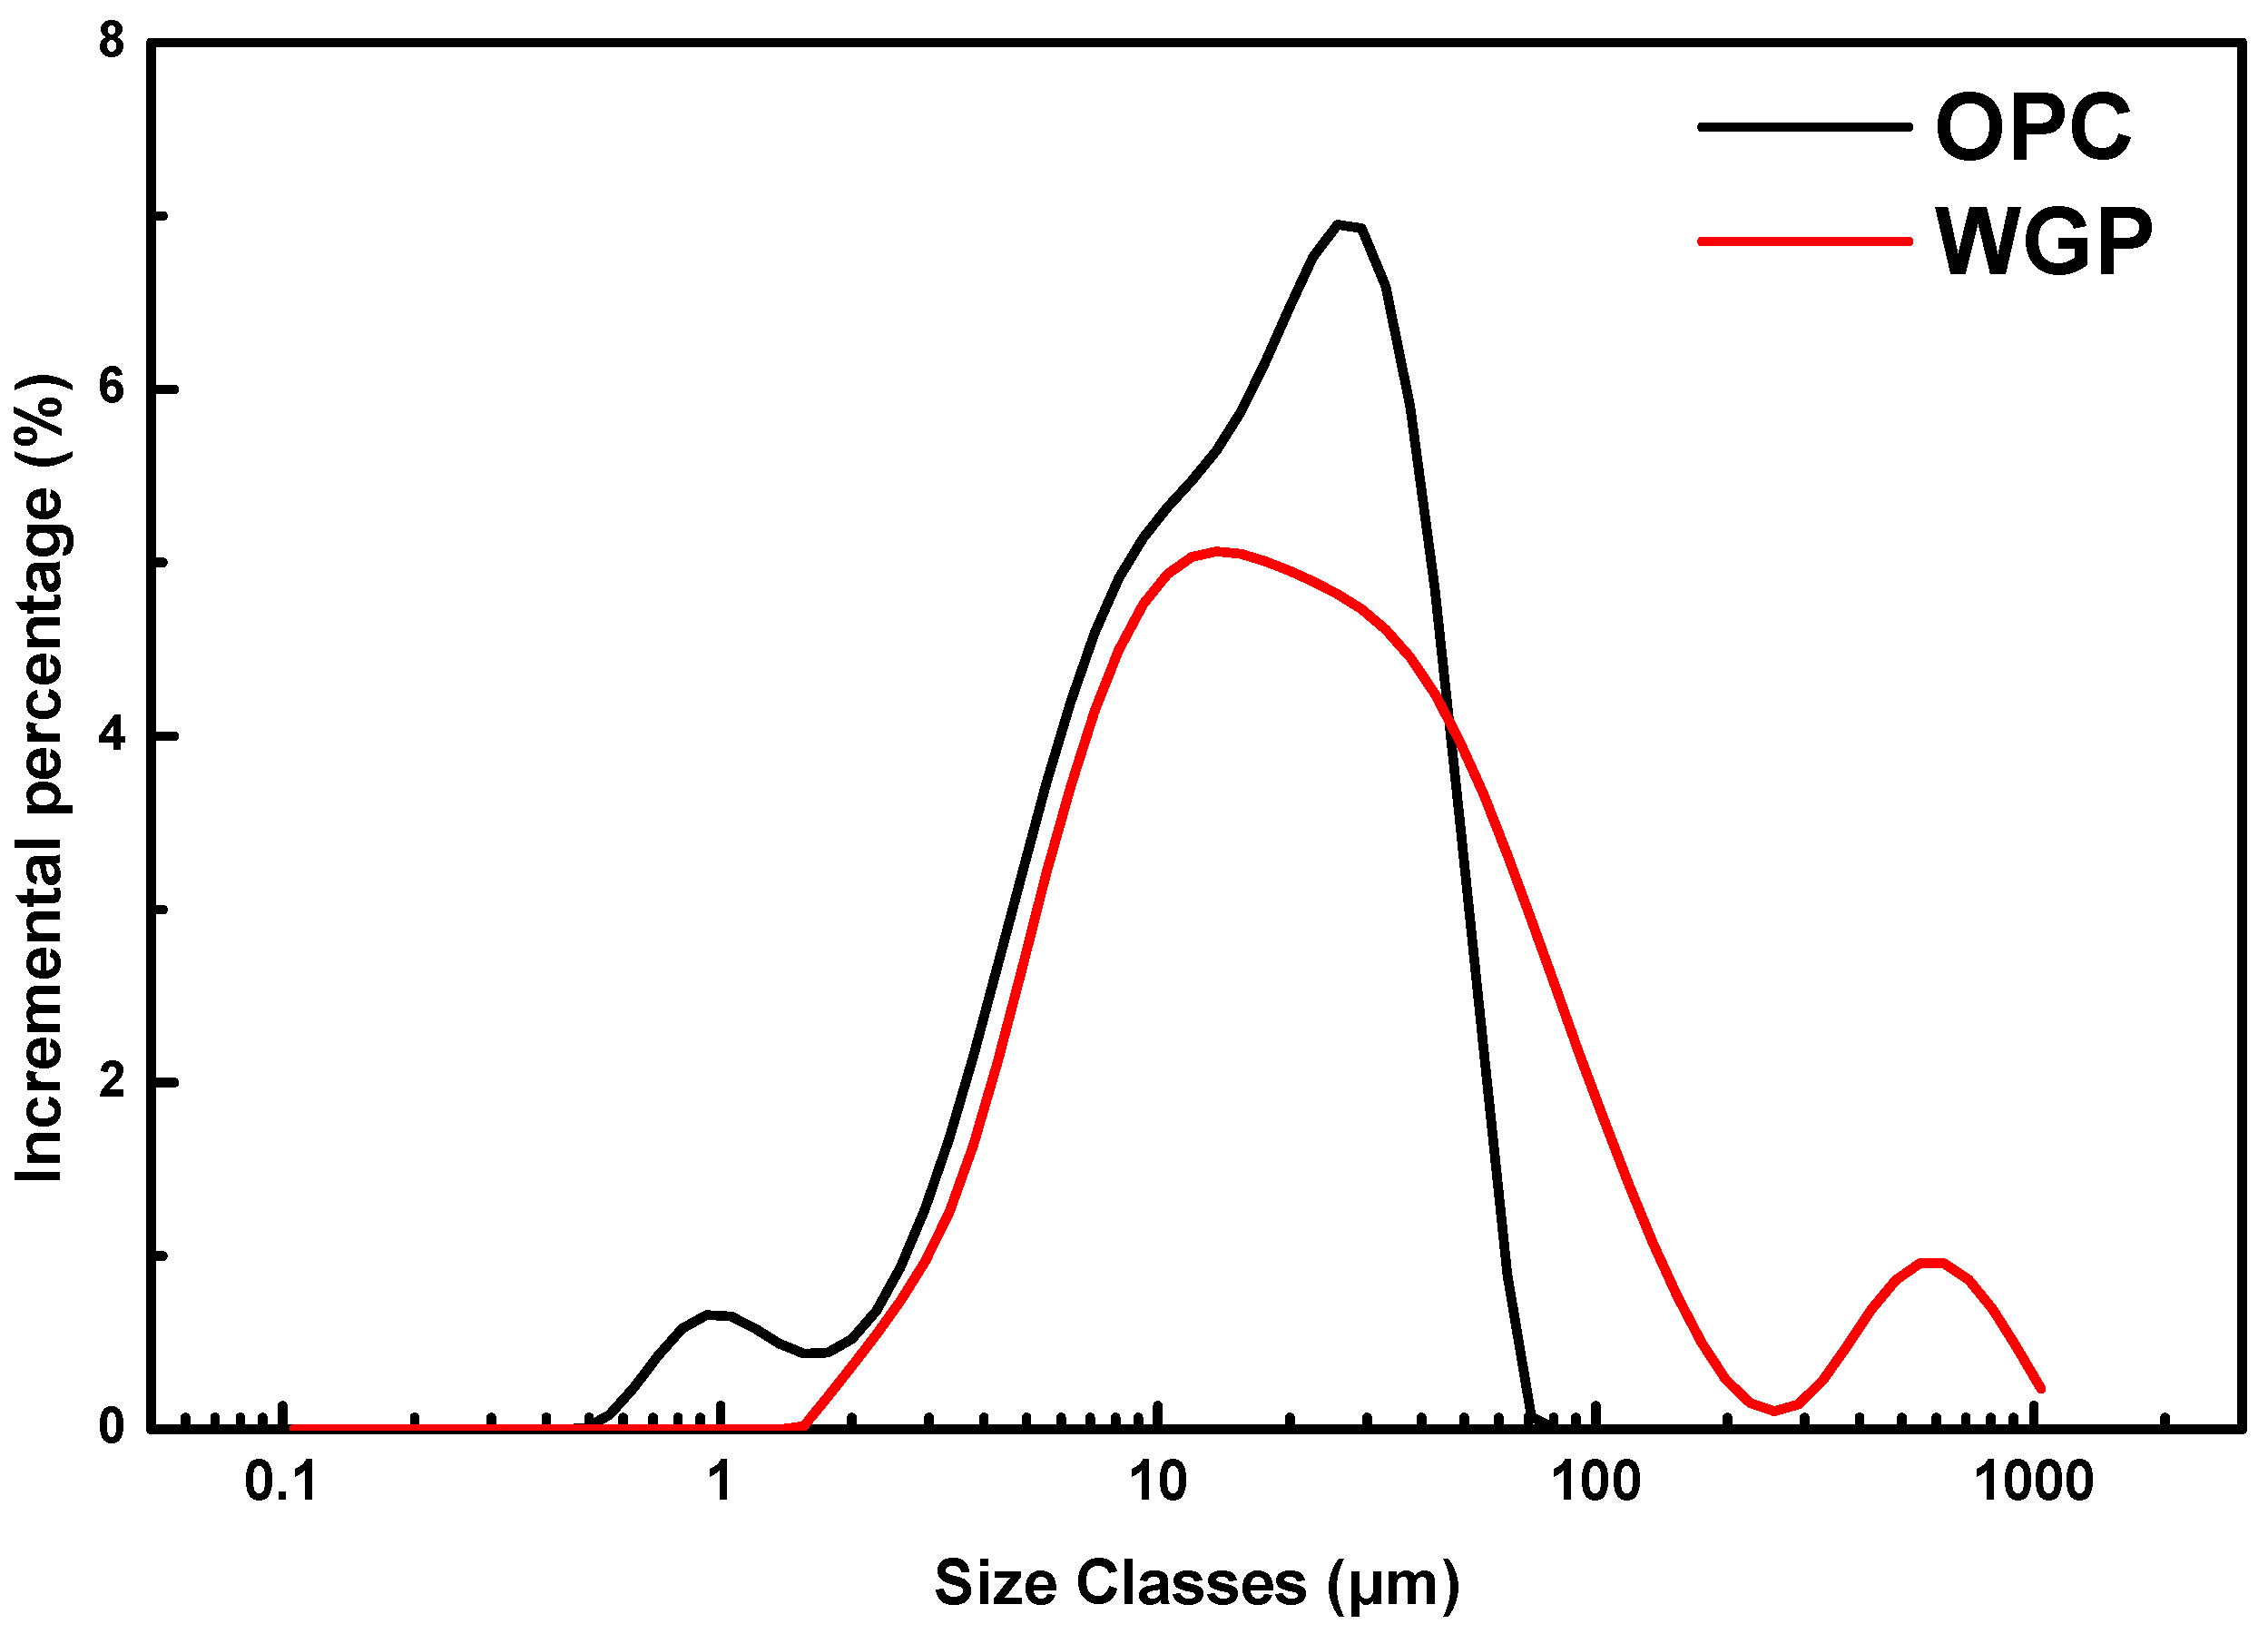
2.1. Materials
2.2. Sample Preparation
2.3. Testing Methods
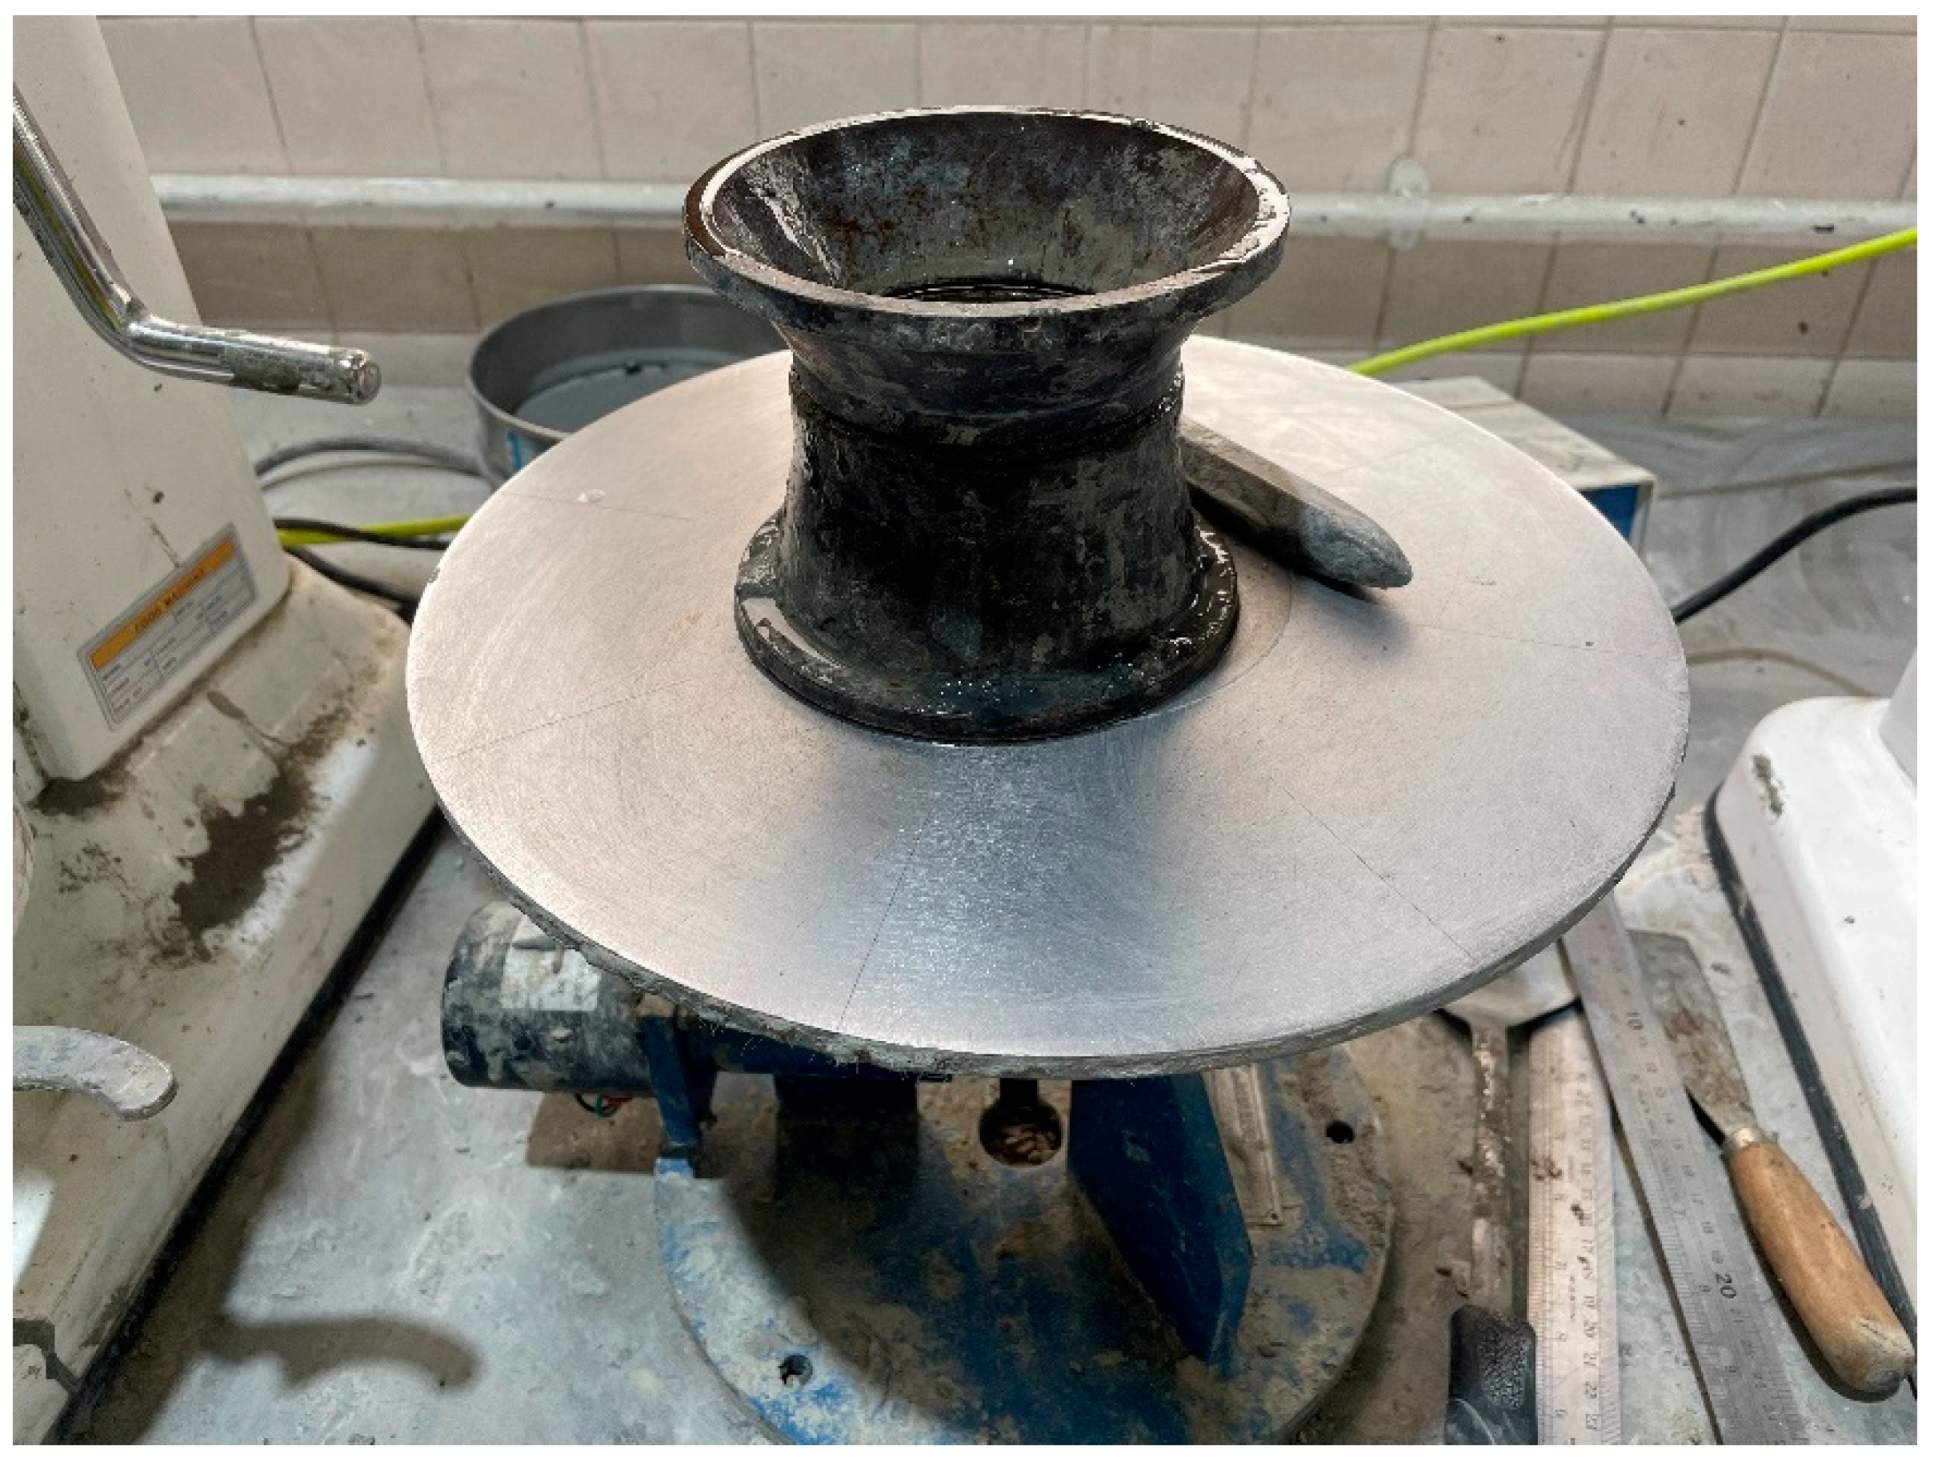
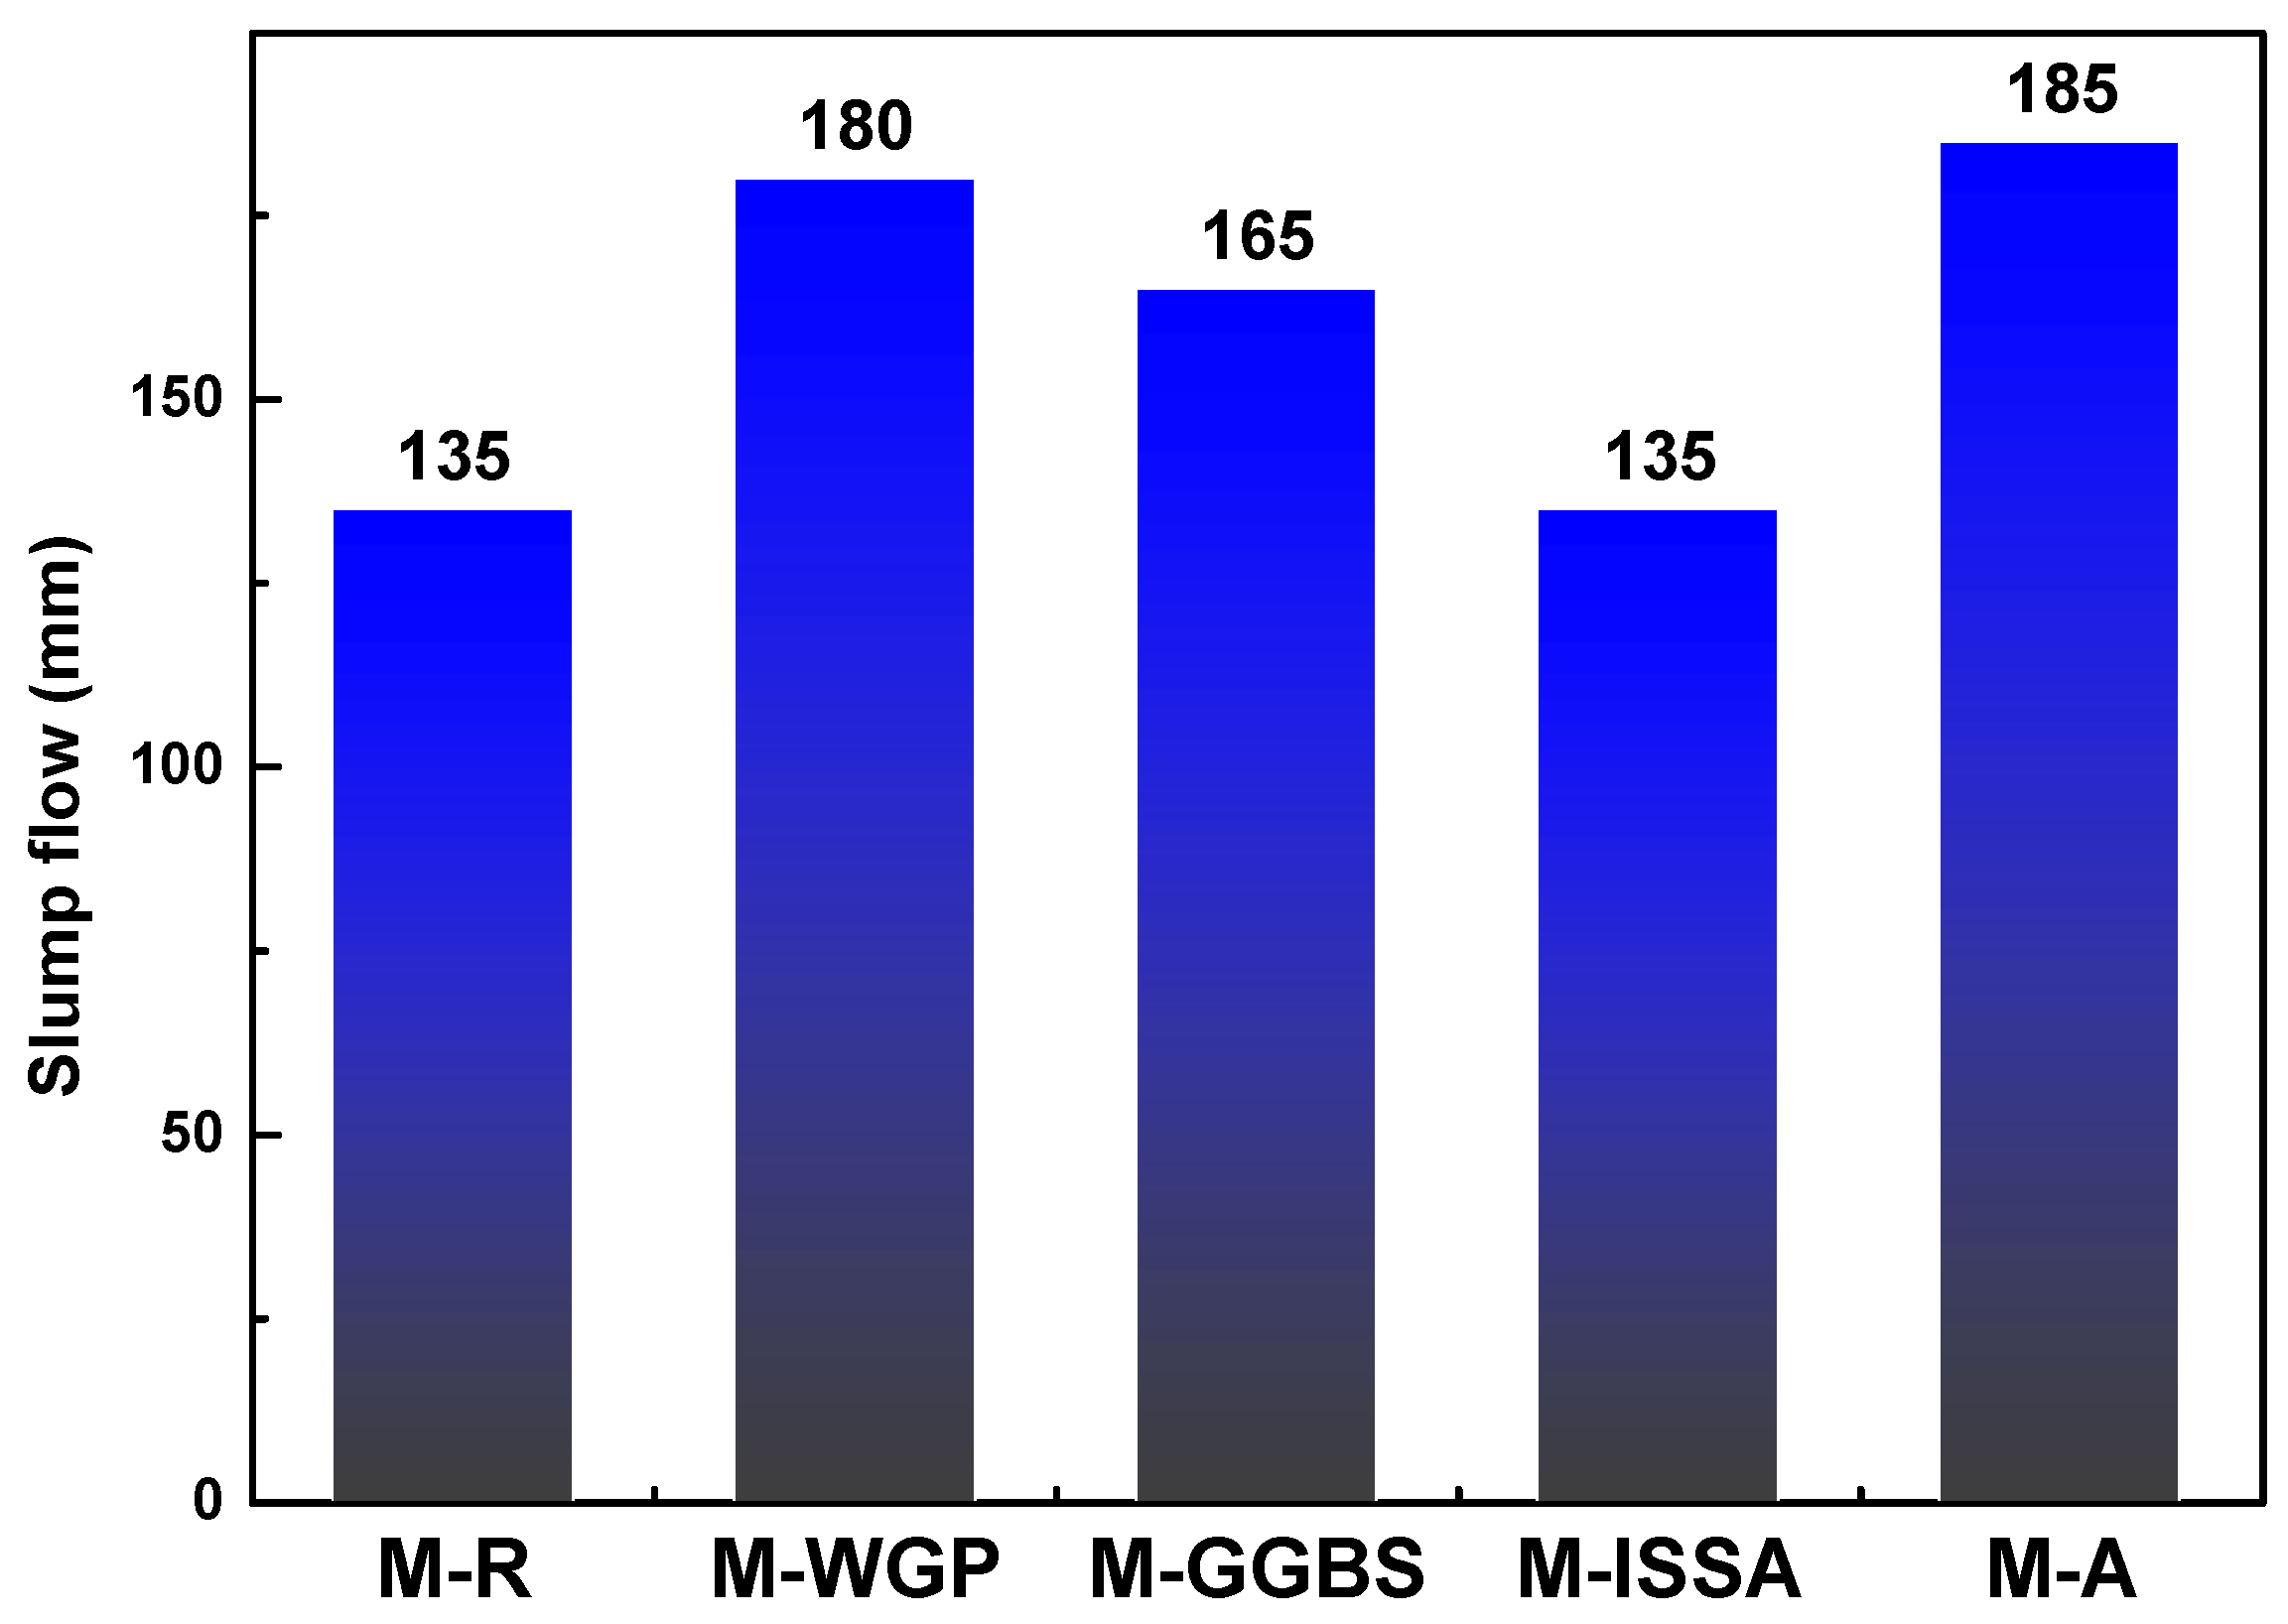
2.3.1. Slump Flow
2.3.2. Buildability
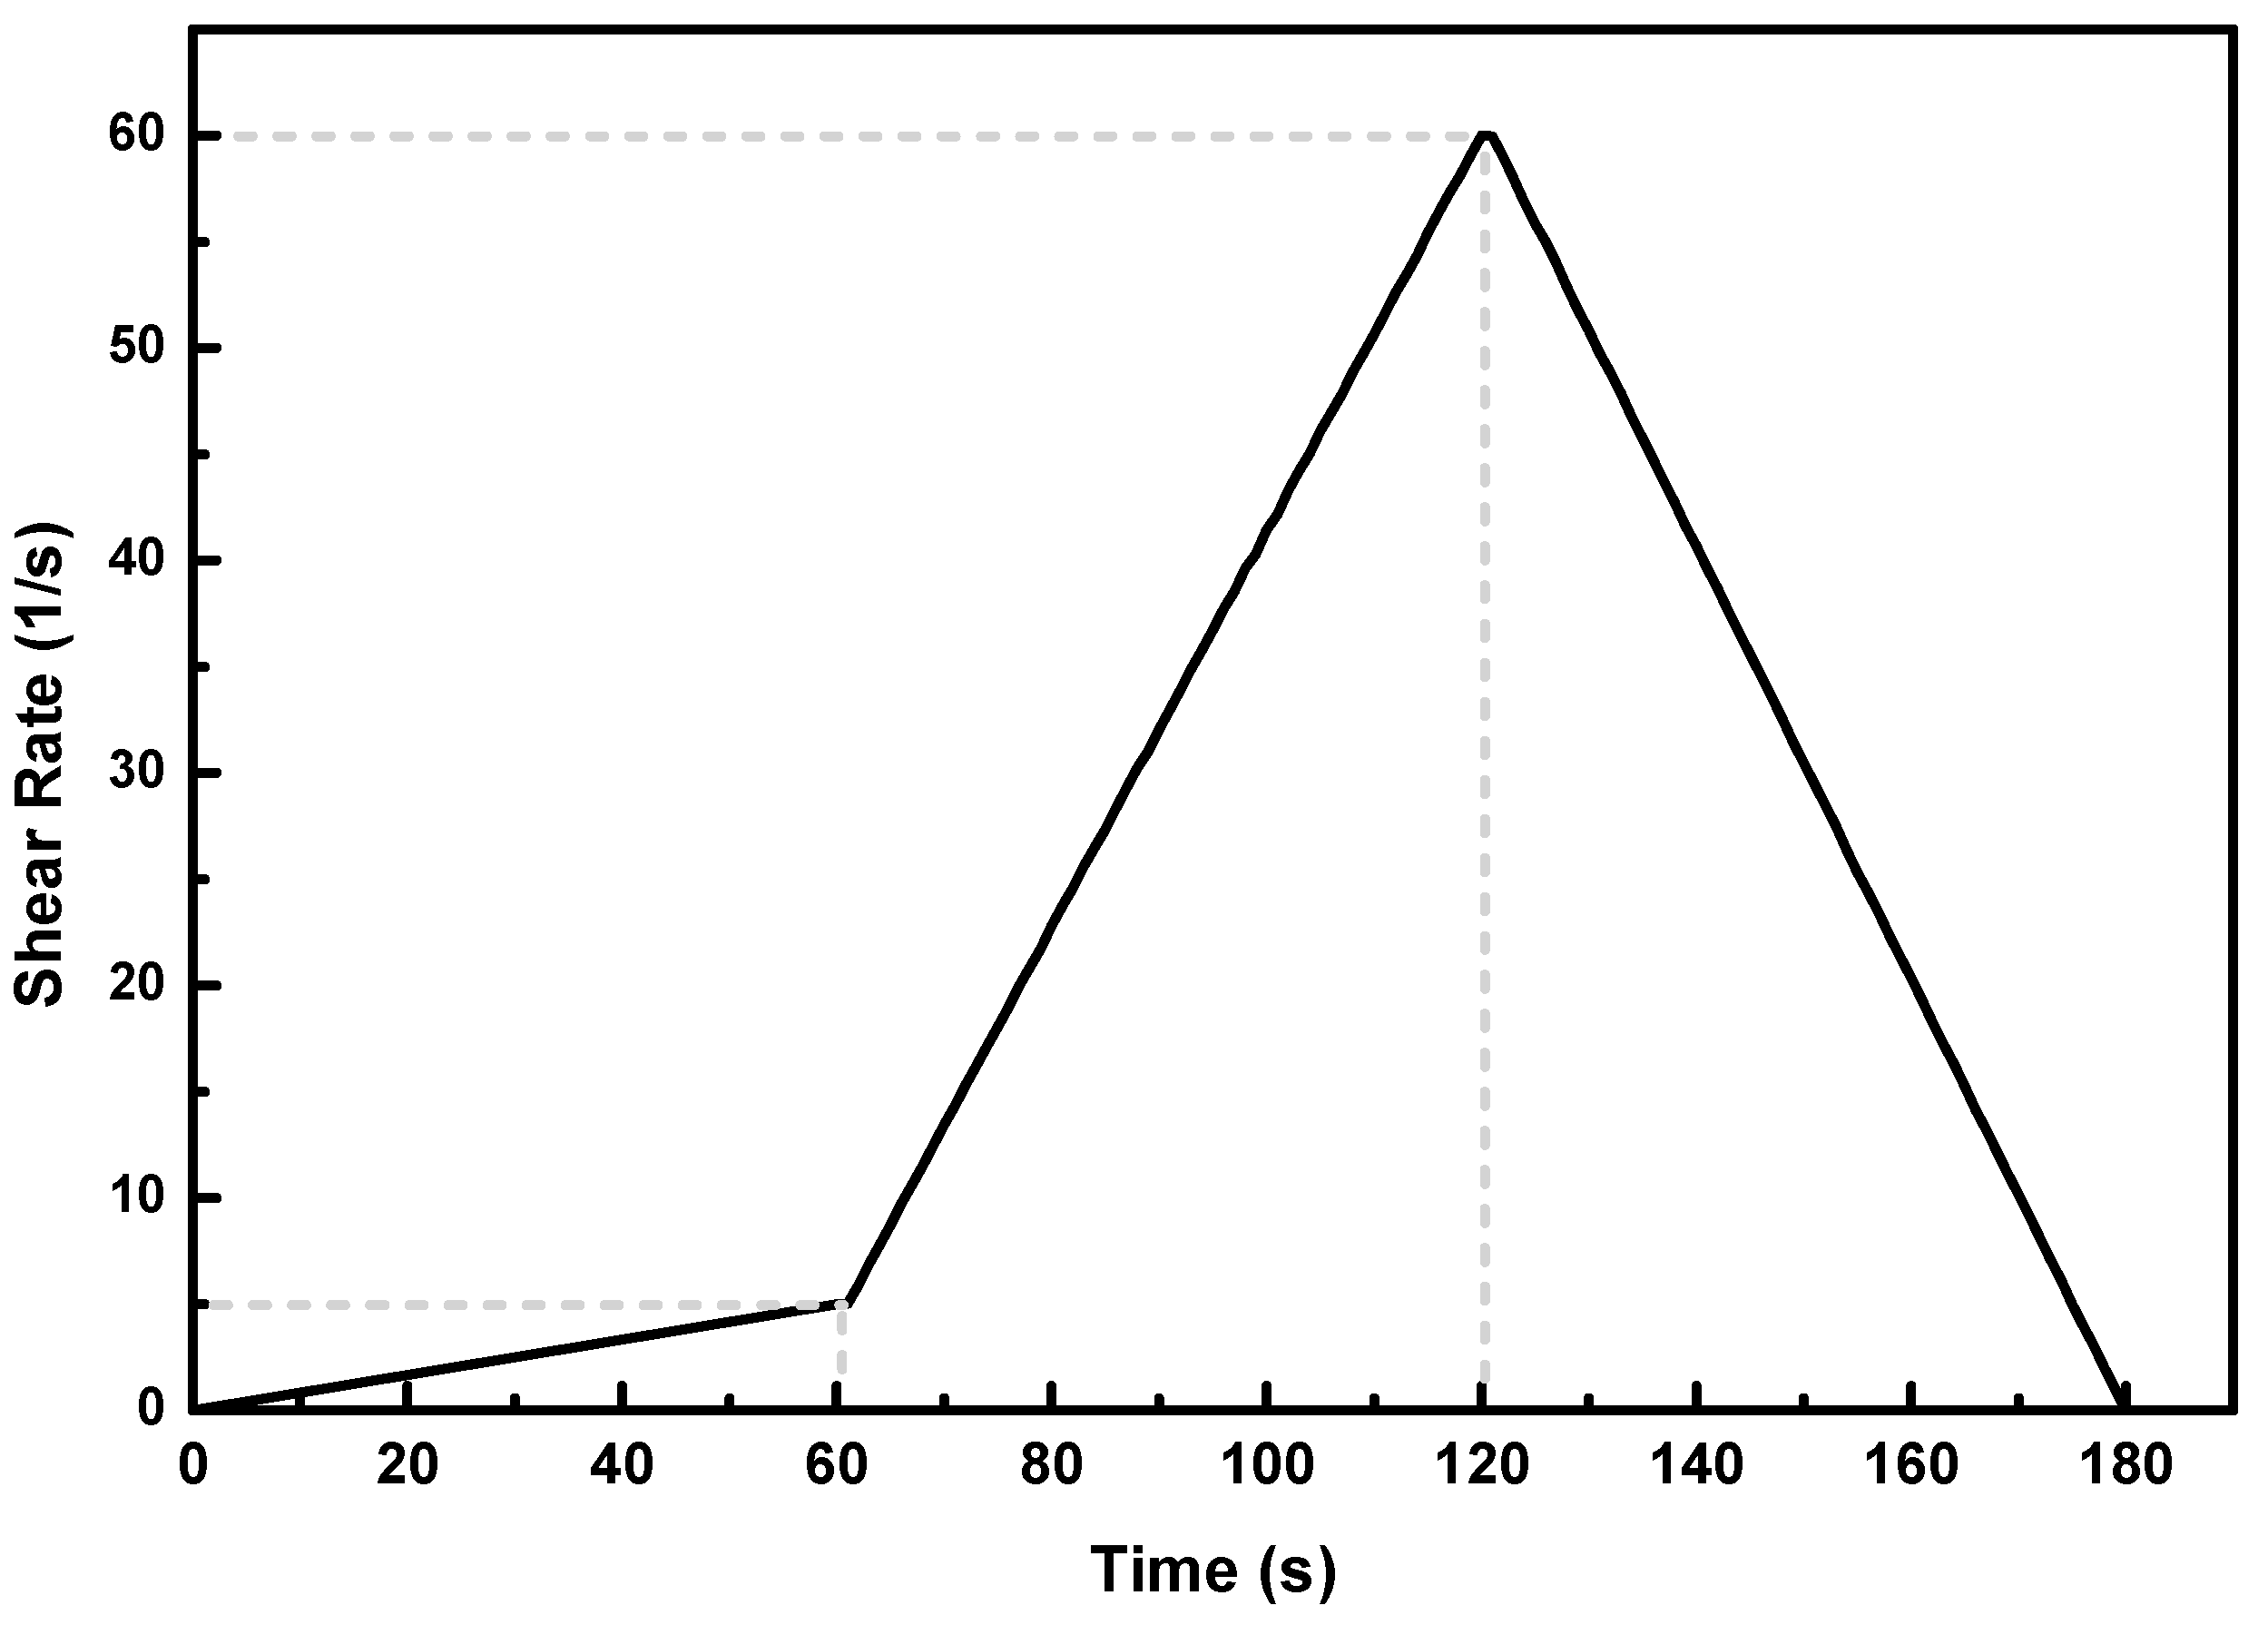
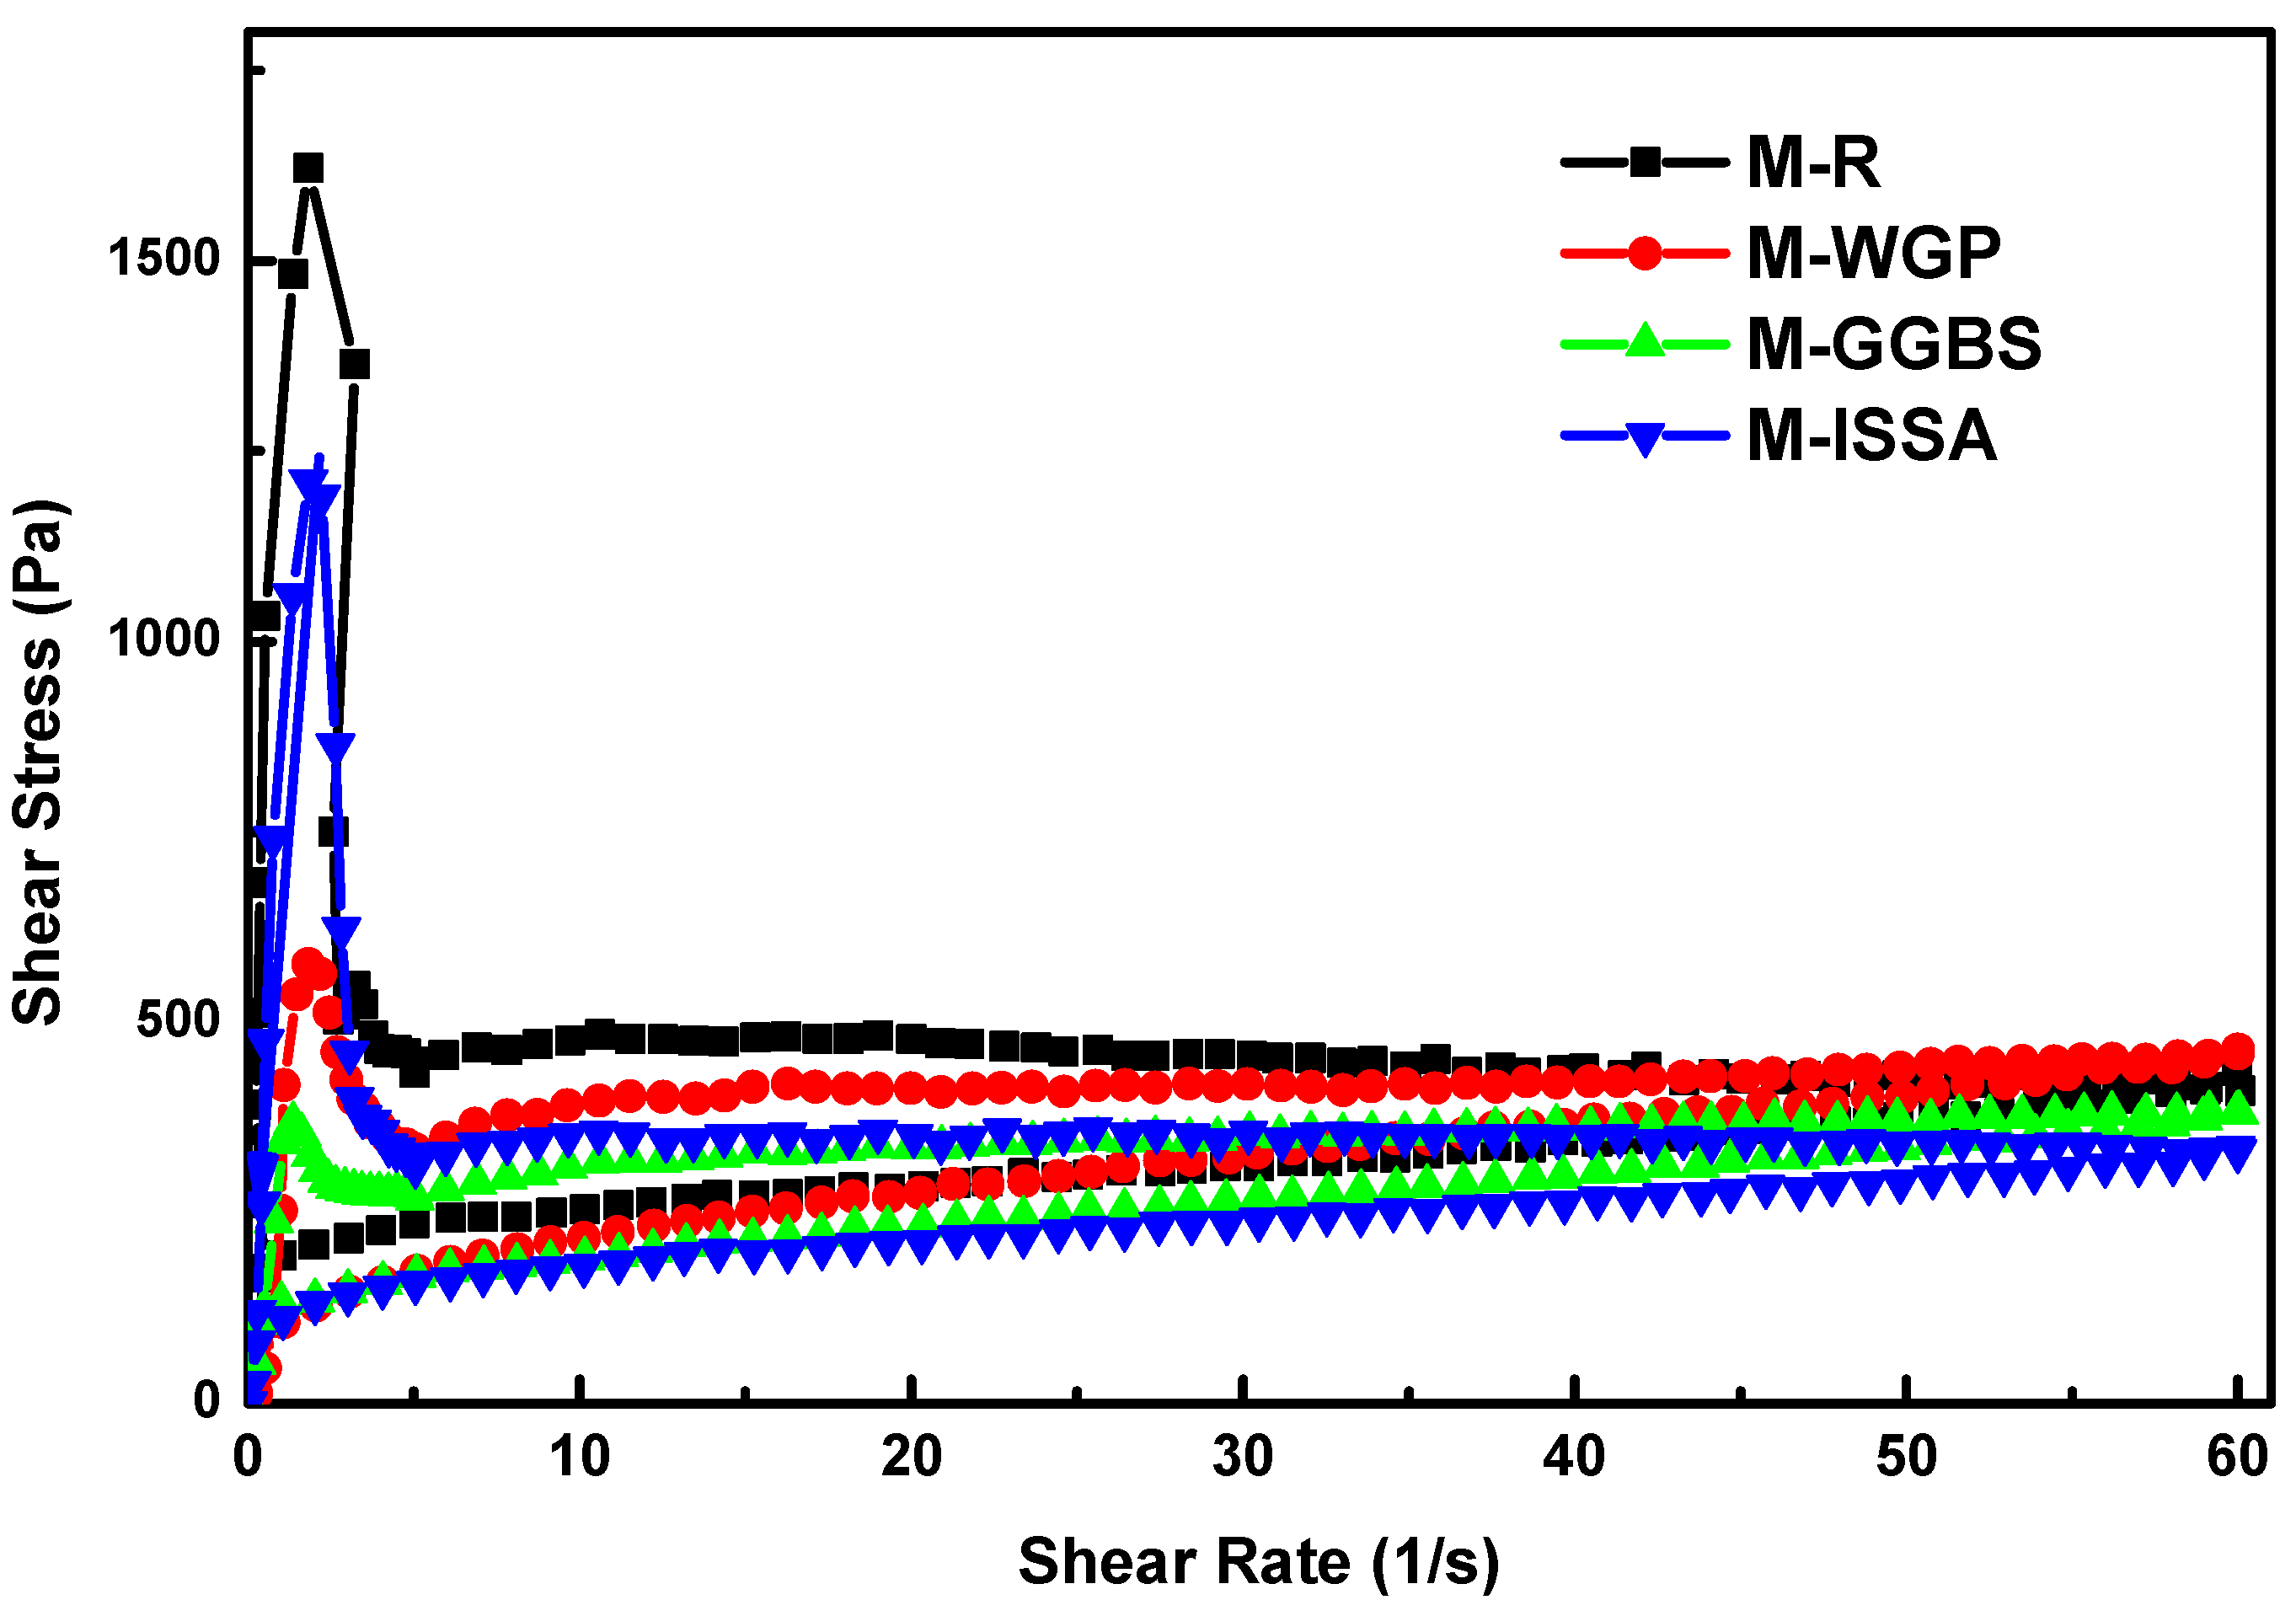
2.3.3. Rheology
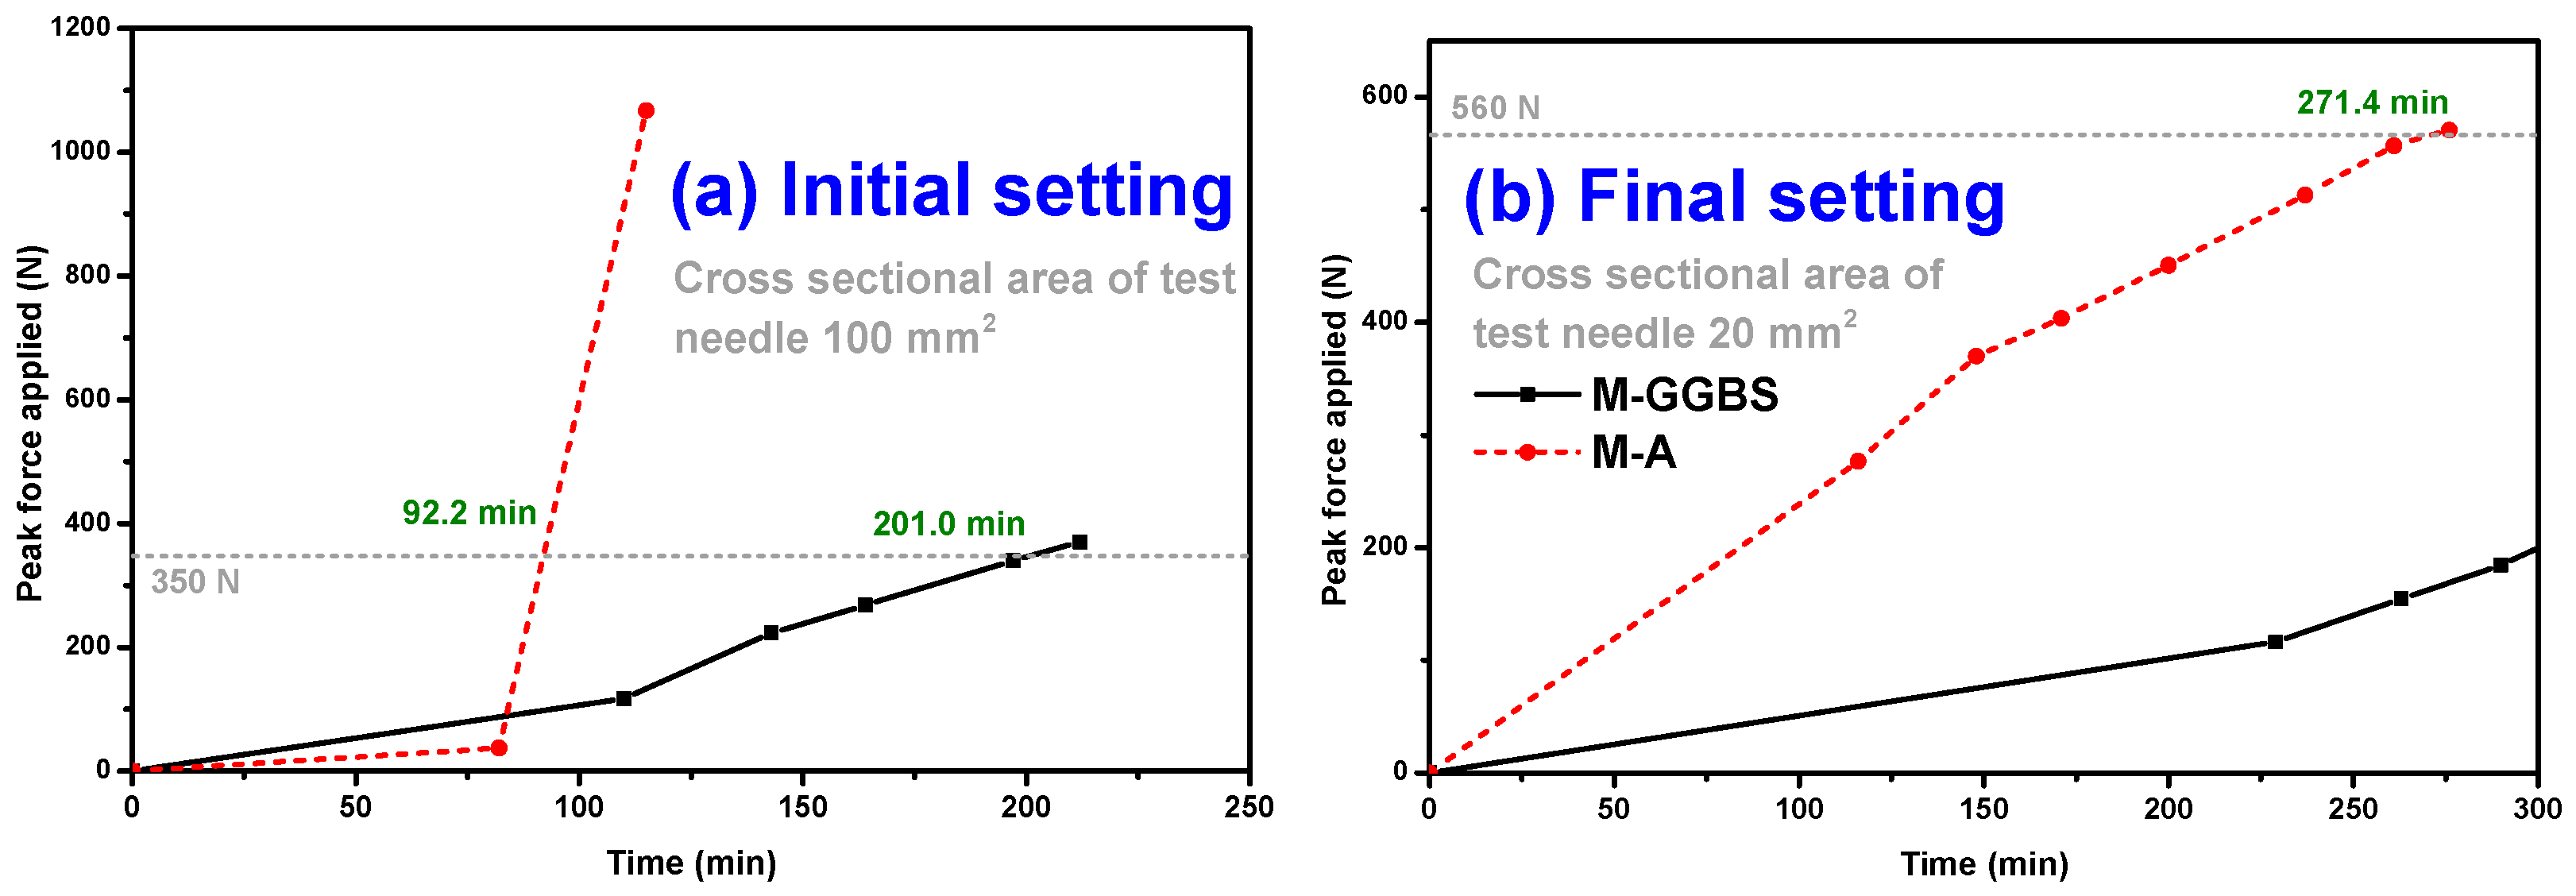
2.3.4. Setting Time
2.3.5. Drying Shrinkage
2.3.6. Surface pH
2.3.7. Compressive Strength
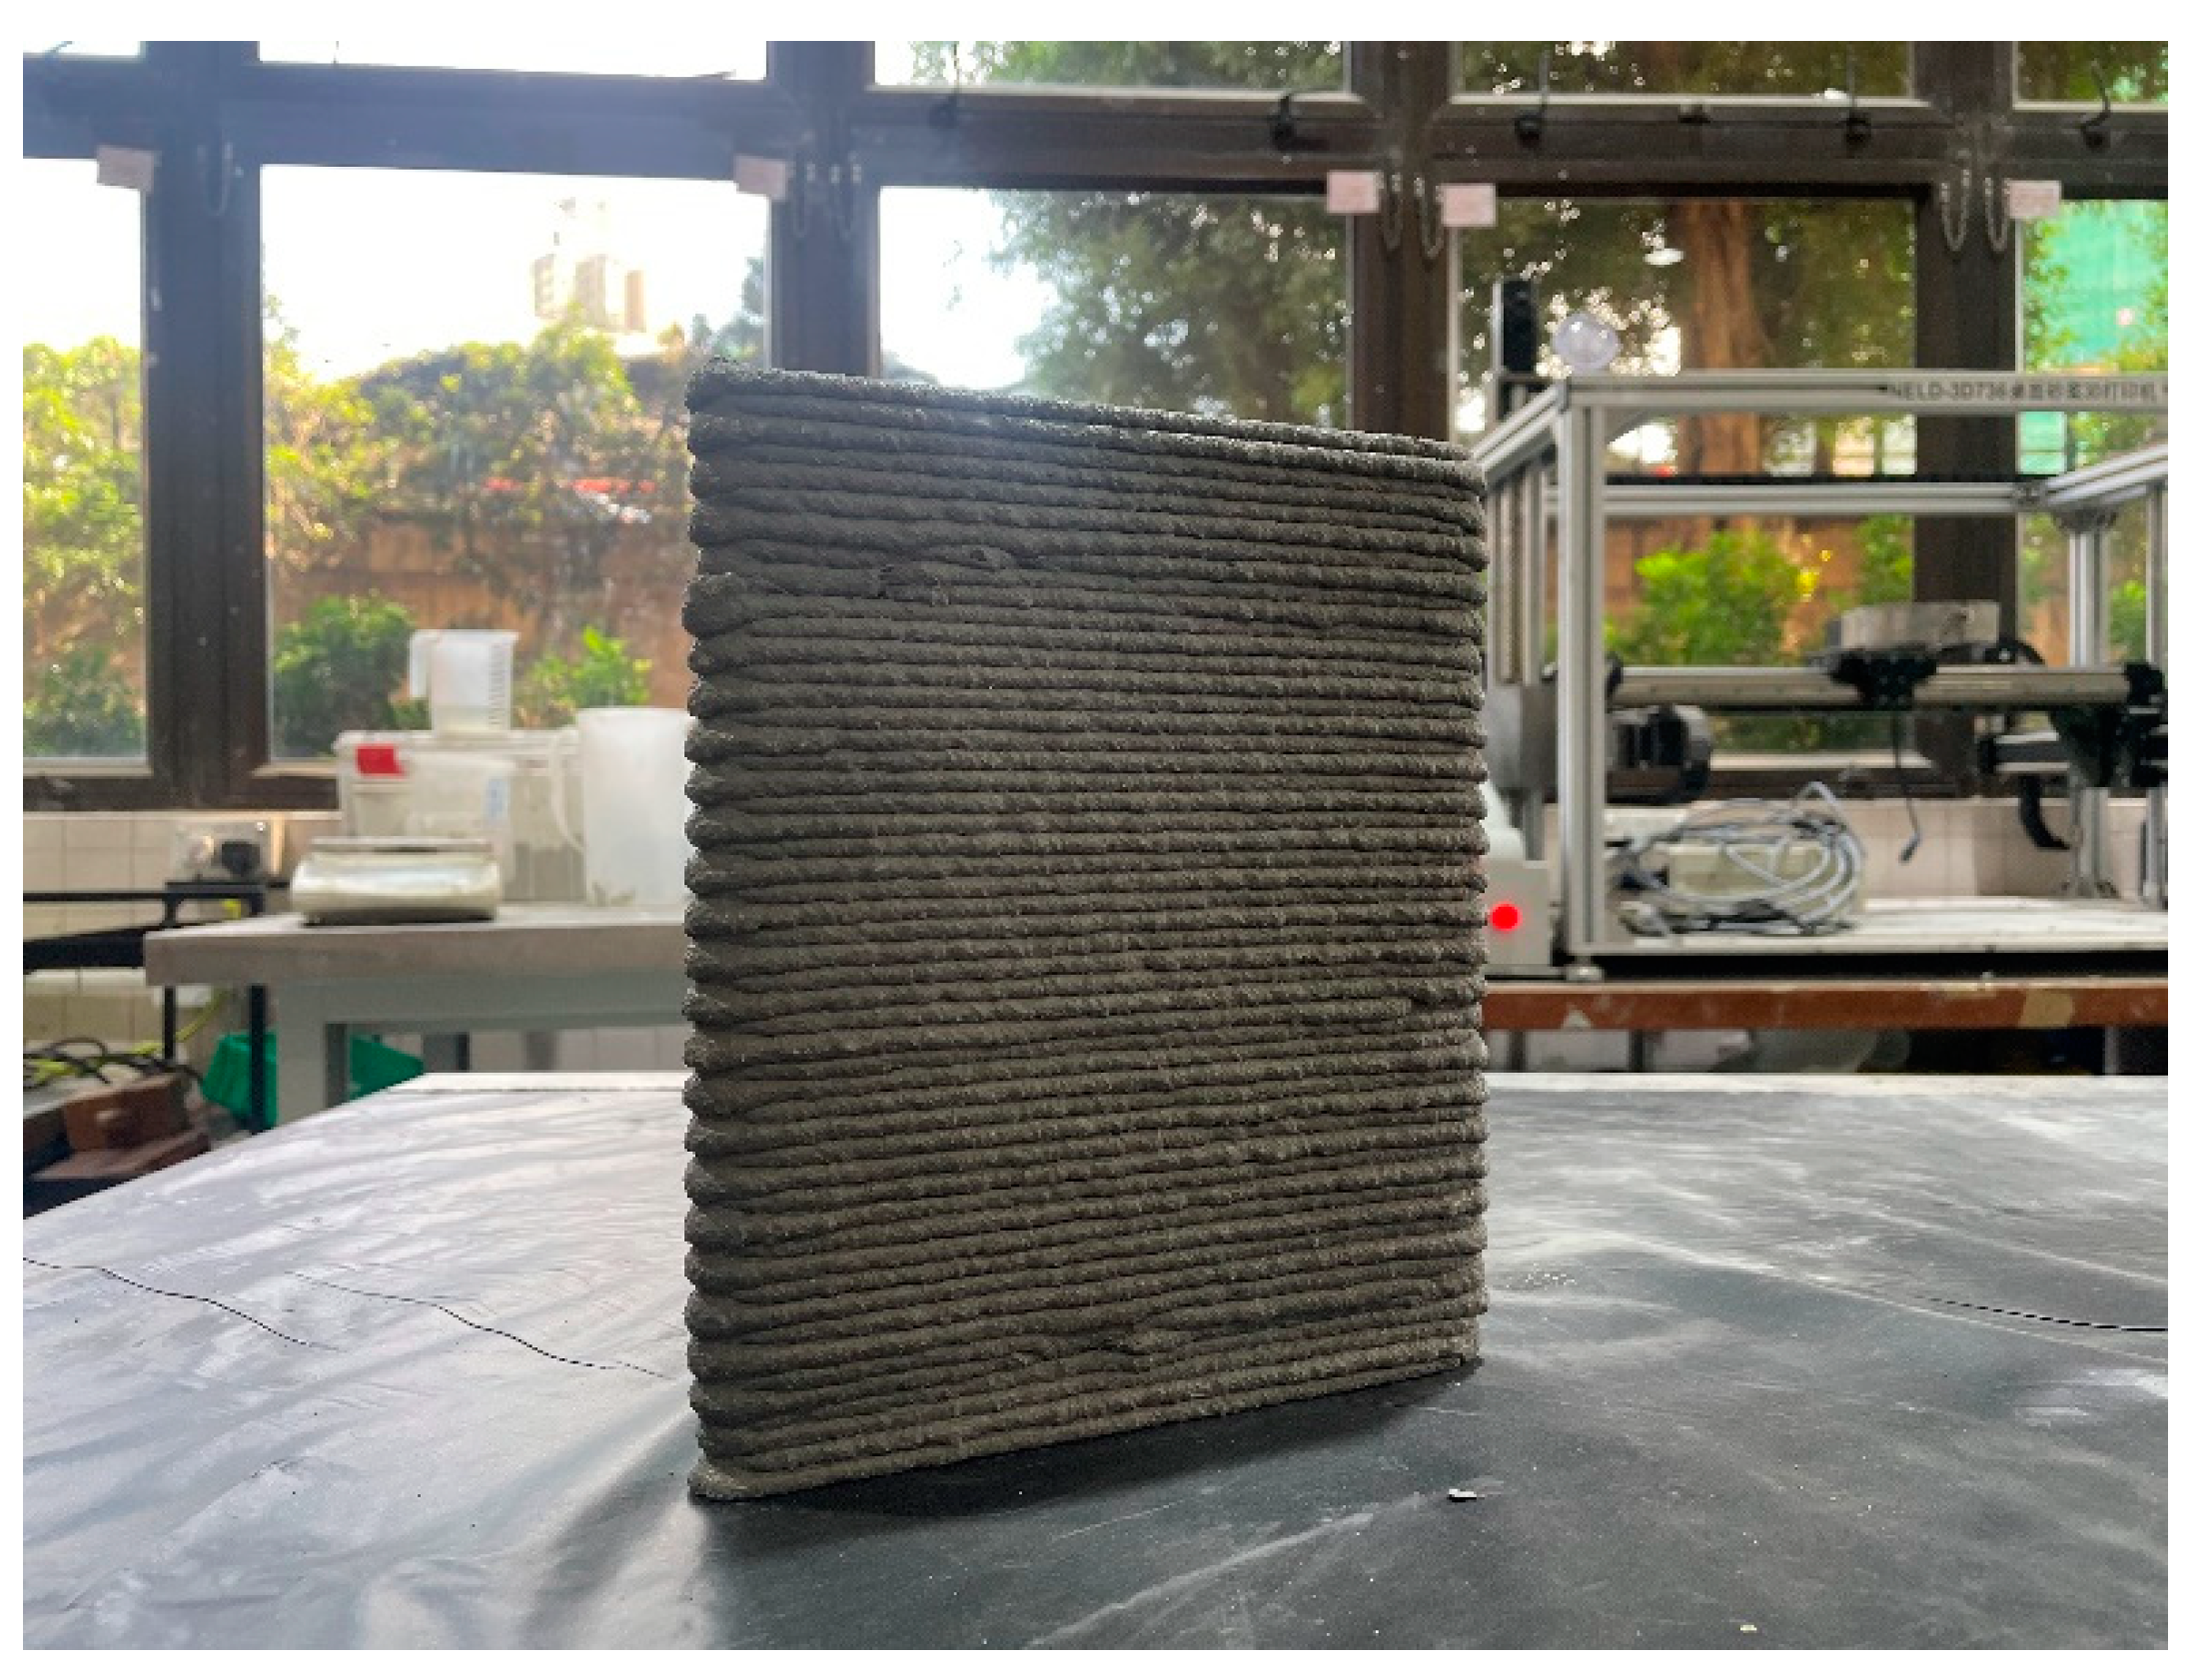
2.3.8. Printing Height
3. Results and Discussion
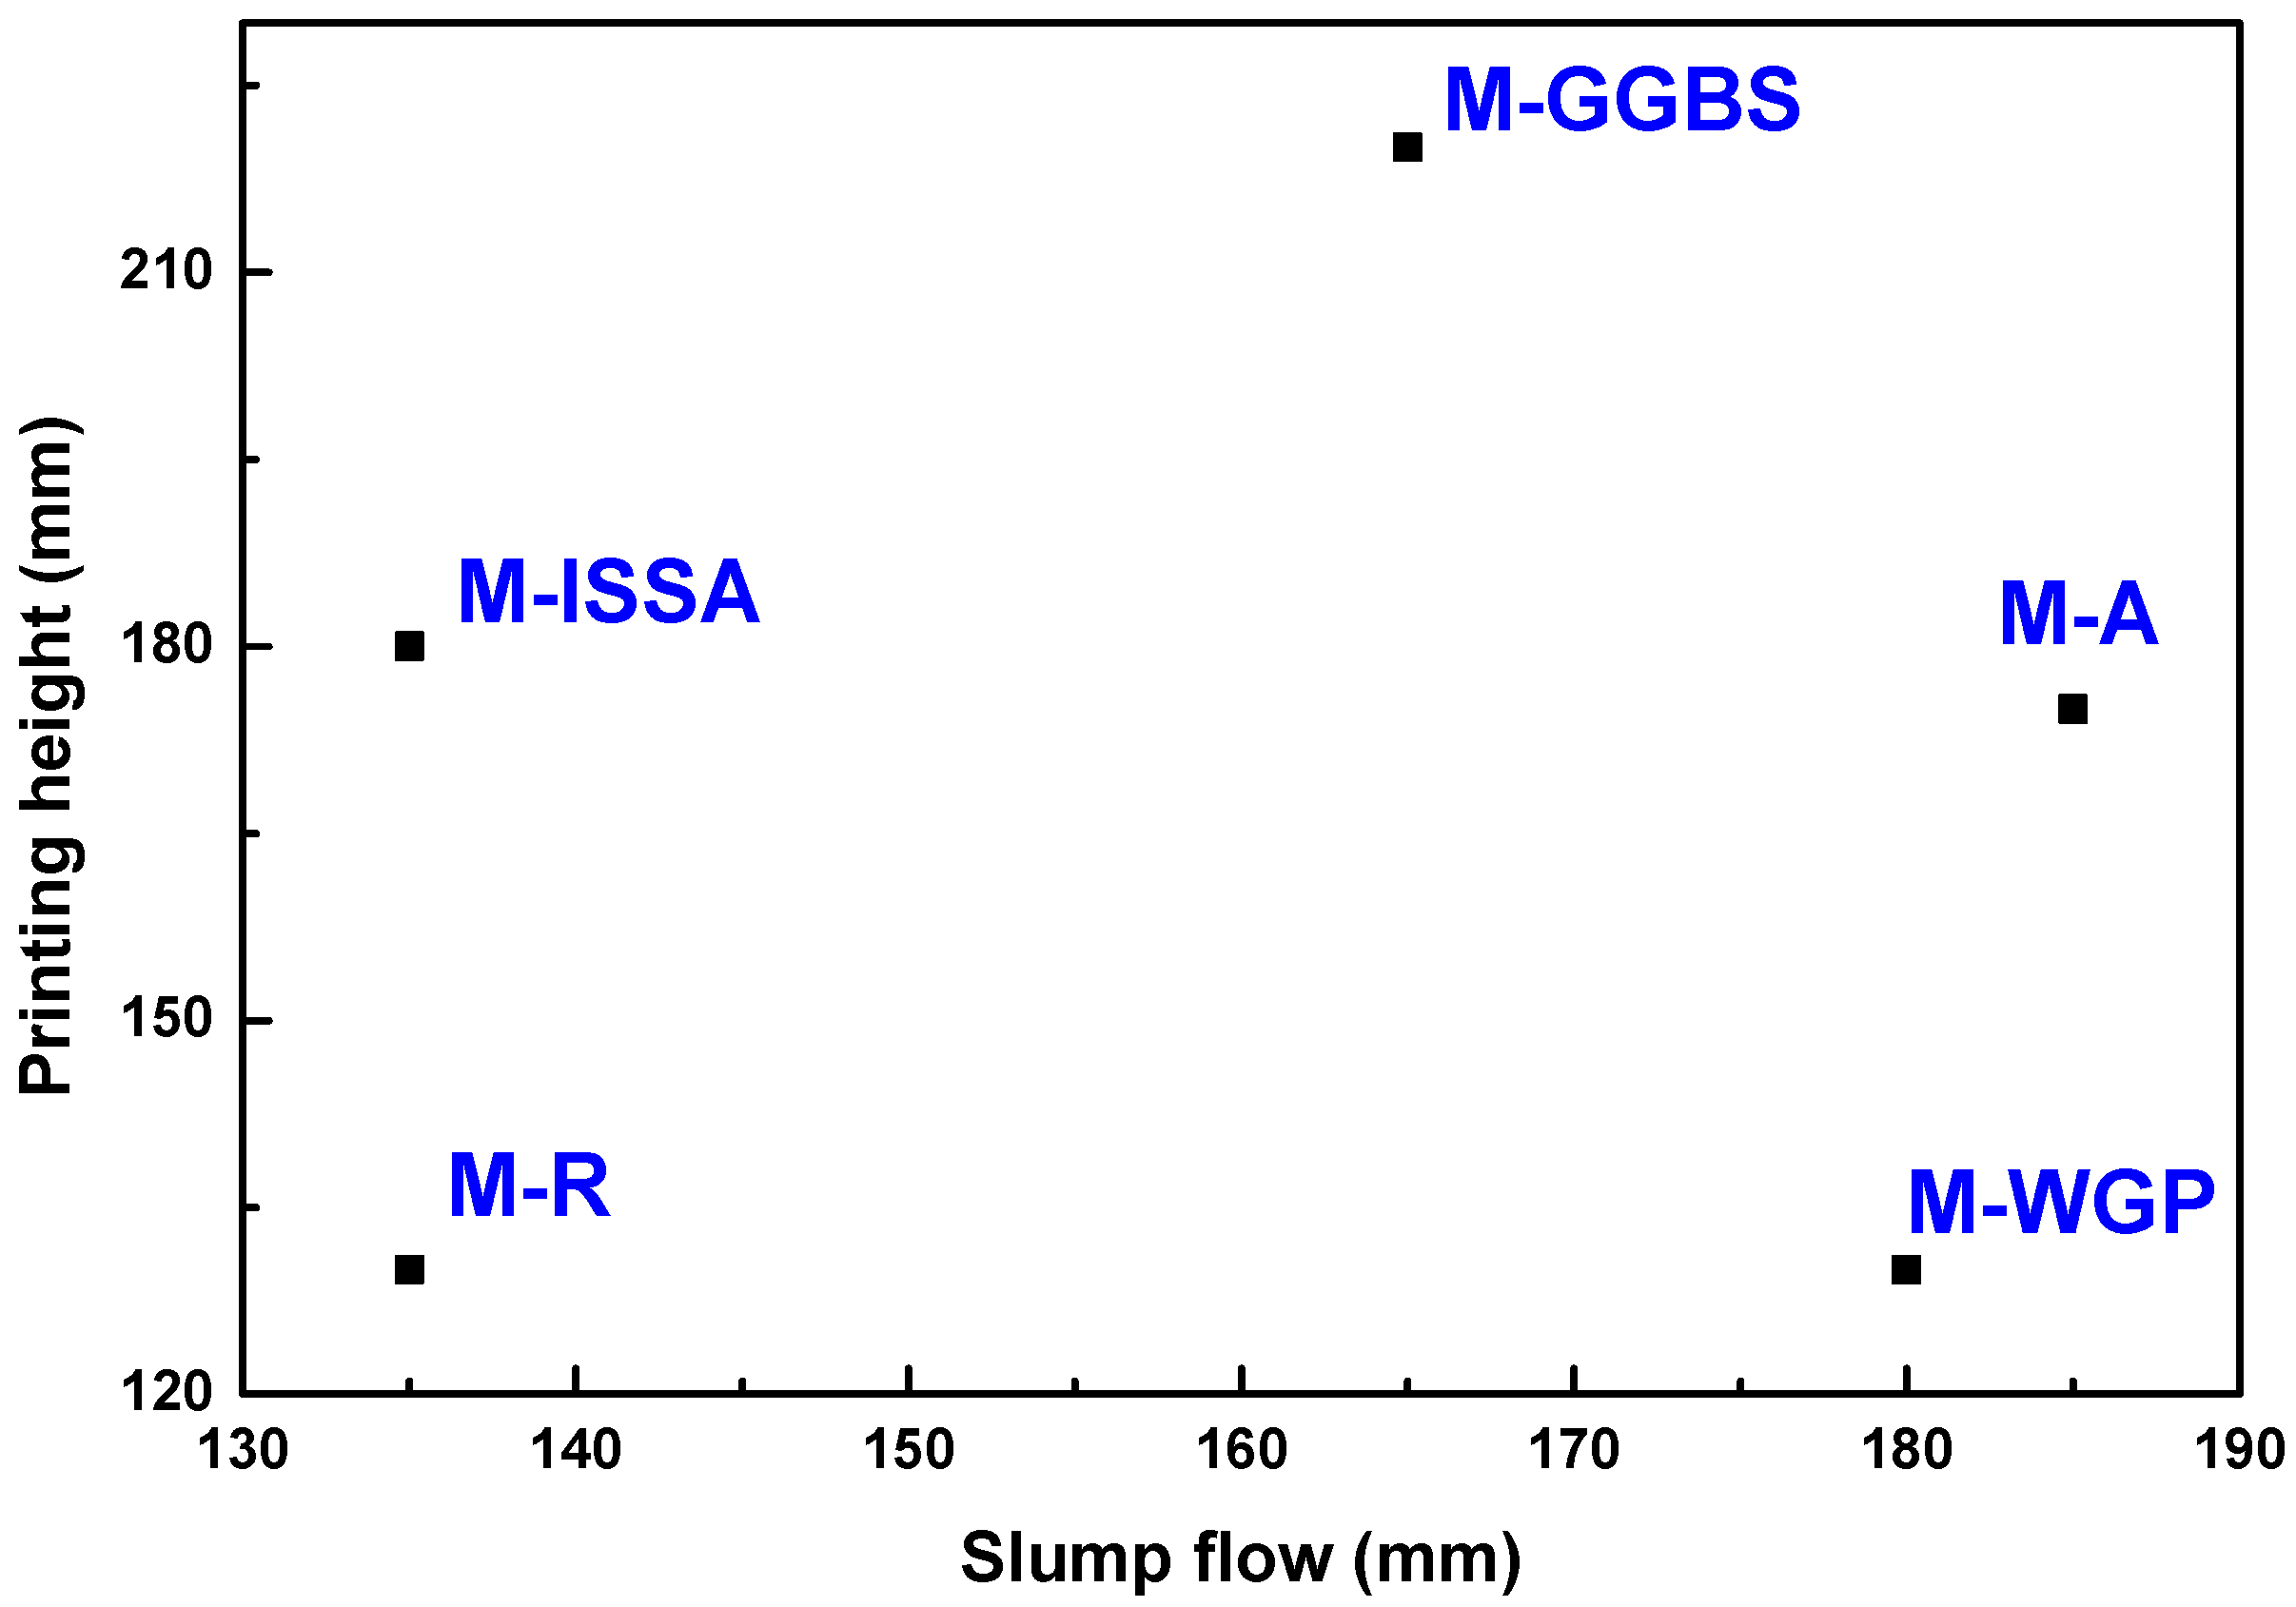
3.1. Slump Flow
3.2. Buildability
3.3. Rheology
3.4. Setting Time
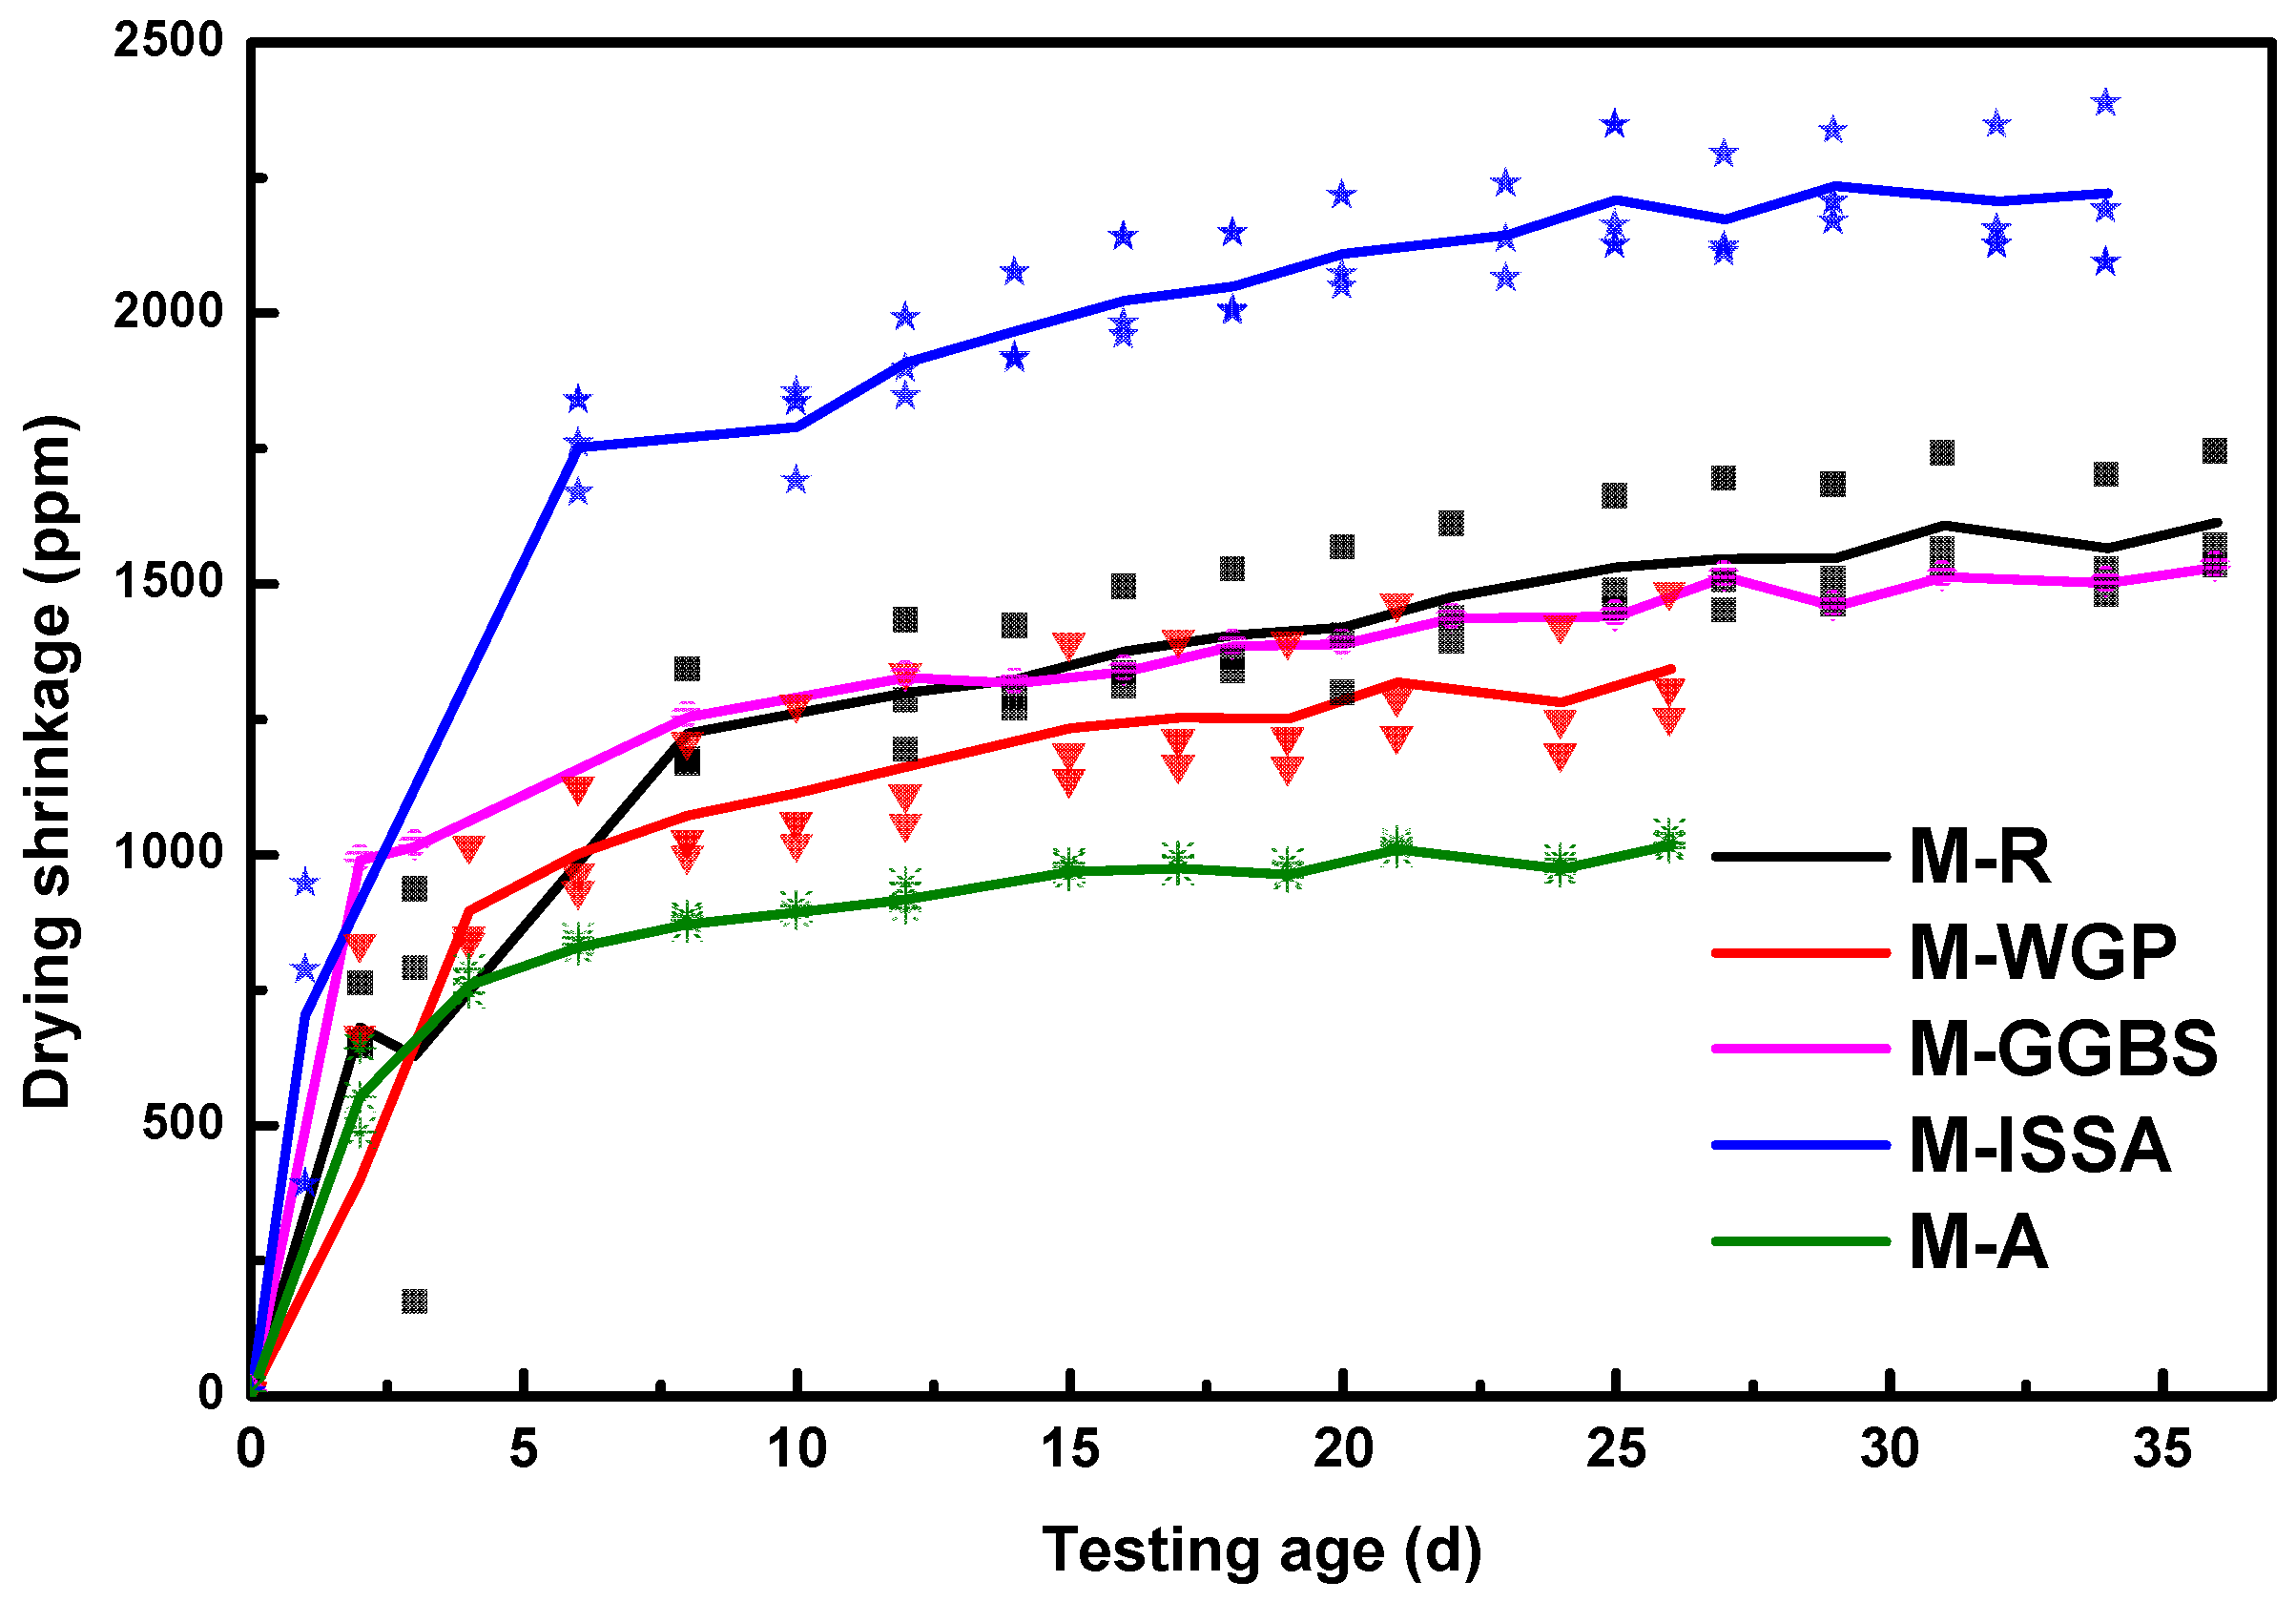
3.5. Drying Shrinkage
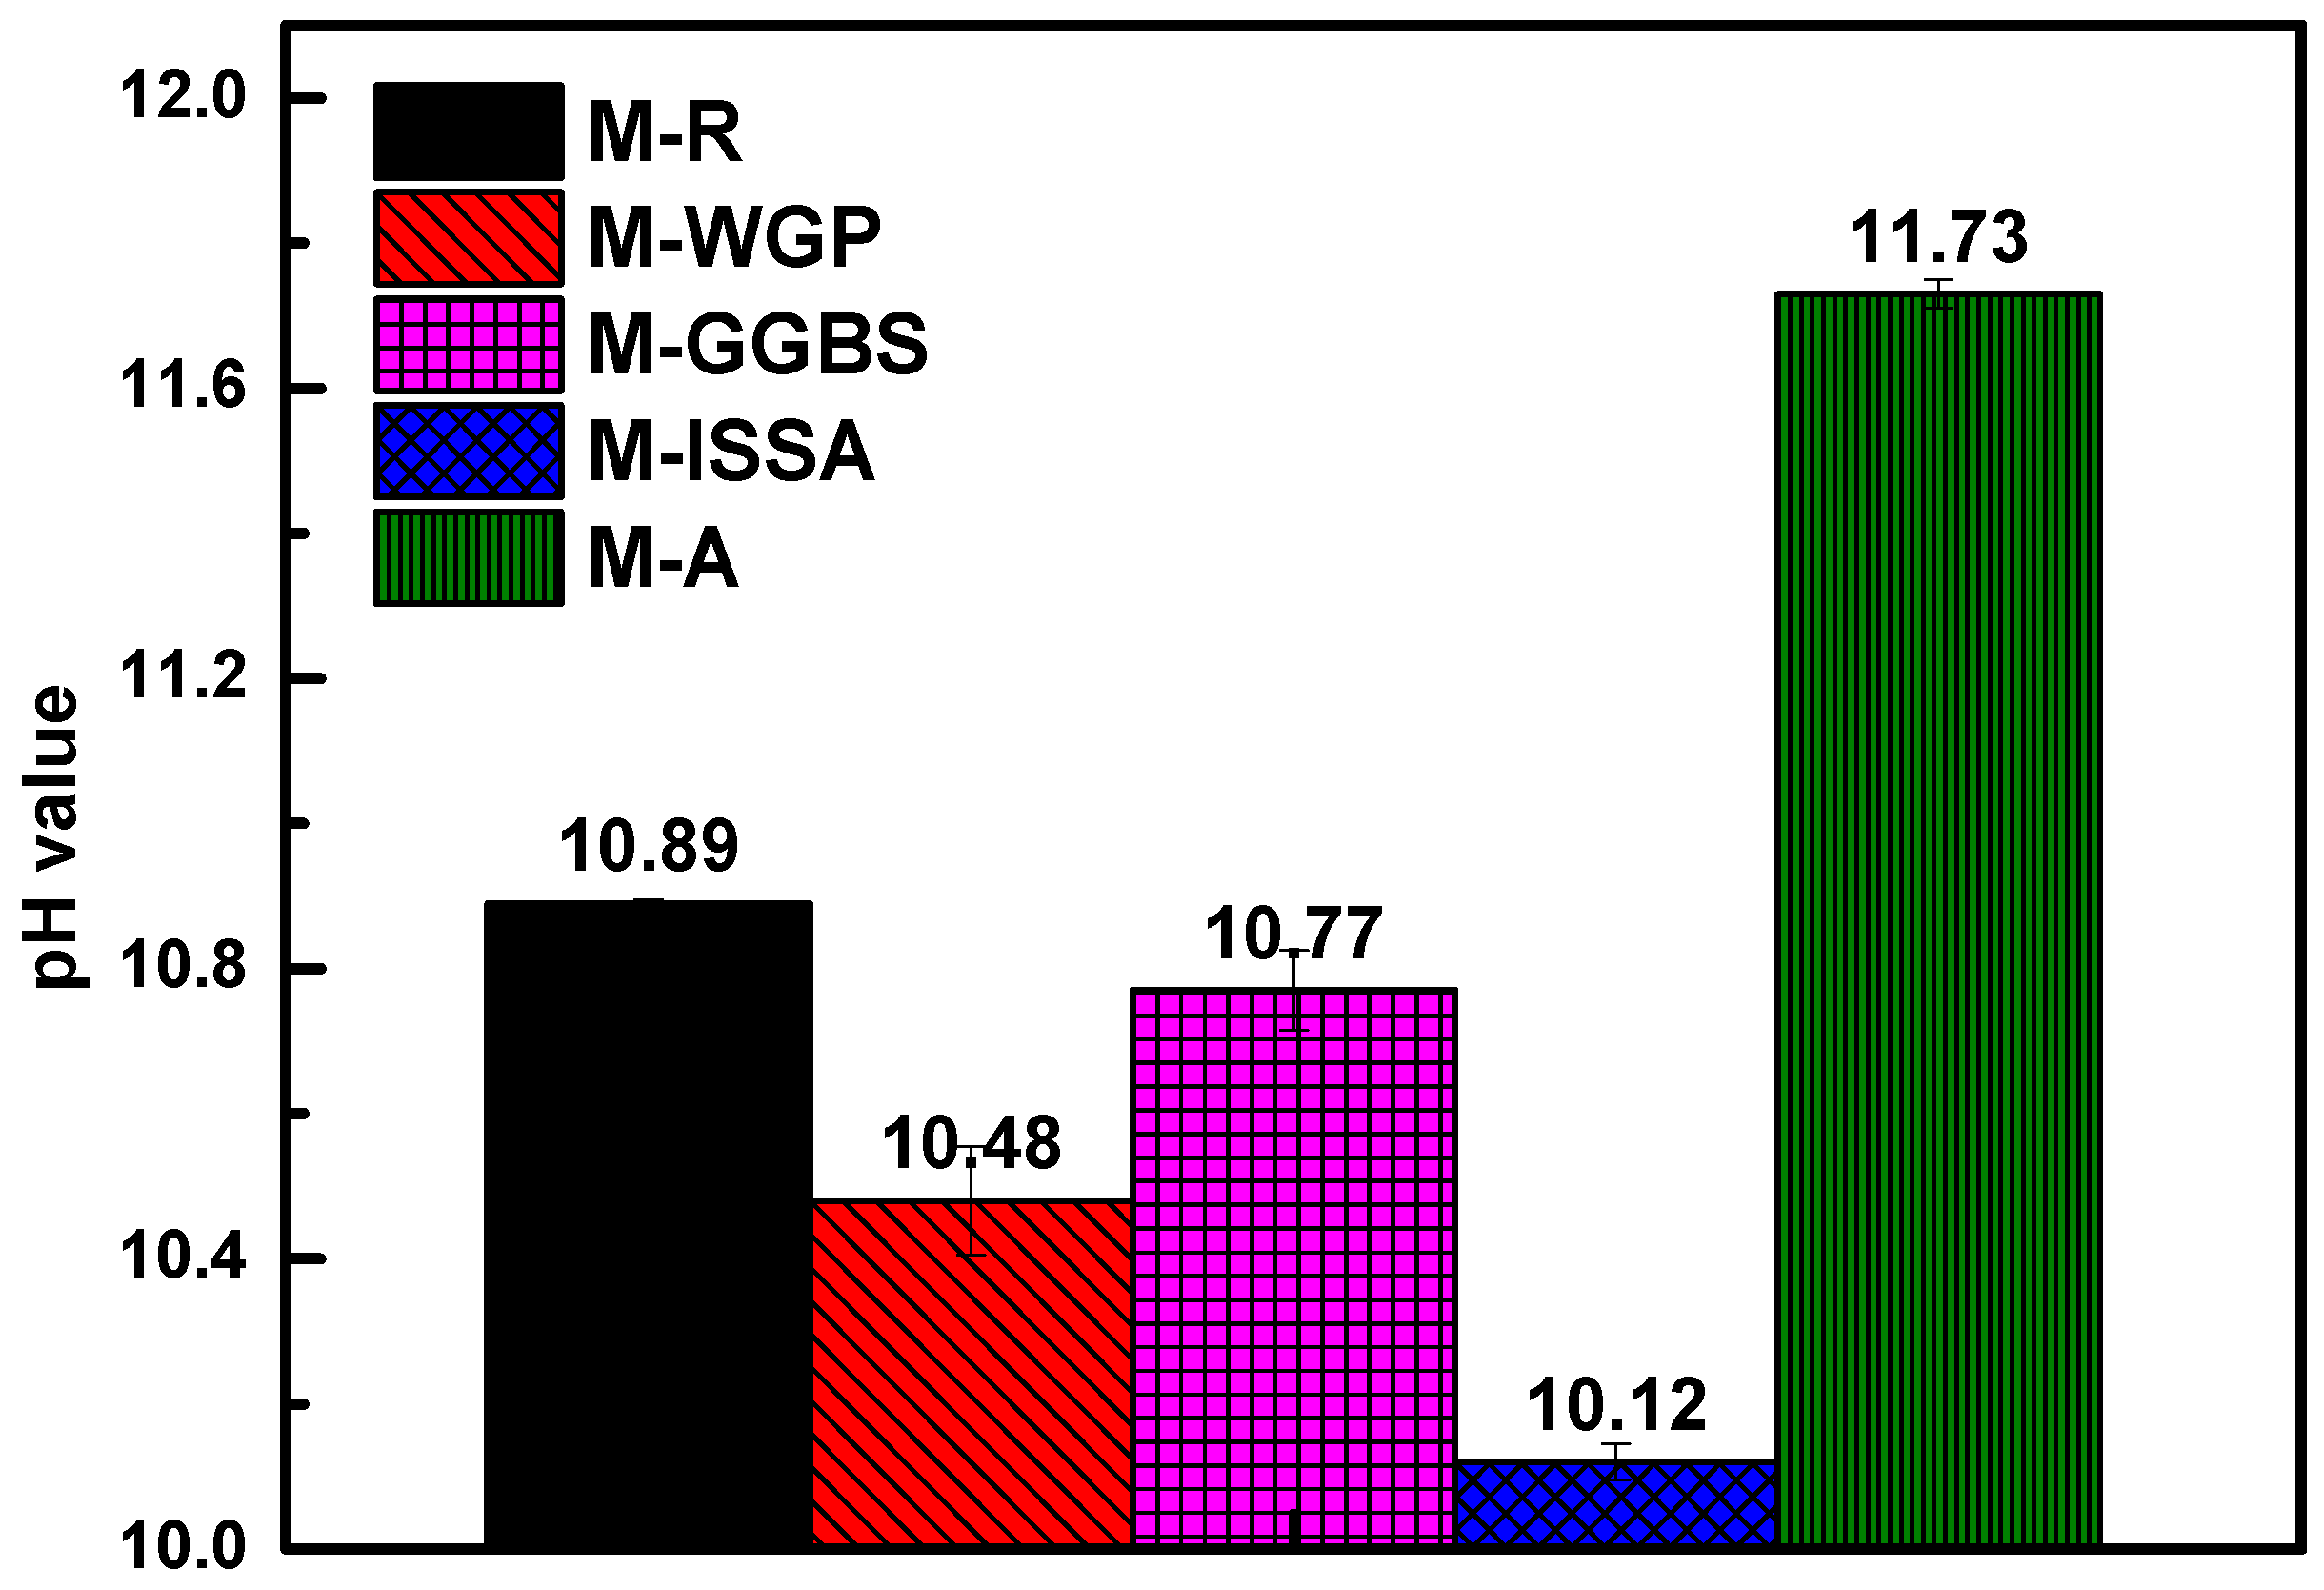
3.6. Surface pH
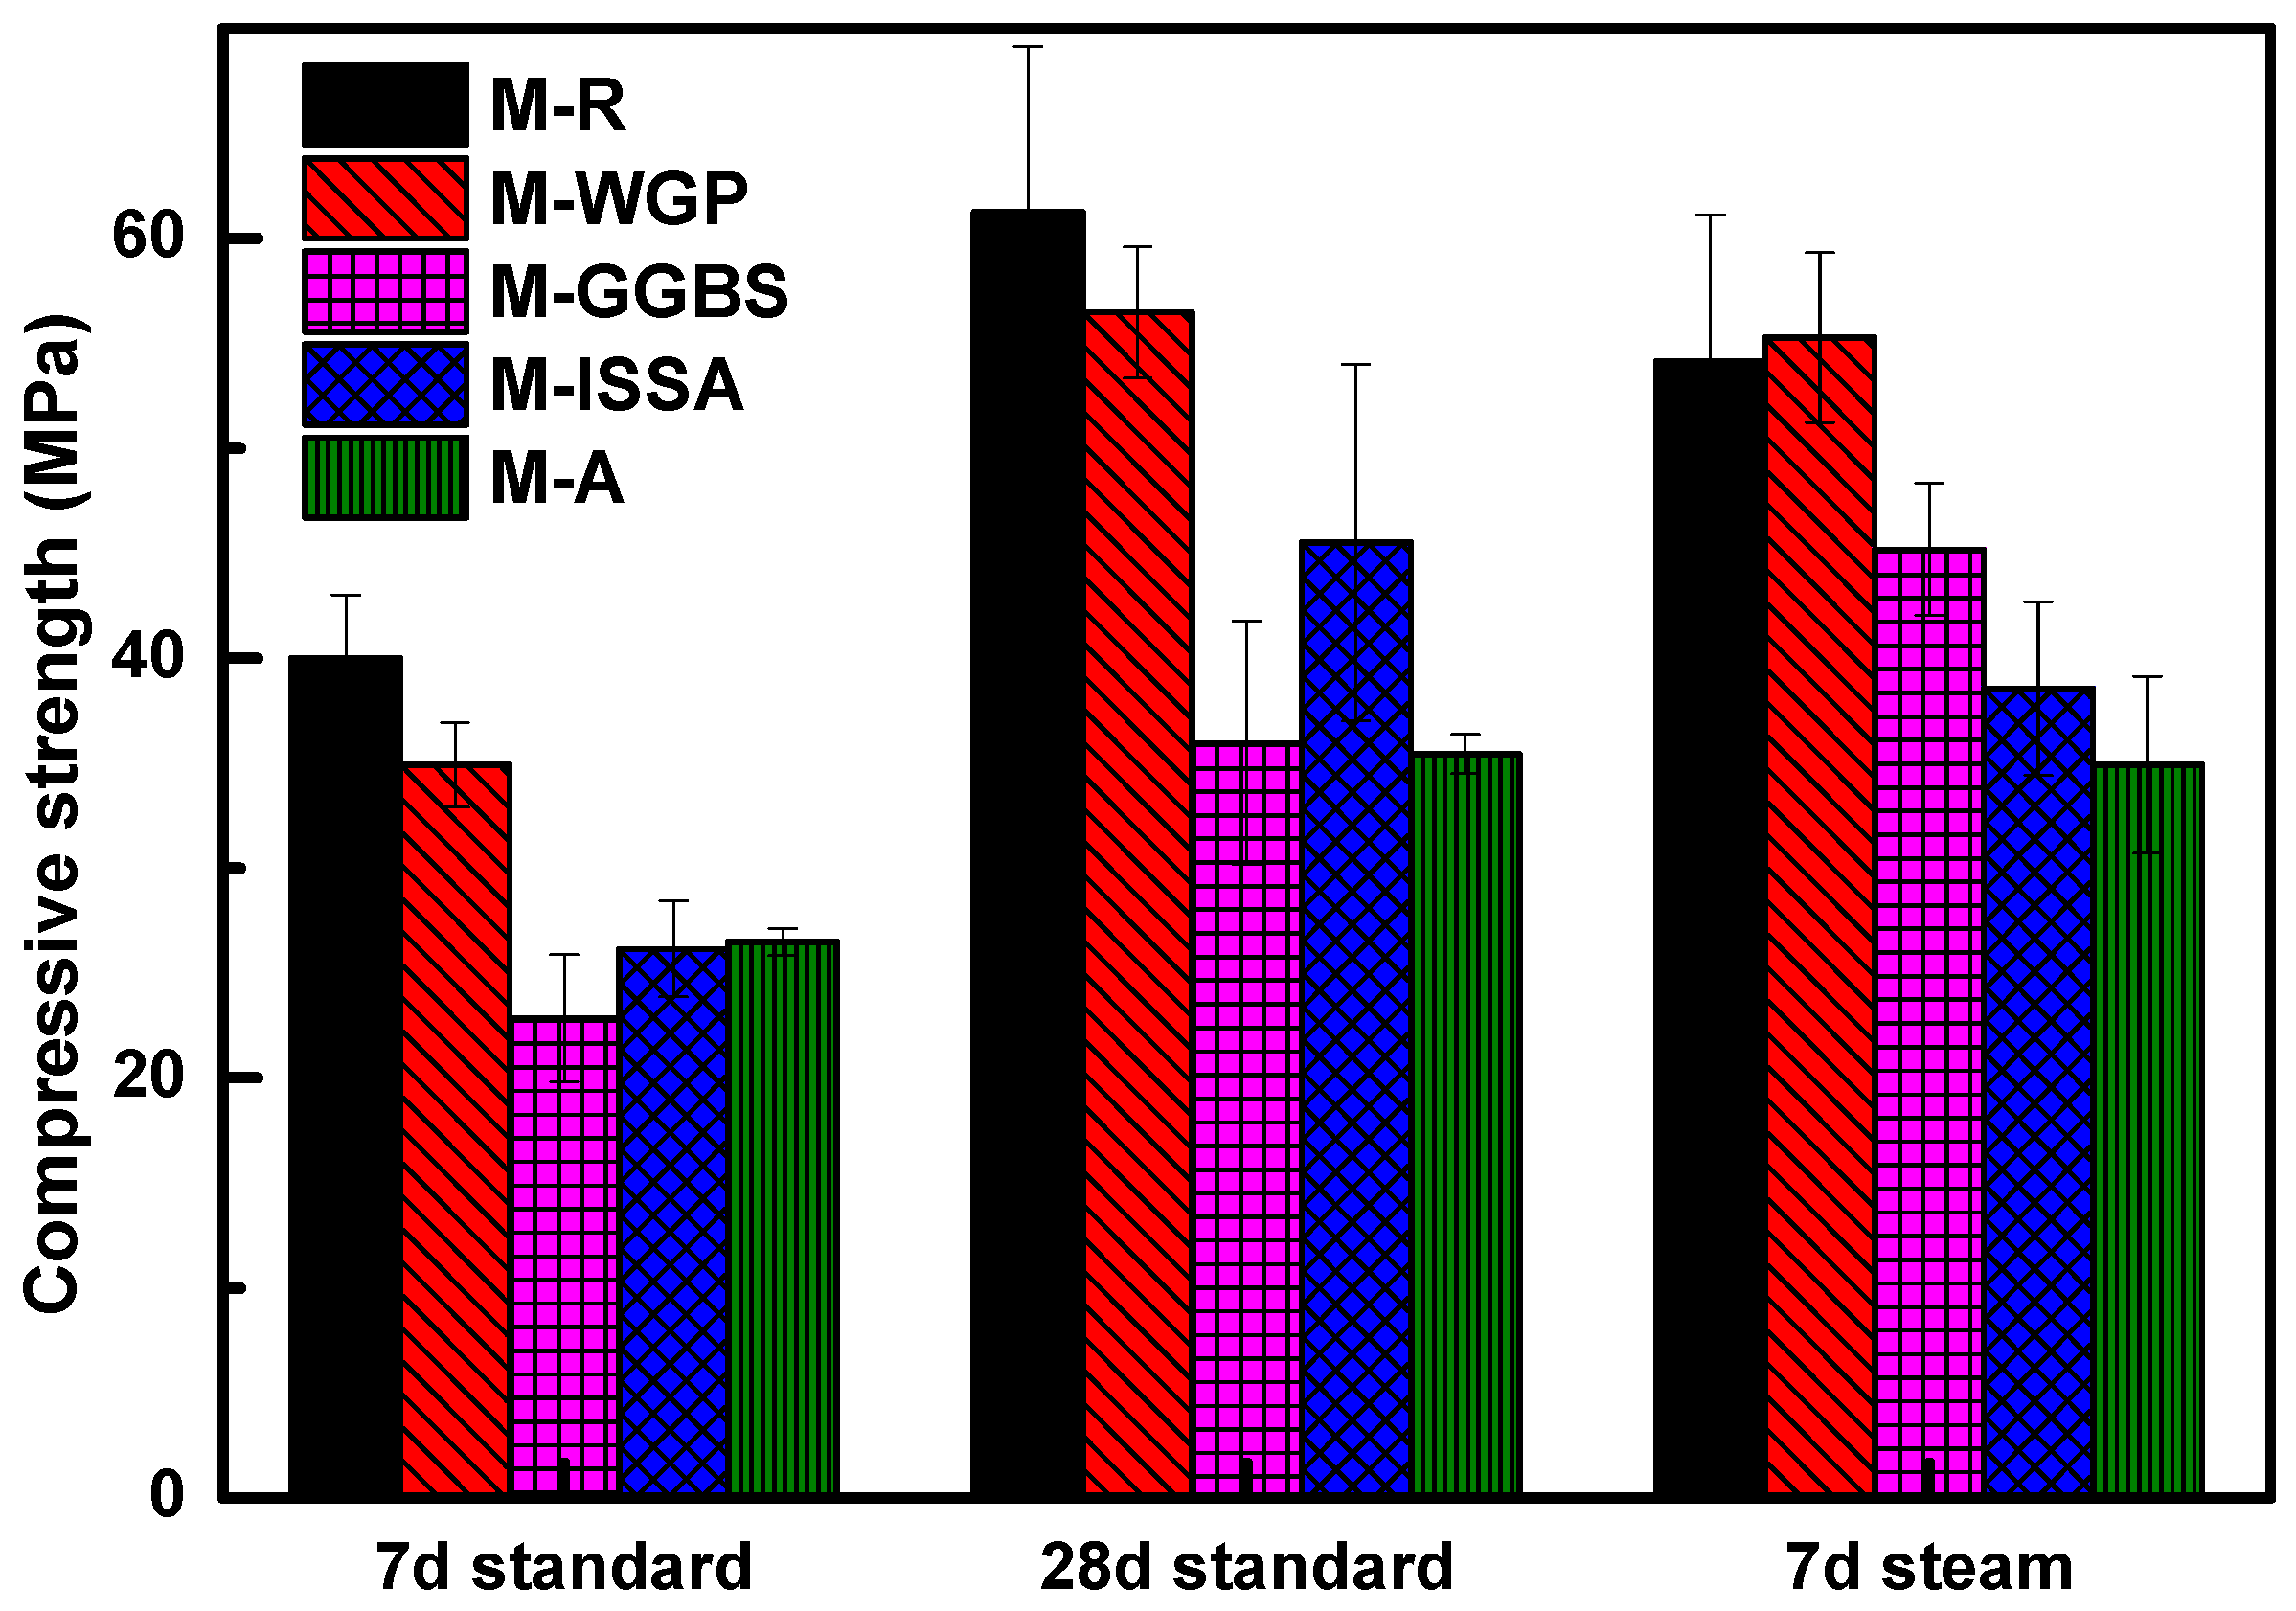
3.7. Compressive Strength
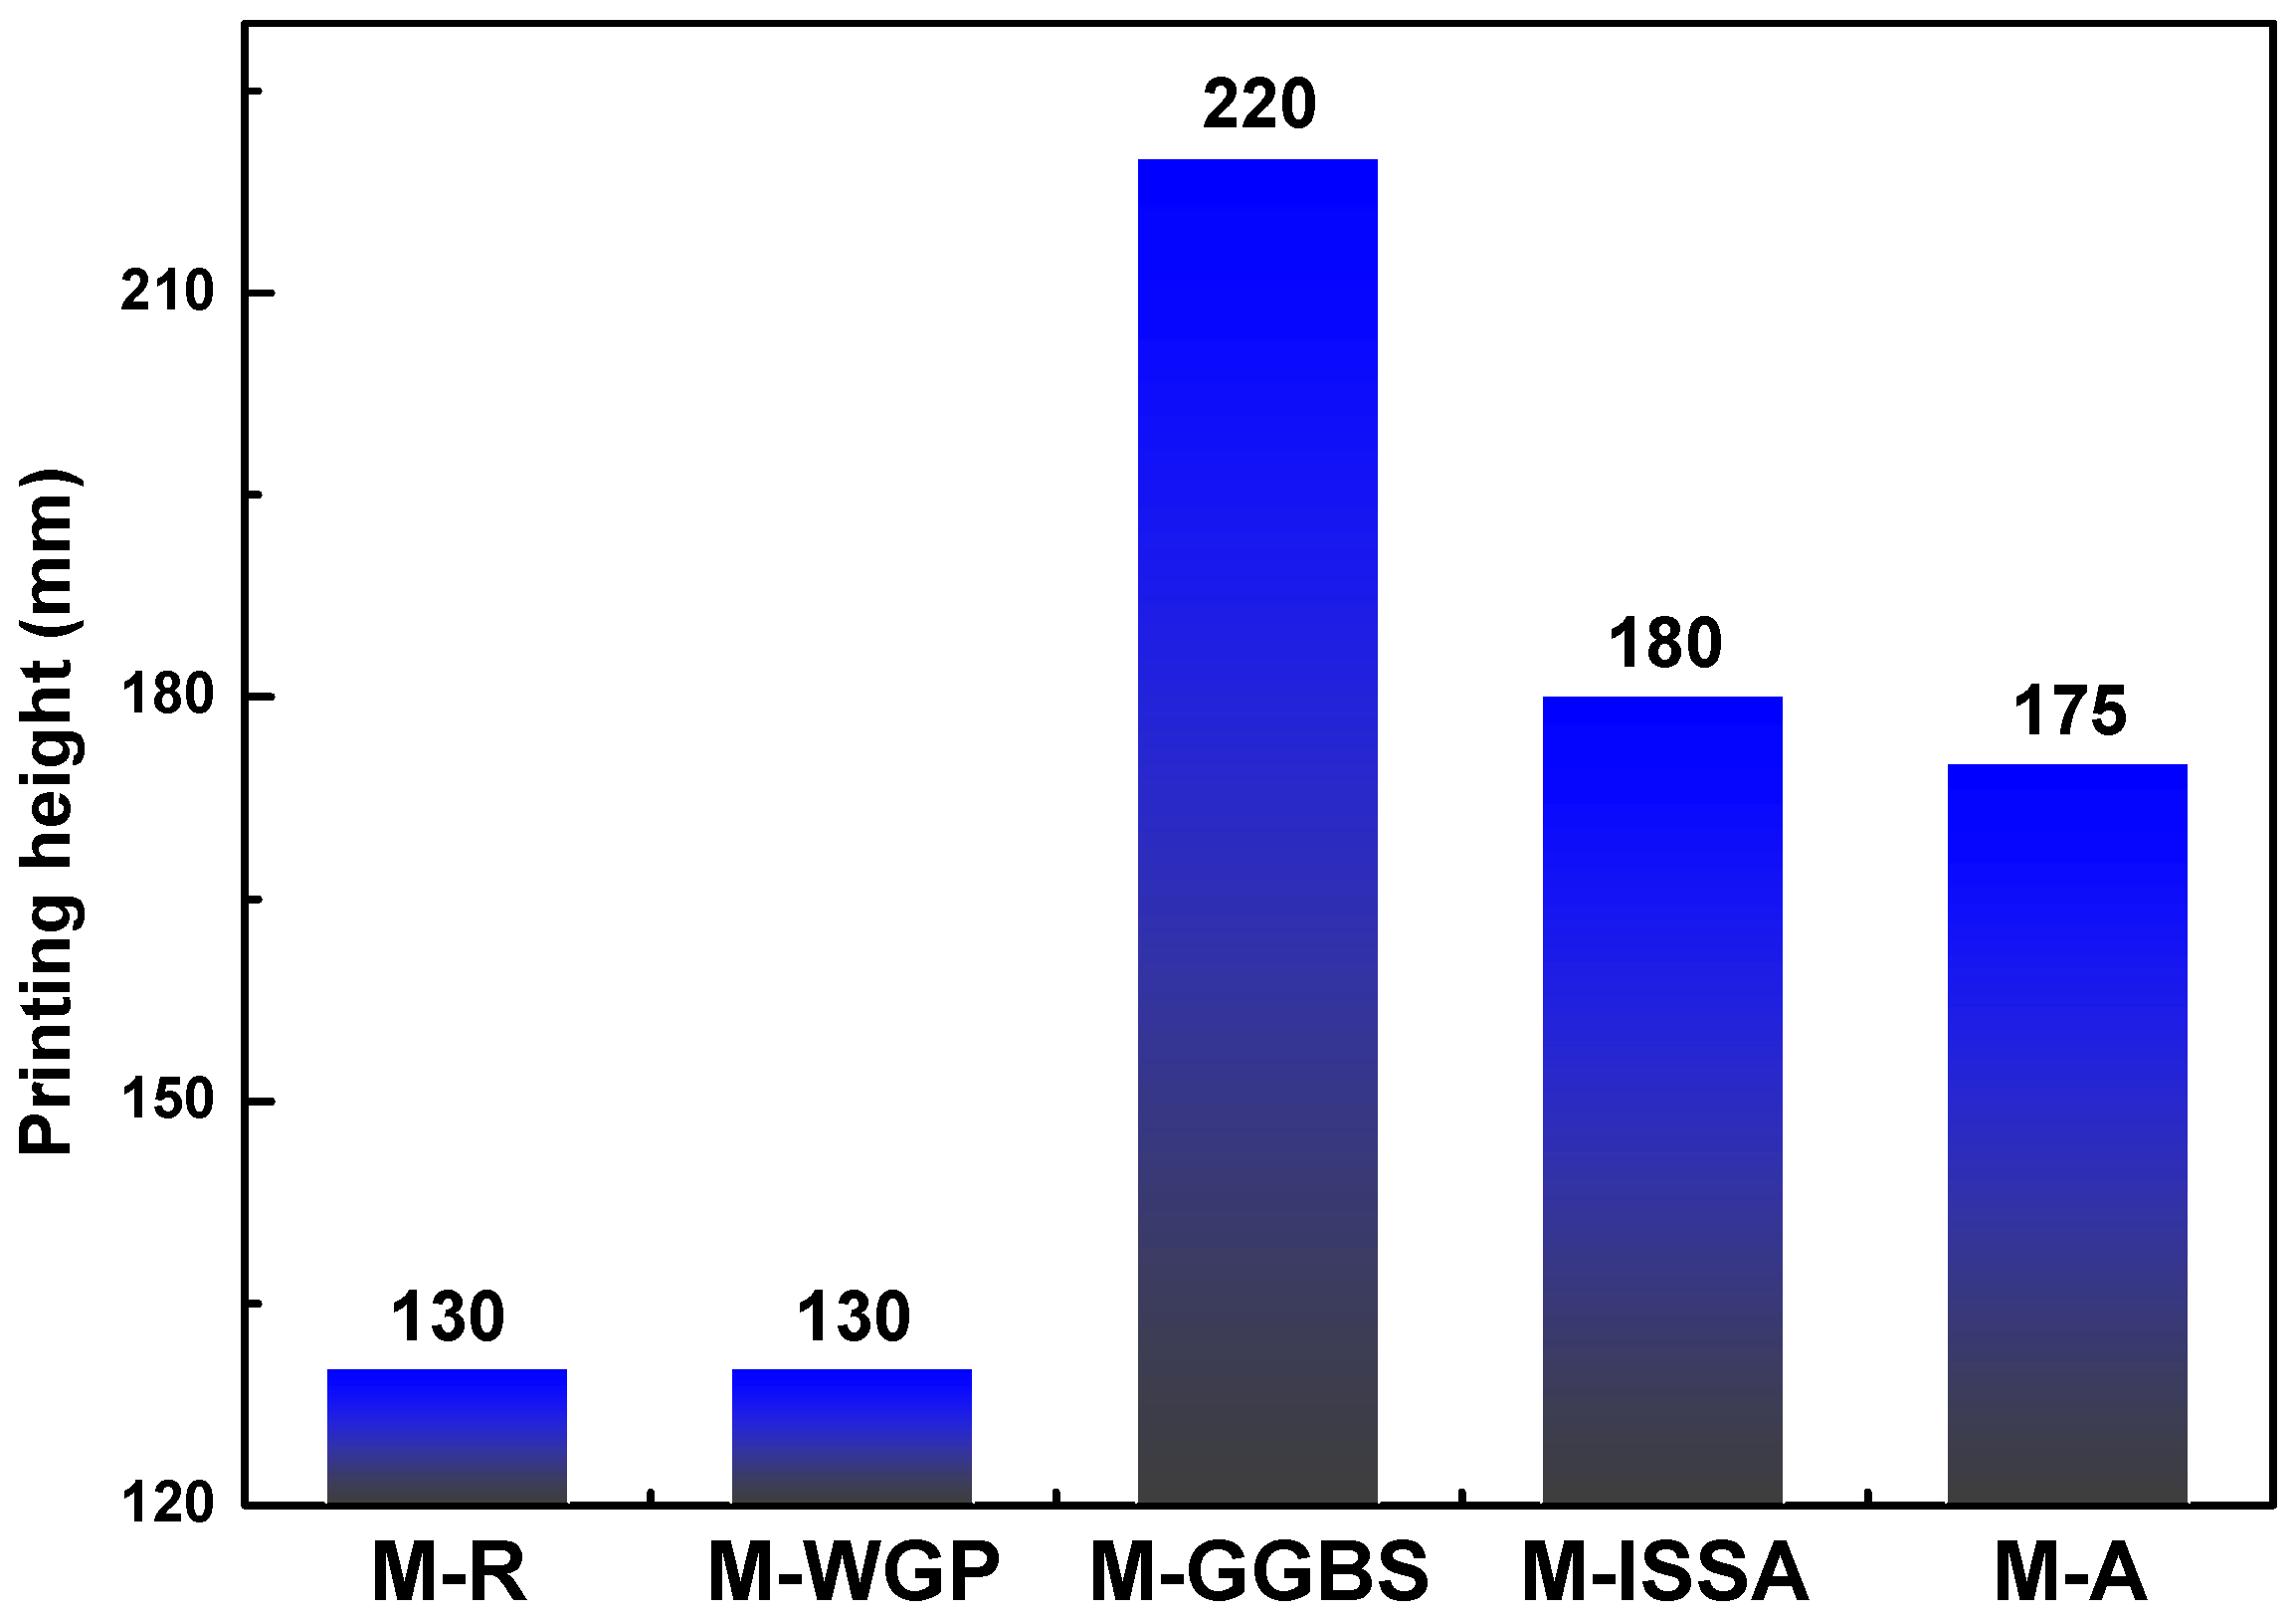
3.8. Printing Height
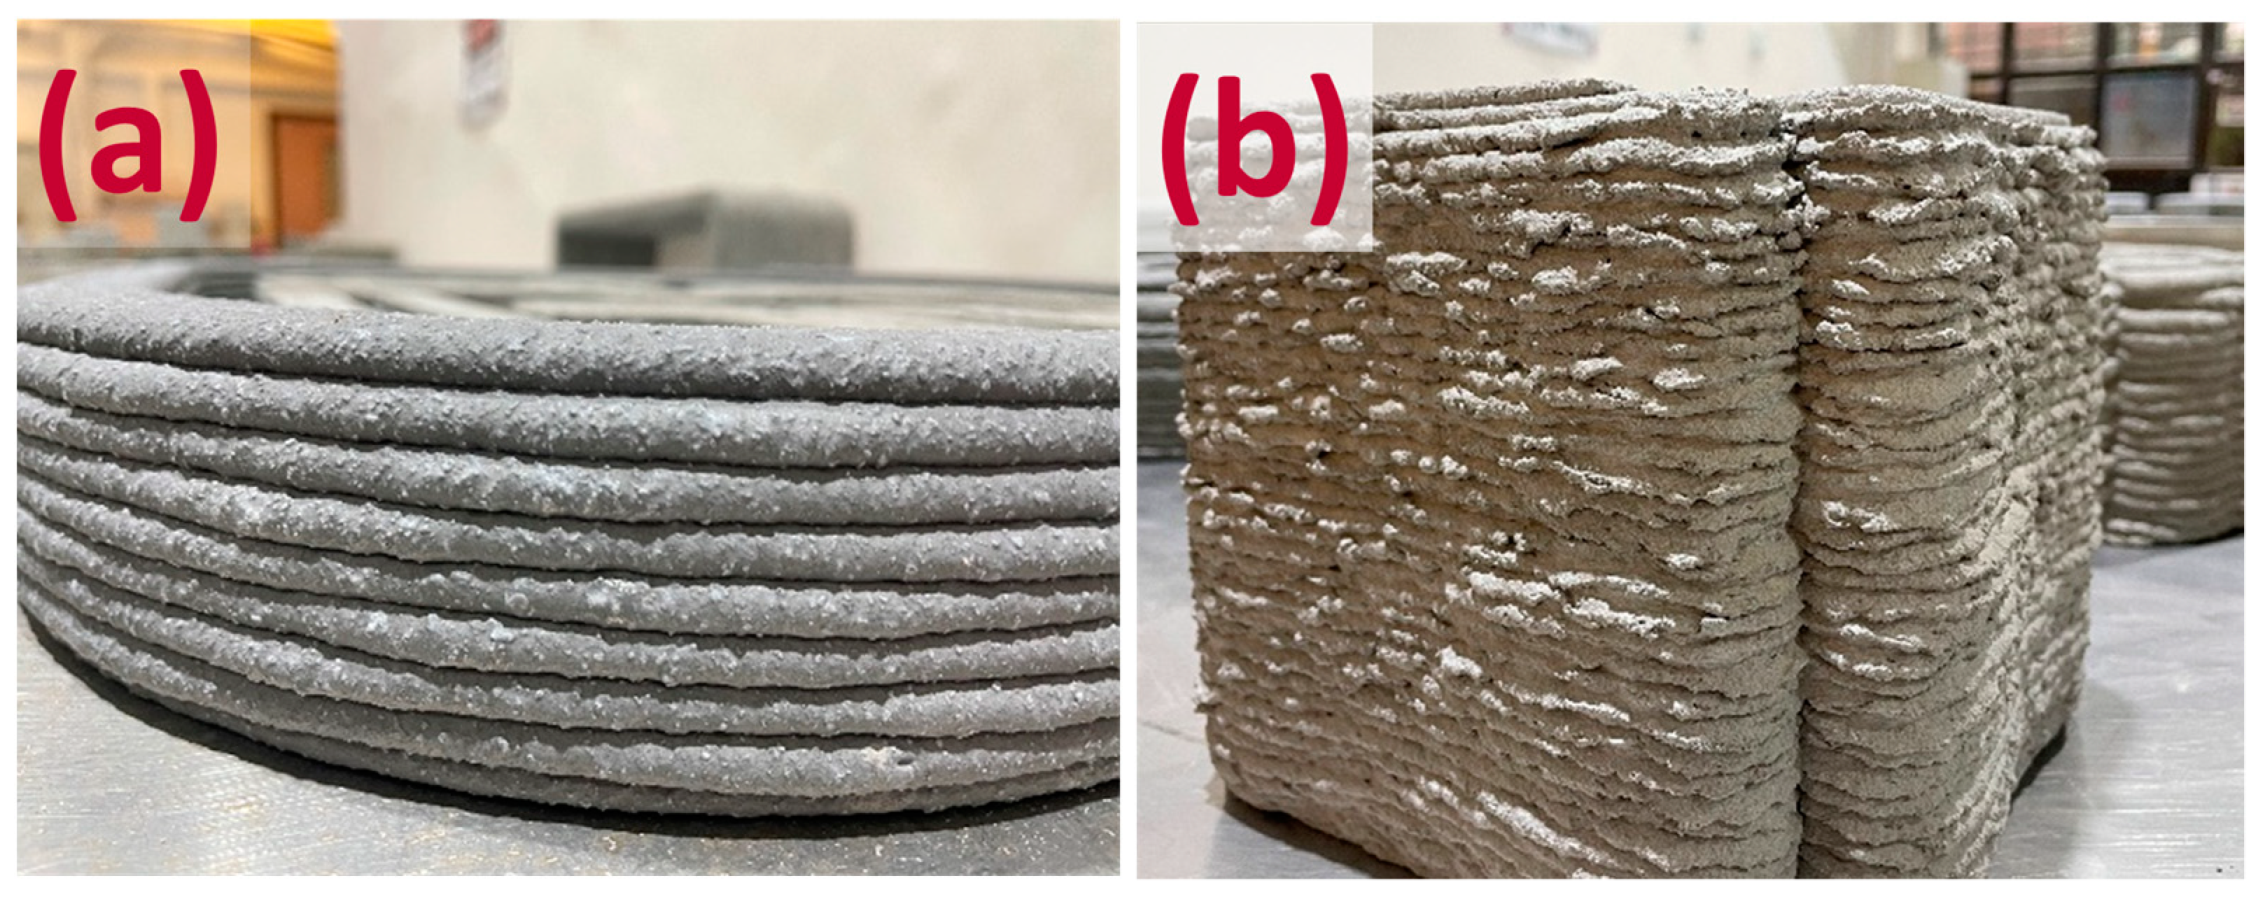
3.9. Visual Observation
4. Conclusions
- (1)
- Better printability is achieved by replacing OPC and SF in the classic low-pH recipe with slag and ISSA, which contributes to lower yield stress and reduced shape maintenance. Excessive yield stress induced by high-dosage SF in a low pH recipe can be controlled by the reasonable application of solid wastes, herein improving the extrudability and buildability. No obvious correlation between slump flow and printing height is observed.
- (2)
- Lower surface pH is actualized with the partial replacement of OPC and SF with WGP, slag, and ISSA, which consequently results in lower compressive strength. The outstanding pH control in SF is revealed after approximate quantification of the contribution of all binders on the surface pH. Reducing OPC and increasing SF content is determined to be the most effective approach for low-pH concrete development.
Author Contributions
Funding
Data Availability Statement
Conflicts of Interest
References
- Bach, T.; Coumes, C.C.D.; Pochard, I.; Mercier, C.; Revel, B.; Nonat, A. Influence of temperature on the hydration products of low pH cements. Cem. Concr. Res. 2012, 42, 805–817. [Google Scholar] [CrossRef]
- Vogt, C.; Lagerblad, B.; Wallin, K.; Baldy, F.; Jonasson, J.-E. Low pH Self Compacting Concrete for Deposition Tunnel Plugs; Swedish Nuclear Fuel and Waste Management, Co.: Stockhom, Sweden, 2009. [Google Scholar]
- Dauzères, A.; Le Bescop, P.; Cau-Dit-Coumes, C.; Brunet, F.; Bourbon, X.; Timonen, J.; Voutilainen, M.; Chomat, L.; Sardini, P. On the physico-chemical evolution of low-pH and CEM I cement pastes interacting with Callovo-Oxfordian pore water under its in situ CO2 partial pressure. Cem. Concr. Res. 2014, 58, 76–88. [Google Scholar] [CrossRef]
- Nochaiya, T.; Wongkeo, W.; Chaipanich, A. Utilization of fly ash with silica fume and properties of Portland cement–fly ash–silica fume concrete. Fuel 2010, 89, 768–774. [Google Scholar] [CrossRef]
- Mazloom, M.; Ramezanianpour, A.A.; Brooks, J.J. Effect of silica fume on mechanical properties of high-strength concrete. Cem. Concr. Compos. 2004, 26, 347–357. [Google Scholar] [CrossRef]
- Siddique, R. Utilization of silica fume in concrete: Review of hardened properties. Resour. Conserv. Recycl. 2011, 55, 923–932. [Google Scholar] [CrossRef]
- Ahmed, A.S.; Elshikh, M.M.Y.; Elemam, W.E.; Youssf, O. Influence of Mixing-Water Magnetization Method on the Performance of Silica Fume Concrete. Buildings 2023, 13, 44. [Google Scholar] [CrossRef]
- Wang, B.; Zhai, M.; Yao, X.; Wu, Q.; Yang, M.; Wang, X.; Huang, J.; Zhao, H. Printable and Mechanical Performance of 3D Printed Concrete Employing Multiple Industrial Wastes. Buildings 2022, 12, 374. [Google Scholar] [CrossRef]
- Calvo, J.G.; Hidalgo, A.; Alonso, C.; Luco, L.F. Development of low-pH cementitious materials for HLRW repositories: Resistance against ground waters aggression. Cem. Concr. Res. 2010, 40, 1290–1297. [Google Scholar] [CrossRef]
- Cheng, A.; Lin, W.-T.; Chao, S.-J.; Hsu, H.-M. Composition and selected properties of low pH mortars and concretes for radioactive waste repositories. MATEC Web Conf. 2020, 322, 01033. [Google Scholar] [CrossRef]
- Buswell, R.A.; Leal de Silva, W.R.; Jones, S.Z.; Dirrenberger, J. 3D printing using concrete extrusion: A roadmap for research. Cem. Concr. Res. 2018, 112, 37–49. [Google Scholar] [CrossRef]
- Zhang, C.; Deng, Z.; Zhang, Y.; Chen, C. Predicting the yield stress of 3d printing mortar based on the flowability of paste and excess paste thickness. In Proceedings of the 4th International Rilem Conference on Microstructure Related Durability of Cementitious Composites, The Hague, The Netherlands, 29 April 2021. [Google Scholar]
- Zou, S.; Xiao, J.; Duan, Z.; Ding, T.; Hou, S. On rheology of mortar with recycled fine aggregate for 3D printing. Constr. Build. Mater. 2021, 311, 125312. [Google Scholar] [CrossRef]
- Xiao, J.; Zou, S.; Yu, Y.; Wang, Y.; Ding, T.; Zhu, Y.; Yu, J.; Li, S.; Duan, Z.; Wu, Y.; et al. 3D recycled mortar printing: System development, process design, material properties and on-site printing. J. Build. Eng. 2020, 32, 101779. [Google Scholar] [CrossRef]
- Moelich, G.M.; Kruger, P.J.; Combrinck, R. A plastic shrinkage cracking risk model for 3D printed concrete exposed to different environments. Cem. Concr. Compos. 2022, 130, 104516. [Google Scholar] [CrossRef]
- Moelich, G.M.; Kruger, P.J.; Combrinck, R. The effect of restrained early age shrinkage on the interlayer bond and durability of 3D printed concrete. J. Build. Eng. 2021, 43, 102857. [Google Scholar] [CrossRef]
- Moelich, G.M.; Kruger, P.J.; Combrinck, R. Mitigating early age cracking in 3D printed concrete using fibres, superabsorbent polymers, shrinkage reducing admixtures, B-CSA cement and curing measures. Cem. Concr. Res. 2022, 159, 106862. [Google Scholar] [CrossRef]
- Daher, J.; Kleib, J.; Benzerzour, M.; Abriak, N.-E.; Aouad, G. Recycling of Flash-Calcined Dredged Sediment for Concrete 3D Printing. Buildings 2022, 12, 1400. [Google Scholar] [CrossRef]
- Melichar, J.; Žižková, N.; Brožovský, J.; Mészárosová, L.; Hermann, R. Study of the Interaction of Cement-Based Materials for 3D Printing with Fly Ash and Superabsorbent Polymers. Buildings 2022, 12, 2008. [Google Scholar] [CrossRef]
- Muthukrishnan, S.; Kua, H.W.; Yu, L.N.; Chung, J.K.H. Fresh Properties of Cementitious Materials Containing Rice Husk Ash for Construction 3D Printing. J. Mater. Civ. Eng. 2020, 32, 04020195. [Google Scholar] [CrossRef]
- Ma, G.; Li, Z.; Wang, L. Printable properties of cementitious material containing copper tailings for extrusion based 3D printing. Constr. Build. Mater. 2018, 162, 613–627. [Google Scholar] [CrossRef]
- Vaitkevičius, V.; Šerelis, E.; Hilbig, H. The effect of glass powder on the microstructure of ultra high performance concrete. Constr. Build. Mater. 2014, 68, 102–109. [Google Scholar] [CrossRef]
- Mirzahosseini, M.; Riding, K.A. Influence of different particle sizes on reactivity of finely ground glass as supplementary cementitious material (SCM). Cem. Concr. Compos. 2015, 56, 95–105. [Google Scholar] [CrossRef]
- Elaqra, H.; Rustom, R. Effect of using glass powder as cement replacement on rheological and mechanical properties of cement paste. Constr. Build. Mater. 2018, 179, 326–335. [Google Scholar] [CrossRef]
- Mejdi, M.; Wilson, W.; Saillio, M.; Chaussadent, T.; Divet, L.; Tagnit-Hamou, A. Quantifying glass powder reaction in blended-cement pastes with the Rietveld-PONKCS method. Cem. Concr. Res. 2020, 130, 105999. [Google Scholar] [CrossRef]
- Ting, G.H.A.; Tay, Y.W.D.; Qian, Y.; Tan, M.J. Utilization of recycled glass for 3D concrete printing: Rheological and mechanical properties. J. Mater. Cycles Waste Manag. 2019, 21, 994–1003. [Google Scholar] [CrossRef]
- Cuevas, K.; Chougan, M.; Martin, F.; Ghaffar, S.H.; Stephan, D.; Sikora, P. 3D printable lightweight cementitious composites with incorporated waste glass aggregates and expanded microspheres–Rheological, thermal and mechanical properties. J. Build. Eng. 2021, 44, 102718. [Google Scholar] [CrossRef]
- Liu, J.; Li, S.; Gunasekara, C.; Fox, K.; Tran, P. 3D-printed concrete with recycled glass: Effect of glass gradation on flexural strength and microstructure. Constr. Build. Mater. 2022, 314, 125561. [Google Scholar] [CrossRef]
- Ting, G.H.A.; Tay, Y.W.D.; Tan, M.J. Experimental measurement on the effects of recycled glass cullets as aggregates for construction 3D printing. J. Clean. Prod. 2021, 300, 126919. [Google Scholar] [CrossRef]
- Lu, J.-X.; Zhou, Y.; He, P.; Wang, S.; Shen, P.; Poon, C.S. Sustainable reuse of waste glass and incinerated sewage sludge ash in insulating building products: Functional and durability assessment. J. Clean. Prod. 2019, 236, 117635. [Google Scholar] [CrossRef]
- Chen, Z.; Poon, C.S. Comparative studies on the effects of sewage sludge ash and fly ash on cement hydration and properties of cement mortars. Constr. Build. Mater. 2017, 154, 791–803. [Google Scholar] [CrossRef]
- Chen, Z.; Li, J.S.; Poon, C.S. Combined use of sewage sludge ash and recycled glass cullet for the production of concrete blocks. J. Clean. Prod. 2018, 171, 1447–1459. [Google Scholar] [CrossRef]
- Li, J.-S.; Guo, M.-Z.; Xue, Q.; Poon, C.S. Recycling of incinerated sewage sludge ash and cathode ray tube funnel glass in cement mortars. J. Clean. Prod. 2017, 152, 142–149. [Google Scholar] [CrossRef]
- Ki, D.; Kang, S.Y.; Park, K.-M. Upcycling of Wastewater Sludge Incineration Ash as a 3D Printing Technology Resource. Front. Sustain. 2021, 2, 1–9. [Google Scholar] [CrossRef]
- Zou, S.; Xiao, J.; Ding, T.; Duan, Z.; Zhang, Q. Printability and advantages of 3D printing mortar with 100% recycled sand. Constr. Build. Mater. 2021, 273, 121699. [Google Scholar] [CrossRef]
- Ding, T.; Xiao, J.; Zou, S.; Wang, Y. Hardened properties of layered 3D printed concrete with recycled sand. Cem. Concr. Compos. 2020, 113, 103724. [Google Scholar] [CrossRef]
- Ding, T.; Xiao, J.; Zou, S.; Zhou, X. Anisotropic behavior in bending of 3D printed concrete reinforced with fibers. Compos. Struct. 2020, 254, 112808. [Google Scholar] [CrossRef]
- Kim, J.-S.; Kwon, S.-K.; Sanchez, M.; Cho, G.-C. Geological storage of high level nuclear waste. KSCE J. Civ. Eng. 2011, 15, 721–737. [Google Scholar] [CrossRef]
- Tay, Y.W.D.; Qian, Y.; Tan, M.J. Printability region for 3D concrete printing using slump and slump flow test. Compos. Part B Eng. 2019, 174, 106968. [Google Scholar] [CrossRef]
- EN 1015-3:1999; Methods of test for mortar for masonry-Part 3: Determination of consistence of fresh mortar (by flow table). iTeh, Inc.: Newark, DE, USA, 1999.
- Arunothayan, A.R.; Nematollahi, B.; Ranade, R.; Bong, S.H.; Sanjayan, J. Development of 3D-printable ultra-high performance fiber-reinforced concrete for digital construction. Constr. Build. Mater. 2020, 257, 119546. [Google Scholar] [CrossRef]
- Weng, Y.; Li, M.; Tan, M.J.; Qian, S. Design 3D printing cementitious materials via Fuller Thompson theory and Marson-Percy model. Constr. Build. Mater. 2018, 163, 600–610. [Google Scholar] [CrossRef]
- ASTM C403/403M-08; Standard Test Method for Time of Setting of Concrete Mixtures by Penetration Resistance. ASTM International: West Conshohocken, PA, USA, 2008; p. 7.
- ASTM C157/C157M-08; Standard Test Method for Length Change of Hardened Hydraulic-Cement Mortar and Concrete. ASTM International: West Conshohocken, PA, USA, 2014.
- BS EN 1015-11:2019; Methods of Test for Mortar for Masonry—Part 11: Determination of Flexural and Compressive Strength of Hardened Mortar. iTeh, Inc.: Newark, DE, USA, 1999.
- Rehman, A.U.; Kim, J.-H. 3D Concrete Printing: A Systematic Review of Rheology, Mix Designs, Mechanical, Microstructural, and Durability Characteristics. Materials 2021, 14, 3800. [Google Scholar] [CrossRef]
- Chen, X.; Chen, H.; Tan, W. Effect of glass powder on the mechanical and drying shrinkage of glass-fiber-reinforced cementitious composites. Case Stud. Constr. Mater. 2022, 17, e01587. [Google Scholar] [CrossRef]
- Huang, D.; Chen, P.; Peng, H.; Yang, Y.; Yuan, Q.; Su, M. A review and comparison study on drying shrinkage prediction between alkali-activated fly ash/slag and ordinary Portland cement. Constr. Build. Mater. 2021, 305, 124760. [Google Scholar] [CrossRef]
- Di Bella, C. Drying Shrinkage of Cementitious Materials at Early Age; ETH Zurich: Zurich, Switzerland, 2016. [Google Scholar]
- Nahi, S.; Leklou, N.; Khelidj, A.; Oudjit, M.N.; Zenati, A. Properties of cement pastes and mortars containing recycled green glass powder. Constr. Build. Mater. 2020, 262, 120875. [Google Scholar] [CrossRef]
- Lothenbach, B.; Le Saout, G.; Haha, M.B.; Figi, R.; Wieland, E. Hydration of a low-alkali CEM III/B–SiO2 cement (LAC). Cem. Concr. Res. 2012, 42, 410–423. [Google Scholar] [CrossRef]
- Zhu, Y.; Yang, Y.; Yao, Y. Use of slag to improve mechanical properties of engineered cementitious composites (ECCs) with high volumes of fly ash. Constr. Build. Mater. 2012, 36, 1076–1081. [Google Scholar] [CrossRef]
- Duffó, G.S.; Morris, W.; Raspini, I.; Saragovi, C. A study of steel rebars embedded in concrete during 65 years. Corros. Sci. 2004, 46, 2143–2157. [Google Scholar] [CrossRef]
- Maruthapandian, V.; Saraswathy, V.; Muralidharan, S. Development of solid state embeddable reference electrode for corrosion monitoring of steel in reinforced concrete structures. Cem. Concr. Compos. 2016, 74, 100–108. [Google Scholar] [CrossRef]
- Montemor, M.F.; Simões, A.M.P.; Salta, M.M. Effect of fly ash on concrete reinforcement corrosion studied by EIS. Cem. Concr. Compos. 2000, 22, 175–185. [Google Scholar] [CrossRef]
- Kocaba, V. Development and Evaluation of Methods to Follow Microstructural Development of Cementitious Systems Including Slags; EPFL: Lausanne, Switzerland, 2009. [Google Scholar]
- Pane, I.; Hansen, W. Investigation of blended cement hydration by isothermal calorimetry and thermal analysis. Cem. Concr. Res. 2005, 35, 1155–1164. [Google Scholar] [CrossRef]
- Escalante, J.I.; Gómez, L.Y.; Johal, K.K.; Mendoza, G.; Mancha, H.; Méndez, J. Reactivity of blast-furnace slag in Portland cement blends hydrated under different conditions. Cem. Concr. Res. 2001, 31, 1403–1409. [Google Scholar] [CrossRef]
- Luke, K.; Lachowski, E. Internal Composition of 20-Year-Old Fly Ash and Slag-Blended Ordinary Portland Cement Pastes. J. Am. Ceram. Soc. 2008, 91, 4084–4092. [Google Scholar] [CrossRef]
- Schmuckler, J.S. Solubility product constant, Ksp. J. Chem. Educ. 1982, 59, 245. [Google Scholar] [CrossRef]
- Hu, X.; Poon, C.S. Chloride-related steel corrosion initiation in cement paste prepared with the incorporation of blast-furnace slag. Cem. Concr. Compos. 2022, 126, 104349. [Google Scholar] [CrossRef]
- Mejdi, M.; Wilson, W.; Saillio, M.; Chaussadent, T.; Divet, L.; Tagnit-Hamou, A. Hydration and microstructure of glass powder cement pastes—A multi-technique investigation. Cem. Concr. Res. 2022, 151, 106610. [Google Scholar] [CrossRef]
- Alsadey, S.J. Effect of superplasticizer on fresh and hardened properties of concrete. Engineering 2015, 1, 70–74. [Google Scholar]
- Kong, F.-r.; Pan, L.-s.; Wang, C.-m.; Zhang, D.-l.; Xu, N. Effects of polycarboxylate superplasticizers with different molecular structure on the hydration behavior of cement paste. Constr. Build. Mater. 2016, 105, 545–553. [Google Scholar] [CrossRef]
- Gu, X.; Li, X.; Zhang, W.; Gao, Y.; Kong, Y.; Liu, J.; Zhang, X. Effects of HPMC on Workability and Mechanical Properties of Concrete Using Iron Tailings as Aggregates. Materials 2021, 14, 6451. [Google Scholar] [CrossRef] [PubMed]
- Kou, S.C.; Xing, F. The Effect of Recycled Glass Powder and Reject Fly Ash on the Mechanical Properties of Fibre-Reinforced Ultrahigh Performance Concrete. Adv. Mater. Sci. Eng. 2012, 2012, 263243. [Google Scholar] [CrossRef] [Green Version]


| Material | OPC | SF | WGP | Slag | ISSA | |
|---|---|---|---|---|---|---|
| Chemical compositions (wt.%) | SiO2 | 18.7 | 95.9 | 69 | 31.5 | 37 |
| Al2O3 | 4.4 | - | 2.6 | 16.1 | 15.2 | |
| CaO | 68.1 | 0.1 | 10.5 | 40.2 | 6.9 | |
| MgO | - | 0.2 | 1.4 | 8 | 2.8 | |
| SO3 | 5.2 | 3.2 | 0.1 | 2.3 | 3.7 | |
| Fe2O3 | 2.7 | 0.1 | 1.4 | 0.3 | 14 | |
| K2O | 0.6 | 0.4 | 0.8 | 0.6 | 2.8 | |
| Na2O | 0.3 | - | 13.5 | - | 7.1 | |
| Density (g/cm3) | 3.04 | 2.76 | 2.32 | 2.87 | 2.29 | |
| Specific surface area (m2/kg) | 761.1 | 5658 | 460.6 | 666.3 | 152.3 | |
| ID a | OPC | SF | WGP | Slag | ISSA | Sand | Tap Water | PP Fiber | SP | HPMC |
|---|---|---|---|---|---|---|---|---|---|---|
| M-R | 600 | 400 | 0 | 0 | 0 | 1000 | 350 | 5 | 4.4 | 1 |
| M-WGP | 400 | 200 | 400 | 0 | 0 | 1000 | 350 | 5 | 3.1 | 1 |
| M-GGBS | 200 | 400 | 0 | 400 | 0 | 1000 | 350 | 5 | 4.0 | 1 |
| M-ISSA | 500 | 300 | 0 | 0 | 200 | 1000 | 350 | 5 | 4.1 | 0.5 |
| ID | Height/cm | Buildability Index | |
|---|---|---|---|
| Before Compression | After Compression | ||
| M-R | 5.8 | 4.0 | 31% |
| M-WGP | 4.3 | 2.7 | 37% |
| M-GGBS | 5.2 | 2.3 | 56% |
| M-ISSA | 5.2 | 3.3 | 37% |
| M-A | 3.8 | 2.1 | 45% |
| ID a | Dynamic Yield Stress/Pa | Plastic Viscosity/Pa·s | Thixotropy/Pa·s−1 |
|---|---|---|---|
| M-R | 219.3 | 3.2 | 6949.4 |
| M-WGP | 192.8 | 4.3 | 4922.4 |
| M-GGBS | 160.3 | 3.6 | 4082.9 |
| M-ISSA | 157.8 | 2.7 | 5567.4 |
| Material | OPC | SF | WGP | Slag | ISSA |
|---|---|---|---|---|---|
| Alkali release | a | b | c | d | e |
Disclaimer/Publisher’s Note: The statements, opinions and data contained in all publications are solely those of the individual author(s) and contributor(s) and not of MDPI and/or the editor(s). MDPI and/or the editor(s) disclaim responsibility for any injury to people or property resulting from any ideas, methods, instructions or products referred to in the content. |
© 2023 by the authors. Licensee MDPI, Basel, Switzerland. This article is an open access article distributed under the terms and conditions of the Creative Commons Attribution (CC BY) license (https://creativecommons.org/licenses/by/4.0/).
Share and Cite
Li, X.-S.; Li, L.; Zou, S. Developing Low-pH 3D Printing Concrete Using Solid Wastes. Buildings 2023, 13, 454. https://doi.org/10.3390/buildings13020454
Li X-S, Li L, Zou S. Developing Low-pH 3D Printing Concrete Using Solid Wastes. Buildings. 2023; 13(2):454. https://doi.org/10.3390/buildings13020454
Chicago/Turabian StyleLi, Xiao-Sheng, Long Li, and Shuai Zou. 2023. "Developing Low-pH 3D Printing Concrete Using Solid Wastes" Buildings 13, no. 2: 454. https://doi.org/10.3390/buildings13020454