Article

Study on Eccentric Compressive Behavior of Concrete Columns Reinforced with NPR735 High-Strength Steel Bars

1
School of Civil Engineering, Shandong University, Jinan 256001, China
2
State Key Laboratory for Geomechanics and Deep Underground Engineering, China University of Mining and Technology (Beijing), Beijing 100083, China
*
Authors to whom correspondence should be addressed.
Buildings 2023, 13(1), 188; https://doi.org/10.3390/buildings13010188
Submission received: 18 December 2022 / Revised: 4 January 2023 / Accepted: 8 January 2023 / Published: 10 January 2023
(This article belongs to the Special Issue Advances in Steel Structures: Testing, Modelling and Design)

Abstract

:
In this paper, eccentric compressive tests and theoretical studies of grade 735 MPa reinforced concrete columns were conducted. The eccentric distance and strength of the longitudinal reinforcement were used as experimental parameters to investigate the bearing capacity, failure mode, and strength of eccentric compressive behavior of NPR735 high-strength steel bars. When the load eccentricity of the reinforced concrete columns was small or longitudinal, the reinforcement ratio was large, and small eccentricity failure occurred. The results were similar to the failure mode of ordinary concrete columns with traditional steel bars. When the load eccentricity decreased, the bearing capacity increased, but the deflection and ductility of the specimen decreased. When the strength of the longitudinal reinforcement increased, the bearing capacity of the specimen increased slightly. Finally, according to current design methods in the concrete structure design code, the bearing capacity of the eccentric compressive column was obtained, and the calculated results were compared with the experimental results to verify the applicability of the concrete structure design code GB50010-2010 to concrete columns with grade 735 MPa reinforcement.

1. Introduction

With the continuous emergence of complex engineering structures, steel reinforcement bars are increasingly required to possess higher mechanical performance. Recently, a new type of structural reinforcement bar with negative Poisson’s ratio effect (NPR reinforcement) was developed, which exhibits high strength and high ductility. Numerous studies have focused on the compressive performance of concrete columns reinforced with high-strength NPR reinforcement. Liu et al. [1] conducted eccentric compressive tests on 500 MPa reinforced concrete columns and analyzed the macro characteristics of eccentric compressive columns, namely, the failure mode, bearing capacity and deflection; and the analysis of microscopic characteristics, which were steel strain and concrete strain. It was found that the 500 MPa steel bar and concrete could work with each other, the utilization of reinforcement strength was relatively small, and the ultimate strain of concrete on the compressive zone of most specimens exceeded 0.0033. Xu et al. [2] conducted an experimental study on HRBF500 reinforced concrete columns under large eccentric compression, and analyzed the failure mode, bearing capacity, reinforcement strain and concrete strain. It was found that the large eccentric failure mode of HRBF500 reinforced concrete compression column was similar to that of ordinary reinforced concrete column, and the mechanical performance of the reinforcement was good. The applicability of Code for Design of Concrete Structures [3] to HRBF500 reinforced concrete columns was verified. The design value of the tensile strength of HRBF500 reinforcement was set as 450 MPa, and the design value of compressive strength is as follows: when x ≥ 2.5 as’, fy’ is 450 MPa, and x < 2.5 as’, fy’ is 400 MPa. X and as’ are the height of the concrete pressure zone and the distance from the point of combined force for the tensile reinforcement to the edge of the tensile zone. Wang [4] conducted an experimental study on HRBF500 reinforced concrete columns, mainly analyzing the two failure modes of axial compression and eccentric compression. It was found that the compressive properties of 500 MPa fine-grained reinforced concrete columns under compression were similar to those of ordinary reinforced concrete columns, and the similarities specifically manifested in failure form, crack development and deformation performance, which revealed that the strength of 500 MPa fine-grained reinforcement could be fully utilized. Zhuo et al. [5] carried out eccentric compressive tests on short columns with 500 MPa grade steel self-compacting concrete, and then conducted a further finite element analysis. The parameters were concrete strength, eccentricity distance and reinforcement ratio. The performance of the 500 MPa grade reinforced concrete short columns was found to be similar to that of ordinarily reinforced concrete columns, the load-carrying capacity calculation formula of the Highway Bridge Code was verified, and the design strength of 500 MPa grade reinforcement was proposed to be taken as: fy = fy’ = 420 MPa. Cui et al. [6,7] conducted axial and eccentric compressive tests of short concrete columns reinforced with 635 MPa class hot-rolled ribbed high-strength steel bars. The axial compressive experimental parameters were longitudinal reinforcement ratio, hoop strength, and volumetric hoop ratio, which revealed the mechanical properties of the whole process of axial compression, and the matching of concrete and high-strength reinforcement. The calculation equation of axial compressive load-carrying capacity of short columns with 635 MPa class reinforced concrete was proposed. The eccentricity, longitudinal reinforcement ratio, hoop strength and aspect ratio were the parameters studied in eccentric compression to reveal the failure mode, stress model, deflection and strain distribution. The eccentricity and aspect ratio decreased, the longitudinal reinforcement ratio and hoop strength increased, and the eccentric bearing capacity increased. The ductility was improved by increasing the hoop strength and longitudinal reinforcement ratio. The accuracy of the specification was verified. Xiong et al. [8,9,10,11] conducted reinforcement tensile tests, concrete column eccentric tests, axial compression tests, concrete beam bending tests, and simulation studies. The design values of HRB600 reinforcement strength were determined by the tests, in which the tensile strength was taken as 520 MPa, and the compressive strength was taken as 490 MPa (eccentric pressure) and 400 MPa (axial pressure); the test results were compared with the maximum crack width calculated by the code, and the proposed corrections to the formula were undertaken. Yin et al. [12] collected test results from 37 high-strength steel and concrete columns. Based on the test results, the length prediction equations for the equivalent plastic hinge of columns proposed by Priestley, Paulay, Telemachos, and JTG/T B02-01-2008 were evaluated. The proposed equations were found to have a large dispersion in calculating the plastic hinge length of high-strength reinforced piers. The equations proposed by Paulay and Telemachos obtained larger results than the test ones, while the equations proposed by Priestley and JTG/T B02-01-2008 obtained more conservative results. Sayedmahdi et al. [13] conducted static tests on 600 MPa class reinforced concrete beam–column joints. Variables such as longitudinal reinforcement strength, concrete strength, reinforcement ratio, column–beam flexural bearing capacity ratio and longitudinal reinforcement diameter were investigated. It was found that the cumulative energy dissipation increased with high-strength concrete for the same 600 MPa grade reinforcement ratio, while high-strength concrete had no significant impact on secant stiffness and peak load. Ding et al. [14] conducted quasi-static tests and a numerical study on stressed concrete bridge piers reinforced by high-strength HTRB600 steel bars that exhibited low elongation and poor low-cycle fatigue performance. The increase in slenderness ratio (L/D) severely weakened the low-cycle fatigue life of the steel, but the deformation capacity of RC piers was still higher than or equal to that of HRB400. Based on the test results and finite element analysis, the effects of different factors on the mechanical performance of reinforced concrete piers were revealed in detail.
Much research has been conducted on high-strength reinforcement, and the application of high-strength reinforcement in engineering is very extensive, but the following problems remain for the promotion of high-strength reinforcement: (1) there is less research on reinforcement in the range of 700–900 MPa; (2) the GB/50010-2010 Code for design of concrete structures [3] does not include 600 MPa, 700 MPa, and above, reinforcement, which causes difficulties for engineering design; and (3) the problem of matching reinforced concrete. The axially compressed plain concrete specified peak compressive strain is 0, while the calculated stress of the reinforcement is 400 MPa, which is less than the actual strength of high-strength reinforcement. The eccentric compressive ultimate compressive strain is 00033, corresponding to a reinforcement stress of 660 MPa, for 700 MPa to reach yield. The 700 MPa high-strength reinforcement in the column cannot give full play to the strength, and the solution needs to be further studied. Therefore, it is necessary to conduct research related to high strength reinforcement.
In this paper, experimental analysis and theoretical analysis were carried out to study the mechanical performance of concrete columns reinforced with grade 735 MPa steel bars, under eccentrical compressive load. Based on the test mechanisms and test results, the eccentric compressive mechanical properties and failure modes of concrete columns reinforced with grade 735 MPa high-strength steel bars have been summarized. According to the experimental study of the concrete columns reinforced with grade 735 MPa high-strength steel bars, the stress and the strain distribution law of the key cross-section were analyzed, and the test results were compared with the theoretical results according to the code [3], which revealed that the eccentrically compressed bearing capacity calculation formula by the code [3] was still applicable for concrete columns reinforced with grade 735 MPa high-strength steel bars. This paper fills a research gap in the mechanical behavior of high-strength NPR reinforcement in concrete columns subjected to eccentric compression.

2. Experimental Program

Six concrete columns reinforced with grade 735 MPa high-strength steel bars were subjected to eccentric compressive loads. The investigated parameters were eccentricity and longitudinal reinforcement strength. The failure mode, the bearing capacity, deflection, and strain of the specimens were obtained.

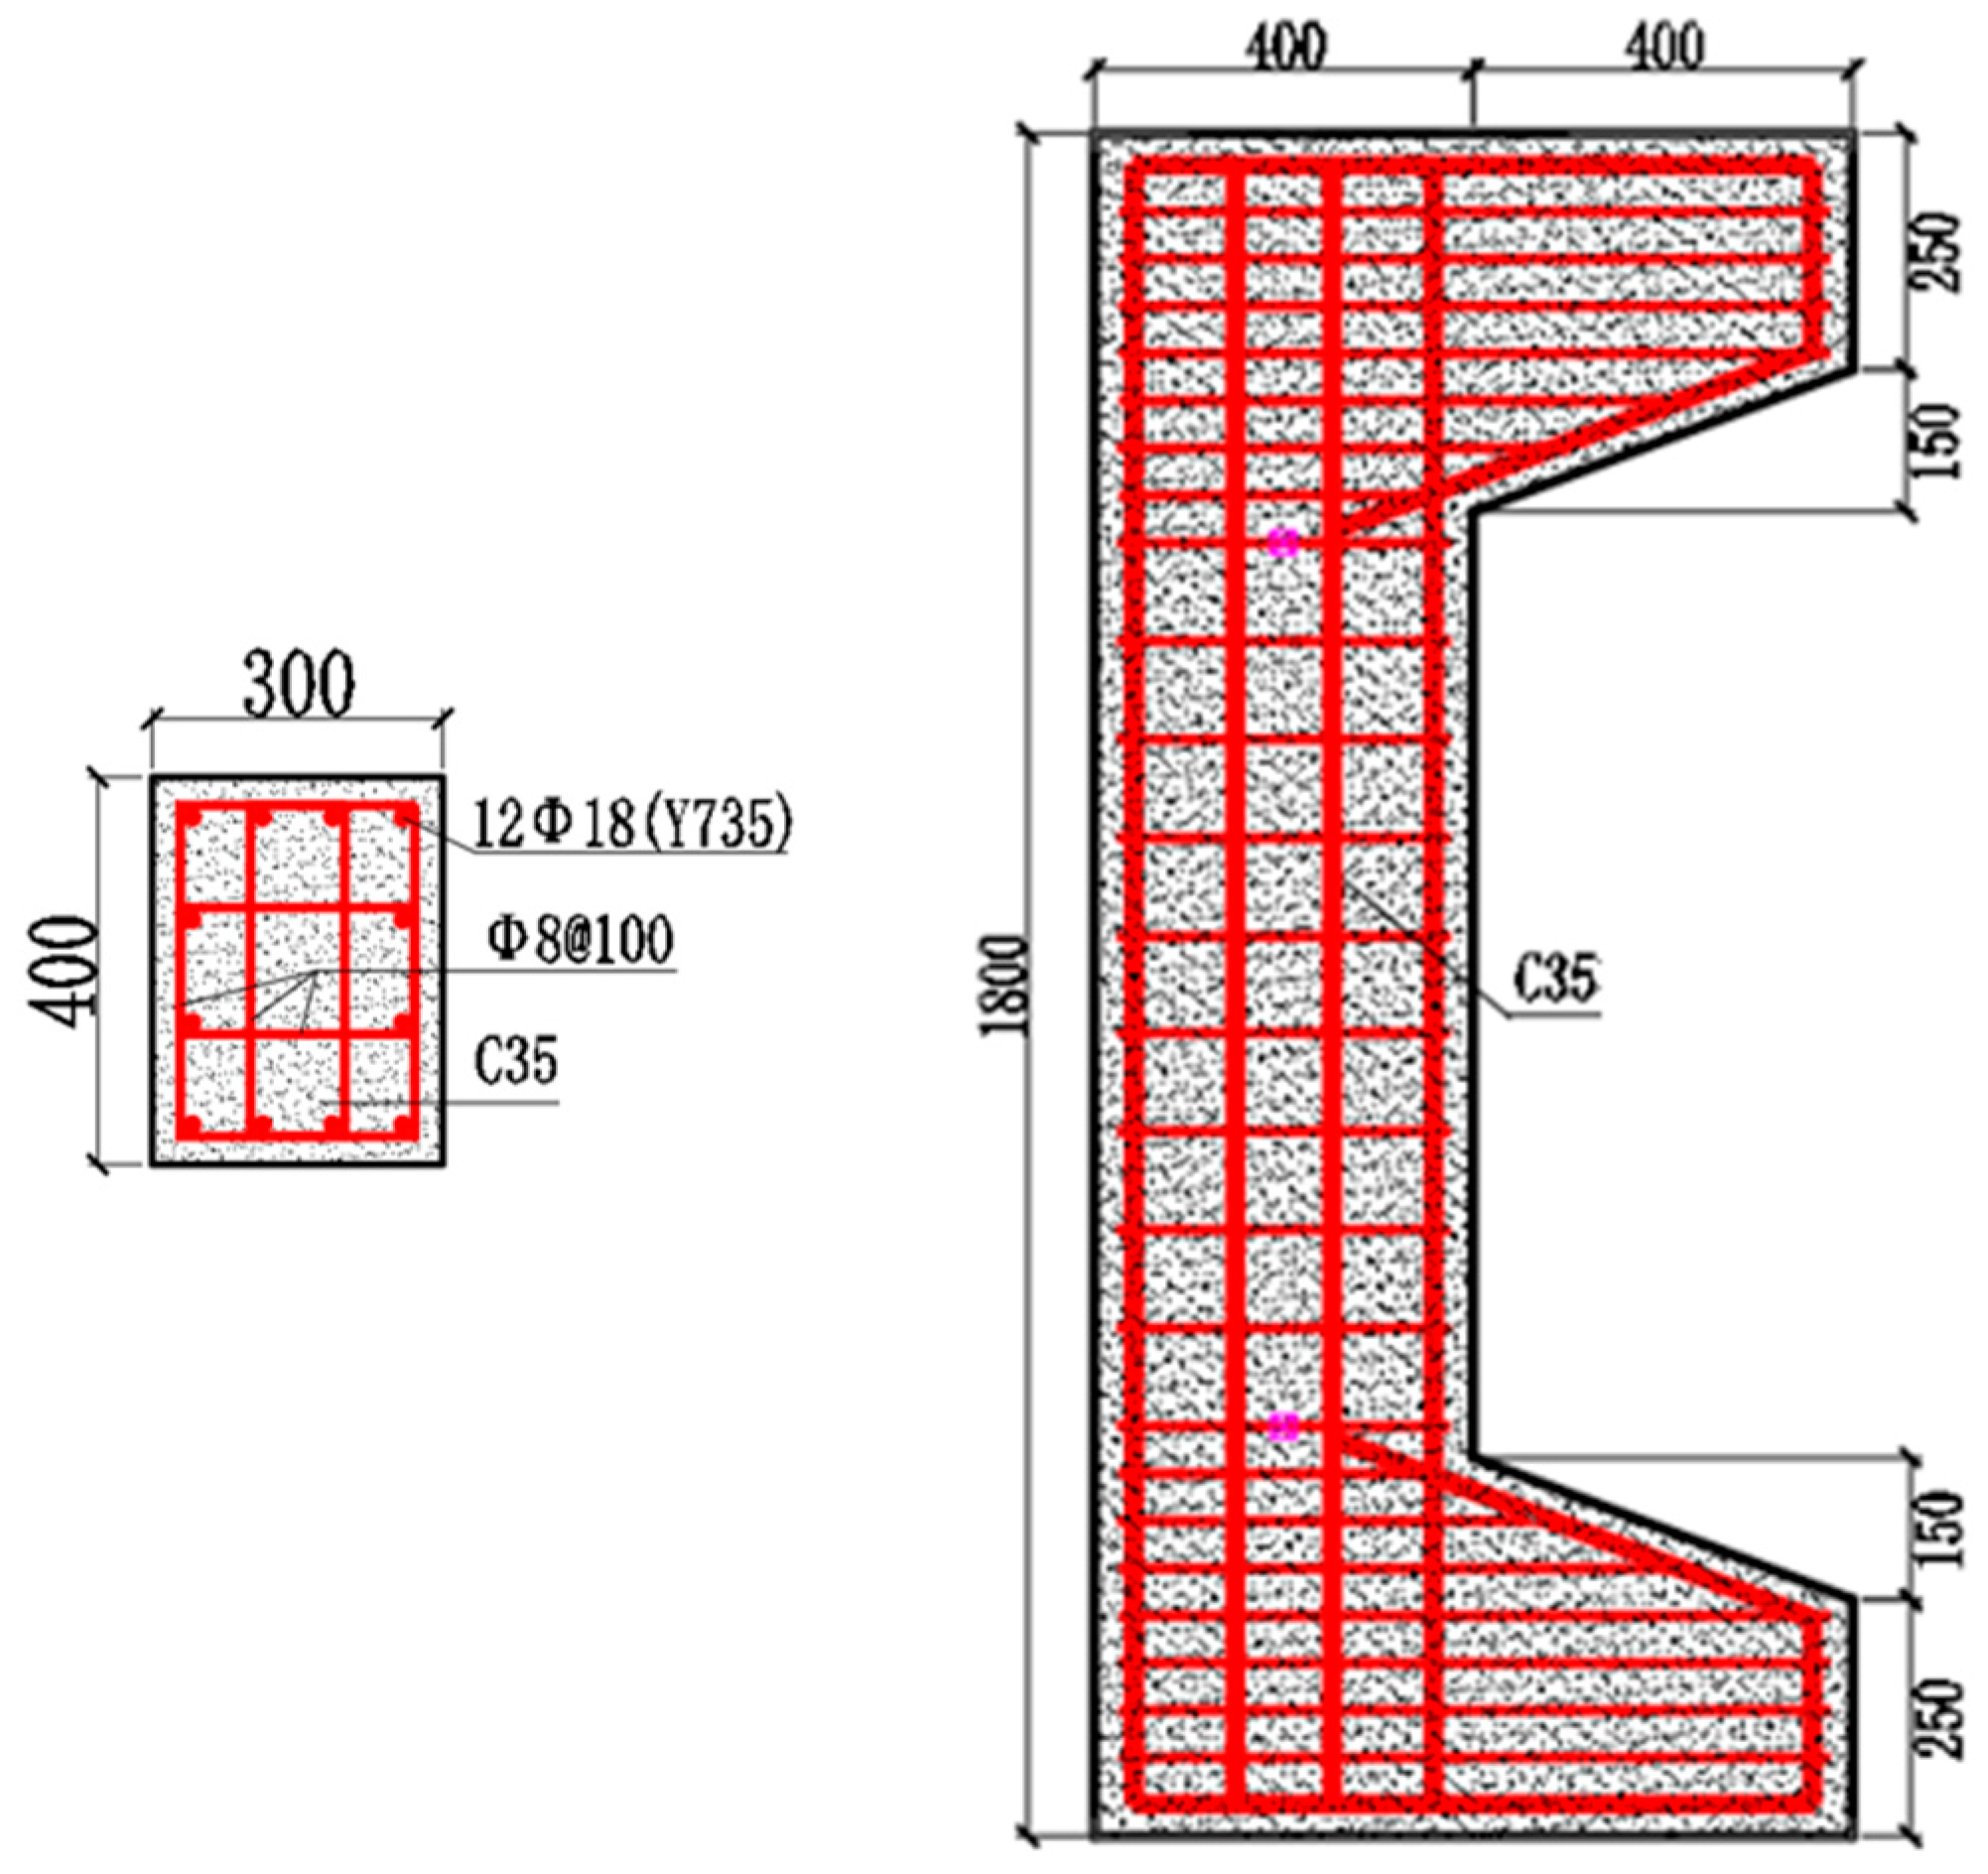
2.1. Details of Test Specimens

A total of six concrete columns reinforced with high-strength steel bars were designed for the eccentric compression test. Four of the specimens were concrete columns reinforced with grade 735 MPa high-strength steel bars, and the other two specimens were concrete columns reinforced with ordinary high-strength steel bars. The cross-sectional dimension of specimens was 300 mm × 400 mm, the height was 1.8 m, the concrete protective layer thickness was 25 mm, and the strength grade was C35. The hoop reinforcement was encrypted at the bracket to prevent local crushing. The parameters affected were initial eccentricity distance and strength grade of longitudinal reinforcement. The design parameters are shown in Table 1, and reinforcement and construction are shown in Figure 1.

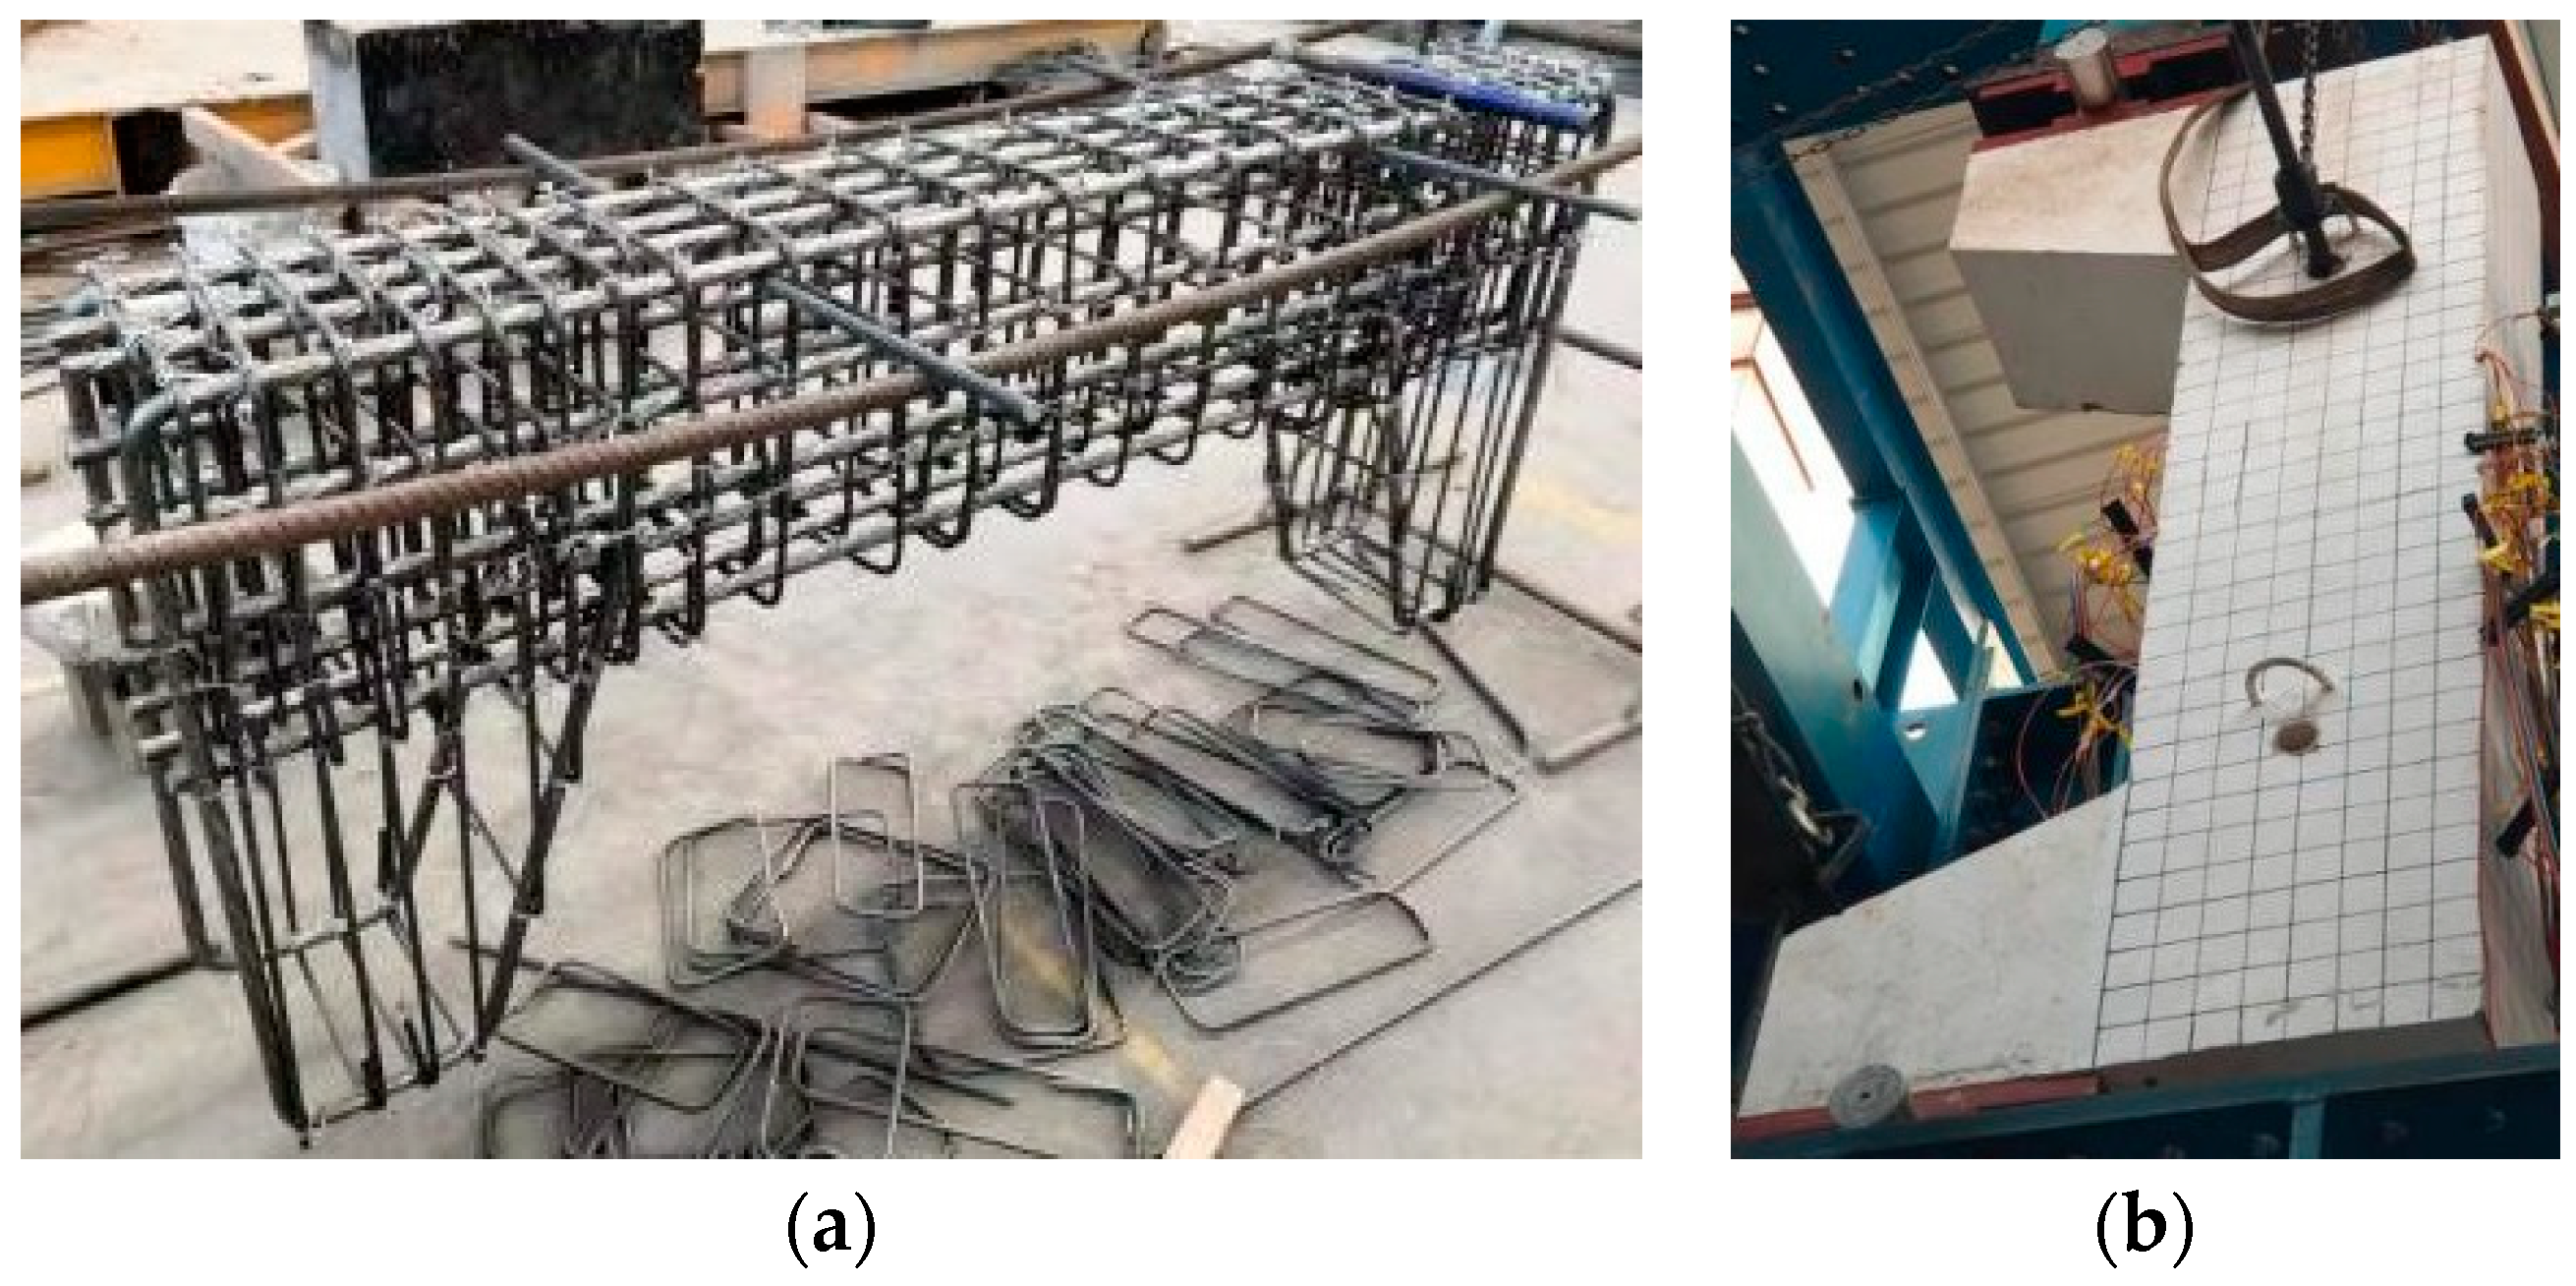
2.2. Fabrication Process

The concrete columns reinforced with grade 735 MPa high-strength steel bars were fabricated as follows: the specimens were processed and fabricated at the construction site of the national assembly building industrial base of Jinan Wanstar Group. First, the reinforcement cage was tied, in order to prevent the occurrence of local pressure damage which would reduce the bearing capacity, and the end of the column was locally strengthened. Then the strain gauges with a gauge length of 20 mm were pasted on the corresponding measurement points, and finally, the specimen template was created. For the test, C35 concrete was poured and adequately vibrated, and was demolded and cured after 2 days. In order to accurately depict the specific location where the cracks in the specimen would appear during the loading process, the concrete surface was painted white and a 50 mm × 50 mm square grid was drawn for positioning, as shown in Figure 2.

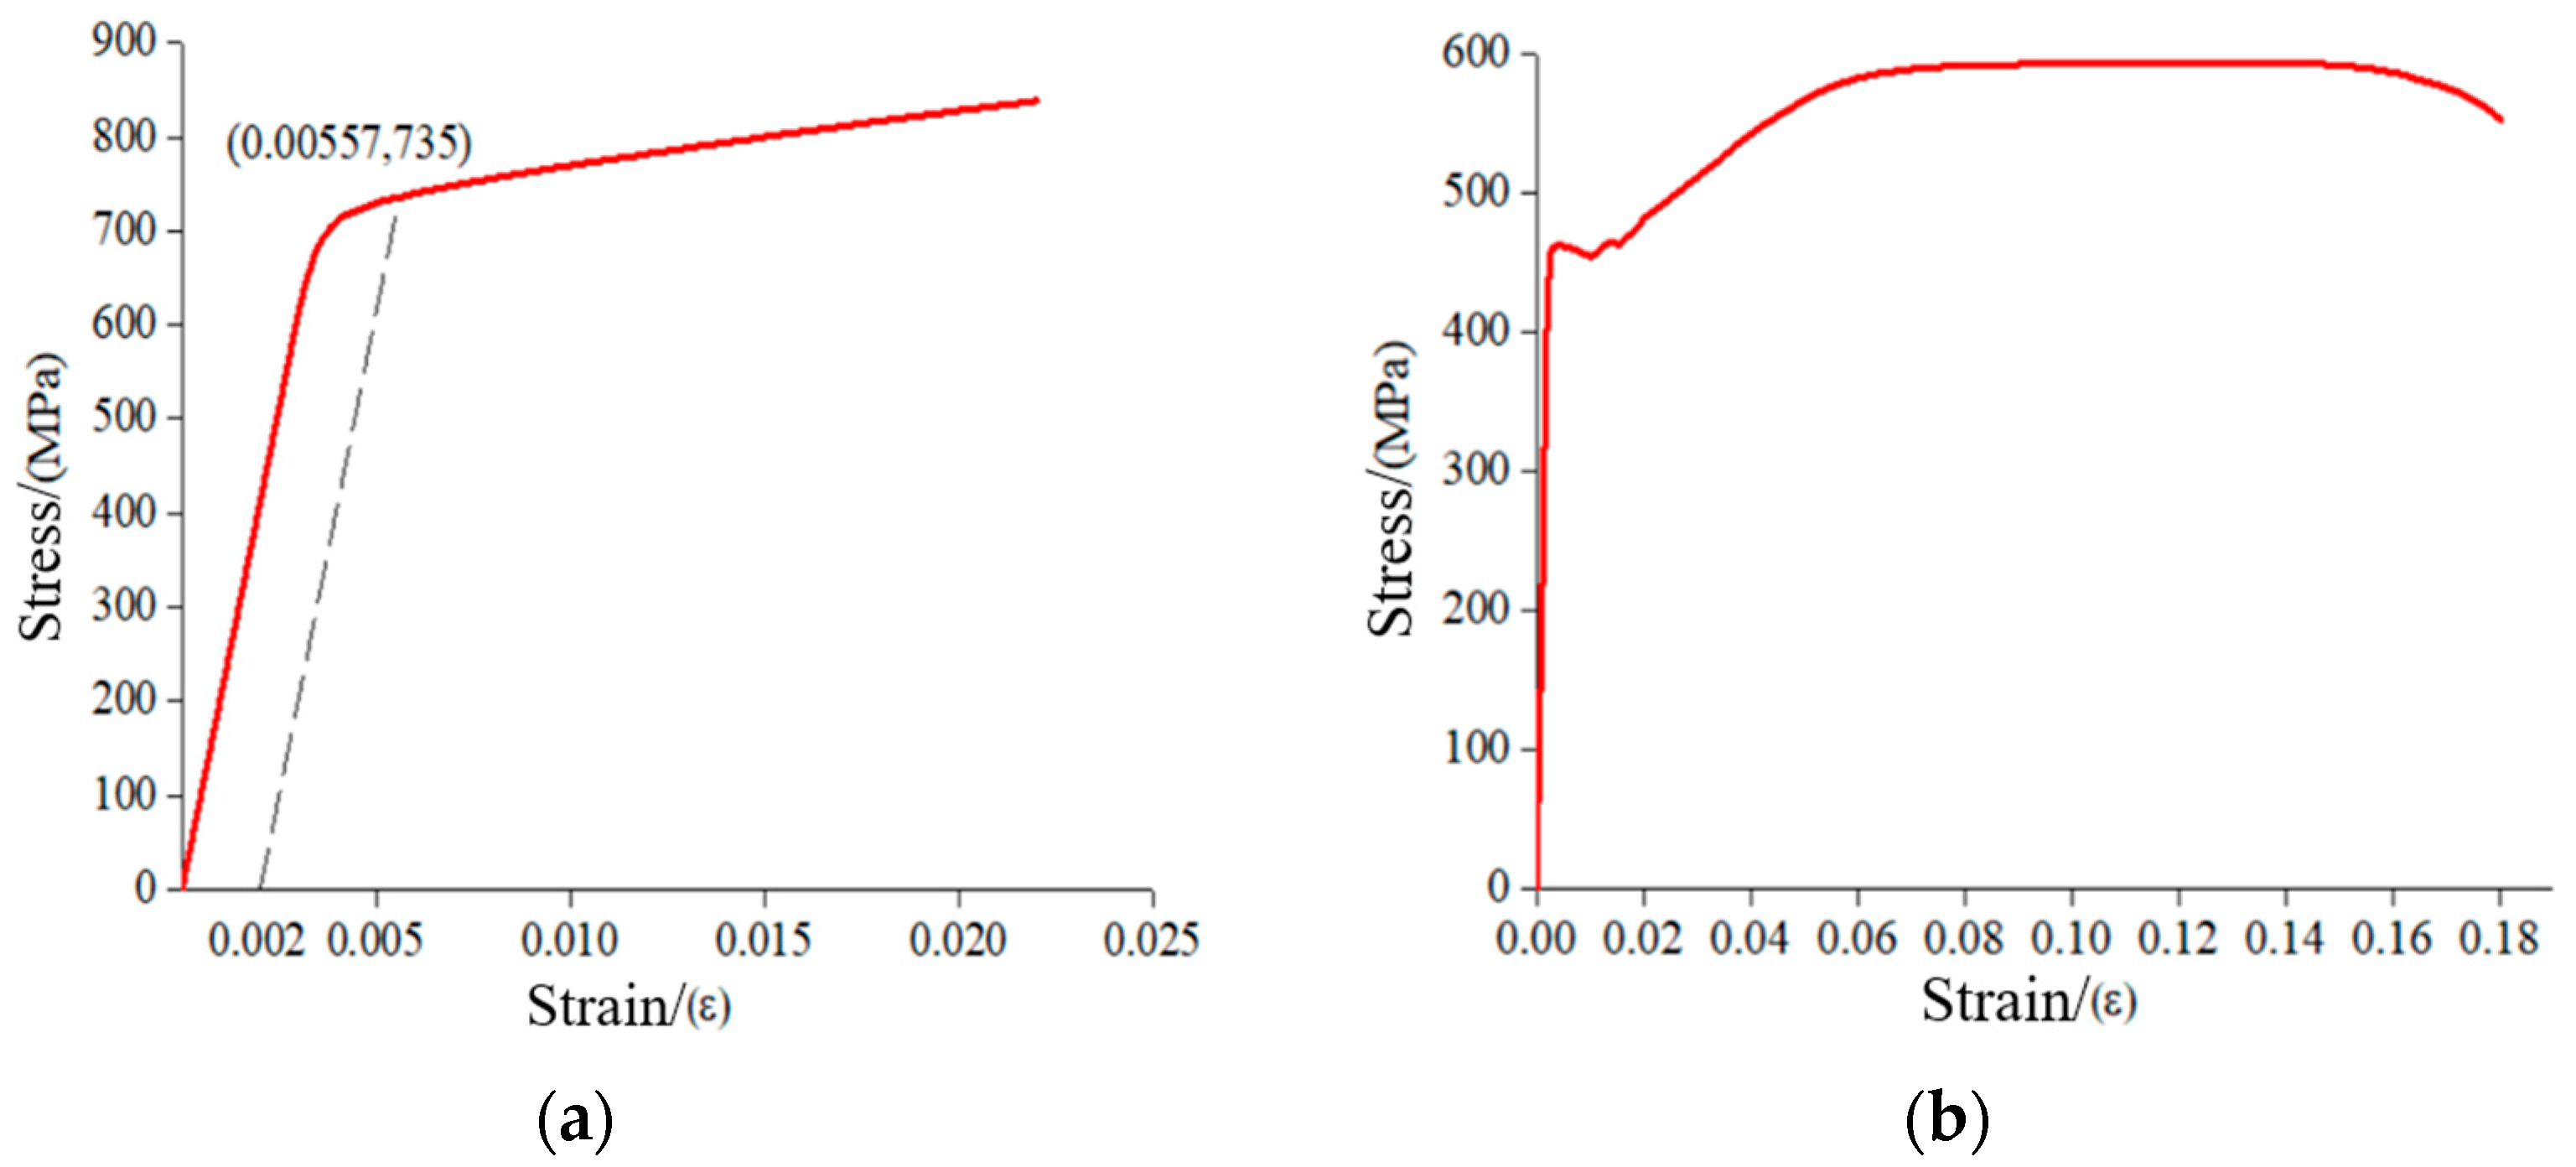
2.3. Material Properties

(1) Mechanical properties of concrete
The concrete was prepared according to specification GB/T50081-2002 Standard for Test Method of Mechanical Properties on Ordinary Concrete [15]. The specimens were poured integrally at one time, six cubic test blocks with a side length of 150 mm were reserved, and the specimens and test blocks were placed under the same conditions for curing. The compressive strength of the specimens was measured using a press, and the average cubic compressive strength was measured to be 43.95 MPa, which was converted to an average axial compressive strength of 33.4 MPa. The specific performance parameters of the concrete are shown in Table 2.
(2) Mechanical properties of steel bar
Both types of steel, of diameters of 8 mm and 18 mm, were used for the experiment. An extensometer was used to measure the load displacement curve of reinforcement, and the mechanical properties of reinforcement are shown in Figure 3 and Table 3.

2.4. Experimental Program
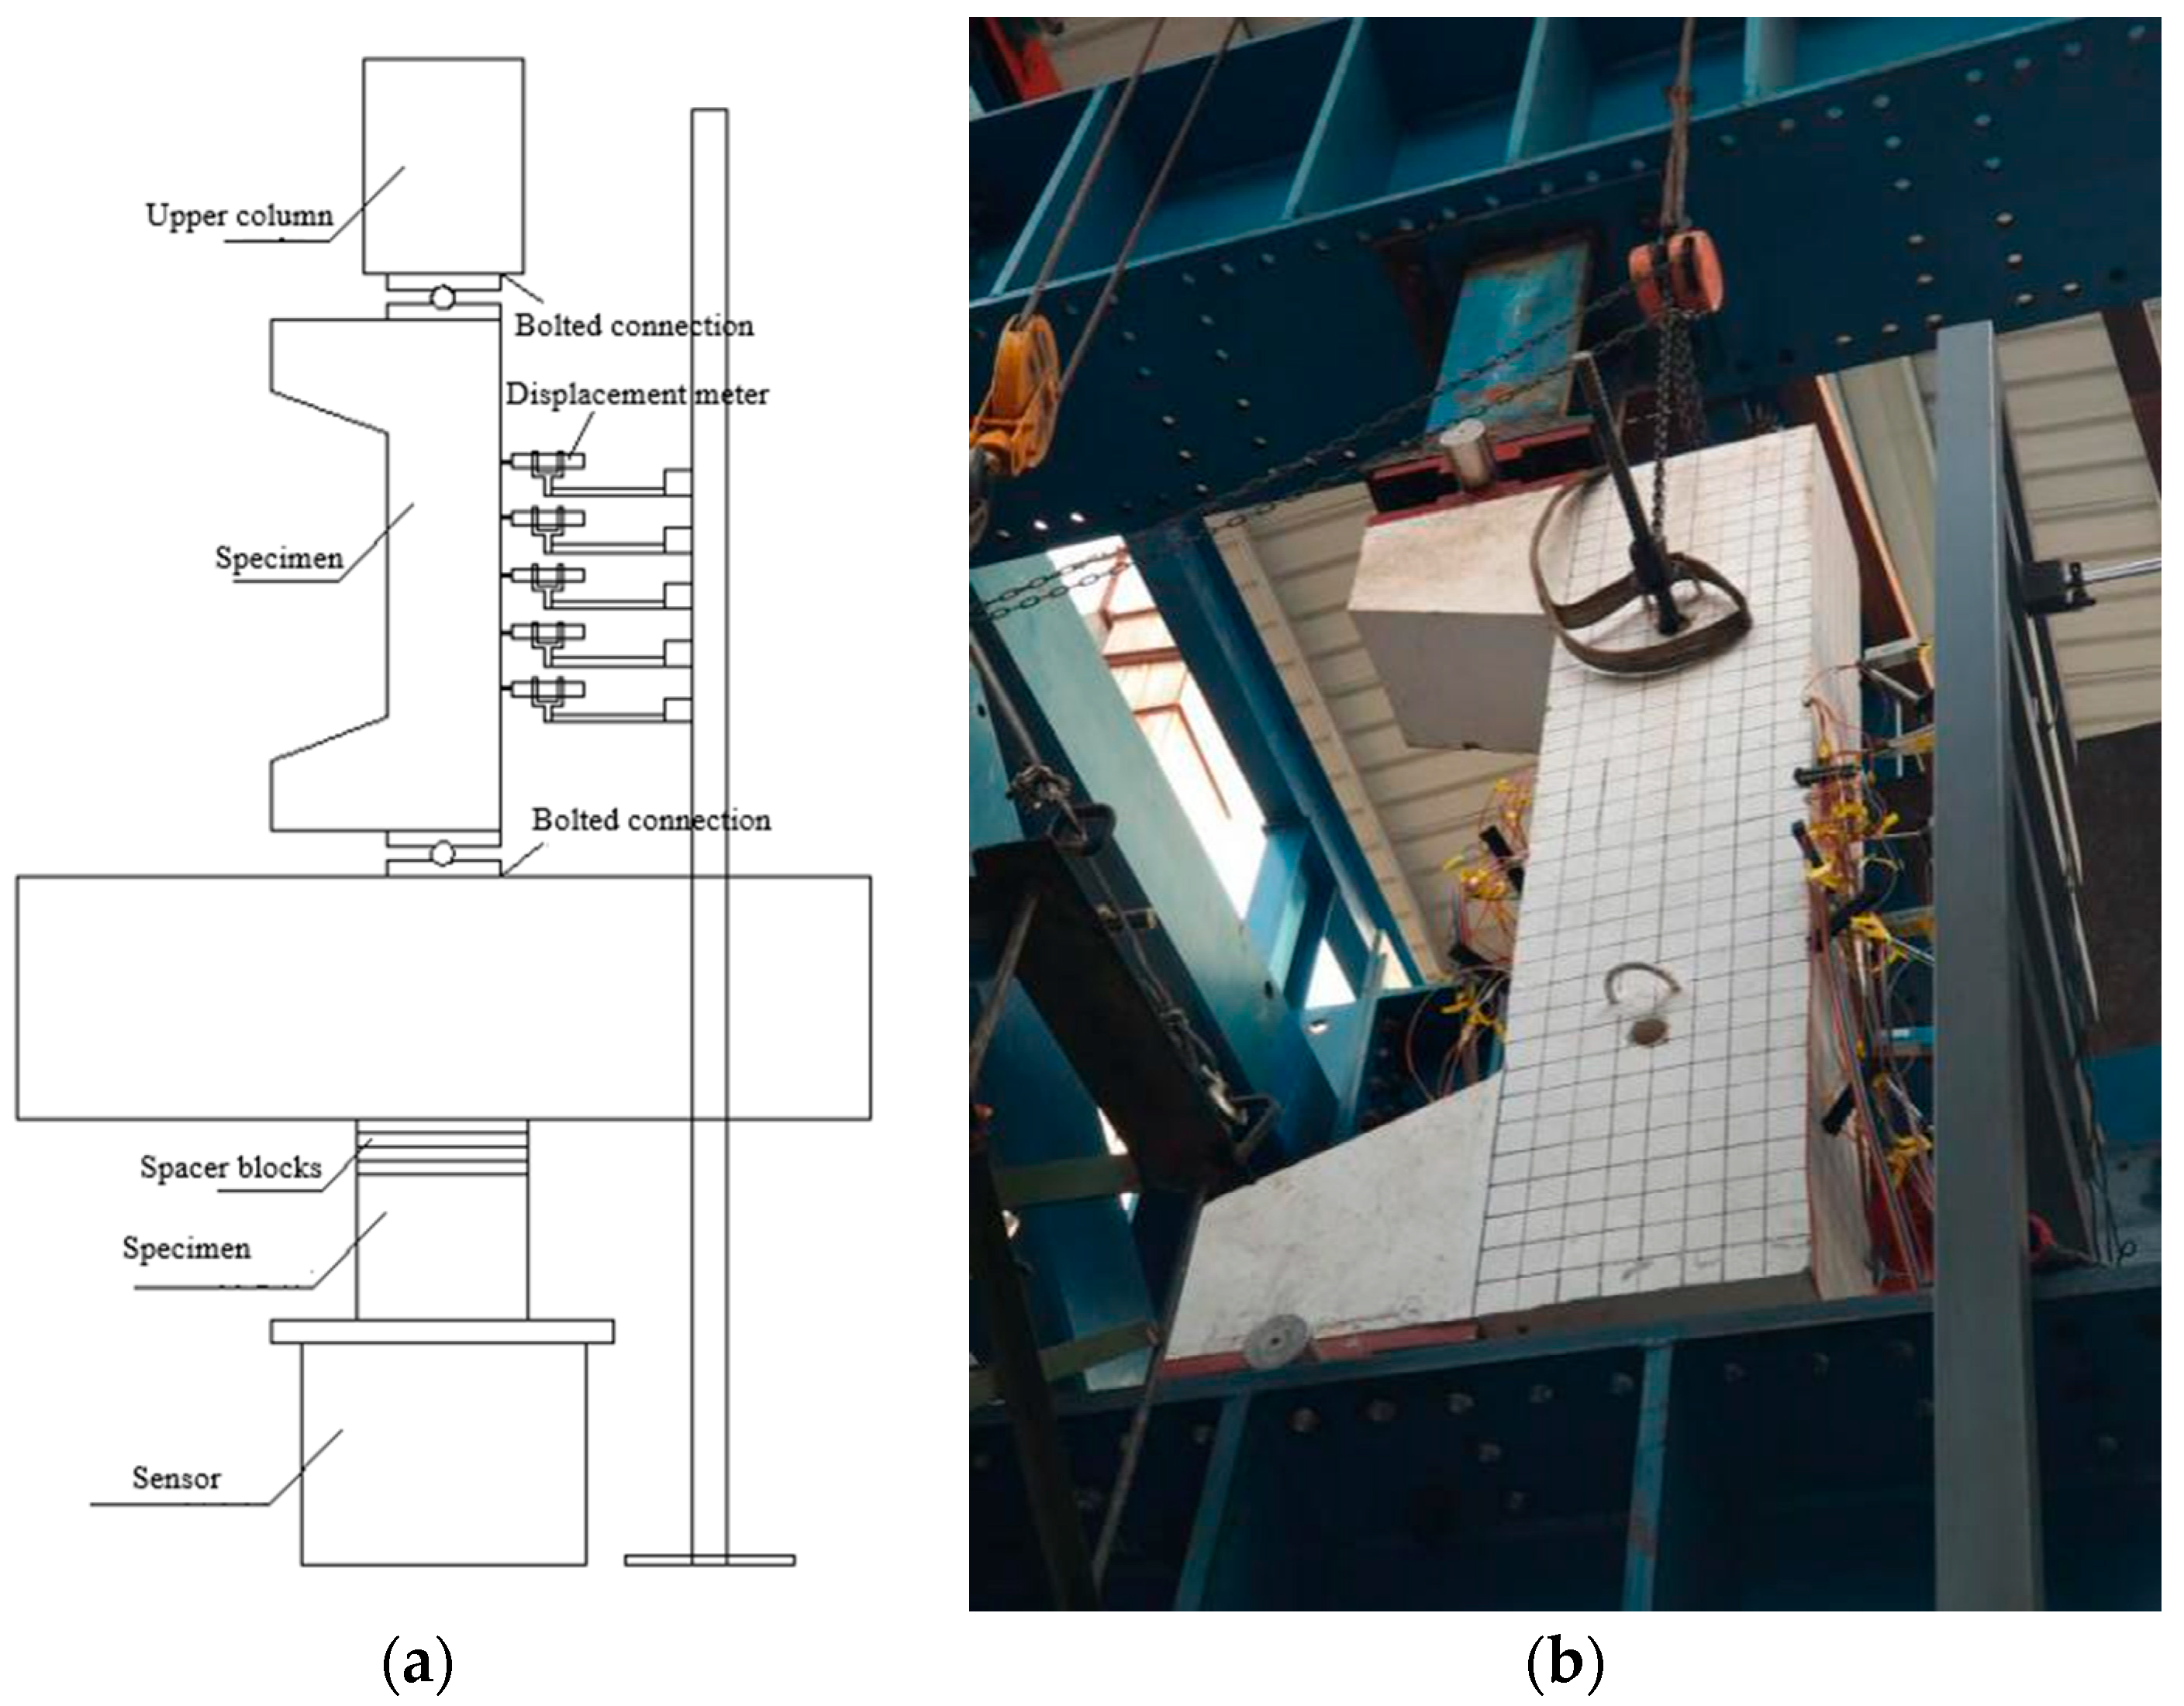
2.4.1. Test Setup

The test was carried out on a 10,000 kN reaction frame with a span and height of 3.2 m and 6.2 m, respectively. According to the actual loading of the eccentric compressive column in the project, steel plates were hinged at both ends of the eccentric compression column during the loading, and the eccentricity was the distance from the jack axis to the centroid of the specimen. The upper and lower ends of the specimen were installed with one-way hinged bearings, five displacement meters were arranged on the side to measure the deflection, and strain gauges with a length of 10 mm were pasted on the reinforcement and concrete in the middle of the specimen to measure the strain of reinforcement and concrete. In this experiment, a load sensor was installed to record load, and a strain collection system was installed to record strain of reinforcement and concrete. The test setup is shown in Figure 4.

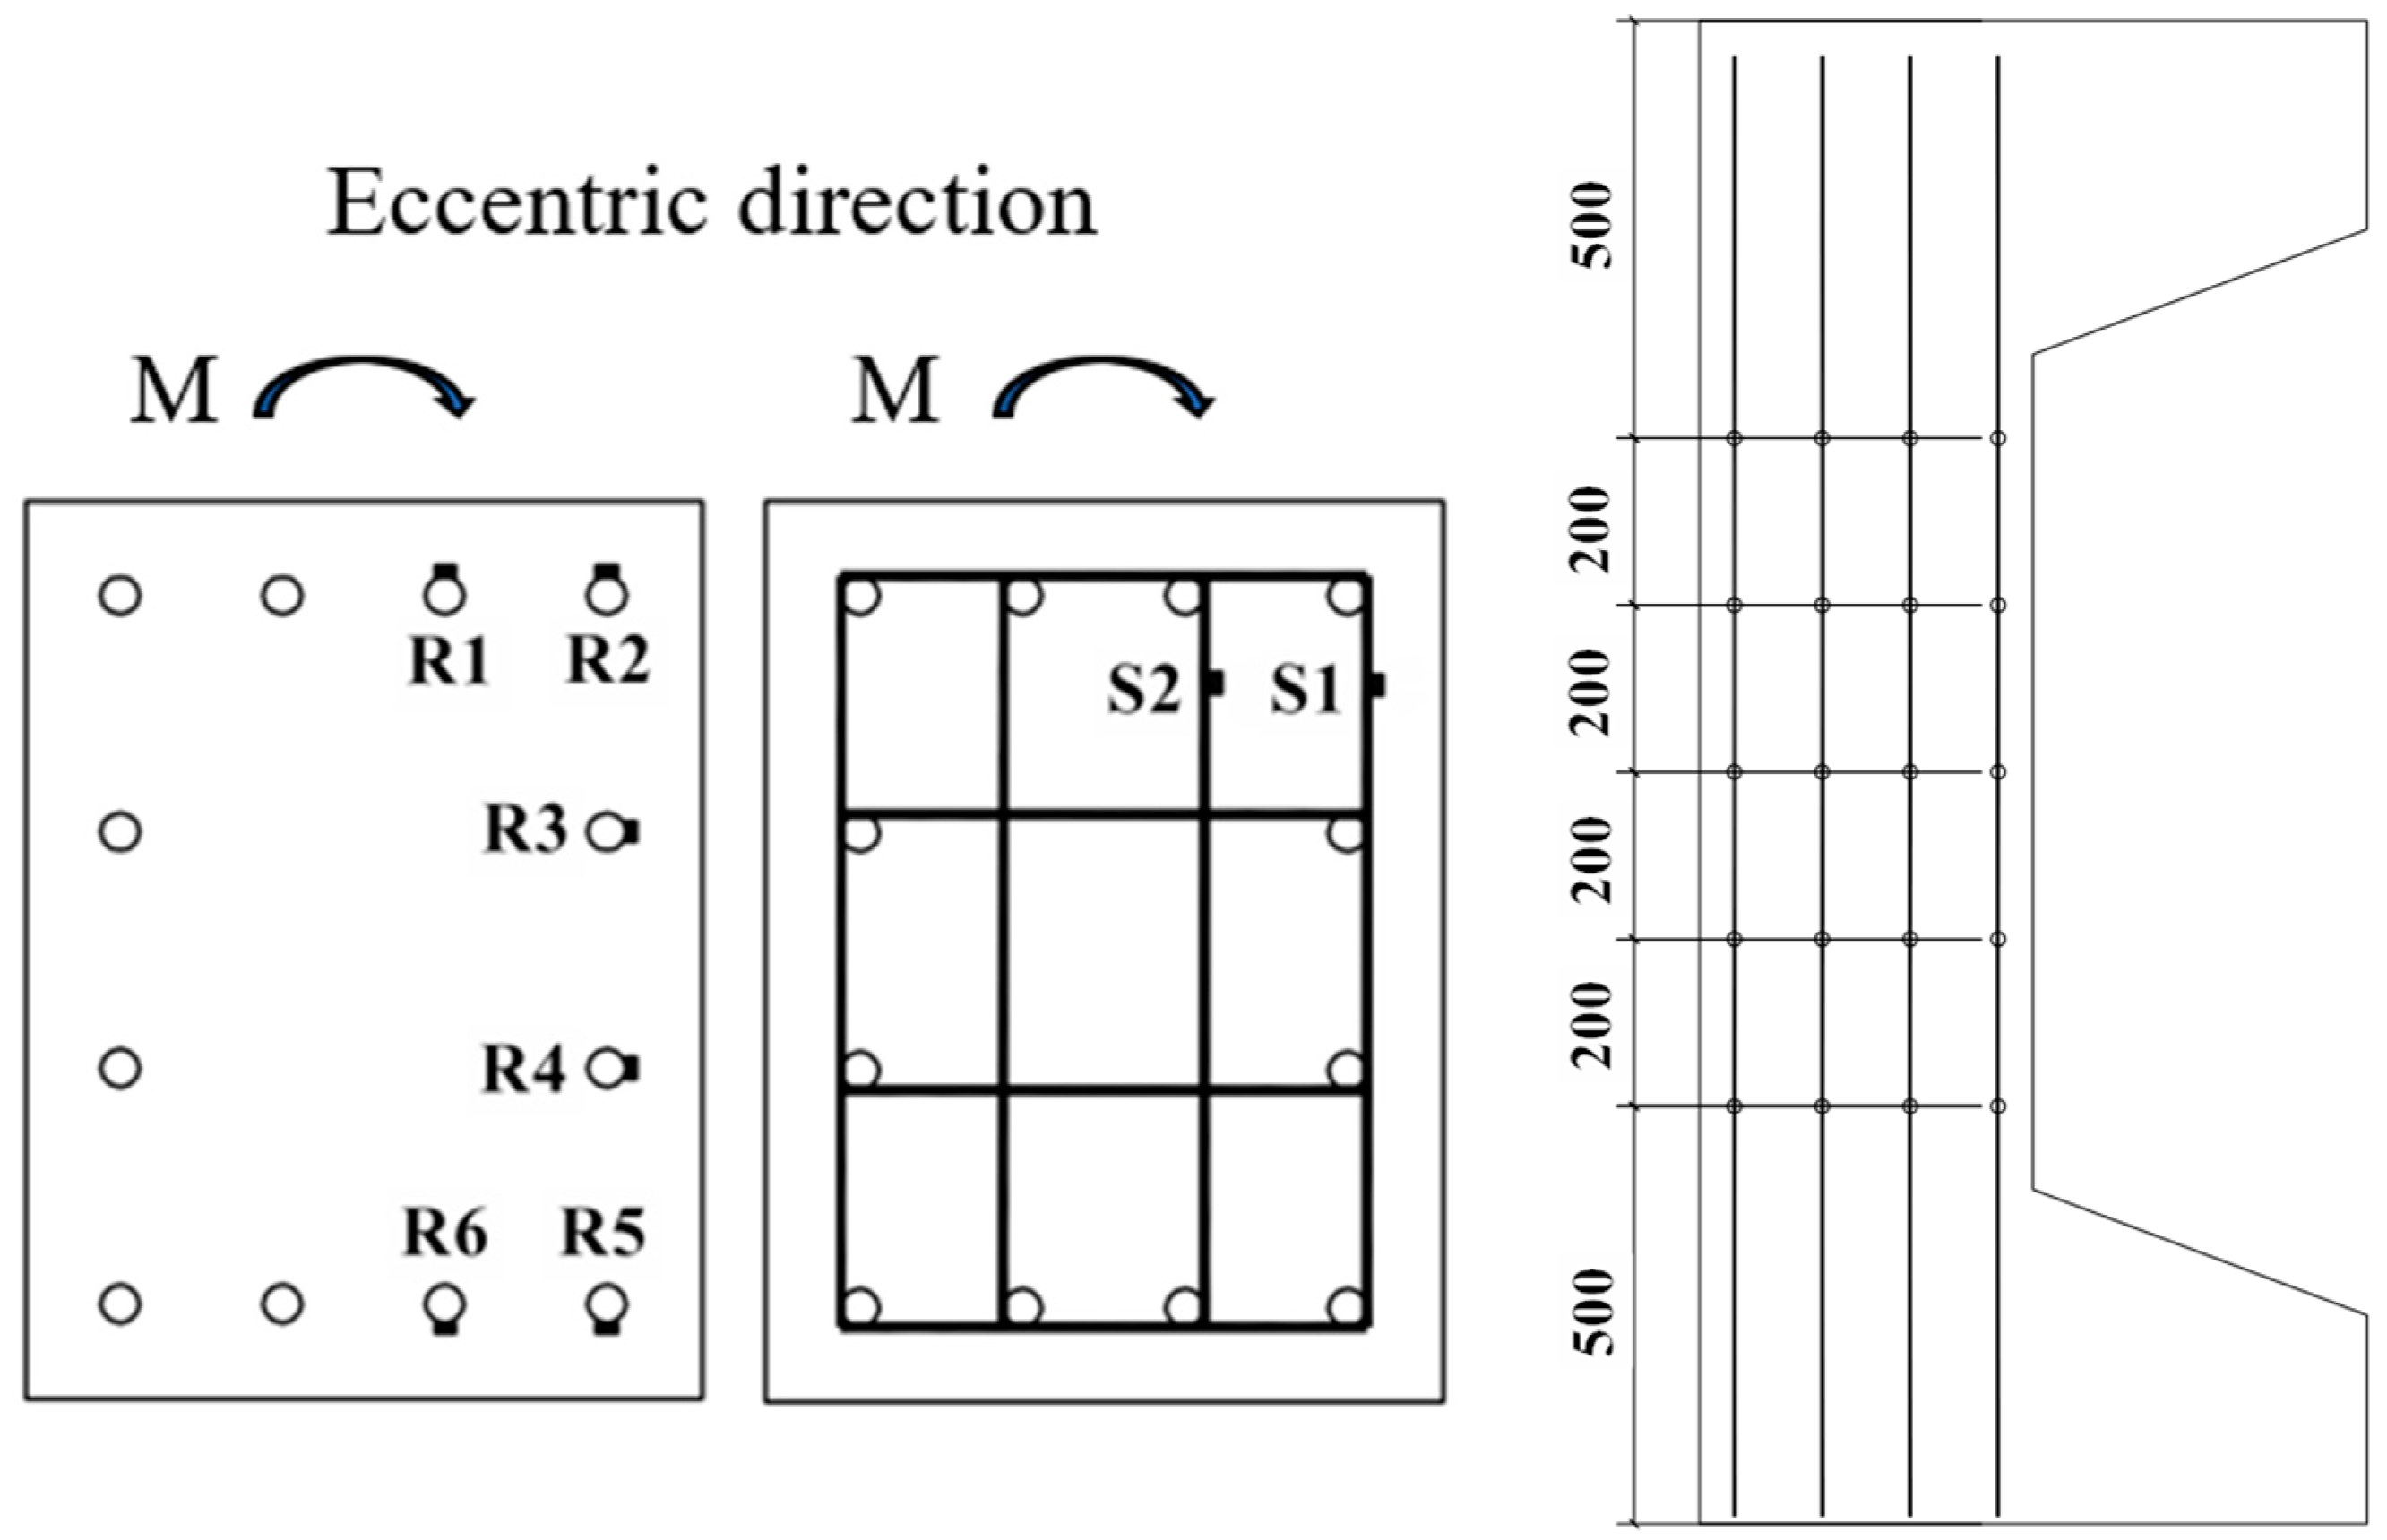
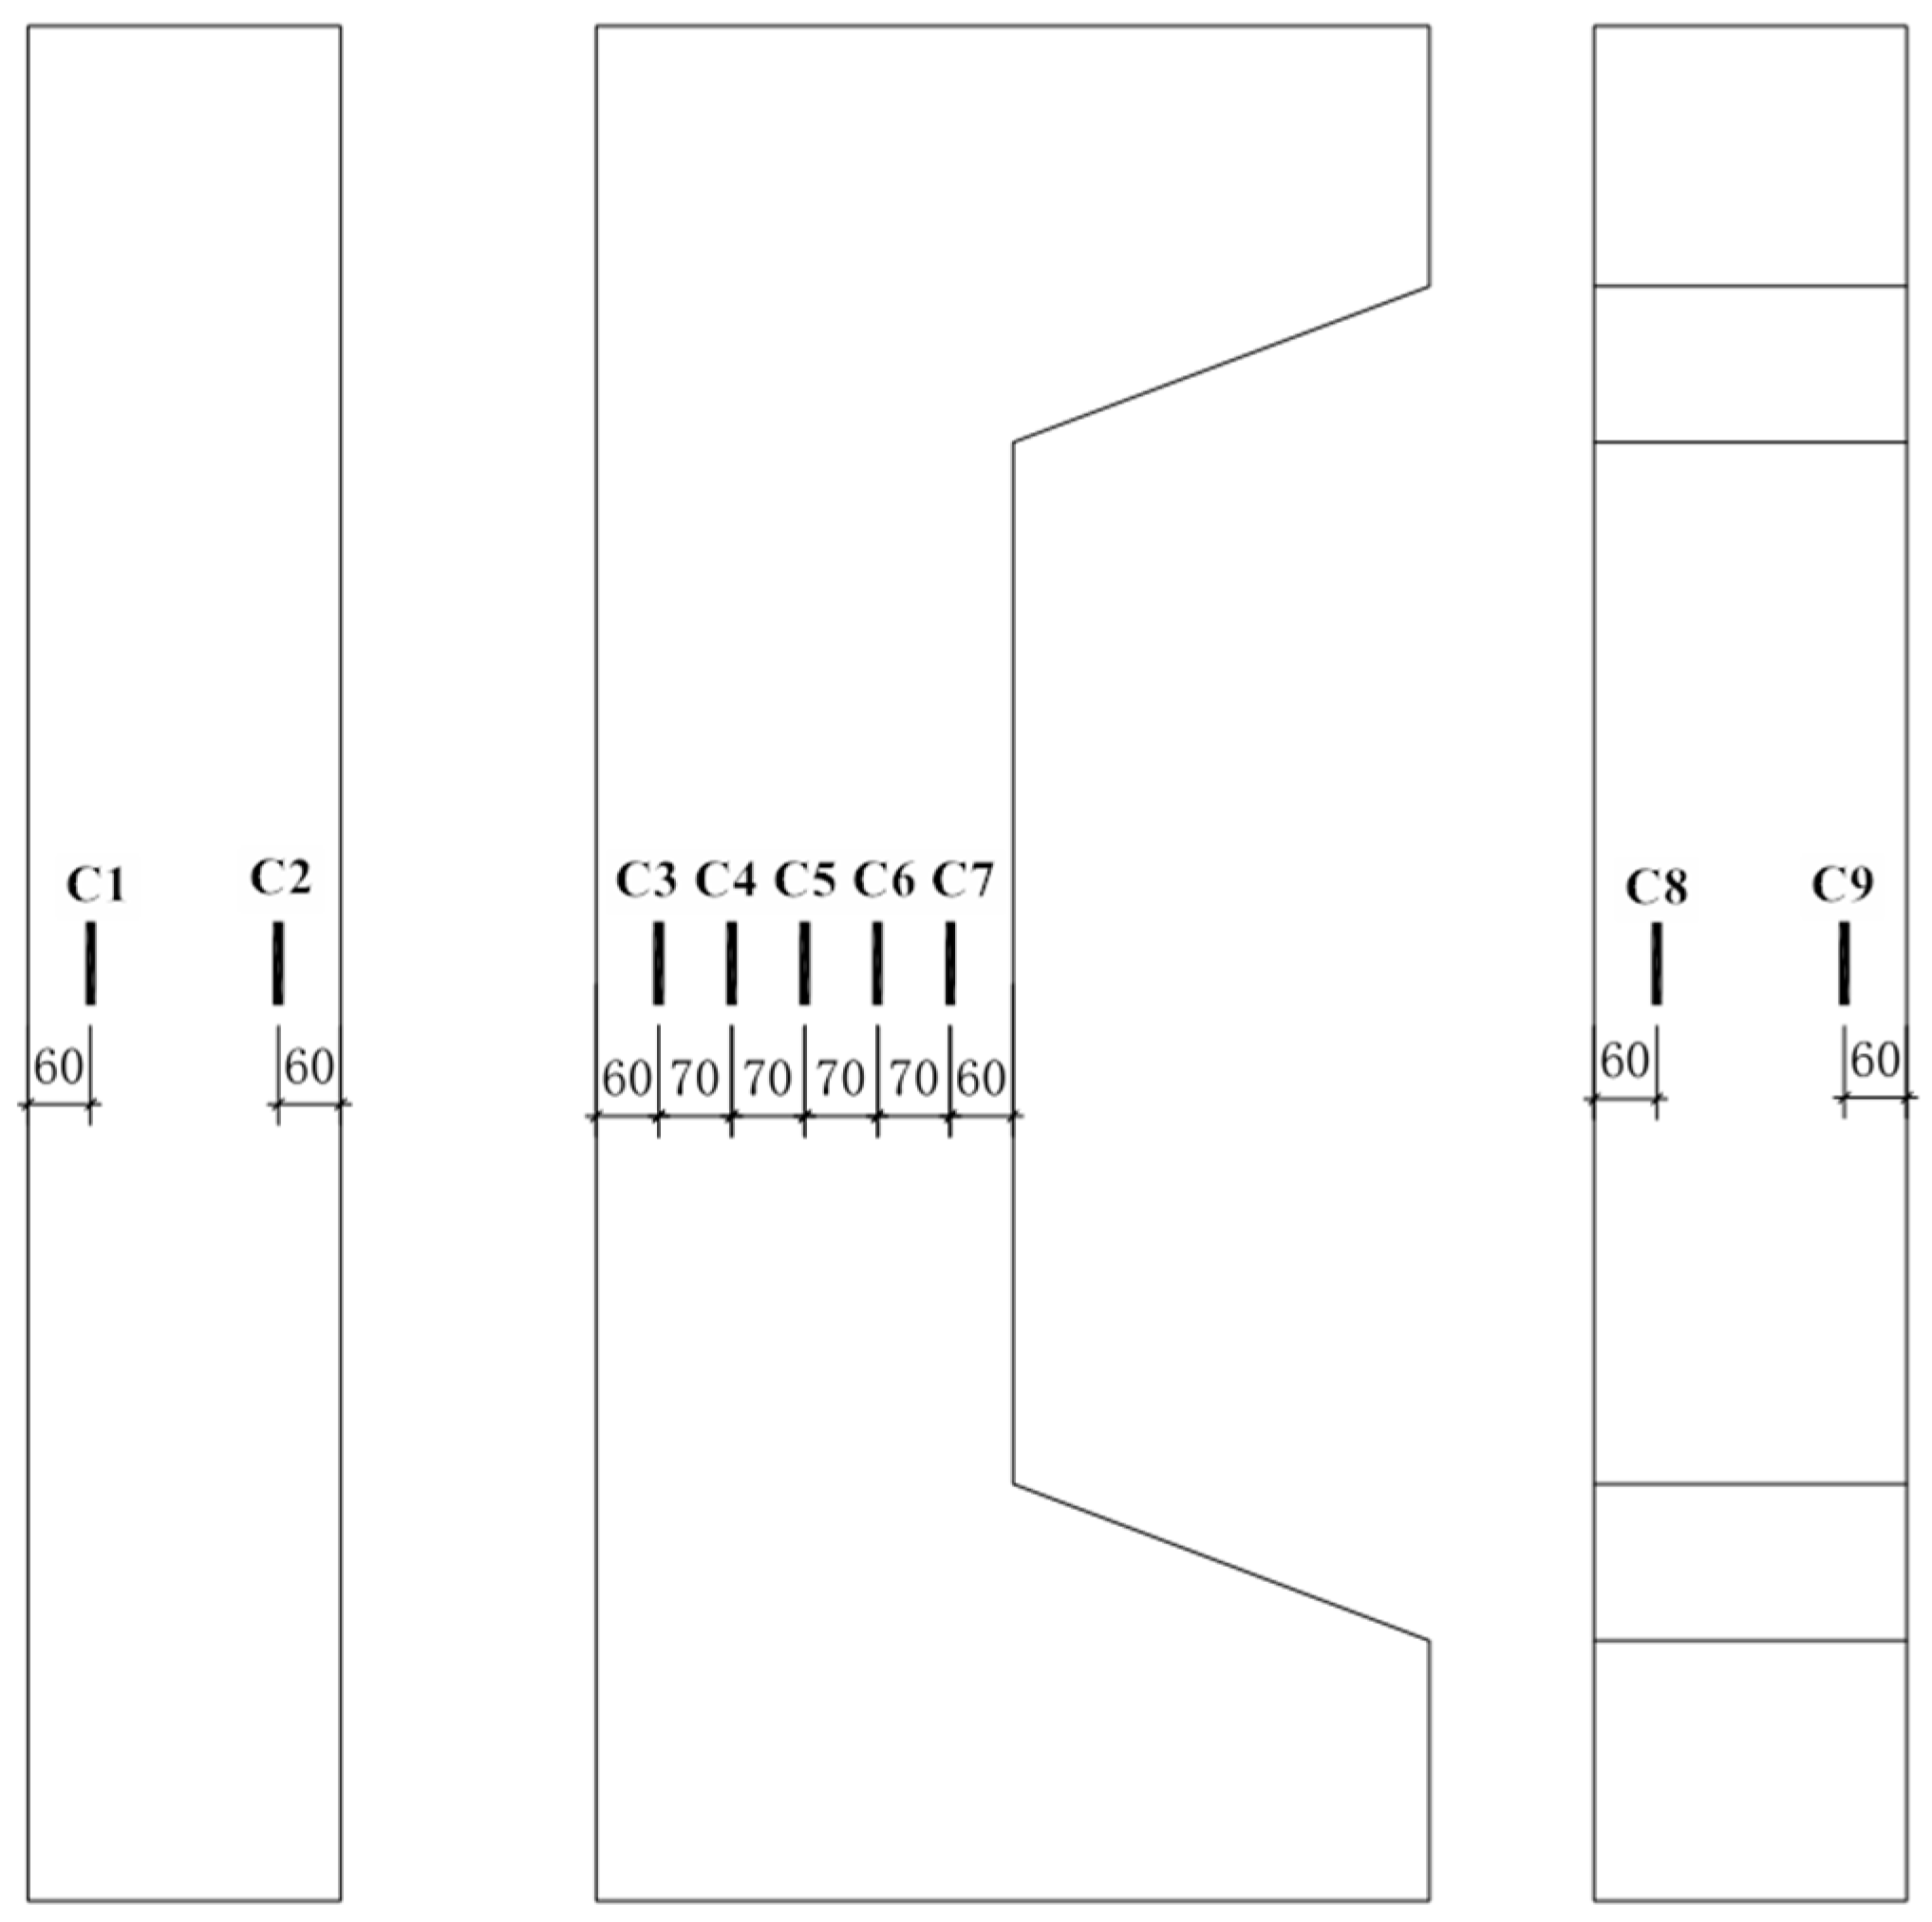
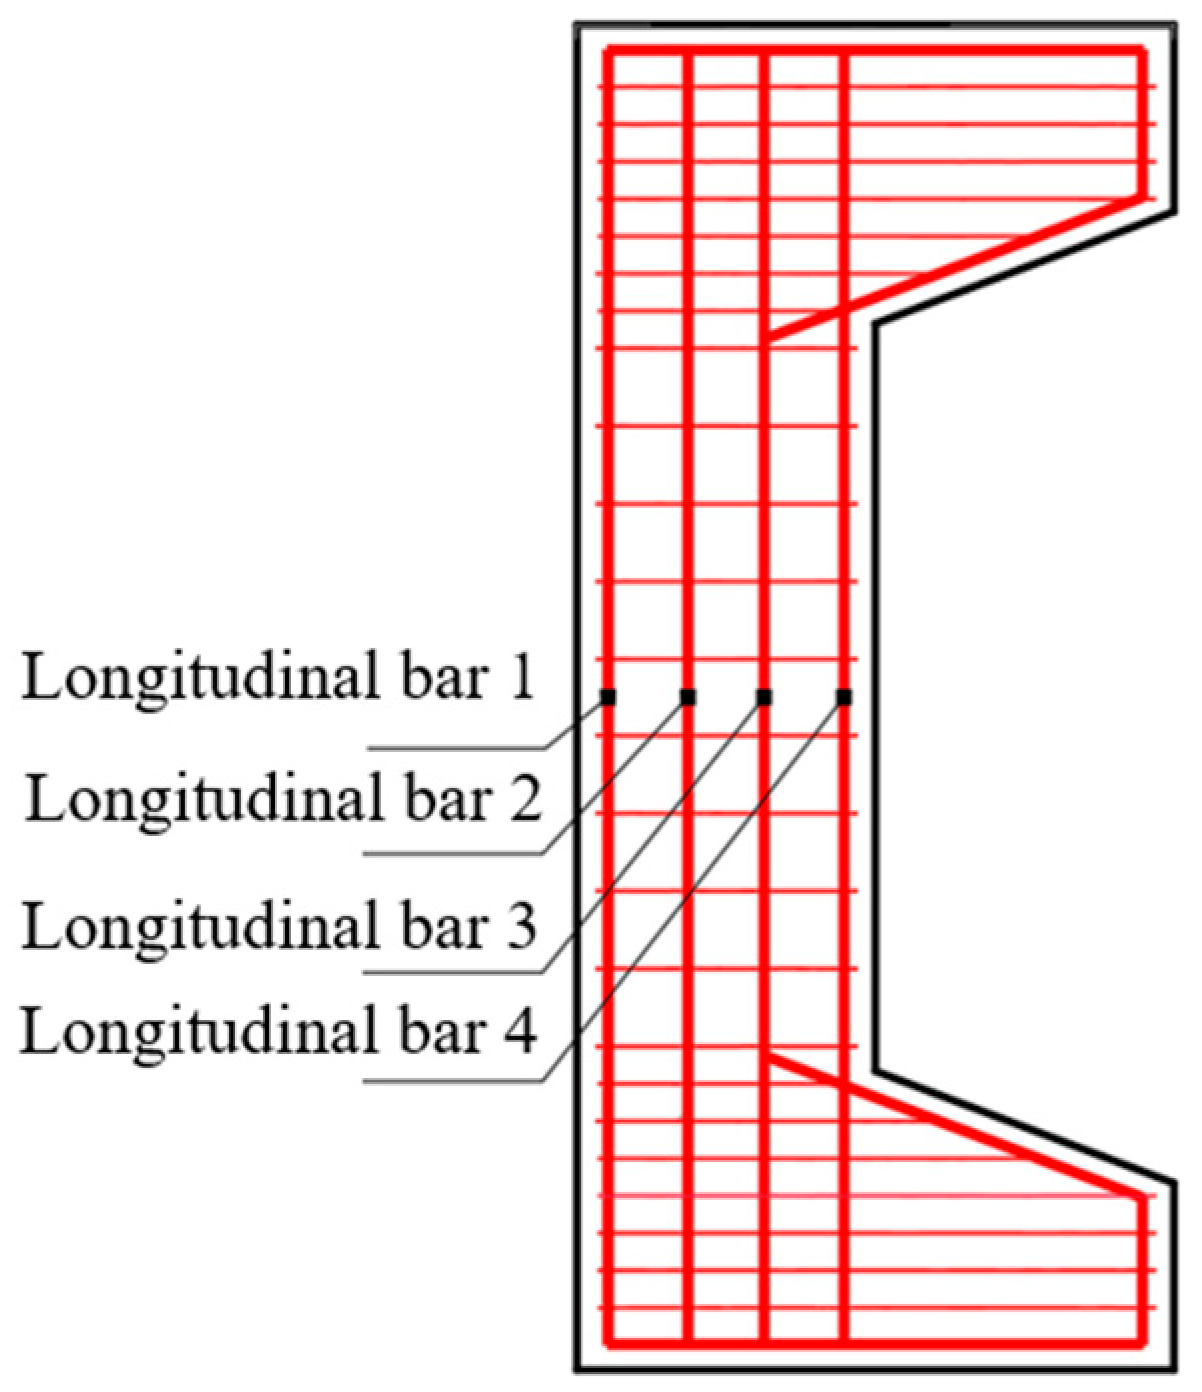
2.4.2. Layout of Measuring Points

The test measurement data included the lateral deflection values at 200 mm and 400 mm in the span and up and down offset of the specimen, the reinforcement strain values at 200 mm and 400 mm in the span and up and down offset of the specimen cage, and the concrete strain values at the compression side, tension side and the lateral surface of the specimen, as shown in Figure 5 and Figure 6. During the loading process, the damage process and failure mode of the specimen were recorded by taking photos in real time, and crack marks and process descriptions were recorded.

2.4.3. Loading Protocol

The specimen was loaded with monotonic static force, and the loading system of force control first and displacement control later was adopted. Before the formal loading, geometric and physical alignment was carried out, and the preload was carried out to 20% of the estimated bearing capacity. In order that the specimen entered into normal working condition, the data were collected with the collection instrument and observed as to whether the data were reasonable. The strain gauges and instrumentation were checked for any problems, the specimen and instrumentation were then corrected to make the alignment, and then the specimen was unloaded. After a few minutes, the loading was carried out formally with a speed of 20 kN/min. When the loading value reached 60% of the calculated load, the specimens were loaded at 5% of the calculated load in a graded manner. Each load level was kept for 10 min to ensure that the deformation of the specimen was stable under the current load, and then the experiment was continued by applying the next level of load. When the loading value reached 90% of the calculated load, the loading method adopted equal displacement continuous loading, and the loading rate was 1 mm/min. When the specimen load decreased to 70% of the peak load, the specimen was considered to be damaged and the loading was stopped.

3. Test Results and Discussion

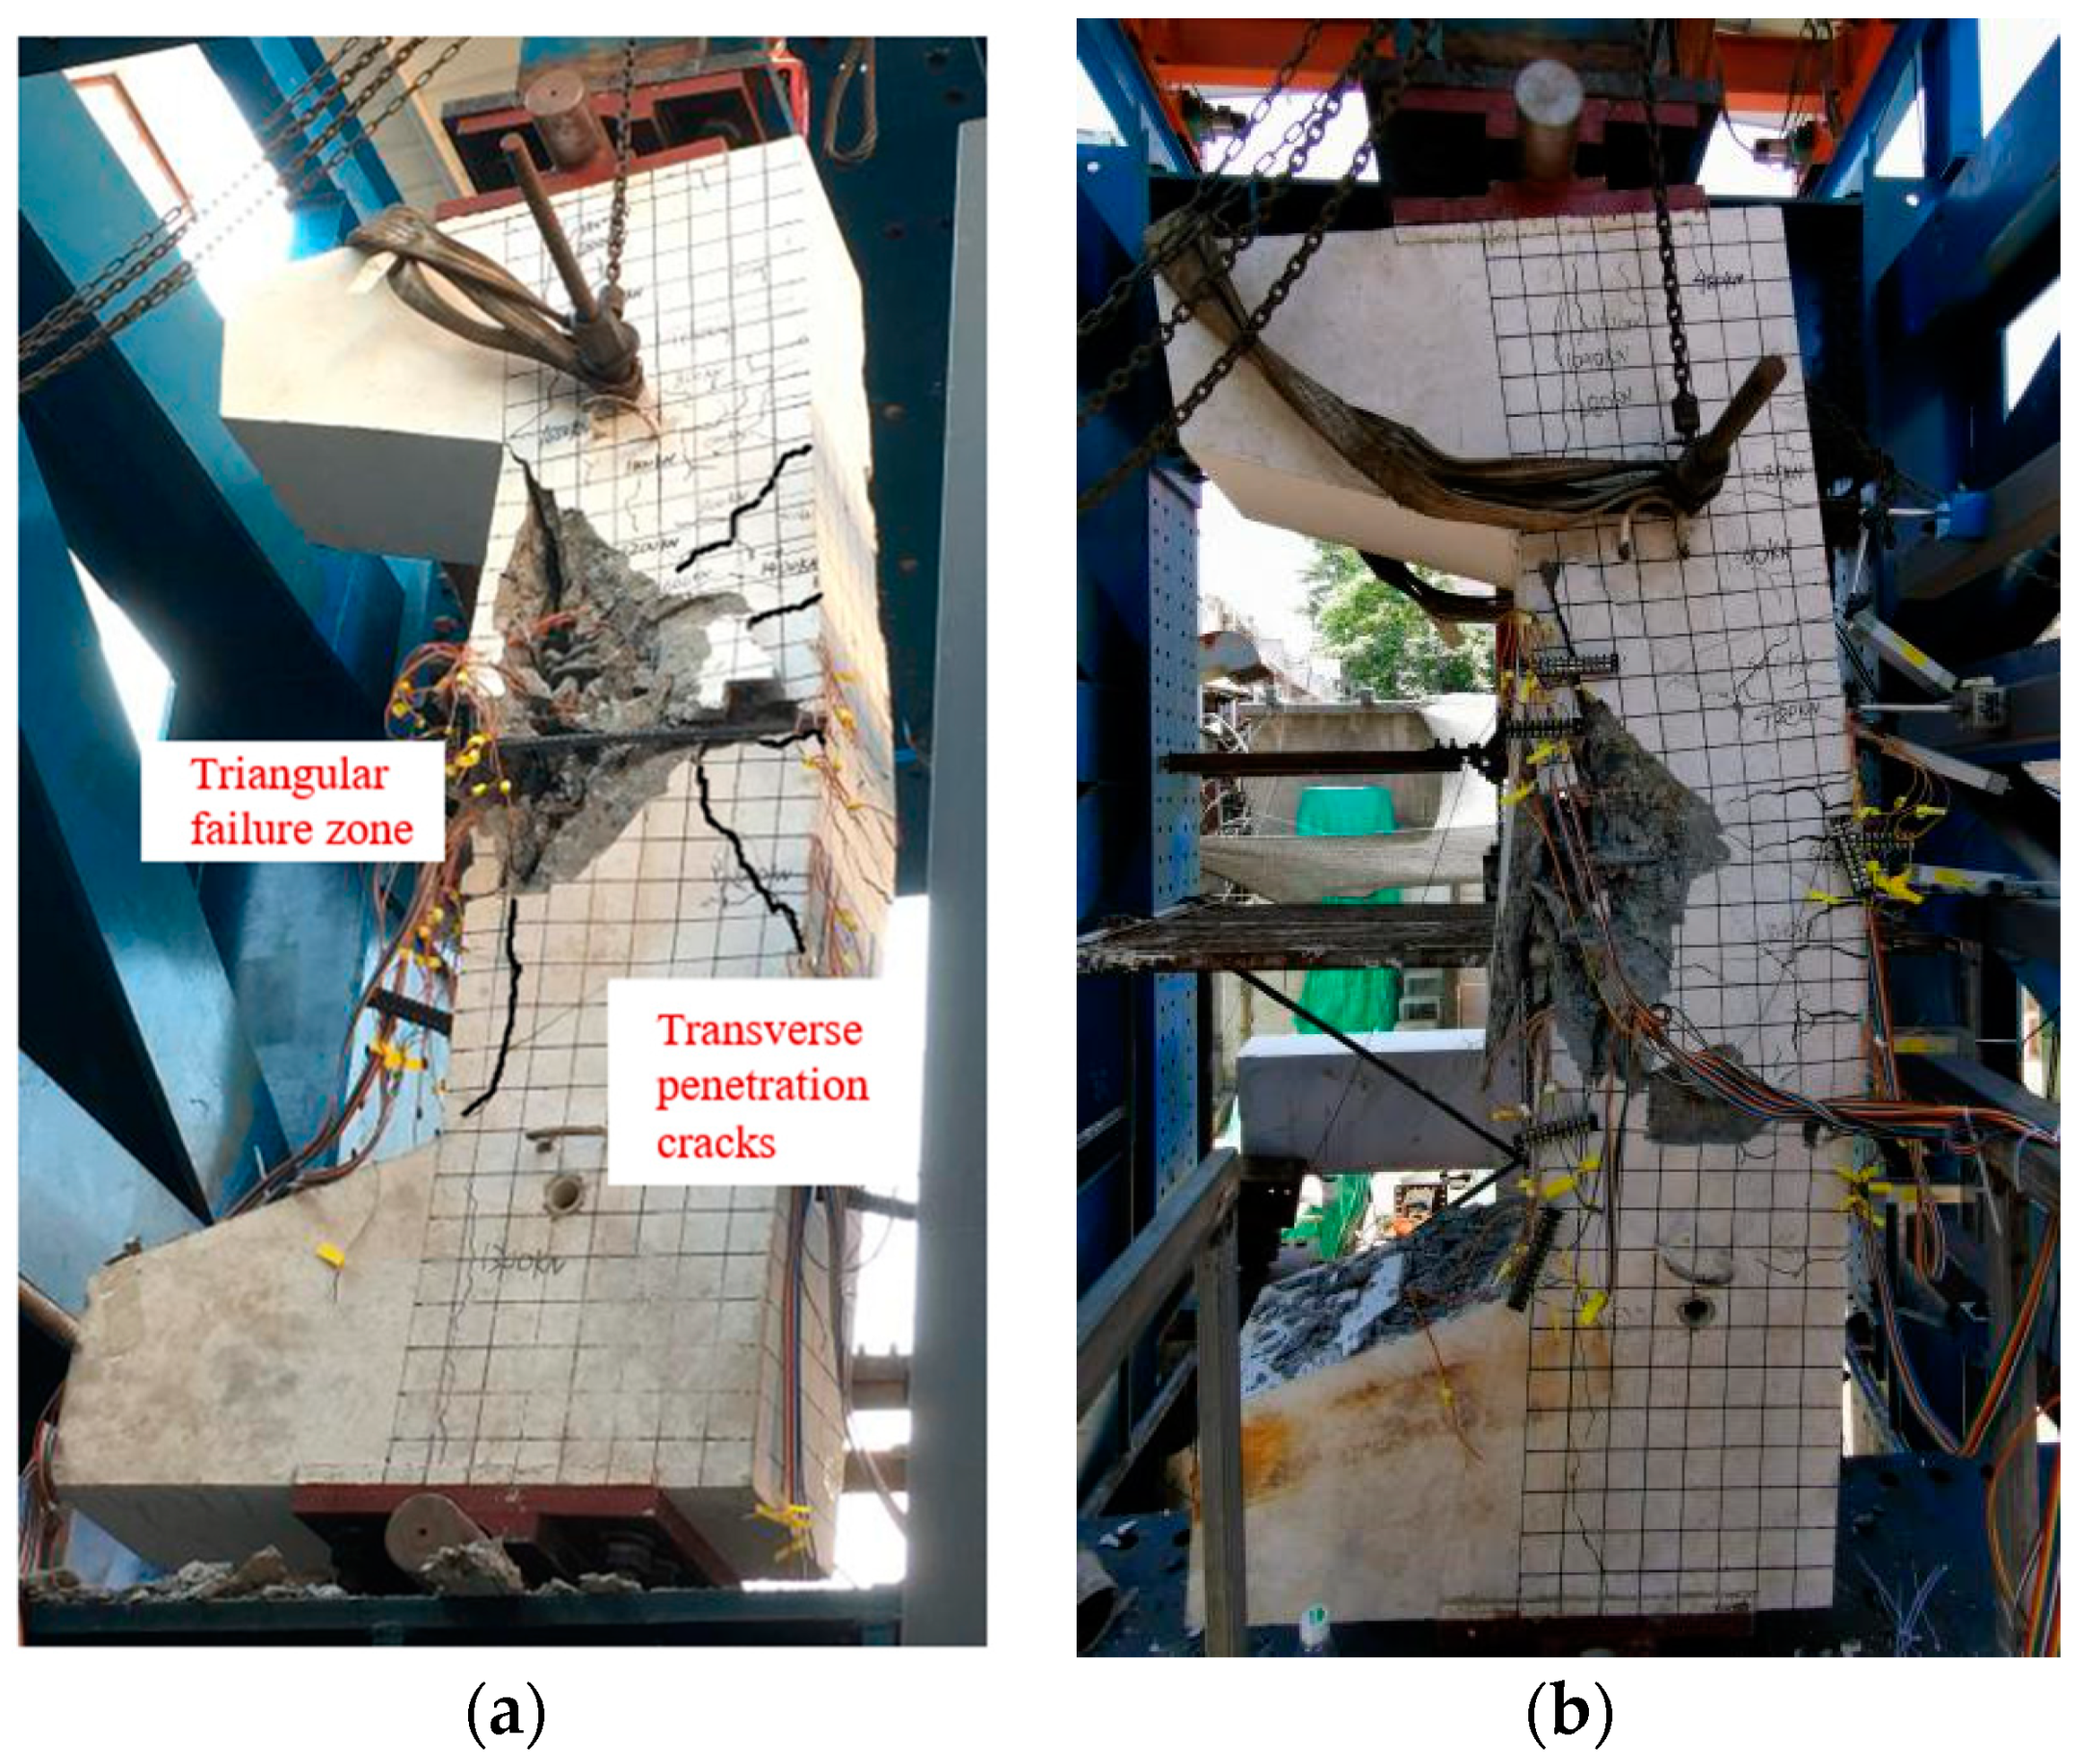
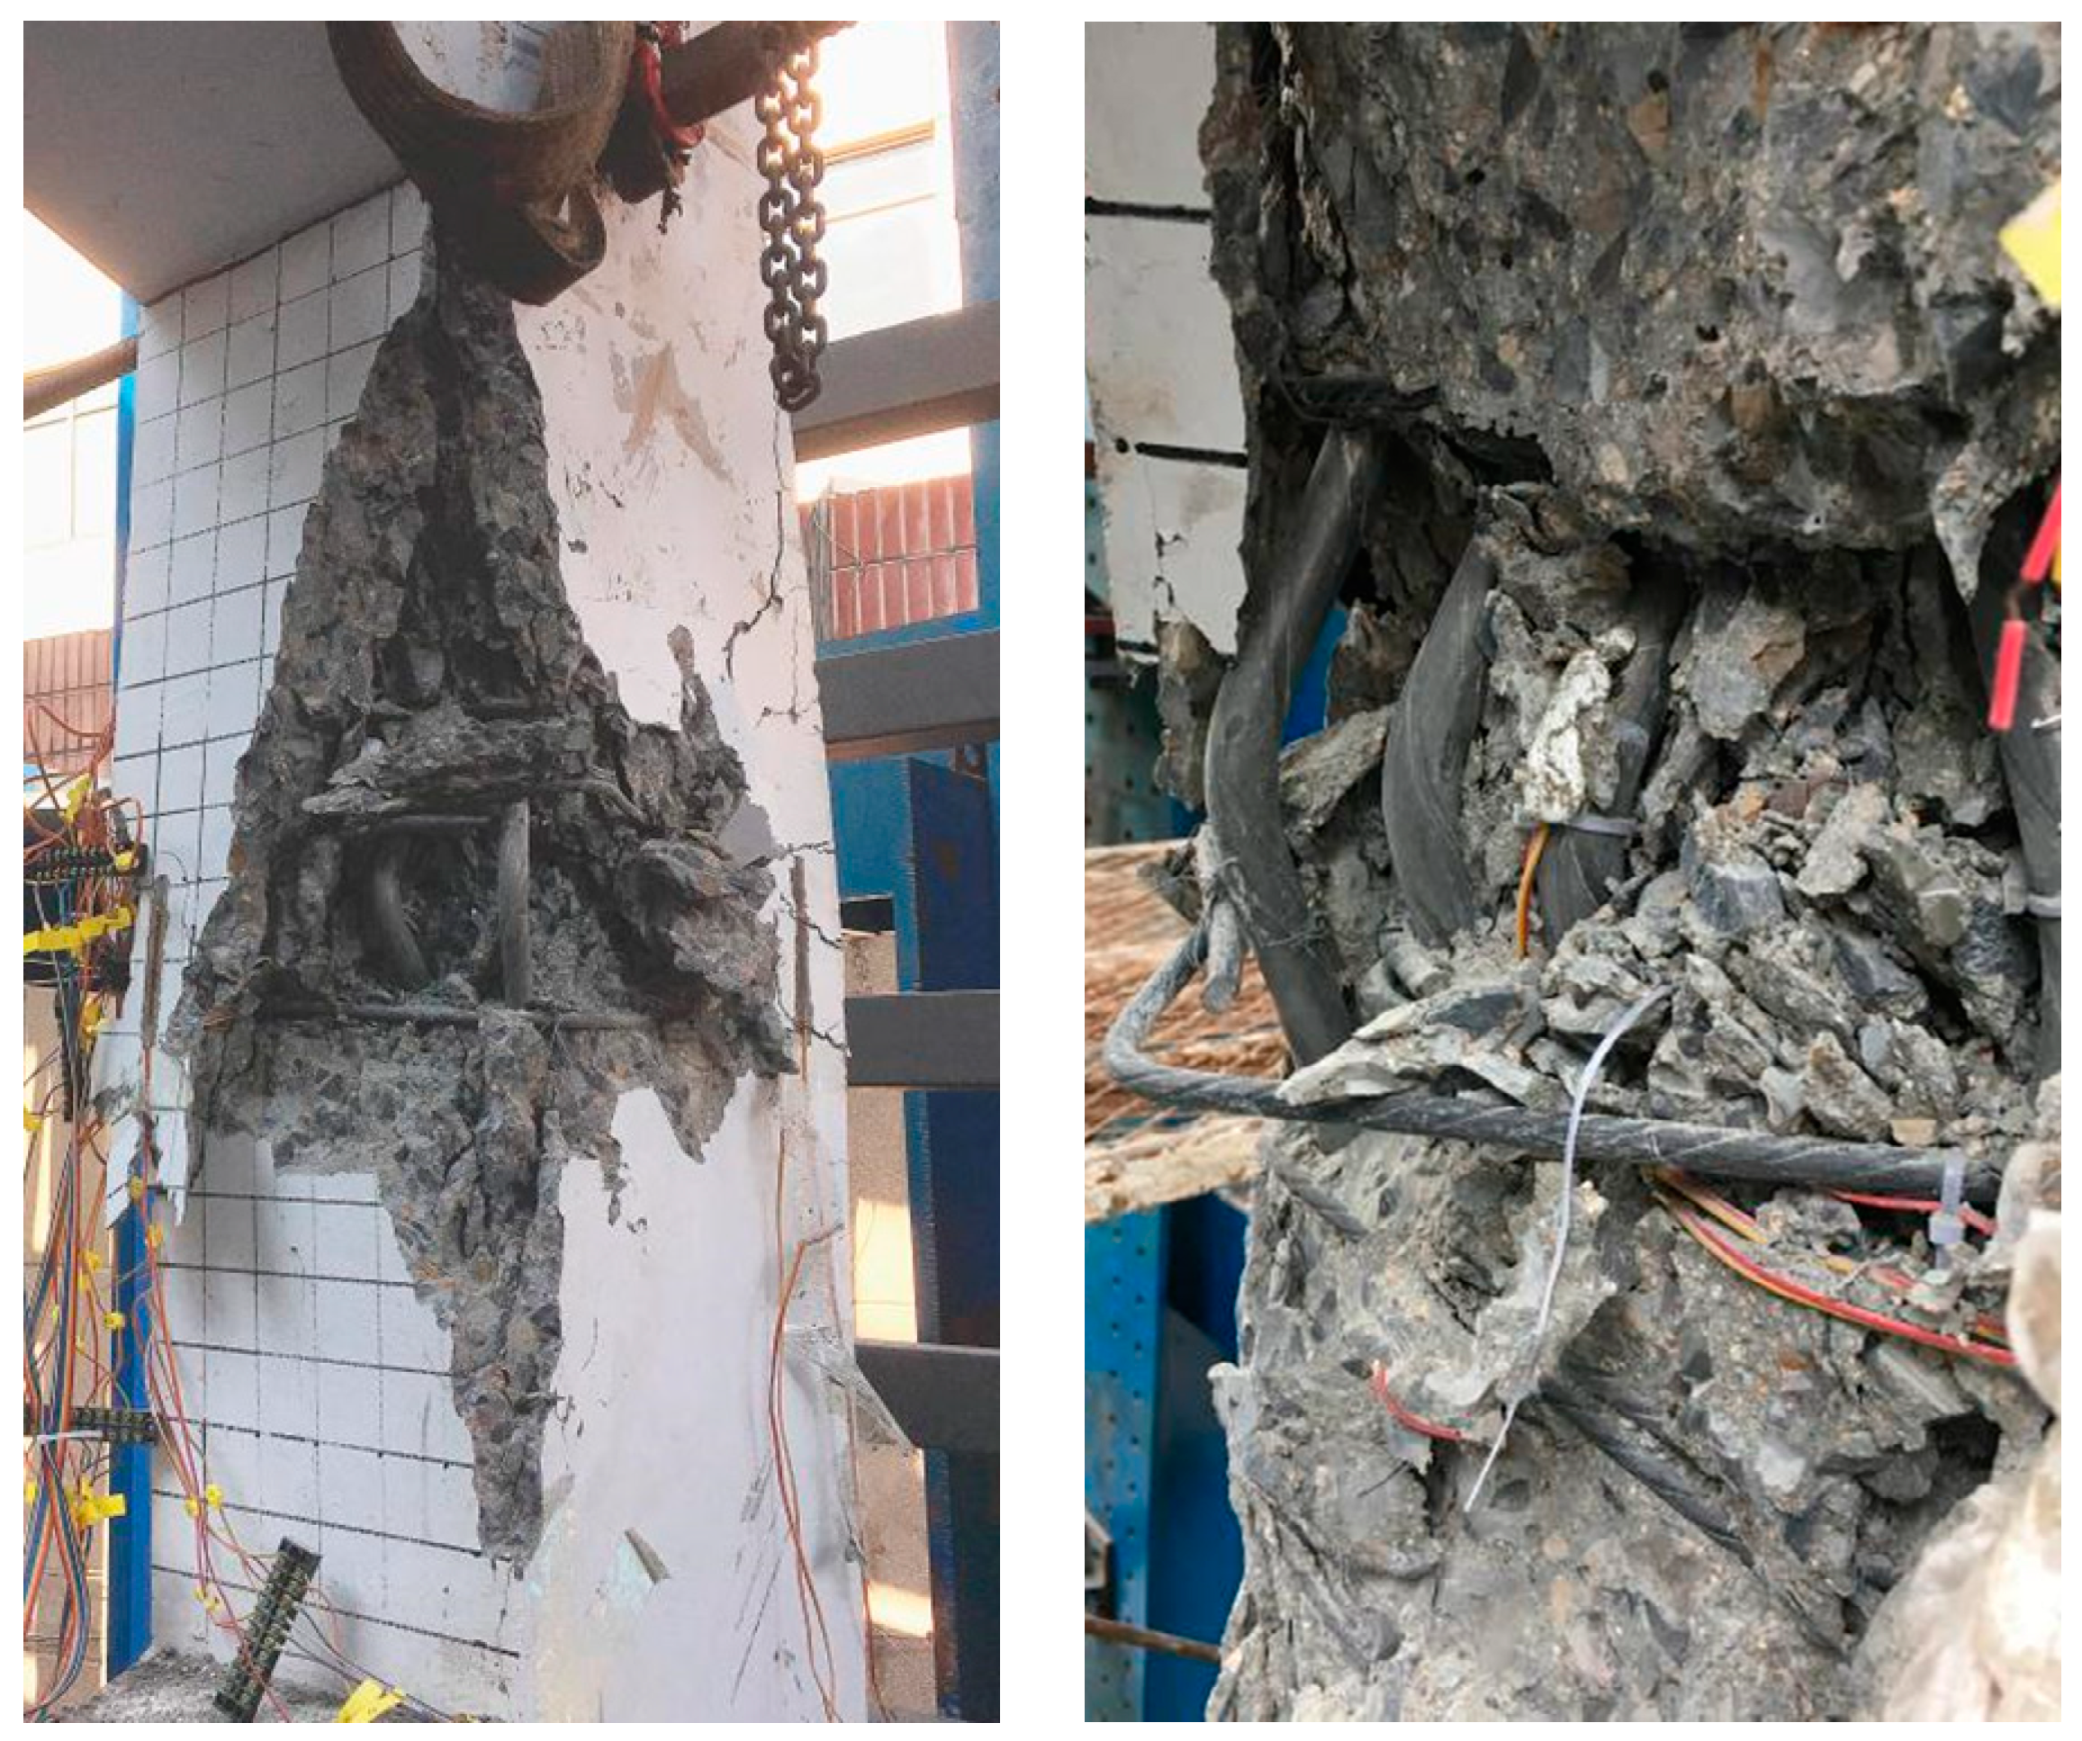
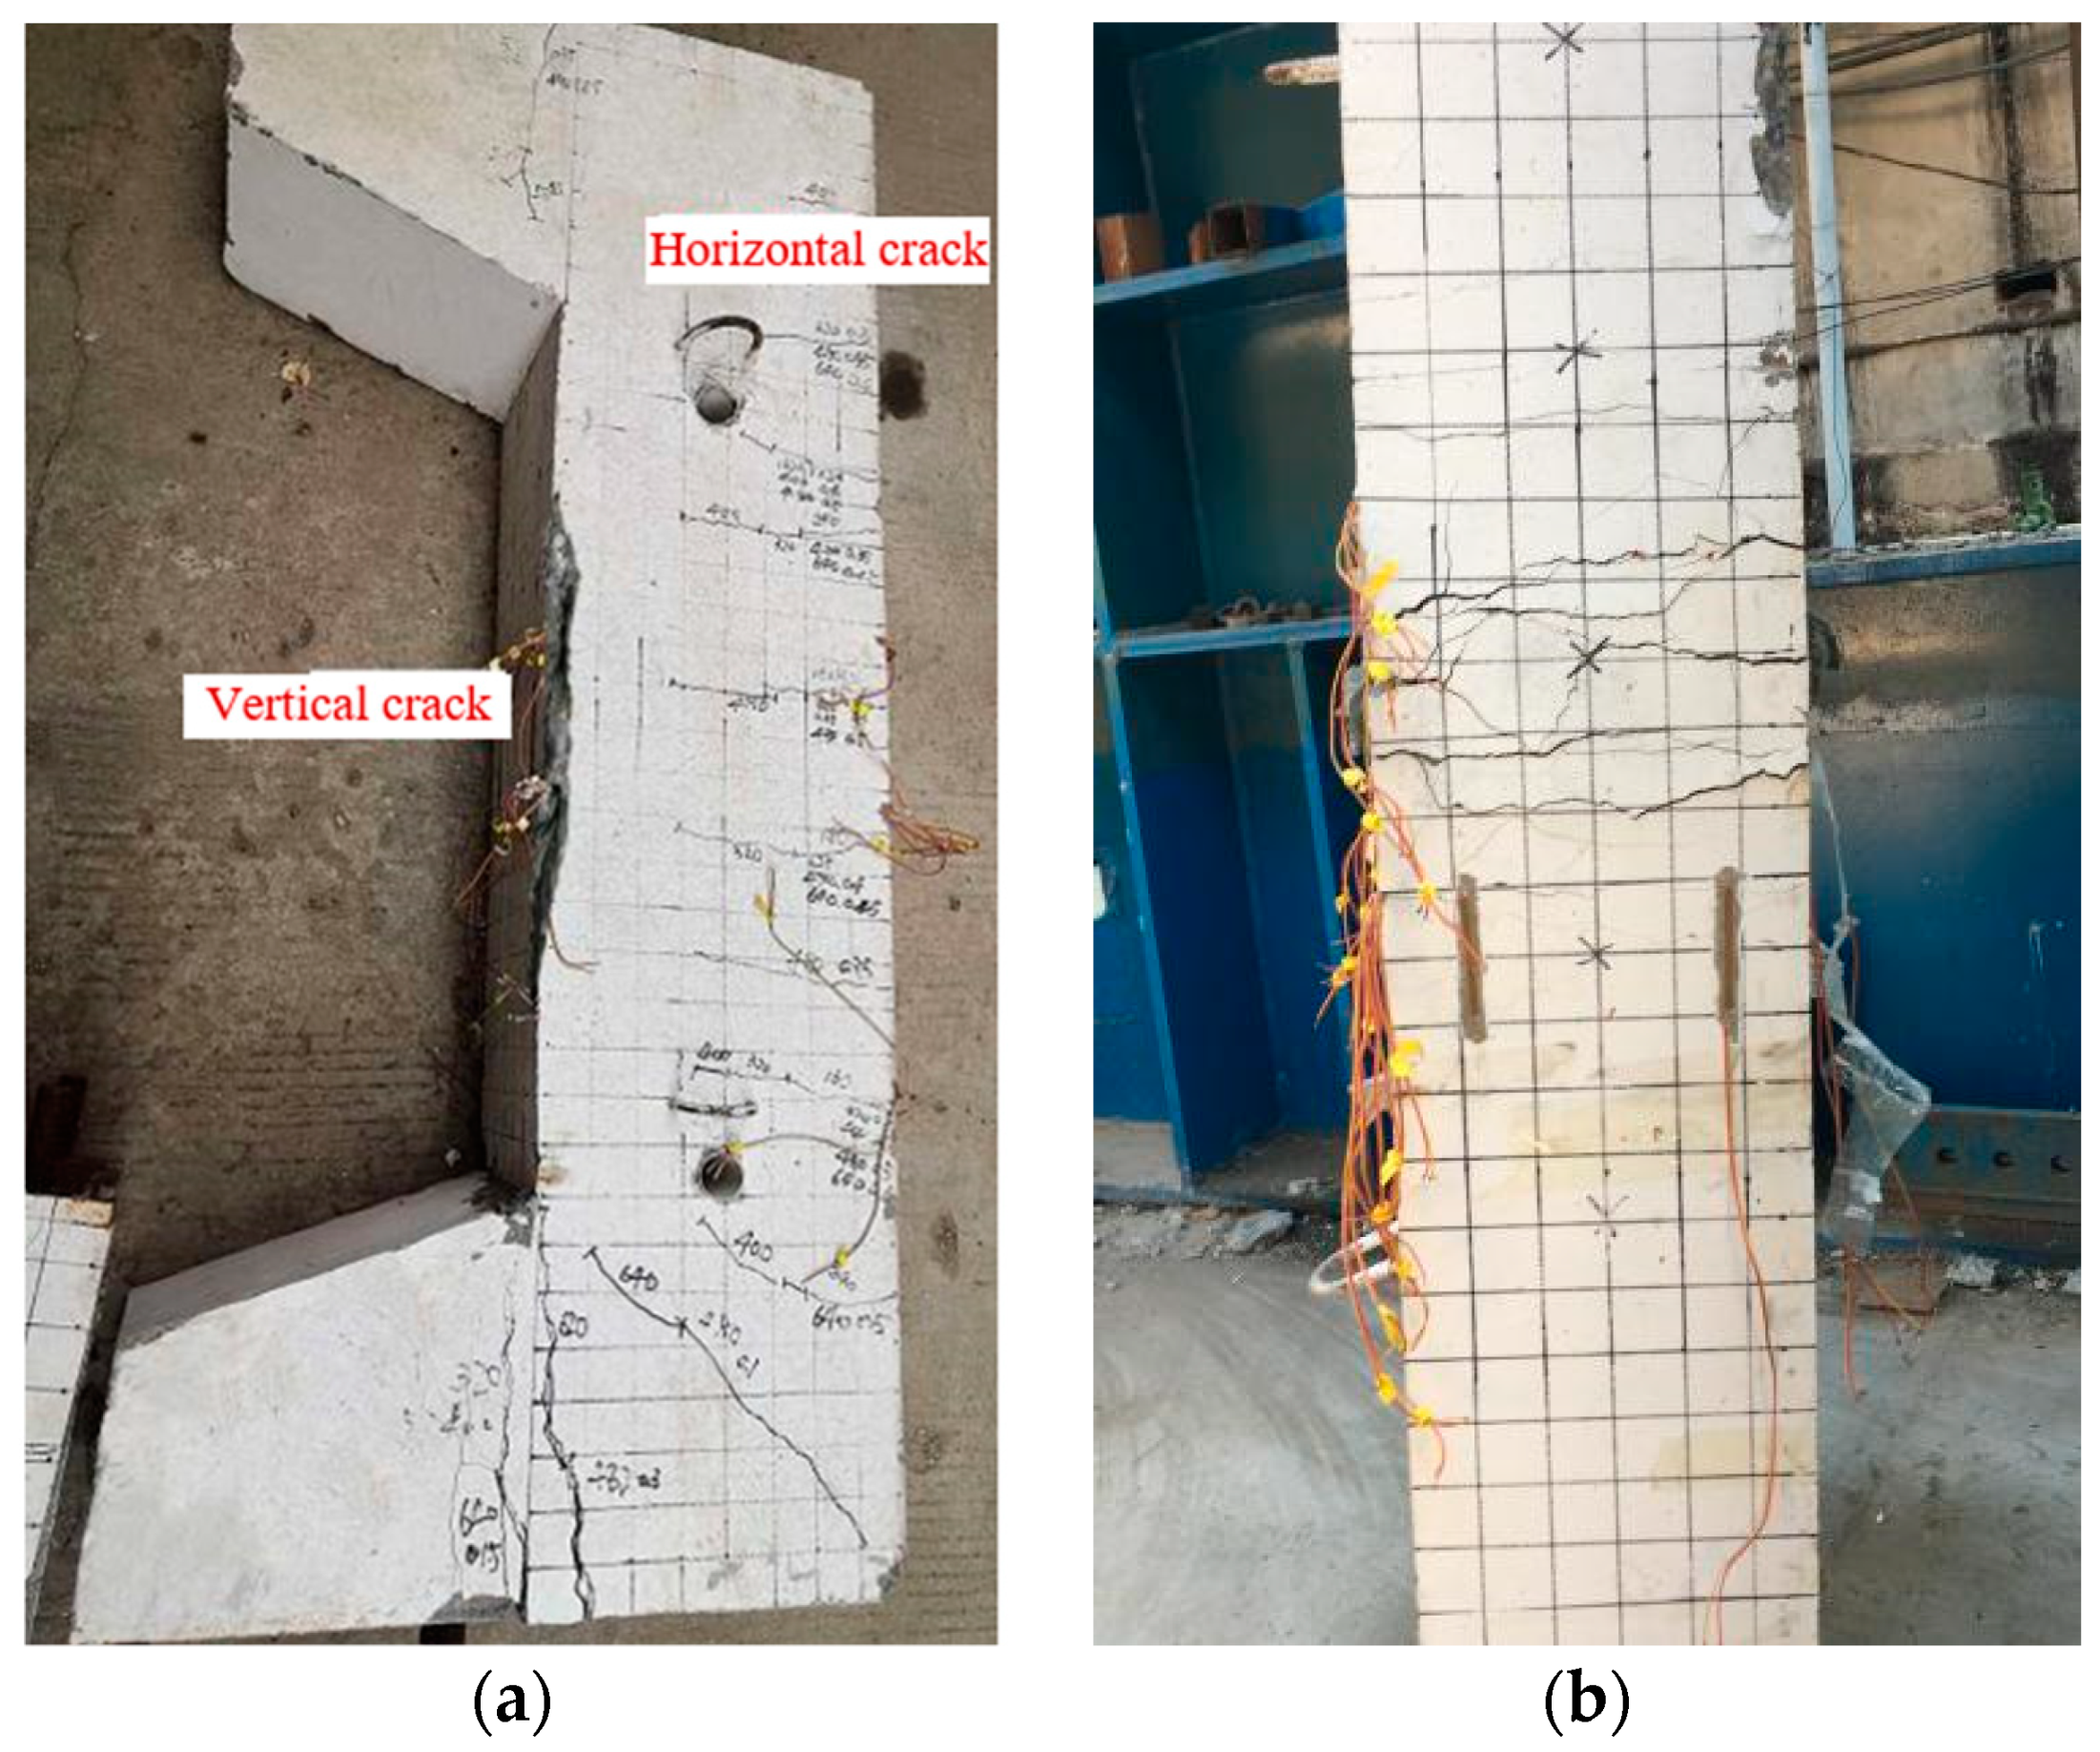
3.1. Failure Process and Phenomenon Analysis of Small Eccentric Compression Column

The damage processes of specimens BZ1, BZ2, and BZ5 were basically similar. When the load reached 15~25% of the peak load, horizontal cracks began to appear at the tensile edge of the section, but the number of horizontal cracks were small at this time, and the development and extension were not significant, while the concrete compressive strain at the edge of the compressive zone began to grow. With the increase in the load, the number of cracks increased. When the load reached 70~85% of the peak load, longitudinal cracks appeared in the specimen, while the development and extension of transverse cracks on the tensile side were not significant, no obvious main crack was formed, and the compressive strain at the edge of the concrete on the compressed side grew faster. When the peak load was reached, the concrete in the compressed area was suddenly damaged, and the crush area formed an obvious triangular damage zone with a small growth of deflection. After the peak load, the transverse cracks developed rapidly, the crack width gradually increased, the concrete spalled on the compressed side, and the compression reinforcement yielded under compression. These specimens were damaged when the concrete was first damaged by compression, and the rebars at the side under large compression reached buckling failure, while the other side of the reinforcement did not yield under tension or compression. The deflection of the specimen was small when the specimen was damaged, and the specimen showed certain brittle characteristics. According to the damage classification characteristics of an ordinarily reinforced concrete eccentric column, such specimens were classified as small eccentric compressive damage. The failure mode of the specimens are shown in Figure 7 and Figure 8.

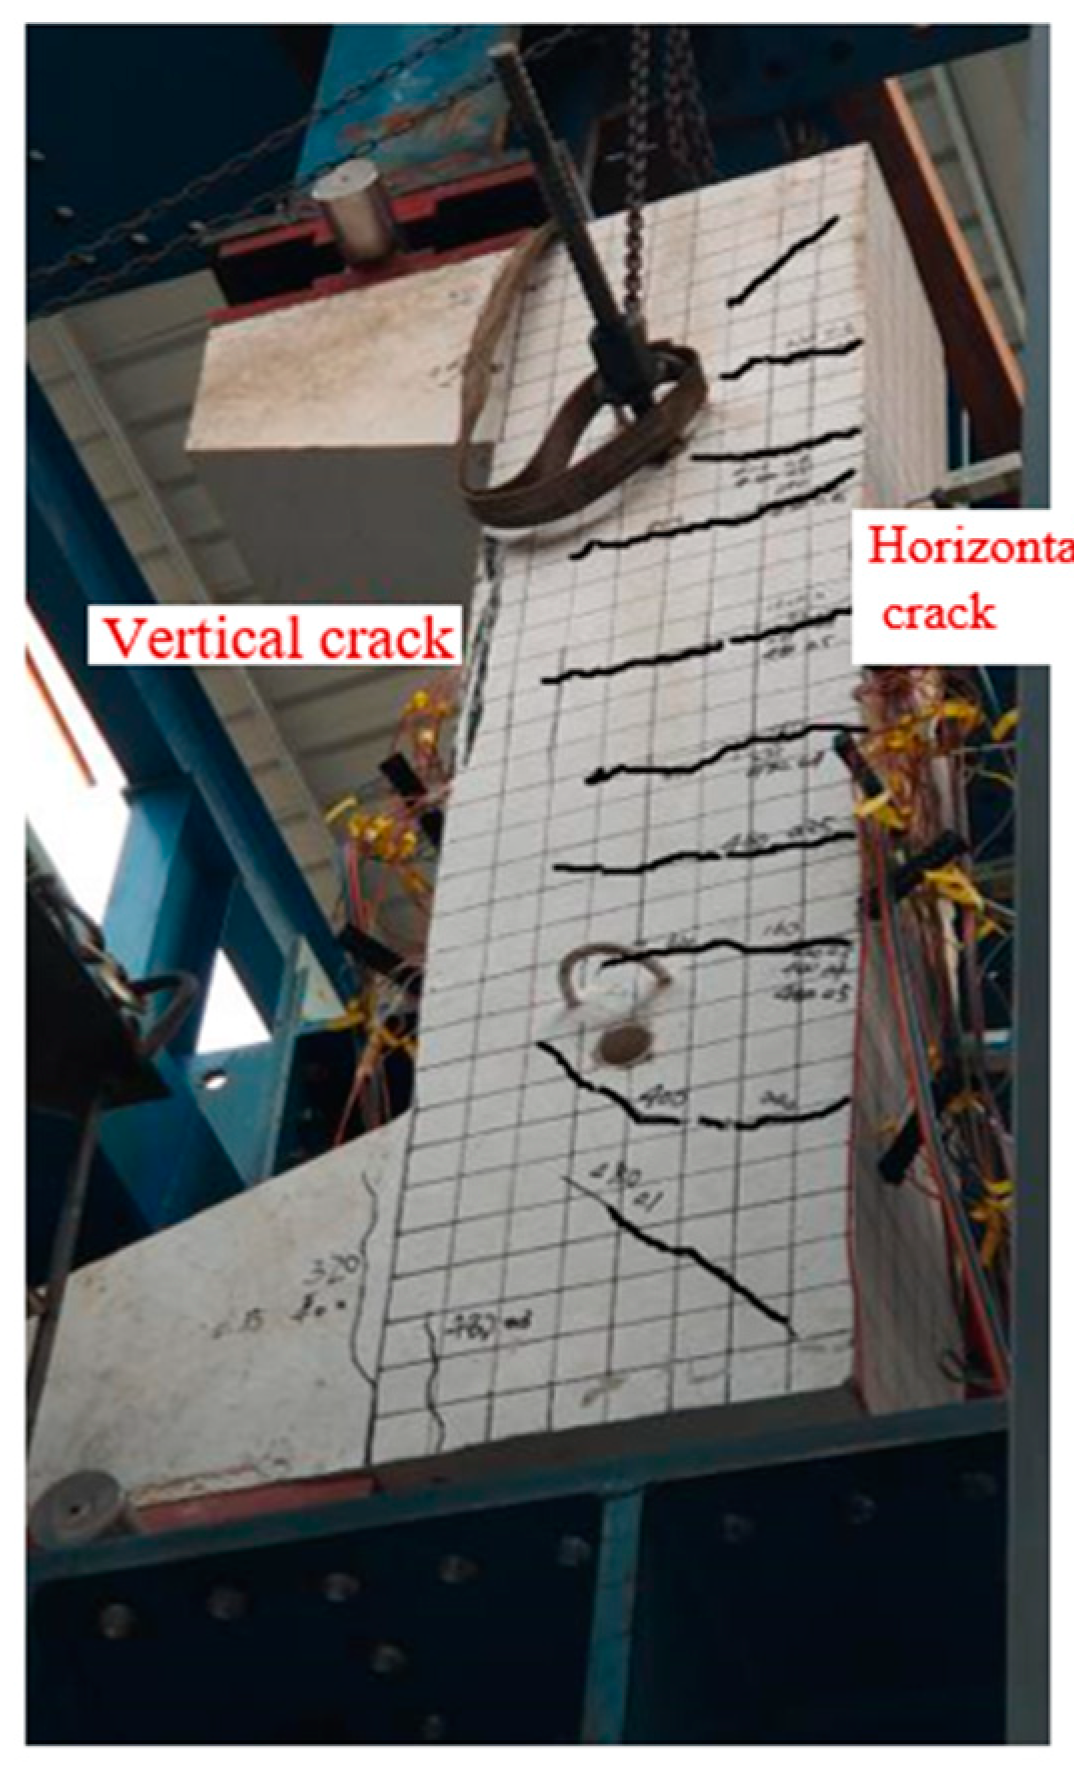
3.2. Failure Process and Phenomenon Analysis of Large Eccentric Compression Column

The failure processes of BZ3, BZ4 and BZ6 were basically similar. Obvious cracks were observed far from the loading point side and mostly concentrated in the middle of the column when the applied load reached 25% of the peak load. When loaded to 80% of peak load, longitudinal cracks appeared in the eccentric compression column. Horizontal cracks developed at the tension side, and the middle part was close to the penetration. As the load continued to increase, the cracks began to extend to both ends, that is, diagonal cracks occurred. When the failure load was reached, the compression reinforcement buckled, and the width of the transverse crack and the deflection increased. The concrete at the compression side was crushed, the crushing section became longer, and the specimen was damaged; as shown in Figure 9 and Figure 10.

3.3. Analysis of Test Results of Eccentrically Pressurized Columns

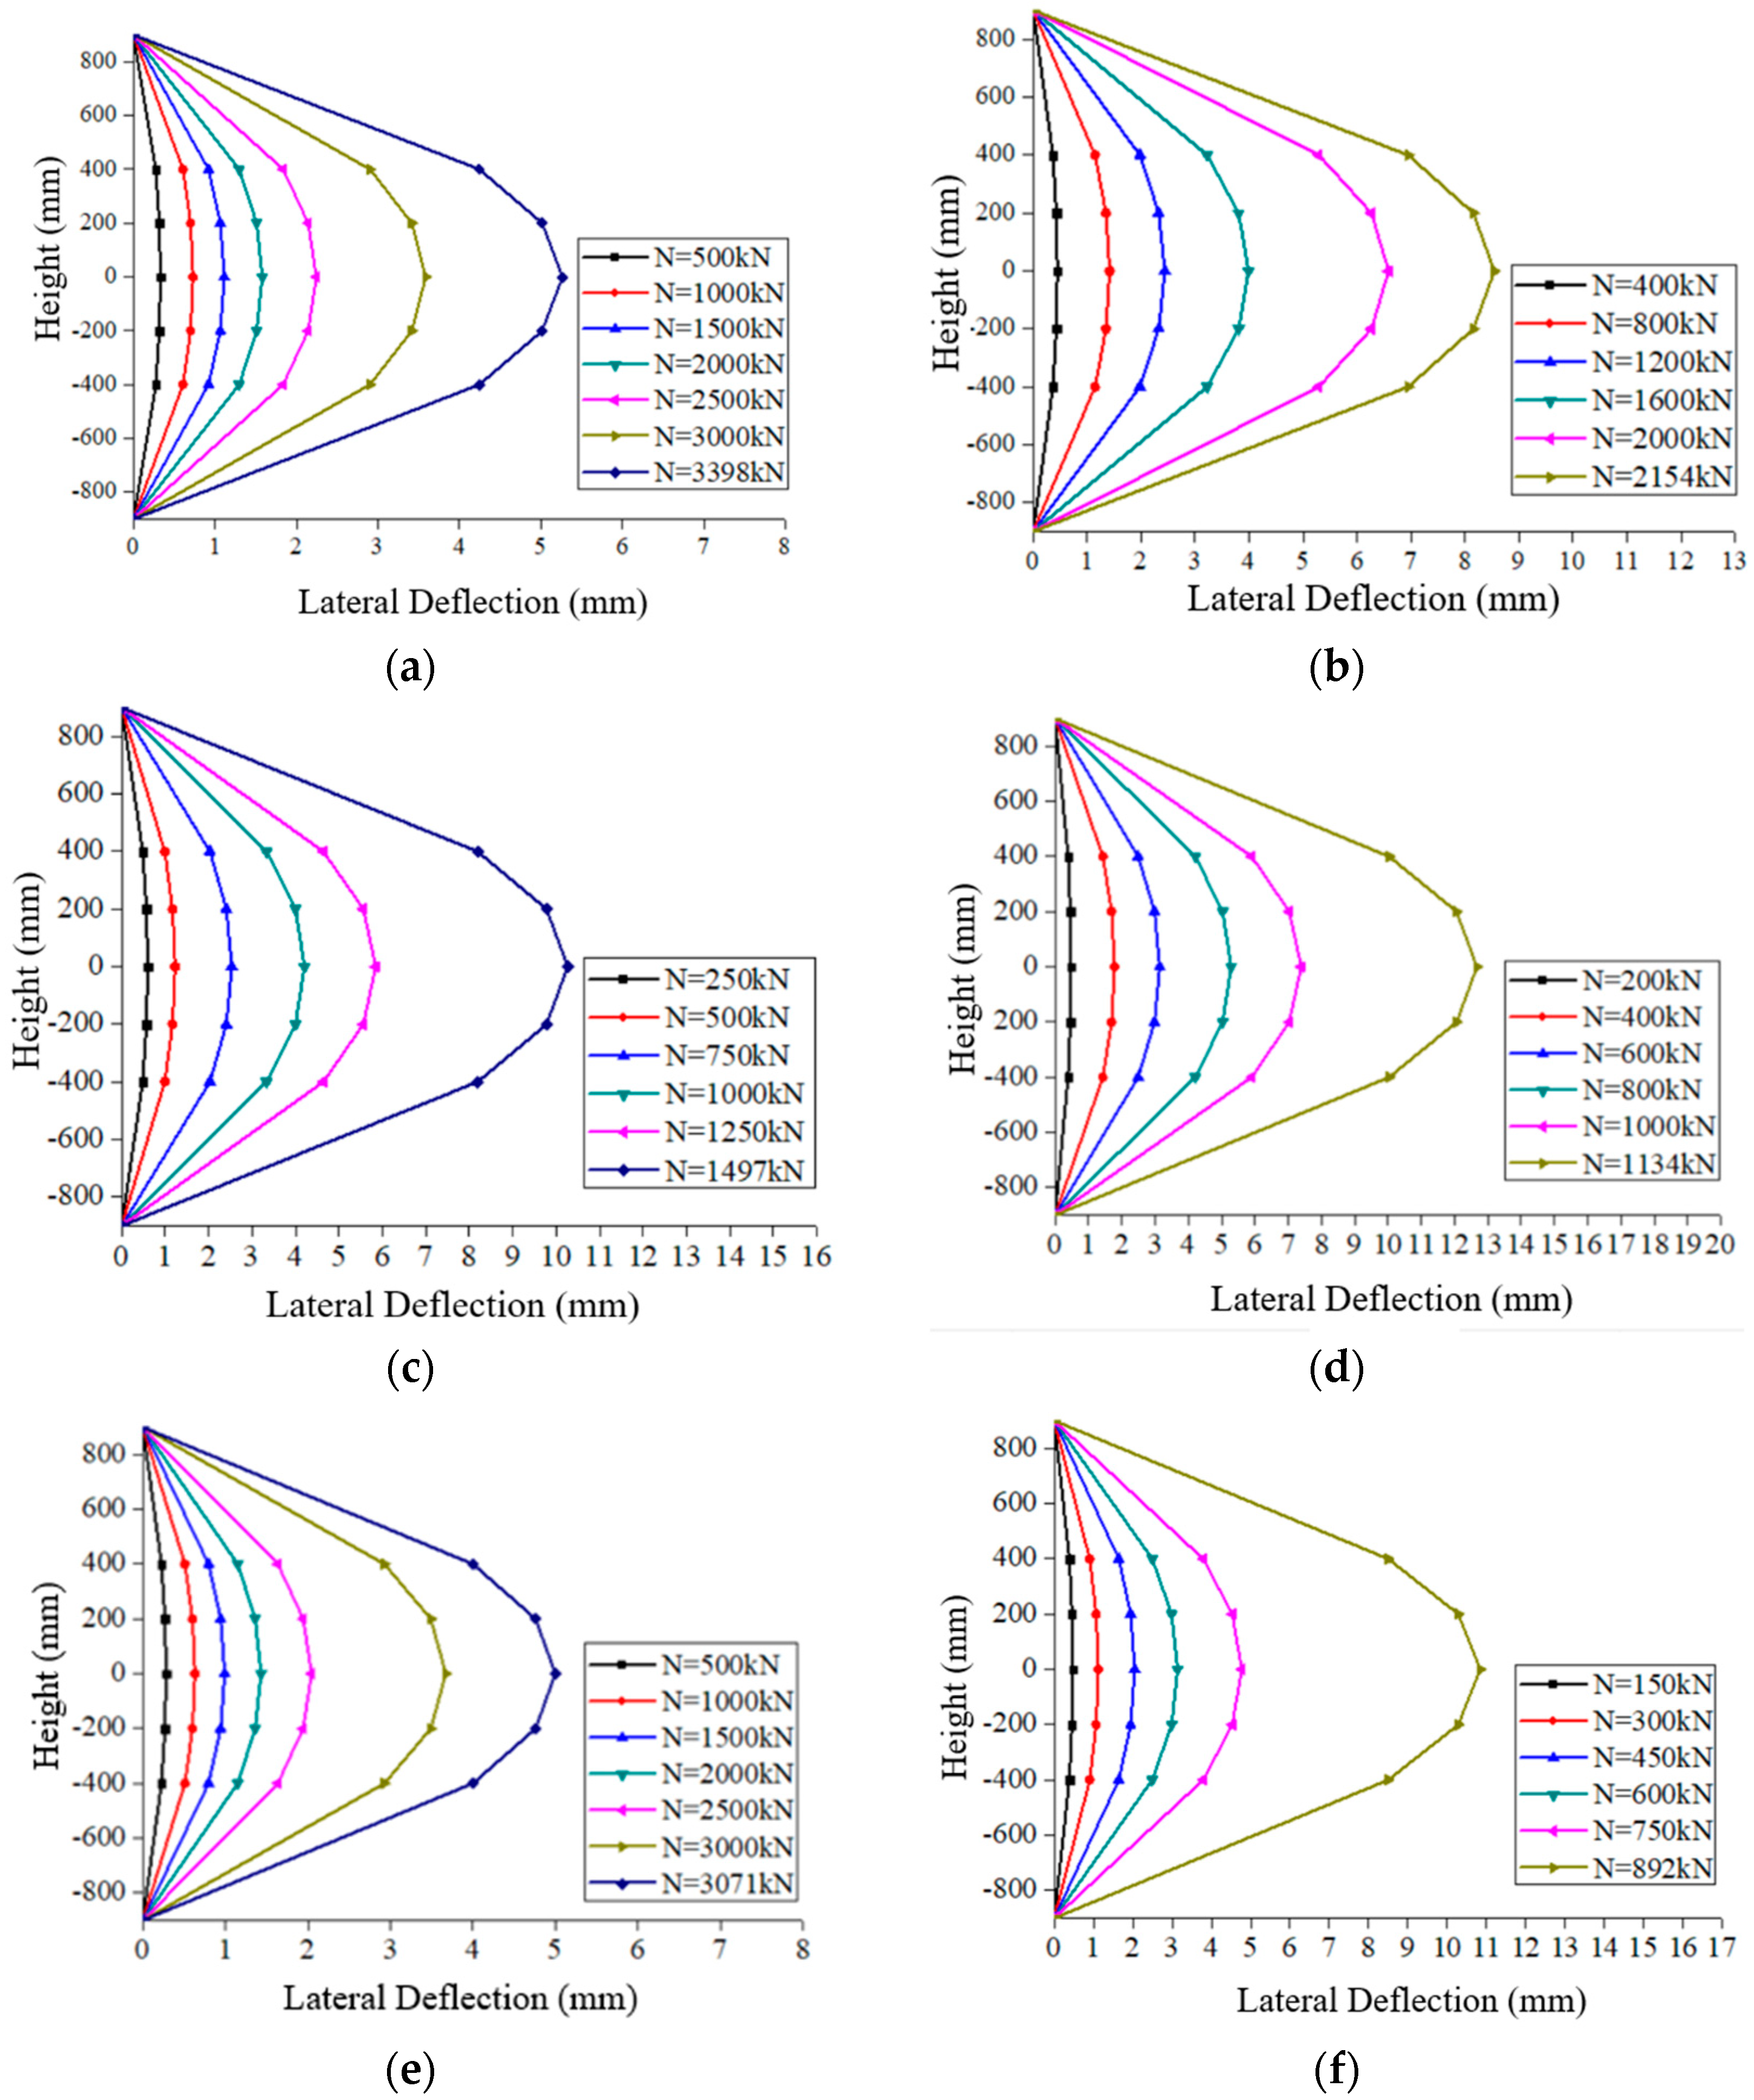
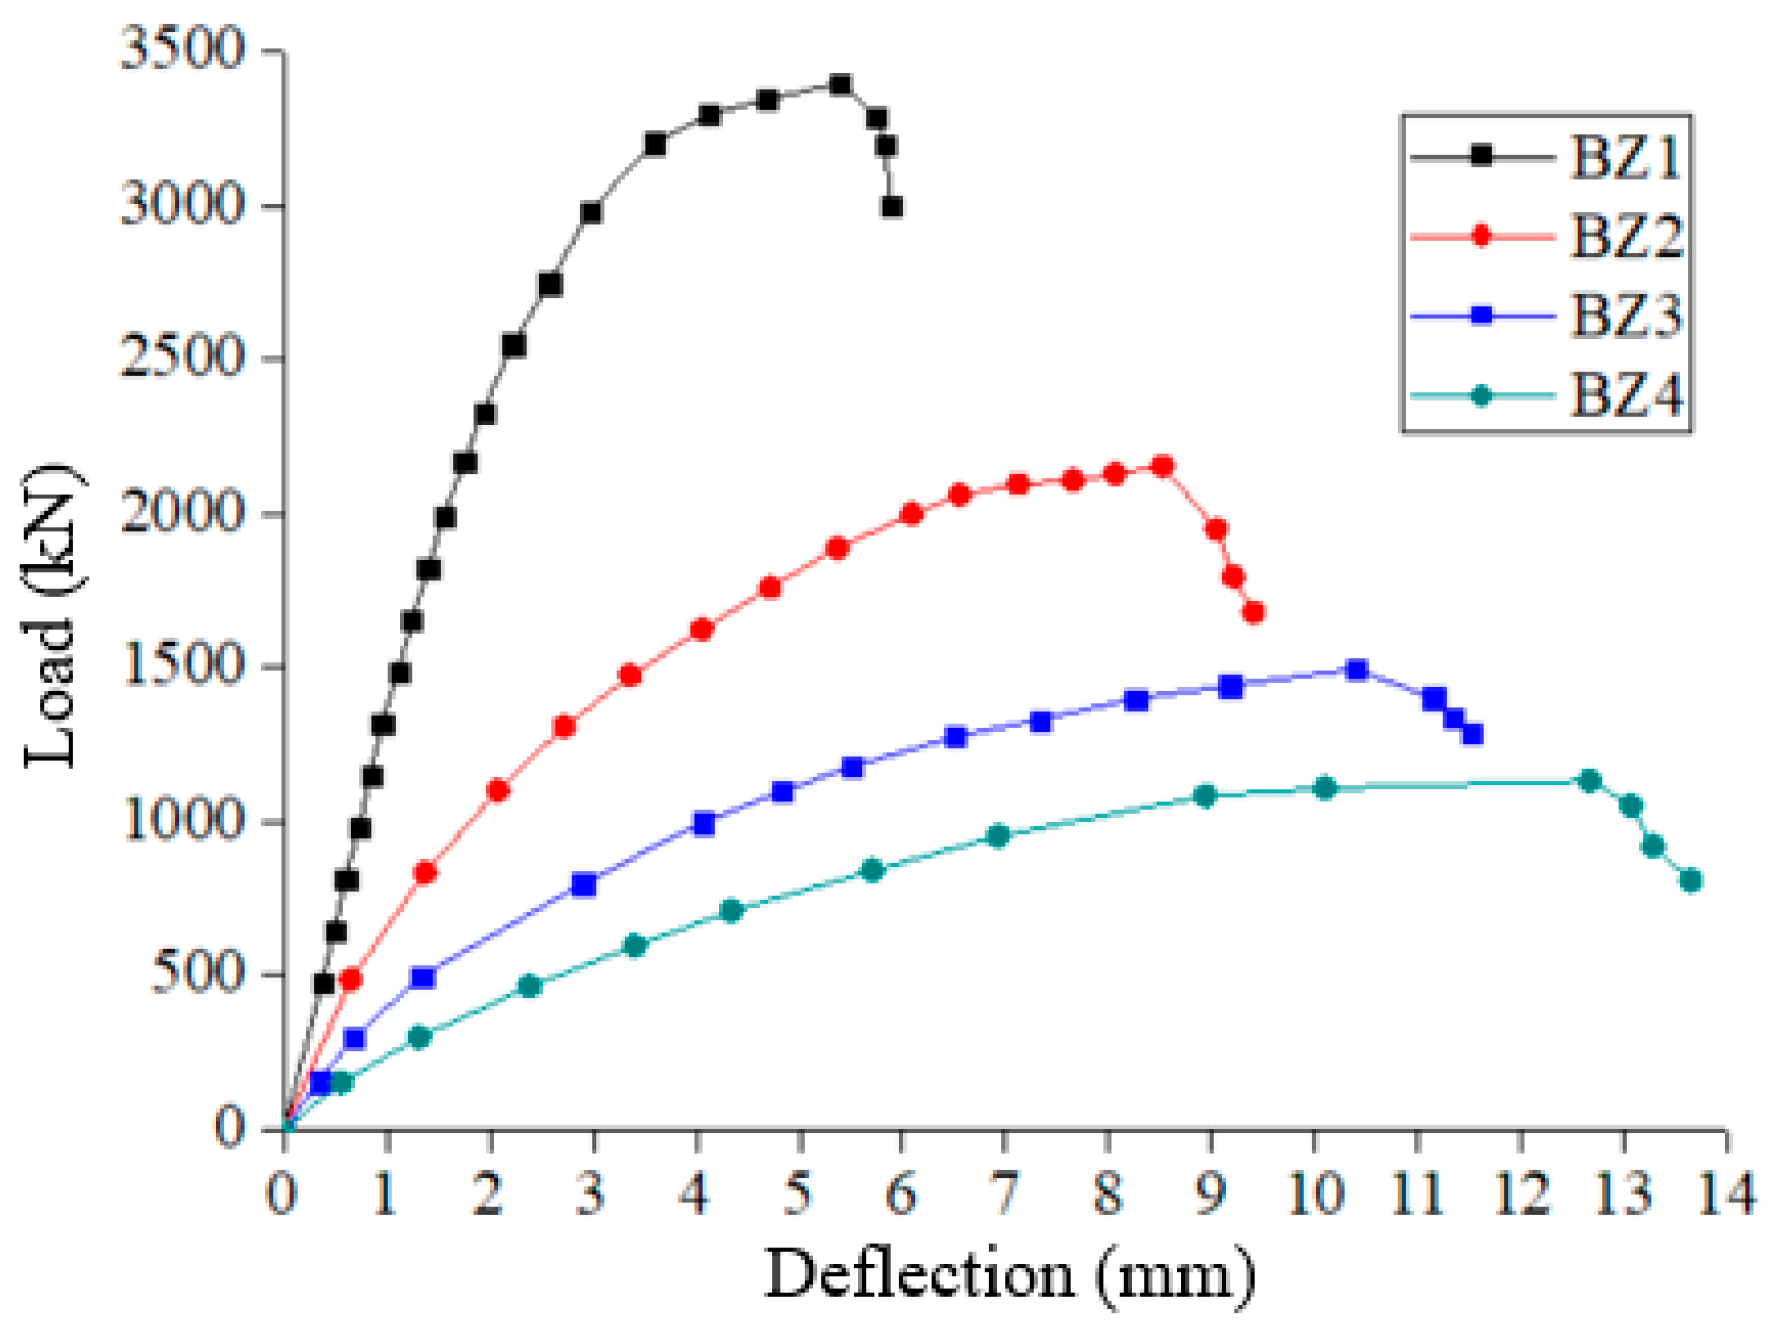
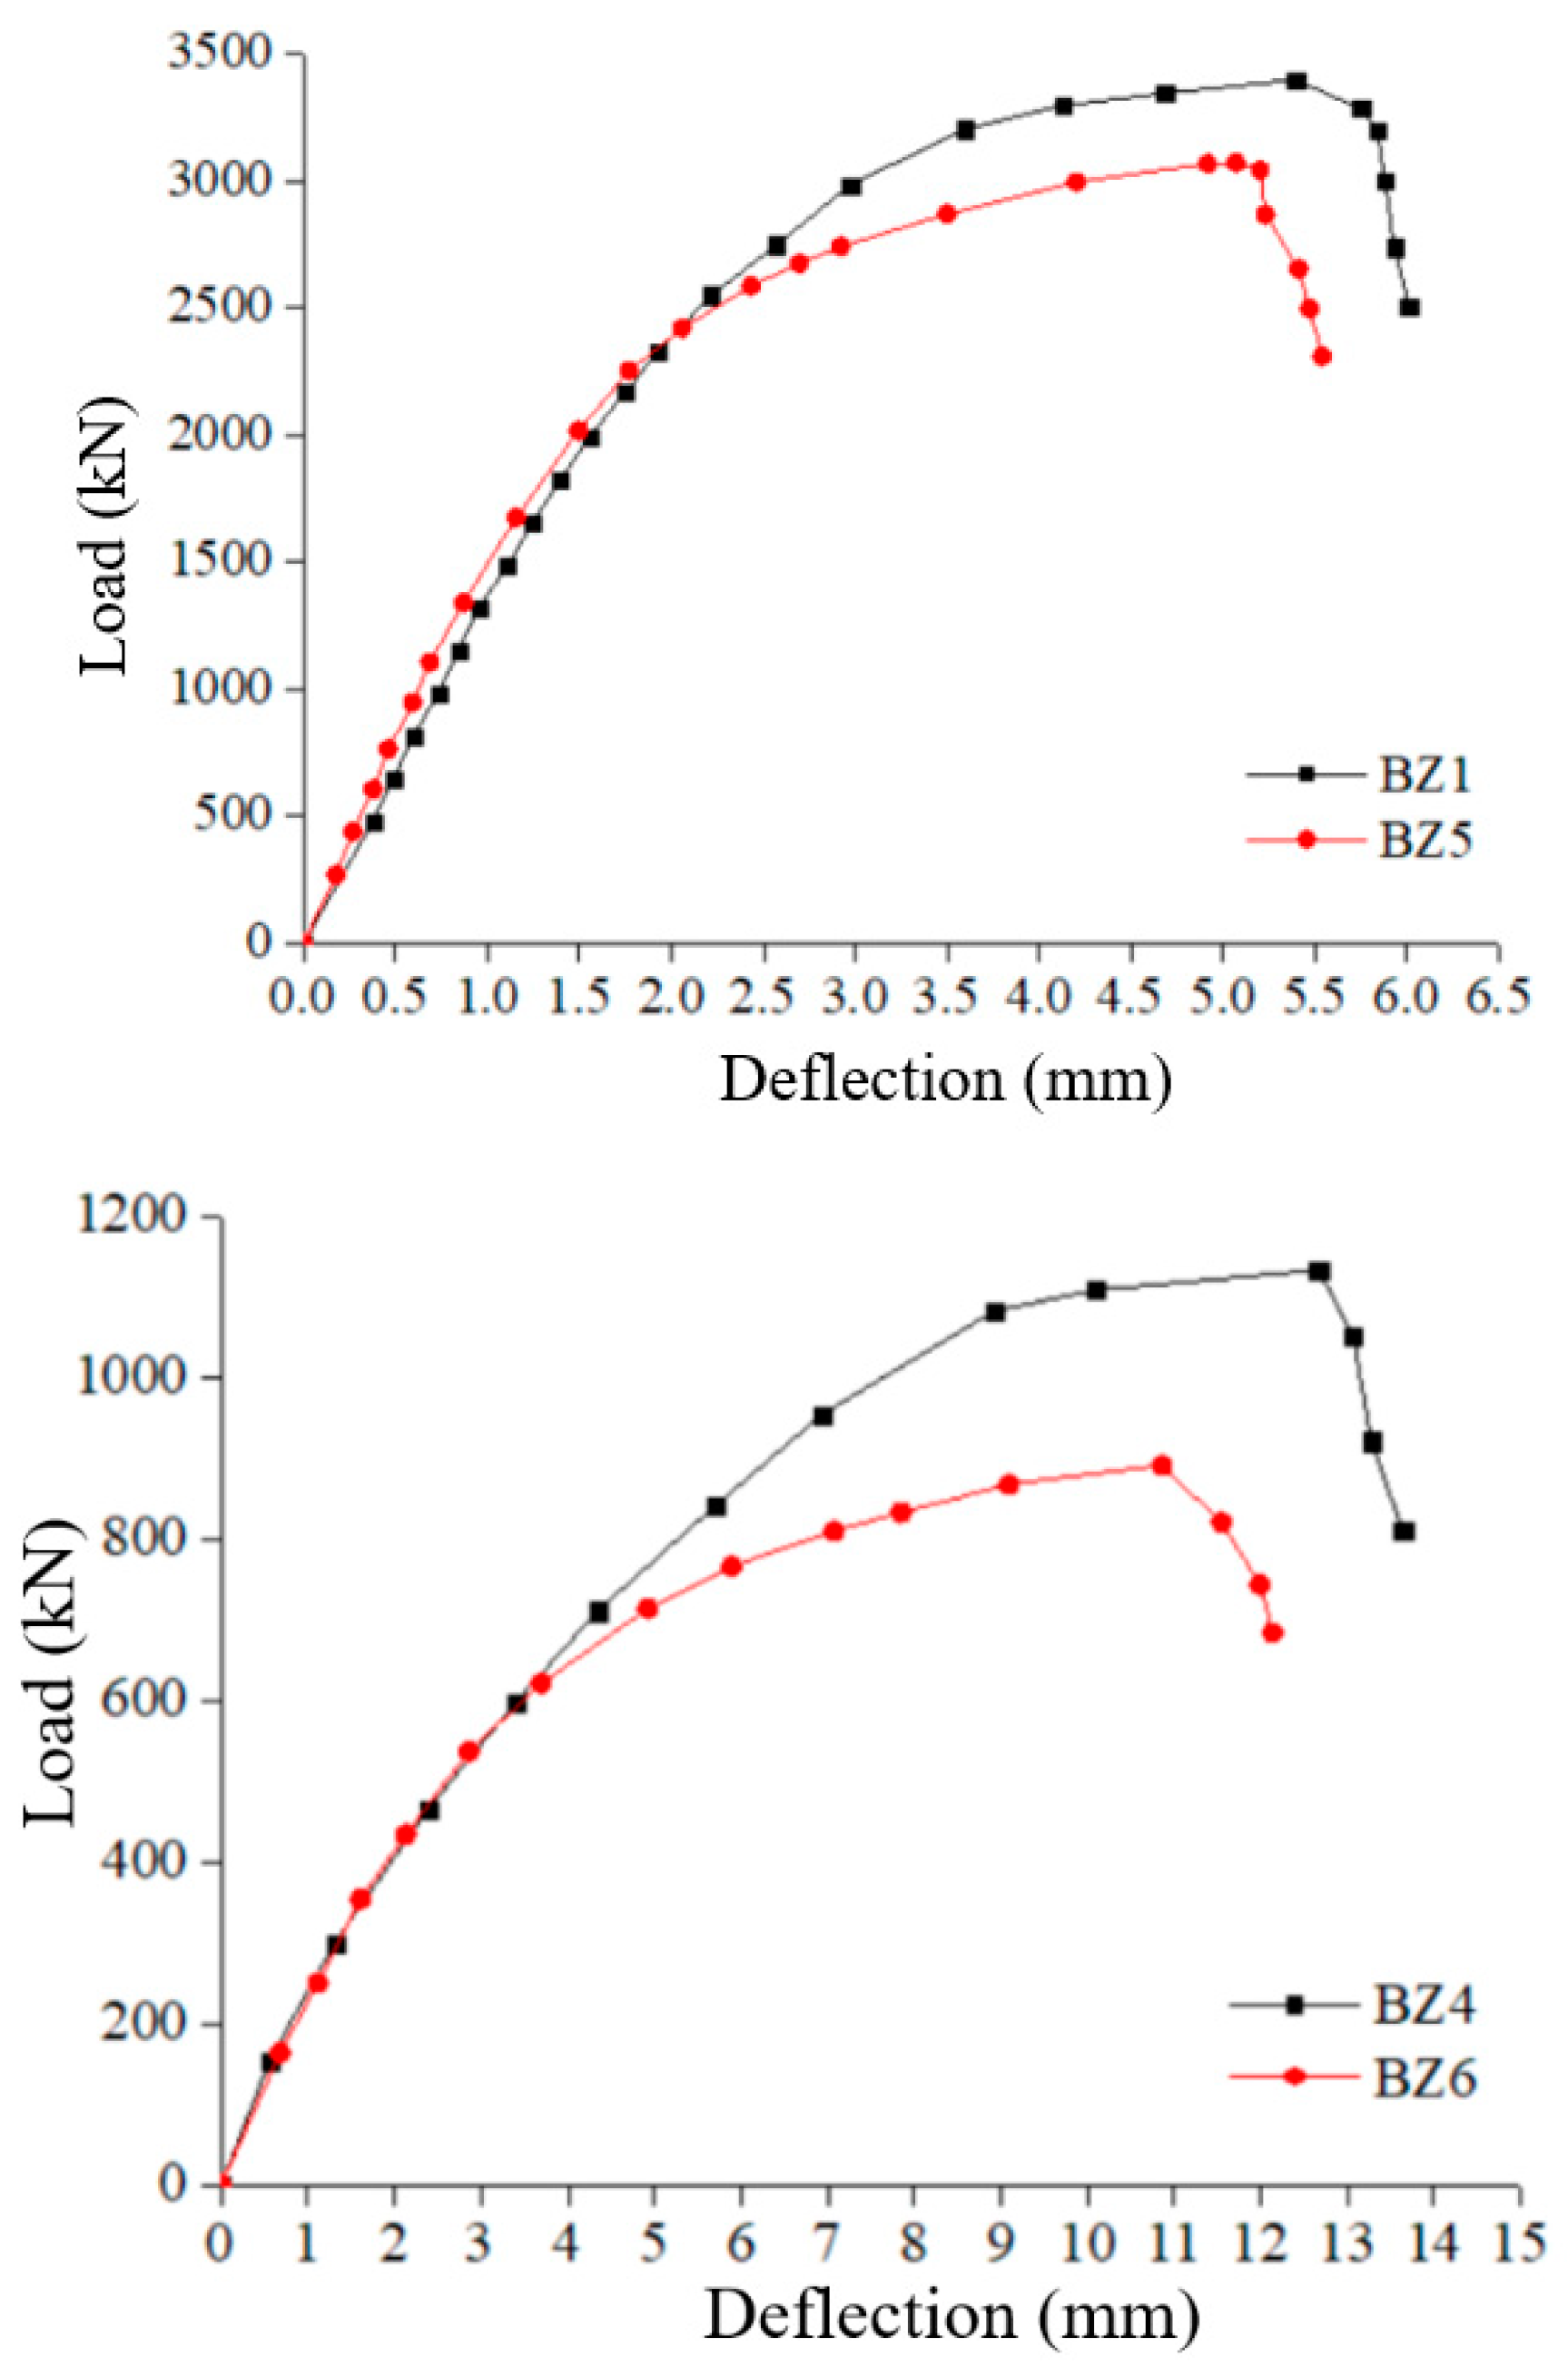
3.3.1. Load–Deflection Analysis

(1) Lateral deflection curve
Five displacement meters were arranged along the full length of the eccentric compression column. Figure 11 shows the lateral deflection curves under different loads. The abscissa represents the deflection of the middle section of the specimen, and the ordinate represents the position of the deflection measuring point. It can be seen from the lateral deflection curve that the deflection curve of the eccentric compression specimen was basically symmetrical, and the maximum deflection occurred at the midspan. Under eccentric compression, the lateral deflection curve of the concrete columns reinforced with grade 735 MPa high-strength steel bars was consistent with that of the concrete columns reinforced with ordinary high-strength steel bars.
(2) Load–lateral deflection curve
The load–lateral deflection relationship curves of the specimen are shown in Figure 12 and Figure 13. As seen from the figures, the curves can be divided into three stages. The first stage was the linear elastic stage. The load was small, no cracks occurred on one side of the tensile zone, and the relevant curve was straight. The second stage was the elasto-plastic stage. Horizontal cracks appeared at one end far from the loading point, with gradual extension, and an increase in number and width. The specimen changed from elastic to linear, the curve started to deflect, the slope decreased, and the stiffness of the specimen gradually decreased. The third stage was the decreasing load section. The load decreased after the peak. The flatter the curve, the greater the ductility. In this test, the effects of longitudinal reinforcement strength and eccentricity on the load–deflection curve were investigated.
The effect of eccentricity on the load–lateral deflection curve is shown in Figure 12. From the figure, it can be seen that in the elastic phase, the stiffness decreased as the eccentricity increased. In the elasto-plastic stage, the larger the eccentricity, the smaller the bearing capacity and the larger the lateral deflection. In the declining load section, the larger the eccentricity distance, the smoother the curve decline and the greater the ductility. The bearing capacity of BZ1 was 57.7% higher than that of BZ2, and BZ3 was 32% higher than that of BZ4. Therefore, the smaller the initial eccentricity distance, the more significant the effect on the bearing capacity of the eccentric column.
Figure 13 shows the effect of longitudinal reinforcement strength on the load–deflection curve. As seen from the figure, in the elastic phase, the stiffness did not change with the longitudinal reinforcement strength. In the elastic-plastic phase, the concrete cracks appeared away from the loading end, and the higher the longitudinal reinforcement strength, the greater the stiffness. With the increase in longitudinal reinforcement strength, the lateral deflection and bearing capacity of the specimen increased. When the eccentric distance was 100 mm, the load bearing capacity of the concrete column reinforced with grade 735 MPa high-strength steel bars increased by 10.6% compared with the concrete column reinforced with HRB400 high-strength steel bars. When the eccentricity distance was 400 mm, the load bearing capacity of the concrete column reinforced with grade 735 MPa high-strength steel bars increased by 27% compared with the concrete column reinforced with HRB400 high-strength steel bars. Therefore, the degree of influence of reinforcement strength on the large eccentric compressive bearing capacity was more obvious.

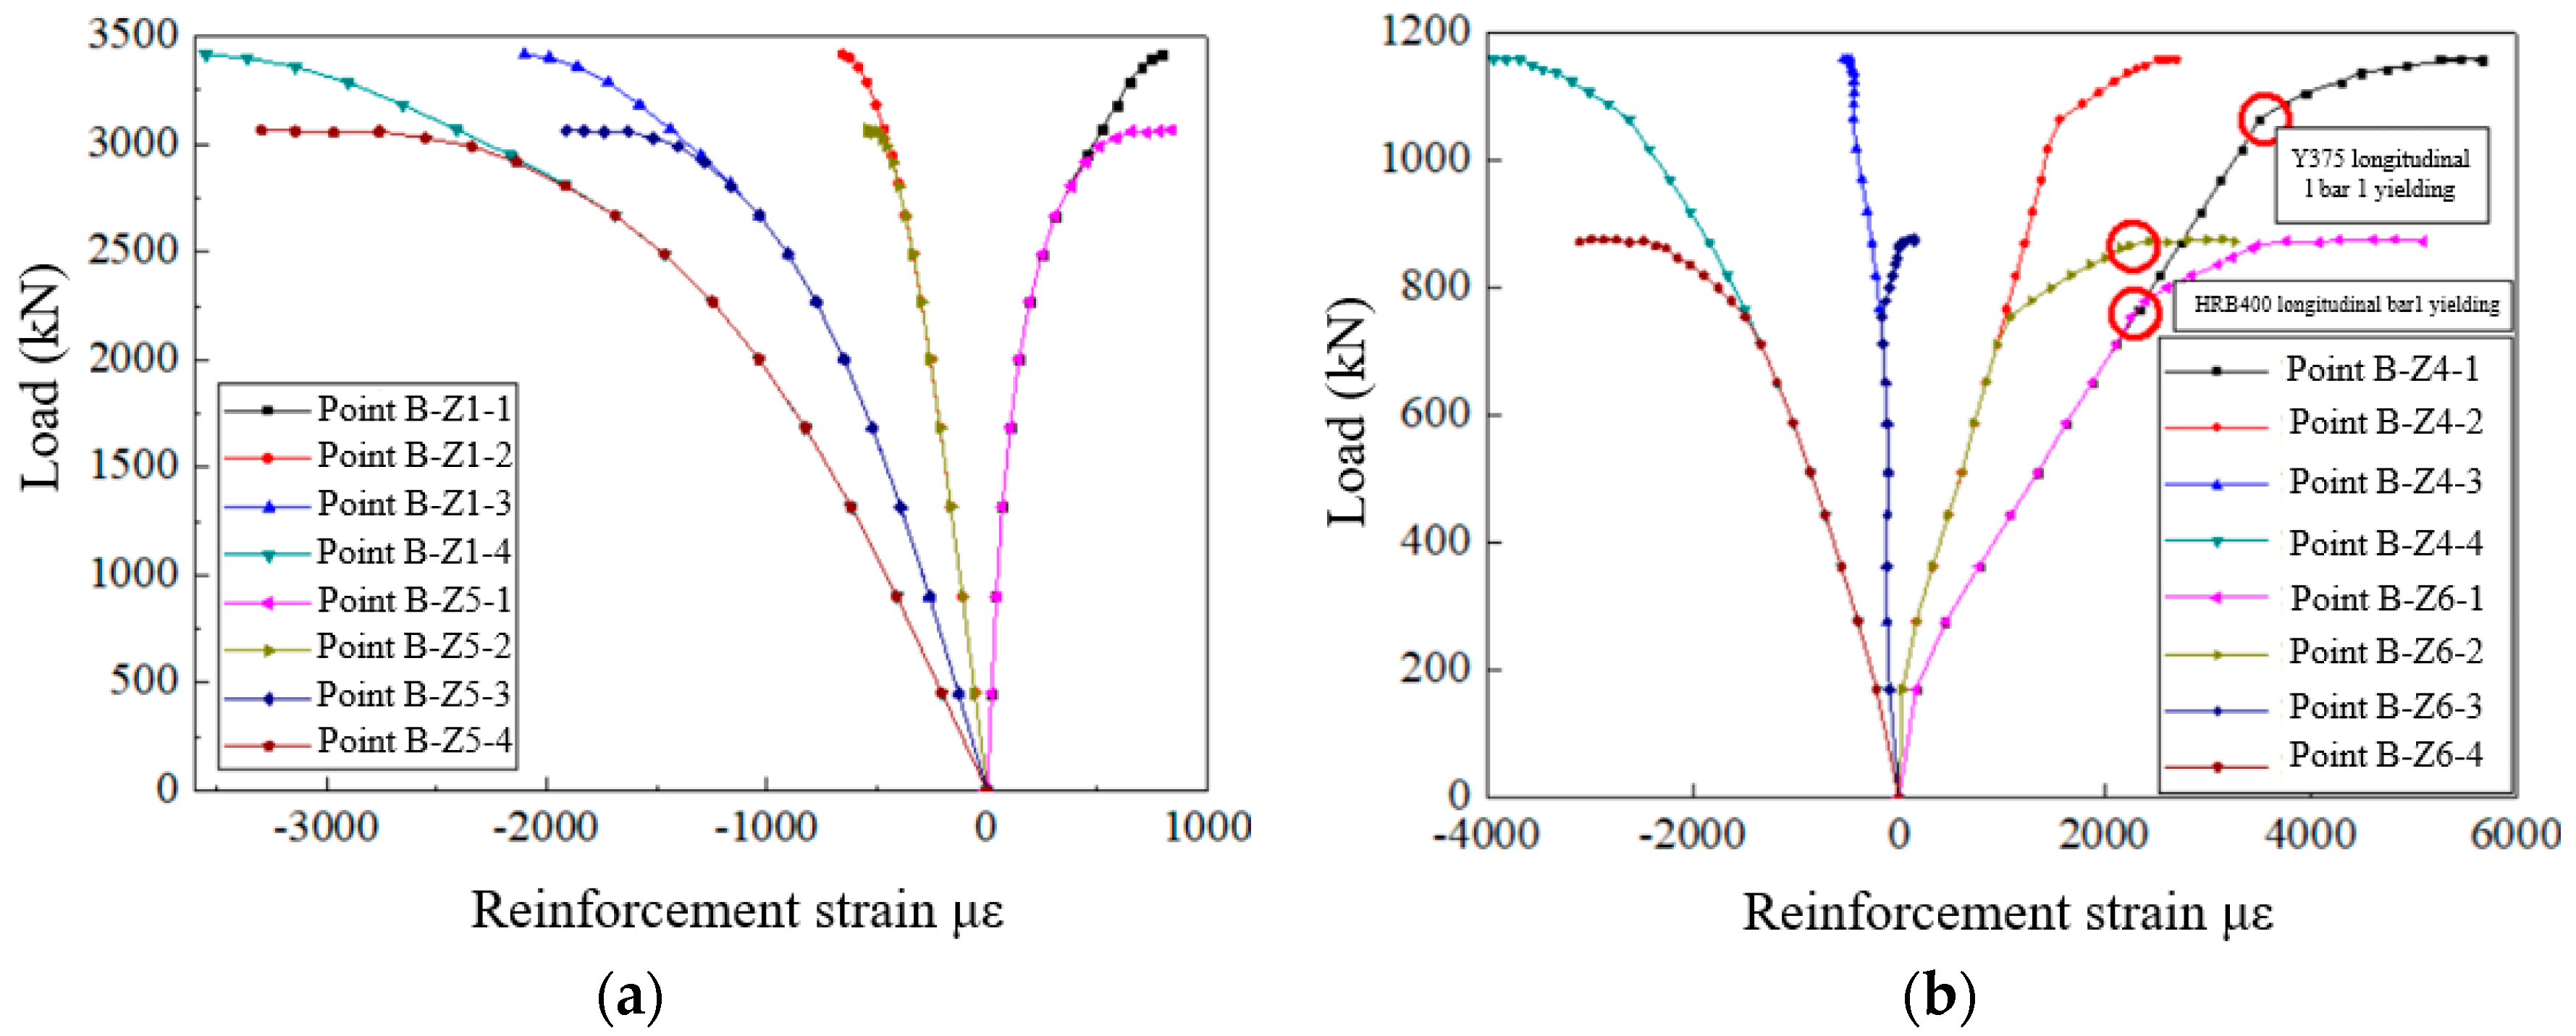
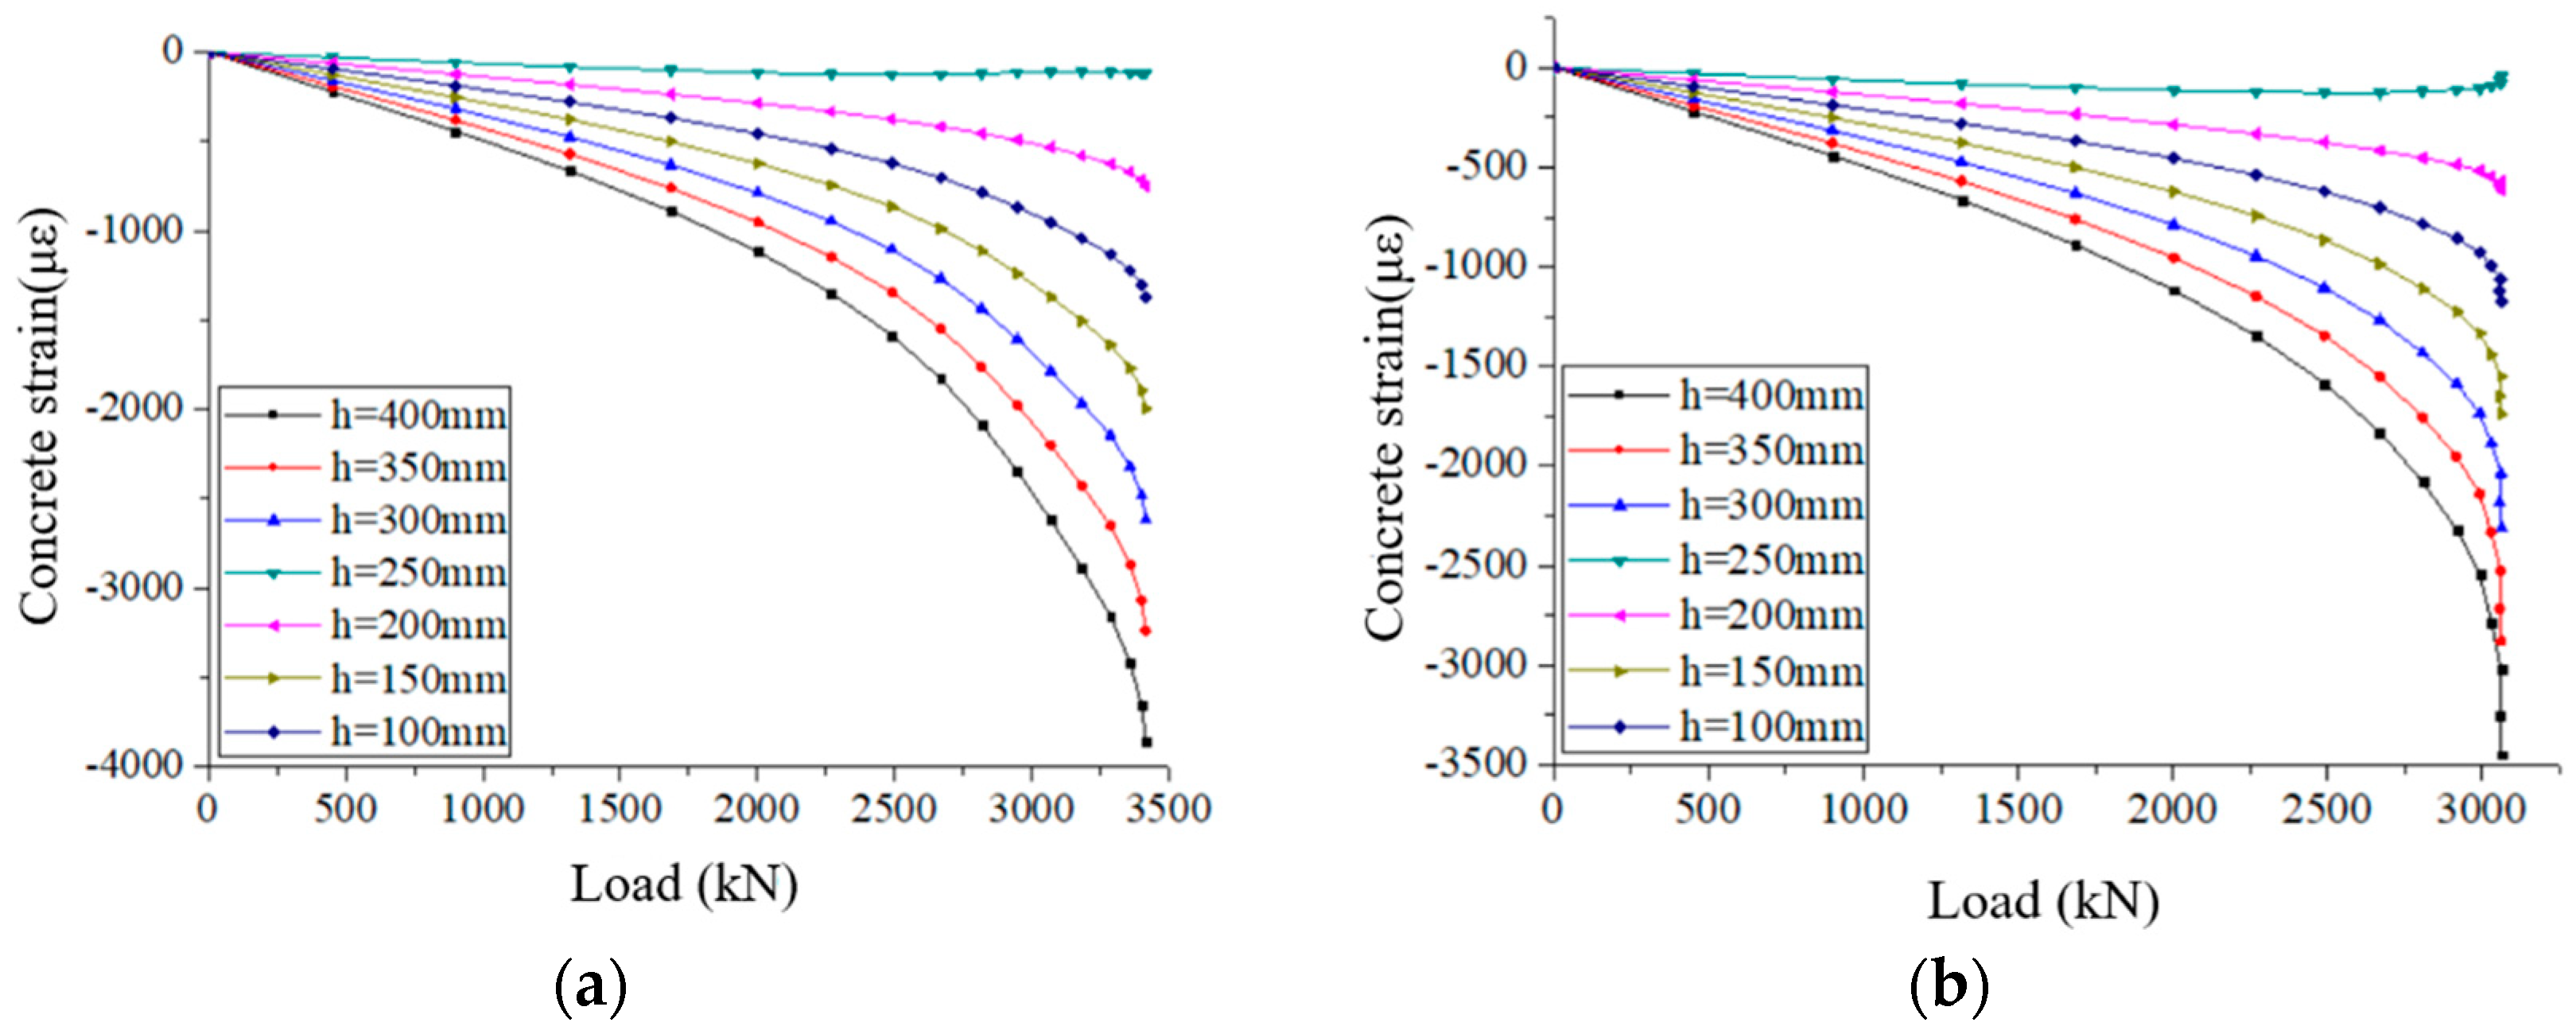
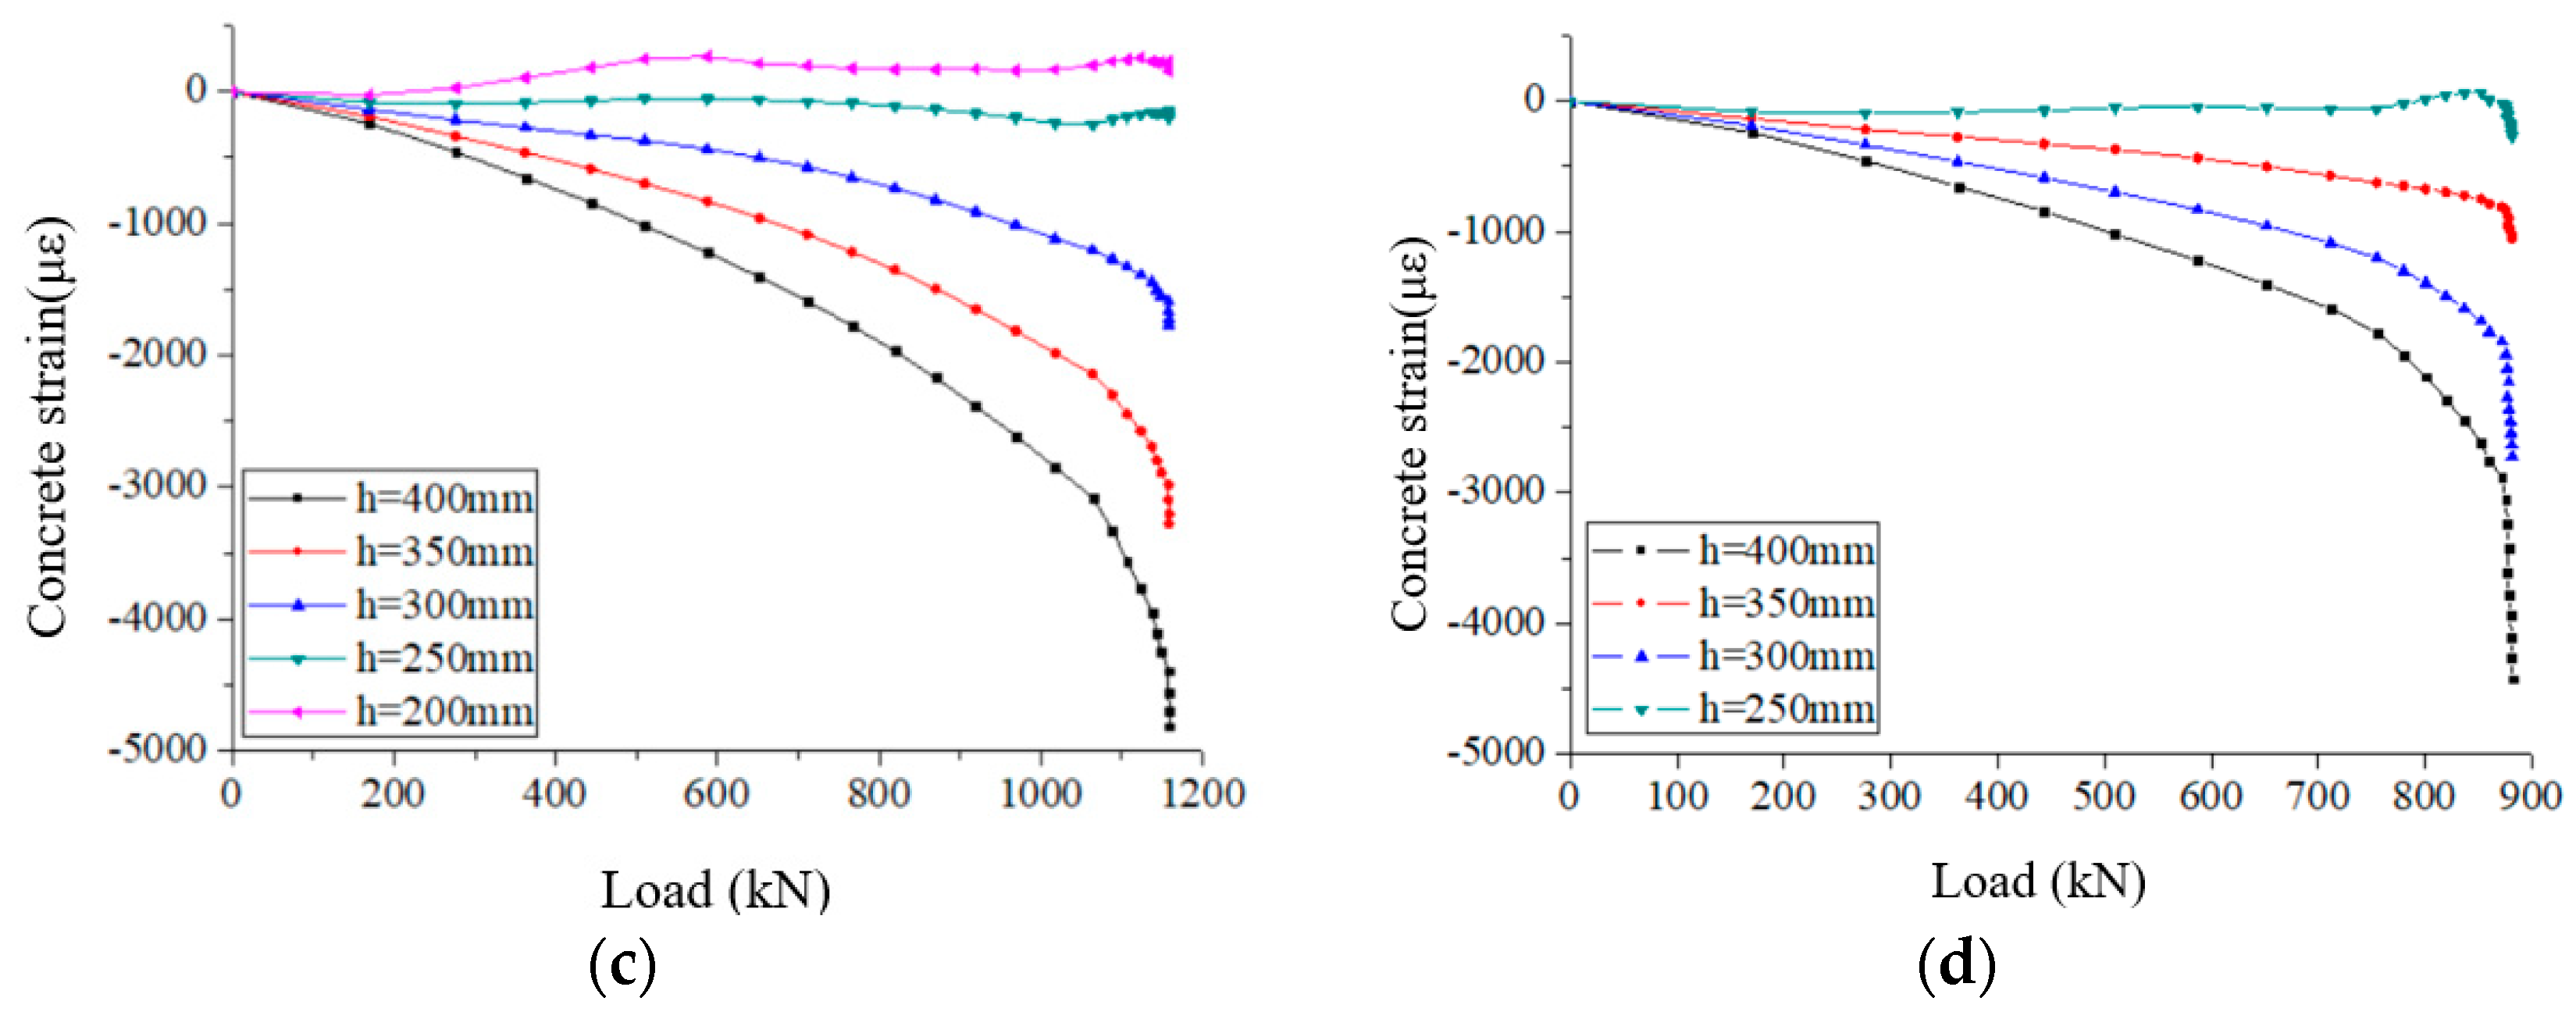
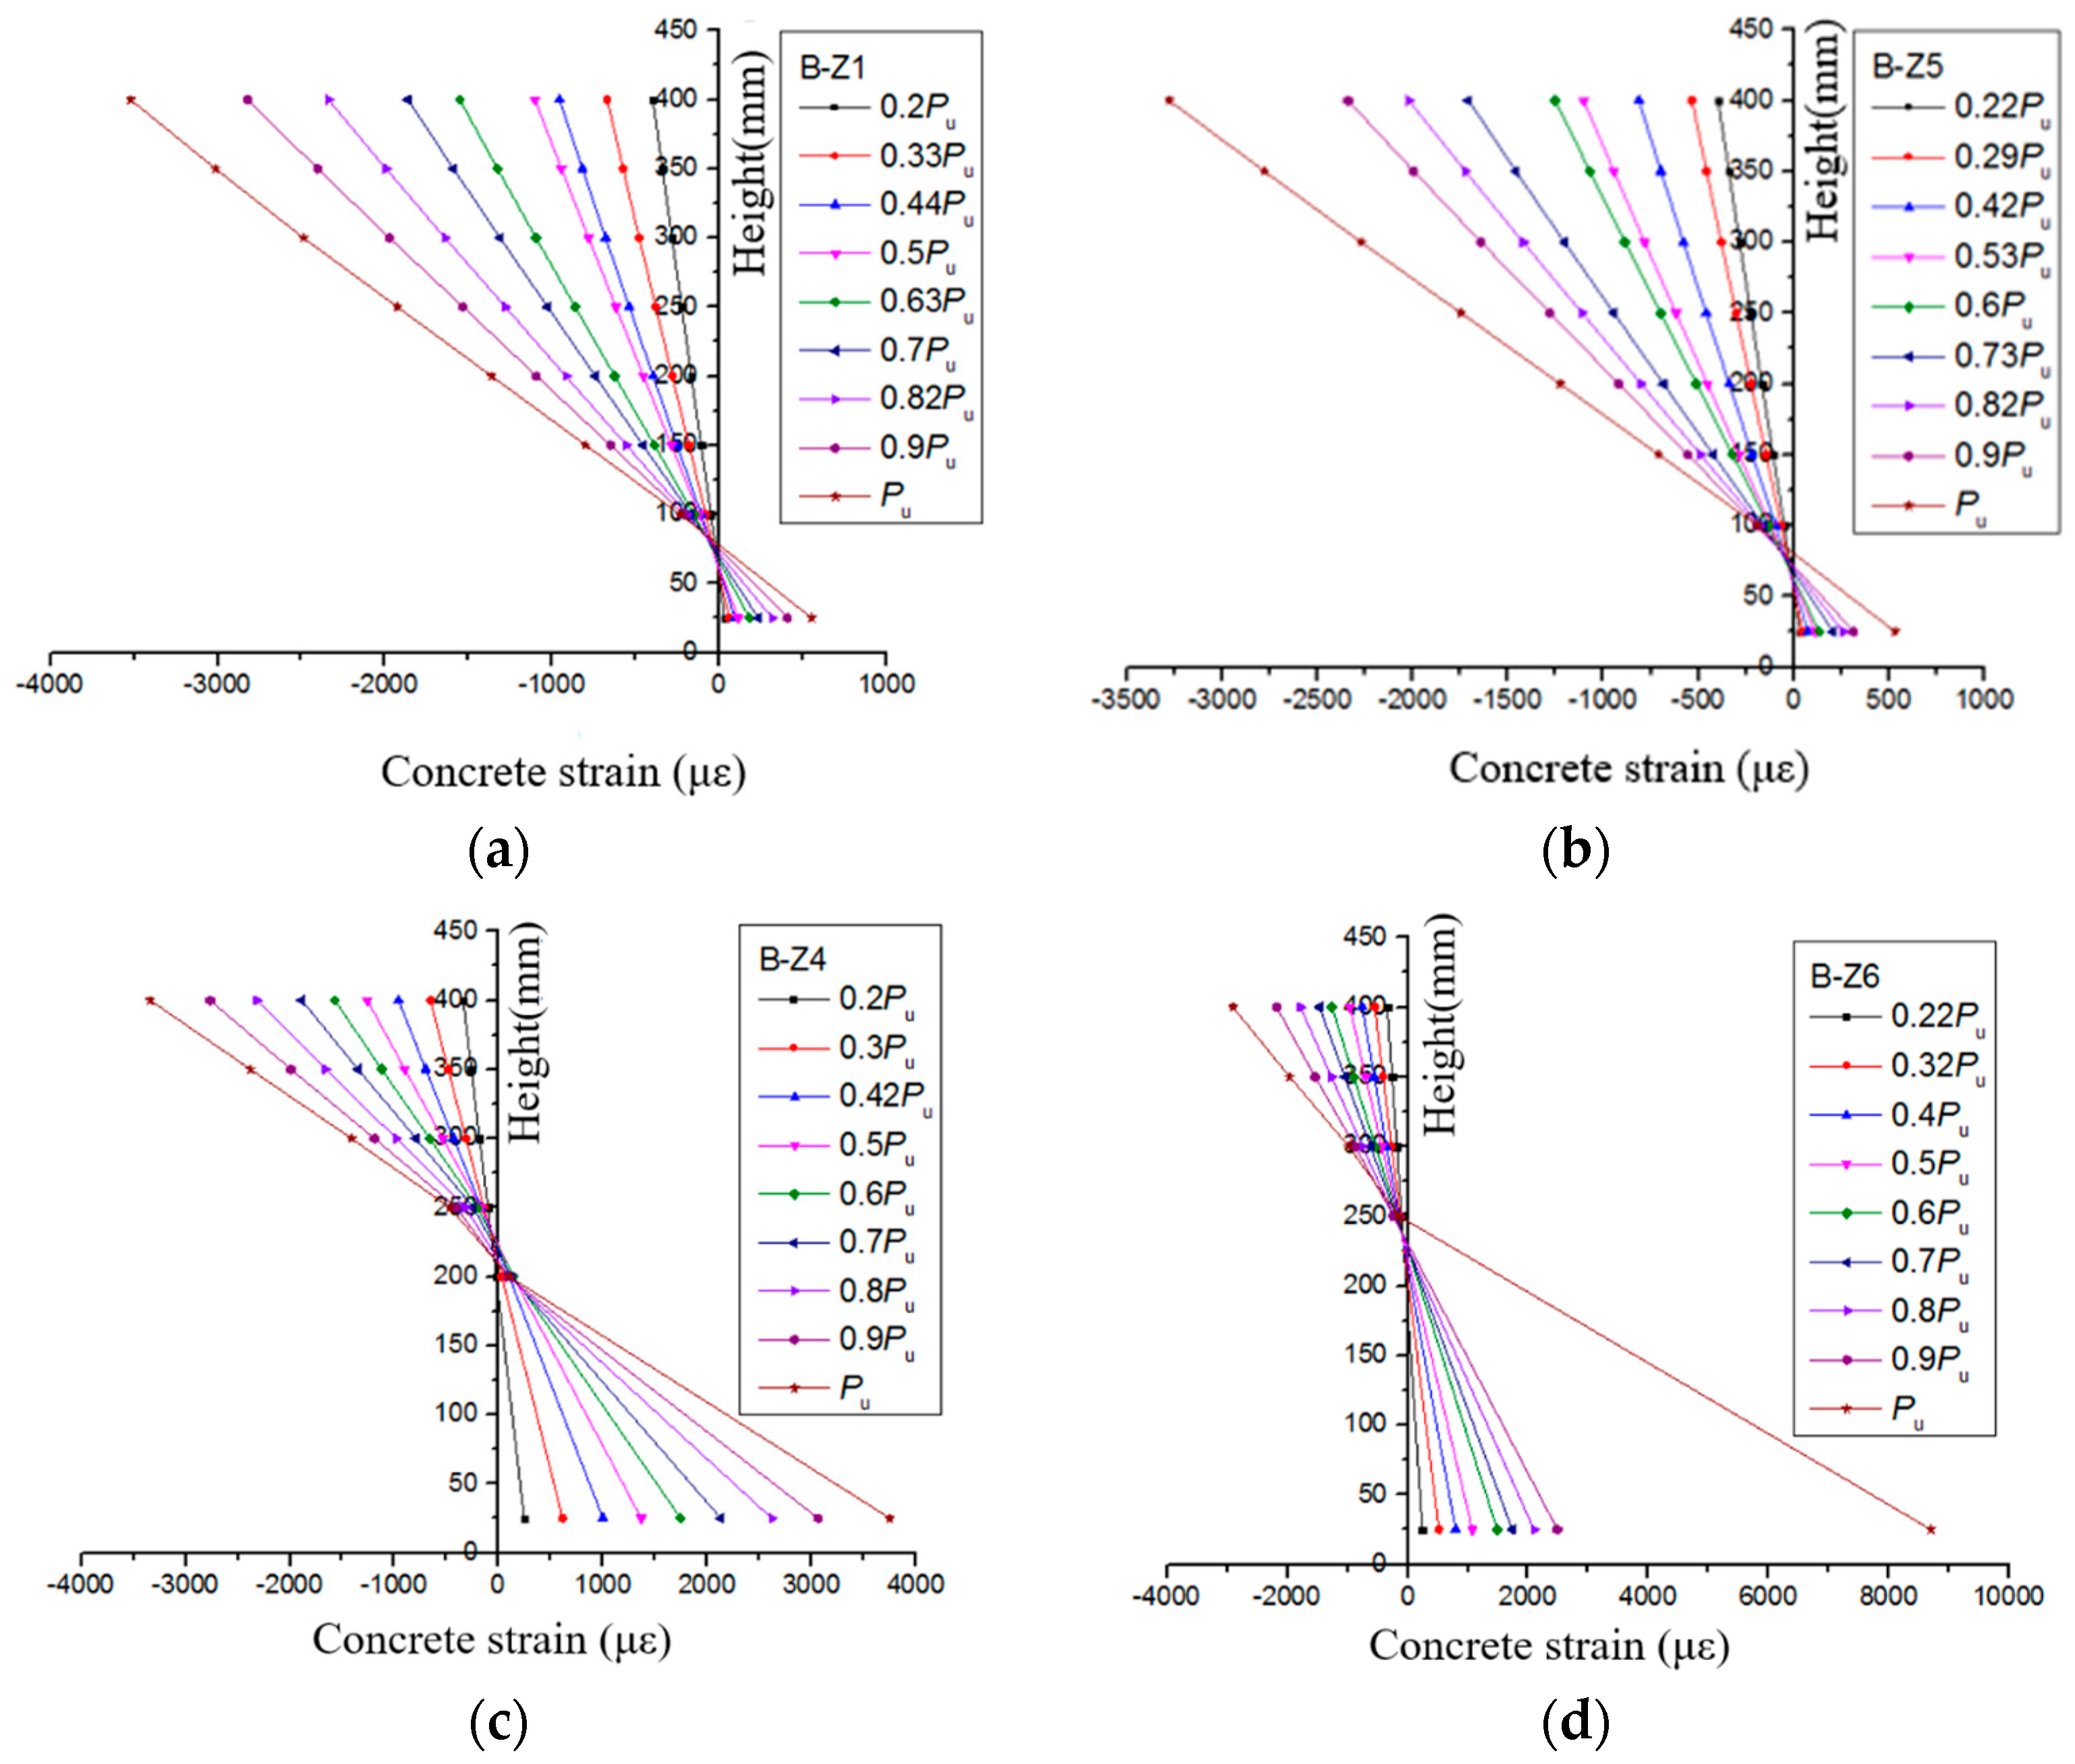
3.3.2. Load–Strain Analysis

(1) Load–strain analysis of steel bars
Reinforcement measurement points 1 to 4 were set in each row of longitudinal reinforcement of the eccentric column, as shown in Figure 14. According to the strain and load of each row of measurement points of the large and small eccentric specimens, the strain curves of the longitudinal reinforcement of the eccentric column were plotted in Figure 15, respectively. The strain curves were more consistent with the experimental phenomena. The curves could be divided into three stages: linear stage, nonlinear working stage and damage stage. The first stage was the linear stage: in the early stage of loading, with the increase in load, the strains of both the eccentric column configured with 735 MPa grade reinforcement and the eccentric column configured with HRB400 steel reinforcement showed linear growth, the strain growth rate was also basically the same, and the elastic performance was good. The second stage was the nonlinear stage: horizontal cracks appeared far from the loading end and extended continuously. The curve change was nonlinear. The third stage was the damage stage: when the ultimate load was about to be reached, the strain grew faster by a smaller magnitude and the curve tended to grow horizontally.
The performance of high-strength reinforcement in concrete was as follows. In B-Z1, small eccentric damage occurred, the ultimate state compressive longitudinal reinforcement 4 compressive strain reached 0.0035, and yielding occurred. While the strain of the tensile reinforcement was small and did not reach yielding, the specimen suffered compressive brittle damage. Small eccentric damage occurred in B-Z5, the ultimate state longitudinal reinforcement 4 compressive strain reached 0.0033, and yielding occurred. While the strain of the tensile reinforcement was small and did not reach yield, the specimen suffered brittle damage under pressure. Specimen B-Z4 suffered large eccentric damage when the specimen reached the ultimate state, the longitudinal reinforcement 1 strain exceeded 0.0037, and yielding occurred. When the longitudinal reinforcement 1 just increased to the yielding load, the longitudinal reinforcement 4 compressive strain was about 0.0024, the compressive strain was small and did not yield. As the load continued to increase, the strain of longitudinal reinforcement 1 increased at a faster rate until the longitudinal reinforcement yielded on the compressed side away from the loading point, the concrete crushed, and the specimen underwent ductile damage. The B-Z6 specimen suffered large eccentric damage when the specimen reached the ultimate state, and yielded when the longitudinal reinforcement 1 tensile strain was higher than 0.002. When the longitudinal reinforcement 1 just increased to yielding load, the longitudinal reinforcement 4 compressive strain was about 0.0016, and the compressive strain was small and unyielding. As the load increased, longitudinal reinforcement 3 and longitudinal reinforcement 1 reached yield almost simultaneously, the concrete crushed and the specimen underwent ductile damage. The comparison of the load–longitudinal reinforcement strain curves from B-Z1 and B-Z5 showed that the higher the strength of longitudinal reinforcement, the higher the bearing capacity, the greater the stiffness in the nonlinear phase, and the greater the ultimate compressive strain of compressed longitudinal reinforcement. From the comparison of B-Z4 and B-Z6 load–longitudinal reinforcement strain curves, it can be seen that the higher the strength of longitudinal reinforcement, the higher the bearing capacity, the smaller the height of the compressive zone, the more difficult it was for the tensile longitudinal reinforcement to yield, and the greater the strain of the tensile longitudinal reinforcement and compressive longitudinal reinforcement when the ultimate load was reached. From the comparison of B-Z1 and B-Z4 load–longitudinal strain curves, it can be seen that the smaller the eccentric distance, the lower the bearing capacity and the greater the stiffness. When other conditions were kept constant, the ultimate tensile and compressive strains of the longitudinal reinforcement were positively correlated with the eccentricity distance.
(2) Load–strain analysis of concrete
Figure 16 plots the variation curve of the concrete compressive strain at the middle section of the eccentric column during the loading process. It can be seen that when the loading started, the compressive strain was approximately linearly related to the load, and the farther away from the left end of the column, the faster the strain grew. Continuing to load, cracks appeared on the side far from the loading point, the concrete withdrew from working in concert, and the curve exhibited nonlinearity. Approaching the ultimate load, the strain growth accelerated, and when the ultimate state was reached, the compressive strain exceeded 0.0033. The corresponding curves of B-Z1 and B-Z5 were the concrete compressive strain curves with the same eccentricity distance and different strengths of longitudinal reinforcement. It can be seen that the higher the strength of the longitudinal reinforcement, the higher the bearing capacity and the higher the concrete compressive strain. B-Z1 and B-Z4 corresponded to the concrete compressive strain curves with the same longitudinal reinforcement strength and different eccentric distances. The larger the eccentricity, the lower the bearing capacity and the larger the concrete compressive strain. Compared with the reinforcement strain curves shown in Figure 15, it can be seen that the magnitude of concrete compressive strain remained basically the same as the value of longitudinal reinforcement compressive strain at a similar location.
The strain variation of the concrete along the section height is described as follows. In order to verify the flat section hypothesis, the strain magnitude and distribution of concrete in the middle of the column under different loads and heights were measured by setting measurement points at different heights of the cross-section. The strain distribution of concrete along the height of the specimen section under different loads is shown in Figure 17 (where the concrete strains on the tensile side are the strains of the tensile reinforcement). From the figure, it can be seen that the strain distribution law of the mid-span section of the 735 MPa grade eccentric column was similar to that of the ordinary HRB400 eccentric column in terms of force performance, which was in line with the assumption of flat section, and the greater the longitudinal load, the closer the neutral axis was to the compressed side.

4. Theoretical Analysis

4.1. Calculation Method for Bearing Capacity of Concrete Columns Reinforced with Grade 735 MPa High-Strength Steel Bars under Eccentric Compression

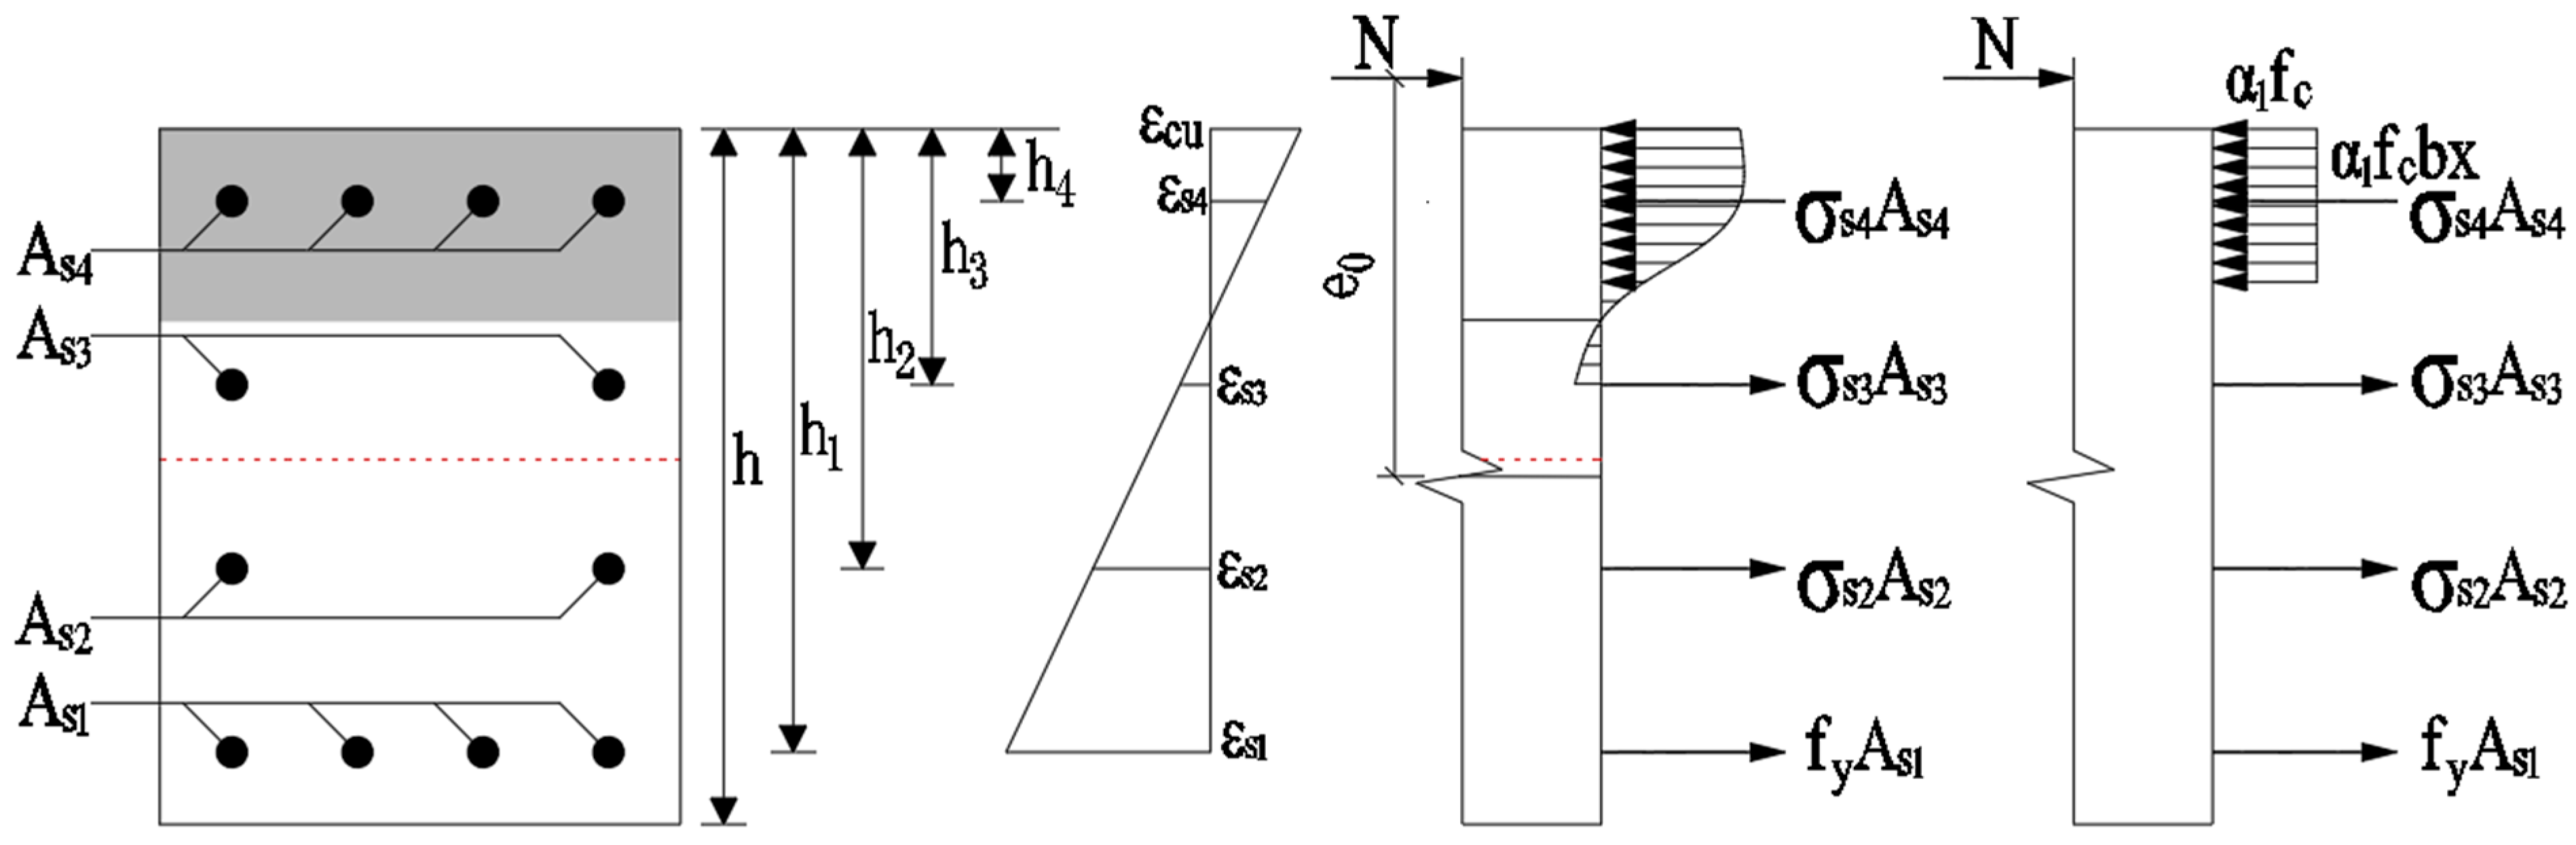
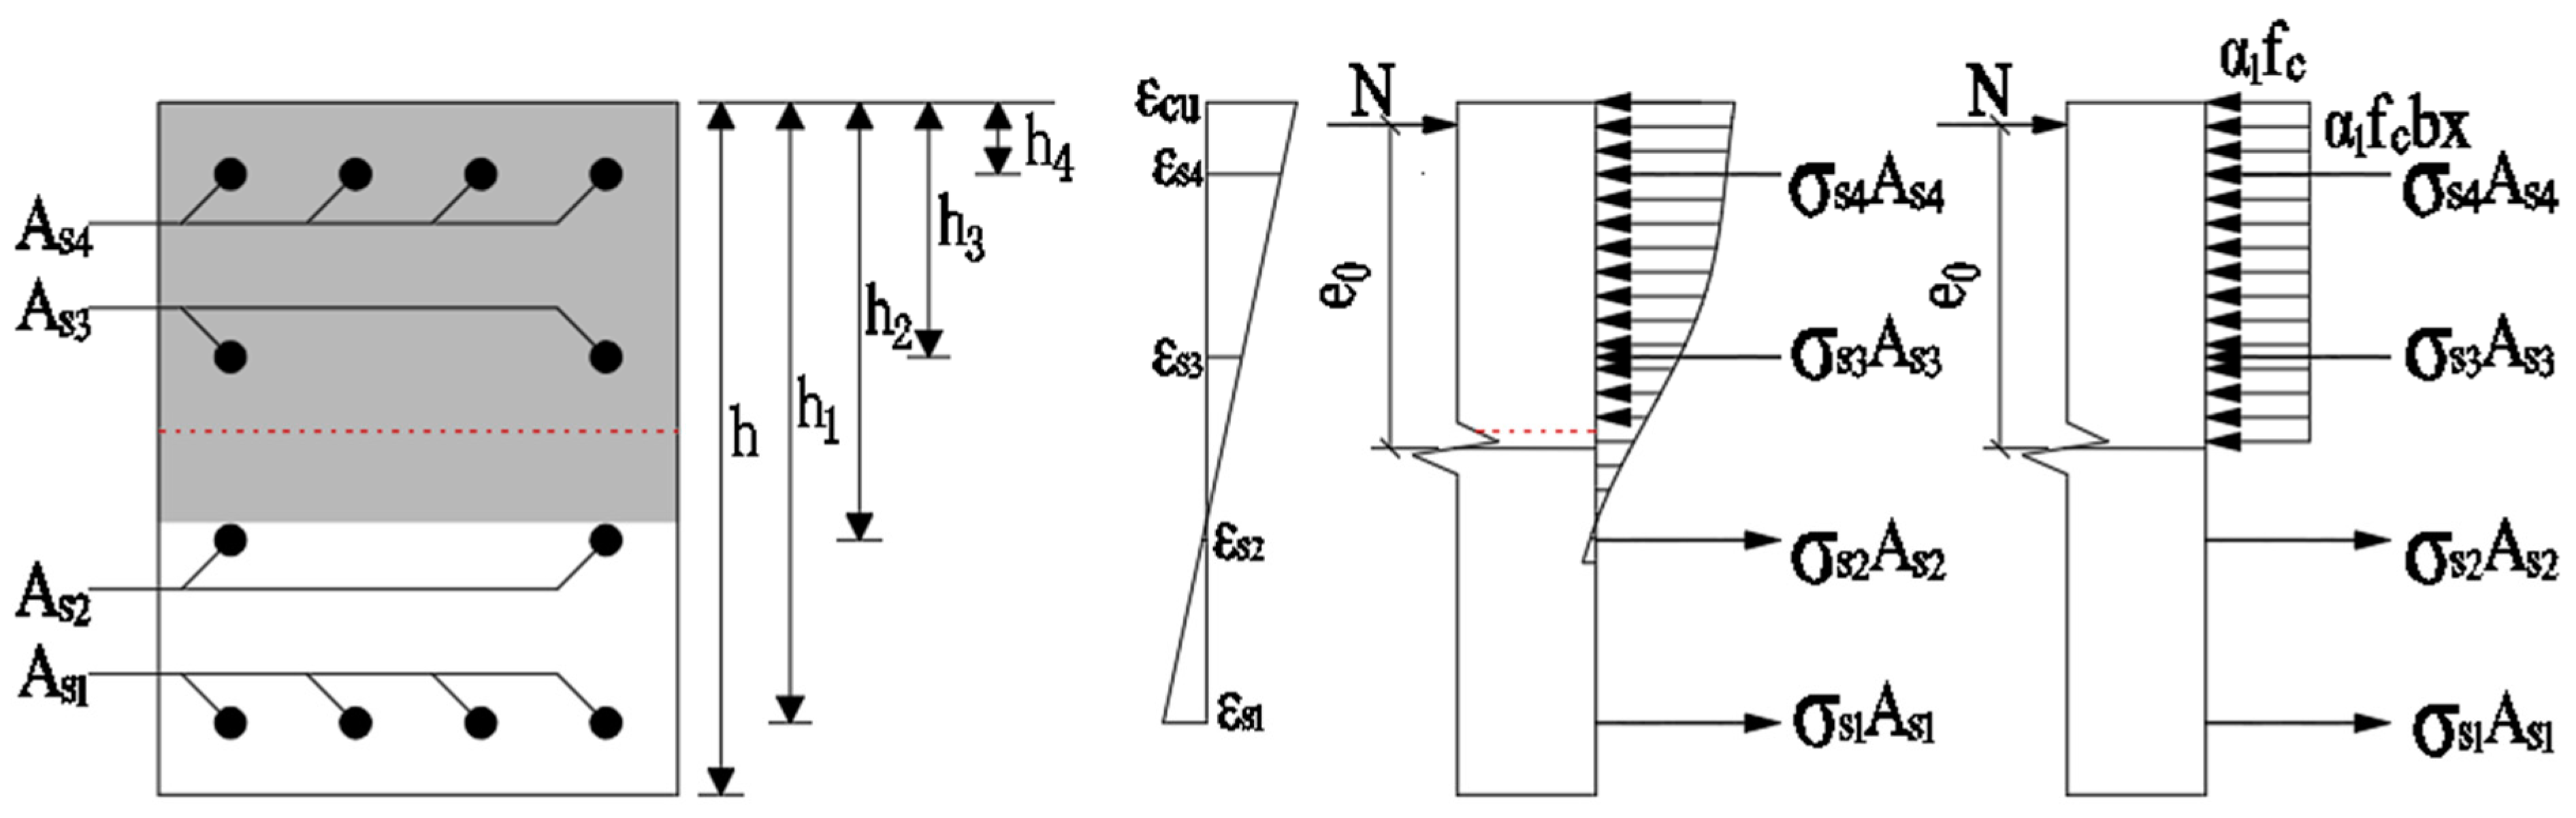
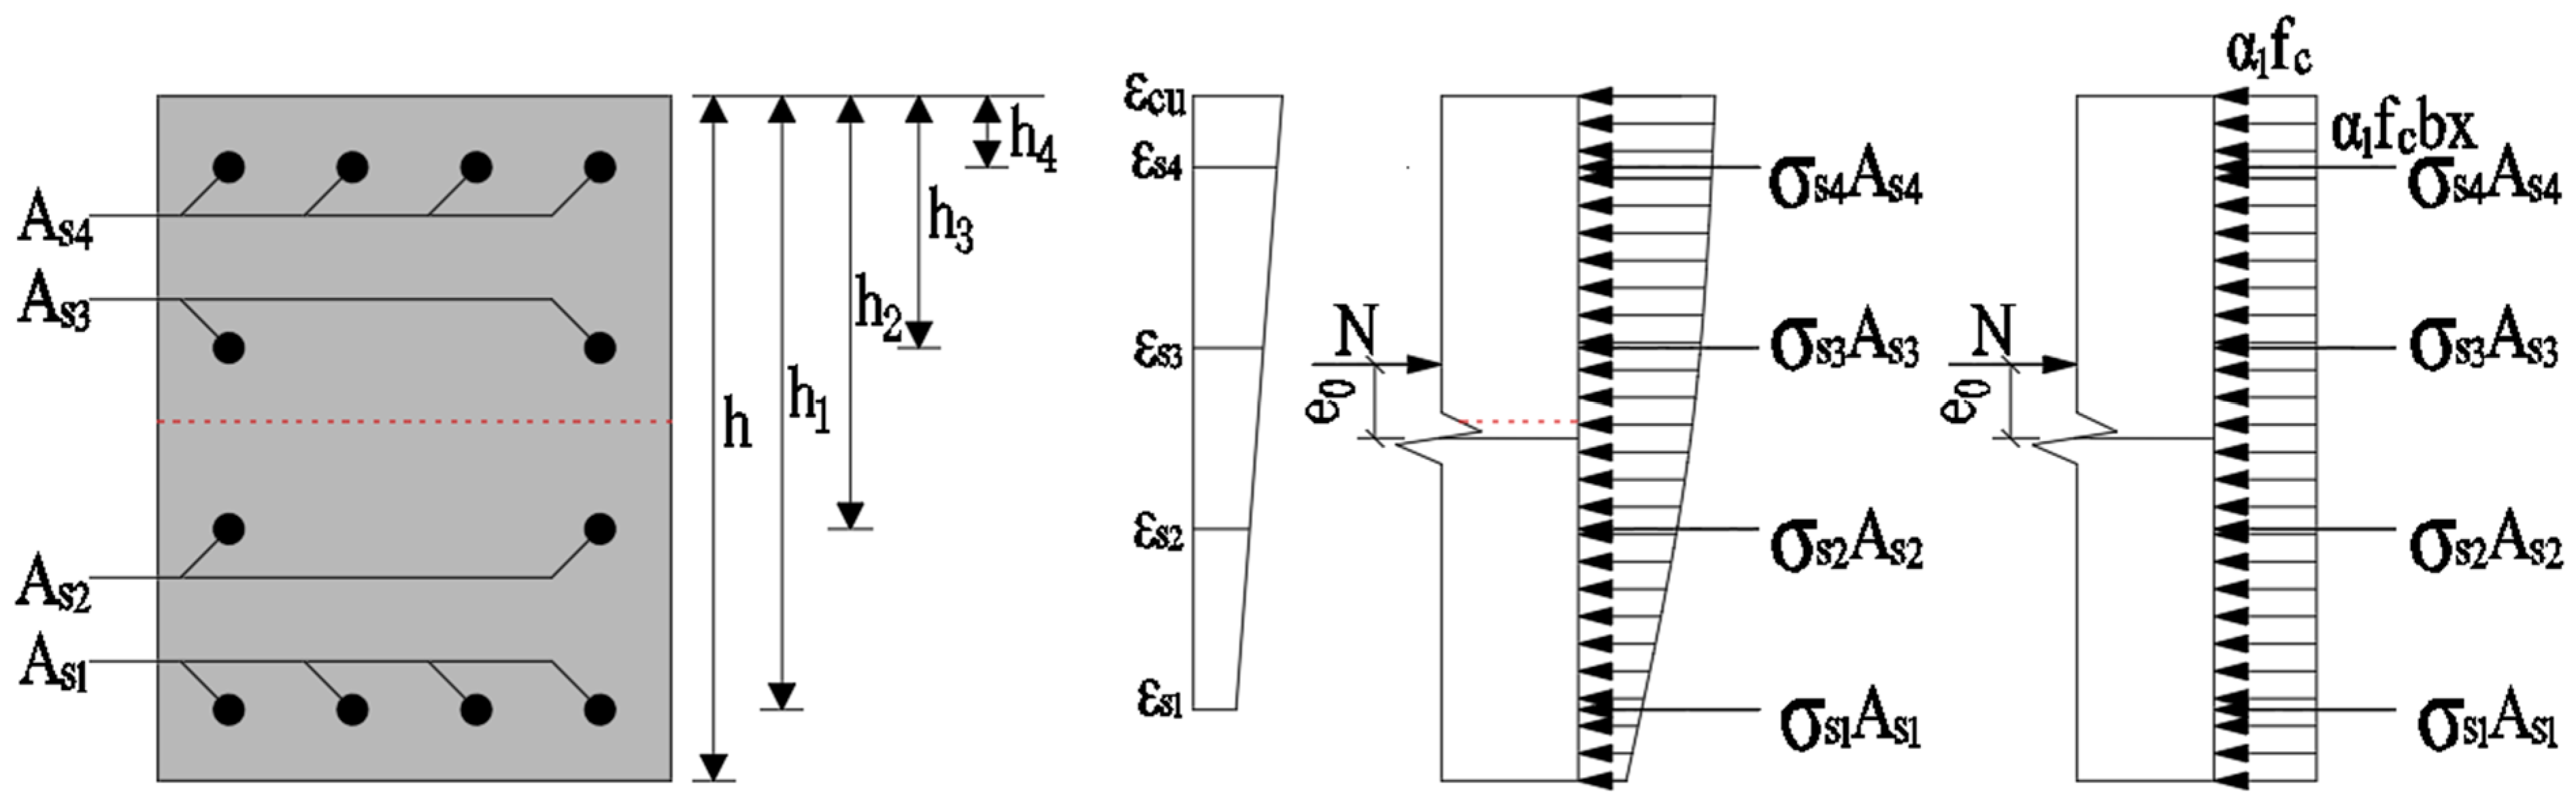
4.1.1. Equivalent Rectangular Stress Map Method

The rectangular stress diagram coefficient is defined in the Code for Design of Concrete Structures (GB50010-2010) [3] as: when the concrete strength grade is not greater than C50, the value of α is 1.0, and the value of β is 0.80. When the concrete strength grade is equal to C80, the value of α is 0.94, and the value of β is 0.74. When the concrete strength grade is greater than C50 and less than C80, the coefficients α and β are determined by linear interpolation. The ultimate compressive strain of concrete is assumed to be 0.0033.

4.1.2. P-δ Effect

Since lateral bending occurs when the specimen is tested under eccentrical compressive loads, the second-order effect of axial pressure in the deflected rod needs to be considered. The concrete structure design code (GB50010-2010) [3] uses the Cmδns method. By considering the effect of second-order effects through two parameters, Cm and ηns, the adjusted bending moment M is:
M = C m η ns M 2 ,   C m η ns 1.0
C m = 0.7 + 0.3 M 1 M 2
η ns = 1 + 1 1300 ( M 2 / N + e a ) / h 0 ( l c h ) 2 ξ c
ξ c = 0.5 f c A N
where Cm is the moment correction coefficient at the column end of the specimen, when Cm is less than 0.7, take 0.7. ηns is the moment increase coefficient. M1 is the section moment at both ends of the eccentric specimen, M2 is the larger absolute value. The eccentrical compressive column in this test, M1 = M2 = Ne0, e0 is the initial eccentric distance. N is the axial compression corresponding to M2; ea is the additional eccentric distance, its value is taken as the larger value between 20 mm and 1/30 of the maximum size of the section in the eccentric direction; lc is the calculated length of the specimen; h0 is the effective height of the section; and ξc is the curvature correction coefficient of the section, when the calculated value is greater than 1.0, the value of ξc is 1.0.
The specification (GB50010-2010) [3] provides that the eccentrical compressive specimen with symmetrical cross-section in the plane of the bending moment, when the bending moment ratio M1/M2 in the same major axis direction is not greater than 0.9, and the axial compression ratio is not greater than 0.9, if the slenderness ratio of the specimen meets lc/h ≤ 5, the P-δ effect of axial compression in this direction can be disregarded. In this paper, lc/h = 4.5, therefore, P-δ effect was not considered. Due to the uncertainty of the location of the load action, the uneven quality of concrete and construction deviation, the Chinese specification (GB50010-2010) [3] considers the influence of the additional eccentricity ea. That is, ei = e0 + ea.

4.1.3. Strength Value of 735 MPa Steel Rebar in Eccentric Compression Column

According to the maximum compressive strain of concrete measured in this test, it can be learned from the figure that the maximum compressive strain of concrete measured in the eccentric compressive column of reinforced concrete of 735 MPa level exceeded 0.0033 as stipulated in the Code for the Design of Concrete Structures [3], and an increase in the ultimate compressive strain would further increase the height of the bounded compressive zone of concrete and at the same time further increase the ultimate bearing capacity of the eccentric column. However, due to a lack of sufficient data, this thesis takes the ultimate compressive strain of concrete as 0.0033, according to the Code for the Design of Concrete Structures [3].
(1) Stress value of reinforcement at tension side
When ξ < ξb, large eccentric compressive failure occurred, which was controlled by the yield of tensile reinforcement, and the tensile reinforcement stress σs = fy. It can be seen from the test that when 735 MPa steel bars were used for eccentric compressive specimens, the strength of the steel bars at the tensile side could be fully utilized. According to the partial coefficient of steel materials specified in the Code for Design of Concrete Structures (GB50010-2010) [3], it was found that the higher the yield strength of steel bars, the greater the partial coefficient. Therefore, the partial coefficient of HRB500 steel bars was appropriately expanded, and the partial coefficient of 735 MPa steel bars was taken as 1.2. Therefore, the design value of tensile strength of 735 MPa rebar in the eccentric compression specimen was fy = 735/1.2 ≈ 600 MPa, which had a large safety reserve.
When ξ > ξb, small eccentric compression failure occurred, the tensile reinforcement did not reach yield, and the reinforcement stress was σs < fy. At this time, the strain and stress of the reinforcement in the tensile area could be calculated according to the plane section assumption.
(2) Stress value of reinforcement at compression side
The eccentric compression performance of concrete columns with longitudinal reinforcement was the same as that of ordinarily reinforced concrete columns. As the longitudinal reinforcement in the compression zone, 735 MPa steel bars could reach the yield strength. The Code for Design of Concrete Structures (GB50010-2010) [3] stipulates that when the specimen is subjected to small eccentric compression, the compression longitudinal reinforcement can reach the yield strength, and the compression yield strength is used to calculate the eccentric compression bearing capacity. When the specimen is subjected to large eccentric compression, if the height of the equivalent rectangular stress diagram of the concrete compression zone x ≥ 2as’, the yield strength is also used to calculate the eccentric compression bearing capacity of the longitudinal compression reinforcement. With the increase in the yield strength of longitudinal reinforcement, the relevant calculation parameters in the calculation of eccentric load-bearing capacity also need to change. According to the plane section assumption, the compressive longitudinal reinforcement should reach yield, and the height of the compression zone xc of the concrete section should meet certain conditions: when the ultimate compressive strain of concrete εcu = 0.0033, the longitudinal reinforcement reaches yield, and the yield strain shall be taken as εy = 0.0037, which is impossible. Therefore, when the ultimate compressive strain of concrete is 0.0033, when the eccentric compressive specimen reaches the peak load, the longitudinal reinforcement at the compression side has not yet yielded. If the concrete protective layer is peeled off, the longitudinal reinforcement at the compression side will buckle and reach the yield strength.
The stress of the steel bar in the compression area σs is calculated according to the strain εs determined by the plane section assumption.
The stress of i-th layer reinforcement is:
σ s , i d = E s ε c u ( β 1 d i x 1 )
The maximum compressive stress of reinforcement close to the edge of compression zone is:
σ s = ε s E s = 1.25 x a s 1.25 x ε c u E s 660   MPa ,
According to the formula, when the height x of the concrete compressive zone is larger, the strain of the reinforcement in the outermost compressive zone is closer. In this paper, it was considered that the ultimate compressive strain of concrete in the compression zone measured by the test was greater than 0.0033, and the ultimate compressive stress of reinforcement in the compression zone was no more than 660 MPa. In this paper, based on the safety of the structure and the specimen, and taking into account the full use of the reinforcement strength to save the amount of reinforcement, it is recommended that the standard value of compressive strength of 735 MPa reinforcement be fy’ = 600 MPa. Then the design value of compressive strength of 735 MPa rebar in the eccentric compression specimen should be fy = 600/1.2 ≈ 500 MPa. The height of the equivalent rectangular stress diagram of the concrete compression zone shall meet x ≥ 3.3as’, which is close to the value of x ≥ 2as’ in the specification when calculating the compression yield of the longitudinal reinforcement based on the plane section assumption. Therefore, the eccentric compression bearing capacity of concrete specimens with 735 MPa grade longitudinal reinforcement can still be calculated according to the relevant provisions and formulas for the compression bearing capacity of the normal section of eccentric compression specimens in the Code for Design of Concrete Structures (GB50010-2010) [3]. It is only necessary to ultimate the height of the equivalent rectangular stress diagram in the concrete compression zone to x ≥ 3.3as’.

4.1.4. Analysis of Eccentric Bearing Capacity

(1) Bearing capacity calculation formula
It can be seen from the test data that the section of the concrete eccentric compression column equipped with 735 MPa high-strength reinforcement basically conformed to the plane section assumption, and its mechanical performance was similar to that of the ordinarily reinforced concrete eccentric compression specimen. The ultimate bearing capacity of the normal section of the eccentric compression specimen can be calculated according to the relevant formula in the Code for Design of Concrete Structures (GB50010-2010) [3]. Since four layers of longitudinal reinforcement were set for this batch of specimens, the iterative calculation method of design section balance equation and flat section assumption was adopted for taking the distance from the initial eccentric loading point. The calculation of section equilibrium state is shown in Figure 18, Figure 19 and Figure 20. This method mainly considers two failure modes, namely, the tensile failure of reinforcement and the compression failure of concrete. When the eccentricity is too small, the full section of the specimen will be compressed.
(a) Tensile failure-large eccentric compression
Figure 18. Cross-sectional calculation graph for large eccentric damage.
Buildings 13 00188 g018
(b) Compression damage–small eccentric compression
Figure 19. Cross-sectional calculation graph for small eccentric damage.
Buildings 13 00188 g019
Figure 20. Cross-sectional calculation graph for small eccentric damage (full section compression).
Buildings 13 00188 g020
The calculation formula is as follows:
N = 0 N u = α 1 f c b x + f y A s 1 + σ s 2 A s 2 + σ s 3 A s 3 + σ s 4 A s 4
M = 0 α 1 f c b x ( x 2 + e i h 2 ) + f y A s 1 ( e i h 2 + y 1 ) + σ s 2 A s 2 ( e i h 2 + y 2 ) + σ s 3 A s 3 ( e i h 2 + y 3 ) + σ s 4 A s 4 ( e i h 2 + y 4 ) = 0
σ s i = E s ε c u ( β 1 h i x 1 )
e i = e 0 + e a
e 0 = M N
M = C m η n s M 2
C m = 0.7 + 0.3 M 1 M 2
η n s = 1 + 1 1300 ( M 2 N + e a ) / h 0 ( l c h ) 2 ζ c
ζ c = 0.5 f c A N
where, Nu is the compressive bearing capacity; σSi is the stress of reinforcement in i-th layer; hi is the distance from the center of gravity of the longitudinal reinforcement section of the i-th layer to the compression edge of the section; Asi is the sectional area of the longitudinal reinforcement of the i-th layer; fy is the yield strength of the outermost tensile longitudinal reinforcement; α1 is the equivalent rectangular stress diagram coefficient of concrete compression zone; fc is the design value of axial compressive strength of concrete; x is the height of the concrete compression zone; fy’ is the design value of compressive strength of longitudinal compression reinforcement; e0 is the eccentricity of the axial force to the center of gravity of the section; ea is the additional eccentricity, which is the larger value between 20 mm and 1/30 of the section size in the eccentric direction; M is the design value of the bending moment of the control section, considering the P-δ effect, calculated according to formula 10; N is the design value of axial compressive load corresponding to M; Cm is the correction coefficient of the eccentricity of the end section of the specimen, which is taken as 0.7 when it is less than 0.7; ηns is the moment amplification factor; and ζC is the section curvature correction coefficient, which is taken as 1.0 when the calculated value is greater than 1.0.
(2) Verification of bearing capacity calculation formula
The measured value and calculated value of the bearing capacity of the specimen are shown in Table 4. It can be seen from Table 4 that the ratio (Nu/NGB,m) between the test value of eccentric compressive bearing capacity, and the calculated value of the code GB50010-2010 and the measured strength of materials, was 1.01~1.15, and the average value was 1.07, which indicated that the calculated bearing capacity of the 735 MPa reinforced concrete eccentric compressive specimen conformed well with the extreme ultimate load test. The ratio (Nu/NGB) between the test value of eccentric bearing capacity, and the calculated value of the code (GB50010-2010) [3] and the design strength of materials was 1.49~1.85, with an average of 1.68.
The test value and calculated value of the stress of the outermost reinforcement on the tensile side of the specimen are shown in Table 4. It can be seen from Table 4 that the ratio of the stress test value of the longitudinal reinforcement at the tension side, to the calculated value of the code GB50010-2010 [3] and the measured strength of materials (σ1/σGB,m), was 1.00~1.37, and the average value was 1.136, which indicated that the tensile strength of longitudinal reinforcement of the 735 MPa reinforced concrete eccentric compressive specimen was smaller than that of the test. With regard to the concrete compressive strain limit, according to the information provided for the tested specimens, a closely-spaced tie configuration was adopted consistently for each specimen. This would contribute to a confining pressure (passive confinement) when the column was subjected to axial load. Therefore, the measured ultimate compressive concrete strain was expected to be larger than 0.0033 (a strain limit of unconfined concrete). This was because the ultimate compressive strain of concrete is 0.0033, while the actual ultimate compressive strain of concrete is about 0.0038, resulting in the calculated stress of longitudinal reinforcement being smaller; at the same time, the stress of longitudinal reinforcement under compression was calculated to be 600 MPa, but the actual stress of longitudinal reinforcement under compression could reach 735 MPa.
In summary, from the point of view of structural or specimen safety, the design formula for the design of compressive load bearing capacity in positive section of eccentric compressive specimens in the current Code for the Design of Concrete Structures (GB50010-2010) [3] has a certain safety reserve and can be extended to 735 MPa grade high-strength reinforcement.

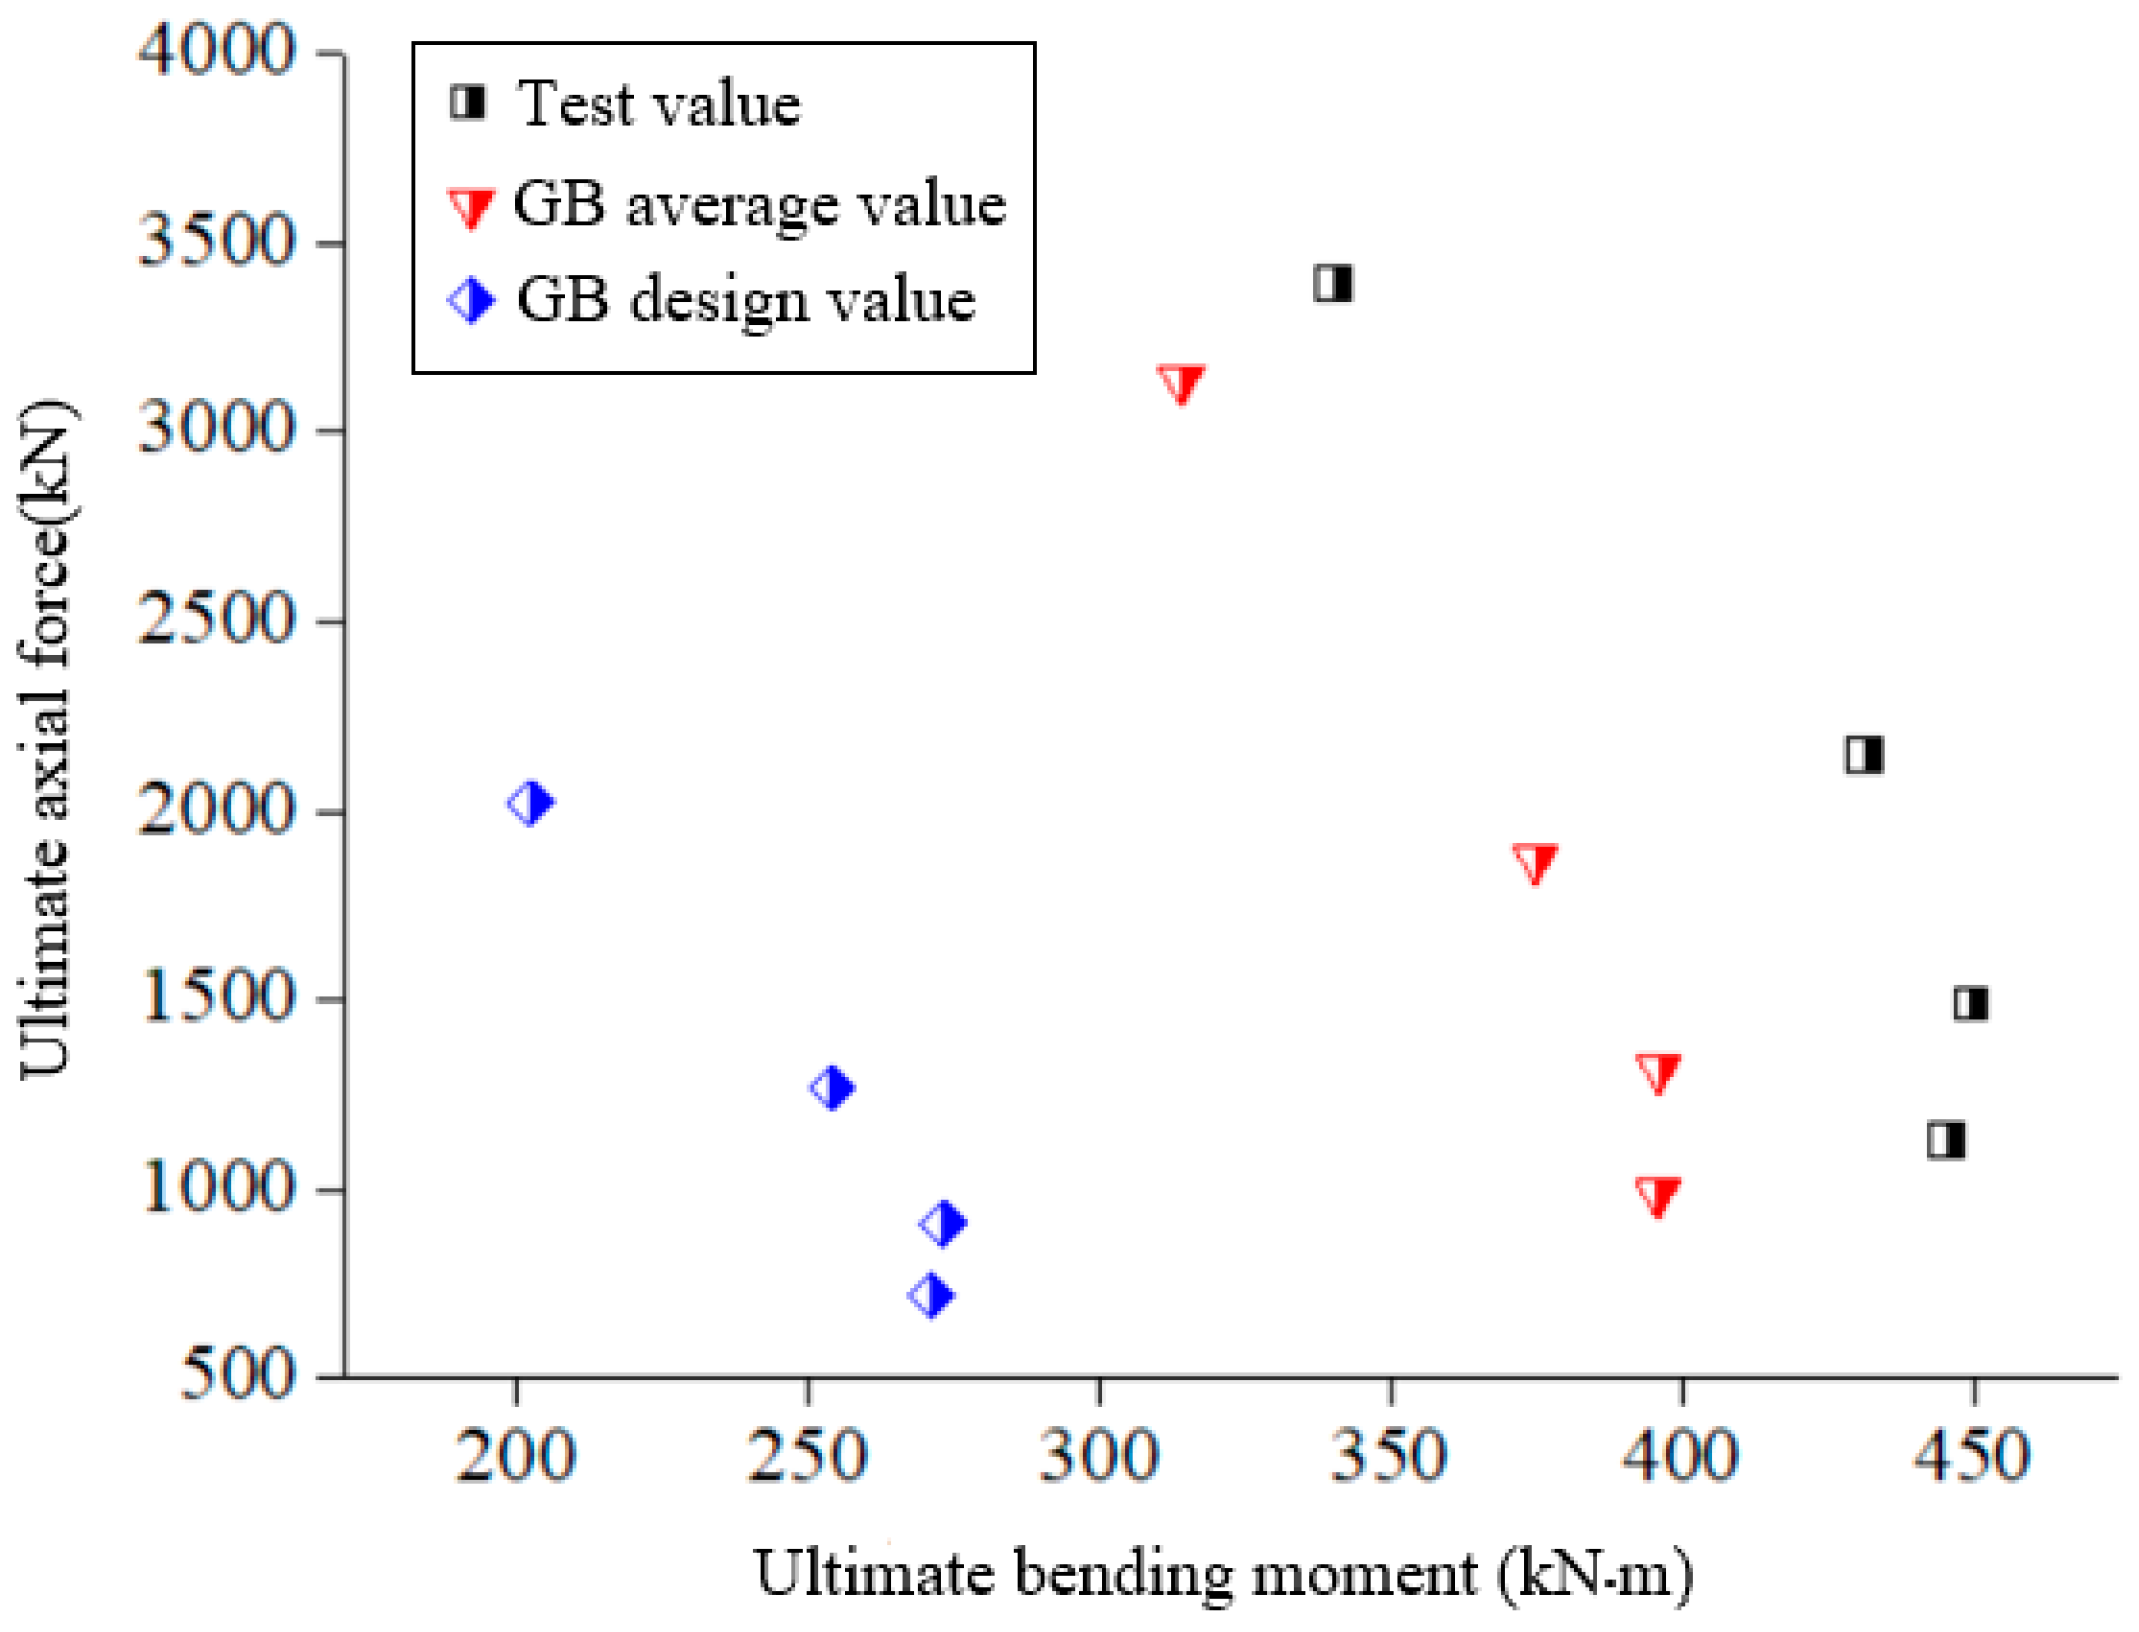
4.2. N-M Correlation Curve

(1) Analysis of the height of compression zone of 735 MPa reinforced concrete column
Table 5 and Table 6 show the comparison between the test value and the formula calculation value of the compression zone height of the eccentric compression column. In the table, x is the height of the concrete compression zone according to the concrete strain distribution along the section height, x1 and x1b are the equivalent height of the concrete compression zone and the height of the boundary concrete compression zone calculated according to the measured values of the reinforcement, and x2 and x2b are the equivalent height of the concrete compression zone and the height of the boundary concrete compression zone calculated according to the design values of the tensile strength and compressive strength of the reinforcement, respectively.
From the test analysis of the eccentric compression column, it can be seen that the height of the compression zone of the eccentric compression column obtained from the test was close to the calculated value. The calculated failure mode of specimen B-Z3 was small eccentric compression failure, while actual large eccentric compression failure occurred, which indicated that when the eccentricity is fixed, the reinforcement ratio calculated in the specification is higher, and the bearing capacity is further increased. Therefore, the calculation formula has a certain safety reserve.
(2) N-M correlation curve
Due to the small slenderness ratio of the test and simulated specimens in this paper, the additional bending moment caused by the deflection was ignored in the calculation. According to the specification, M = Ne0, the bending moment M of the midspan section of the specimen was calculated by the following steps: calculate the normal section bearing capacity N and M of the specimen according to the specification, and obtain the N-M curve of the normal section bearing capacity of the eccentric compression specimen for different initial eccentricity e0, as shown in Figure 21. In general, the standard GB50010-2010 can be used to predict the bearing capacity of the normal section of the eccentric compressive specimen with 735 MPa longitudinal reinforcement.

5. Conclusions

This paper describes the design process, loading method and damage mode of eccentric compressive experiments on concrete columns reinforced with grade 735 MPa high-strength steel bars. The eccentric distance and longitudinal reinforcement strength of the specimen were the parameters used to analyze the test mechanisms, specimen deflection, longitudinal reinforcement and concrete strain. Meanwhile, based on the compressive test study of concrete reinforced with grade 735 MPa high-strength steel bars, the relevant data were summarized and the eccentric compressive bearing capacity calculation formulae were calculated for the test specimens based on the Code for the Design of Concrete Structures (GB50010-2010) [3]. The calculated results were compared with the tests results to verify the applicability of the code formulae.
(1) According to the analysis of the test phenomenon process and the relationship curve of relevant variables, the compression process of a concrete column reinforced with grade 735 MPa high-strength steel bars could be divided into three sections—from elastic, to elastoplastic, then to ultimate state. There were two failure modes: small eccentricity failure occurred when eccentricity was small or the reinforcement ratio was large; and when eccentricity was large or the reinforcement ratio was small, small eccentricity failure occurred. The results were similar to ordinarily reinforced concrete columns;
(2) The tests focused on systematic research on eccentricity and longitudinal reinforcement strength. When eccentricity decreased, the bearing capacity increased, and the deflection and the ductility of the specimen decreased; and when the strength of longitudinal reinforcement increased, the bearing capacity increased slightly. The deflection curve of the specimen showed that the deflection curve of the eccentric compression specimen was basically symmetrical, and maximum deflection occurred at the mid-span. The deflection curve of the concrete columns reinforced with grade 735 MPa high-strength steel bars was consistent with that of ordinarily reinforced concrete columns;
(3) The concrete compressive strain exceeded 0.0033 for eccentrically compressed columns in the ultimate load condition and in different damage modes, which exceeded the ultimate compressive strain. The concrete was also observed to be crushed and damaged during the tests. The average strain in the cross-section was linearly distributed, indicating that the planar section assumption was still applicable to the eccentrically compressed concrete column reinforced with grade 735 MPa high-strength steel bars;
(4) The strain curve of longitudinal reinforcement showed that under the peak load state, when the specimen was in two failure modes of large and small eccentric compression, the tensile longitudinal reinforcement of the eccentrically compressed concrete column reinforced with grade 735 MPa high-strength steel bars could yield under the large eccentric failure mode, the compressive longitudinal reinforcement yielded before the tensile longitudinal reinforcement under the small eccentric mode, and later than the tensile longitudinal reinforcement under the large eccentric mode;
(5) The bearing capacity of eccentrically compressed specimens of 735 MPa grade reinforcement in the Code for Design of Concrete Structures (GB50010-2010) was calculated and compared with the test results, and it was found that the Chinese code has sufficient strength reserve. N-M correlation curves were plotted using the mean value of the material calculation, and it was found that the calculated values of the Chinese code were in good agreement with the test values, and the concrete structure design code could be extended to 735 MPa grade reinforcement;
(6) Since the ultimate compressive strain of concrete in the compressive zone was 0.0033 when the specimen was eccentrically compressed, reinforcement with grade 735 MPa high-strength steel bars could not give full strength when it was eccentrically compressed as compressive reinforcement, and could give full strength when it was tensile reinforcement in large eccentric tension. We used the 735 MPa grade reinforcement (fy’ = 500 MPa, fy = 600 MPa) values in the specification formula to calculate the bearing capacity, and found that the calculation results were in good accordance with the test and simulation results.

Author Contributions

Conceptualization, X.Z. and L.S.; methodology, Y.D. and X.W.; software, Y.D.; validation, X.Z., Y.D. and L.S.; formal analysis, X.W.; investigation, X.Z. and L.S.; resources, X.Z.; data curation, Y.D.; writing—original draft preparation, X.Z. and Y.D.; writing—review and editing, X.Z. and L.S.; visualization, X.W.; supervision, X.Z.; project administration, X.Z., Y.D. and L.S.; funding acquisition, X.Z. All authors have read and agreed to the published version of the manuscript.

Funding

This research was funded by National Natural Science Foundation of China with grant number 52127814.

Data Availability Statement

Data is contained within the article.

Conflicts of Interest

The authors declare no conflict of interest.

References

  1. Liu, L.; Li, H.; Zhang, Y.; Li, Q. Experimental study on the force performance of 500 MPa class reinforced concrete eccentric compressed columns. J. Zhengzhou Univ. 2007, 2, 30–34. [Google Scholar]
  2. Xu, Y.; Wang, M.; Geng, S.; Yang, Y.; Wang, Y.; Wang, J. Experimental study on the bearing capacity of HRBF500 reinforced concrete large eccentric compressed columns. J. Qingdao Univ. Technol. 2010, 31, 48–53. [Google Scholar]
  3. GB/50010-2010; Code for Design of Concrete Structures. China Architecture & Building Press: Beijing, China, 2015. (In Chinese)
  4. Wang, J. Experimental Study and Analysis of 500MPa Class High Strength Reinforced Concrete Compressed Columns. Master’s Thesis, Qingdao University of Technology, Qingdao, China, 2010. [Google Scholar]
  5. Zhuo, W.; Huang, L.; Chen, Z.; Ye, G.; Huang, X. Force performance tests and finite element simulation analysis of 500 MPa grade reinforced self compacting concrete biased short columns. Eng. Mech. 2018, 35, 197–206. [Google Scholar]
  6. Cui, Y.; Wang, J.; Shen, Q.; Ding, Z.; Shao, X. Experimental study on the deflection performance of hot-rolled ribbed high-strength reinforced concrete columns of 635 MPa class. Ind. Constr. 2020, 50, 11–19. [Google Scholar]
  7. Cui, Y.; Wang, J.; Shen, Q.; Ding, Z.; Li, Z. Analysis of axial compression performance and calculation of bearing capacity of short columns with hot-rolled ribbed high-strength reinforced concrete of grade 635 MPa. Ind. Build. 2020, 50, 1–10. [Google Scholar]
  8. Xiong, H.; Ge, J. Analysis and experimental study of parameters for calculating crack width of high-strength reinforced flexural members. Build. Struct. 2020, 50, 18–23. [Google Scholar]
  9. Xiong, H.; Ge, J.; Feng, J.; Bai, J. Experimental study of mechanical properties of HRB600 steel bars and their serviceability. J. Build. Struct. 2018, 39, 387–393. [Google Scholar]
  10. Xiong, H.; Mu, F.; Ge, J.; Yu, S.; Feng, J. Experimental study on flexural performance of reinforced concrete beams of 600 MPa class. Ind. Constr. 2018, 48, 77–82. [Google Scholar]
  11. Xiong, H.; Feng, J.; Sun, C.; Ge, J. Comparison of Crack Calculation in Different Codes for 600 MPa Class High Strength Reinforced Concrete Beams. In Proceedings of the Industrial Construction 2018 Annual National Academic Conference, Beijing, China, 20 June 2018. [Google Scholar]
  12. Han, Y.; Guan, H.C.; Li, Z. Experimental Study on Seismic Performance of HRB400 Reinforced Concrete Columns under Cyclic Loading. Adv. Mater. Res. 2011, 287–290, 703–707. [Google Scholar] [CrossRef]
  13. Alavi-Dehkordi, S.; Mostofinejad, D.; Alaee, P. Effects of high-strength reinforcing bars and concrete on seismic behavior of RC beam-column joints. Eng. Struct. 2019, 183, 702–719. [Google Scholar] [CrossRef]
  14. Ding, Y.; Wu, D.; Su, J.; Li, Z.-X.; Zong, L.; Feng, K. Experimental and numerical investigations on seismic performance of RC bridge piers considering buckling and low-cycle fatigue of high-strength steel bars. Eng. Struct. 2020, 227, 111464. [Google Scholar] [CrossRef]
  15. GB/T50081-2002; Standard for Test Method of Mechanical Properties on Ordinary Concrete. China Architecture & Building Press: Beijing, China, 2016. (In Chinese)
Figure 1. Size and reinforcement diagram of eccentric compressive column.
Buildings 13 00188 g001
Figure 2. Construction process of the specimens: (a) skeleton of steel reinforcement, (b) finished concrete column.
Buildings 13 00188 g002
Figure 3. Stress–strain curve of longitudinal reinforcement: (a) stress–strain curve of NPR735 longitudinal reinforcement, (b) stress–strain curve of HRB400 longitudinal reinforcement.
Buildings 13 00188 g003
Figure 4. Test setup: (a) sketch of loading frame, (b) concrete column on test frame.
Buildings 13 00188 g004
Figure 5. Arrangement of reinforcement strain measuring points.
Buildings 13 00188 g005
Figure 6. Arrangement of concrete strain measuring points.
Buildings 13 00188 g006
Figure 7. Failure mode of concrete column under compression with eccentricity of 100 mm: (a) B-Z1 using NPR735 rebars, (b) B-Z5 using HRB400 rebars.
Buildings 13 00188 g007
Figure 8. Compression resulting in local buckling of NPR735 rebars in specimen BZ-1.
Buildings 13 00188 g008
Figure 9. Failure mode of concrete column reinforced with grade 735 MPa high-strength steel bars, under large eccentric compression: (a) failure mode, (b) distribution of cracks in the tension zone.
Buildings 13 00188 g009
Figure 10. Failure mode of concrete column reinforced with grade HRB400 high-strength steel bars, under large eccentric compression.
Buildings 13 00188 g010
Figure 11. Lateral deflection curves: (a) specimen BZ1, e = 100 mm, NPR735; (b) specimen BZ2, e = 200 mm, NPR735; (c) specimen BZ3, e = 300 mm, NPR735; (d) specimen BZ4, e = 400 mm, NPR735; (e) specimen BZ5, e = 100 mm, HRB400; (f) specimen BZ6, e = 400 mm, HRB400.
Buildings 13 00188 g011
Figure 12. Load–deflection curve (eccentricity).
Buildings 13 00188 g012
Figure 13. Load–deflection curve (longitudinal reinforcement strength).
Buildings 13 00188 g013
Figure 14. Location of reinforcement measuring points.
Buildings 13 00188 g014
Figure 15. Load–longitudinal reinforcement strain curve: (a) small eccentric columns (B-Z1 and B-Z5), (b) large eccentric columns (B-Z4 and B-Z6).
Buildings 13 00188 g015
Figure 16. Load–concrete strain curve (h is the distance from the left end of the column): (a) specimen B-Z1, (b) specimen B-Z5, (c) specimen B-Z4, (d) specimen B-Z6.
Buildings 13 00188 g016aBuildings 13 00188 g016b
Figure 17. Concrete strain distribution along the height of section: (a) specimen B-Z1, (b) specimen B-Z5, (c) specimen B-Z4, (d) specimen B-Z6.
Buildings 13 00188 g017
Figure 21. Comparison of experimental and calculated values.
Buildings 13 00188 g021
Table 1. Design parameters of eccentric compressive columns.
SpecimenConcrete GradeEccentricity
(mm)
Longitudinal ReinforcementStirrup
Steel TypeNumber of ReinforcementsSteel TypeSpace of Stirrups
B-Z1C35100NPR73512Φ18NPR735Φ8@100
B-Z2C35200NPR73512Φ18NPR735Φ8@100
B-Z3C35300NPR73512Φ18NPR735Φ8@100
B-Z4C35400NPR73512Φ18NPR735Φ8@100
B-Z5C35100HRB40012Φ18HRB400Φ8@100
B-Z6C35400HRB40012Φ18HRB400Φ8@100
Table 2. Concrete mechanical performance indicators.
Concrete GradeEs (GPa)fcu,m (MPa)fc,m (MPa)
C353.5343.9533.4 ± 5
Table 3. Indexes for mechanical properties of reinforcement.
Steel TypeDiameter (mm)Es (N/mm2)fy (N/mm2)fcu (N/mm2)
NPR 73582.06 × 105764.281165.7
182.06 × 105740.76975.2
HRB40082.06 × 105522.67623.43
182.06 × 105478.67588.56
Table 4. Comparison results of test and calculation of eccentric compression column.
Specimene0
(mm)
Failure ModeNu
(kN)
NGB,m
(kN)
NGB
(kN)
Nu/NGB,mNu/NGBσ1
(MPa)
σGB,m
(MPa)
σ1/σGB,m
B-Z1100Small ecc.3397.63138.82021.31.08 1.68 147.64 118.84 1.24
B-Z2200Small ecc.2154.21873.21269.51.15 1.70 480.71 439.62 1.09
B-Z3300Small ecc.1496.71319.4910.11.13 1.64 728.88 615.47 1.18
B-Z4400Large ecc.1134.29897201.15 1.58 735.29 735.00 1.00
B-Z5100Small ecc.3071.23036.31660.91.01 1.85 140.52 125.72 1.12
B-Z6400Large ecc.892.4849.2560.51.05 1.59 480.64 400.00 1.20
Note: e0 is the initial eccentricity; Nu is the test value and simulation value of eccentric compressive bearing capacity; NGB,m, NGB are the eccentric bearing capacity calculated according to the Code GB50010-2010 and the average value of materials, and the code GB50010-2010 and the design value of materials, respectively; σ1 is the experimental value of the outermost tensile reinforcement; and σGB is the stress of longitudinal reinforcement calculated according to the average value of materials in GB50010-2010.
Table 5. Comparison between test results and calculation results using tested material properties.
Spec.e0
(mm)
Tested ResultsCalculated Results
x (mm)Failure Modex1 (mm)x1b (mm)Failure Mode
B-Z1100305Small eccentricity242.7137.1Small eccentricity
B-Z2200185Small eccentricity171.9137.1Small eccentricity
B-Z3300135Large eccentricity148.2137.1Small eccentricity
B-Z4400115Large eccentricity134.6137.1Large eccentricity
B-Z5100280Small eccentricity241.7161.9Small eccentricity
B-Z6400150Large eccentricity115.5161.9Large eccentricity
Table 6. Comparison between test results and calculation results using nominal material properties.
Spec.e0
(mm)
Tested ResultsCalculated Results
x (mm)Failure Modex1 (mm)x1b (mm)Failure Mode
B-Z1100305Small eccentricity249150Small eccentricity
B-Z2200185Small eccentricity180.4150Small eccentricity
B-Z3300135Large eccentricity157150Small eccentricity
B-Z4400115Large eccentricity139.5150Large eccentricity
B-Z5100280Small eccentricity249185.3Small eccentricity
B-Z6400150Large eccentricity114.8185.3Large eccentricity
Disclaimer/Publisher’s Note: The statements, opinions and data contained in all publications are solely those of the individual author(s) and contributor(s) and not of MDPI and/or the editor(s). MDPI and/or the editor(s) disclaim responsibility for any injury to people or property resulting from any ideas, methods, instructions or products referred to in the content.

