
Seismic Design Codes—Key Elements for Seismic Risk Perception and Reduction in Europe
Department of Reinforced Concrete Structures, Technical University of Civil Engineering Bucharest, Bd. Lacul Tei 122-124, Sector 2, 020396 Bucharest, Romania
Buildings 2023, 13(1), 158; https://doi.org/10.3390/buildings13010158
Submission received: 9 December 2022
/
Revised: 28 December 2022
/
Accepted: 6 January 2023
/
Published: 8 January 2023
(This article belongs to the Topic Resilient Civil Infrastructure)
Abstract
:Earthquakes are one of the most costly and deadliest natural disasters. This perspective paper presents a discussion focused on the role of seismic design codes in risk perception and seismic risk reduction in Europe. The seismic design codes are a key component for both the design of new buildings, as well as for the vulnerability assessment of existing ones. The impact of seismic design codes on seismic risk reduction is discussed using as case-study countries, Italy, Turkey, Greece, and Romania, which according to the recent European seismic risk model 2020 have the largest expected mean annual losses due to earthquakes. The evaluation of the seismic exposure of the four countries shows that from the entire population of more than 170 million people, about 130 million live in buildings designed using no or low level seismic design. The mean annual expected losses due to earthquakes are of the order of 0.1–0.2% of the national GDP. Moreover, the mean annual death probability due to earthquakes is 10−6 which represents a risk level not of great concern to the average people. However, large earthquakes in Europe from the past 50 years have produced losses in excess of 10 billion Euros and several hundred thousand affected people. A solution for a better communication of seismic risk in order to increase seismic risk perception might be to provide exceedance probabilities of specific macroseismic intensity levels for time frames of 10 or 20 years, instead of annual values. Macroseismic levels from past earthquakes might be used in order to have a better understanding of the results and should complement the seismic design maps. In addition, in the case of seismic vulnerability, the use of simple terms (e.g., inhabitable or uninhabitable) along with their associated occurrence probabilities in the same time frame as in the case of the seismic hazard, might be a solution. Financial incentives for seismic strengthening, as well as a clear definition of an earthquake-prone building are also very useful for increasing seismic risk perception.

1. Introduction
Earthquakes represent one of the deadliest and most costly natural disasters in the world and in Europe, as well. The EM-DAT database [1] assigns a number of more than 70,000 deaths, more than 13 million affected people and losses in excess of 250 billion Euros caused by earthquakes that have occurred in Europe in the period from 1950–2022. Corbane et al. [2] state that earthquakes are the second costliest natural disaster in Europe for the period 1980–2014, after heatwaves.
From the point of view of the design of new buildings, and from the point of view of seismic assessment and the strengthening of existing buildings, seismic codes are key elements. An increase in the level of seismic safety of new buildings is observed for each new generation of design codes. The taxonomy employed for the evaluation of seismic exposure uses the evolution of seismic design codes as a key parameter for differentiating among various buildings. Finally, the seismic risk metrics can be significantly reduced by increasing the level of seismic safety of buildings. It is suggested by some authors that the adoption and enforcement of seismic design codes is the most important factor to reduce earthquake community risk [3]. A benefit-to-cost analysis has shown that there are many areas in Europe where seismic design is highly cost-beneficial in terms of life-cycle costs, compared to no seismic provisions [4].
In this context, a technical description of the provisions given in the seismic design codes from US, New Zealand, Japan, Chile, Mexico and Canada, as well as in Eurocode 8 [5] can be found in [6]. In the European context, the most important documents from the past 20 years for the seismic design and assessment of structures and which have been adapted nationally by a significant number of countries are Eurocode 8—Part 1 for new buildings [5] and Eurocode 8—Part 3 for existing buildings [7].
In this study, the issue of seismic design codes and their impact on seismic risk reduction in Europe is focused on the four countries which have the largest mean annual losses according to the recent European seismic risk model 2020 [8], namely Italy, Turkey, Greece and Romania. The average annual seismic losses from these four countries account for more than 70% of the total losses at the European level. The seismic risk metrics are evaluated and discussed in the context of seismic risk perception. Finally, solutions for improving the communication of seismic hazards and risks to the general public in order to enhance seismic risk perception are proposed based on the experience of Japan, and using simpler, more comprehensible metrics.
2. The Evolution of Seismic Design
This section focuses on the seismic design evolution from the four countries, as well as on the major earthquakes affecting these countries and their impact. The evolution of the seismic design in each country is marked by significant changes occurring as a result of a local damaging earthquake, or as a result of the practice accumulated nationally and/or worldwide. The study of Crowley et al. [9] highlights the years marking the changes in seismic design practice in European countries. The years in which the first moderate-level or high-level seismic design code was enforced in each country, as well as the major damaging earthquakes occurring in the past 50 years are given in Table 1. It can be observed from Table 1, that a significant number of earthquakes occurring in the past 50 years has affected the four selected countries. In addition, it can be seen that, at least for the case of Romania and Greece, the changes of the seismic design codes from low-code to moderate-code occurred after significant earthquakes (1977 Vrancea earthquake and 1978 Thessaloniki earthquake). In the case of Italy and Turkey, the change from the low seismic design code generation to a moderate seismic design code occurred some 10–15 years later [9].
According to the EM-DAT database [1], the earthquakes which have generated the largest number of affected people and economic losses in the past 50 years for the four countries being analyzed are: (1) the Irpinia 1980 earthquake in Italy, (2) the Kocaeli 1999 earthquake in Turkey, (3) the Vrancea 1977 earthquake in Romania, and (4) the Thessaloniki 1978 and (5) Athens 1999 earthquakes in Greece.
3. Seismic Exposure
The recent European seismic risk model provides an evaluation at the European level of the seismic losses for residential, industrial and commercial buildings [8]. The exposure model employed for the development of the European seismic risk model is presented in the study of Crowley et al. [10].
All the data used in the exposure analyses shown in this section is publicly available for download [11]. Table 2 shows the number of buildings, population and the total replacement costs of the buildings in the four selected countries [11], as well as the gross domestic product (GDP) evaluated by the World Bank [12]. Based on the data given in Table 2, it can be observed that the ratio between the total replacement costs of the building stock and the GDP of each individual country is in all cases larger than unity and can be as high as 3 (in the case of Greece).
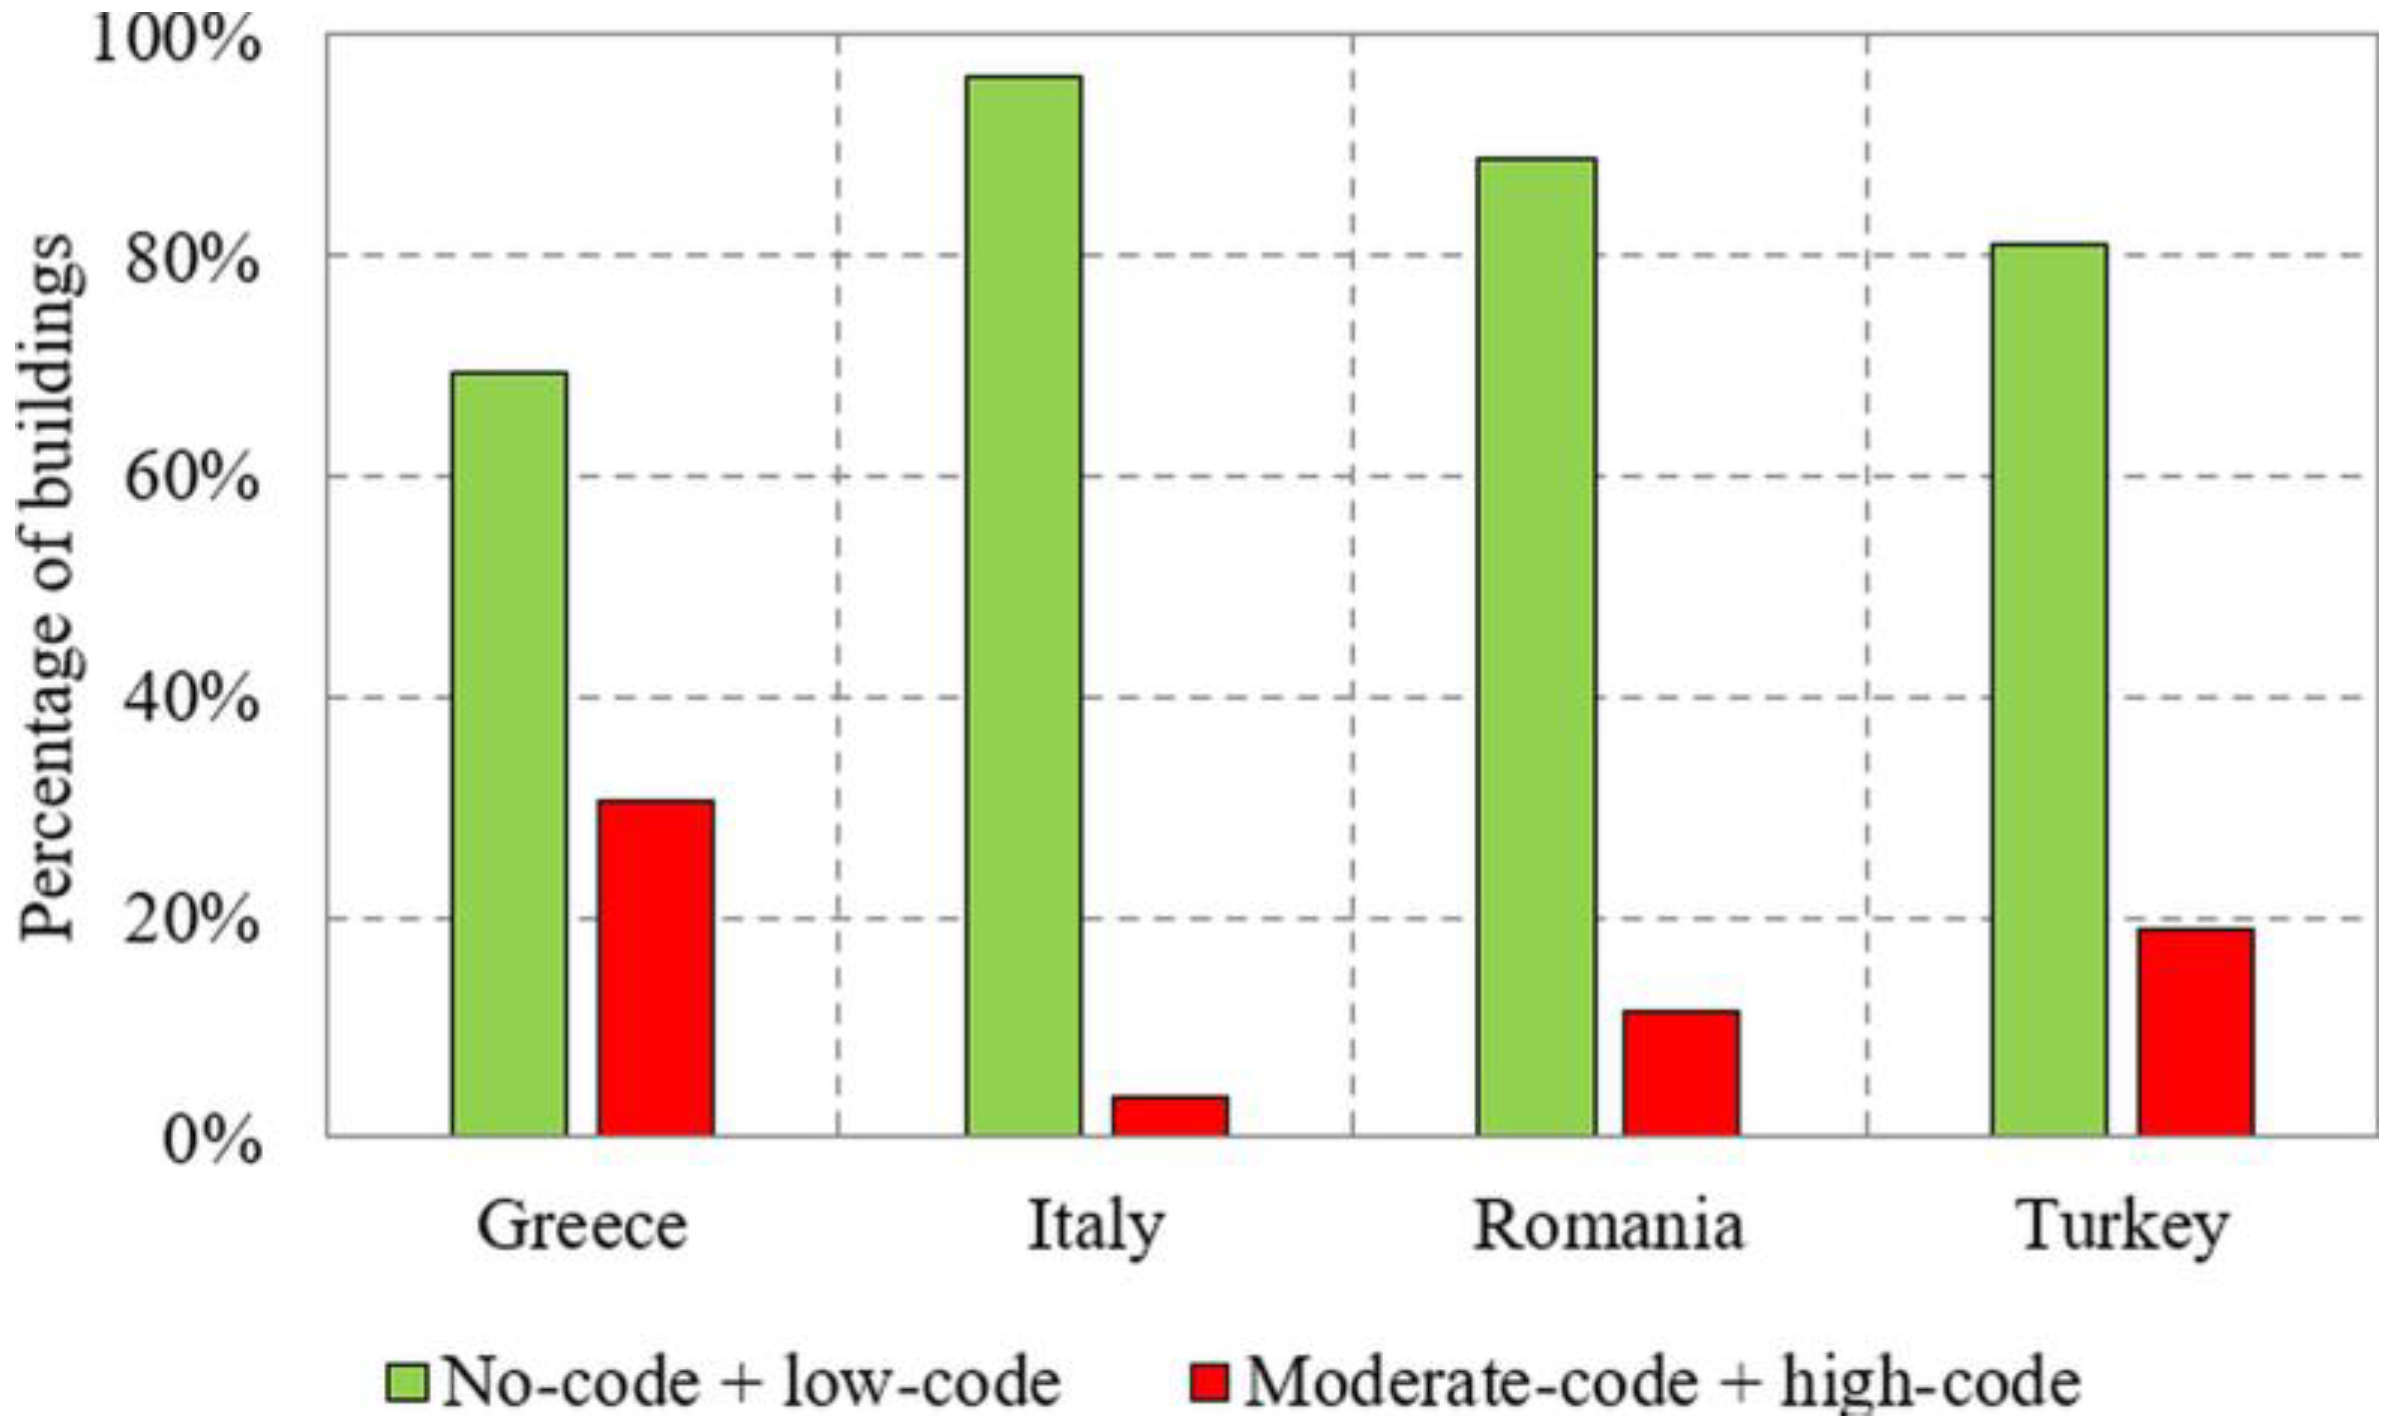
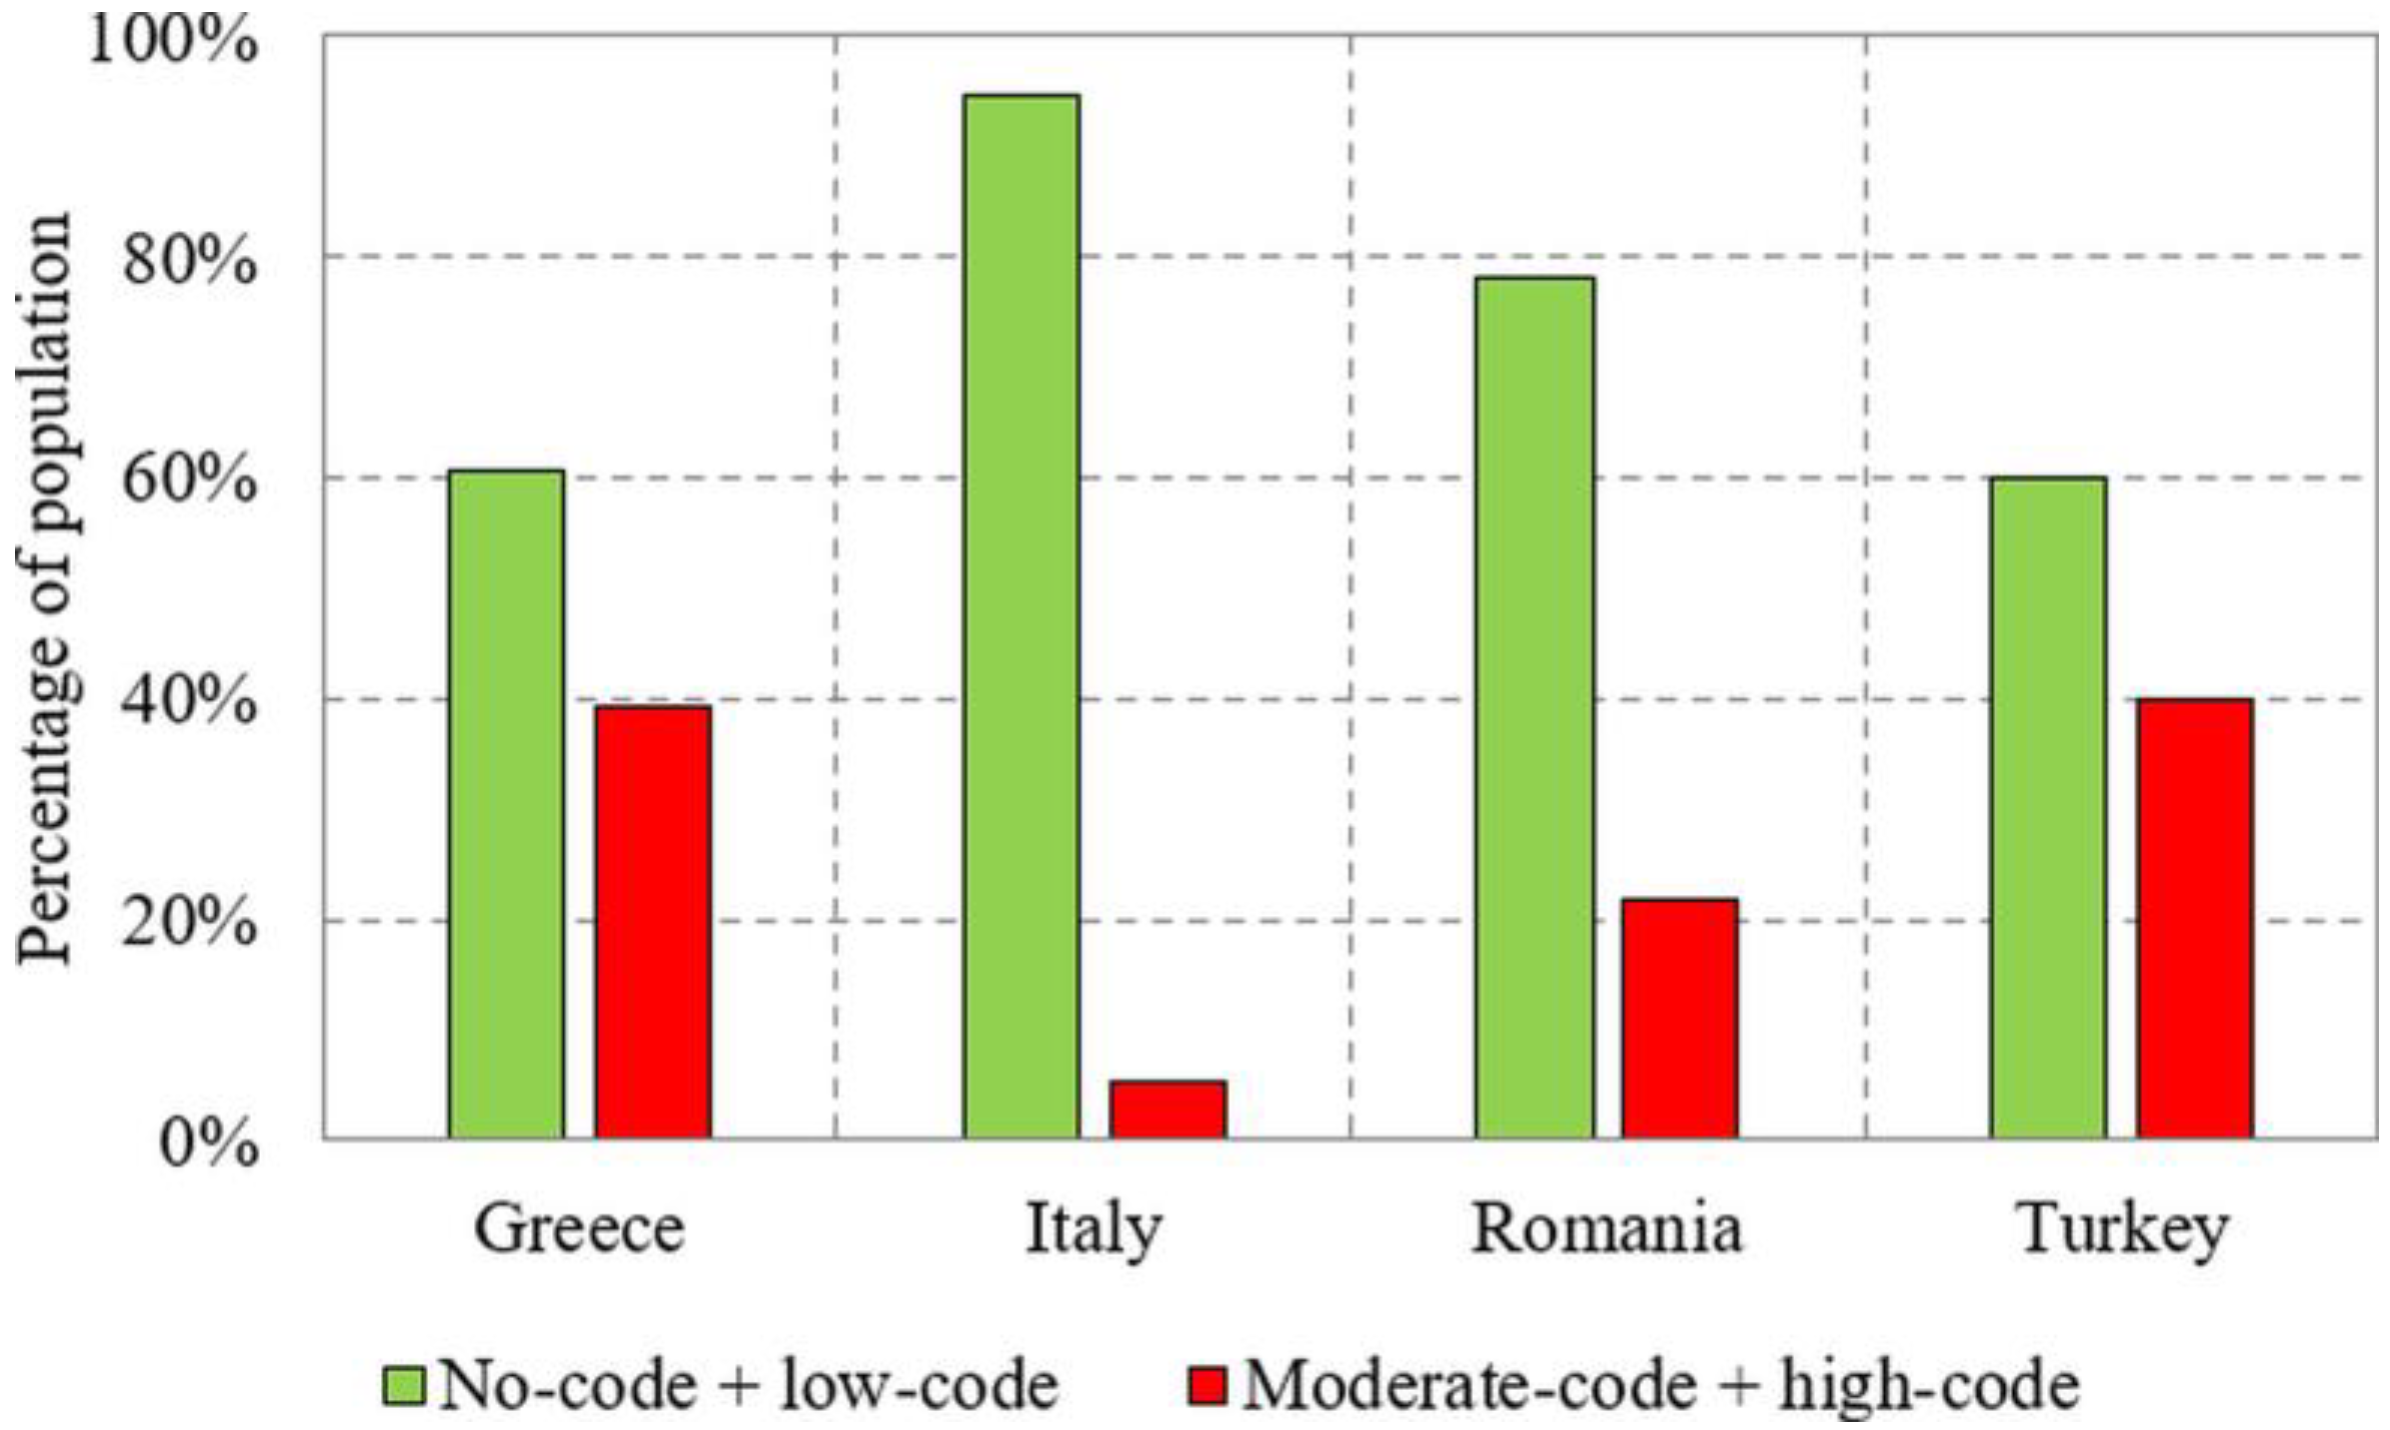
The structure of the building stock (residential, industrial and commercial) in terms of the number of buildings as a function of the level of the seismic design code is subsequently analyzed for all four countries. The relative percentage of buildings designed using either no-code/low-code or moderate-code/high-code for each country is illustrated in Figure 1. Modern seismic design codes are considered as high-code, low-level codes represent the first generation of seismic design codes (which follow the no-code period), and moderate-code is the second generation of seismic design codes [9]. It can be easily observed that in all four countries, the current building stock consists mainly of buildings designed using no- or low-level seismic design. The relative percentage of the population living in buildings designed using either no-code/low-code or moderate-code/high-code for each country is shown in Figure 2. The relative percentages are similar in the two situations (buildings and population) for Greece and Italy, while in the case of Romania and Tukey, the relative percentage of the people living in buildings designed using either moderate-code/high-code is double than that corresponding to the building number.
In absolute terms, from the entire population of more than 170 million people in the four countries, about 130 million live in buildings designed using no- or low-level seismic design.
4. Seismic Risk Assessment
The average annual losses for the four selected countries are, according to the recent European Seismic Risk Model 2020 [9] in the range 0.4–3.3 billion Euros, which leads to average annual loss ratios between 0.6‰ and 1.4‰.
The average annual number of deaths, injured people and those affected are computed for each country based on the data collected from the EM-DAT database [1] for the period 1950–2022 in Table 3.
Based on the average annual number of deaths, injured people and affected people and the corresponding population of each country, the mean annual probability of death is of the order 1.2–5.7 × 10⁻⁶, while for injuries it is 3.0 × 10⁻⁶–1.5 × 10⁻⁵. The order of magnitude of the mean annual death probability due to earthquakes is about 10 times smaller than that due to air travel or building fires [13]. It is noted by Otway et al. [14] that a risk level of the order of 10−6 means that such accidents are not of great concern to average people. This means that average people may be aware of them, but they feel nothing will ever happen to them.
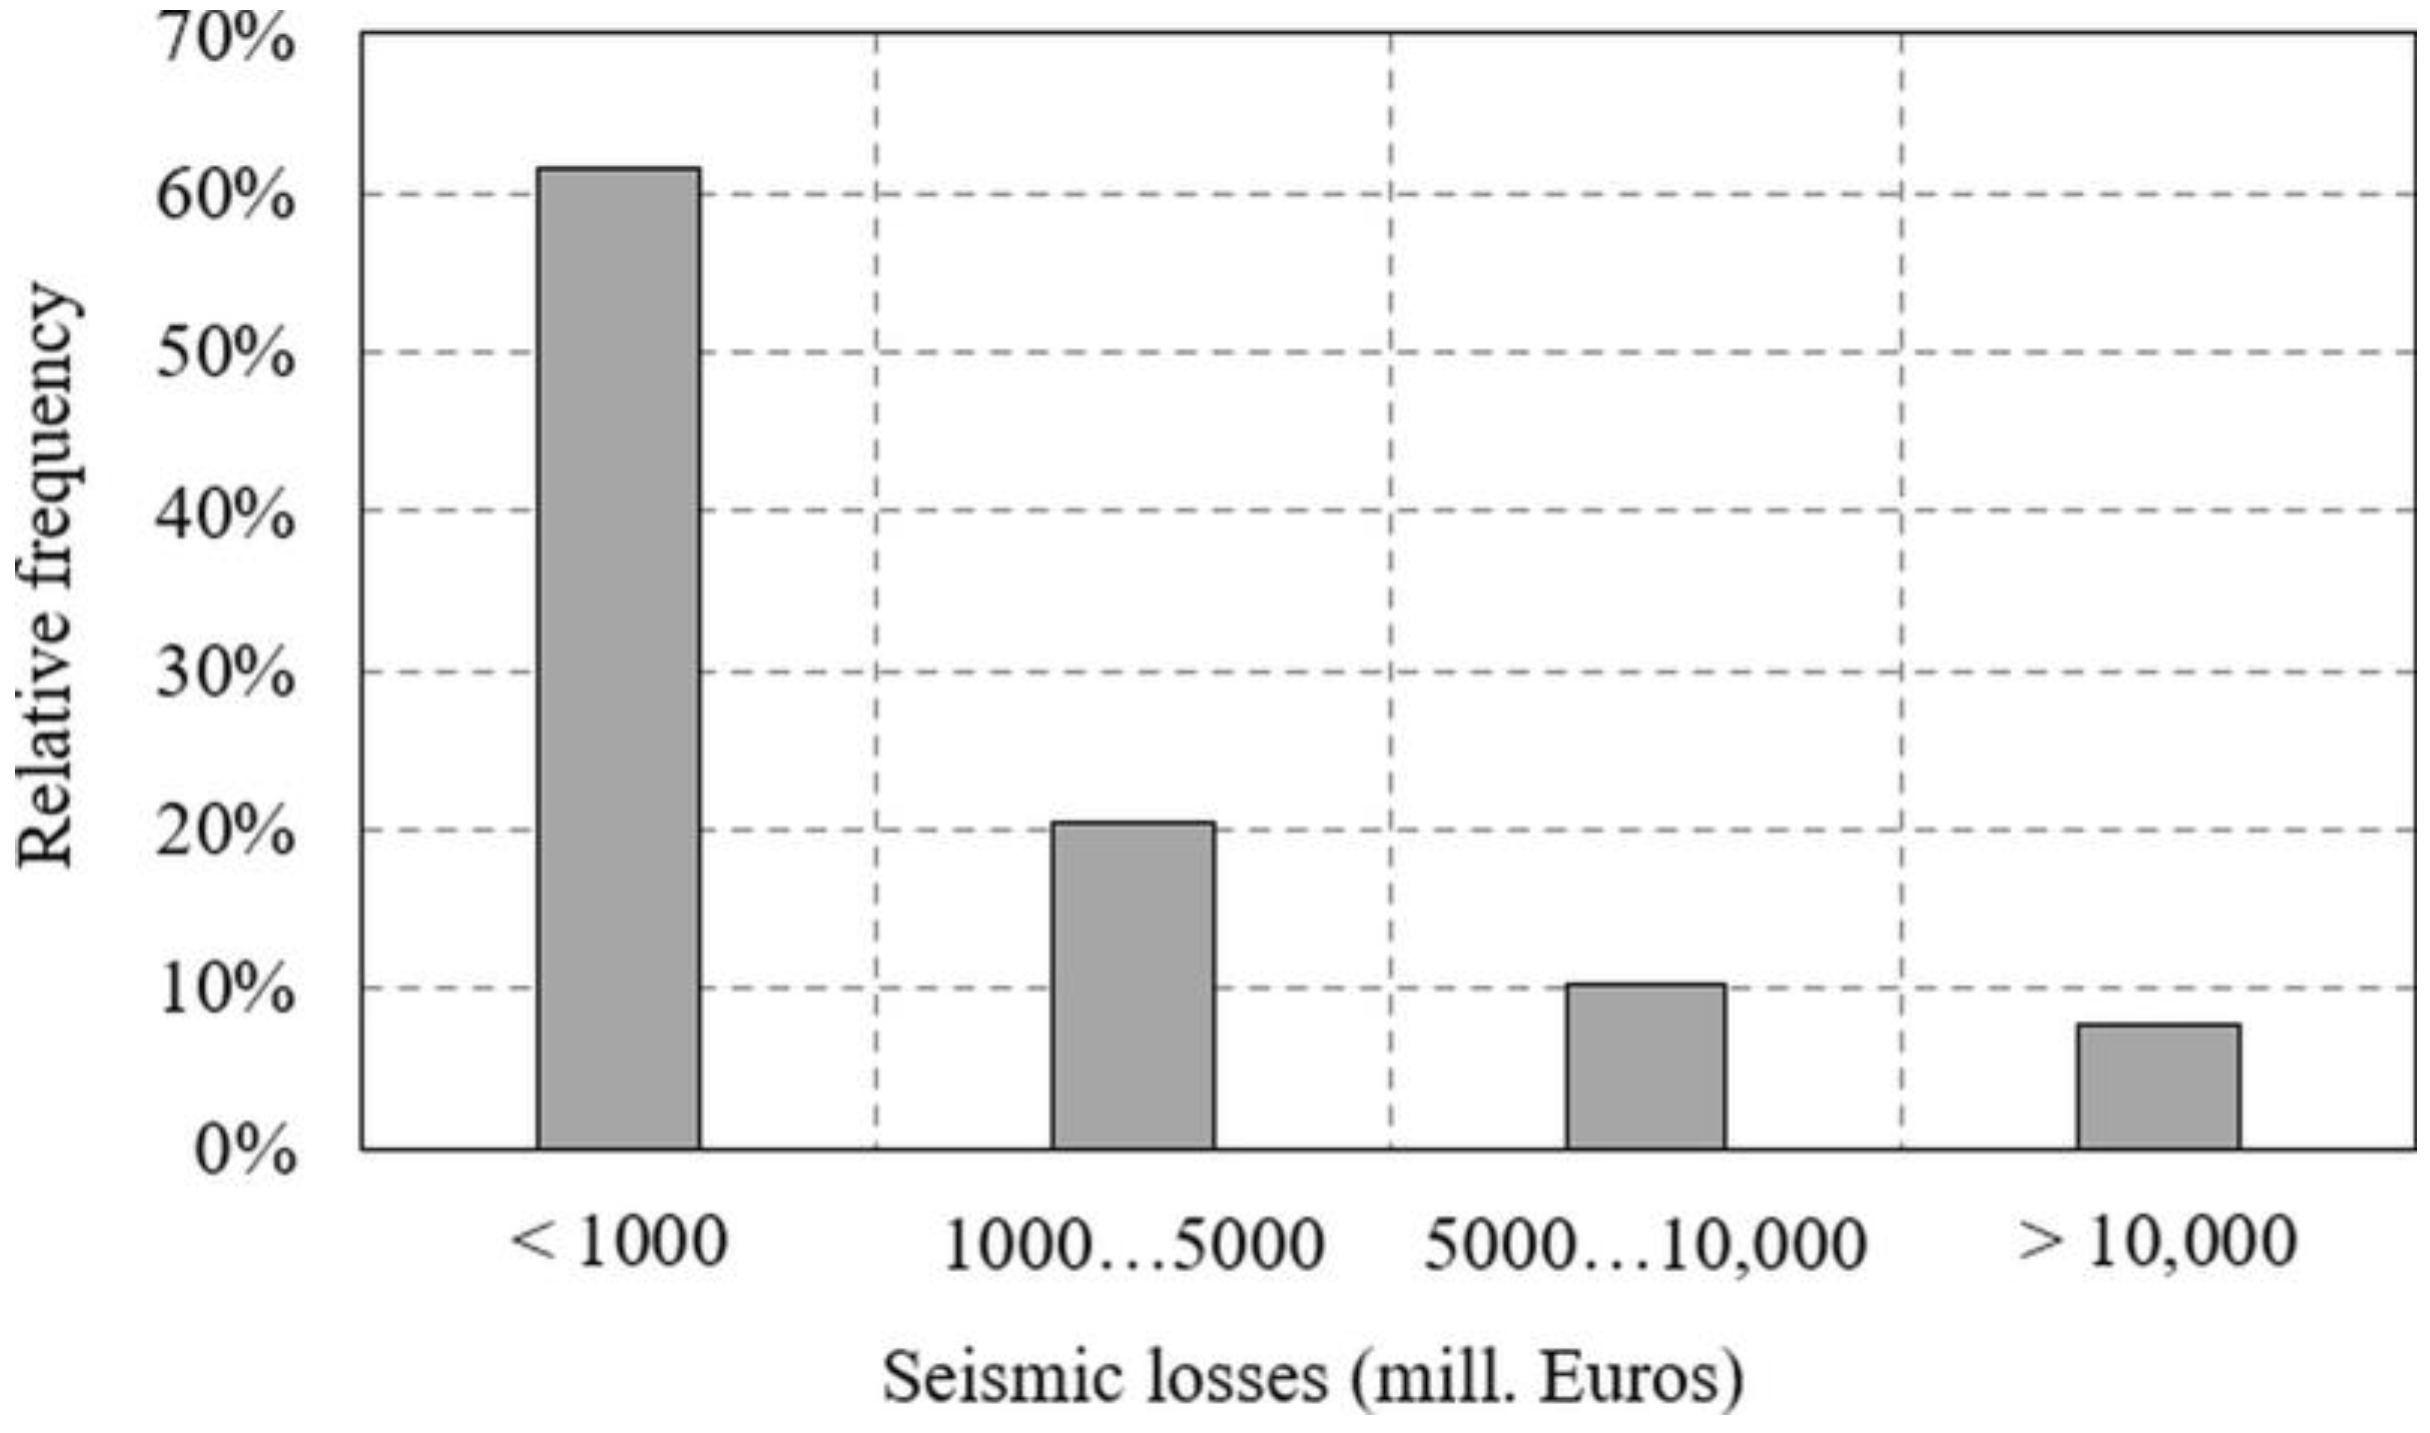
The average seismic losses are evaluated in Table 4 using also the EM-DAT database [1] for the period 1980–2022, in order to better constrain the results. It can be concluded that the average annual seismic losses are of the order 0.08–0.16% of the GDP. Thus, on average, the annual seismic losses are small, but individual seismic events can generate losses 10–20 times larger. A plot showing the distribution of the seismic losses for earthquakes occurring in the four selected countries in the period 1980–2022 according to the EM-DAT database [1] is illustrated in Figure 3. It can be easily observed that three seismic events occurring in the selected period have generated losses in excess of 10 billion Euros, which can have a considerable impact on the GDP of each country.
It has to be emphasized that even in the case of the current seismic design regulations, the exceedance of the design accelerations in the areas situated in the vicinity of the earthquake epicenter can occur as shown in several studies from the literature (e.g., [15,16]) and as observed during various earthquakes. It also has to be highlighted that the mean return period of the seismic action considered for design is 225 years in the case of Romania and 475 years in the case of Italy. Both mean return periods are defined with respect to a timeframe of 50 years. The same mean return period for the seismic design action from the current version of Eurocode 8 [5], will be maintained in the proposed future draft [17], as well. The impact of the provisions of the proposed future Eurocode 8 draft on the seismic zonation of Romania has been studied by Pavel et al. [18].
5. Perception of Seismic Risk and Risk Reduction
The superior seismic performance of better engineered buildings has been observed in many earthquakes both in Europe, as well as in the rest of the world (e.g., [19,20,21,22,23,24]). In addition, the new generations of seismic design codes increase the level of safety of buildings (through improved design and detailing requirements) and as such, an improved seismic performance is expected during future earthquakes. However, on the other hand, the use of an increased quantity of construction materials (e.g., concrete, reinforcing steel bars, etc.) required by large seismic design forces leads to an increase in the emissions released to the environment [25].
In this context, the recent Italian guidelines for seismic risk reduction [26] define technical principles for exploiting tax deductions with respect to seismic strengthening interventions on existing buildings. The reference demand is evaluated as for a new building. The financial incentives are valid only if a safety index of 60% of that corresponding to a new building is obtained through the strengthening process. The unit costs to have an upgrade of one safety index class result was about 270 €/m2 for reinforced concrete buildings and 342 €/m2 for masonry buildings, respectively. The scale of the problem considering the size of the building stock in Italy, as well as the possible costs of the retrofitting are visible with reference to the results from Figure 1.
The 2016 Building (Earthquake-prone Buildings) Amendment Act 2016 [27] from New Zealand adopted in the aftermath of the 2010–2011 Christchurch series of earthquake adopts very strict timeframes for the authorities to identify earthquake prone buildings and for the owners to strengthen or demolish them. Very importantly, an earthquake-prone building is referred to as one that has a rating smaller than 34% of that corresponding to a new building standard, and thus there is a much better understanding from the general public of this term. Risk reduction can be further enhanced by employing policies that can link together house improvements, maintenance loans and seismic risk reduction strategies [28]. A methodology for identifying risk levels for both individual buildings and entire neighborhoods allowing for the identification of areas of conflict between public perceptions of risk and objective/physical risk was proposed in the study of Fischer et al. [29]. A review of the seismic risk mitigation policies in earthquake-prone countries can be found in the study of Zhang et al. [30]. The recent study of Morelli et al. [31] presents a literature review on how social media can impact on disaster risk perception and vulnerability and how these two aspects are interconnected.
From the point of view of earthquake occurrence, the vast majority of the sites in Greece, Italy or Turkey are affected by significant earthquakes which occur at most once or twice per century. On the other hand, Romania faces a different problem in the sense that the main contributor to seismic hazard is the Vrancea intermediate-depth seismic source [32], thus affecting the same regions every time an earthquake occurs. Bucharest, for instance was affected by five large magnitude Vrancea earthquakes in the period 1908–1990 (in 1908, 1940, 1977, 1986 and 1990) and by only one moderate sized earthquake since 1990.
However, the issue of communicating seismic risk to the general population is much more complicated. The assessment of seismic risk perception is of significant importance in order to introduce appropriate disaster risk reduction strategies [33]. Risk perception is a measure of the community awareness, preparedness, and resilience to natural disasters. Moreover, another study has shown that a person’s risk perception increases with respect to the actual vulnerability of their buildings [34]. Since the risk level associated with death due to earthquakes has a very small probability associated to situations which are not of great concern to average people [14], communication strategies have to be adapted. For instance, Savadori et al. [35] proposed a solution for the communication of seismic risks to the general public by providing meaningful risk comparisons with other, more familiar events. However, such an approach is not valid for the case of earthquake risk. To make matters more complicated for the general public, seismic design codes rely on zonation maps in terms of peak ground acceleration (PGA) or spectral acceleration (SA). Both quantities are a complete unknown for most of the general public. Maps in terms of macroseismic intensities (directly related to the way in which an earthquake is felt and its effects) are not commonly associated with seismic design codes, as they used to be in the past.
In Japan, the seismic hazard maps depict the likelihood of an earthquake with a seismic intensity (JMA) of 6 Lower [36] or more within 30 years, with 3.0% being considered a high probability level [37]. The study of Saito et al. [37] reveals an interesting observation in the sense that earthquake risk perception increased significantly when the earthquake danger was presented in terms of occurrence probabilities within 10 and 20 years. Moreover, an age dependency on seismic risk perception was also noticed in the same study in the sense that an increase occurred when the risk was presented as the occurrence probabilities within 20 and 30 years for those aged 20–40, and as occurrence probabilities within 10 years for those aged 50–60. As such, the solution of communicating seismic hazard for time frames of 10 or 20 years instead of using annual values or a time frame of 50 years (as is the case of modern seismic design codes) might be feasible.
The vulnerability of buildings is another critical issue for the correct perception of seismic risk. While for the engineering community, the differences between the expected seismic performance of a building designed considering no or very limited seismic design are obvious, for the general public, they are not. A recent seismic awareness study performed in Bucharest [38] has shown that irrespective of the construction year of the building they live in, the residents expect minor to moderate damage to occur to their building (even though some of the buildings have no or very limited seismic design). Moreover, from the point of view of preparedness, similarly low values were observed in both the case of Bucharest [38] as well as in Salt Lake City [39], both sites being situated in the proximity of active seismic zones. In this context, it is clear that many people do not understand seismic design codes, their evolution and what is the expected performance of a particular building during an earthquake of a given size. The common limit states employed for design purposes (e.g., immediate occupancy, life safety, near collapse, etc.) should be replaced for the general public with simple, more manageable and comprehensible terms. For instance, the use of inhabitable or non-inhabitable differentiation, with associated probabilities in the case of scenario earthquakes or using the same suggested time frames (10 or 20 years) as for the seismic hazard case, might be a solution. In order to better understand the results, numbers of uninhabitable buildings after scenario earthquakes and the average time necessary for rendering the building as inhabitable again can have a significant impact on seismic risk perception.
6. Conclusions
Earthquakes are one of the deadliest and most costly natural disasters affecting Europe. In this context, the focus of this perspective paper has been to present an overview of the seismic risk reduction in Europe using as case-studies four countries in Europe, namely Greece, Italy, Romania and Turkey, which have the largest mean annual losses according to the recent European seismic risk model 2020 [4]. In this context, the issue of seismic risk perception and awareness has been also discussed. The main observations of the analyses performed using data from the four countries can be summarized as follows:
- The current building stock in the four analyzed countries consists mainly of buildings designed using no- or low-level seismic design;
- There is a much larger share of the population living in buildings designed using either moderate-code/high-code in Greece, Turkey and Romania, than in the case of Italy;
- In the case of Romania and Turkey, the relative percentage of the people living in buildings designed using either moderate-code/high-code is double than the percentage corresponding to the building number;
- From the entire population of more than 170 million people in the four case-study countries, about 130 million live in buildings designed using no- or low-level seismic design;
- The mean annual probability of death computed based on the EM-DAT database [1] for the population in the four analyzed countries is of the order 1.2–5.7 × 10⁻⁶, while for injuries it is 3.0 × 10⁻⁵–1.5 × 10⁻⁴. The order of magnitude of the annual death probability due to earthquakes is on average 10 times smaller than that due to air travel or a building fire;
- Three seismic events occurring in the period 1980–2022 in Europe have generated losses in excess of 10 billion Euros.
While from the point of view of seismic risk specialists, things appear very clear, the communication of seismic risks to the general population and the perception of seismic risk in the case of the general people is a very difficult issue. In this context, it is worth highlighting that according to Otway et al. [14], a risk level of the order of 10−6 means that such accidents are not of great concern to average people. The Japanese experience which suggests that seismic hazards should be discussed in terms of occurrence probabilities in 10 years or 20 years, instead of the current time frame of 50 years, is an option which should also be employed in Europe. Zonation maps using macroseismic intensity as the intensity measure should accompany the engineering-oriented maps (in terms of spectral accelerations or peak ground accelerations), as was the case in the past. Macroseismic levels from past earthquakes might be used for comparison purposes in order to have a better understanding of the results from the general population. In addition, the definition of vulnerability of the buildings and their expected seismic performance during various earthquakes should be adjusted and made more comprehensible to the general public. The improvement in the seismic performance of buildings as a function of the seismic design code level observed in many earthquakes should be mentioned in a very clear manner in design codes. A solution starting from the communication of seismic hazard might be to use simple terms (e.g., inhabitable vs. uninhabitable) in order to describe the expected behavior of a building along with their associated probabilities for a time frame of 10 or 20 years. These probabilities should also be accompanied by absolute numbers of uninhabitable buildings after scenario earthquakes (e.g., Vrancea 1977 earthquake, Kocaeli 1999 earthquake, L’Aquila 2009 earthquake, etc.) and the average time necessary for rendering the building as inhabitable again can have a significant impact on seismic risk perception. The financial incentives proposed by the recent Italian guidelines for seismic risk reduction should be explored by other countries as well. In addition, as applied in New Zealand, the definition of earthquake-prone buildings should be clearly defined by using a new building as a reference.
The main conclusion and the most important point of this paper is that a very important adjustment and update of the presentation of the seismic design codes has to be performed in the near future, so the general population can have clear, distinct and measurable quantities in order to make informed decisions.
Funding
This research received no external funding.
Institutional Review Board Statement
Not applicable.
Informed Consent Statement
Not applicable.
Data Availability Statement
The data used in this study are publicly available.
Conflicts of Interest
The author declares no conflict of interest.
References
- EM-DAT|The International Disasters Database. Available online: https://www.emdat.be/index.php (accessed on 17 November 2022).
- Corbane, C.; Hancilar, U.; Ehrlich, D.; De Groeve, T. Pan-European Seismic Risk Assessment: A Proof of Concept Using the Earthquake Loss Estimation Routine (ELER). Bull. Earthq. Eng. 2017, 15, 1057–1083. [Google Scholar] [CrossRef]
- Ainuddin, S.; Mukhtar, U.; Ainuddin, S. Public Perception about Enforcement of Building Codes as Risk Reduction Strategy for Seismic Safety in Quetta, Baluchistan. Int. J. Disaster Risk Reduct. 2014, 9, 99–106. [Google Scholar] [CrossRef]
- Gkimprixis, A.; Tubaldi, E.; Douglas, J. Evaluating Alternative Approaches for the Seismic Design of Structures. Bull. Earthq. Eng. 2020, 18, 4331–4361. [Google Scholar] [CrossRef]
- CEN. Eurocode 8: Design of Structures for Earthquake Resistance. Part 1: General Rules, Seismic Actions and Rules for Buildings; CEN: Bruxelles, Belgium, 2004. [Google Scholar]
- FIB. FIB Bulletin 69: Critical Comparison of Major Seismic Codes for Buildings; FIB: Lausanne, Switzerland, 2013. [Google Scholar]
- CEN. Eurocode 8: Design of Structures for Earthquake Resistance. Part 3: Assessment and Retrofitting of Buildings; CEN: Bruxelles, Belgium, 2005. [Google Scholar]
- Crowley, H.; Dabbeek, J.; Despotaki, V.; Rodrigues, D.; Martins, L.; Silva, V.; Romão, X.; Pereira, N.; Weatherhill, G.; Danciu, L. European Seismic Risk Model (ESRM20); EUCENTRE Foundation: Pavia, Italy, 2021. [Google Scholar] [CrossRef]
- Crowley, H.; Despotaki, V.; Silva, V.; Dabbeek, J.; Romão, X.; Pereira, N.; Castro, J.M.; Daniell, J.; Veliu, E.; Bilgin, H.; et al. Model of Seismic Design Lateral Force Levels for the Existing Reinforced Concrete European Building Stock. Bull. Earthq. Eng. 2021, 19, 2839–2865. [Google Scholar] [CrossRef]
- Crowley, H.; Despotaki, V.; Rodrigues, D.; Silva, V.; Toma-Danila, D.; Riga, E.; Karatzetzou, A.; Fotopoulou, S.; Zugic, Z.; Sousa, L.; et al. Exposure Model for European Seismic Risk Assessment. Earthq. Spectra 2020, 36, 252–273. [Google Scholar] [CrossRef]
- Crowley, H.; Despotaki, V.; Rodrigues, D.; Silva, V.; Costa, C.; Toma-Danila, D.; Riga, E.; Karatzetzou, A.; Fotopoulou, S.; Sousa, L.; et al. European Exposure Model Data Repository [Data set]; Zenodo: Honolulu, HI, USA, 2021. [Google Scholar] [CrossRef]
- GDP (Current US$)|Data. Available online: https://data.worldbank.org/indicator/NY.GDP.MKTP.CD?view=chart (accessed on 15 November 2022).
- Melchers, R.; Beck, A. Structural Reliability Analysis and Prediction, 3rd ed.; John Wiley & Sons: Hoboken, NJ, USA, 2018; ISBN 978-1-119-26610-5. [Google Scholar]
- Otway, H.J.; Battat, M.E.; Lohrding, R.K.; Turner, R.D.; Cubitt, R.L. A Risk Analysis of the Omega West Reactor; Report No.: LA-4449, 4121184; Los Alamos Scientific Laboratory of the University of California: Los Alamos, NM, USA, 1970. [Google Scholar]
- Iervolino, I.; Giorgio, M.; Cito, P. Which Earthquakes Are Expected to Exceed the Design Spectra? Earthq. Spectra 2019, 35, 1465–1483. [Google Scholar] [CrossRef]
- Pavel, F.; Vacareanu, R. Analysis of Exceedance Probabilities for Design Spectral Accelerations from Crustal Earthquakes in Romania. J. Seism. 2019, 23, 1327–1345. [Google Scholar] [CrossRef]
- CEN/TC 250/SC 8; Eurocode 8: Earthquake Resistance Design of Structures Working Draft. 2021.
- Pavel, F.; Vacareanu, R.; Pitilakis, K. Preliminary Evaluation of the Impact of Eurocode 8 Draft Revision on the Seismic Zonation of Romania. Appl. Sci. 2022, 12, 649. [Google Scholar] [CrossRef]
- Pavel, F. Collapse Rates of Reinforced Concrete Structures during Large Magnitude Earthquakes: Case Study for Romania. SN Appl. Sci. 2021, 3, 525. [Google Scholar] [CrossRef]
- Pomonis, A. The Mount Parnitha (Athens) Earthquake of September 7, 1999: A Disaster Management Perspective. Nat. Hazards 2002, 27, 171–199. [Google Scholar] [CrossRef]
- Del Gaudio, C.; De Martino, G.; Di Ludovico, M.; Manfredi, G.; Prota, A.; Ricci, P.; Verderame, G.M. Empirical Fragility Curves from Damage Data on RC Buildings after the 2009 L’Aquila Earthquake. Bull. Earthq. Eng. 2017, 15, 1425–1450. [Google Scholar] [CrossRef]
- Saatcioglu, M.; Mitchell, D.; Tinawi, R.; Gardner, N.J.; Gillies, A.G.; Ghobarah, A.; Anderson, D.L.; Lau, D. The August 17, 1999, Kocaeli (Turkey) Earthquake—Damage to Structures. Can. J. Civ. Eng. 2001, 28, 715–737. [Google Scholar] [CrossRef]
- Kam, W.Y.; Pampanin, S.; Elwood, K. Seismic Performance of Reinforced Concrete Buildings in the 22 February Christchurch (Lyttelton) Earthquake. Bull. N. Z. Soc. Earthq. Eng. 2011, 44, 239–278. [Google Scholar] [CrossRef] [Green Version]
- Ates, S.; Kahya, V.; Yurdakul, M.; Adanur, S. Damages on Reinforced Concrete Buildings Due to Consecutive Earthquakes in Van. Soil Dyn. Earthq. Eng. 2013, 53, 109–118. [Google Scholar] [CrossRef]
- Chrysanidis, T.; Mousama, D.; Tzatzo, E.; Alamanis, N.; Zachos, D. Study of the Effect of a Seismic Zone to the Construction Cost of a Five-Story Reinforced Concrete Building. Sustainability 2022, 14, 10076. [Google Scholar] [CrossRef]
- Cosenza, E.; Del Vecchio, C.; Di Ludovico, M.; Dolce, M.; Moroni, C.; Prota, A.; Renzi, E. The Italian Guidelines for Seismic Risk Classification of Constructions: Technical Principles and Validation. Bull. Earthq. Eng. 2018, 16, 5905–5935. [Google Scholar] [CrossRef]
- Ministry of Business, Innovation and Employment. Regulations under the Building (Earthquake-prone Buildings) Amendment Act 2016; Ministry of Business, Innovation and Employment: Wellington, New Zealand, 2016. [Google Scholar]
- Taylan, A. Factors Influencing Homeowners’ Seismic Risk Mitigation Behavior: A Case Study in Zeytinburnu District of Istanbul. Int. J. Disaster Risk Reduct. 2015, 13, 414–426. [Google Scholar] [CrossRef]
- Fischer, E.; Biondo, A.E.; Greco, A.; Martinico, F.; Pluchino, A.; Rapisarda, A. Objective and Perceived Risk in Seismic Vulnerability Assessment at an Urban Scale. Sustainability 2022, 14, 9380. [Google Scholar] [CrossRef]
- Zhang, Y.; Fung, J.F.; Johnson, K.J.; Sattar, S. Review of Seismic Risk Mitigation Policies in Earthquake-Prone Countries: Lessons for Earthquake Resilience in the United States. J. Earthq. Eng. 2022, 26, 6208–6235. [Google Scholar] [CrossRef]
- Morelli, S.; Pazzi, V.; Nardini, O.; Bonati, S. Framing Disaster Risk Perception and Vulnerability in Social Media Communication: A Literature Review. Sustainability 2022, 14, 9148. [Google Scholar] [CrossRef]
- Pavel, F.; Vacareanu, R.; Douglas, J.; Radulian, M.; Cioflan, C.; Barbat, A. An Updated Probabilistic Seismic Hazard Assessment for Romania and Comparison with the Approach and Outcomes of the SHARE Project. Pure Appl. Geophys. 2016, 173, 1881–1905. [Google Scholar] [CrossRef] [Green Version]
- Qureshi, M.I.; Khan, S.U.; Rana, I.A.; Ali, B.; Rahman, A. ur Determinants of People’s Seismic Risk Perception: A Case Study of Malakand, Pakistan. Int. J. Disaster Risk Reduct. 2021, 55, 102078. [Google Scholar] [CrossRef]
- Khan, S.U.; Qureshi, M.I.; Rana, I.A.; Maqsoom, A. An Empirical Relationship between Seismic Risk Perception and Physical Vulnerability: A Case Study of Malakand, Pakistan. Int. J. Disaster Risk Reduct. 2019, 41, 101317. [Google Scholar] [CrossRef]
- Savadori, L.; Ronzani, P.; Sillari, G.; Di Bucci, D.; Dolce, M. Communicating Seismic Risk Information: The Effect of Risk Comparisons on Risk Perception Sensitivity. Front. Commun. 2022, 7, 59. [Google Scholar] [CrossRef]
- Shabestari, K.T.; Yamazaki, F. A Proposal of Instrumental Seismic Intensity Scale Compatible with MMI Evaluated from Three-Component Acceleration Records. Earthq. Spectra 2001, 17, 711–723. [Google Scholar] [CrossRef] [Green Version]
- Saito, S.; Yasumoto, S.; Sekiya, N. Earthquake Probability in the National Seismic Hazard Maps for Japan and People’s Risk Perceptions: The Search for More Effective Expression. Earth Planets Space 2022, 74, 82. [Google Scholar] [CrossRef]
- Calotescu, I.; Pavel, F.; Vacareanu, R. Earthquake Risk Awareness in Bucharest, Romania: Public Survey. In Proceedings of the Seismic Hazard and Risk Assessment; Vacareanu, R., Ionescu, C., Eds.; Springer International Publishing: Cham, Switzerland, 2018; pp. 297–311. [Google Scholar]
- Nicoll, K.; Cova, T.J.; Siebeneck, L.K.; Martineau, E. Assessing “Preparedness Elevated”: Seismic Risk Perception and Household Adjustment in Salt Lake City, Utah. J. Geogr. Nat. Disast. 2016, 6, 1000168. [Google Scholar] [CrossRef] [Green Version]
- Douglas, J.; Gkimprixis, A. Risk Targeting in Seismic Design Codes: The State of the Art, Outstanding Issues and Possible Paths Forward. In Proceedings of the Seismic Hazard and Risk Assessment; Vacareanu, R., Ionescu, C., Eds.; Springer International Publishing: Cham, Switzerland, 2018; pp. 211–223. [Google Scholar]
- Talebi, M.; Zare, M.; Noroozinejad Farsangi, E.; Soghrat, M.R.; Maleki, V.; Esmaeili, S. Development of Risk-Targeted Seismic Hazard Maps for the Iranian Plateau. Soil Dyn. Earthq. Eng. 2021, 141, 106506. [Google Scholar] [CrossRef]
- Vacareanu, R.; Pavel, F.; Craciun, I.; Coliba, V.; Arion, C.; Aldea, A.; Neagu, C. Risk-Targeted Maps for Romania. J. Seism. 2018, 22, 407–417. [Google Scholar] [CrossRef]
- Douglas, J.; Ulrich, T.; Negulescu, C. Risk-Targeted Seismic Design Maps for Mainland France. Nat. Hazards 2013, 65, 1999–2013. [Google Scholar] [CrossRef] [Green Version]
- Stewart, J.P.; Luco, N.; Hooper, J.D.; Crouse, C.B. Risk-Targeted Alternatives to Deterministic Ground Motion Caps in U.S. Seismic Provisions. Earthq. Spectra 2020, 36, 904–923. [Google Scholar] [CrossRef]
Figure 1.
Comparison of the relative percentage of buildings designed using no-code or low-code and buildings designed using moderate-code or high-code for each selected country.
Figure 1.
Comparison of the relative percentage of buildings designed using no-code or low-code and buildings designed using moderate-code or high-code for each selected country.

Figure 2.
Comparison of the relative percentage of the population living in buildings designed using no-code or low-code and buildings designed using moderate-code or high-code for each selected country.
Figure 2.
Comparison of the relative percentage of the population living in buildings designed using no-code or low-code and buildings designed using moderate-code or high-code for each selected country.

Figure 3.
Relative frequency histogram for the seismic losses due to earthquakes occurring in Greece, Italy, Turkey and Romania in the period 1980–2022 [1].
Figure 3.
Relative frequency histogram for the seismic losses due to earthquakes occurring in Greece, Italy, Turkey and Romania in the period 1980–2022 [1].


Table 1.
Years corresponding to low-code to moderate/high-code change and years in which significant damaging earthquakes occurred for the four selected countries [9].
Table 1.
Years corresponding to low-code to moderate/high-code change and years in which significant damaging earthquakes occurred for the four selected countries [9].
| Country | Seismic Design Code Change (Low-Code to Moderate/High-Code) | Major Damaging Earthquakes |
|---|---|---|
| Greece | 1984 | 1981, 1986, 1995. 1999, 2014, 2015, 2017, 2020 |
| Italy | 1996 | 1976, 1980, 2002, 2009, 2016 |
| Romania | 1978 | 1977, 1986, 1990 |
| Turkey | 1997 | 1976, 1983, 1992, 1998, 1999, 2003, 2011, 2020 |
Table 2.
Number of buildings, population, total replacement costs of buildings and gross domestic product in the four selected countries [11].
Table 2.
Number of buildings, population, total replacement costs of buildings and gross domestic product in the four selected countries [11].
| Country | Number of Buildings (mill.) | Population (mill.) | Total Replacement Cost (bill. Euro) | GDP (bill. Euro) |
|---|---|---|---|---|
| Greece | 3.35 | 10.71 | 609 | 207.6 |
| Italy | 12.19 | 60.30 | 5263 | 2015.9 |
| Romania | 5.51 | 19.35 | 337 | 272.7 |
| Turkey | 9.16 | 83.43 | 822 | 782.7 |
Table 3.
Average annual number of deaths, injured people and affected people for the period 1950–2022 [1].
Table 3.
Average annual number of deaths, injured people and affected people for the period 1950–2022 [1].
| Country | Average No. of Deaths | Average No. of Injured People | Average No. of Affected People |
|---|---|---|---|
| Greece | 14 | 100 | 16,836 |
| Italy | 92 | 178 | 13,289 |
| Romania | 23 | 167 | 5456 |
| Turkey | 473 | 1287 | 97,712 |
Table 4.
Average annual seismic losses for the period 1980–2022 [1].
Table 4.
Average annual seismic losses for the period 1980–2022 [1].
| Country | Average Economic Losses (mill. Euro) |
|---|---|
| Greece | 326 |
| Italy | 2507 |
| Romania | 213 |
| Turkey | 952 |
Disclaimer/Publisher’s Note: The statements, opinions and data contained in all publications are solely those of the individual author(s) and contributor(s) and not of MDPI and/or the editor(s). MDPI and/or the editor(s) disclaim responsibility for any injury to people or property resulting from any ideas, methods, instructions or products referred to in the content. |
© 2023 by the author. Licensee MDPI, Basel, Switzerland. This article is an open access article distributed under the terms and conditions of the Creative Commons Attribution (CC BY) license (https://creativecommons.org/licenses/by/4.0/).
Share and Cite
MDPI and ACS Style
Pavel, F. Seismic Design Codes—Key Elements for Seismic Risk Perception and Reduction in Europe. Buildings 2023, 13, 158. https://doi.org/10.3390/buildings13010158
AMA Style
Pavel F. Seismic Design Codes—Key Elements for Seismic Risk Perception and Reduction in Europe. Buildings. 2023; 13(1):158. https://doi.org/10.3390/buildings13010158
Chicago/Turabian StylePavel, Florin. 2023. "Seismic Design Codes—Key Elements for Seismic Risk Perception and Reduction in Europe" Buildings 13, no. 1: 158. https://doi.org/10.3390/buildings13010158
Note that from the first issue of 2016, this journal uses article numbers instead of page numbers. See further details here.