
Study on Restoring Force Model of Cold-Formed Thin-Walled Steel Lipped Channel Beam-Columns under Cyclic Load

Abstract
:1. Introduction
2. Establishment and Verification of FEA Models
2.1. Establishment of FEA Model
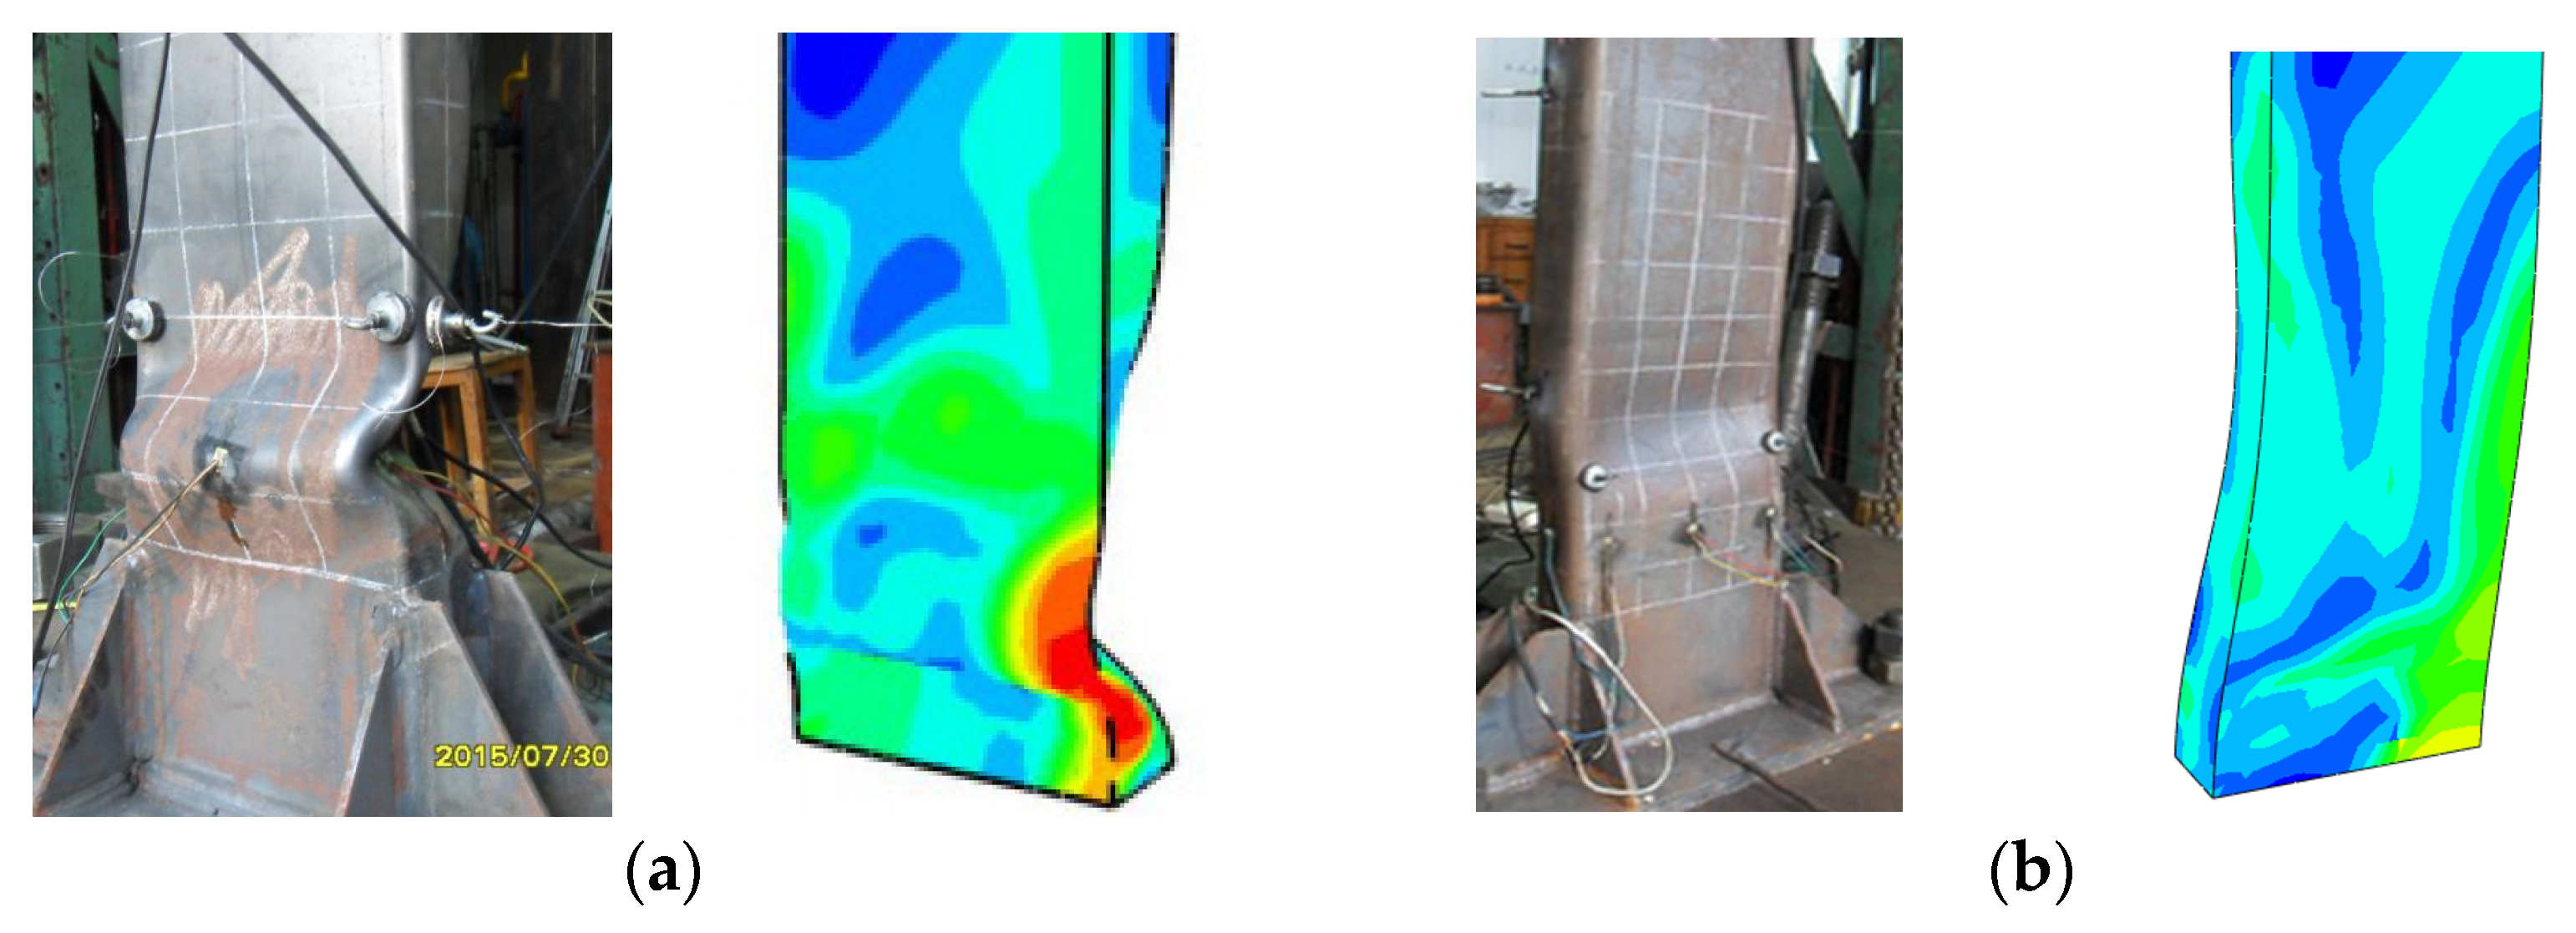
2.2. Verification on FEA Model
3. Parameter Analysis of Hysteretic Behavior
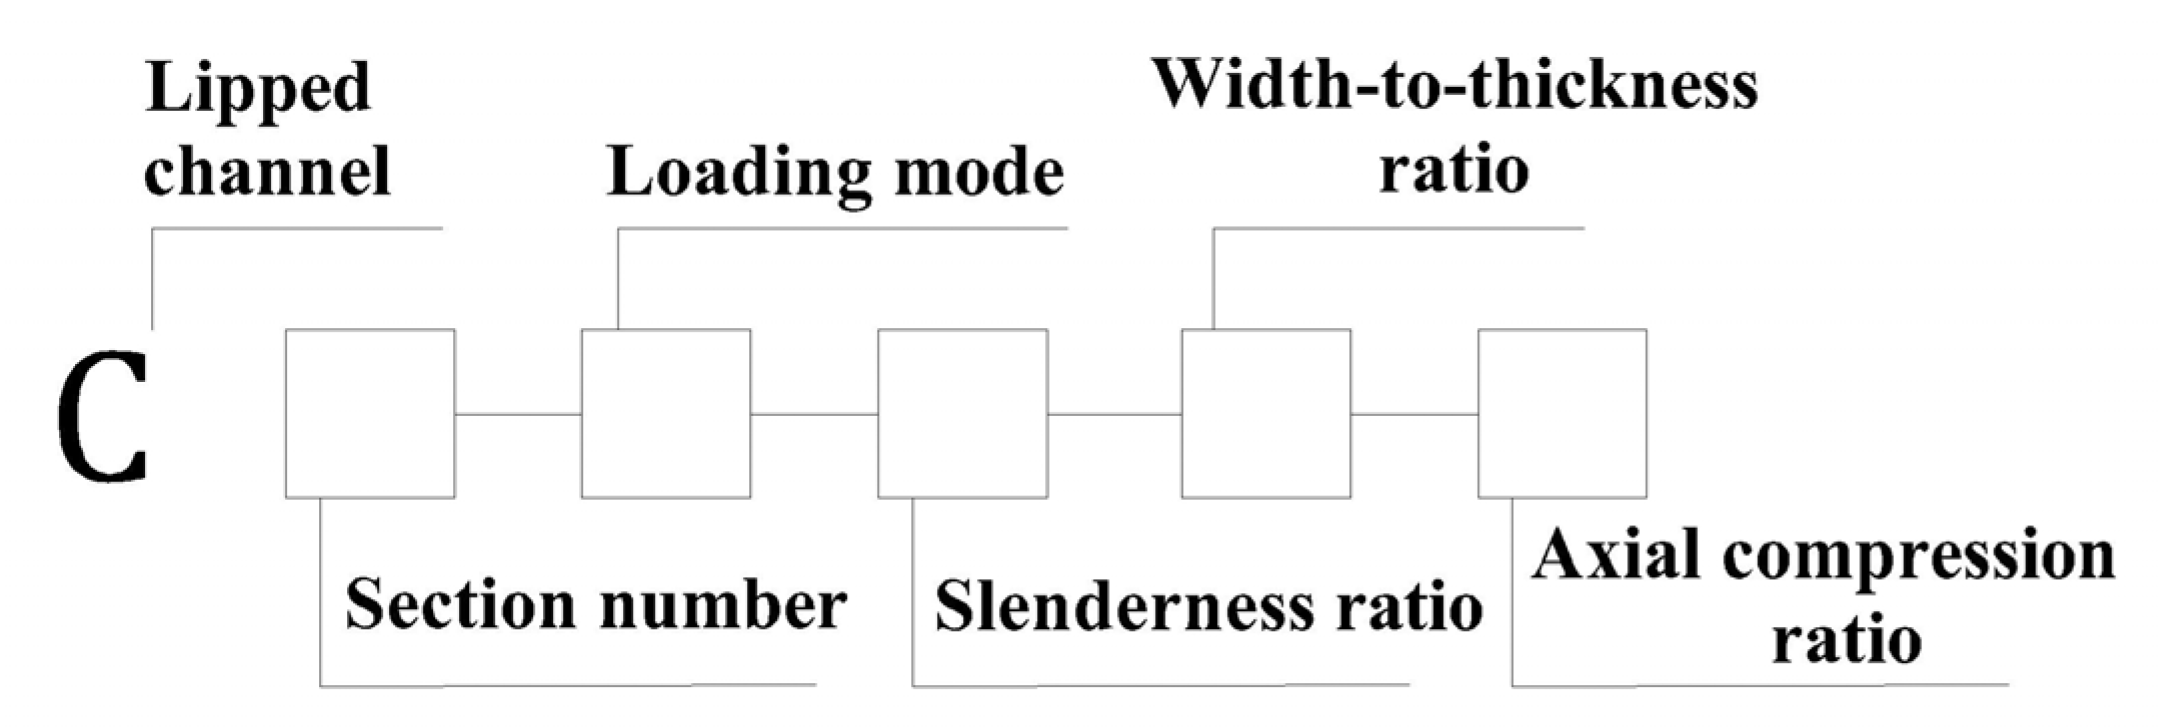
3.1. Member Design
3.2. Parameter Analysis
3.2.1. Failure Mode
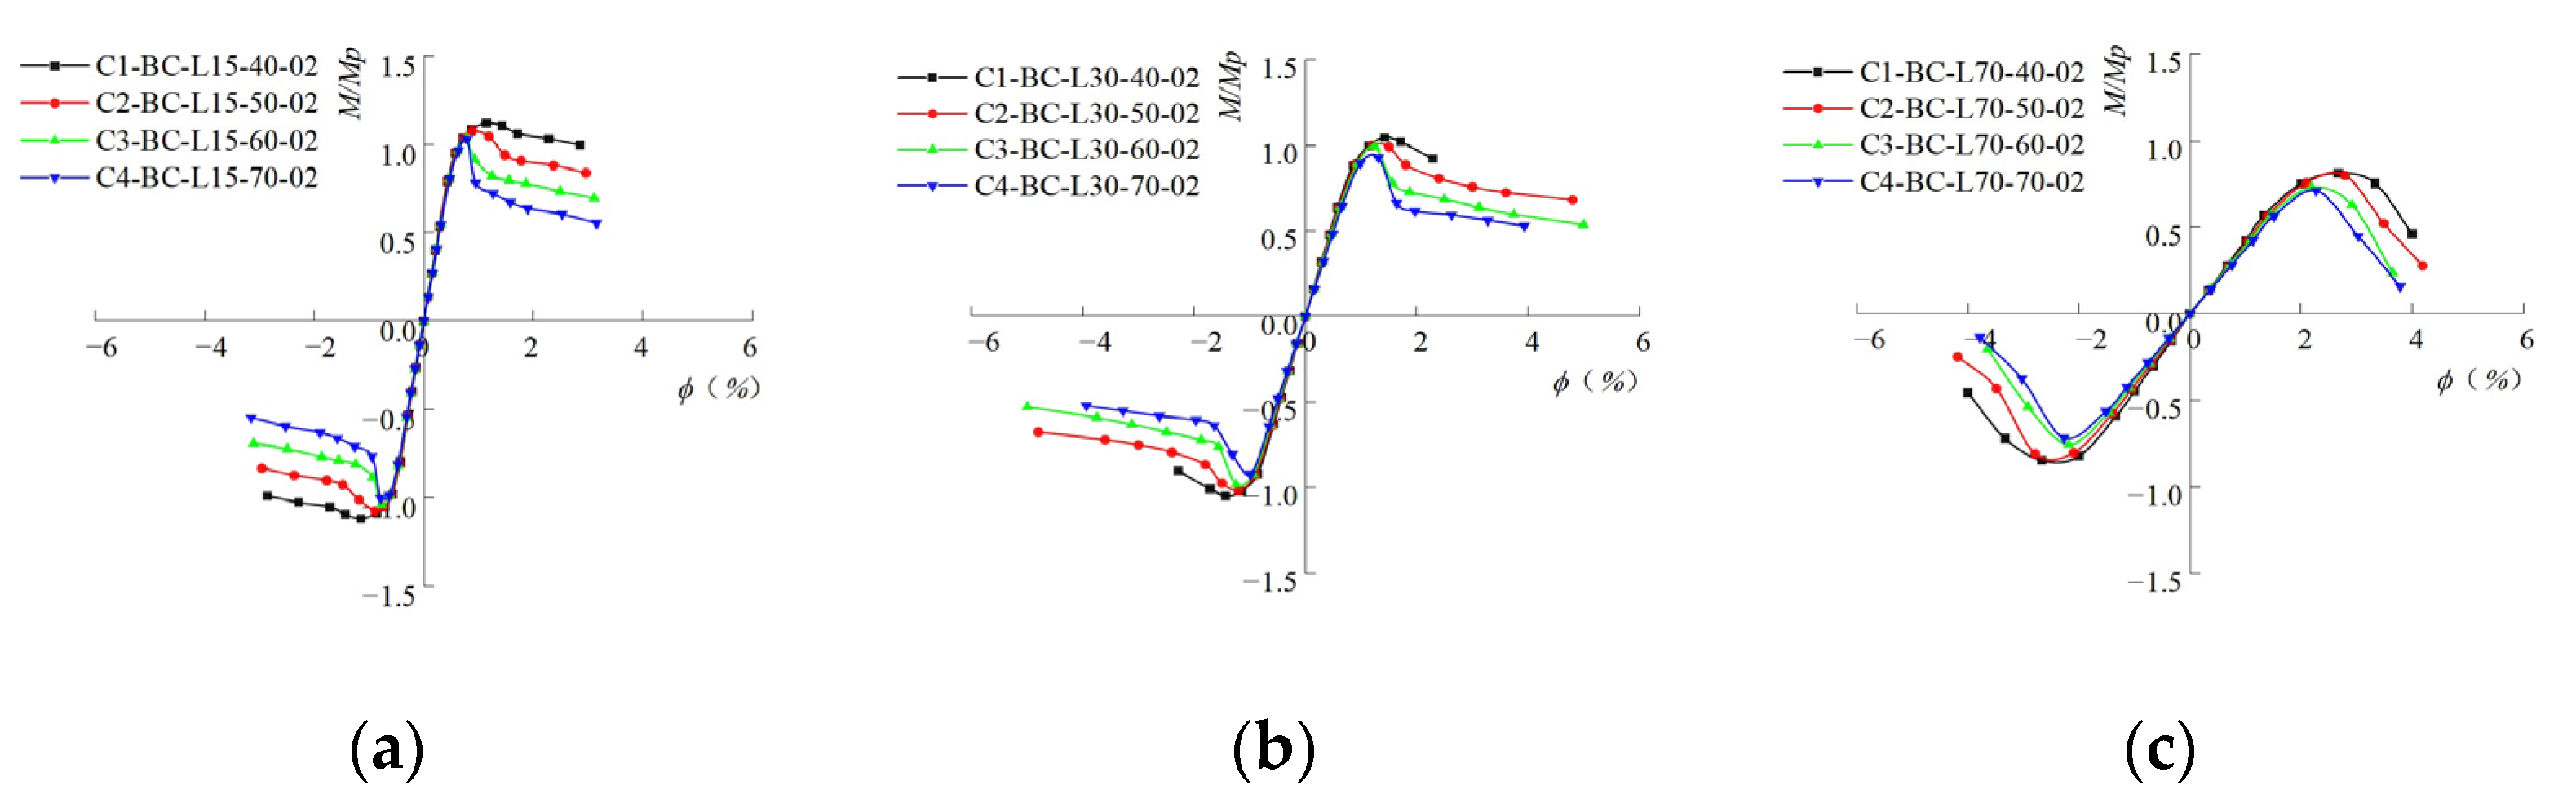
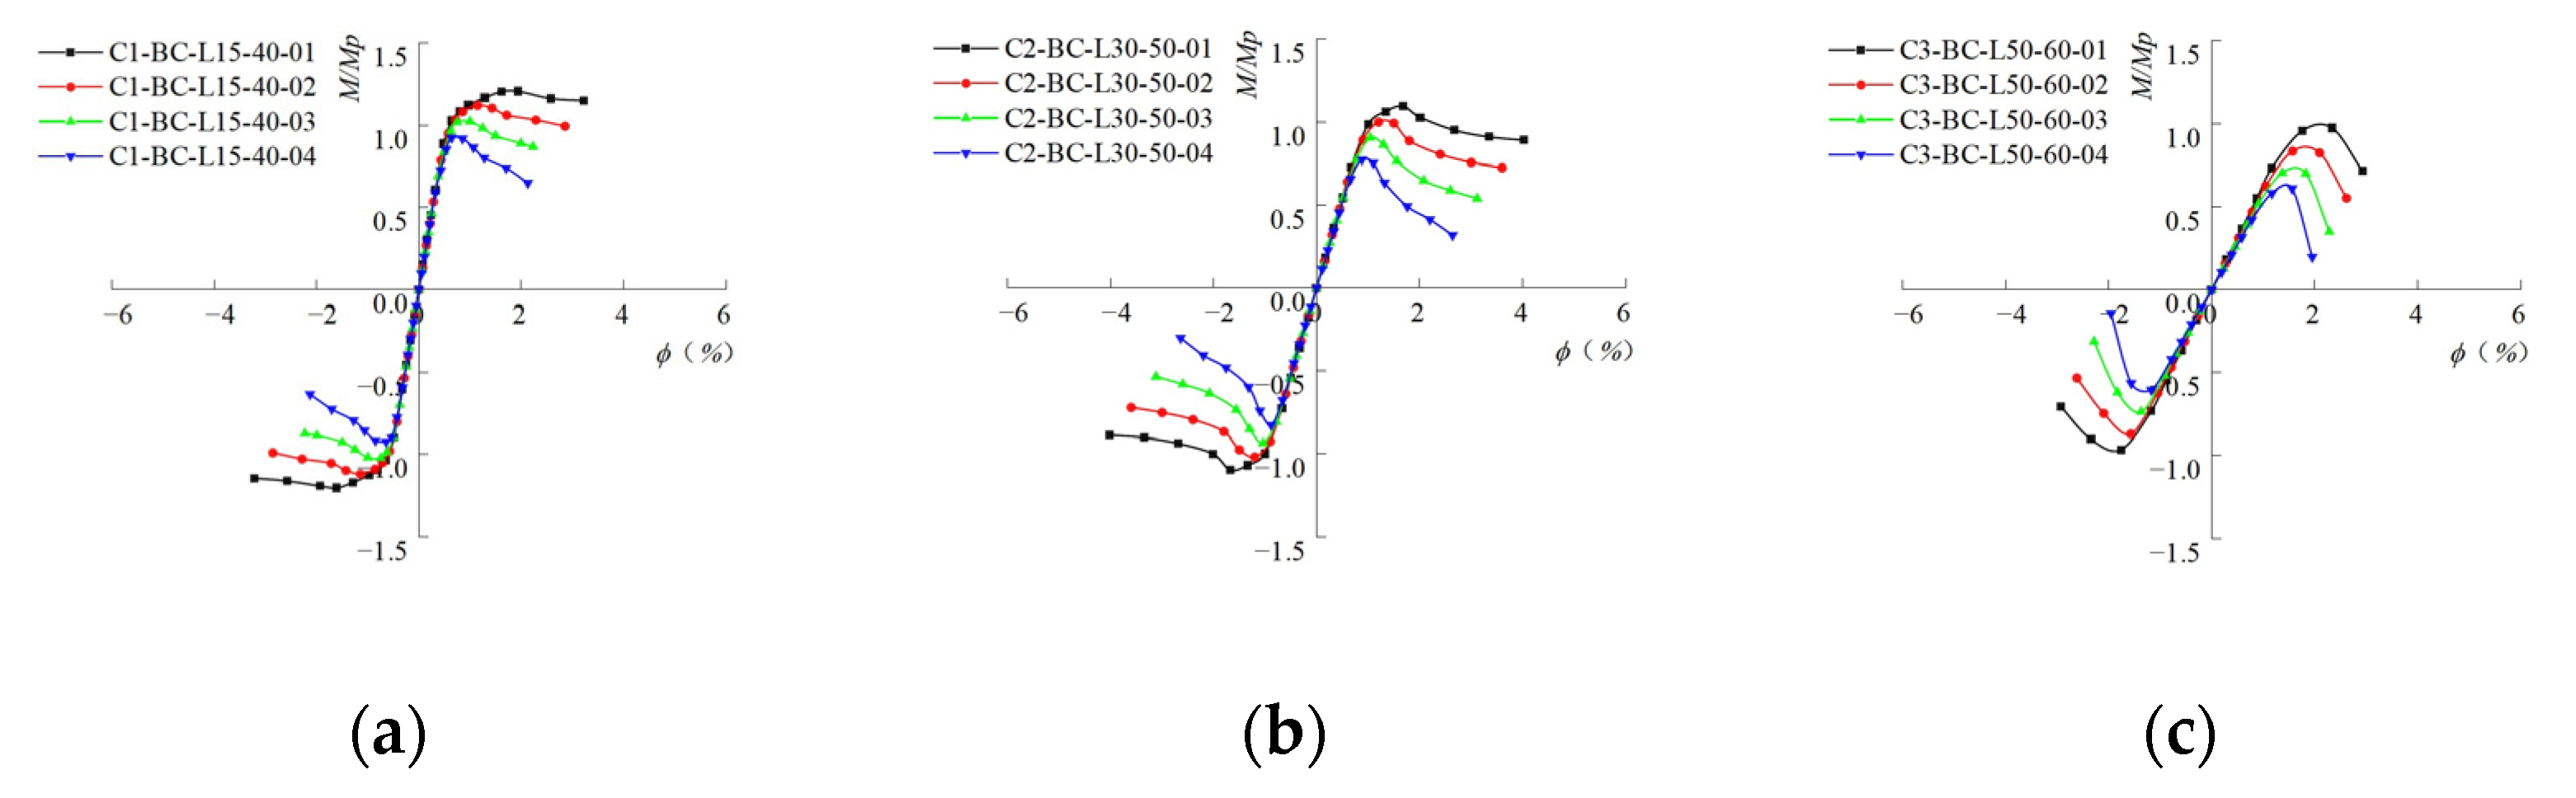
3.2.2. Skeleton Curve
- 1.
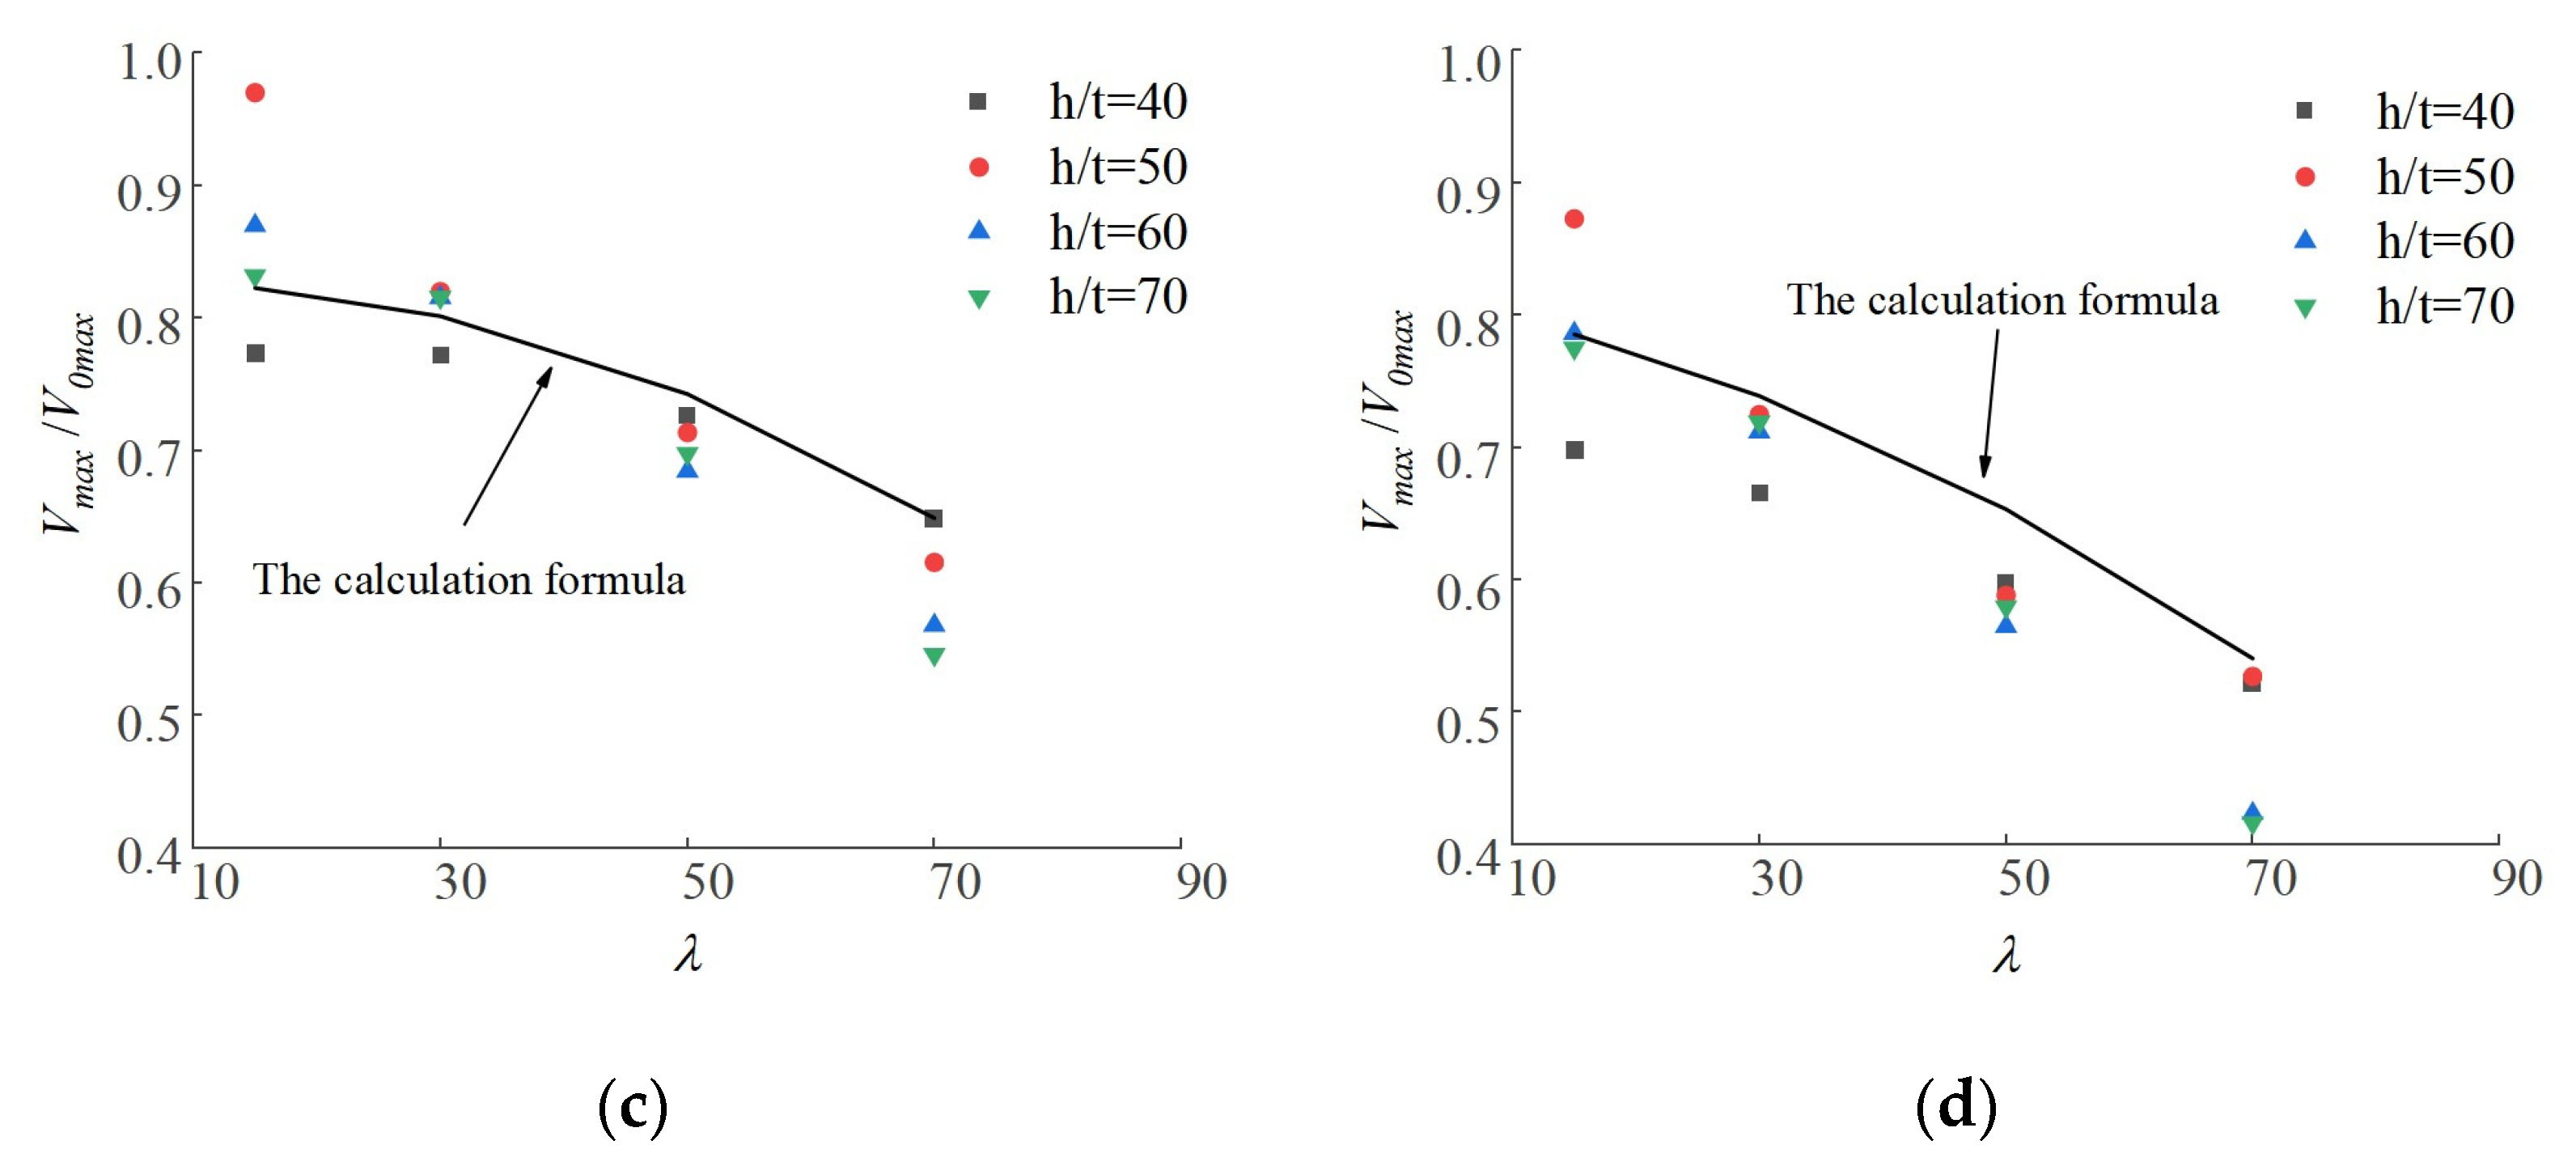
- The slenderness ratio
- 2.
- The width-to-thickness ratio
- 3.
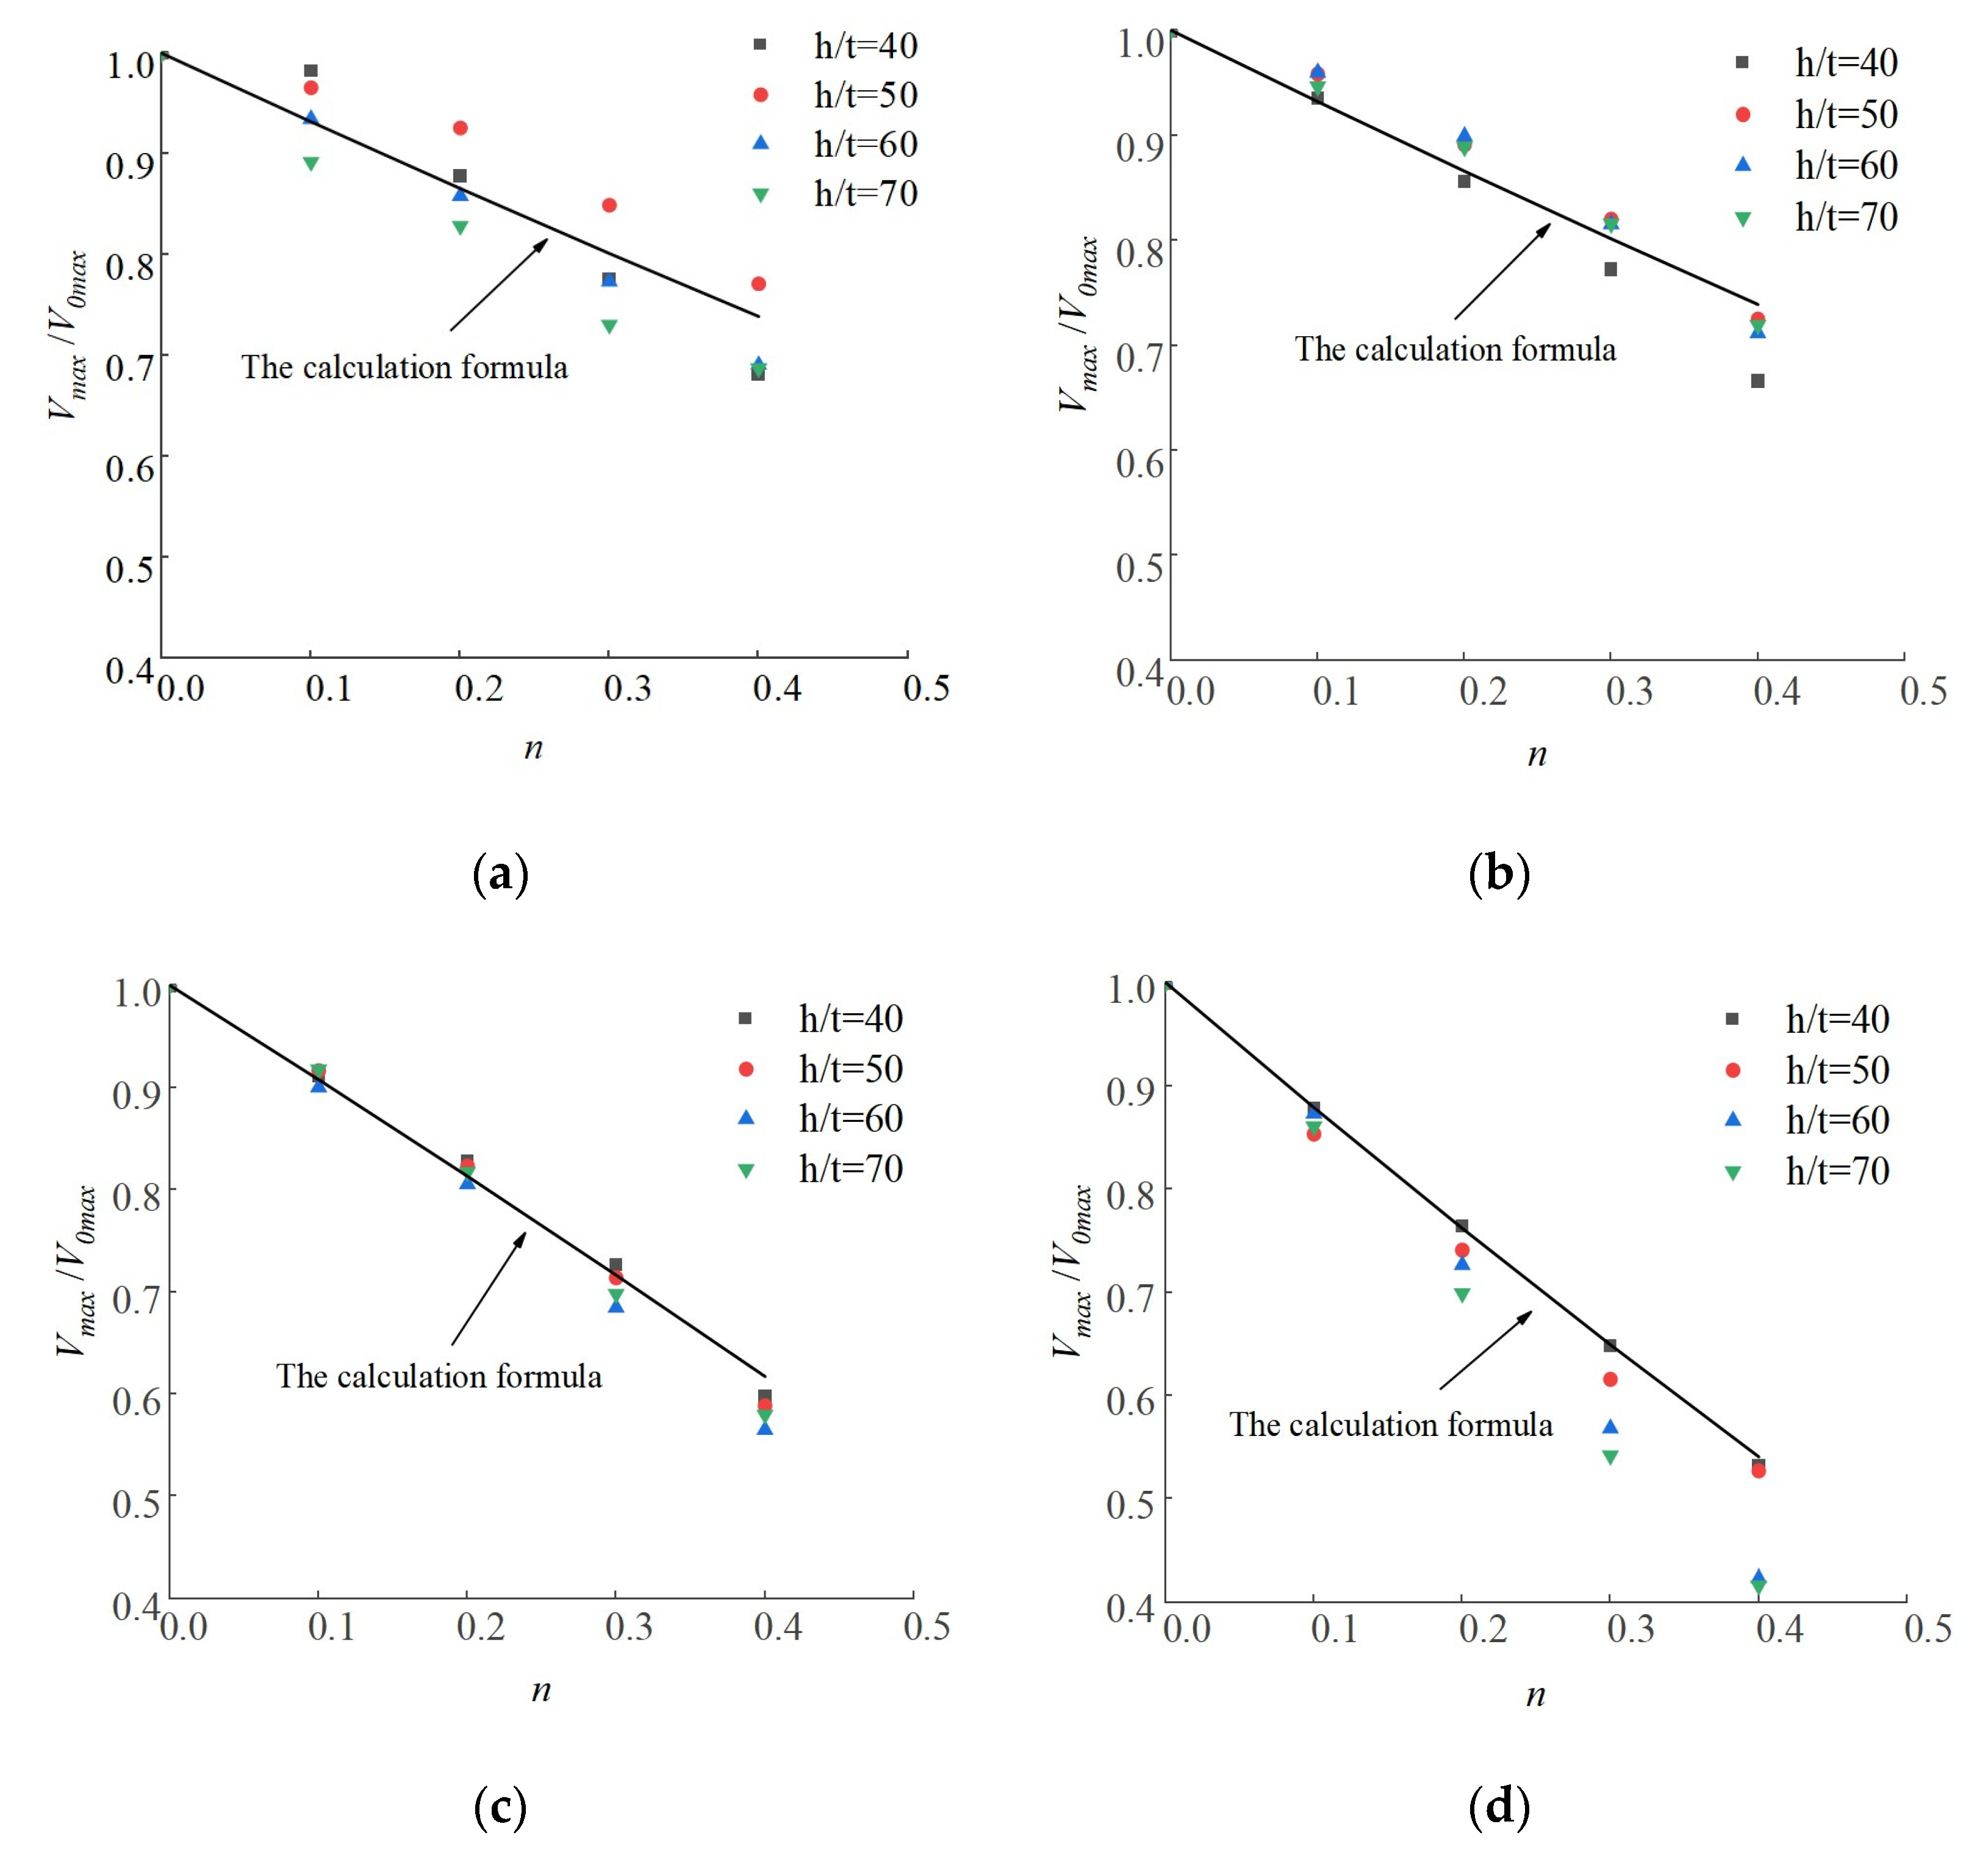
- Axial compression ratio
3.2.3. Analysis of Hysteretic Behavior of Beam-Column Member
- 1.
- Ductility
- 2.
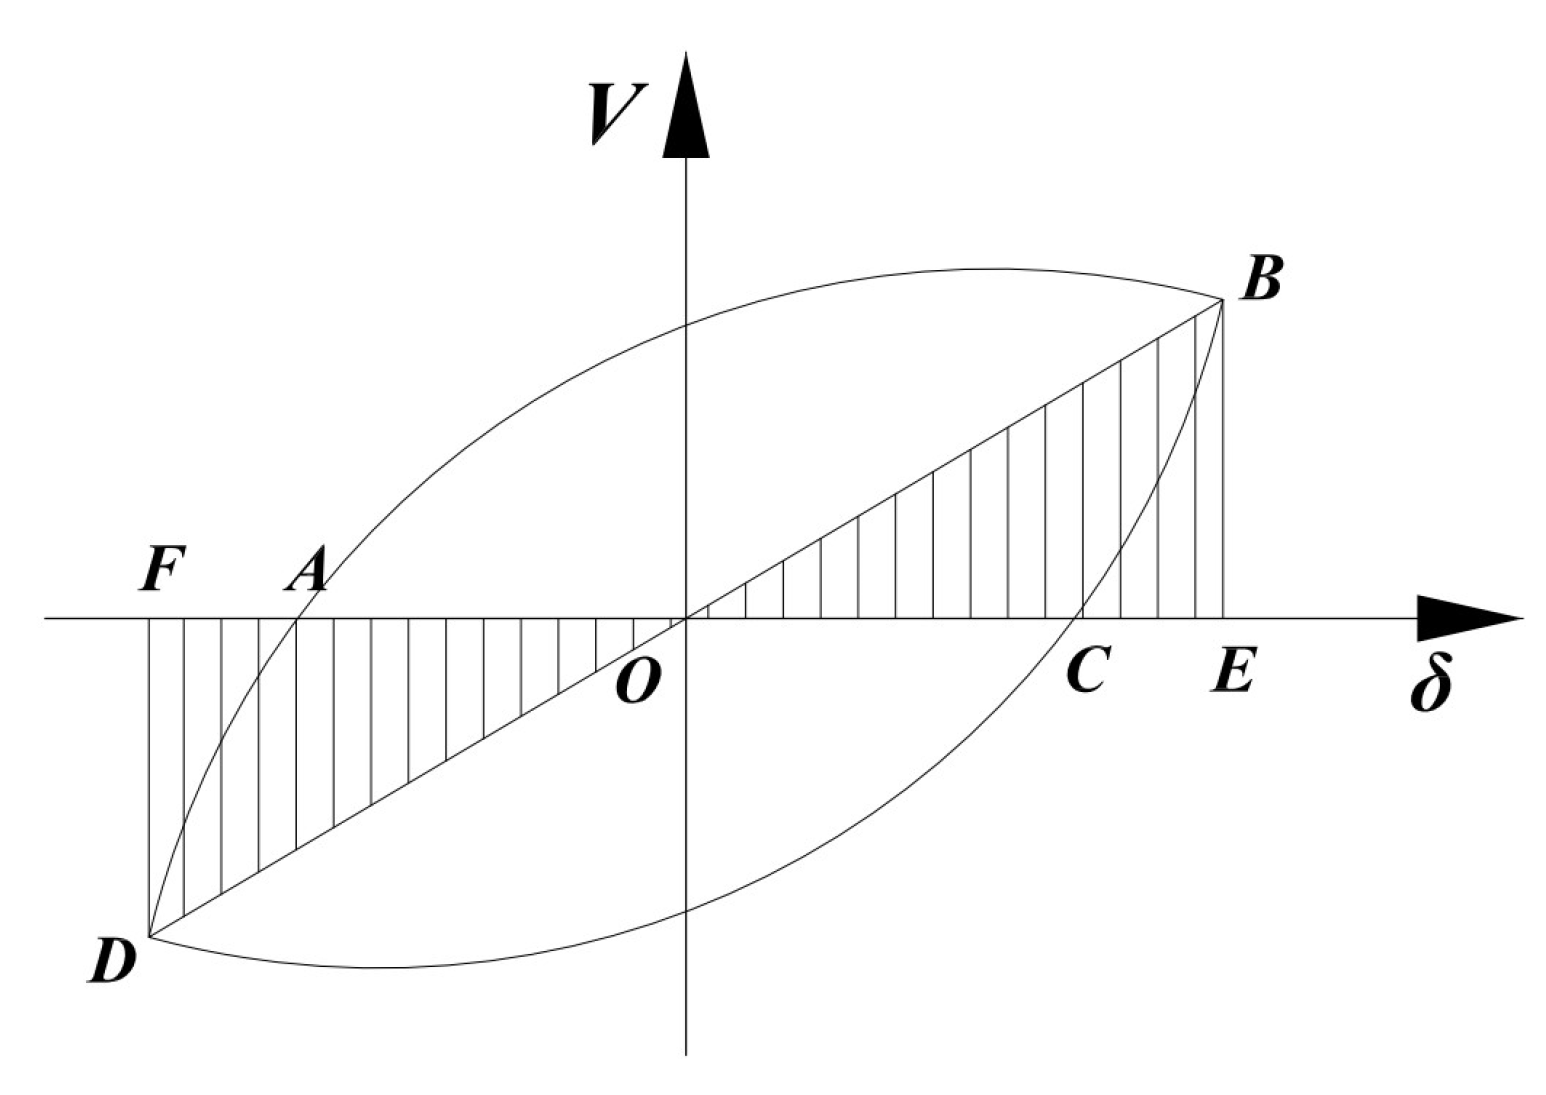
- Energy dissipation behavior
- 3.
- Stiffness degradation
4. Simplify and Establishment of Restoring Force Model
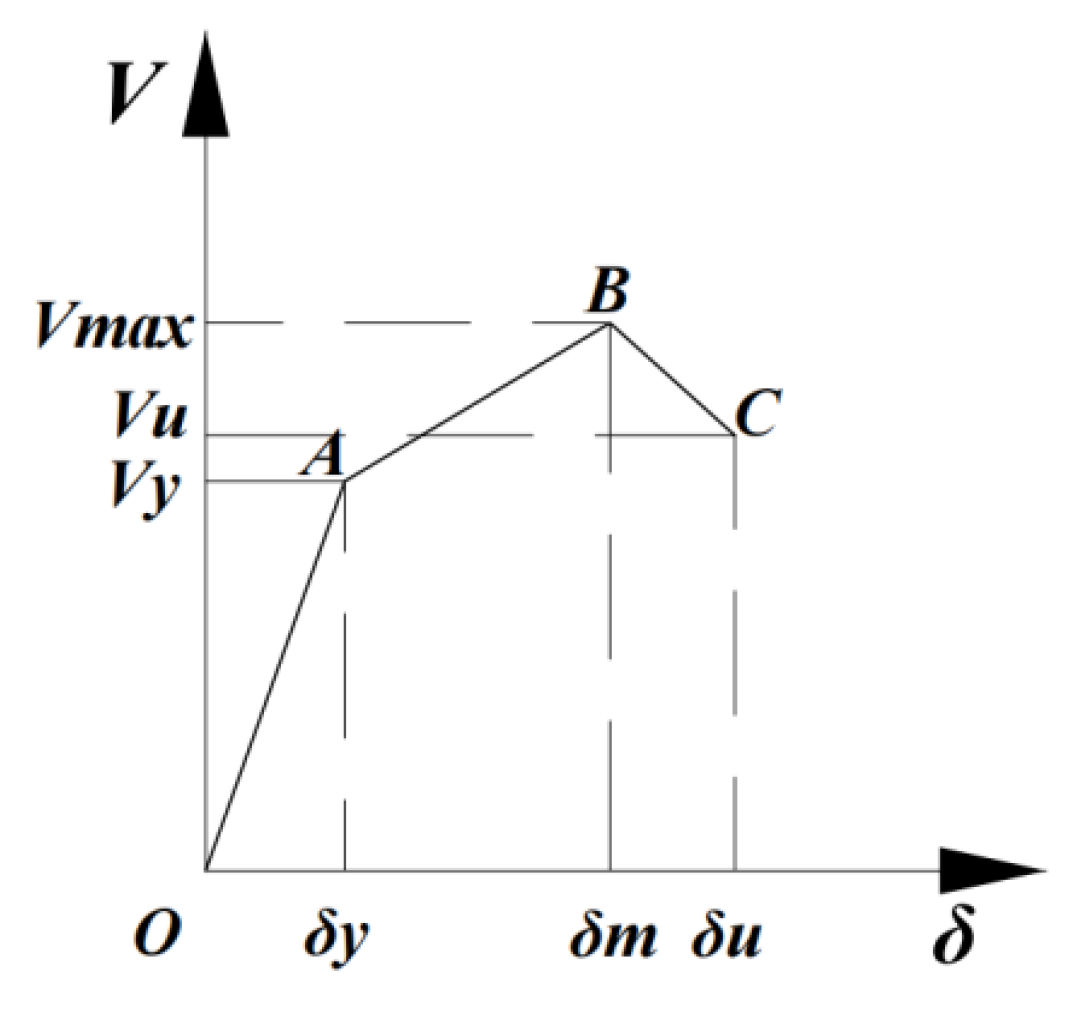
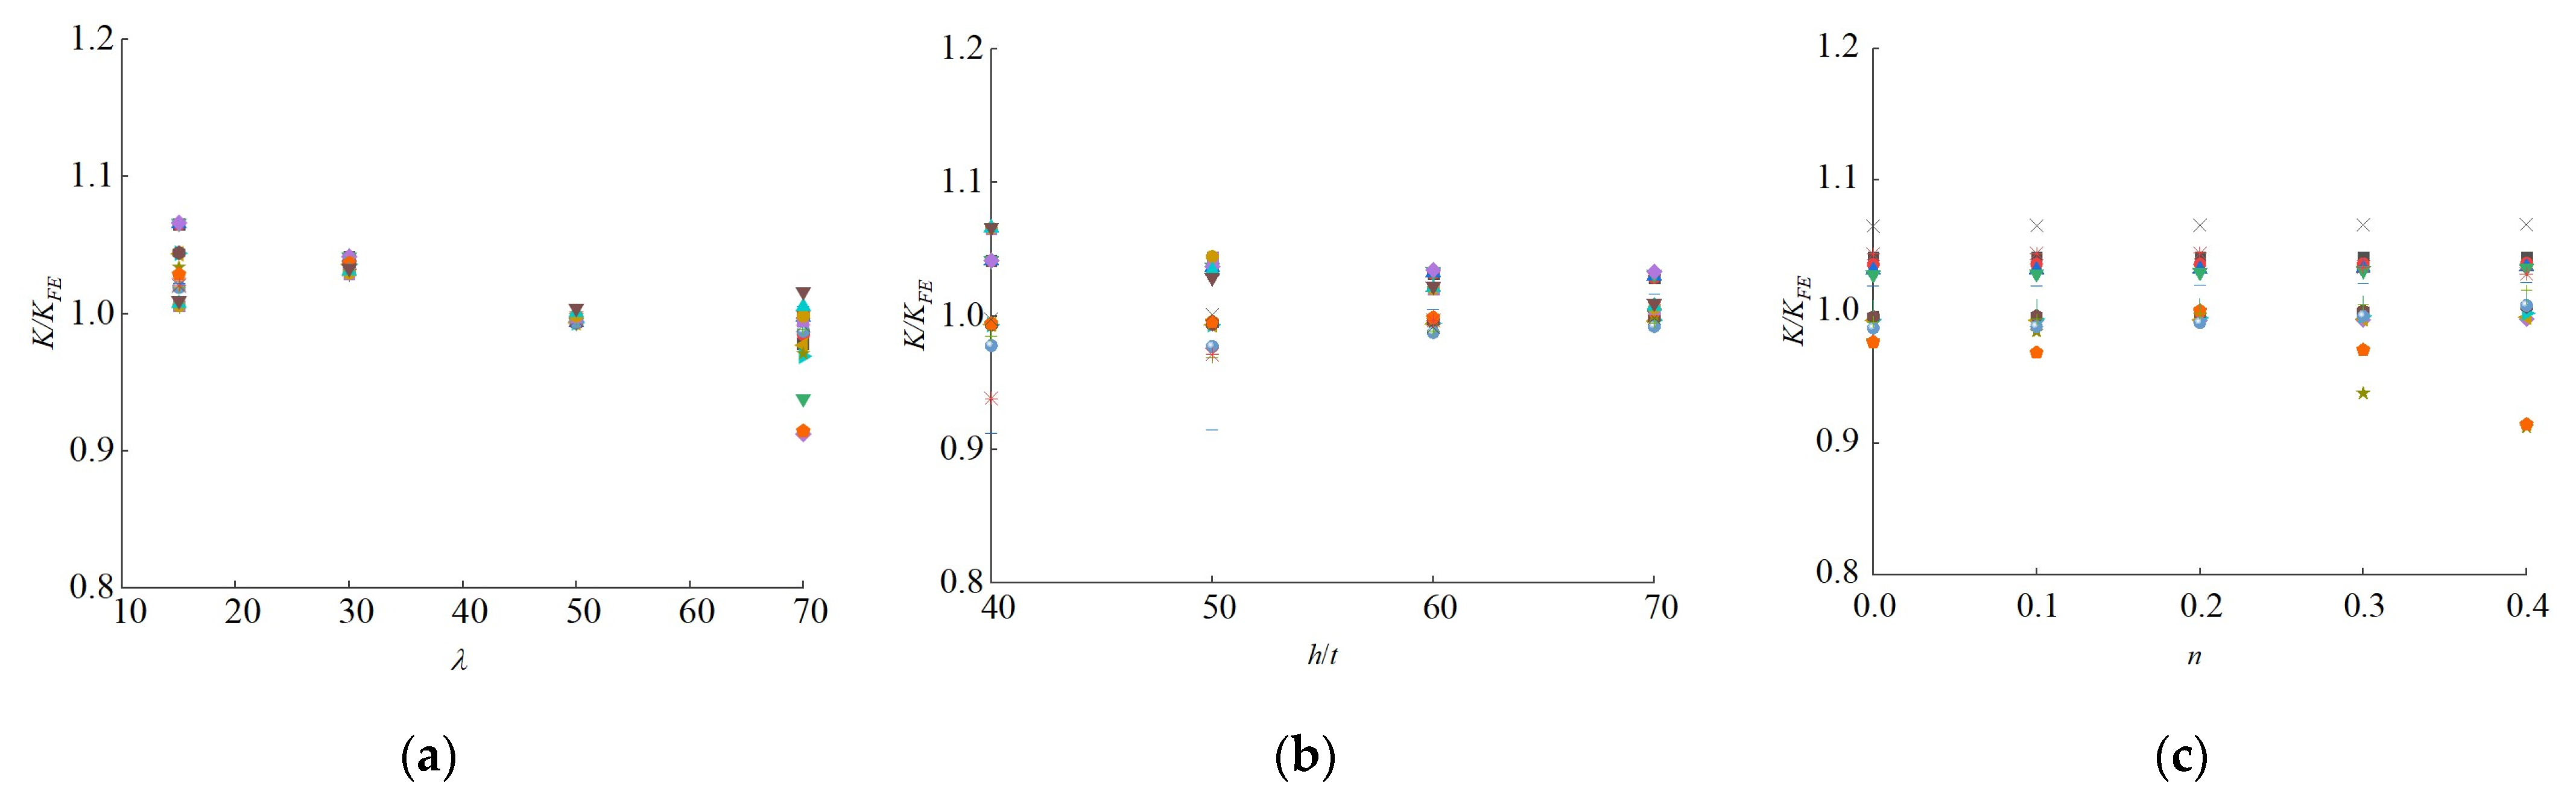
4.1. Skeleton Curve Model
- 1.
- Peak load Vmax
- 2.
- Yield load Vy
- 3.
- Ultimate load Vu
- 4.
- Yield displacement δy
- 5.
- Peak displacement δm
- 6.
- Ultimate displacement δu
4.2. Simplify Restoring Force Model
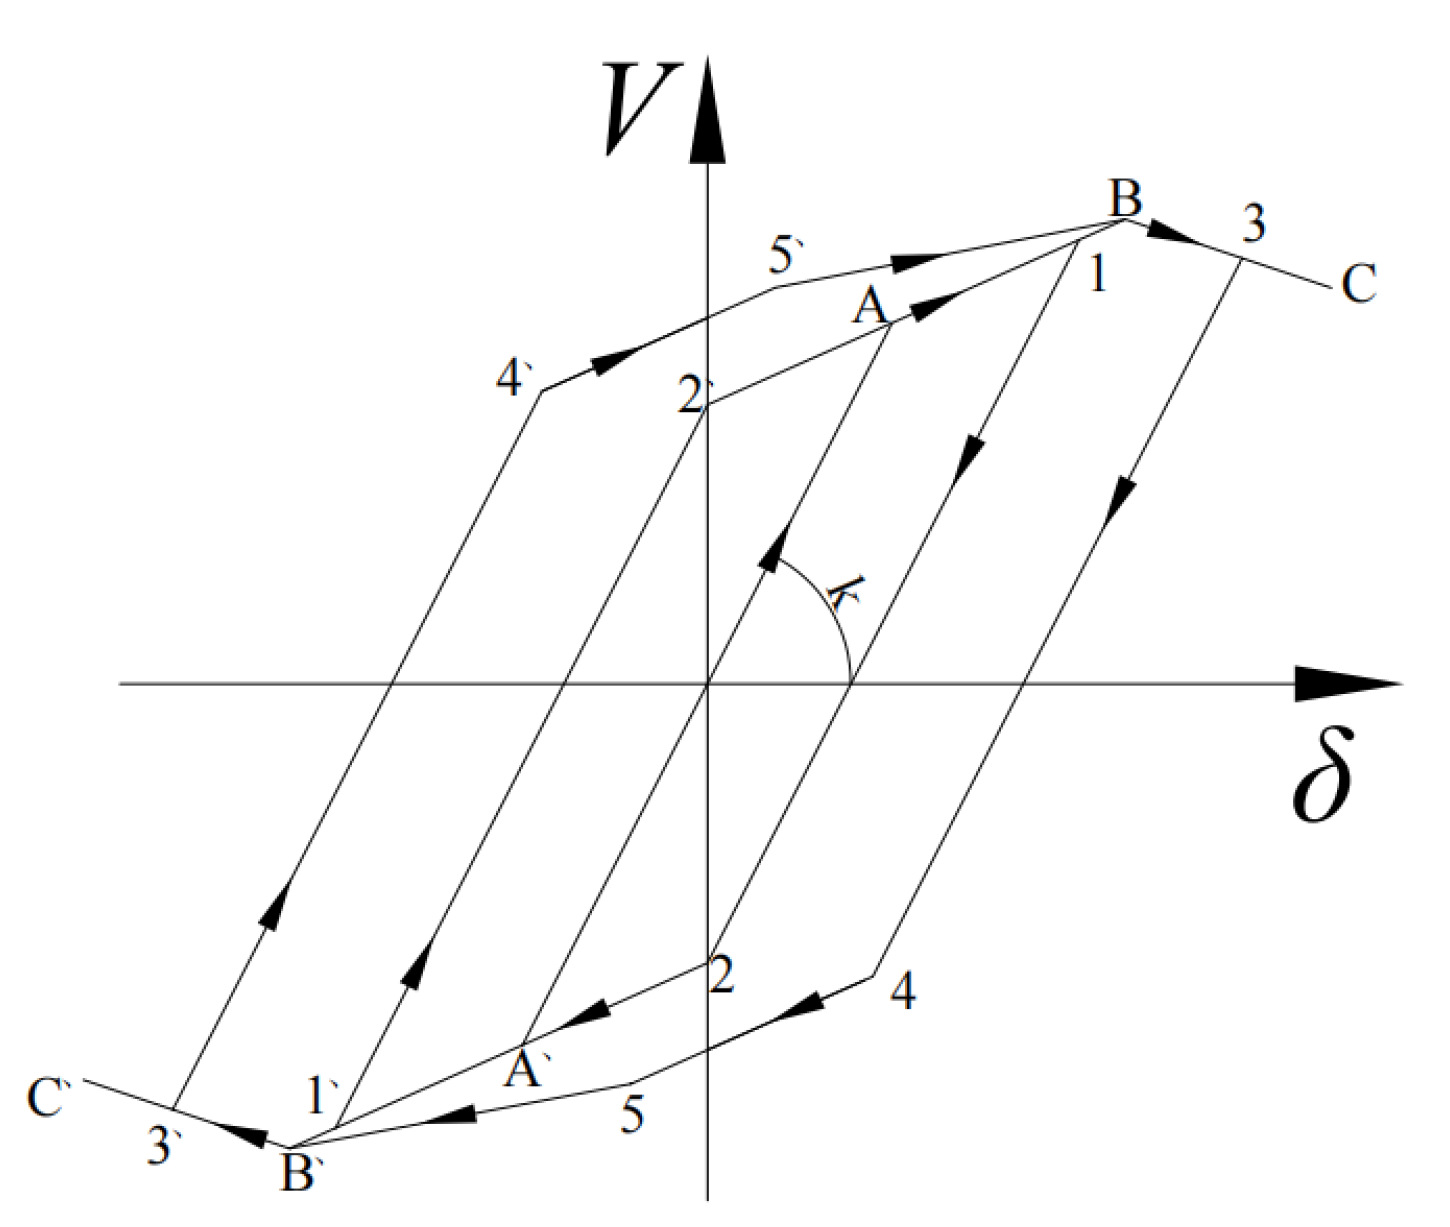
4.2.1. Hysteresis Rules
- SRFM for CFTWS lipped channel members failed with strength or global buckling
- 2.
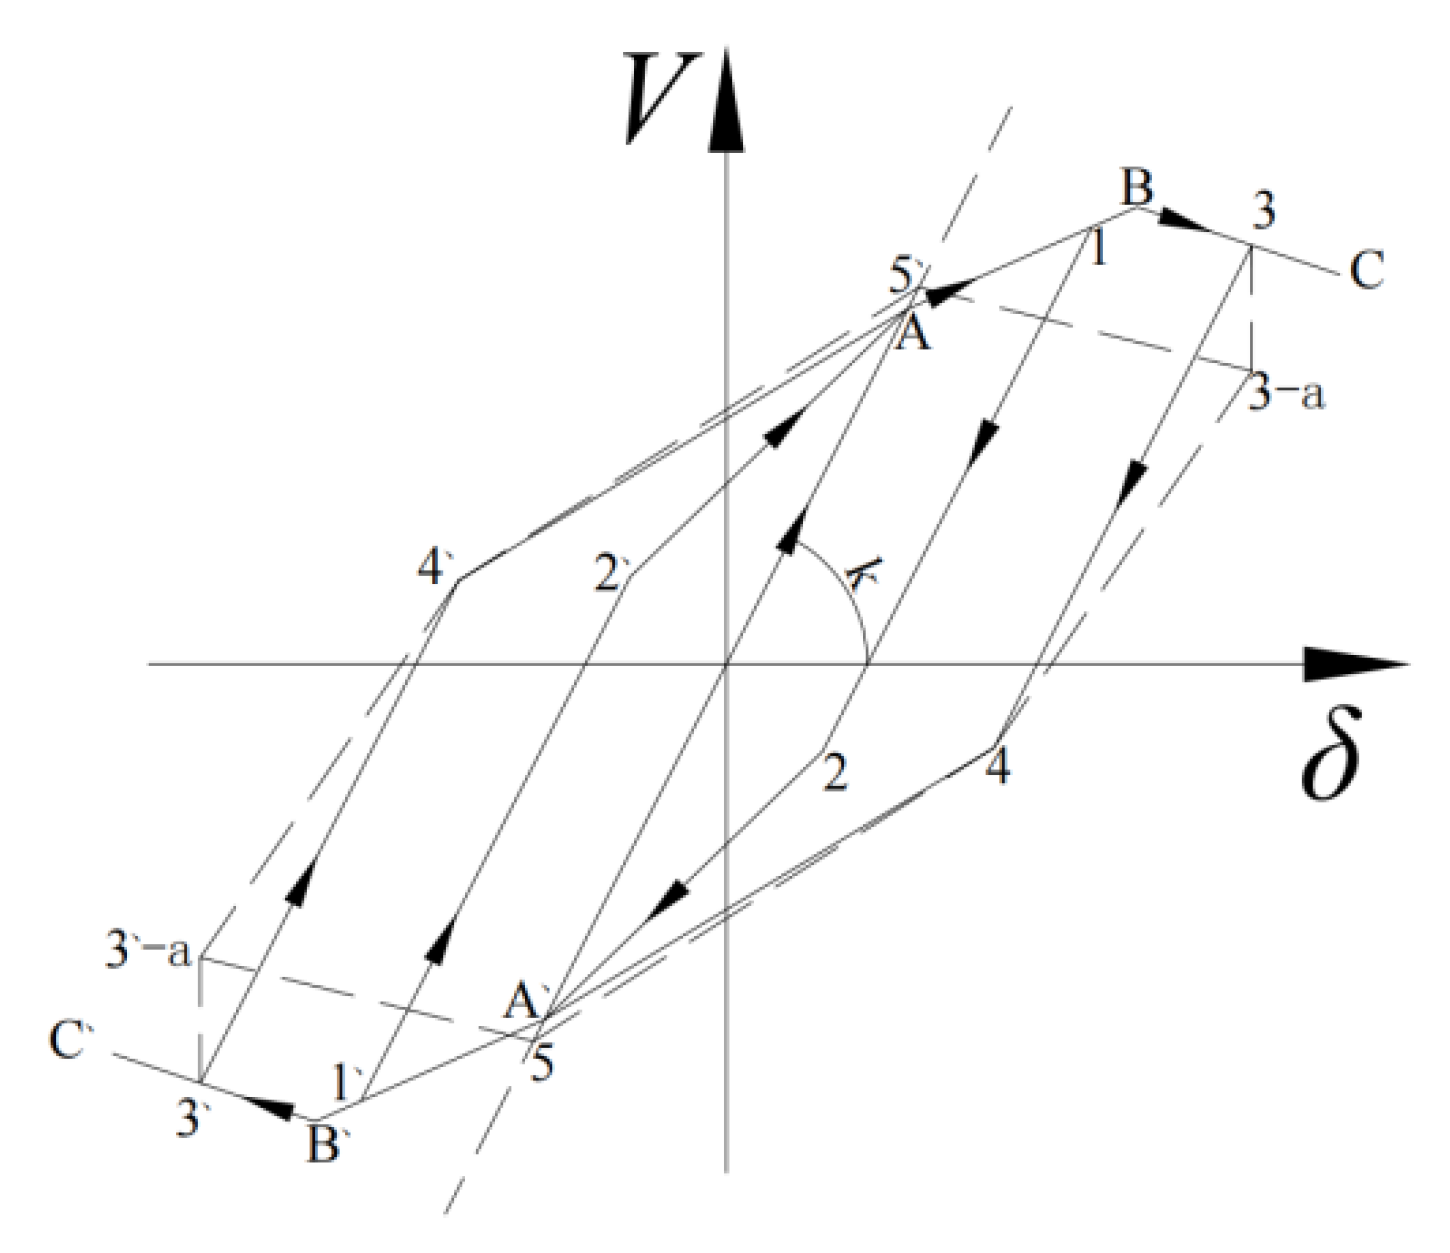
- SRFM model for CFTWS lipped channel members failed with local buckling
- 3.
- SRFM model for CFTWS lipped channel members failed with distortional buckling
- 4.
- SRFM for CFTWS lipped channel members failed with interactive buckling
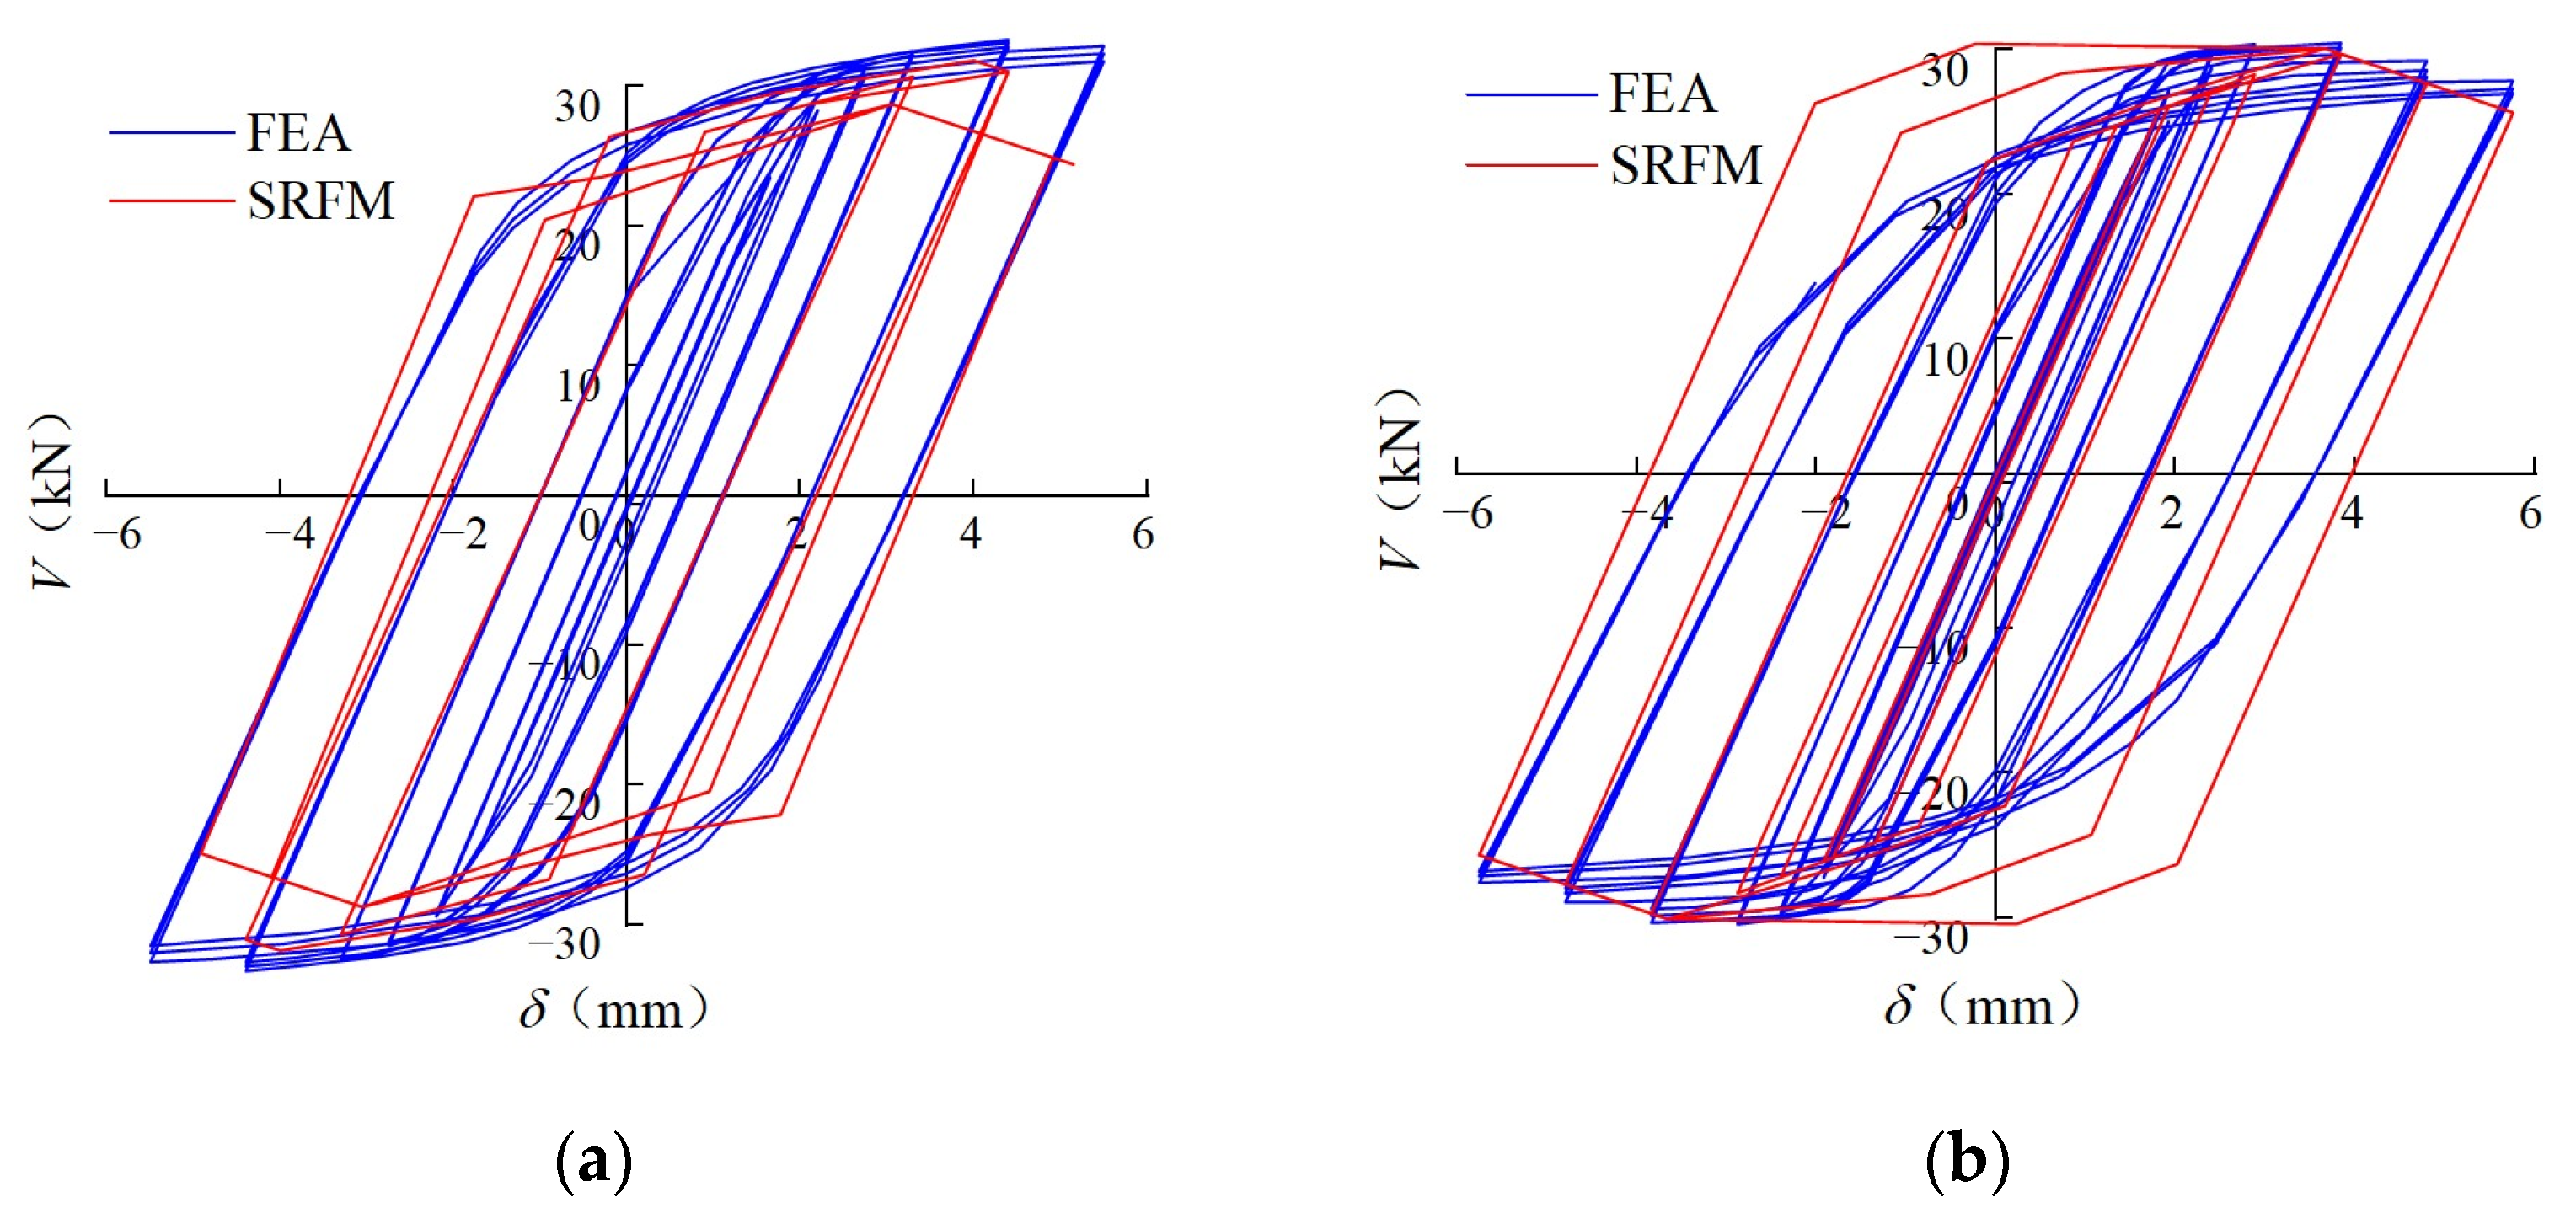
4.2.2. Verification of Simplify Restoring Force Model
- The comparison on the hysteresis curves between the proposed SRFM and the FEA model for CFTWS lipped channel members failed with strength is shown in Figure 27.
- The comparison on the hysteresis curves between the proposed SRFM and the FEA model for CFTWS lipped channel members failed with global buckling is shown in Figure 28.
- The comparison on the hysteresis curves between the proposed SRFM and the FEA model for CFTWS lipped channel members failed with local buckling is shown in Figure 29.
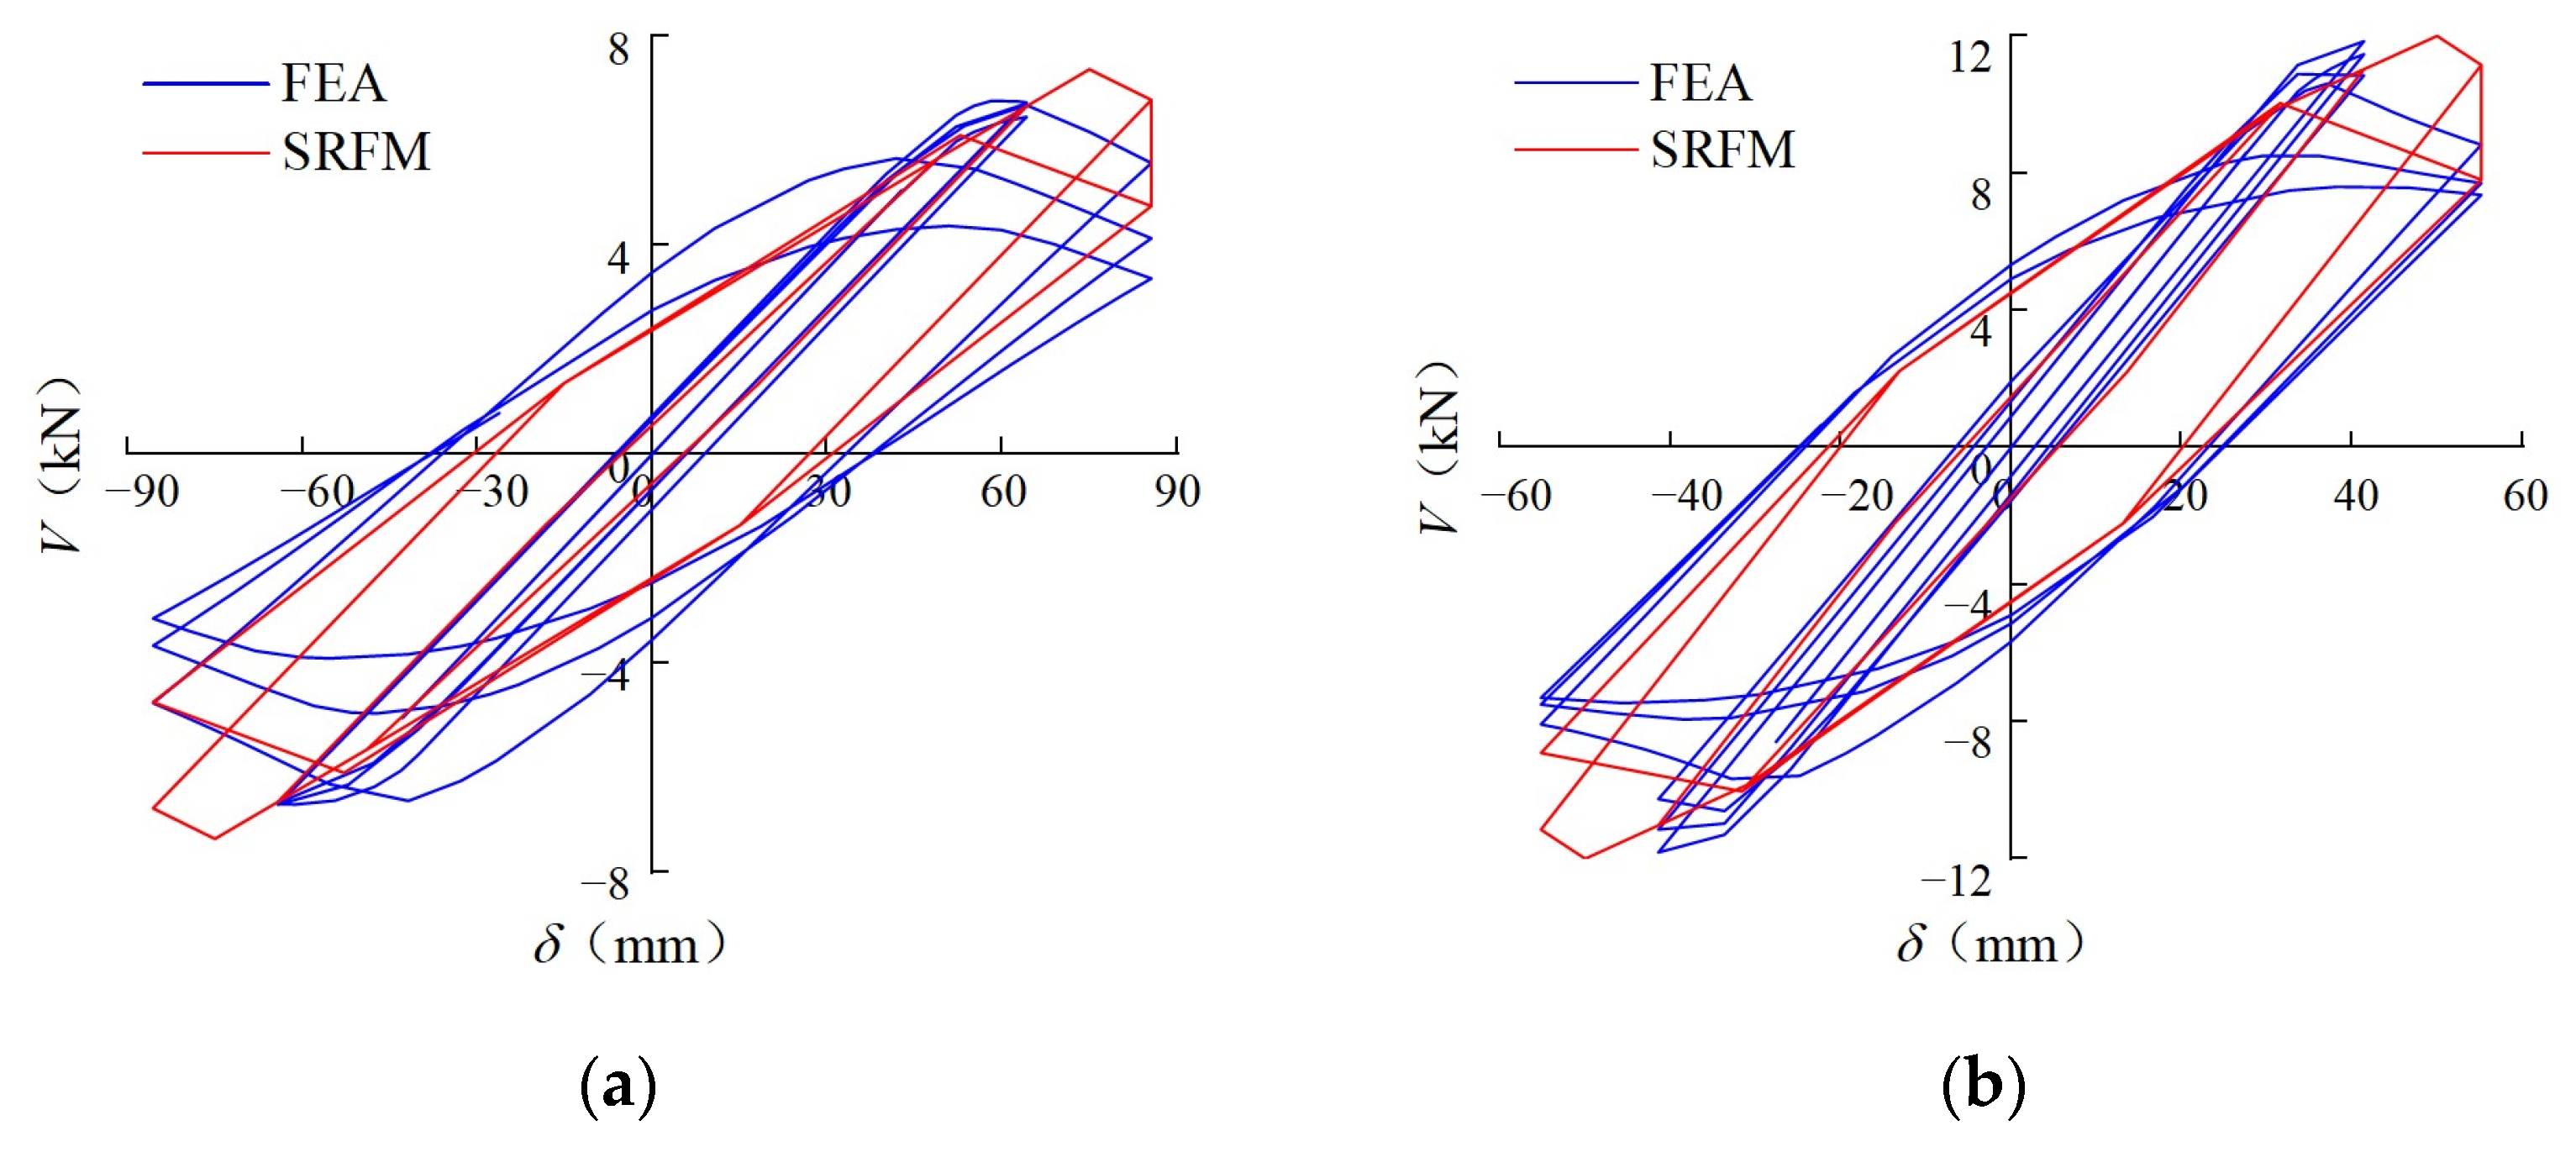
- The comparison on the hysteresis curves between the proposed SRFM and the FEA model for CFTWS lipped channel members failed with distortional buckling is shown in Figure 30.
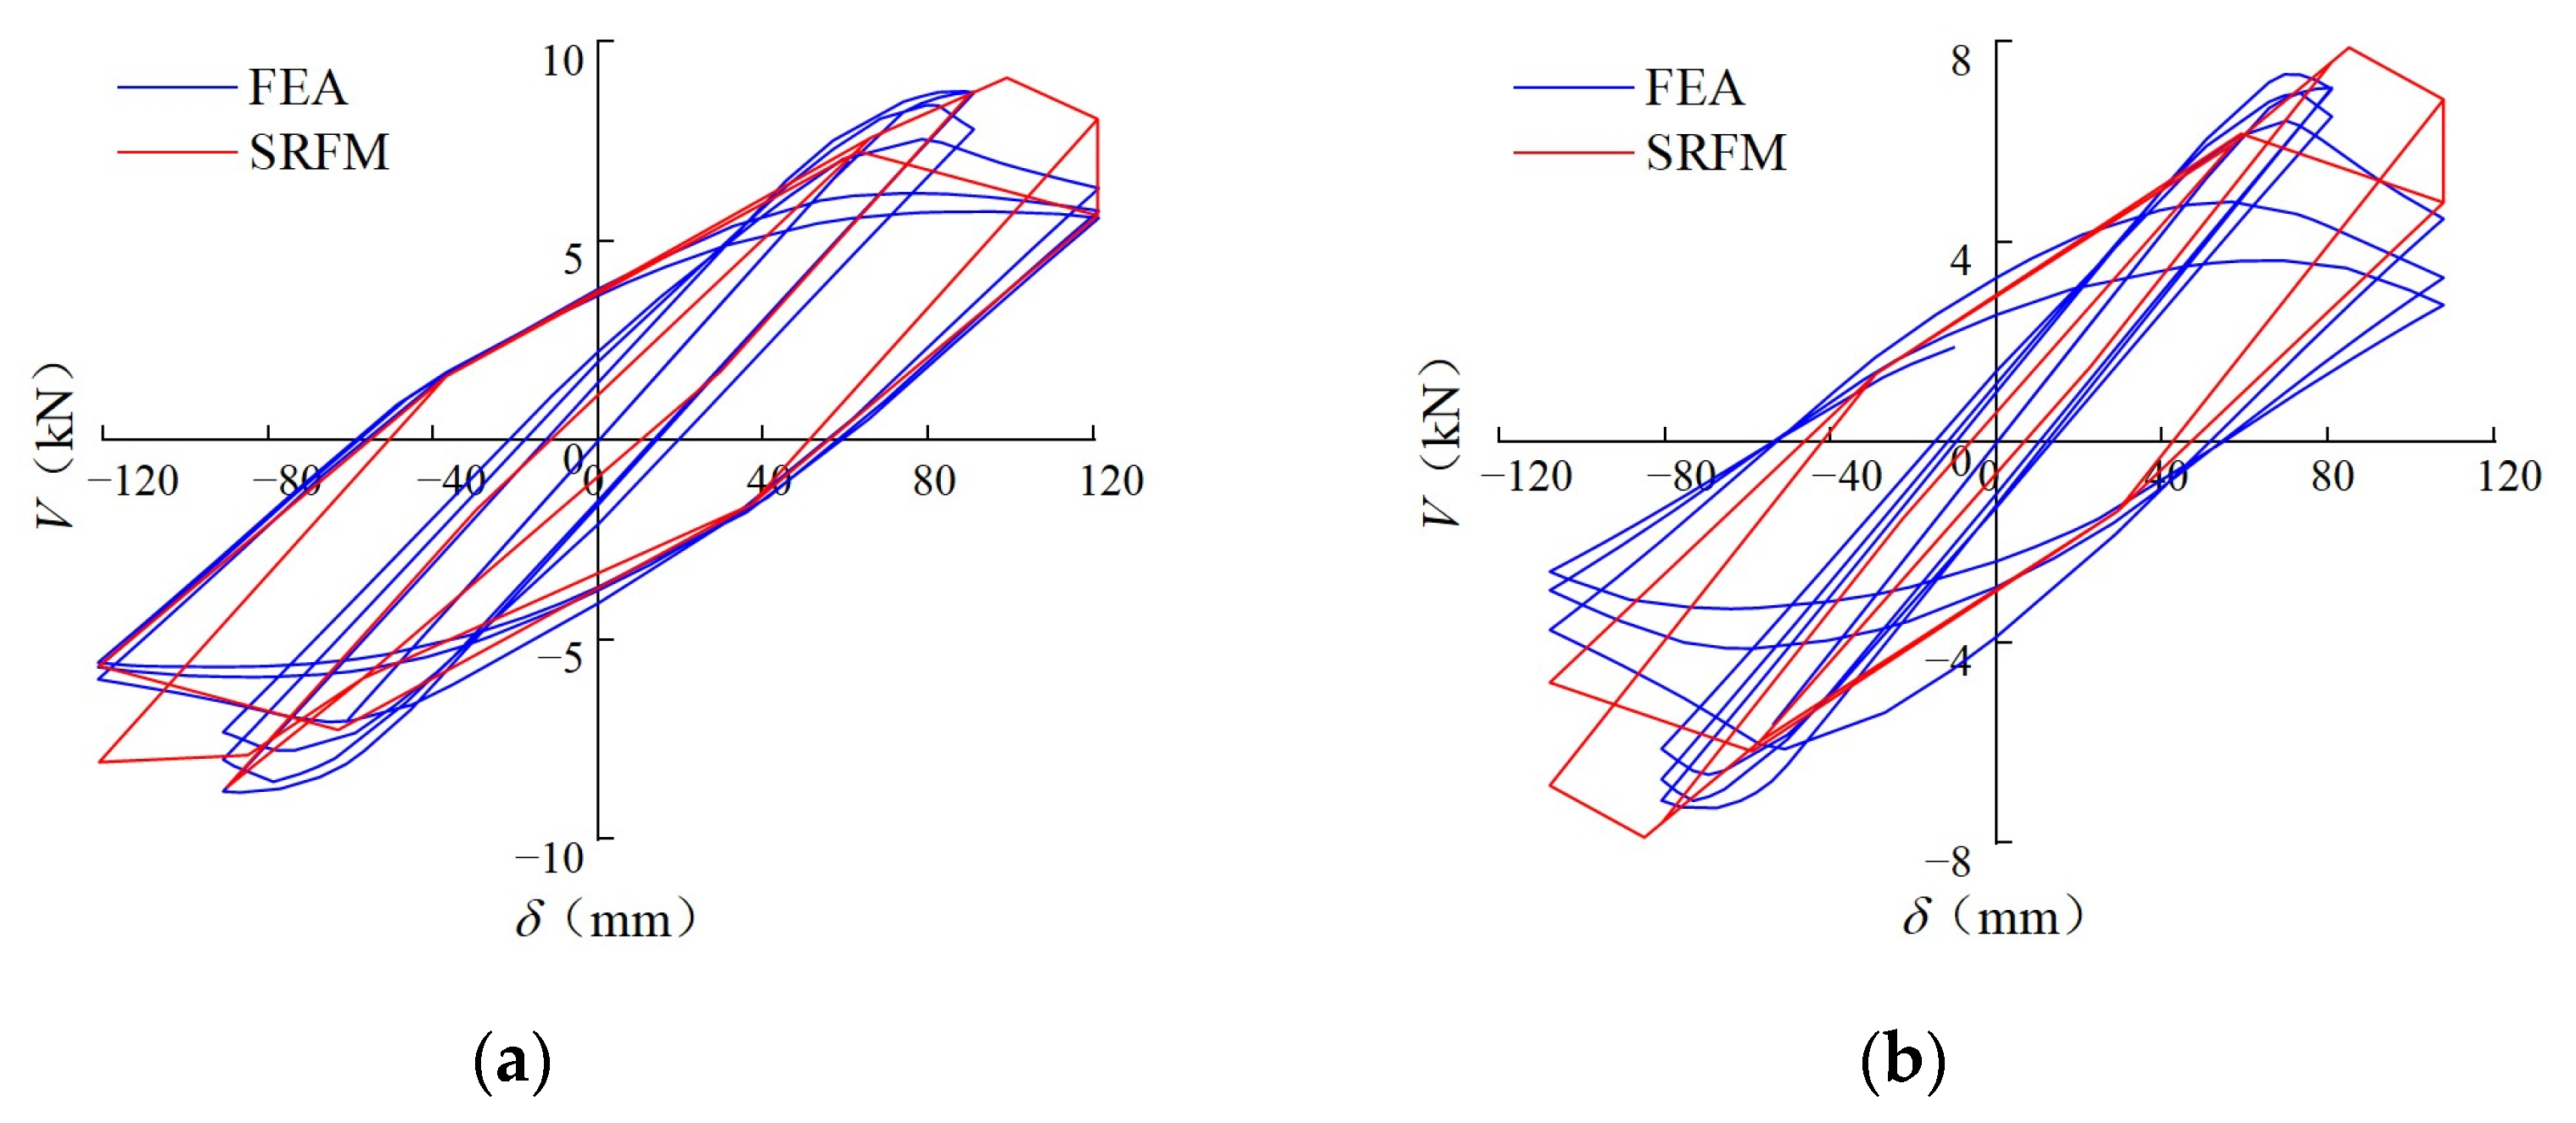
- The comparison on the hysteresis curves between the proposed SRFM and the FEA model for CFTWS lipped channel members failed with distortional and global coupling instability is shown in Figure 31.
- The comparison on the hysteresis curves between the proposed SRFM and the FEA model for CFTWS lipped channel members failed with local and global coupling instability is shown in Figure 32.
5. Conclusions
- (1)
- The hysteresis characteristics of the CFTWS lipped channel beam-column members are mainly affected by the ratio of width-to-thickness, the slenderness ratio and axial compression ratio. The larger the slenderness ratio, the smaller the plastic moment that the member can withstand and the faster the stiffness degenerates. The ductility of the member decreases and the degradation of stiffness increases with the increase of the width-to-thickness ratio. With the increase of the axial compression ratio, the lower the ductility of the member decreases, the stiffness degradation increases, the plastic moment that can be tolerated is reduced and the energy consumption capacity is weakened.
- (2)
- According to the analysis on the influence of the width-to-thickness ratios, the slenderness ratios and axial compression ratios on the beam-column members, the failure modes of the CFTWS lipped channel beam-column members can be divided into six modes: strength failure, local buckling, distortional buckling, global buckling, interactive buckling of local buckling and global buckling, interactive buckling of distortional buckling and global buckling. CFTWS lipped channel beam-column members with the strength failure and local buckling show good seismic performance. The members with local buckling have a considerable local buckling reserve.
- (3)
- Based on the results of finite element parametric analysis, a skeleton curve model suitable for the CFTWS lipped channel beam-column members is proposed through data regression analysis. By analyzing the hysteresis curve of the FEA, the SRFM under different buckling modes are established. The comparisons on the hysteresis curve between the FEA and proposed method show that the proposed SRFM can indicate greatly the characteristics of the hysteretic behavior of the CFTWS lipped channel beam-column member.
Author Contributions
Funding
Data Availability Statement
Conflicts of Interest
References
- Hancock, G.J.; Rasmussen, K.J.R. Recent research on thin-walled beam-columns. Thin-Walled Struct. 1998, 32, 3–18. [Google Scholar] [CrossRef]
- Hancock, G.J. Cold-formed steel structures. J Constr Steel Res. 2003, 59, 473–487. [Google Scholar] [CrossRef]
- Kumar, S.; Usami, T. An evolutionary-degrading hysteretic model for thin-walled steel structures. Eng Struct. 1996, 18, 504–514. [Google Scholar] [CrossRef]
- Usami, T.; Ge, H.B. Cyclic behavior of thin-walled steel structures—Numerical analysis. Thin-Walled struct. 1998, 32, 41–80. [Google Scholar] [CrossRef]
- Goggins, J.M.; Broderick, B.M.; Elghazouli, A.Y.; Lucas, A.S. Experimental cyclic response of cold-formed hollow steel bracing members. Eng Struct. 2005, 27, 977–989. [Google Scholar] [CrossRef]
- Goggins, J.M.; Broderick, B.M.; Elghazouli, A.Y.; Lucas, A.S. Behaviour of tubular steel members under cyclic axial loading. J. Constr. Steel Res. 2006, 62, 121–131. [Google Scholar] [CrossRef] [Green Version]
- Yang, N.; Zhong, Y.N.; Meng, Q.T.; Zhang, H. Hysteretic behaviors of cold-formed steel beam-columns with hollow rectangular section: Experimental and numerical simulations. Thin-Walled Struct. 2014, 80, 217–230. [Google Scholar] [CrossRef]
- Padilla-Llano, D.A.; Moen, C.D.; Eatherton, M.R. Cyclic axial response and energy dissipation of cold-formed steel framing members. Thin-Walled Struct. 2014, 78, 95–107. [Google Scholar] [CrossRef]
- Padilla-Llano, D.A.; Eatherton, M.R.; Moen, C.D. Cyclic flexural response and energy dissipation of cold-formed steel framing members. Thin-Walled Struct. 2016, 98, 518–532. [Google Scholar] [CrossRef]
- Li, G.W.; Li, Y.Q.; Ji, H.; Li, T.; Zheng, J. Investigation on the hysteretic behavior of axially loaded cold-formed thick-walled steel members. Structures 2022, 38, 1411–1425. [Google Scholar] [CrossRef]
- Jiang, L.Z.; Goto, Y.; Obata, M. Hysteretic modeling of thin-walled circular steel columns under biaxial bending. J. Struct. Eng. 2002, 128, 319–327. [Google Scholar] [CrossRef]
- Shen, Z.Y.; Wen, D.H.; Li, Y.Q.; Ma, Y.F. Distribution Patterns of Material Properties for Cross-section of Cold-formed Thick-walled Steel Rectangular Tubes. J. Tongji Univ. 2016, 44, 981–990. (In Chinese) [Google Scholar]
- Wen, D.H. Research on Seismic Behavior of Cold-Formed Thick-Wall Steel Beam-Column Members; Tongji University: Shanghai, China, 2014. [Google Scholar]
- Fu, X.C.; Li, Y.Q.; Shen, Z.Y. Research on the seismic behaviors of opening cold-formed thick-walled steel under the axial cyclic loading. J. Hebei Univ. Eng. 2016, 33, 1–7. (In Chinese) [Google Scholar]
- Fu, X.C. Research on the Seismic Performance of Open-Section Cold-Formed Thick-Walled Steel Members; Tongji University: Shanghai, China, 2016. [Google Scholar]
- Chen, L.C.; Cheng, X.; Chen, Y.Y. Research on restoring force model of H-section steel members under uniaxial compression and bending considering local buckling. Eng. Mech. 2021, 38, 80–92. (In Chinese) [Google Scholar]
- Yang, N.; Peng, X. Research on hysteretic model and buckling mechanism of cold-formed C-section steel column. China Civ. Eng. J. 2015, 48, 25–33. (In Chinese) [Google Scholar]
- Yang, N.; Peng, X.; Yang, Q.S. Analysis of hysteretic performance of C-section specimens of cold-formed steel. J. Civ. Archit. Environ. Eng. 2012, 34, 69–76. (In Chinese) [Google Scholar]
- Liu, Z.Q.; Du, Z.Y.; Xue, J.Y.; Zhou, C.F. Study on damage-based restoring force model of steel reinforced concrete special-shaped columns. Eng. Mech. 2022, 36–147. [Google Scholar]
- Wang, T.; Jiang, R.N.; Yuan, S.F.; Yuan, K.; Li, L.W.; Zhou, G.Y. A Restoring Force Model for Prefabricated Concrete Shear Walls with Built-In Steel Sections. Appl. Sci. 2021, 11, 12131. [Google Scholar] [CrossRef]
- Zhao, J.; Dun, H.H. A restoring force model for steel fiber reinforced concrete shear walls. Eng. Struct. 2014, 75, 469–476. [Google Scholar] [CrossRef]
- Wu, C.L.; Liu, X.; Pan, W.; Mou, B. Restoring force model for modular prefabricated steel-reinforced concrete column to H-shaped steel beam composite joints. J. Build. Eng. 2021, 42, 102845. [Google Scholar] [CrossRef]
- Zhang, J.W.; Zheng, W.B.; Cao, W.L.; Dong, H.Y.; Li, W.D. Seismic behavior of low-rise concrete shear wall with single layer of web reinforcement and inclined rebars: Restoring force model. KSCE J. Civ. Eng. 2019, 23, 1302–1319. [Google Scholar] [CrossRef]
- Chen, Y.; Chen, C.; Chen, C. Study on seismic performance of prefabricated self-centering beam to column rotation friction energy dissipation connection. Eng. Struct. 2021, 241, 112136. [Google Scholar]
- Liu, J.C.; Tian, L.; Ma, R.S.; Qu, B. Development of a hysteretic model for steel members under cyclic axial loading. J. Build. Eng. 2022, 46, 103798. [Google Scholar] [CrossRef]
- Lam, S.S.E.; Chung, K.; Wang, X. Load-carrying capacities of cold-formed steel cut stub columns with lipped C-section. Thin-Walled Struct. 2006, 44, 1077–1083. [Google Scholar] [CrossRef]
- Yang, J.; Guo, Y.; Yu, L.; Hu, C.; Liu, Y. Research on Hysteretic Behavior of Cold-Formed Thin-Wall Rolled Edge Channel Steel Flexural Members. J. Phys. Conf. Ser. 2022, 2185, 012066. [Google Scholar] [CrossRef]
- Contento, A.; Aloisio, A.; Xue, J.; Quaranta, G.; Briseghella, B.; Gardoni, P. Probabilistic axial capacity model for concrete-filled steel tubes accounting for load eccentricity and debonding. Eng. Struct. 2022, 268, 114730. [Google Scholar] [CrossRef]
- Peterman, K.D.; Nakata, N.; Schafer, B.W. Hysteretic characterization of cold-formed steel stud-to-sheathing connections. J. Constr. Steel Res. 2014, 101, 254–264. [Google Scholar] [CrossRef]
- Nithyadharan, M.; Kalyanaraman, V. Modelling hysteretic behaviour of cold-formed steel wall panels. Eng. Struct. 2013, 46, 643–652. [Google Scholar] [CrossRef]
- Xu, Z.; Du, Q.; Chen, Z.; Chen, H. Hysteretic behavior of cold-formed steel reinforced concrete shear walls with steel meshes. J. Constr. Steel Res. 2022, 197, 107445. [Google Scholar] [CrossRef]
- Tong, G.S. In-Plane Stability of Steel Structure; China building industry press: BeiJing, China, 2005. [Google Scholar]


| Specimen | h (mm) | b (mm) | a (mm) | t (mm) | L (mm) | n |
|---|---|---|---|---|---|---|
| C1-BC-L30-70-02 | 199.4 | 69.9 | 19.3 | 2.85 | 1277 | 0.2 |
| C2-BC-L60-35-02 | 251.3 | 79.6 | 49.7 | 7.43 | 2945 | 0.2 |
| Members | h × b × a × t × L (mm) | Analysis Parameters | |||
|---|---|---|---|---|---|
| h/t | λ | n | fy (MPa) | ||
| C1-BC-L15-40-00 | 120 × 48 × 20 × 3 × 385 | 40 | 15 | 0.0(0.1, 0.2, 0.3, 0.4) | 345 |
| C1-BC-L30-40-00 | 120 × 48 × 20 × 3 × 770 | 40 | 30 | 0.0(0.1, 0.2, 0.3, 0.4) | 345 |
| C1-BC-L50-40-00 | 120 × 48 × 20 × 3 × 1280 | 40 | 50 | 0.0(0.1, 0.2, 0.3, 0.4) | 345 |
| C1-BC-L70-40-00 | 120 × 48 × 20 × 3 × 1800 | 40 | 70 | 0.0(0.1, 0.2, 0.3, 0.4) | 345 |
| C2-BC-L15-50-00 | 150 × 60 × 25 × 3 × 500 | 50 | 15 | 0.0(0.1, 0.2, 0.3, 0.4) | 345 |
| C2-BC-L30-50-00 | 150 × 60 × 25 × 3 × 1000 | 50 | 30 | 0.0(0.1, 0.2, 0.3, 0.4) | 345 |
| C2-BC-L50-50-00 | 150 × 60 × 25 × 3 × 1680 | 50 | 50 | 0.0(0.1, 0.2, 0.3, 0.4) | 345 |
| C2-BC-L70-50-00 | 150 × 60 × 25 × 3 × 2350 | 50 | 70 | 0.0(0.1, 0.2, 0.3, 0.4) | 345 |
| C3-BC-L15-60-00 | 180 × 72 × 30 × 3 × 630 | 60 | 15 | 0.0(0.1, 0.2, 0.3, 0.4) | 345 |
| C3-BC-L30-60-00 | 180 × 72 × 30 × 3 × 1250 | 60 | 30 | 0.0(0.1, 0.2, 0.3, 0.4) | 345 |
| C3-BC-L50-60-00 | 180 × 72 × 30 × 3 × 2100 | 60 | 50 | 0.0(0.1, 0.2, 0.3, 0.4) | 345 |
| C3-BC-L70-60-00 | 180 × 72 × 30 × 3 × 2935 | 60 | 70 | 0.0(0.1, 0.2, 0.3, 0.4) | 345 |
| C4-BC-L15-70-00 | 210 × 84 × 35 × 3 × 760 | 70 | 15 | 0.0(0.1, 0.2, 0.3, 0.4) | 345 |
| C4-BC-L30-70-00 | 210 × 84 × 35 × 3 × 1525 | 70 | 30 | 0.0(0.1, 0.2, 0.3, 0.4) | 345 |
| C4-BC-L50-70-00 | 210 × 84 × 35 × 3 × 2550 | 70 | 50 | 0.0(0.1, 0.2, 0.3, 0.4) | 345 |
| C4-BC-L70-70-00- | 210 × 84 × 35 × 3 × 3560 | 70 | 70 | 0.0(0.1, 0.2, 0.3, 0.4) | 345 |
| Members | μ | Members | μ | Members | μ | Members | μ |
|---|---|---|---|---|---|---|---|
| C1-BC-L15-40-01 | 1.77 | C1-BC-L30-40-01 | 1.66 | C1-BC-L50-40-01 | 1.67 | C1-BC-L70-40-01 | 1.63 |
| C1-BC-L15-40-02 | 1.68 | C1-BC-L30-40-02 | 1.40 | C1-BC-L50-40-02 | 1.45 | C1-BC-L70-40-02 | 1.40 |
| C1-BC-L15-40-03 | 1.67 | C1-BC-L30-40-03 | 1.47 | C1-BC-L50-40-03 | 1.36 | C1-BC-L70-40-03 | 1.30 |
| C1-BC-L15-40-04 | 1.67 | C1-BC-L30-40-04 | 1.47 | C1-BC-L50-40-04 | 1.35 | C1-BC-L70-40-04 | 1.33 |
| C2-BC-L15-50-01 | 1.80 | C2-BC-L30-50-01 | 1.42 | C2-BC-L50-50-01 | 1.47 | C2-BC-L70-50-01 | 1.43 |
| C2-BC-L15-50-02 | 1.58 | C2-BC-L30-50-02 | 1.56 | C2-BC-L50-50-02 | 1.38 | C2-BC-L70-50-02 | 1.35 |
| C2-BC-L15-50-03 | 1.61 | C2-BC-L30-50-03 | 1.47 | C2-BC-L50-50-03 | 1.35 | C2-BC-L70-50-03 | 1.30 |
| C2-BC-L15-50-04 | 1.62 | C2-BC-L30-50-04 | 1.47 | C2-BC-L50-50-04 | 1.33 | C2-BC-L70-50-04 | 1.29 |
| C3-BC-L15-60-01 | 1.63 | C3-BC-L30-60-01 | 1.65 | C3-BC-L50-60-01 | 1.51 | C3-BC-L70-60-01 | 1.49 |
| C3-BC-L15-60-02 | 1.43 | C3-BC-L30-60-02 | 1.33 | C3-BC-L50-60-02 | 1.53 | C3-BC-L70-60-02 | 1.47 |
| C3-BC-L15-60-03 | 1.37 | C3-BC-L30-60-03 | 1.27 | C3-BC-L50-60-03 | 1.42 | C3-BC-L70-60-03 | 1.17 |
| C3-BC-L15-60-04 | 1.36 | C3-BC-L30-60-04 | 1.28 | C3-BC-L50-60-04 | 1.38 | C3-BC-L70-60-04 | 1.25 |
| C4-BC-L15-70-01 | 1.48 | C4-BC-L30-70-01 | 1.41 | C4-BC-L50-70-01 | 1.31 | C4-BC-L70-70-01 | 1.29 |
| C4-BC-L15-70-02 | 1.36 | C4-BC-L30-70-02 | 1.39 | C4-BC-L50-70-02 | 1.22 | C4-BC-L70-70-02 | 1.25 |
| C4-BC-L15-70-03 | 1.37 | C4-BC-L30-70-03 | 1.32 | C4-BC-L50-70-03 | 1.43 | C4-BC-L70-70-03 | 1.24 |
| C4-BC-L15-70-04 | 1.24 | C4-BC-L30-70-04 | 1.26 | C4-BC-L50-70-04 | 1.45 | C4-BC-L70-70-04 | 1.22 |
Disclaimer/Publisher’s Note: The statements, opinions and data contained in all publications are solely those of the individual author(s) and contributor(s) and not of MDPI and/or the editor(s). MDPI and/or the editor(s) disclaim responsibility for any injury to people or property resulting from any ideas, methods, instructions or products referred to in the content. |
© 2023 by the authors. Licensee MDPI, Basel, Switzerland. This article is an open access article distributed under the terms and conditions of the Creative Commons Attribution (CC BY) license (https://creativecommons.org/licenses/by/4.0/).
Share and Cite
Yao, X.; Yang, J.; Guo, Y. Study on Restoring Force Model of Cold-Formed Thin-Walled Steel Lipped Channel Beam-Columns under Cyclic Load. Buildings 2023, 13, 114. https://doi.org/10.3390/buildings13010114
Yao X, Yang J, Guo Y. Study on Restoring Force Model of Cold-Formed Thin-Walled Steel Lipped Channel Beam-Columns under Cyclic Load. Buildings. 2023; 13(1):114. https://doi.org/10.3390/buildings13010114
Chicago/Turabian StyleYao, Xingyou, Jiabao Yang, and Yanli Guo. 2023. "Study on Restoring Force Model of Cold-Formed Thin-Walled Steel Lipped Channel Beam-Columns under Cyclic Load" Buildings 13, no. 1: 114. https://doi.org/10.3390/buildings13010114