Article

Performance of Grouting Sleeve-Connected Prefabricated Beams Subjected to Impact Loading

Key Laboratory of Urban Security and Disaster Engineering of Ministry of Education, Beijing University of Technology, Beijing 100124, China
*
Author to whom correspondence should be addressed.
Buildings 2022, 12(12), 2146; https://doi.org/10.3390/buildings12122146
Submission received: 2 November 2022 / Revised: 17 November 2022 / Accepted: 1 December 2022 / Published: 6 December 2022
(This article belongs to the Special Issue Steel Structures and Sustainable Building Structure System)

Abstract

:
The potential of accidental loads such as explosions and impacts cannot be overlooked given the widespread use of precast concrete (PC) buildings. However, research on the impact resistance of reinforced concrete precast beams is limited. In order to explore the dynamic behavior of PC beams connected by grouted sleeves under impact loads, this work developed a numerical model based on the finite element program LS-DYNA. First, the experimental process was described in detail, and the numerical model was evaluated and calibrated according to the experimental data. Then, parameters such as impact location, concrete strength of precast section and stirrup rate of cast-in-place area were studied. Finally, a simpler model based on equal high-frequency impulse impact force was suggested, and the viability of a single-degree-of-freedom model theory was proved for the dynamic analysis of PC simply supported beams subjected to impact loading. According to the findings, the interface of precast concrete and cast-in-place concrete is the weak point of the PC beam, which is prone to shear damage under impact loads. Second, when the middle of the cast-in-place part of the PC beam is impacted, wide cracks from the bottom to the top are quite likely to form. As a result, the most disadvantageous impact position for PC beams is in the middle of the cast-in-place portion. Although increasing the concrete strength of the precast section can reduce crack formation, it has minimal influence on the interface’s shear resistance. Furthermore, increasing the stirrup rate in the post-cast portion can increase the overall shear resistance of the PC beams.

Graphical Abstract

1. Introduction

As precast reinforced concrete structure (PC) building technology advances, its advantages in terms of construction cost, time cost, and environmental protection become increasingly apparent. It is increasingly being utilized in residential and commercial structures across the world [1,2,3]. The fundamental distinction between PC and reinforced concrete (RC) components is the manner in which they are connected. Unlike RC components, PC components are pre-produced at the factory and afterwards brought to the building site for assembly. The connecting technique of PC components directly influences the overall performance of PC structures. Therefore, the connecting technique of PC components has gained more and more attention from researchers [4,5,6].
At present, there are two types of assembly procedures for PC components: dry connection, and wet connection. For dry connection, all prefabricated components are normally completed in the factory, and the connection is completed on site using bolts or welding, etc. For wet connection, the longitudinal reinforcement in the beam is commonly connected by grouted sleeve, spiral hoop restraint and metal bellows. After raising the PC components to the installation location, cast-in-place concrete is poured to finish the connection between the PC components. In the field of precast concrete buildings, the grouted sleeve connection method has been widely adopted for its robust and dependable mechanical qualities, fast construction duration, and easy operation [7,8,9].
Currently, academics have completed several investigations on the mechanical characteristics of grouted sleeve PC parts [10,11]. Liu et al. [12] conducted cyclic loading tests on PC beam–column nodes connected by grouted sleeves to evaluate the seismic performance of the nodes. The results indicated that the ductility of PC beam–column nodes increased by 5.2% and the average energy dissipation coefficient improved by 0.71% compared with RC beam–column nodes. Lu et al. [13] designed a PC beam with double grouted sleeve connection and evaluated the flexural and seismic performance of the PC beam, and proposed a method for calculating the bearing capacity of the PC beam with double grouted sleeve connection. Ma et al. [14] studied experimentally the influence of anchoring length on the grouted sleeve connection on the pullout resistance performance. The link between anchoring length and ultimate tensile force was given, and a calculation formula was developed. However, much of the research effort carried out so far has concentrated on the seismic performance of grouted sleeve PC members and less on their mechanical properties under impact loads. In addition to seismic loads, PC structures may also be endangered by accidental loads such as explosions and shocks [15,16,17]. Therefore, a detailed study of the impact resistance of grouted sleeve precast beams under impact loads is important.
At present, the damage process of ordinary RC beams under impact loads has been quite thoroughly researched [18,19]. Numerous study results have revealed that RC constructions display considerably distinct damage mechanisms under static and dynamic stresses [20]. The strain rate impact of the material is more noticeable under dynamic loads. Unlike plastic deformation damage under static stresses, RC beams under impact loading frequently display shear damage [21]. Yu et al. [22] discovered that previous axioms for static flexural load capacity calculations are not applicable to RC beams under impact loading, based on drop hammer impact tests and LS-DYNA numerical simulations. Zhang et al. [20] employed uniaxial damage material models for concrete and steel reinforcement. The deterioration process of the load-bearing capability of RC beams after impact was examined using fiber cross-section analysis. Pham et al. [23] provided a technique to consider the shear force distribution and bending moment distribution of RC beams under impact loading, which was confirmed by experimental and computational findings. In addition, unlike static loading, the contact stiffness of the impactor and the RC beam has a substantial effect on the dynamic bending moment and shear moment distribution of the beam when the RC beam is exposed to impact loading [24].
With the expanding usage of prefabricated constructions, PC beams are also garnering more and more attention. Grouted sleeve connection techniques are also commonly employed in PC beams with their multiple benefits [25]. The damage mechanisms and dynamic response of grouted sleeve connected PC beams may be distinct from conventional wet connected PC beams. Nevertheless, there are limited research on the mechanical characteristics of PC beams coupled with grouted sleeves under impact loads [26]. Yan et al. [27] studied the impact resistance of PC beams connected with grouted sleeves, concentrating on characteristics such as impact velocity and assembly location. The results demonstrated that the assembly location had a substantial effect on the impact resistance of PC beams. Zhao et al. [28] studied the dynamic response of PC piers linked by grouted sleeves under impact loads based on the finite element approach. The findings of the investigation revealed the mechanical characteristics of the grouted sleeve under impact loading. A curvature-based damage assessment approach for PC piers joined by grouted sleeves was presented.
In summary, studies on the mechanical characteristics of conventional RC beams under impact loading are becoming more and more mature, whereas the research on grouted sleeve PC beams is less frequently studied. In addition, crucial parameters such as impact location, strength of precast concrete, and stirrup reinforcement ratio in cast-in-place areas have not been explored. Fewer investigations have been undertaken for the theoretical computation of the deformation of grouted sleeve PC beams under impact loading. The rapid development of prefabricated structures has put forward more requirements for the study of mechanical properties of PC components. Therefore, it is necessary to carry out an in-depth investigation on the mechanical characteristics of grouted sleeve PC beams under impact loading.
The research topic of this work is separated into three parts. First, a validation model of grouted sleeve PC beams under impact loading was constructed, and the simulation approach of grouted sleeve connection mode was provided. Then, the characteristics such as impact location, precast concrete strength and stirrup reinforcement ratio of cast-in-place area were examined. Finally, this work adopted a simplified single-degree-of-freedom model to theoretically examine the mechanical characteristics of PC beams under impact loads. The viability of the theoretical analysis approach of the single-degree-of-freedom model for grouted sleeve PC beams was proven, and will provide a reference for the engineering design of grouted sleeve PC beams.

2. Numerical Model Verification

2.1. PC Beam Geometry Model

In this work, PC beams were simulated under impact loads to validate the reliability of the numerical simulation [27]. In this section, the geometry of the model, material parameters, loading method and boundary conditions are provided.
The detailed dimensions and reinforcement of the PC beam are shown in Figure 1. The dimensions of the beam are 200 mm × 400 mm × 3300 mm with a net span of 2900 mm. The longitudinal tensile and compressive sides of the beam are symmetrically arranged with reinforcement. There are two HRB400 [29] reinforcements of Φ16 on the tensile side and two on the compressive side. The reinforcement rate of longitudinal reinforcement is 1.01%. The stirrup adopts Φ6@150 HRB400 steel bar. The stirrup reinforcement ratio is 0.19%. The thickness of the concrete cover is 20 mm, and the strength of the concrete in the precast part of the PC beam is C30 [30]. 500 mm of cast-in-place area is reserved, and the strength of the concrete in the cast-in-place area is C40. In the test, steel shafts and steel plates are installed at both ends of the reinforced concrete beam to simulate the simply supported boundary conditions (Figure 2).
LS-DYNA, as the most widely used dynamic analysis software, has been applied by many scholars to analyze the dynamic response of concrete structures under impact and blast loads [28]. The numerical model can simulate the nonlinear properties of reinforced concrete materials very well [31]. Therefore, in this work, the finite element software LS-DYNA was used to investigate the mechanical characteristics of PC beams under impact loads.
In this study, solid elements (Solid 164) were used to simulate concrete, drop hammer and steel shafts. A beam element (Beam 161) with 2 × 2 Gaussian integrals was utilized to model the reinforcement and grout sleeve. It is crucial to note that this study assumes no bond slip between the reinforcement, grout sleeve and concrete. The drop hammer was a cylinder with a diameter of 200 mm and a height of 200 mm. The impact weight was changed by adjusting the density of the drop hammer. The initial velocity of the drop hammer was regulated by the term *INITIAL VOLOCITY GENERATION. The numerical model is given in Figure 3.

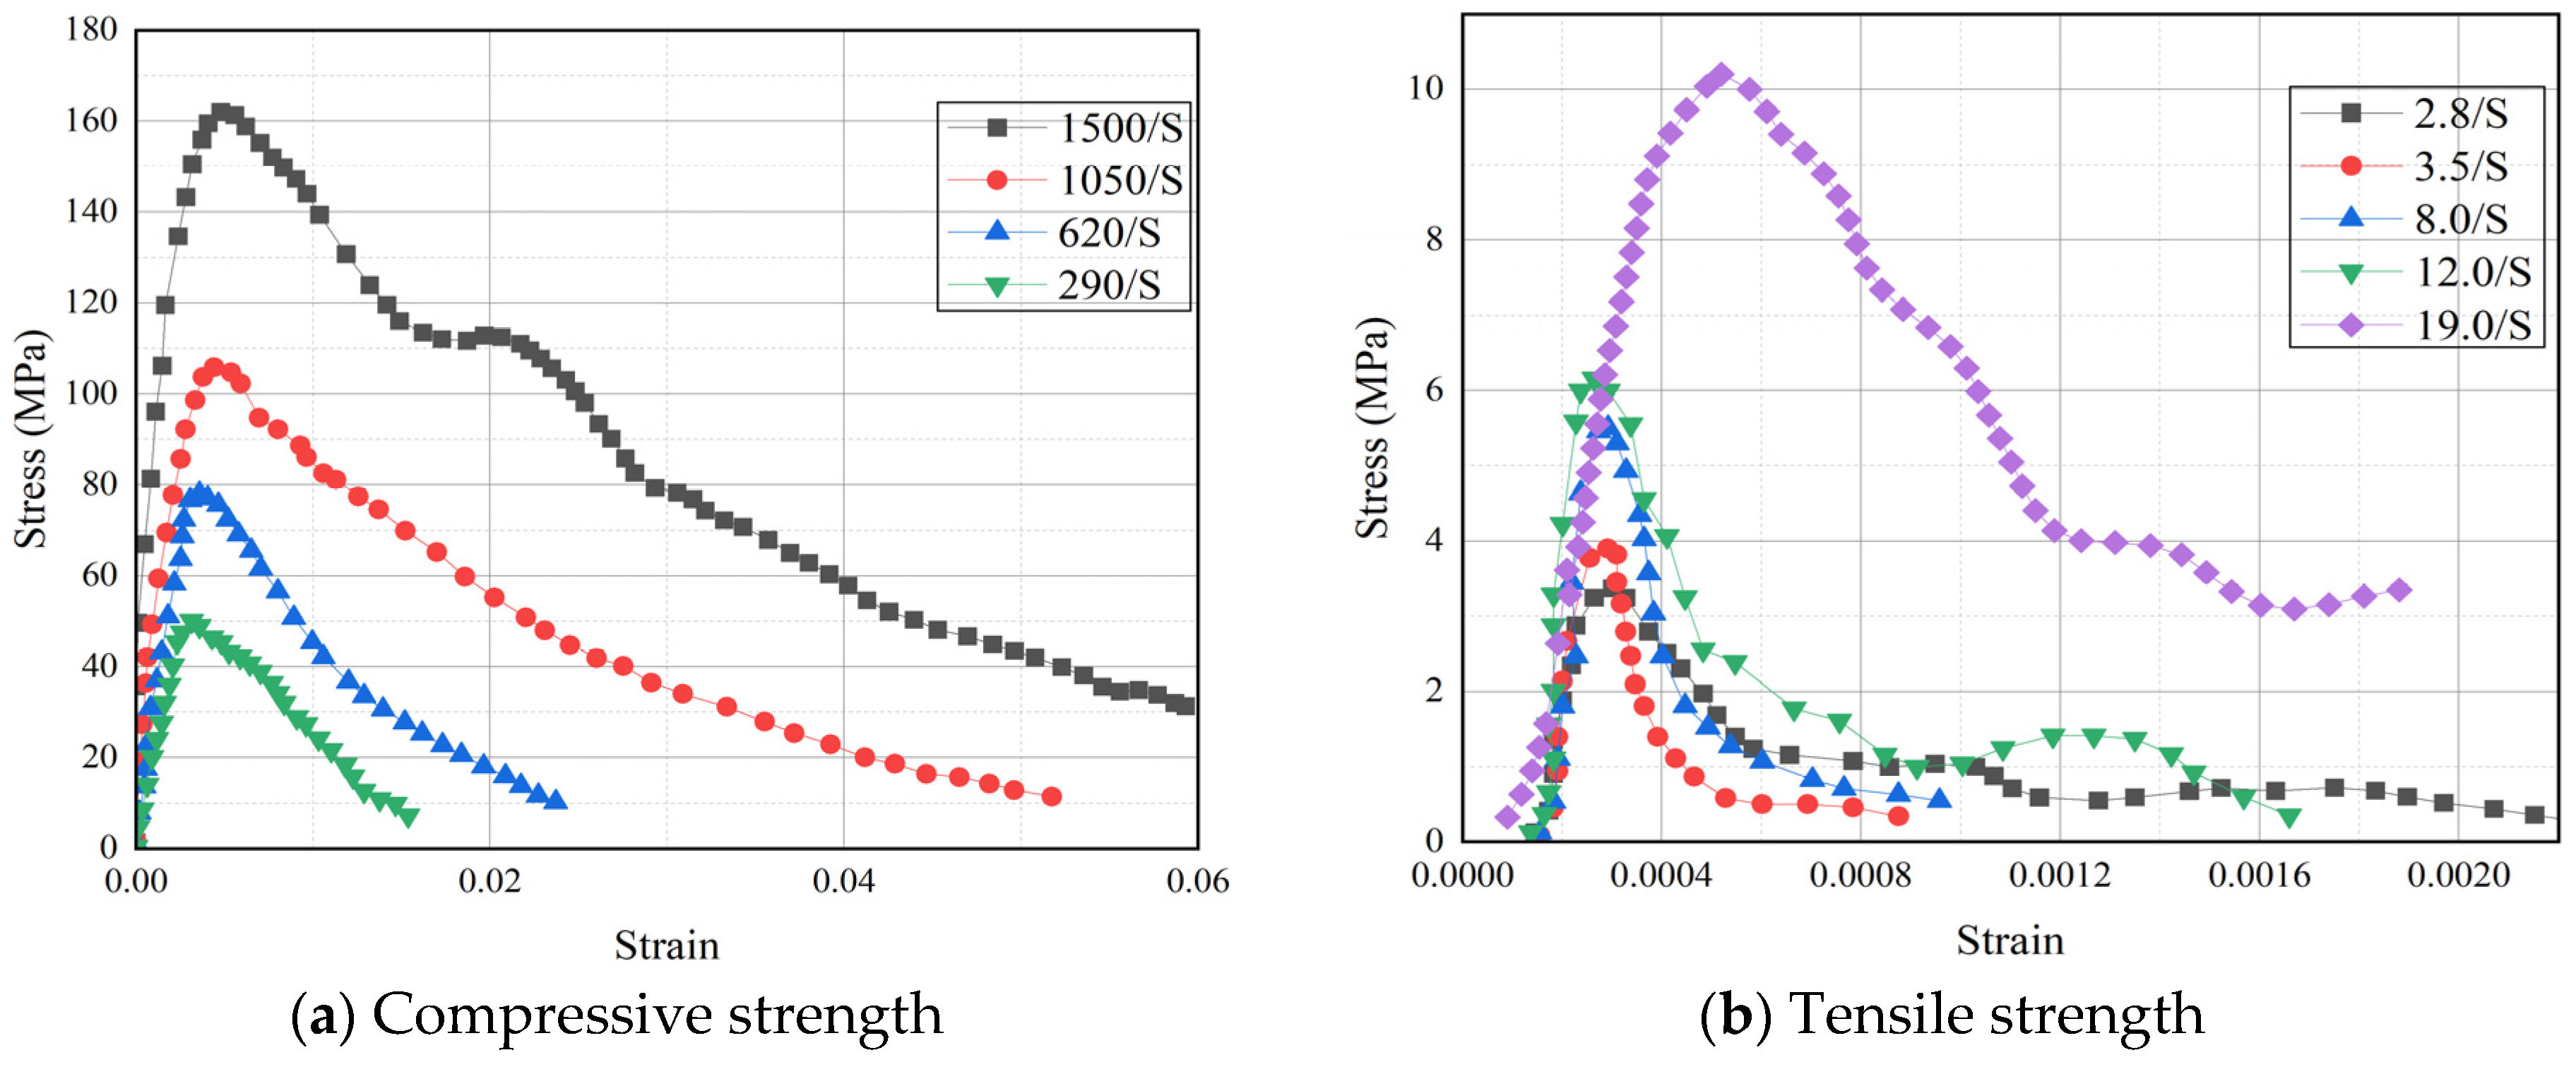
2.2. Material Model and Strain Rate Effects

The LS-DYNA material library contains a range of concrete intrinsic structure models, such as 72#, 84#, 96#, 111#, 159#, and 272# material models, which have been extensively utilized in research work on concrete structures under blast and impact loads [32,33]. In this research, the Riedel-Hiermaier-Thoma model (*MAT_RHT) [34] was utilized to simulate concrete under impact loads. The *MAT_RHT model offers a good description of the mechanical behavior of concrete structures under high-frequency loads such as blast and impact [35]. The model is embedded through the elastic limit surface equation, failure surface equation and residual strength surface equation for a given stress state and loading rate. This calculation method can describe the change pattern of concrete under impact loading. The expression of the failure surface equation for the RHT intrinsic model is provided below:
σ fail ( p , θ , ε ˙ ) = f c σ T X C ( p s ) R 3 ( θ ) F rate ( ε ˙ )
where, σ T X C ( p s ) is the quasi−static failure surface compression radial equivalent force strength, R 3 ( θ ) is the Rhodes angle factor, F rate ( ε ˙ ) is the strain rate dynamic enhancement factor, and p s = p / F rate ( ε ˙ ) is the quasi−static pressure.
Concrete exhibits typical rate-sensitive characteristics. During numerical simulations, impact and blast loads create strain rate effects in brittle materials such as concrete. The strain rate values under drop hammer impact loading vary from 10−1 to 102. As the strain rate rises, the uniaxial tensile and compressive strength of concrete increases [36]. Therefore, *MAT_RHT incorporates a dynamic strain rate factor function in the failure surface equation. The relevant dynamic amplification factor is supplied to address the strain rate impact of the concrete material. The mathematical expression of this is as follows:
F rate ( ε ˙ ) = { ( ε ˙ ε ˙ 0 c ) β c                                                                   p f c / 3 p + f t / 3 f c / 3 + f t / 3 ( ε ˙ ε ˙ 0 c ) β c + p f c / 3 f t / 3 f c / 3 ( ε ˙ ε ˙ 0 c ) β t      f t / 3 < p < f c / 3 ( ε ˙ ε ˙ 0 t ) β t                                                                   p f t / 3
where, f t is the uniaxial tensile strength; ε ˙ 0 c = 30 × 10 6 s 1 , ε ˙ 0 t = 3 × 10 - 6 s - 1 ; β c is the compressive strain rate index, β c = 4 / 20 + 3 f c ; β t is the tensile strain rate index, β t = 4 / 20 + 3 f ; f c is the uniaxial compressive strength.
In the RHT model parameters, the uniaxial compressive strength of the material fc was accurately obtained by means of tests. The shear modulus G was derived through theoretical computation. The other parameters can only be quoted from the concrete-related parameters due to their complicated access to the test. The parameters utilized in this work can be found in the literature [37,38,39]. The RHT concrete material specifications are provided in Table 1.
The steel shaft was represented using the *MAT_20 (*MAT_RIGID) rigid material model. The longitudinal reinforcements, stirrups and drop hammer were all modeled using the kinematic hardening model *MAT_003 (*MAT_PLASTIC_KINEMATIC), assuming a constant yield surface of the material. It is worth mentioning that the strength of the reinforcement rises with the loading rate under impact loading. The improvement of the material strength is determined by the dynamic factor (DIF), and the *MAT_003 material adopts the Cowper–Symonds model to account for the impacts of strain rate. Therefore, the adoption of this material model gives a more accurate representation of the dynamic strain rate impact on the reinforcement. This empirical calculation has been widely used [40].
The DIF for concrete compressive strength is expressed by the following equation:
DIF = 1 + ( ε ˙ C ) 1 p
where, ε ˙ is the strain rate parameter; P and C are strain rate related parameters.
Therefore, the equation for the yield stress of the material is expressed as follows:
σ y = [ 1 + ( ε ˙ C ) 1 / p ] ( σ 0 + β E p ε e f f )
where, σ0 and εeff are the initial yield stress and effective plastic strain, respectively; Ep denotes the plastic hardening parameter.
Taking the concrete of C30 strength as an example (Figure 4), the stress–strain relationship of the C30 concrete test block at different strain rates is shown in the figure below [41,42].
According to the test results, the yield strength, modulus of elasticity and density of the bars were 450 MPa, 209 GPa and 7800 kg/m3, respectively. The main parameters of *MAT_003 are shown in Table 2.
It is vital to note that when members are exposed to impact loads, excessive deformation may ensue, leading to erroneous calculation results and energy leakage. *MAT_ADD_EROSION gives a mechanism to automatically remove over-deformed elements based on given criteria. This keyword specifies numerous conditions, and when one or more of these requirements are fulfilled in the numerical computation, the element will be deleted from the numerical model. Among these, the maximum principal strain criterion is extensively employed for concrete structures under impact or blast loads, and good results have been achieved [43]. Therefore, in this work, the greatest principal strain is defined as a criterion with a threshold value of 0.3. It corresponded better with the experimental data [44]. For steel reinforcement, the failure plastic strain was specified as 0.12 in the keyword *MAT_003 [45].

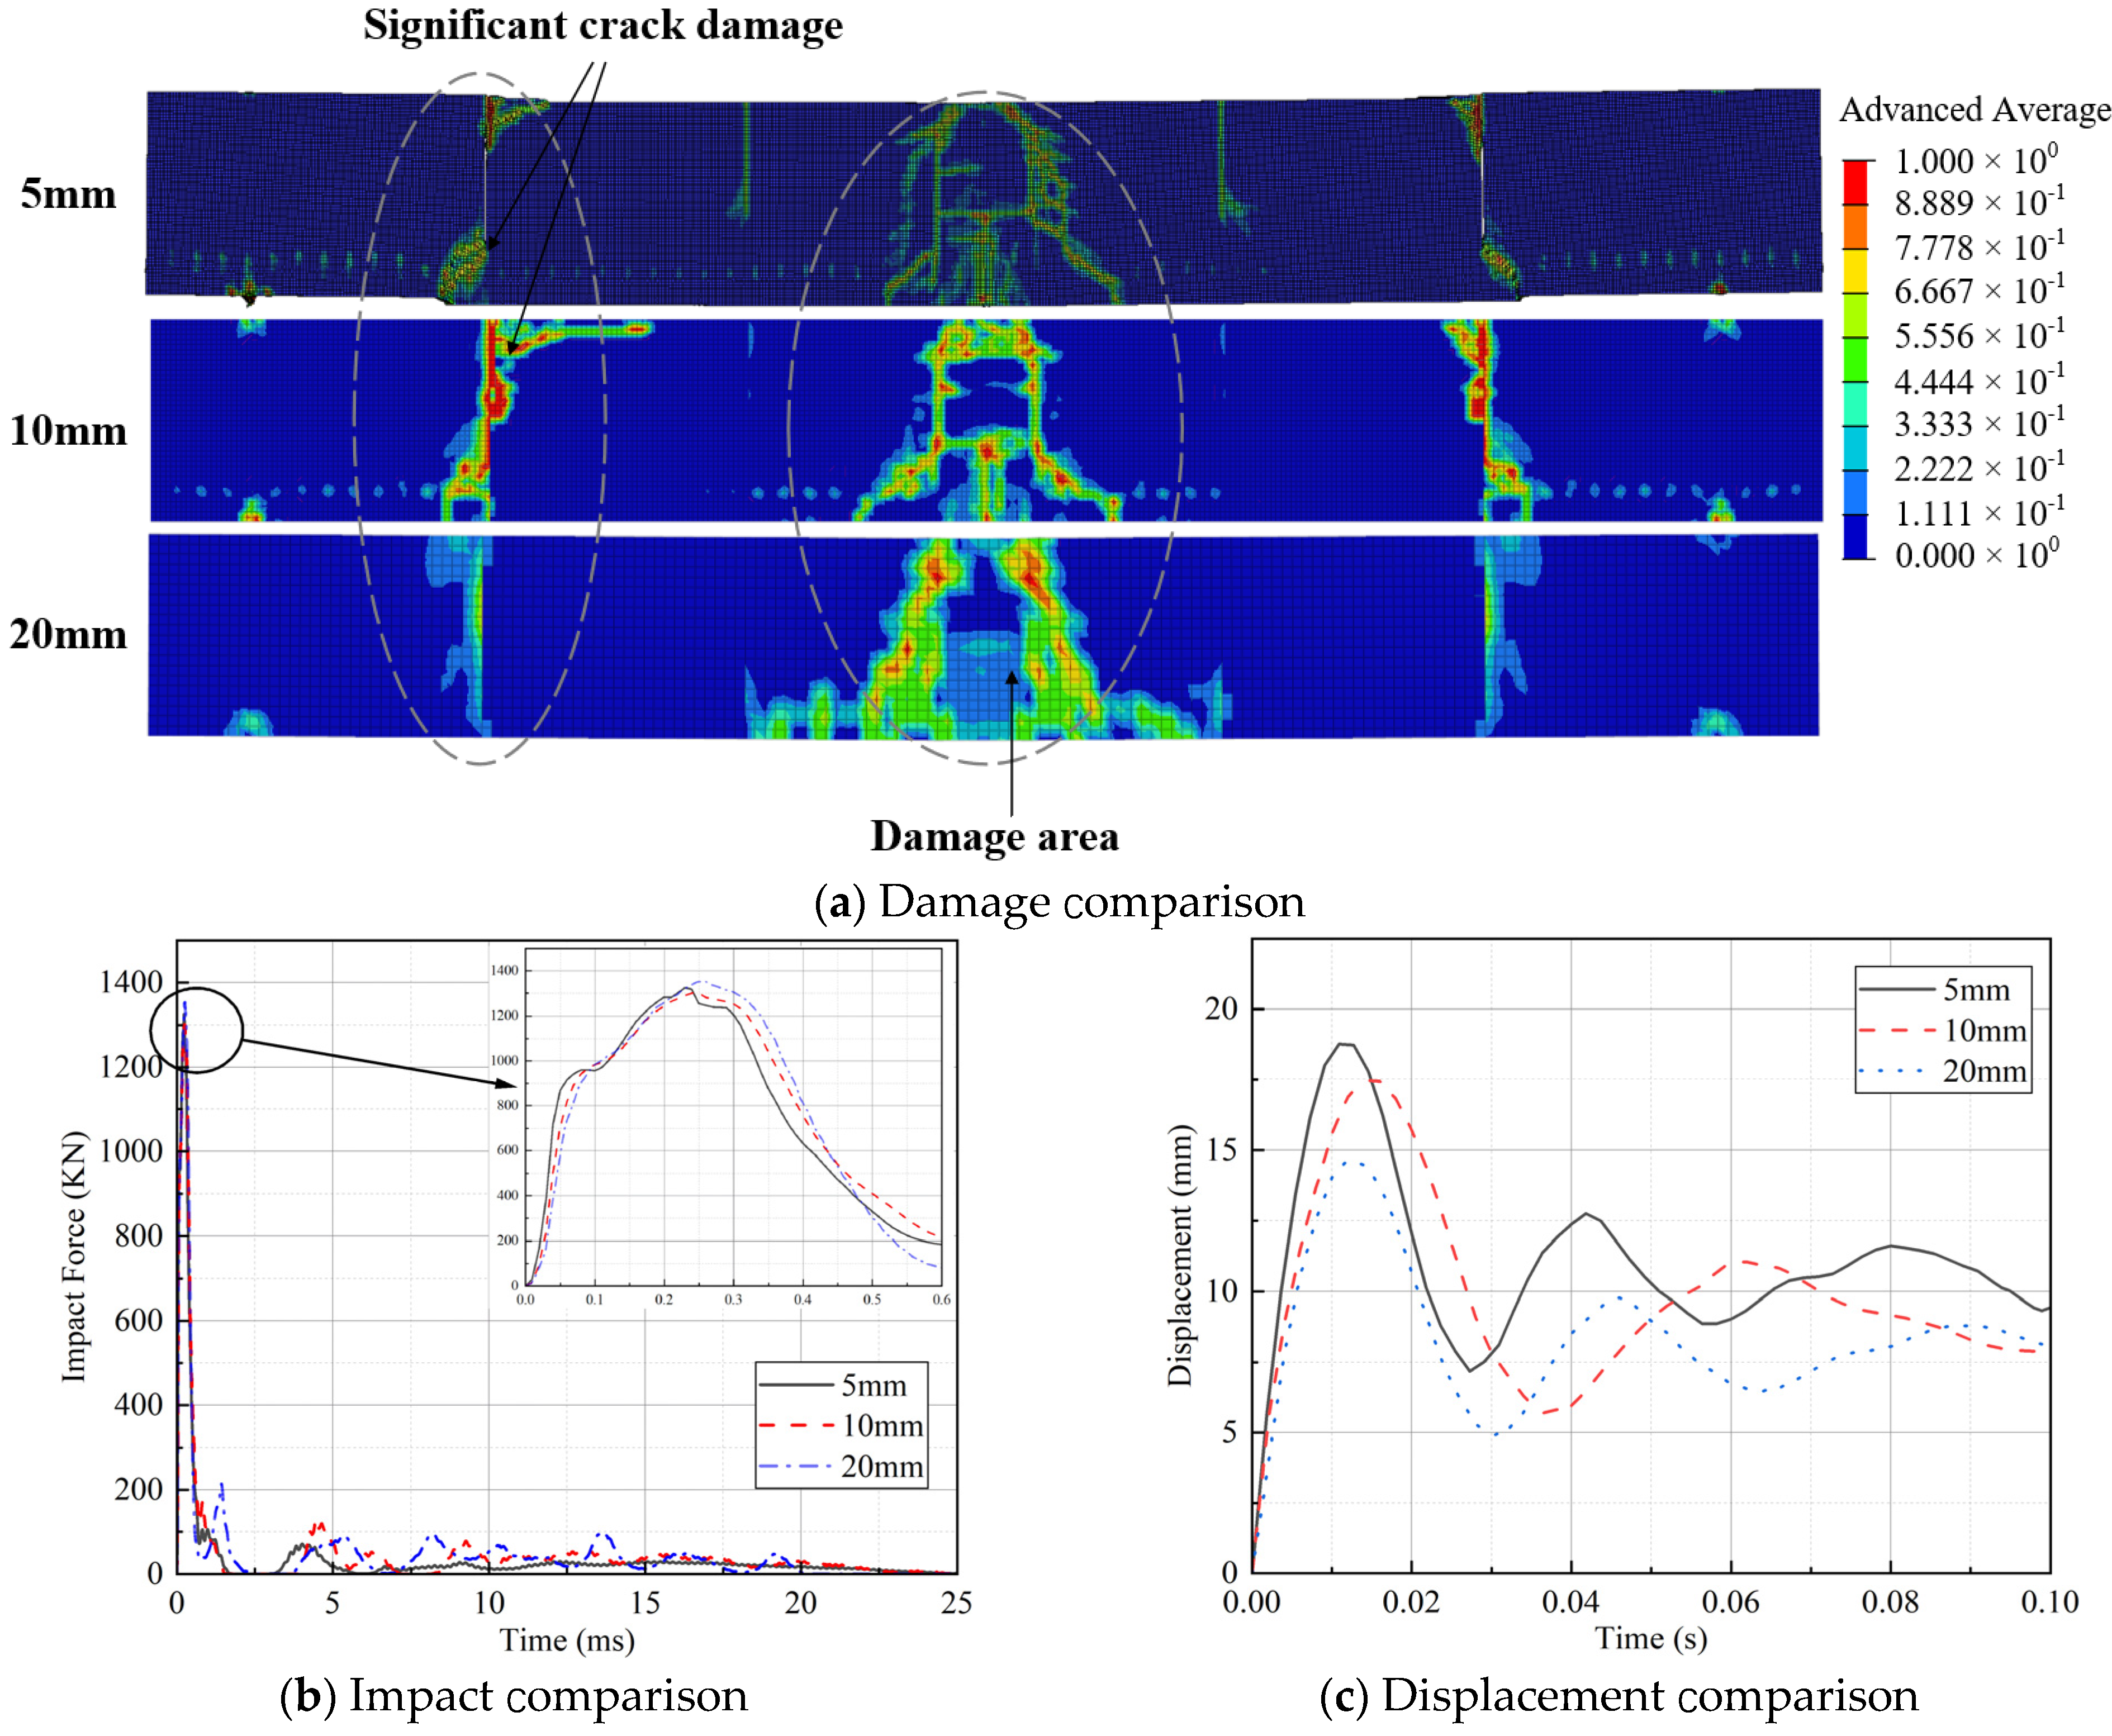
2.3. Mesh Size and Contact

In addition, the size of the mesh has a considerable influence on the outcomes of the finite element simulation. Since this numerical model employs a single integral point solid element, the keyword *CONTROL_HOURGLASS is utilized to overcome the hourglass pattern. In order to establish a suitable mesh size, the dynamic response of the PC beam was explored in this section for concrete mesh sizes of 5 mm, 10 mm, and 20 mm, respectively.
Observe the mesh size on the peak impact force, peak central displacement and residual displacement (Figure 5). Compared with the grid size of 20 mm, 5 mm and 10 mm can capture the damage of concrete more correctly, while 20 mm has larger damage range and somewhat less accuracy (Figure 5a). The peak impact forces of the three are approximately comparable (Figure 5b), but the peak displacement in the center of the grid size of 20 mm varies greatly from the numerical models of 5 mm and 10 mm (Figure 5c). It can be shown that the mesh size of 5 mm and 10 mm satisfy the precision of numerical simulation and can replicate the dynamic response of PC beam under impact load effectively. Meanwhile, considering the computational cost, the mesh size of concrete in this article is determined as 10 mm, the mesh size of reinforcement is likewise set as 10 mm, and the maximum mesh size of drop hammer and steel shaft is 20 mm.
It is necessary to note that the interface between the precast concrete and cast-in-place concrete is the weak spot of PC beams compared to RC beams. Under impact loading, the concrete at the interface readily surpasses the tensile or shear stress limit, which is frequently a common damage mechanism of PC beams. Therefore, in this study, a very thin layer of solid elements was chosen as the interface [26,46]. The concrete strength of this layer of solid elements is the same as that of precast concrete. The erosion criteria based on the highest principal strain in the term *MAT_ADD_EROSION is utilized. Through trial and error, it was discovered that a maximum principal strain value of 0.005 for the interfacial unit was a good predictor of the test outcomes. To date, no failure behavior owing to damage of grout sleeve with longitudinal reinforcement has been found in the investigation of PC beams connected by grout sleeves. Therefore, in this work, the grout sleeve for connecting longitudinal reinforcement was simplified to a reinforcement with a comparable cross-sectional area to the longitudinal reinforcement, but with a different strength. The equivalent reinforcement was brought into contact with the longitudinal reinforcement utilizing a common node, a setup approach that has been verified in earlier investigations [26]. The formulae for calculating the strength and stiffness of the equivalent reinforcement are as follows:
E e = E s A s + E g A g + E r A r A
σ e = σ s A s + σ g A g + σ r A r A
where A is the total area of grout sleeves. As, Ag and Ar are the area of steel sleeve, grout and rebar, respectively; As, Ag and Ar are 791.68 mm2, 816.81 mm2, 201.06 mm2, respectively; Es, Eg and Er are the elastic modulus of steel sleeve, grout and rebar, respectively; Es, Eg and Er are 201 GPa, 13.6 GPa, 209 GPa, respectively; σs, σg, and σr are the strength of steel sleeve, grout and rebar, respectively; σs, σg, and σr are 602 MPa, 85 MPa, 450 MPa, respectively.
The coupling contact between concrete, longitudinal reinforcement, and hooped reinforcement was set by the keyword *CONSTRAINED_BEAM_IN_SOLID. This keyword couples the 2-node line and solid elements for calculation, which allows the axial shear force between the reinforcement and concrete owing to bond slip to be set. During the computation, the approach permits large deformation of the reinforcements, successfully addressing the energy balance mistakes caused by the earlier use of the keyword *CONSTRAINED_LAGRANGE_IN_SOLID [34].
The keyword *CONTACT_AUTOMATIC_SURFACE_TO_SURFACE was used to set the contact between the drop hammer and the PC beam. This keyword mimics the contact between the two parts by specifying the contact stiffness k of the solid element penalty function. The formula for k is shown below:
k = f s K A 2 V
where fs is the scale factor for the interface stiffness and its default value is 1.0, k is the bulk modulus of contact materials, A and V are the contact area and the volume containing the contact elements, respectively.
According to the current research [47], setting SFS and SFM to 0.1 and static and dynamic friction coefficients FS and FD to 0.6 can achieve better simulation results. In this work, the steel shaft was configured as a rigid body without deformation and movement. Therefore, considering the probable deformation of the PC beam at the support, *CONTACT_AUTOMATIC_NODE_TO_ SURFACE was utilized to model the contact between the steel shaft and the PC beam, a point and surface contact that is well documented in numerous studies [48]. The keyword *INITIAL_VOLOCITY_GENERATION was used to set a starting velocity to the drop hammer.

2.4. Comparison of Numerical Simulation and Experimental Results

In this part, specimen B4a from the test of our group was employed as the validation model [27]. The drop hammer weight of specimen B4a in the test was 253 kg and the impact velocity was 5.6 m/s. From the results of the comparison between the test and numerical simulation (Figure 6a), the damage of the member was mainly in three parts, i.e., the interface between the precast and cast-in-place concrete on the left and right sides, and the part of the central precast concrete beam that was directly impacted. Both testing and numerical simulations indicated shear fractures at the interface. The shear cracks grew from the bottom of the beam to the top of the beam, generating a pass through. The bending cracks in the central precast concrete piece developed intensively, and the numerical simulations were able to properly calculate the position of the crack formation. At the same time, both experimental and numerical modeling findings demonstrated cracks in the horizontal direction caused by the impact on the top of the beam. Therefore, the numerical technique employed in this article can better mimic the damage phenomena of PC beams under impact loading.
In addition, this section compared the impact forces and vertical displacements from the experimental and numerical models (Figure 6b,c). The impact forces in the test and numerical simulation were 1086 kN and 1075 kN, respectively, and the discrepancy between them was roughly 1.01%. Slightly different from the experimental results, the numerical simulation did not mimic the secondary impact of the drop hammer well. This is because the numerical model did not account the influence of gravity, and the drop hammer bounced up and did not fall down again. However, the secondary impact load of the drop hammer was minimal, and the effect on the structure was insignificant. The highest displacements of the test and numerical simulation were 21.08 mm and 19.67 mm, respectively, and the difference between them was around 6.69%. The residual displacements of the test and simulation were around 11.44 mm and 10.83 mm, respectively, and the difference between them was about 5.33%. The peak and residual displacements of the numerical simulation were somewhat lower than those of the test, which may have been caused by the fact that factors such as bond slip between concrete and reinforcement in the test were not taken into consideration in the numerical simulation. Overall, the numerical calculation results and the experimental findings coincided well. The parameters used in the numerical simulation were more reliable.

3. Parametric Analysis

PC beams are more vulnerable to damage in the region subjected to direct impact at the interface of precast concrete and cast-in-place concrete under impact loads. Based on the finite element simulation approach that was confirmed in the previous section, this section carried out the study of the parameters relevant to the mechanical characteristics of PC beams under impact loading. The specific parameters studied were the impact location of the drop hammer, the concrete strength of the precast section, and the stirrup reinforcement ratio in the post-cast region (Table 3). Among these, the impact position was the distance between the center of the drop hammer and the middle of the span of the PC beam. The estimated formula for the stirrup reinforcement ratio in the post-cast region is as follows:
ρ s v = A s v b s = n × A s v 1 b × s
where, b is the width of the rectangle member section, s is the spacing of the stirrup, n is the number of hoop sections in the section, and A s v 1 is the cross-sectional area of the stirrup.

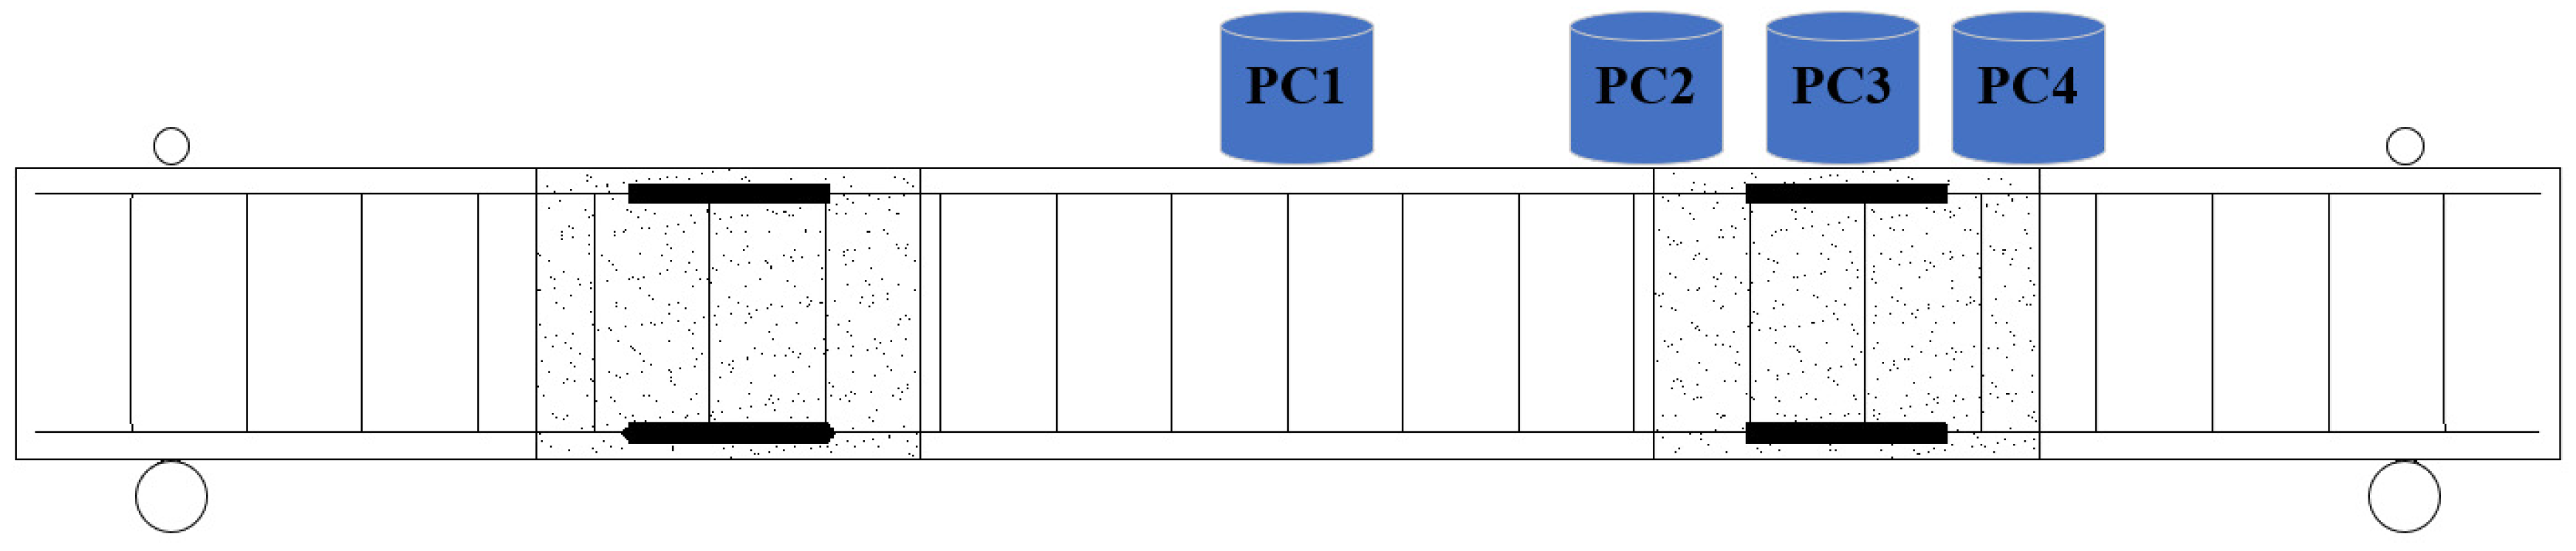
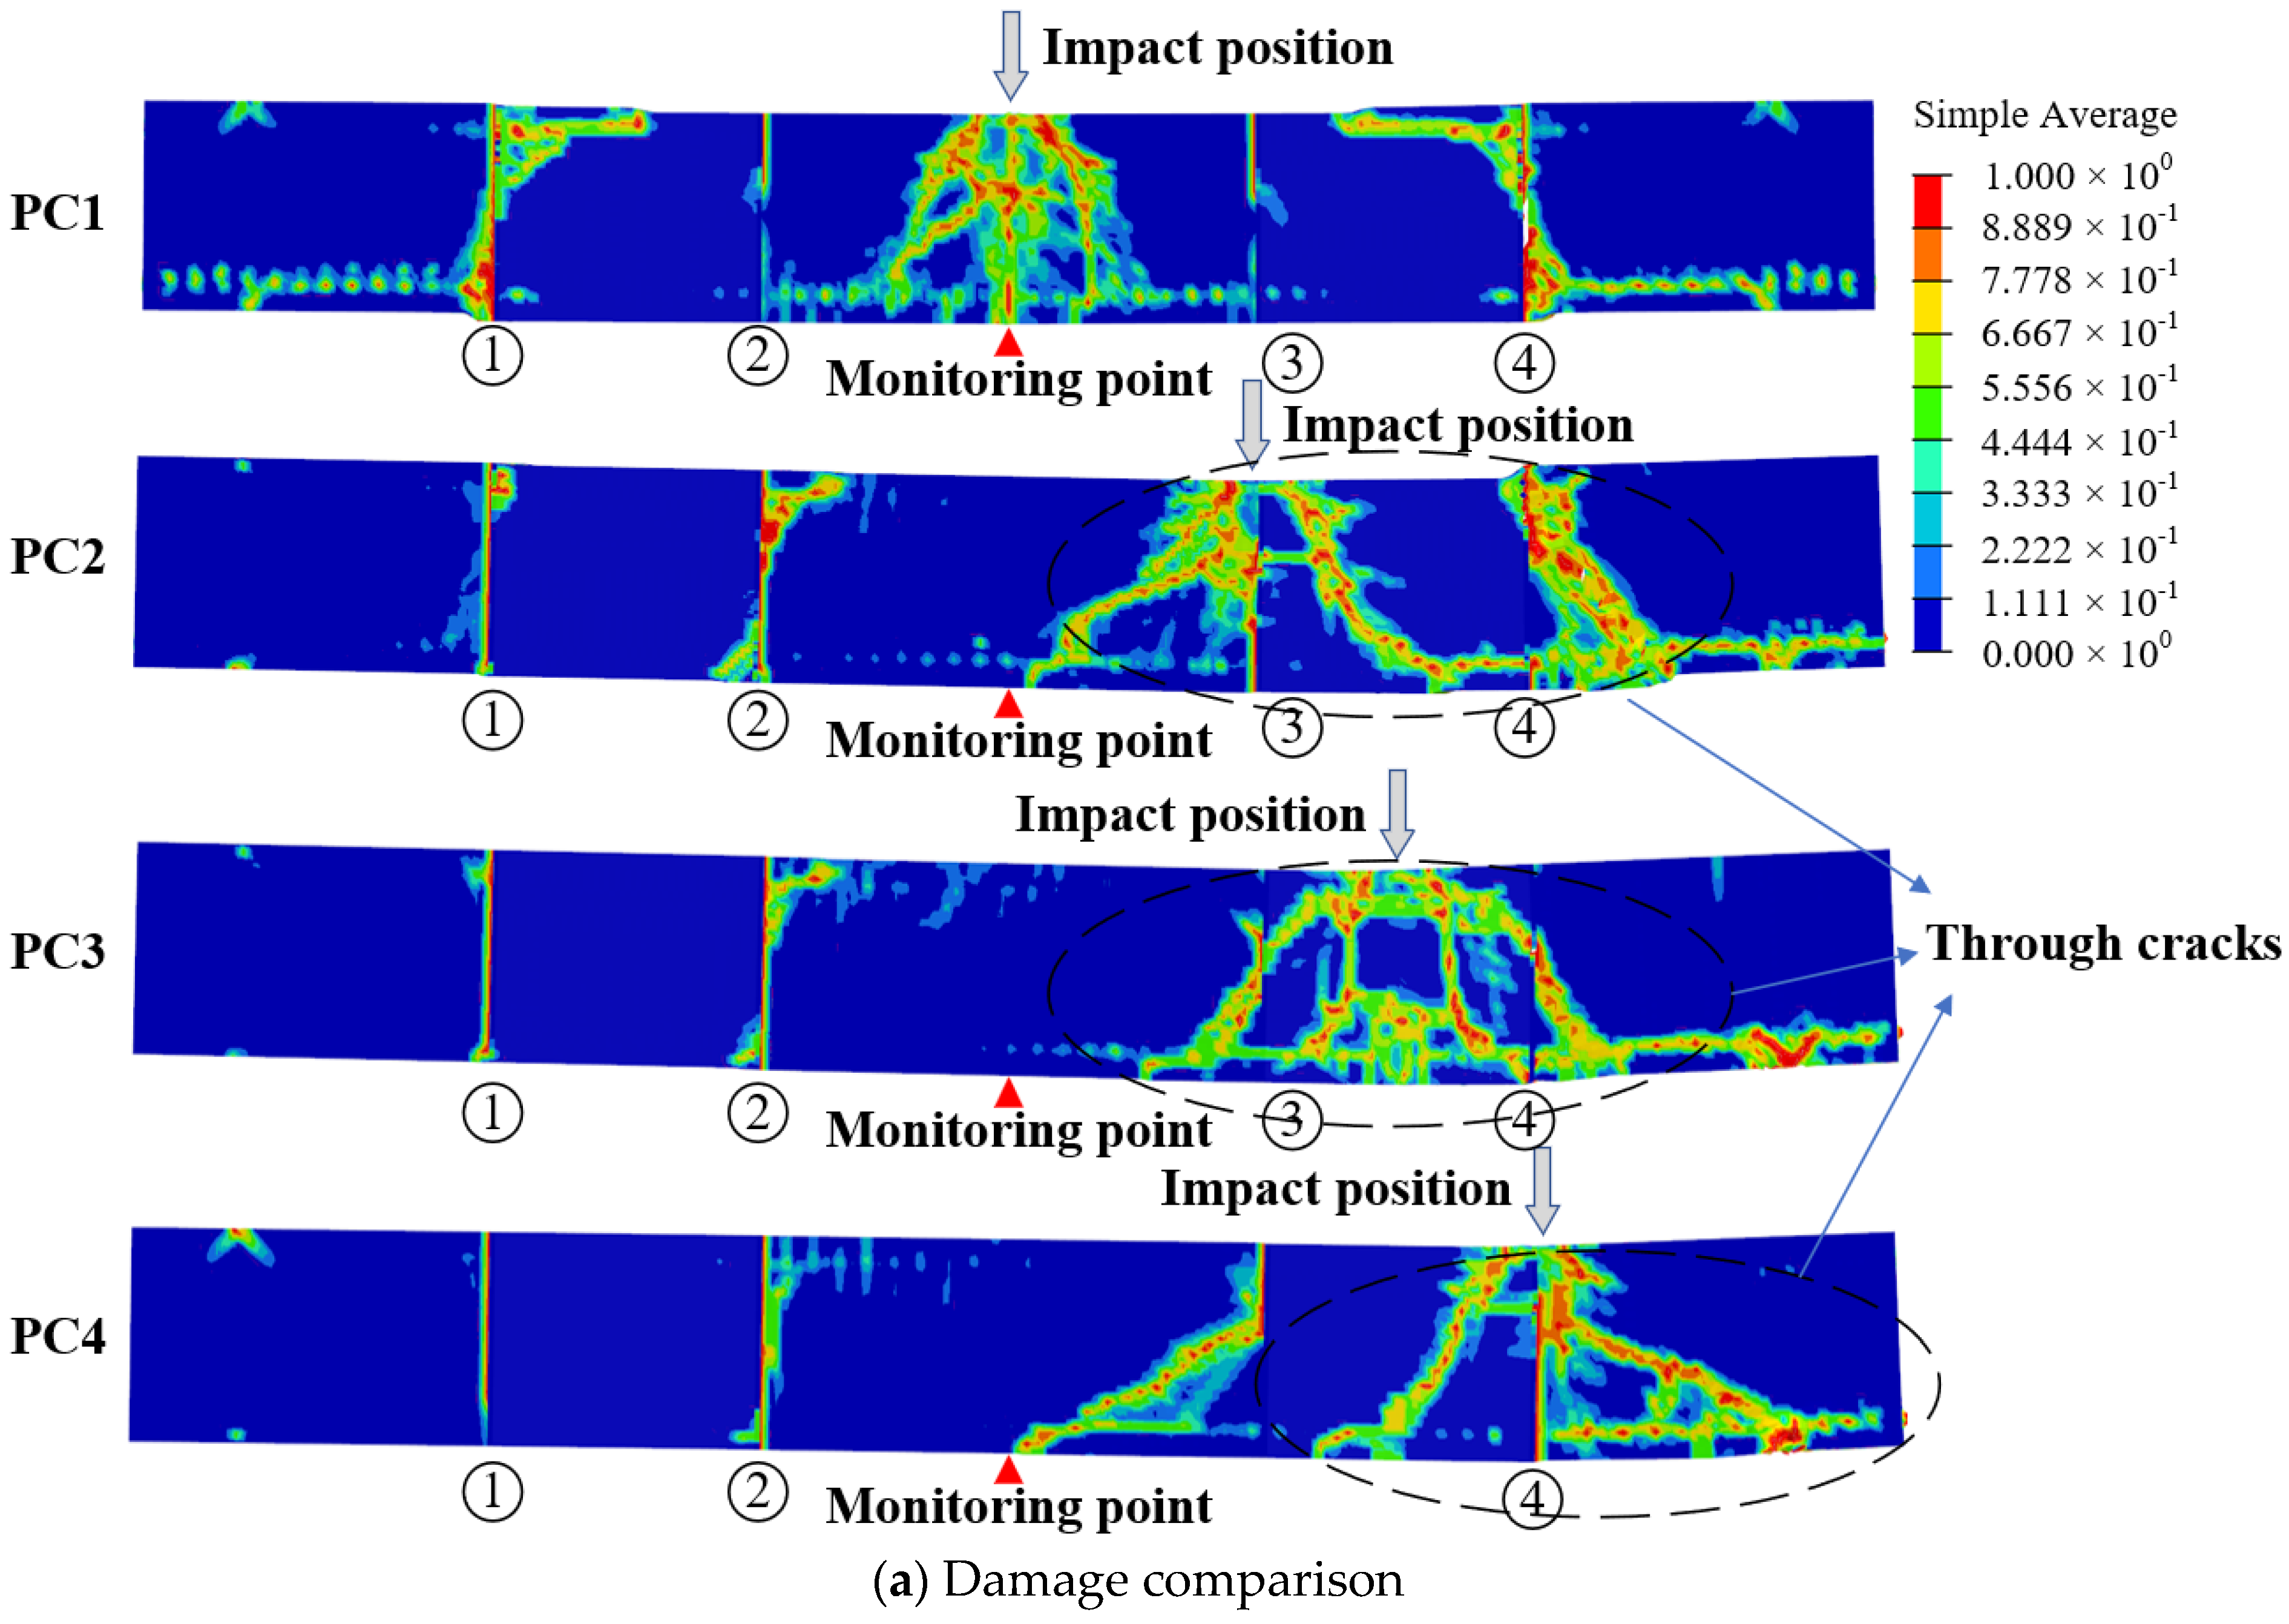
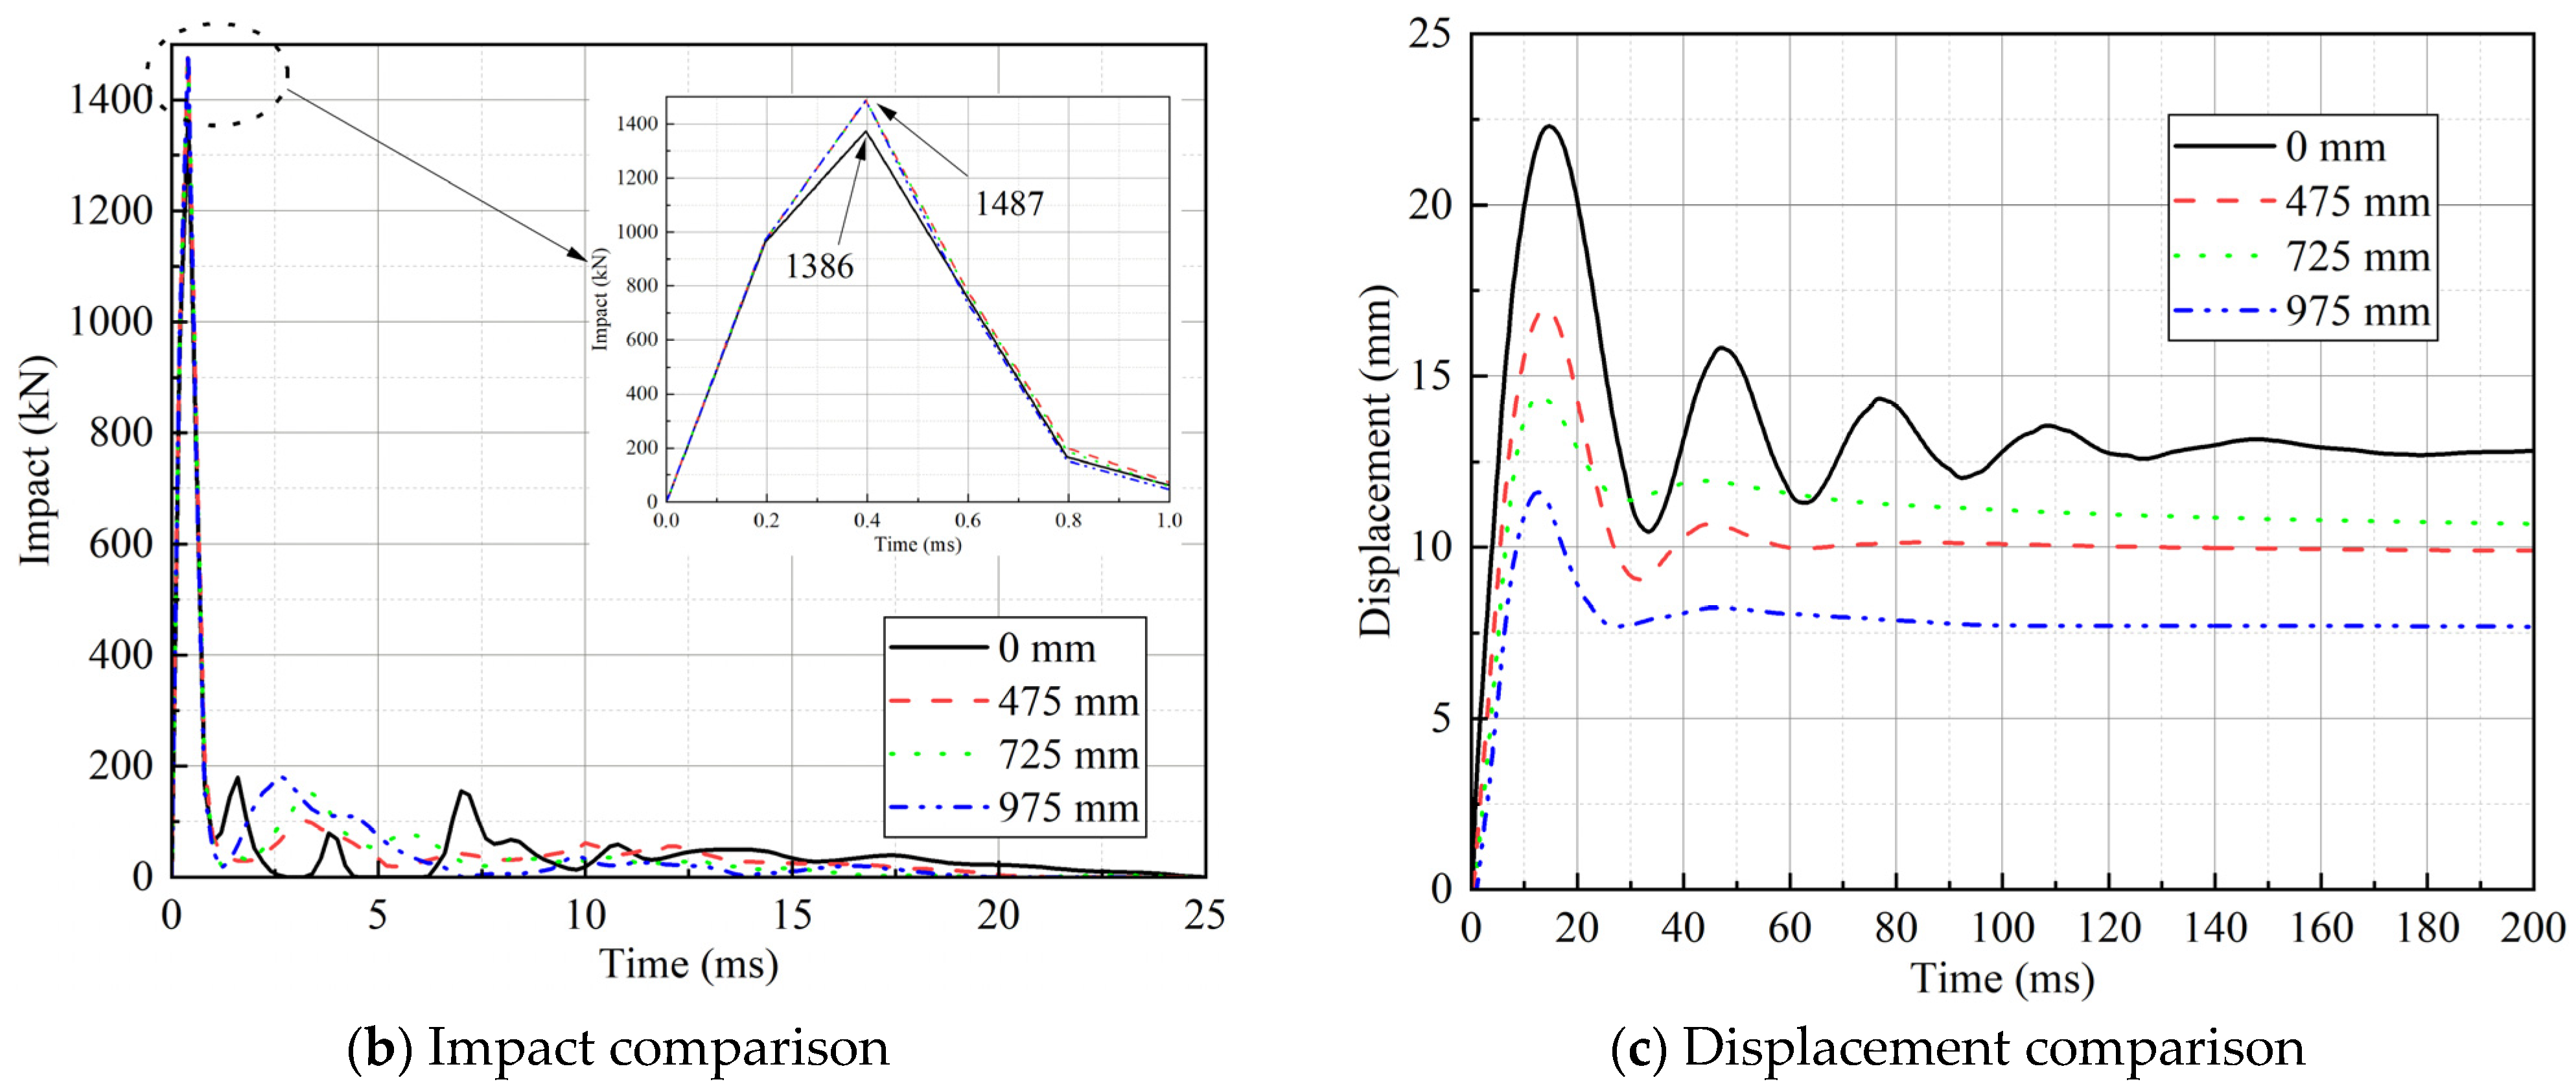
3.1. Impact Position

In the present relevant investigations, the impact on the mid-span part of the beam is frequently examined [20,49], especially for PC beams with cast-in-place concrete in the mid-span area. However, this consideration may be inappropriate for PC beams with several cast-in-place zones. Therefore, in this section, the effects of impact locations 0 mm, 475 mm (left interface), 725 mm (middle of cast-in-place zone), and 975 mm (right interface) from the span center were evaluated (Figure 7). The weight of the drop hammer is 253 kg and the impact velocity was 6 m/s.
The varied impact positions induced distinct damage profiles (Figure 8a). The impact forces of PC1~PC4 were not equal. The impact force of PC1 was around 1386 kN, which was smaller than that of PC2~PC4. This showed that PC1 begins plastic deformation slightly earlier than other working conditions (Figure 8b). Under the impact load, PC1 displayed symmetrical damage on the left and right sides. A penetration fracture was produced in the span, and a “Z”-shaped crack occurred at the concrete contact at sites 1 and 4. This behavior shows that the reinforcement starts to be subjected to tension and compression at this time and works in concert with the concrete to deform.
It should be noted that large cracks of a penetrating type were observed in all three working conditions from PC2 to PC4. The cracks at the bottom of the PC beam penetrated to the top of the beam. Especially in PC3, large “trapezoidal” cracks appeared in the cast-in-place area. A horizontal through crack was formed from the right end of the beam to the middle of the span. The longitudinal reinforcement at the bottom was severely deformed. Although the monitoring point was located in the middle of the beam span, the residual deformation of PC3 was even larger than that of PC2 (Figure 8c).
From the overall damage pattern, PC1 was plastic-deformed under the impact load. The cracks were predominantly dispersed in the middle of the span and at the interface 1 and 4, with a small amount of damage at interface 2 and 3. With the changing of the impact position, the damage degree of PC beam evidently varied. The damage of interface 1 and 2 steadily lessened. In addition, a large number of radial and longitudinal penetration cracks appeared at the bottom of the beam. Overall, under the same impact load, the middle of the cast-in-place area on the right side of the PC beam was the most severely damaged member when impacted.

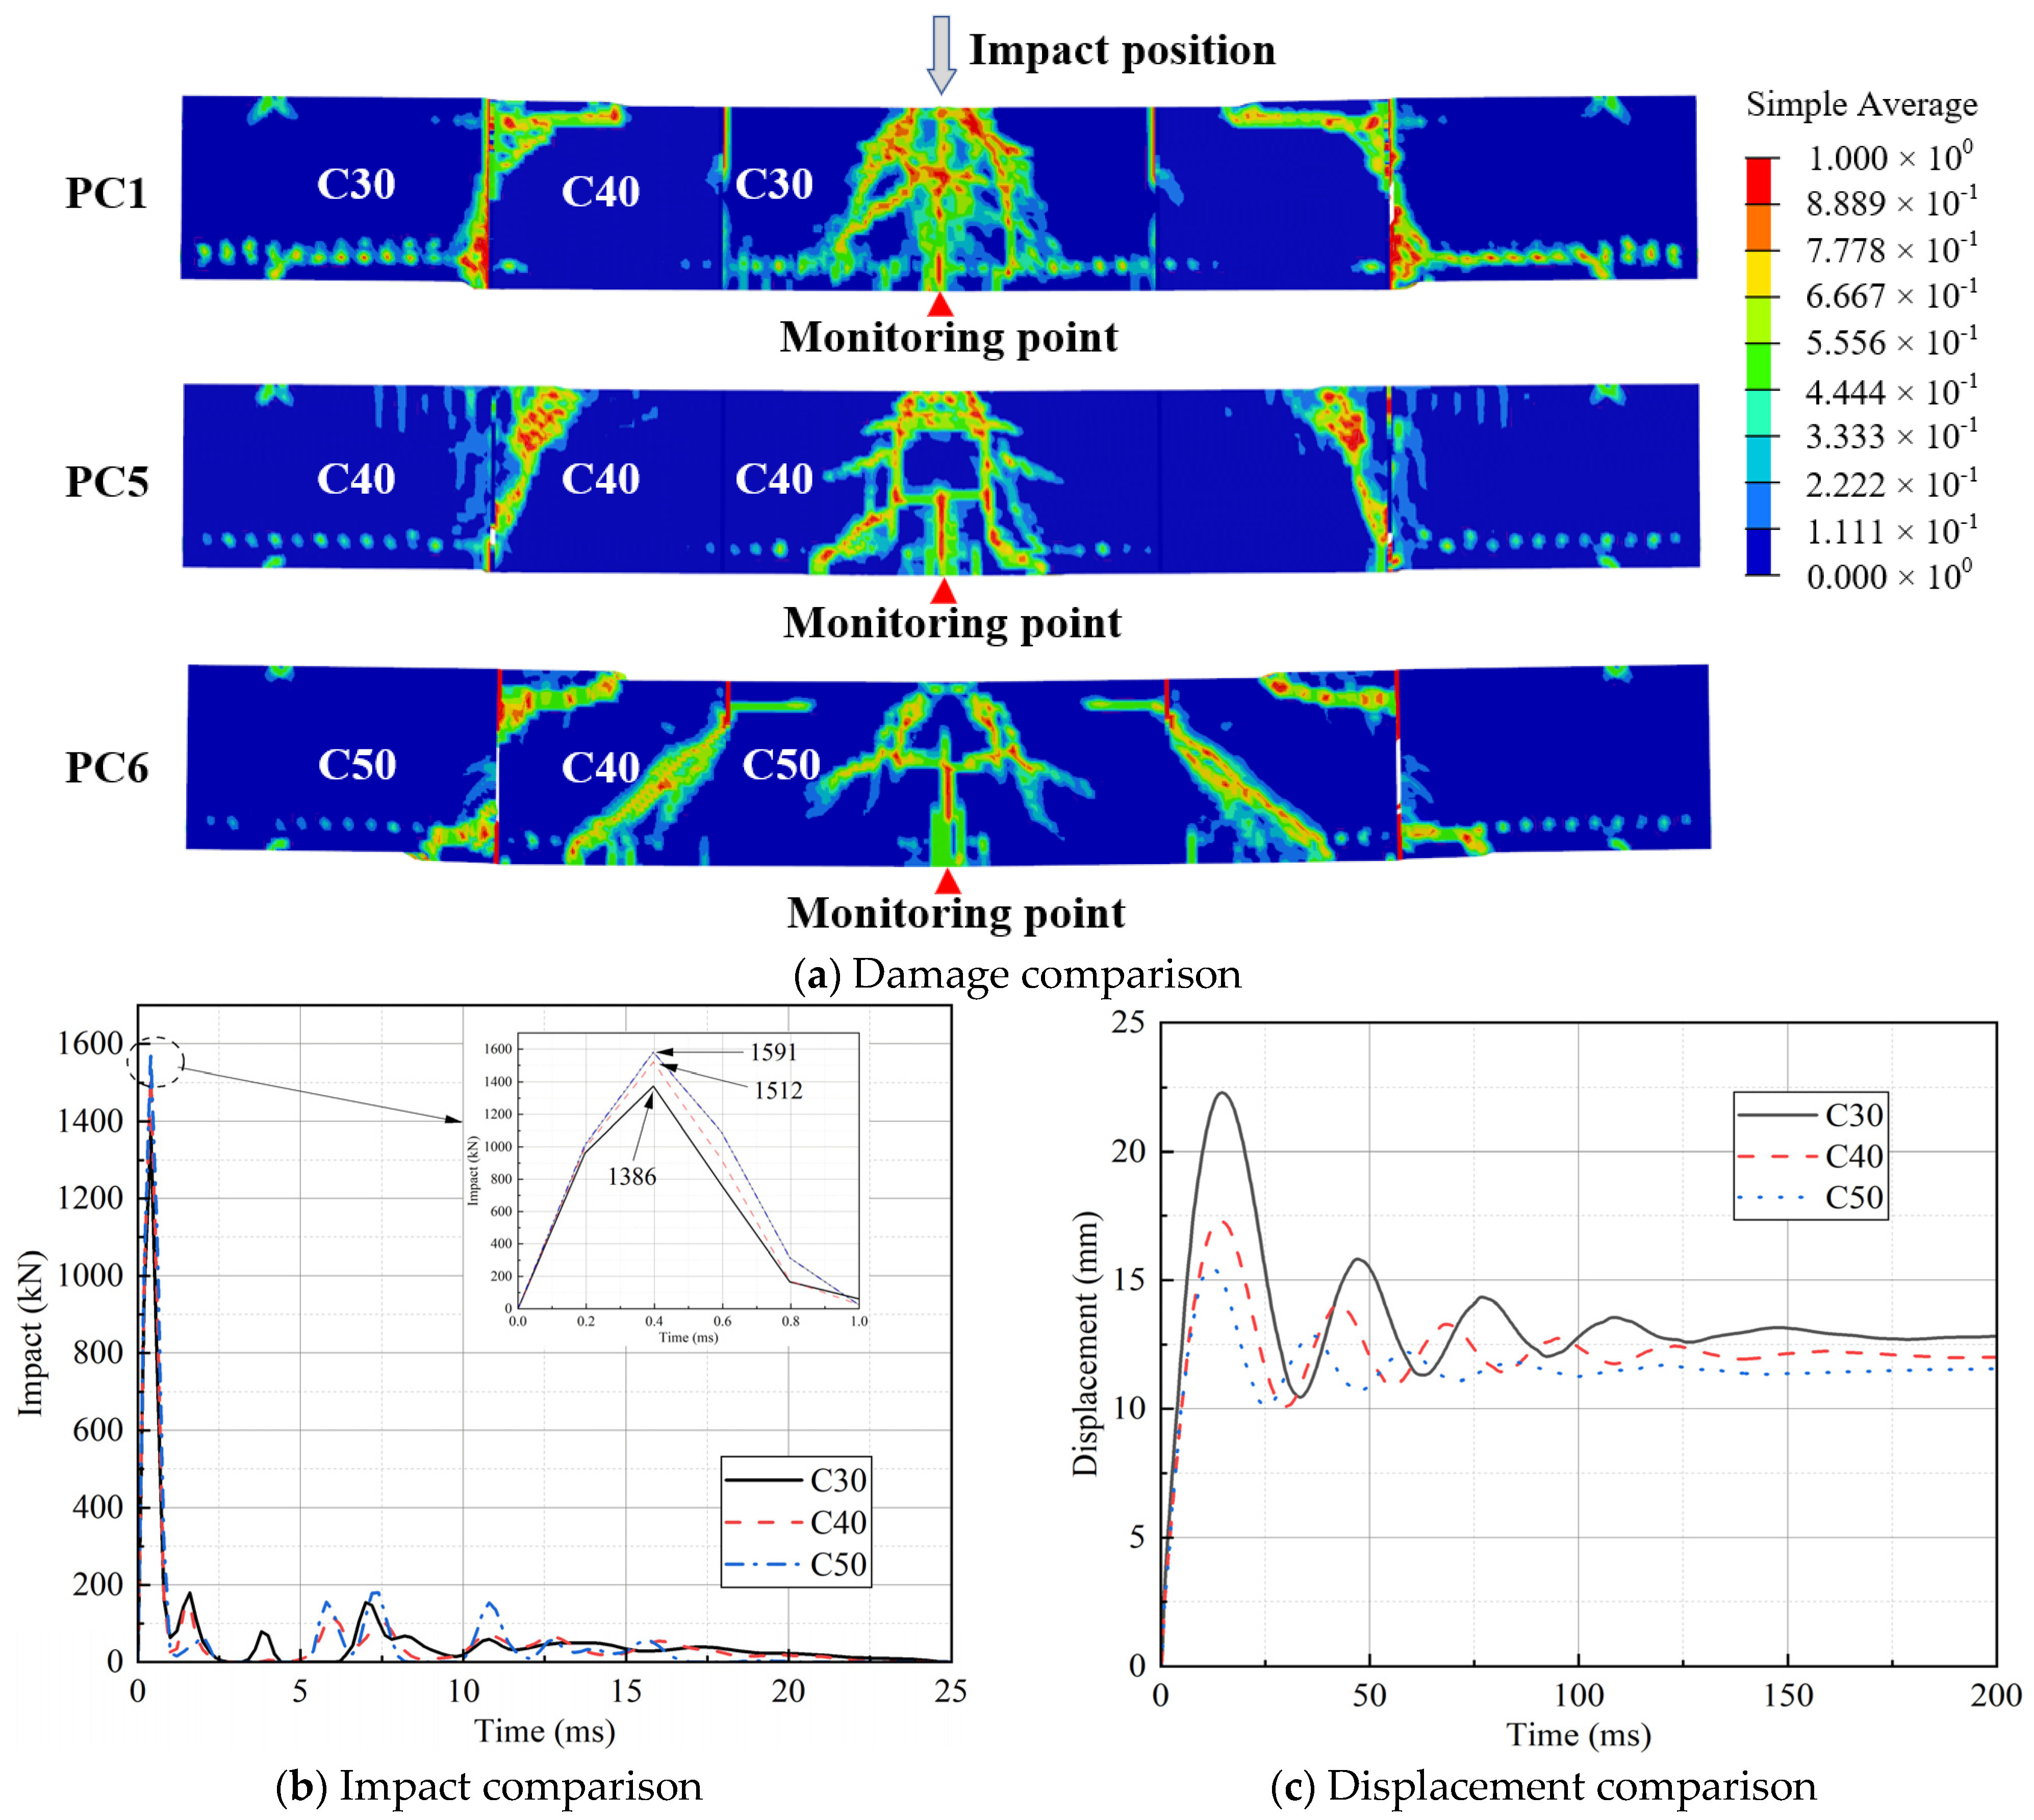
3.2. Concrete Strength

In order to study the effect of concrete strength on PC beams under impact loading, the concrete strength of precast section was set to 30 MPa, 40 MPa and 50 MPa in this section. Meanwhile, the concrete strength of 40 MPa was maintained in the cast-in-place area.
The damage of PC beams under impact loading is depicted in Figure 9a. The damage of the member is predominantly localized at the concrete interface and the area of the mid-span susceptible to direct impact. The interface is the weak region of the component, which creates shear damage under the impact stress and develops a significant number of shear cracks. When the concrete strength is raised to 50 Mpa, 45° oblique fractures emerge in the cast-in-place region. It is noticeable that the damage fractures in the mid-span section steadily reduce as the concrete strength of the precast section improves. It can be shown that raising the concrete strength of the precast section can effectively increase the impact resistance of the span-middle region of the PC beam. The concrete strength of the PC section should not be higher than the cast-in-place concrete strength, or else it would increase the degree of damage in the cast-in-place area.
With the rise in concrete strength, the local stiffness of PC beam span mid-section increased. The peak impact force increased from 1386 kN to 1591 kN (Figure 9b), and increased by 14.79%. Interestingly, the residual displacements did not change significantly despite the substantial variance in the peak mid-span displacements of the three. The residual displacements of PC1, PC5 and PC6 were around 12.76 mm, 12.03 mm and 11.52 mm (Figure 9c). The residual displacements of the three were reduced by 5.72% and 9.72%, respectively. It can be seen that the increase in concrete strength of precast sections enhanced the local stiffness of PC beams, but the influence on the overall stiffness was not considerable.

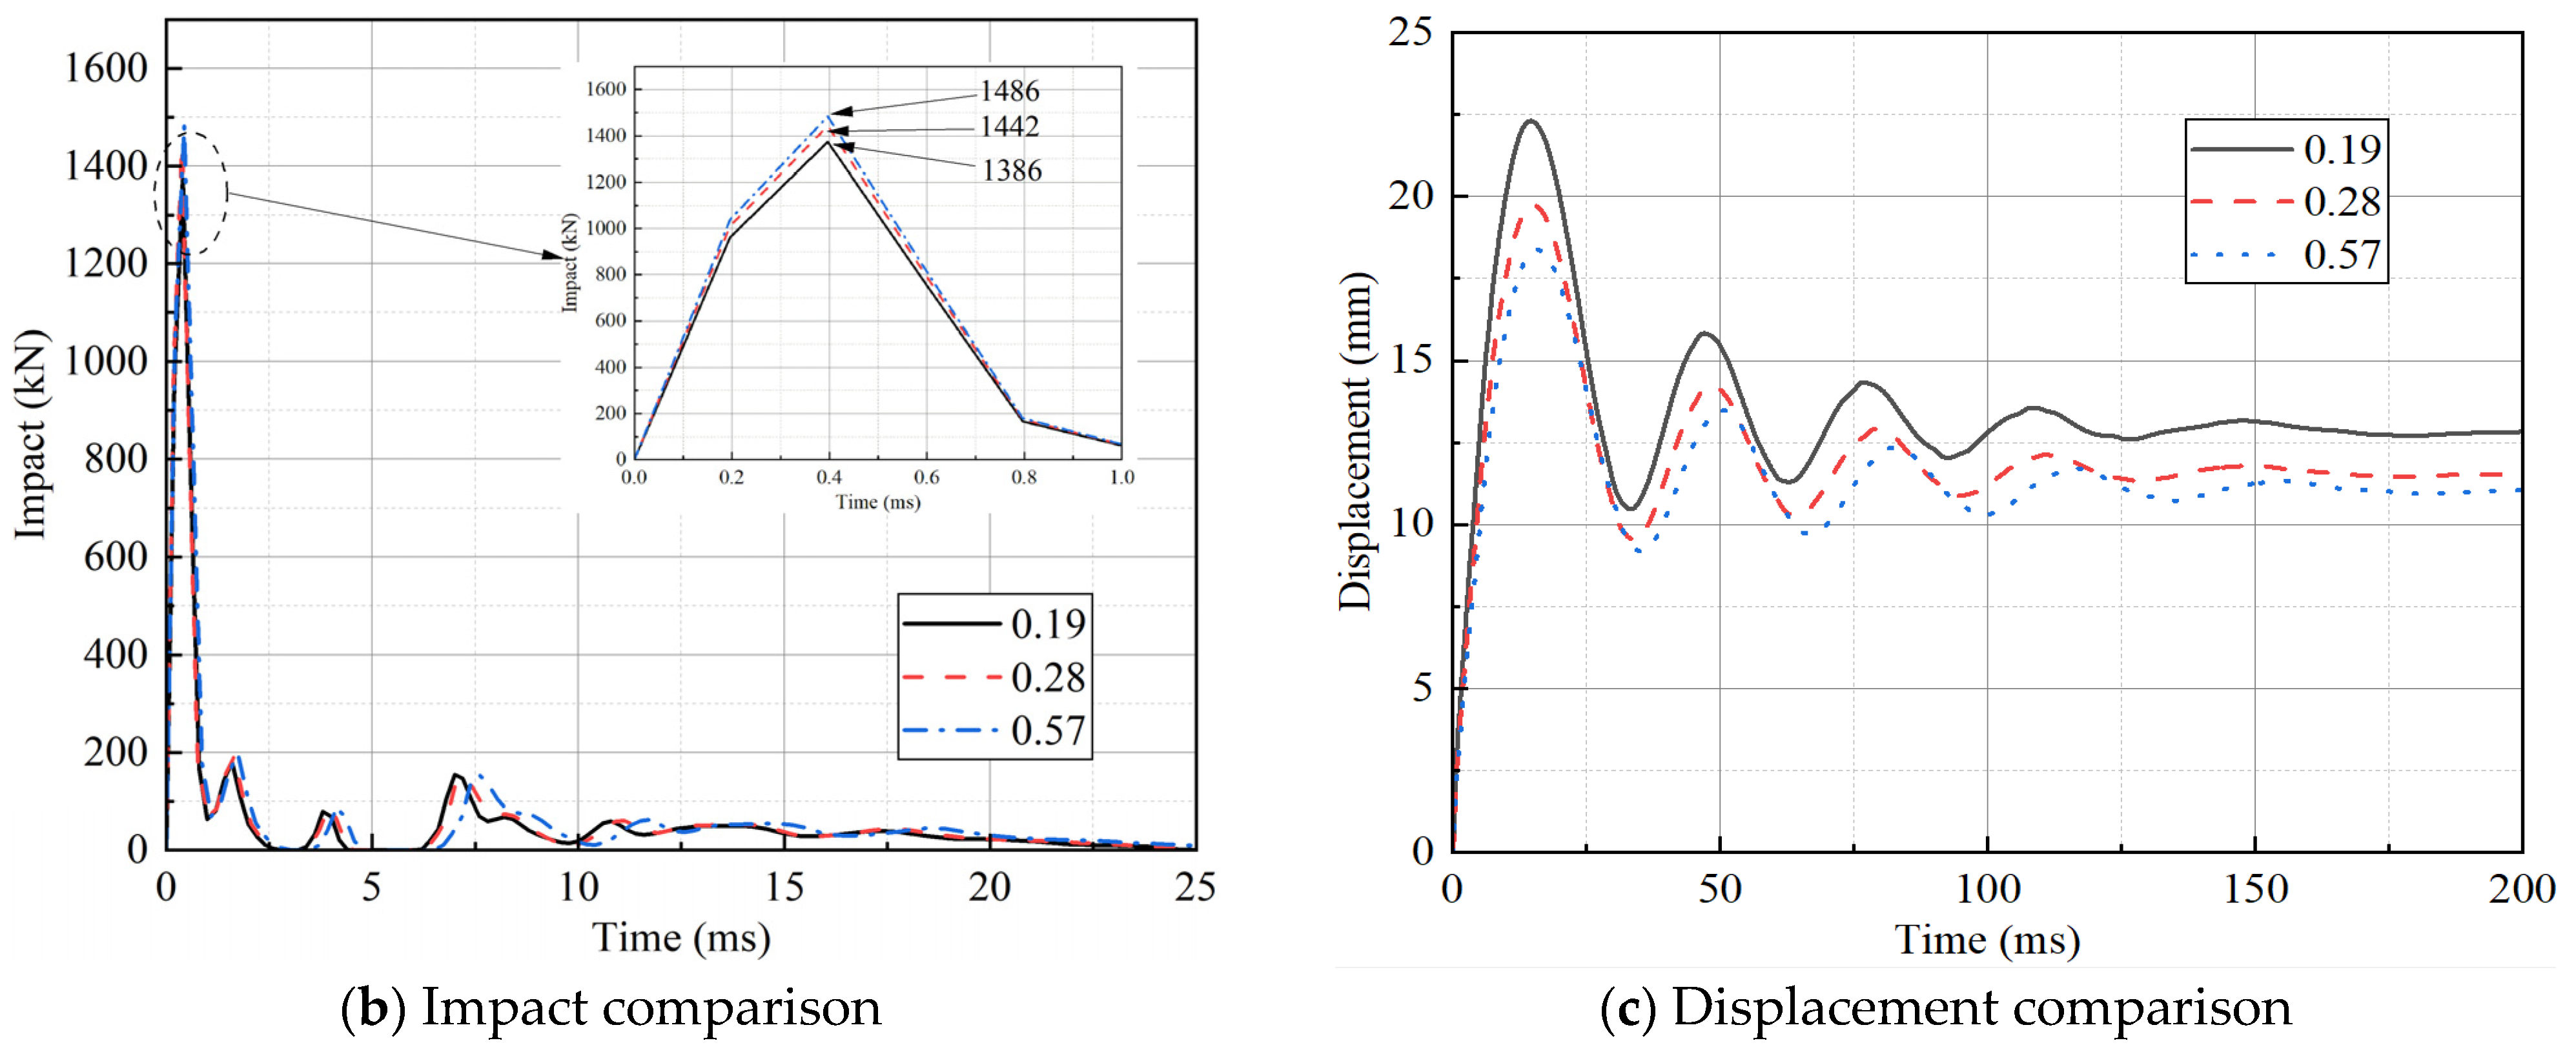
3.3. Stirrup Reinforcement Ratio

Numerous study results have revealed [50,51] that the concrete interface of PC beams is the weakest part of the member under either static load or impact load. In order to investigate the effect of the stirrup reinforcement ratio on PC beams, the stirrups in the cast-in-place area of the member were encrypted in this section (Figure 10). The encryption length was 450 mm on each of the left and right sides of the cast-in-place zone. The spacing of stirrups in the encrypted zone was 150 mm, 100 mm and 50 mm for PC1, PC7 and PC8, respectively.
The damage of PC beams with varied stirrup ratios under impact loading is illustrated in Figure 11a. The damaged regions of the PC beams were localized at the concrete interface and the area subjected to direct impact. The damage at the interface reduced with the increasing of the stirrup rate. The most severe damage at interface 1 and 2 transferred from the bottom to the top of the beam, while the damage at interface 3 and 4 steadily reduced until it disappeared. Interestingly, when the concrete damage at interface 2 and 3 subsided, the damage at interface 1 and 4 was localized in the higher half of the junction surface. This may have been caused by the quick transmission of the impact force to intersection 1 and 4, due to the high rise in the stirrup rate and the increase in local stiffness between interface 2 and 3.
The peak impact forces of PC1, PC7 and PC8 were roughly 1386 kN, 1442 kN and 1486 kN. It can be observed that the increase in the stirrup reinforcement ratio locally increased the stiffness of the mid-span section. It also enhanced the peak impact force of PC7 and PC8 (Figure 11b). As a consequence, the peak and residual displacements in the mid-span of the members steadily reduced with the increase of the stirrup reinforcement ratio. The highest displacements of PC1, PC7 and PC8 were around 22.45 mm, 19.05 mm and 17.44 mm, respectively. The residual displacements of the three were roughly 12.76 mm, 11.5 mm and 10.99 mm, respectively (Figure 11c). The residual displacement of the three were reduced by 9.87% and 13.87%, respectively.
Therefore, the local stiffness of PC beams can be improved by encrypting the stirrup in the cast-in-place area and increasing the stirrup reinforcement ratio. At the same time, the shear resistance of the concrete interface of PC beams can be effectively enhanced.

4. Single-Degree-of-Freedom Theoretical Calculation Method

Currently, most of the dynamic responses for PC beams under impact loads are based on numerical simulations and experimental methods. In this section, a simplified single-degree-of-freedom model was used to explore the mechanical properties of PC beams under impact loading. The key issues of using the simplified single-degree-of-freedom model are: simplification of the single-degree-of-freedom model, simplification of the impact load, and simplification of the force-resisting model.

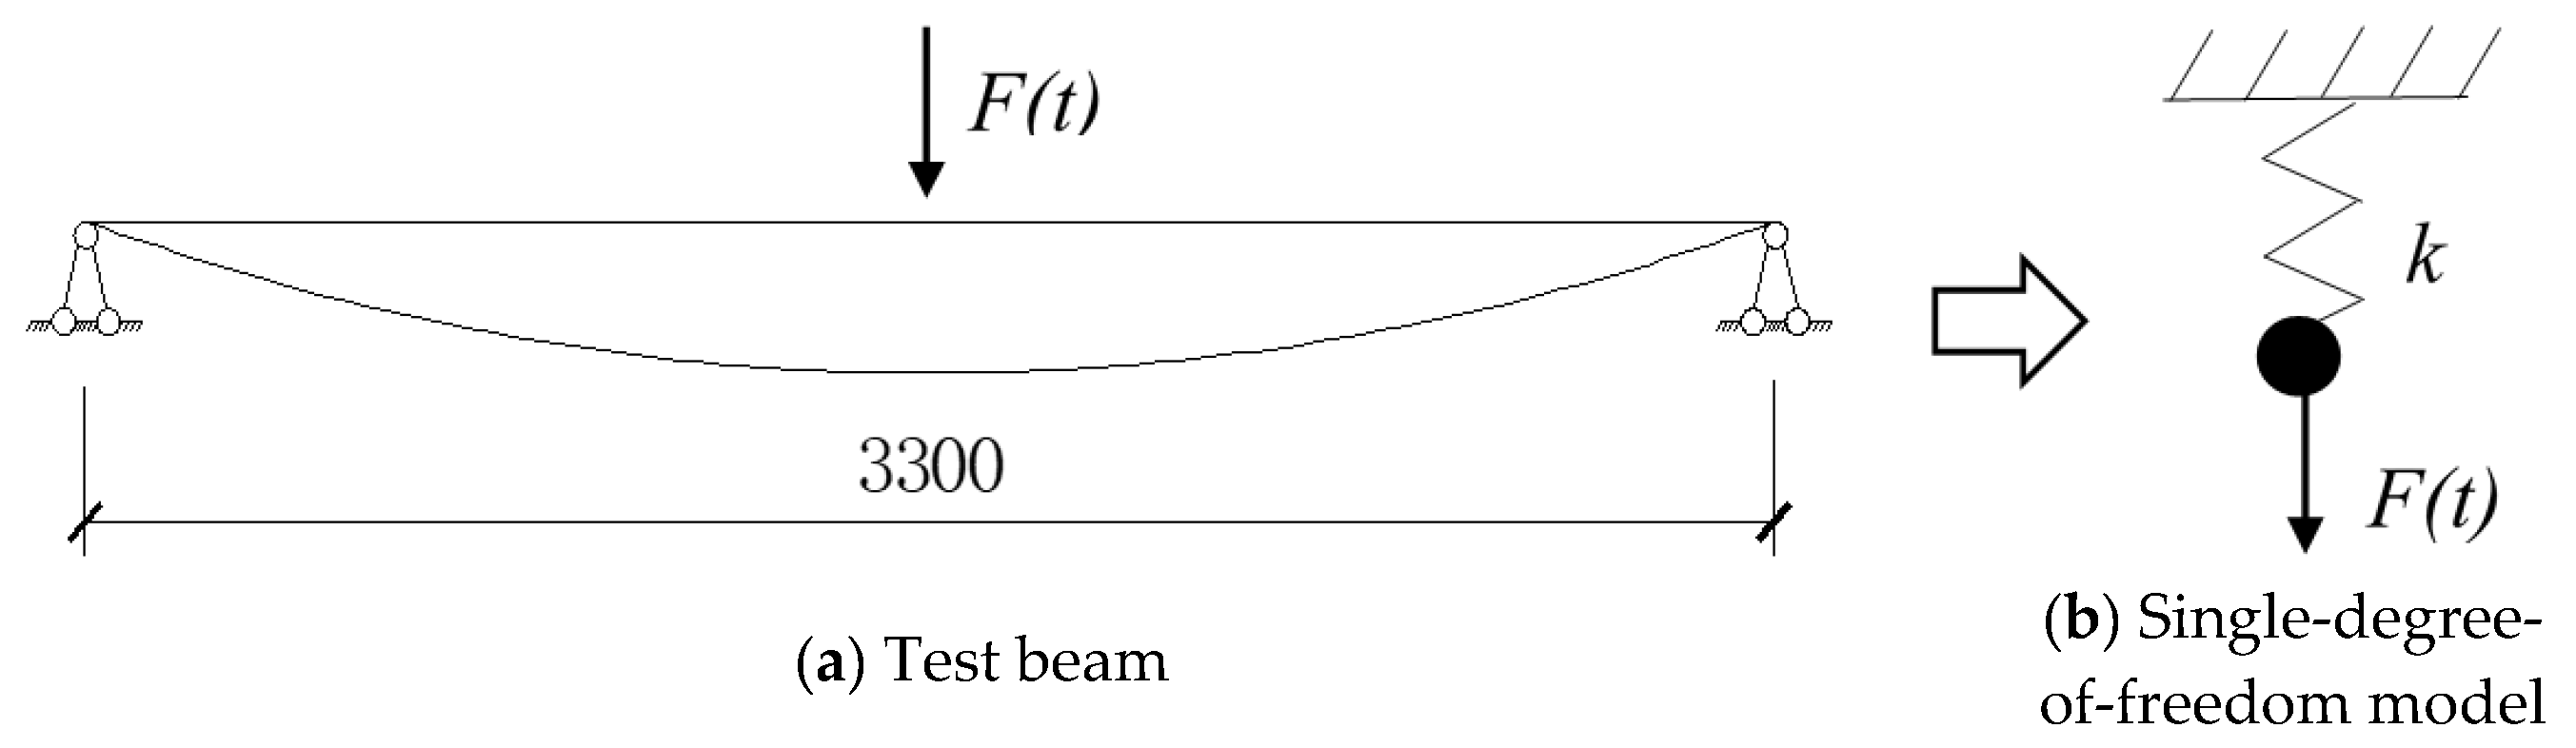
4.1. Simplification of the Single-Degree-of-Freedom Model

Simply supported beams are continuous mass distribution systems. In order to simplify the analysis process, the simply supported beam was equated to a single degree of freedom system for analysis according to the principle of energy conservation. The simplified models of elastic and plastic single degree of freedom for the simply supported beam system with uniform mass distribution are shown in Figure 12 and Figure 13, respectively.

4.1.1. Mass Conversion Factor

When the PC beam is in the elastic phase, the kinetic energy of the PC beam is expressed as follows:
E d = 1 2 0 L m y ˙ ( x ) 2 d x
where m ( x ) is the mass per unit length of beam, y ˙ ( x ) is the velocity of PC beam; L is the length of PC beam.
When the PC beam is in elastic phase, the expression of the shape function of the simply supported beam is as follows:
y = y 0 sin π x L
Combining Equations (9) and (10), the following expression can be derived:
E d = 1 2 0 L m ( y ˙ 0 ( t ) sin π x L ) 2 d x = 1 2 m y ˙ 0 2 ( t ) L 2
where
E = 1 2 m y ˙ 0 2 ( t ) L
then
E d = K m E
where, K m is the elastic mass conversion factor, K m = 0.5 .
When the PC beam enters the plastic phase, a plastic hinge is formed in the beam span. The beam obeys a linear displacement distribution. For the single-degree-of-freedom system, the following kinetic energy expressions are given:
E d = 1 2 0 l m y ˙ ( x ) 2 d x = 2 0 L 2 [ y ˙ 0 ( t ) x L 2 ] 2 d x = 1 6 m L y ˙ 0 2 ( t )
where
E = 1 2 m L y ˙ 0 2 ( t )
then
E d = K m E
where, K m is the elastic mass conversion factor, K m = 0.33 .

4.1.2. Load Conversion Factor

For the work done by the impact load, since the impact force is a single point load, the load factor Kl = 1. During the impact process, due to the very short impact action time, the damping in the structure has not yet produced the effect, the member displacement has reached the displacement maximum or limit value, and damage occurs. For the convenience of calculation, the damping effect is usually not considered under the action of impact load.

4.1.3. Simplification of the Impact Load

The impact load is an impulsive type of load. Its impact force time course curve is more complicated. The time course curve is simply divided into a high frequency triangular part and a low frequency rectangle component. According to the concept of momentum conservation, the impact force of the drop hammer on the beam can be simplified to a triangular impulse load with the same high-frequency impulse as illustrated in Figure 14. The shaded areas in both figures are equal.
I 0 = 0 t F ( t ) d t
F c = 2 I 0 t 0

4.1.4. Simplification of the Resistance Model

In the single-degree-of-freedom model simplification, the concrete beam was simplified to an ideal elastic-plastic model for the convenience of calculation. Only the bending deformation of the beam was considered, and its shear deformation was neglected. The simplification is shown in Figure 15.
In the figure, R ( u ) = k y m is the ultimate bending load capacity, k is the bending stiffness, and R ( u ) is the ultimate resistance. For a simply supported beam, the maximum displacement in the span under the unit concentrated load is y m ax = L 0 3 48 E I a . The following expressions can be derived:
k = 48 E I a L 0 3
I a = 0.5 ( I g + I c r )
I cr = b c 3 3 + n A s ( d - c ) 2
c = n A s + n A S ( n A s + 2 b d ) b
n = E s E c d
where, I a is the average moment of inertia of the member cross−section, I g is the moment of inertia of the concrete member to the cross−section of the shaped axis, not counting the effect of reinforcement; I c r is the moment of inertia of the concrete cracking section; b is the member cross−section width; d is the effective height of the member cross−section; A s is the member reinforcement area; E s is the modulus of elasticity of reinforcement; E c d is the dynamic modulus of elasticity of concrete, which can be 1.2 times of the static load.
Equations (19)–(23) allow to calculate the beam stiffness in the linear range. When the stress on the section of the beam is less than the yield limit, the deformation of the beam is still in the elastic deformation stage. The formula derived above is suitable for the case where the beam is elastically deformed in the first stage.

4.2. Solving the Equation

The impact dynamic equation of the equivalent single-degree-of-freedom elastic stage of a reinforced concrete beam with continuous mass distribution is expressed as follows:
0.5 M y ¨ + k y = F ( t )
The impact dynamic equation of the equivalent single degree of freedom entering the inelastic stage is expressed as follows:
0.33 M y ¨ + k y = F ( t )
For the dynamic response caused by the general dynamic load, the Duhamel integral can be used to solve it. The principle is to discretize the whole loading process into a series of instantaneous impulses. For a single-degree-of-freedom system with an initial displacement a, and an initial velocity b, the displacement expression under general arbitrary loads is as follows:
y ( t ) = y 0 cos ω t + v 0 ω sin ω t + 1 m ω 0 t F ( τ ) sin ω ( t τ ) d τ
ω = k m
For low-energy impact loads, the specimen has not yet entered the plastic stage when the impact force reaches its peak value. The plastic stage occurs in the drop of the impact force. The solution process is as follows:
When t t r ( t r is the time when the impact force reaches the peak value),
y = F k 1 t r ( t sin ω t ω )
When t = t r , assume that t = t 1 , y = y 1 , y ˙ = v 1 .
When t t r , y y m ,
y = F k [ 1 cos ω ( t t r ) ] F k 1 t r [ ( t t r ) sin ω ( t t r ) ω ] + v 1 ω sin ω ( t t r ) + y 1 cos ω ( t t r )
When y = y m   ( y m is the maximum elastic displacement), assume that t = t 2 , y = y 2 , y ˙ = v 2 .
When t t 2 , t 2 t r ,
y = 1 6 F t r ( t t 2 ) 3 + ( 2 t r t 2 ) 2 t r ( F R u ) ( t t 2 ) 2 + v 2 ( t t 2 ) + y 2
When y y m , t = 2 t r , assume that t = t 3 , y = y 3 , y ˙ = v 3 .
When t t 3 , y y m a x ( y m a x is the maximum value of the displacement in the middle of the span),
y = 1 2 R ( u ) ( t t 3 ) 2 + v 3 t + y 3
When y = y max , assume that t = t 4 , y = y 4 , y ˙ = v 4 .
When t t 4 , y y m a x y m ,
y = y 4 [ cos ω ( t t 4 ) ]
When y = y m a x y m , t = t 5 .
When t t 5 ,
y = y m a x y m
For high-energy impact loads, when the impact force has not yet reached its peak, the specimen has entered the plastic phase, and the solution process is as follows:
When y y m ( y m is the maximum elastic displacement),
y = F k 1 t r ( t sin ω t ω )
When y = y m , assume that t = t 1 y = y 1 y ˙ = v 1 .
When t t t r ,
y = 1 6 F t r ( t t 1 ) 3 + 1 2 [ t 1 t r F R ( u ) ] ( t t 1 ) 2 + v 1 ( t t 1 ) + y 1
When t = t r , assume that t = t 2 , y = y 2 , y ˙ = v 2 .
When t t 2 , t 2 t r ,
y = 1 6 F t r ( t t 2 ) 3 + 1 2 [ F R ( u ) ] ( t t 2 ) 2 + v 2 ( t t 2 ) + y 2
When t = 2 t r , assume that t = t 3 , y = y 3 , y ˙ = v 3 .
When t t 3 , y y m a x ,
y = 1 2 R ( u ) ( t t 3 ) 2 + v 3 ( t t 3 ) + y 3
When y = y max , assume that t = t 4 , y = y 4 , y ˙ = v 4 .
When t t 4 , y y m a x y m ,
y = y 4 [ cos ω ( t t 4 ) ]
When y = y m a x y m , assume that t = t 5 .
When t t 5 ,
y = y m a x y m
The solution flow chart of Equations (26)–(39) is shown in Figure 16.

4.3. Time-History Curve of Mid-Span Displacement

The time-history curve of mid-span displacement acquired by experiment [27] and theoretical computation is presented in Figure 17. It can be observed from the time-history curves of each specimen that the estimated findings of the peak mid-span displacement of each specimen are all bigger than the experimental values under the identical operating circumstances. The reason may be that the value of the stiffness in the theoretical calculation is smaller than the actual stiffness. The simplified ideal elastic-plastic concrete resistance model decreases the real stiffness of each specimen.
Comparing the theoretical and experimental values of peak vertical displacement in the span of PC beams under impact loading (Table 4), it can be shown that when the impact energy is modest, the peak impact force is tiny. When the impact force reaches its apex, the specimen has not yet reached the plastic phase. Entering plasticity happens when the impact force lowers. At this moment, the theoretical value is closer to the test value. However, when the B4d impact energy grows too fast, the peak impact force likewise increases rapidly. The rigidity of the PC beam drops fast and the theoretical value deviates from the practical value. It can be observed that the peak vertical displacement in the span of the PC beam can be predicted more conservatively by simplifying the PC simply supported beam with continuous mass distribution to a single-degree-of-freedom model and creating the dynamic equations for its dynamic analysis. Although the redundancy of the computation results is substantial, it is nevertheless of practical reference relevance.

5. Conclusions

This paper investigated the dynamic response of precast beams connected by grouted sleeves under impact loads based on the subject’s impact load test concerning PC beams. A revised finite element model was created and compared with the experimental data for verification. Subsequently, the impact location, concrete strength of precast section, and stirrup reinforcement ratio in cast-in-place area of PC beams under impact load were investigated. Finally, based on the simplified single-degree-of-freedom model, the mechanical characteristics of PC beams under impact loading were evaluated theoretically. The main research findings are summarized as follows:
(1)
Under impact loads, the areas of the PC beam that are immediately struck and the interfaces of precast and cast-in-place concrete are most vulnerable to damage. The bottom of the portion subjected to direct impact is prone to tensile damage. The interfaces of precast and cast-in-place concrete is prone to shear damage. Under the same impact load, the damage is most significant in the central half of the cast-in-place area of the PC beam. The protection of this portion should be increased;
(2)
The local stiffness of PC beams increased with the increase of concrete strength in precast sections. At the same time, the damage cracks in the mid-span of PC beams steadily decreased. When the precast concrete strength is C40 and C50, the residual displacement in the beam span is 5.72% and 9.72% lower than that of C30, respectively. Nevertheless, the interface between precast concrete and cast-in-place concrete is still the weak spot. Increasing the strength of precast concrete did not appreciably minimize the shear fractures of PC beams;
(3)
Increasing the stirrup reinforcement ratio in the cast-in-place concrete section can improve the local stiffness of the cast-in-place section of the PC beam. At the same time, the residual displacement of the beam span under the impact load is reduced. Compared with the stirrup ratio of 0.19%, when the stirrup ratio is 0.28% and 0.57%, the mid-span displacement of the beam decreases by 9.87% and 13.87%, respectively. The increase of the stirrup reinforcement ratio can enhance the shear resistance of the interface and effectively reduce the degree of damage to the interface in the mid-span section of the PC beam. Therefore, it is recommended to appropriately increase the stirrup rate in the cast-in-place area to improve the overall shear capacity of the beam.
(4)
In this study, the PC simply supported beam with continuous mass distribution was simplified to a single-degree-of-freedom model for analysis. The simplified model method based on equal high frequency impulse impact force was provided. The calculation findings revealed that the theoretical value is somewhat larger than the test value under low energy impact loading, with an average error of 20.1%, which is more accurate. When the impact energy increases, the deviation of both is greater. The single-degree-of-freedom computational model calculation approach is useful for the investigation of the dynamic response of PC beams under low-energy impact loads.

Author Contributions

Conceptualization, L.Z., X.L. and Q.Y.; methodology, L.Z., X.L. and Q.Y.; software, L.Z.; validation, X.L. and Q.Y.; formal analysis, L.Z. and Q.Y.; investigation, L.Z.; resources, L.Z. and X.L.; data curation, Q.Y.; writing—original draft preparation, L.Z.; writing—review and editing, L.Z.; visualization, L.Z. and X.L.; supervision, L.Z. and Q.Y.; project administration, L.Z. and Q.Y.; funding acquisition, X.L. and Q.Y. All authors have read and agreed to the published version of the manuscript.

Funding

This research was funded by the National Natural Science Foundation of China (No. 52178445).

Institutional Review Board Statement

The research in this paper does not involve humans or animals.

Data Availability Statement

The data are available upon request from the corresponding authors.

Conflicts of Interest

The authors declare no conflict of interest.

References

  1. Banjara, N.K.; Ramanjaneyulu, K. Experimental and numerical study on behaviour of HSFRC overlay strip strengthened flexural deficient RC beams. Eng. Struct. 2019, 198, 109561. [Google Scholar] [CrossRef]
  2. Tran, D.T.; Pham, T.M.; Hao, H.; Chen, W. Numerical study on bending response of precast segmental concrete beams externally prestressed with FRP tendons. Eng. Struct. 2021, 241, 112423. [Google Scholar] [CrossRef]
  3. Lin, Y.; Chen, Z.; Guan, D.; Guo, Z. Experimental study on interior precast concrete beam-column connections with UHPC core shells. Structures 2021, 32, 1103–1114. [Google Scholar] [CrossRef]
  4. Yang, Y.; Xue, Y.; Yu, Y.; Ma, N.; Shao, Y. Experimental study on flexural performance of partially precast steel reinforced concrete beams. J. Constr. Steel Res. 2017, 133, 192–201. [Google Scholar] [CrossRef] [Green Version]
  5. Zhang, J.; Ding, C.; Rong, X.; Yang, H.; Wang, K.; Zhang, B. Experimental seismic study of precast hybrid SFC/RC beam-column connections with different connection details. Eng. Struct. 2020, 208, 110295. [Google Scholar] [CrossRef]
  6. An, Q.; Wang, Y.; Yu, H.; Wang, X. Seismic behaviour of anchored prefabricated wall–beam joints of bundled lipped channel-concrete composite wall structures. Thin-Walled Struct. 2022, 179, 109695. [Google Scholar] [CrossRef]
  7. Fahmy, M.F.M.; Idriss, L.K. Flexural behavior of large scale semi-precast reinforced concrete T-beams made of natural and recycled aggregate concrete. Eng. Struct. 2019, 198, 109525. [Google Scholar] [CrossRef]
  8. Cui, T.; He, H.; Cheng, S. Seismic performance research on precast wall-beam out-of-plane joint with ECC post-cast zone. Eng. Struct. 2022, 266, 114488. [Google Scholar] [CrossRef]
  9. Qasem, M.; Hasan, M.; Muhamad, R.; Mutafi, A. Non-linear 3D finite element analysis of precast reinforced concrete Beam-Column joint under monotonic static load. Mater. Today Proc. 2022, 65, 746–757. [Google Scholar] [CrossRef]
  10. Han, S.W.; Lee, C.S.; Shin, M.; Lee, K. Cyclic performance of precast coupling beams with bundled diagonal reinforcement. Eng. Struct. 2015, 93, 142–151. [Google Scholar] [CrossRef]
  11. Yang, K.; Seo, E.; Hong, S. Cyclic flexural tests of hybrid steel—Precast concrete beams with simple connection elements. Eng. Struct. 2016, 118, 344–356. [Google Scholar] [CrossRef]
  12. Liu, Y.; Ma, H.; Li, Z.; Wang, W. Seismic behaviour of full-scale prefabricated RC beam-CFST column joints connected by reinforcement coupling sleeves. Structures 2020, 28, 2760–2771. [Google Scholar] [CrossRef]
  13. Lu, Z.; Wu, B.; Yang, S.; Hou, J.; Ji, Z.; Li, Y.; Huang, J.; Zhang, M. Experimental study on flexural behaviour of prefabricated concrete beams with double-grouted sleeves. Eng. Struct. 2021, 248, 113237. [Google Scholar] [CrossRef]
  14. Ma, J.; Zhu, J.; Bai, G.; Zheng, W. Experimental study on anchorage performance of steel bar-corrugated pipe grouted connection. Structures 2021, 34, 1834–1842. [Google Scholar] [CrossRef]
  15. Temsah, Y.; Jahami, A.; Khatib, J.; Sonebi, M. Numerical analysis of a reinforced concrete beam under blast loading. MATEC Web Conf. 2018, 149, 02063. [Google Scholar] [CrossRef]
  16. Tran, D.T.; Pham, T.M.; Hao, H.; Do, T.V.; Tran, T.T. Blast behaviour of precast segmental vs monolithic concrete beams prestressed with unbonded tendons: A numerical investigation. Int. J. Impact Eng. 2022, 104434. [Google Scholar] [CrossRef]
  17. Yang, C.; Jia, X.; Huang, Z.; Zhao, L.; Shang, W. Damage of full-scale reinforced concrete beams under contact explosion. Int. J. Impact Eng. 2022, 163, 104180. [Google Scholar] [CrossRef]
  18. Li, H.; Chen, W.; Pham, T.M.; Hao, H. Analytical and numerical studies on impact force profile of RC beam under drop weight impact. Int. J. Impact Eng. 2021, 147, 103743. [Google Scholar] [CrossRef]
  19. Jin, L.; Lan, Y.; Zhang, R.; Du, X. Numerical analysis of the mechanical behavior of the impact-damaged RC beams strengthened with CFRP. Compos. Struct. 2021, 274, 114353. [Google Scholar] [CrossRef]
  20. Zhang, J.; Tong, C.; Feng, L.; Du, W.; Wu, F. Evaluation and degradation mechanism of residual performance of RC beam after drop hammer impact. Int. J. Impact Eng. 2022, 169, 104335. [Google Scholar] [CrossRef]
  21. Zhang, C.; Gholipour, G.; Mousavi, A.A. Nonlinear dynamic behavior of simply-supported RC beams subjected to combined impact-blast loading. Eng. Struct. 2019, 181, 124–142. [Google Scholar] [CrossRef]
  22. Yu, Y.J.; Kim, C.; Cho, J. Investigation of Behavior of RC Beams Subjected to Impact Loading Considering Combination of Mass and Impact Velocity. Procedia Eng. 2017, 210, 353–359. [Google Scholar] [CrossRef]
  23. Pham, T.M.; Hao, H. Plastic hinges and inertia forces in RC beams under impact loads. Int. J. Impact Eng. 2017, 103, 1–11. [Google Scholar] [CrossRef] [Green Version]
  24. Pham, T.M.; Hao, Y.; Hao, H. Sensitivity of impact behaviour of RC beams to contact stiffness. Int. J. Impact Eng. 2018, 112, 155–164. [Google Scholar] [CrossRef]
  25. Kazemi, M.; Li, J.; Lahouti Harehdasht, S.; Yousefieh, N.; Jahandari, S.; Saberian, M. Non-linear behaviour of concrete beams reinforced with GFRP and CFRP bars grouted in sleeves. Structures 2020, 23, 87–102. [Google Scholar] [CrossRef]
  26. Li, H.; Chen, W.; Hao, H. Dynamic response of precast concrete beam with wet connection subjected to impact loads. Eng. Struct. 2019, 191, 247–263. [Google Scholar] [CrossRef]
  27. Yan, Q.; Chen, T.; Xie, Z. Seismic experimental study on a precast concrete beam-column connection with grout sleeves. Eng. Struct. 2018, 155, 330–344. [Google Scholar] [CrossRef]
  28. Zhao, W.; Feng, H.; Ye, J.; Qian, J. Performance of precast concrete bridge piers with grouted sleeve connections against vehicle impact. Structures 2022, 44, 1874–1885. [Google Scholar] [CrossRef]
  29. GB 50017-2017; Standard for Design of Steel Structures. China Architecture & Building Press: Beijing, China, 2017. (In Chinese)
  30. GB 50010-2010; Code for Design of Concrete Structures. China Architecture & Building Press: Beijing, China, 2015. (In Chinese)
  31. Arachchige, B.; Ghasemnejad, H. Post impact analysis of damaged variable-stiffness curved composite plates. Compos. Struct. 2017, 166, 12–21. [Google Scholar] [CrossRef] [Green Version]
  32. Karthick, P.; Ramajeyathilagam, K. Numerical study on ballistic impact behavior of hybrid composites. Mater. Today Proc. 2022, 59, 995–1003. [Google Scholar] [CrossRef]
  33. Wang, D.Z.; Zhi, X.D.; Fan, F.; Lin, L. The energy-based failure mechanism of reticulated domes subjected to impact. Thin-Walled Struct. 2017, 119, 356–370. [Google Scholar] [CrossRef]
  34. Livermore Software Technology Corporation. LS-DYNA Keyword User’s Manual Vol. 2; Livermore Software Technology Corporation: Livermore, CA, USA, 2018. [Google Scholar]
  35. Hong, Z.; Tao, M.; Cui, X.; Wu, C.; Zhao, M. Experimental and numerical studies of the blast-induced overbreak and underbreak in underground roadways. Undergr. Space 2022, 8, 61–79. [Google Scholar] [CrossRef]
  36. Fang, C.; Rasmussen, J.D.; Bielenberg, R.W.; Lechtenberg, K.A.; Faller, R.K.; Linzell, D.G. Experimental and numerical investigation on deflection and behavior of portable construction barrier subjected to vehicle impacts. Eng. Struct. 2021, 235, 112071. [Google Scholar] [CrossRef]
  37. Yang, G.; Wang, G.; Fan, Y.; Deng, K.; Lu, W.; Zhao, J. Dynamic response and performance of submarine tunnel subjected to surface explosions. Mar. Struct. 2021, 80, 103091. [Google Scholar] [CrossRef]
  38. Chen, C.; Zhang, X.; Hao, H.; Cui, J. Discussion on the suitability of dynamic constitutive models for prediction of geopolymer concrete structural responses under blast and impact loading. Int. J. Impact Eng. 2022, 160, 104064. [Google Scholar] [CrossRef]
  39. Zhang, K.; Lu, F.; Peng, Y.; Li, X. Study on dynamic response of gravity dam under air blast load based on similarity law. Eng. Fail. Anal. 2022, 138, 106225. [Google Scholar] [CrossRef]
  40. Fan, L.; Jin, L.; Du, X. Influence of medium-low strain rate on the axial failure of CFRP-confined concrete columns: Meso-scale modellings. Constr. Build. Mater. 2022, 348, 128666. [Google Scholar] [CrossRef]
  41. Grote, D.L.; Park, S.W.; Zhou, M. Dynamic behavior of concrete at high strain rates and pressures: I. Experimental characterization. Int. J. Impact Eng. 2001, 25, 869–886. [Google Scholar] [CrossRef]
  42. Chen, L.; Yue, C.; Zhou, Y.; Zhang, J.; Jiang, X.; Fang, Q. Experimental and mesoscopic study of dynamic tensile properties of concrete using direct-tension technique. Int. J. Impact Eng. 2021, 155, 103895. [Google Scholar] [CrossRef]
  43. Chung, C.; Lee, J.; Jung, R. Numerical simulations of missile impacts on reinforced concrete plates: IRIS-2010/2012 benchmark project. Nucl. Eng. Des. 2015, 295, 747–758. [Google Scholar] [CrossRef]
  44. Chung, C.; Choi, K.; Choi, H.S.; Lee, J. Local impact resistance analysis of prestressed concrete structures considering curvature and post-tensioning effects. Ann. Nucl. Energy 2020, 142, 107415. [Google Scholar] [CrossRef]
  45. Chen, T.L.; Wu, H.; Fang, Q. Dynamic behaviors of double-column RC bridge subjected to barge impact. Ocean Eng. 2022, 264, 112444. [Google Scholar] [CrossRef]
  46. Wu, M.; Jin, L.; Du, X. Numerical investigation of precast RC beam with unbonded prestressing tendon under impact loads. Struct. Infrastruct. Eng. 2021; ahead-of-print. [Google Scholar] [CrossRef]
  47. Li, H.; Chen, W.; Huang, Z.; Hao, H.; Ngo, T.T.; Pham, T.M.; Yeoh, K.J. Dynamic response of monolithic and precast concrete joint with wet connections under impact loads. Eng. Struct. 2022, 250, 113434. [Google Scholar] [CrossRef]
  48. Youssf, O.; ElGawady, M.A.; Mills, J.E. Displacement and plastic hinge length of FRP-confined circular reinforced concrete columns. Eng. Struct. 2015, 101, 465–476. [Google Scholar] [CrossRef]
  49. Guo, Y.; Yin, X.; Yu, B.; Hao, Q.; Xiao, X.; Jiang, L.; Wang, H.; Chen, C.; Xie, W.; Ding, H.; et al. Experimental analysis of dynamic behavior of elastic visco-plastic beam under repeated mass impacts. Int. J. Impact Eng. 2023, 171, 104371. [Google Scholar] [CrossRef]
  50. Wang, H.; Liu, X.; Yue, Q.; Zheng, M. Shear resistance of a novel wet connection for prefabricated composite beams under shear-bending coupling loading. J. Build. Eng. 2022, 45, 103636. [Google Scholar] [CrossRef]
  51. Gulec, A.; Kose, M.M.; Gogus, M.T. An analysis of the usability of prefabricated cage-reinforced composite beams with self-compacting and lightweight concrete under flexural loads. Constr. Build. Mater. 2020, 255, 119274. [Google Scholar] [CrossRef]
Figure 1. Dimension and configuration of PC beam (unit: mm).
Buildings 12 02146 g001
Figure 2. Test setup.
Buildings 12 02146 g002
Figure 3. Finite element model.
Buildings 12 02146 g003
Figure 4. Stress–strain relationship of C30 concrete at different strain rates.
Buildings 12 02146 g004
Figure 5. Numerical simulation results of different mesh sizes.
Buildings 12 02146 g005
Figure 6. Comparison of experimental and numerical simulation results.
Buildings 12 02146 g006
Figure 7. Arrangement of impact position.
Buildings 12 02146 g007
Figure 8. Comparison of the results of different impact positions.
Buildings 12 02146 g008aBuildings 12 02146 g008b
Figure 9. Comparison of the results of different concrete strength.
Buildings 12 02146 g009
Figure 10. Schematic diagram of stirrup encryption in cast-in-place area.
Buildings 12 02146 g010
Figure 11. Comparison of the results of different stirrup reinforcement ratio.
Buildings 12 02146 g011aBuildings 12 02146 g011b
Figure 12. Elastic single-degree-of-freedom simplified model.
Buildings 12 02146 g012
Figure 13. Plasticity single-degree-of-freedom simplified model.
Buildings 12 02146 g013
Figure 14. Simplified model of impact force.
Buildings 12 02146 g014
Figure 15. Simplified model of simply supported beam resistance.
Buildings 12 02146 g015
Figure 16. The solution flow chart.
Buildings 12 02146 g016
Figure 17. Comparison between theoretical calculation and test of peak vertical displacement.
Buildings 12 02146 g017
Table 1. The RHT constitutive model parameter of concrete.
ParametersValueParametersValueParametersValue
ρ 0 2300 kg/m3A23.958 × 1010 Pa Q 0 0.6805
p e l a 2.33 × 10⁷/b 9.33 × 10⁷ PaA39.04 × 109 PaB0.0105
p c o m p 6 × 10⁸ PaB01.22 β c a 0.032/b 0.011
N3.0B11.22 β t a 0.036/b 0.015
α 0 1.1884T13.527 × 1010 Pa ε ˙ 0 c 3.0 × 10⁻⁵ s−1
A13.527 × 1010 PaT20 PaD10.04
fc3.5 × 107 Pa ε ˙ 0 t 3.0 × 10⁻⁶ s−1D21
f t * a 0.1/b 0.157 ε ˙ c 3.0 × 10²² ε p m a 0.01/b 0.017
f s * 0.18 ε ˙ t 3.0 × 10²²Af1.6
G1.67 × 1010 Pa g c * 0.53Nf0.61
A1.6 g t * 0.7
n0.61 ξ 0.5
a Parameters of C30. b Parameters of C40.
Table 2. Parameters of MAT_003.
MaterialMaterial ModelParameterValue
Steel reinforcement, Steel impactorMAT_PLASTIC_KINEMATICDensity7800 kg/m3
Young’s modulus209 GPa
Poisson ratio0.3
Yield stress450 MPa
Tangent modulus2.09 GPa
Hardening parameter40
Strain rate parameter5
Table 3. PC beam parameter analysis working conditions.
No.Impact Location/mmConcrete Strength/MPaStirrup Reinforcement Ratio/%
PC10300.19
PC2475300.19
PC3725300.19
PC4975300.19
PC50400.19
PC60500.19
PC70300.28
PC80300.57
Table 4. Comparison of test and theoretical calculation of peak vertical displacement.
No.Test/mmCalculation/mm(Calculation/Test) − 1
B4a21.0026.727%
B4b29.8438.8229%
B4c76.4579.764.3%
B4d117.65188.961%
Publisher’s Note: MDPI stays neutral with regard to jurisdictional claims in published maps and institutional affiliations.

