1. Introduction
Over the years, Earth’s sudden movements due to earthquakes and their subsequent seismic hazards have impacted vulnerable areas, destroying them socially and economically, and often leaving a high death toll [
1,
2,
3,
4]. There are plenty of examples in the Pacific Rim or the Latin American area, such as the earthquake in Haiti (2010), which caused 316,000 fatalities, and the earthquake and subsequent tsunami in Chile (2010) with 525 dead. More examples include the earthquake and tsunami in Japan (2011), with 15,405 dead and 8405 missing, and the earthquake in Ecuador (2016) that registered 663 people dead [
5,
6,
7,
8,
9,
10,
11,
12]. The consequences of these and other significant events have made it possible to identify the transcendental role played by the structural design of buildings when safeguarding the integrity of their occupants [
13,
14,
15,
16,
17]. Thus, losses due to earthquakes and seismic hazards have made it necessary to become aware of the potential damage that structures may suffer due to these events. As a response, international organizations have been created whose main objective is to minimize the social and economic impact caused by the occurrence of this type of geological phenomenon [
18,
19,
20].
Based on the aforementioned, several countries located on active continental margins where there is a high frequency of severe earthquakes, such as Italy, Japan, Chile, and the USA, have generated several advances in construction codes in buildings with certain conditions for resisting high-magnitude seismic movements [
21,
22,
23,
24,
25]. In this sense, the Federal Emergency Management Agency (FEMA) has a fundamental role in disaster-related issues since it is in charge of developing risk control and management tools to guarantee the proper functioning of structures within the United States [
26,
27,
28,
29]. FEMA and other government agencies of different countries see schools as a primary point of attention for preventing risks in the face of hazards. Indeed, schools are teaching and learning environments where children and young people, followed by teachers and administrative and service personnel, among others, spend most of their time. In this way, the physical and structural elements that make up the facilities, and the administrative and pedagogical processes, must be able to offer a safe environment to those who embrace the educational community. The educational community includes the Ministry of Education, the neighboring families of the school building, and, in general, the community where the school is located, to which the students may or may not belong. Indeed, the mayor, the local level’s educational authorities, and other community actors and sectors are also included.
However, several recorded seismic events have affected and destroyed educational buildings. For example, on 7 December 1988, an earthquake of magnitude 6.9 on the Richter scale and at a depth of 6 km shook Spitak (Armenia); likewise, on 17 October 1989, an earthquake of a similar magnitude, a 7.1 on the Richter scale, with a depth of 15 km agitated Loma Prieta (USA) [
30,
31,
32,
33,
34]. As a standard feature, highly populated urban areas with housing, schools, colleges, and other critical infrastructure were hit. Unfortunately, in Spitak, the buildings within the affected area were built with poor consideration of the effects of an earthquake; therefore, half a million buildings were destroyed, including more than 900 schools, and about 25,000 people died in the destruction, where an estimated 6000 of the deaths were school-age children [
35]. In contrast to the Spitak earthquake, the Loma Prieta earthquake caused 63 deaths; even though it occurred after school hours, only three schools suffered structural damage, but no school building collapsed. Fortunately for the affected area, the “Field Law” that was enacted in response to the Long Beach earthquake (1933), which destroyed hundreds of educational centers, ensured the construction of school buildings that could withstand the 1989 earthquake [
36,
37,
38]. In this context, it is observed that implementing strict building codes and mitigation measures in the law and practices of California saved many lives. In this state, the earthquake resistance standards are more rigorous in their regulations compared to other states in the country, which still puts schools in other high seismic hazard sites at risk. See
Table 1 for further details [
39,
40,
41,
42,
43,
44,
45,
46,
47,
48,
49,
50,
51,
52].
In Mexico, after the two strong earthquakes that shook Chiapas and Puebla on 7 and 19 September 2017, respectively, many schools’ structures were irreparably damaged, whereas others collapsed. In this region, about seven million children lived in the areas affected by the earthquakes [
53]. After the disaster and in a recovery environment, UNICEF worked to establish temporary teaching centers, promote safety guidelines for schools, train teachers and administrators in psychosocial support, distribute educational material, and develop kits for children, representing an investment of 3.5 million dollars [
54].
In Italy, after the tragic collapse of the school at San Giuliano in the October 2002 earthquake and the many damaged schools during the L’Aquila earthquake in April 2009, [
55] a procedure was developed for the seismic risk analyses of several school buildings. Most of them were designed and constructed ignoring seismic regulations, potentially resulting in a high seismic risk. In the same context, to reduce earthquake impacts on Italian school buildings constructed between 1950 and 1975, [
56] typological vulnerabilities were identified that could affect their seismic performance.
Ecuador, a country prone to seismic activity, needs tools that evaluate the vulnerability of both public and private institutions. In terms of earthquake resistance, establishments with a large influx of people such as hospitals, shopping centers, colleges, and schools must have a low level of vulnerability to unavoidable telluric events [
57,
58,
59,
60,
61,
62,
63]. Thus, it has been decided to develop and subsequently apply the most appropriate guide to assess the degree of seismic risk for schools as a pioneering approach. This tool would allow diagnosing the problems of the structures that make up the institutions, identifying the most common issues in design, construction, and operation.
The proposed methodology was mainly based on the FEMA P-1000 guide [
64], considering its practical and economical procedures for school operations and the protection of school facilities before, during, and after an event; in this specific case, an earthquake. In general, it includes the seismogenic characteristics of nearby faults, the structural and nonstructural vulnerability levels, and the response capacity, amongst others, to establish a global risk level. Its effectiveness was probed for twelve schools in Sangolquí, a city within the Interandean Depression in central Ecuador. The results demonstrated the tool’s convenience and that most schools exhibit a moderate global seismic risk level, which should be subjected to advanced vulnerability studies to prioritize improvement measures.
Unfortunately, the seismic hazards and their consequences in Ecuador are still underestimated because of the lack of financial resources and support. Therefore, the study presented in this paper constitutes a convenient instrument for evaluating seismic risk to implement prevention, mitigation, and adaptation actions by global and local stakeholders in this country and will certainly serve other places with similar geodynamic conditions.
2. Geodynamic Setting and Seismic Vulnerability of Ecuador
Ecuador is situated within the Pacific Ring of Fire; therefore, it is a country with a high seismic risk [
65,
66,
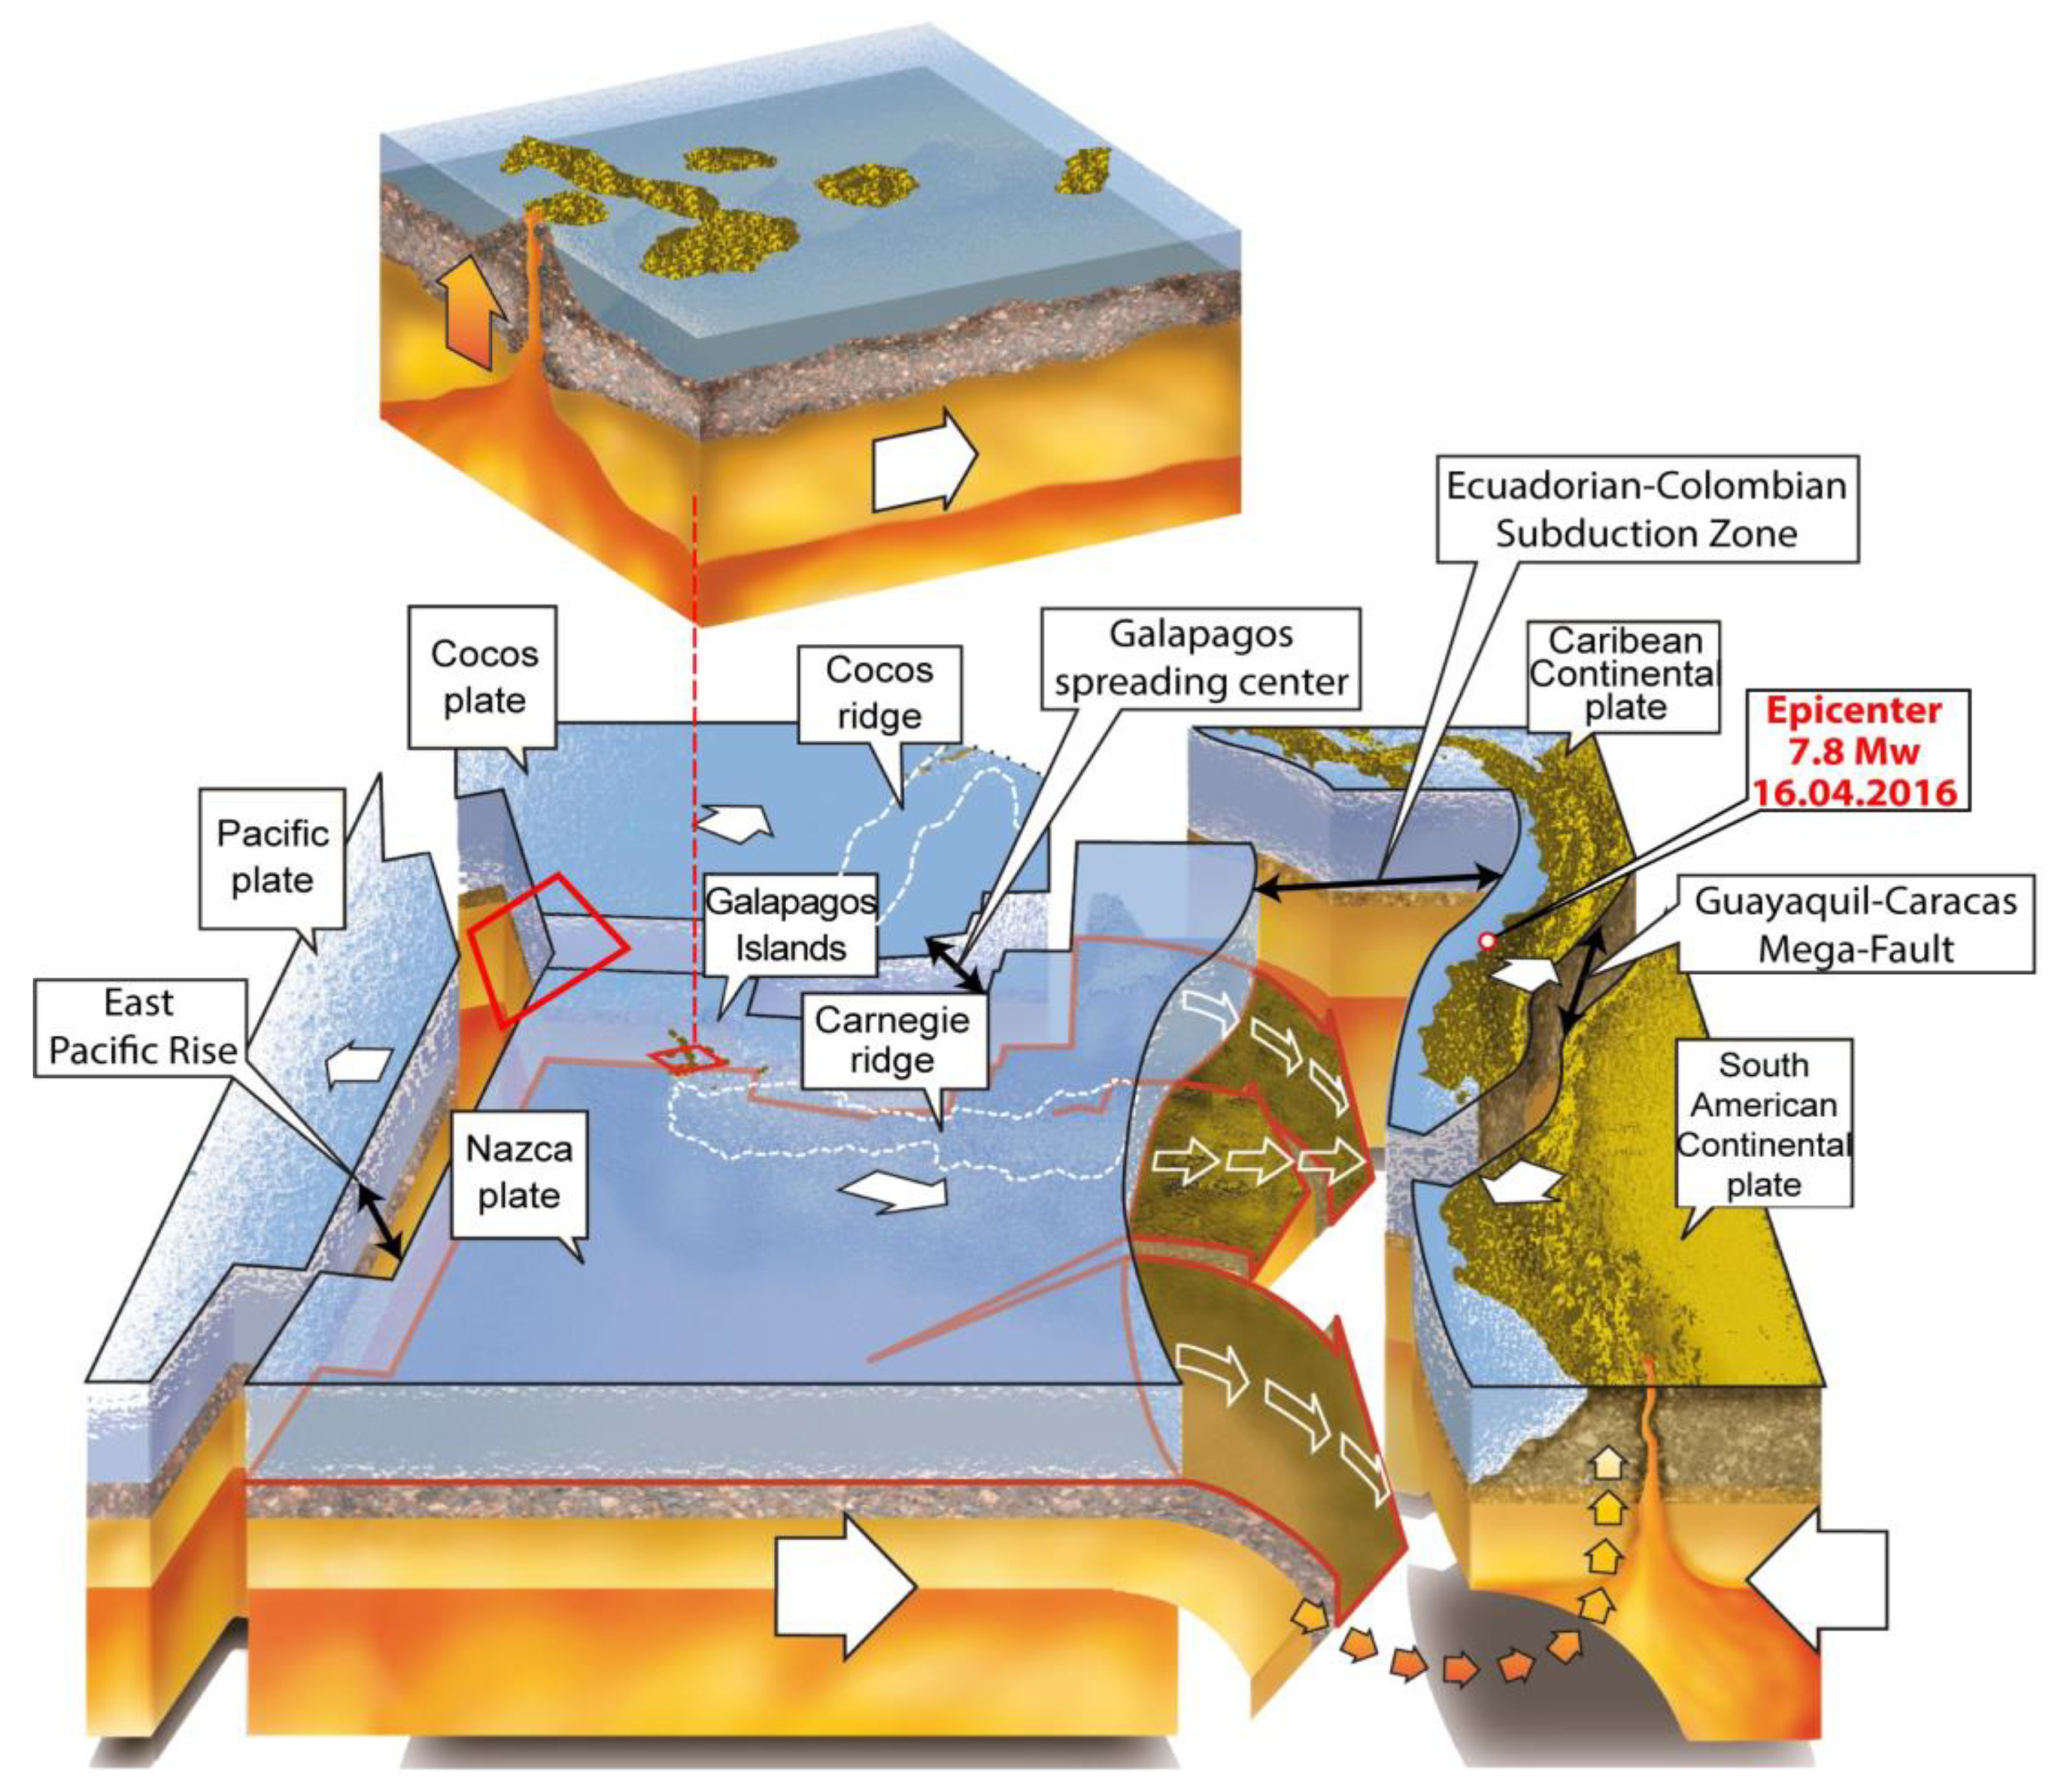
67]. The prominent phenomenon occurs in the subduction zone of the easternmost area of the Pacific Ocean, caused by the oceanic Nazca Plate subducting below the South American and Caribbean continental plates (
Figure 1). Additionally, the Guayaquil-Caracas megafault or shear crosses the country, dividing the mentioned continental plates [
68,
69,
70,
71,
72,
73,
74]. Therefore, most Ecuadorian territory has a high seismic hazard, except for the northeast region which has an intermediate level, whereas the coastal region has a very high seismic hazard [
75,
76,
77]. Thus, based on historical events, there are plenty of documented severe catastrophes, such as the 1797 earthquake in Riobamba, 1859 in Quito, 1868 in Ibarra, 1906 in Esmeraldas, 1942 in Manabí, 1949 in Pelileo-Ambato, and the most recent in 2016 in Pedernales [
78,
79,
80,
81,
82,
83,
84]. On 16 April 2016, at 18:58:36 (ECT), an Mw 7.8 magnitude earthquake hit the Ecuadorian coast, causing damage in the provinces of Esmeraldas and Manabí, including the towns and cities of Muisne, Pedernales, Canoa, Bahía de Caráquez, Portoviejo, and Manta [
85]. The maximum PGA recorded in Pedernales was 1.4 g [
86]. Several buildings collapsed hundreds of kilometers from the epicenter. In the earthquake, 6274 people were injured, 12 remained missing, 113 were rescued, and 28,775 were taken to shelters [
87].
There were collapsed school buildings or a high degree of deterioration, in which three common characteristics were predominant [
88]. These included existing design deficiencies and the lack of professional control during construction processes, as well as poor reinforcement detailing that prevent possible structural damage in the event of severe earthquakes (
Figure 2). As a result, 23% of the 1866 schools and colleges suffered minor (16%), medium (3%), and severe damage (4%).
Ultimately, some of the schools’ structures on the coast were affected, mainly due to poor construction practices and implementation on unsuitable land. The schools that have been most affected were those whose construction was configured according to the school models used more than two decades ago [
89]. Therefore, the need to conduct a vulnerability assessment is evident, especially for establishments with more years of operation.
In 2016, the Ministry of Education of Ecuador set a benchmark for regional risk management, issuing the “Comprehensive School Safety Policy”, which was adopted as a tool for the prevention and preparation for emergencies, and the first comprehensive system of school risk management, designed exclusively for educational centers. Book 2.1 and Book 2.2 of this school safety policy finally recommend a specific study of the areas in which the schools are located, since having a more specific analysis of the sector allows the management of prevention and mitigation processes [
90].
3. Study Area and Regional Seismic Hazard
Sangolquí, on the southeast side of Quito, is the capital of the Rumiñahui Canton with an area of 135.7 km
2. The canton is located in the Valley of Los Chillos within the Interandean Depression, which resulted from a synsedimentary transpressive deformation [
89,
90]. The geology of Sangolquí describes lands primarily formed by deposits that are mainly composed of cangahuas, and pyroclastic flows, mudflows, colluvial and old lava flows of andesitic–basaltic composition as a result and influence of the Ilalo, Pasochoa, Rumiñahui, and Cotopaxi volcanoes, among others [
91,
92,
93,
94,
95,
96,
97,
98]. These are geological formations from the Quaternary period, with a depth of approximately 1000 m [
99].
The Interandean Depression or Valley of Ecuador is crossed by a set of active and inactive faults aligned to the Guayaquil-Caracas megashear system, which have been the cause of various aforementioned, devastating earthquakes. Among the regional and local geological faults that cross the Rumiñahui Canton and that have a direct influence are the Quito fault, which is divided into several segments, and which has a compression and a secondary transcurrent dextral component with a NS trend, and the Machachi dextral transcurrent fault [
99,
100,
101]. Although different segments of the Quito fault add up to a length of about 60 km with a rupture area of about 720 km
2, the Machachi fault extends 23 km with a rupture area of 276.78 km
2 [
99,
100,
101]. The Quito fault could trigger an event of Mw
RA 6.8 (magnitude of a seismic event due to fault rupture area) and Mw
SRL 7.1 (magnitude of a seismic event as a function of rupture length), with a recurrence period between 195 and 235 years [
100]. However, for this study, the southernmost segment called the Puengasí fault is exclusively considered, having a length of 22 km and a rupture area of 259 km
2, which could generate an event of Mw
RA 6.4 and Mw
SRL 6.4 with a recurrence period of 188 years. The Machachi fault could reach magnitudes in Mw
RA events of 6.4 and Mw
SRL of 6.4, with a recurrence period of 538 years [
101].
Sangolquí and, in general, the Valley of Los Chillos is susceptible to strong earthquakes due to the previously mentioned geological faults which were reactivated, as recorded in several historical documents since 1541 and with instruments since the last century [
102,
103]. These events include the earthquakes of 1541 (magnitude 7.5 and an intensity of IX on the MSK scale), 1587 (6.4 and VIII), 1755 (IX), 1859 (IX), 1914 (VI), 1923 (6.5 to 7 and V–VII), 1929 (5.9 and VII), and 1938 (5.8 and VII) [
104,
105,
106]. Thus, the Chillos Valley is affected by a strong influence of surface earthquakes, which, combined with a structural vulnerability, can be very dangerous for the population and its community.
The parish of Sangolquí has a value of the factor (Z), which is the maximum acceleration in rock expected for the design earthquake, which is expressed as a fraction of the acceleration of gravity [
75]. The value Z = 0.4 corresponds to zone V (of possible VI), with a high seismic hazard [
75].
FEMA P-154 [
107,
108,
109] determines five levels of seismic regions based on the spectral acceleration response from the risk-targeted maximum considered earthquake (MCE
R) (ASCE 7-16 [
110]). Through FEMA P-154 [
107,
108,
109], it has been identified that the Sangolquí parish, according to the type of soil and the presence of the Machachi and Quito faults (Puengasí segment), presents two seismic regions, which are either high (for type C soils; Vs30 < 760 m/s, but Vs30 ≥ 360 m/s) and very high (for type D soils; Vs30 < 360 m/s, but Vs30 ≥ 180 m/s) [
101].
There are many schools within Sangolquí, which are important places for community development not only because they are the second home of future leaders, but also because schools could become multifunctional places, as has been explained previously. Therefore, this type of structure must meet specific characteristics in its design and construction, and the management must be conducted by its authorities to prevent risks (especially seismic). Therefore, to comply with the term seismic resistant, a building would need a low vulnerability to a seismic event. Within the parish of Sangolquí, there are 18 schools, 10 colleges, 16 academic units, and 17 education centers (basic or infant) [
106].
4. Methodology
4.1. General Assumptions
This current study seeks to lay the foundations to evaluate the infrastructure of the buildings that make up these education centers. All cities within the country, due to the nonhomogeneous geodynamics of the regions, the exponential population growth, and the expansion of the border, must meet the fundamental principle of “adequate construction” by considering three critical parameters. These are the foundation, the most optimal materials used on site, and the environment in which the activities are carried out, evaluating the vulnerability to seismic hazards and the environmental impact. Vulnerability over the years has been disseminated with various approaches that allude to the security of people, highlighting the fragility of the social order. Therefore, for sustainable development and intelligent land use, planning that respects and prevents the influence of natural hazards is essential.
According to FEMA P-1000 [
64], the infrastructure of the schools fulfills critical functions within the communities. For example, they sometimes serve as designated shelters for displaced families after a natural or man-made disaster. However, even when not designated as a shelter, school policy states that children must be protected within the schools until parents can pick them up. If the school is not officially designated as a key post-emergency site, school policies have made it one [
64].
The methodology and tools to develop appropriate risk management are based on an adequate vulnerability study for natural hazards. The different guides and national and international manuals that address these issues were studied for this case. The primary reference for this study is from FEMA, of the United States, which addresses various essential issues from risk management to regulations and guidelines for the construction of safe and resistant buildings to any hazard [
64].
FEMA has conducted a successful study regarding the risk management of natural hazards in schools and has presented it in a guide called, “Safer, Stronger, Smarter-A Guide to Improving School Natural Hazard Safety”, known as FEMA P-1000, which is a reference for the development of this current study. In addition, a tool is established to assess seismic vulnerability by applying, among others, the FEMA-P154 manual, “Rapid Visual Screening of Buildings for Potential Seismic Hazards” [
109].
Adequate risk management for schools would safeguard the lives of students, teachers, administrative staff, and services, among others, during an emergency through orderly planning within all phases of a given emergency operation plan as long as it involved the entire academic community. Therefore, the seismic hazard study of Sangolquí is presented. Based on these parameters, an emergency operation plan can be adequately developed, and the vulnerability assessment of the schools can be conducted according to the geological and geographical parameters in which they are located.
4.2. Safety Requirements in Performance-Based Design
Performance-based design (PBD) is a philosophy in which design criteria are expressed regarding a specific behavior expected for a given hazard level (Ghobarah, 2001). Before defining the design methodology, ASCE 7-16 [
110] classifies buildings according to the risk to human life, health, and well-being associated with damage due to their occupation, considering loads from floods, wind, snow, earthquakes, and ice supplies (hail). Each building or other structure would be assigned to the highest applicable risk category. For example, school buildings are in category III. This includes buildings and other structures which could be a substantial risk to human life in case of failure. In case of failure, buildings and other structures not included in category IV could cause a substantial economic impact and/or massive interruption to civil life. Buildings and other structures not included in category IV (including, but not limited to, facilities that manufacture, process, handle, store, use, or dispose of hazardous fuels, hazardous chemicals, hazardous waste, or explosives) contain toxic substances or explosives, where the quantity exceeds a threshold quantity established by the competent authority and sufficiently pose a threat to the public if released [
110].
ASCE 41-17 [
111] presents a set of objectives for the seismic rehabilitation of buildings, considering different levels of behavior for structural and nonstructural elements. Each structural performance level must meet the structural and nonstructural design level conditions. For example, category III buildings (where the schools are located) must meet the performance objective (4-D). The structures located in category III are in a range between life safety (S-3) and collapse prevention (S-5) (within the inelastic range). If the nonstructural components are damaged, they could create fall hazards. However, the high-risk components are insured to avoid falling in public gathering areas as they represent a risk to the safety of many people’s lives. The structures must behave correctly in the inelastic range for the maximum considered earthquake (MCE) with a probability exceedance of 2% in 50 years and a return period of 2500 years.
Although ASCE 41-17 indicates four risk categories for existing buildings according to their occupancy or use, NEC-15 identifies three categories and the respective factor of importance due to seismic action [
112]. Both norms are correlated by the designated categories and the importance factors. Special use structures must verify correct seismic performance in the inelastic range in the face of an extreme earthquake with a return period of 2500 years (collapse prevention level). In addition, special occupancy structures must develop a structural performance level of noncollapse (collapse prevention). This means that the design allows a certain degree of damage to structural systems, while considerable damage to nonstructural elements is expected, which is achieved with an adequate seismic response in the inelastic range.
4.3. Vulnerability Degree Assessment Procedure (V)
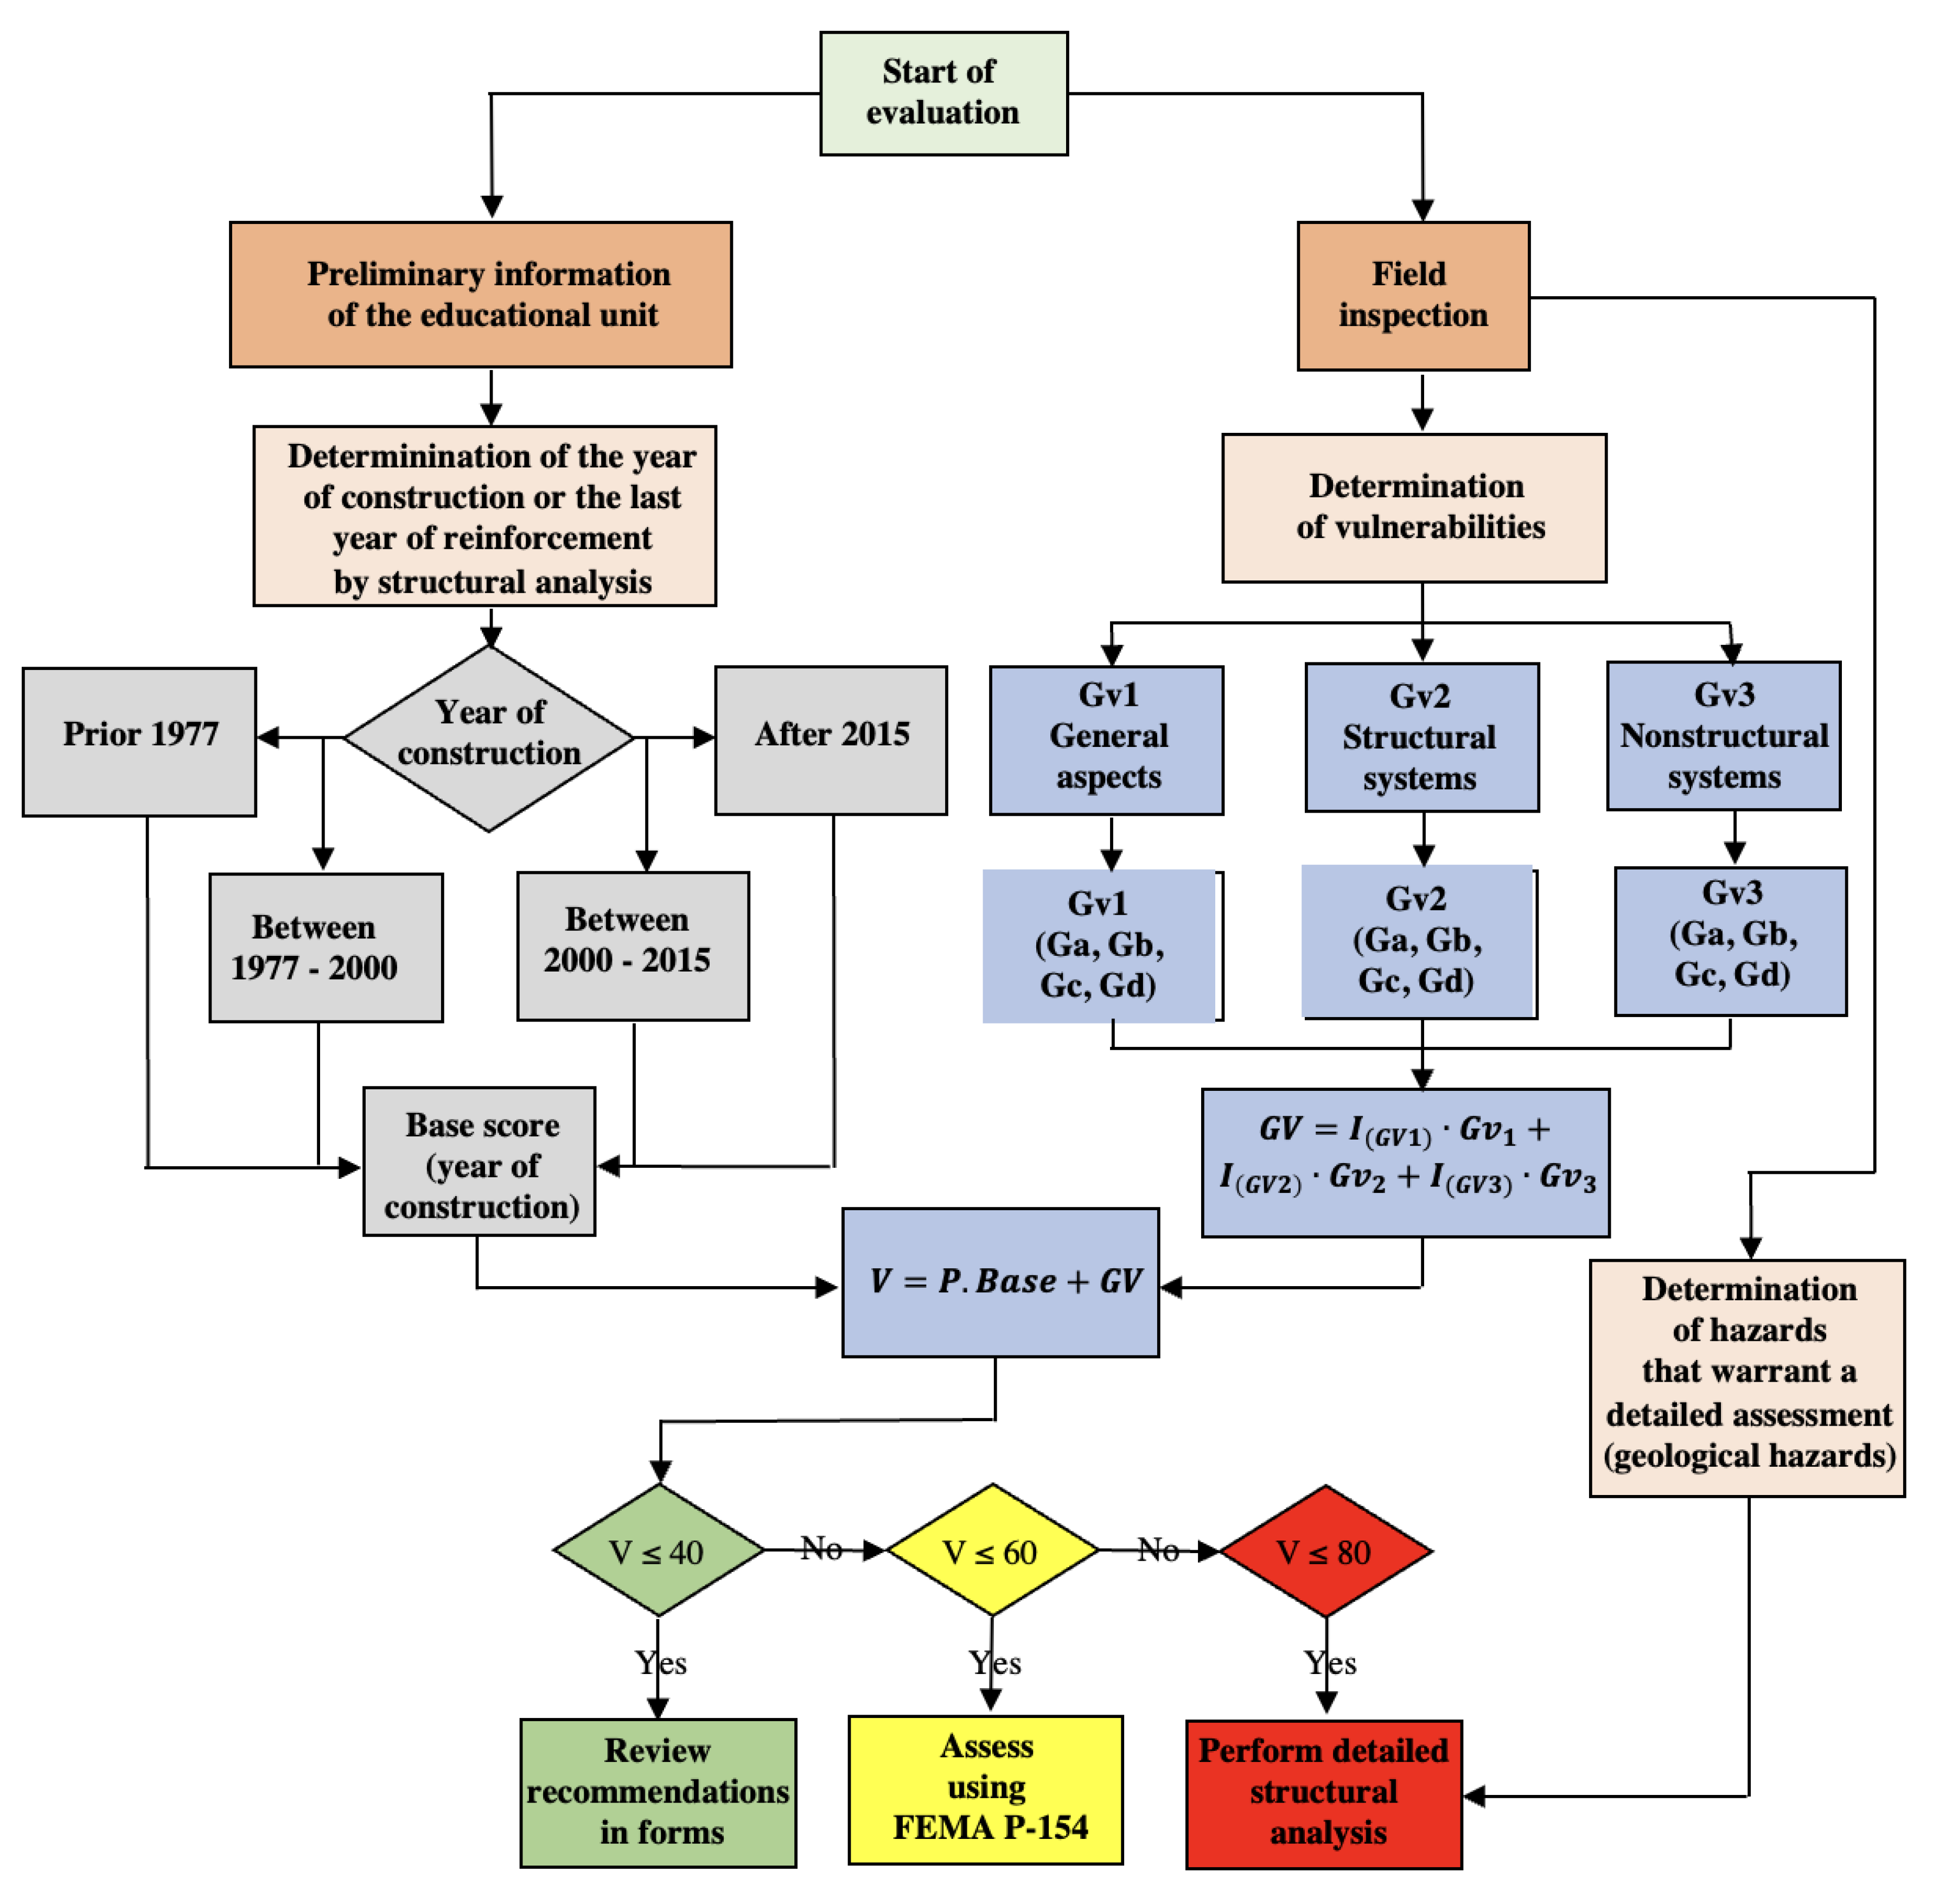
Based on the aforementioned, a Seismic Vulnerability Assessment Guide for Schools Located in the Sangolquí Parish was prepared with a vulnerability degree assessment procedure (V), as illustrated in the flowchart in
Figure 3. In addition, a form for data collection during a rapid building inspection was developed by FEMA P-154 [
108]. The collection instrument is aimed at most buildings, thus it serves as a starting point for the evaluation form developed in this project; its application uses a base score (P. Base) and three vulnerability groups (GV1-3) for quantification.
The P. Base refers to the year of construction, determining if the building meets the performance objectives established for a building category III (ASCE). GV1 deals with the general aspects of the schools, including the type of FEMA building, number of stories, presence of adjacent buildings, and soil type of the land it is built on. GV2 deals with structural vulnerability, which corresponds to the structural elements (columns, beams, and slabs), their geometry, layout, and configuration in plan and elevation, the visible presence of irregularities, and pathologies in structural and nonstructural elements such as walls. GV3 is about the vulnerability of nonstructural systems. With this, the state of conservation of the building and roofs is included, which is added to the contents of the school; for example, water storage tanks, partitions, ceilings, lamps, shelves, doors, and windows, among others. In order to evaluate a structure, variables or conditions are defined with four degrees representing the vulnerability that affects the structure. A numerical value has been assigned to quantify it, as indicated in
Table 2.
The scale for the measurement of vulnerability is established from 20 to 80 points, considering that a vulnerability score equal to 100 would mean that the school building is uninhabitable and would indicate that it is not fit for operation. On the other hand, the value 0 is equivalent to an invulnerable structure that does not correspond to any building in the country.
4.3.1. Base Score (P. Base)
An important factor in determining the vulnerability of schools focuses on the year in which the structure was built and whether it meets the performance objectives established by the American Society of Civil Engineers for the maximum considered earthquake (2% of exceedance in 50 years). These objectives prevent collapse, which allows extensive damage to structural elements (but they continue to function) and significant damage to nonstructural elements. Therefore, it was decided to use base scores depending on the building’s year of construction. In this way, the intended vulnerability ranges for the structures are defined.
Most of the school buildings in Sangolquí are relatively old, thus it is presumed that they were not designed with adequate regulations. It is even known that more than 40 years ago, there was not even an entity that regularized these constructions. To the best of our knowledge, one of the first regulations that contemplates the design of buildings in Ecuador is the CEC 77 (Ecuadorian Construction Code of the year 1977), followed by the CEC 2000 (Ecuadorian Construction Code of the year 2000), and finally, the NEC-15 (Ecuadorian Construction Standard of the year 2015).
4.3.2. Before the First Construction Code (Pre-Code)
For the years before 1977, when the first regulations appeared in Ecuador, most structures did not have an earthquake-resistant design, and there was not even adequate quality control. These facts translate into informal constructions for the older schools and colleges. Therefore, constructions before 1977 are considered to have poor structural performance.
4.3.3. First Ecuadorian Construction Code (CEC 77) (Transition Period)
In 1977, under official registration No. 369, the first two parts of the Ecuadorian Construction Code were made official to improve the safety and quality of construction, as well as to protect human lives, which were elaborated by the Ecuadorian Institute for Standardization (INEN). For preparing this regulation, a reference was made to the ACI 318-71 code (American Concrete Institute), adapting it to the situations in Ecuador. However, this code only dealt with houses with up to three floors, and it does not consider prestressed or prefabricated elements [
113].
Between 1977 and 1990, despite having the CEC 77, a control by construction professionals was still not implemented, and an earthquake-resistant design was not even required. As a result, it was not until 1998, the date of the Bahía de Caráquez earthquake, that the poor performance of the structures built with CEC 77 was evidenced. Given this situation, there was a need to continue investigating to obtain safer buildings in Ecuador in the face of these effects.
4.3.4. Ecuadorian Construction Code 2000 (CEC 2000) (Post-Code)
In 2001, the first document of the CEC 2000 was made official, which contains the chapter on seismic hazards, design spectra, and minimum calculation requirements for earthquake-resistant design, registering the last update in 2002 [
113]. The main objective of this regulation was the design of basic specifications for structures subject to seismic effects, which could occur at some point in their useful life [
114]. The design philosophy of the CEC 2000 served to establish some main objectives for certain types of ground motions. In this regard, mild and frequent earthquakes should prevent structural and nonstructural element damage. Moderate and infrequent earthquakes should prevent serious structural damage and control nonstructural damage. Severe and rarely occurring earthquakes should not cause the collapse of the structure, in an attempt to safeguard people’s lives [
113,
114]. The CEC 2000 sought to improve the quality of the structures after the damage caused by the 1998 earthquake. However, with seismic events in the last two decades, improvements were demanded in the earthquake-resistant design standards worldwide. Therefore, in 2010, the Ecuadorian government decided to update and improve construction regulations with a group of professionals, national and foreign consultants, and professors from different universities.
4.3.5. Ecuadorian Construction Standard 2015 (NEC-15) (Modern Code)
On 6 April 2011, through Executive Decree No. 705, published in the Official Gazette No. 421, the Executive Committee of the NEC was formed. This committee was tasked with issuing the Ecuadorian Construction Standard, which should contemplate the minimum requirements of design, construction, and control in the execution of works, in addition to promoting an improvement in the quality of buildings, with the main aim of protecting people’s lives. On 19 August 2014, through Ministerial Agreement No. 0028 of the Ministry of Urban Development and Housing (MIDUVI), the first six chapters of NEC-15 were approved. On 10 January 2015, the MIDUVI, through Ministerial Agreement number 0047, approved the remaining four chapters of the current standard [
112]. The chapters included nonseismic loads, seismic loads, and earthquake-resistant design, the seismic rehabilitation of structures, geotechnics and foundation design, reinforced concrete structures, and glass, steel, and wood structures.
According to the MIDUVI and CAMICON [
73], the design philosophy allows us to check for the life safety objective. The structural design is developed for the design basis earthquake, which considers a 10% probability of exceedance in 50 years, equivalent to a return period of 475 years. The MIDUVI and CAMICON [
75] indicate in the NEC-15 the performance objectives for special use buildings that comply with the ASCE provisions. Finally, for the base score, the expected performance of the standard valid at the time of construction is considered. With the base scores added to the score modifiers, the ranges of vulnerabilities expected by the year of construction are obtained (
Table 3).
4.3.6. Score Modifiers (GV)
A vulnerability sheet was used to obtain the value of the score modifiers through collected information about the current conditions of the building. It was necessary to review the vulnerability conditions by assigning a score through the mechanism listed in
Table 4. In this way, the vulnerability value is calculated for each “Vulnerability Group” (GV) [
108].
The final
GV score is based on the value of each vulnerability group, with the conditions of the following equation influencing the final vulnerability score to a different extent:
GV1 and GV2 categories are the most important (
Table 5); therefore, these have been assigned a greater influence on vulnerability depending on the base score, as follows:
4.4. General Aspects of the Schools (GV1 and GV2)
4.4.1. Number of Stories
The number of traditional stories for schools in Ecuador ranges from one to four. Given the design characteristics of the schools in Sangolquí, and considering the year of construction, it has been identified that taller buildings could register a higher degree of vulnerability. For this reason, the number of stories and the year of construction are linked together. It is logical to think that if earthquake-resistant design standards had not been implemented, the tallest structures would be the most vulnerable. The structures raised from the post-code (CEC 2000), and to a greater extent, those built with the modern code (NEC 15), would exhibit the lowest vulnerability conditions, especially buildings that contain up to a maximum of four stories, since these regulations have already implemented an earthquake-resistant design. Constructions erected during the transition period (1977–2000) are considered buildings with poor structural performance, which is why they have been categorized as highly vulnerable (up to a maximum of three floors). However, the evaluator would judge the predominant material in the structural system to mark this condition. If it does not meet any of the above conditions, it will be assigned the worst degree of vulnerability (
Table 6).
4.4.2. FEMA Building Type
The structural system of each building within the schools is evaluated according to the FEMA P-154 methodology. Each typology responds to a vulnerability associated with established basic scores [
108,
109], which have been calculated considering the probability of collapse corresponding to the modified version of OSHPD HAZUS. The FEMA building condition is given by the degrees of vulnerability assigned to the buildings that obtain a basic score related to the range of values developed above, as listed in
Table 7. In context, the different types of buildings are coded as follows: W1—light wood frame, single- or multiple-family dwellings of one or more stories in height; S1—steel moment-resisting frame buildings; S2—braced steel frame buildings; S3—light metal buildings; S4—steel frame buildings with concrete shear walls; S5—steel frame buildings with unreinforced masonry infill walls; C1—concrete moment-resisting frame buildings; C2—concrete shear wall buildings; C3—concrete frame buildings with unreinforced masonry infill walls; PC—precast concrete structures; RM—reinforced masonry structures with flexible floor and roof diaphragms; and, URM—unreinforced masonry bearing wall buildings.
4.4.3. Tapping and Adjacency
Insufficient separations between adjacent buildings are associated with a possible degree of vulnerability due to high impact. At the same time, the potential fall of debris that would hinder, to a greater or lesser degree, the main means of egress from the building under analysis is associated with a high or low degree of vulnerability due to adjacency, respectively.
4.4.4. Soil Type
The typology established by the NEC-15 allows assigning the degree of vulnerability according to the soil-type profile on which the school’s building is based. On the one hand, buildings located on type A and B soil profiles are considered to have a minor vulnerability. On the other hand, buildings on type E and F soil profiles are the most vulnerable. On the other hand, buildings on type E (Vs30 < 180 m/s) and F (e.g., liquefiable soils, quick and highly sensitive clays, and collapsible, weakly cemented soils) soil profiles are the most vulnerable.
4.4.5. Degree of Vulnerability Associated with Other Parameters
- (a)
Length-Width Ratio
The excessive floor plan length in a building increases the probability of earthquake damage since not all building sections would respond to the same resistance and ductility demands. Therefore, NEC-15 recommends a length-width ratio of no more than four continuous lengths limited to 30 m. Compliance with these guidelines implies a low degree of vulnerability compared to contrary configurations.
- (b)
Irregularities in Plan and Elevation
The methodology established in the guide associates opposed configurations to regular shapes in plan and elevation with a high degree of vulnerability. In contrast, regular configurations are classified with a lower degree of vulnerability.
- (c)
Vertical-Horizontal Extensions
A building that does not exhibit extensions is classified with the lowest degree of vulnerability. Subsequently, a higher degree of vulnerability would be associated with small or moderate extensions with the same or different construction system.
- (d)
Pathologies in Structural Systems
Pathological deficiencies must be associated with the respective construction system, and the consequences of its exposure to external or internal agents. Those defects with less severe consequences are associated with a low degree of vulnerability. Pathologies that can compromise the stability of a building in the face of a seismic event are linked to higher degrees of vulnerability.
4.5. Vulnerability of Nonstructural Elements (GV3)
External nonstructural elements that may fall and hinder the mobility of students within the school must be considered. These can be parapets, tall tanks, light covers, and chimneys. The absence of these would result in a lower degree of vulnerability. In addition, the nonstructural elements inside each classroom, laboratory, office, and room that can cause damage and hinder mobility must be evaluated. These can be shelves, filing cabinets, cabinets, ceilings, and electrical installations. Again, the adequate placement and installation of these would report a lower degree of vulnerability.
4.5.1. State of Conservation of the Building and Roofs
The state of conservation is a condition, at the discretion of the evaluator, that allows indicating the general situation of the building, in which it briefly describes the state of masonry, components, and structural systems, in addition to nonstructural elements that are part of the building. Four levels are considered: very good, good, fair, and poor, with the subsequent degree of vulnerability from low to high. In the case of roofs, additionally, it is necessary to identify their type and the material.
4.5.2. Exit Doors or Emergency Exits
The lowest degree of vulnerability would be assigned to the highest percentage of doors that meet the basic standards for exit doors or building emergency exits established by the Metropolitan Council of Quito [
115], since exits are the primary means of escape and evacuation.
4.5.3. Windows
In case of door obstacles, the windows could be used as emergency exits. Still, these would comply with the conditions regulated by [
116] and would be evaluated with the lowest degree of vulnerability. Opposite cases would be associated with the highest degree of vulnerability.
4.5.4. Universal Accessibility
School buildings must meet basic requirements to guarantee inclusive accessibility, established by the Metropolitan Council of Quito [
115,
116]. Therefore, close to 100% compliance percentages would be recorded with the lowest degree of vulnerability.
4.5.5. Vulnerability Plugin
The evaluation forms contemplate an additional section where potential geological risks are identified, such as landslides due to the failure of nearby slopes or settlements, horizontal displacements, and rotations of a building as a result of deformations in the ground.
4.5.6. Interpretation of the Degree of Vulnerability Score
Three ranges are considered
Table 8 to categorize the degree of vulnerability. In the report presented by the evaluator, the corresponding degree must be indicated, detailing what was observed and establishing an action plan, and prioritizing the worst conditions.
4.6. Seismic Risk and Global Risk of Schools
Once the degree of vulnerability for each building has been established, as a preliminary result for structural risk and global risk assessments, it is necessary to determine the seismic hazard and its exposure. Additionally, the response capacity, the occupation, and the importance of each building, according to the basic parameters, is established in FEMA P-1000 [
64].
4.6.1. Seismic Risk of a Structure (Rs)
Lagomarsino and Giovinazzi [
117] proposed to combine (Rs = P × V) the degree of vulnerability, V, with the macroseismic intensity, P, to obtain average damage states and, subsequently, damage probability matrices, which for its calculation, Grünthal [
118] establishes that the damage states comply with a binomial distribution behavior. Finally, this procedure aims to determine the empirical fragility curves.
4.6.2. Seismic Hazard
As it was previously pointed out, the evaluated schools are located in a seismic hazard zone between “High” and “Very High”.
4.6.3. Degree of Damage
Damage scenarios are established to identify the consequences of an earthquake hitting a building or group of buildings in a given location with a certain intensity. The proposed methodology is based on interpreting the damage states proposed in the EMS-98 [
119].
4.6.4. Global Seismic Risk (Rg)
The global seismic risk (Equation (3)) is established based on the seismic risk index of the methodology proposed by Lopez [
120], in direct relation to the total vulnerability,
Vtotal, and the level of exposure to the hazard,
NE. Unlike the investigation by Lopez [
120], a capacity coefficient,
C, is established, which is obtained by qualifying the response capacity of the entire school. For this, a form named response capacity, Cr, has been prepared, and it positively or negatively influences the final grade.
4.6.5. Hazard Exposure Level (NE)
Quantitative values are established for each of the five threat levels, taking into account that the lower the level of exposure, the less likely a disaster is to occur. The study area is cataloged with a “Very High” level of exposure to the hazard, corresponding to a value of 1.00. As listed in
Table 9, for each of the following levels, the assigned value is reduced in proportion to the mean values of the spectral acceleration intervals, according to FEMA P-154, which defines seismic risk zones, regardless of the vulnerability.
4.6.6. Response Capacity (Cr)
The response capacity evaluation is carried out for the entire school. In the proposed methodology, a format similar to the previously described vulnerability assessment has been developed. However, the capacity conditions would be the opposite. The best capacity level would be related to a maximum value of 80 points and the lowest capacity degree to a minimum value of 20 points. The score is associated with the knowledge and application of the different reforms, policies, and plans issued by a government, or sectional or municipal entity. A low capacity level recommends reforming the response plans, restructuring planning teams, and implementing protocols or more specific annexes.
On the other hand, a high capacity value means that the school has sufficient resources to face an emergency. The final recommendation is based on the deficiencies found during the evaluation. It is worth mentioning that, in Ecuador, schools must submit their emergency plans to the municipal risk management secretariat for review and for the issuance of operating permits.
4.6.7. Calculation of the Capacity Coefficient (C)
This coefficient affects the total vulnerability of the school, increasing or reducing it, depending on the score obtained on the response capacity form. The calculation of C is established from a heuristic methodology for solving problems, resulting in the following equations [
121]:
4.6.8. Categorization of Schools
The schools would finally be accredited according to the value of Rg, which generally represents the risk of developing activities within the facilities. The proposed methodology considers five categories between A and E. Category A represents Rg ≤ 15, B contemplates a range of 15 < Rg ≤ 30, C of 30 < Rg ≤ 45, D of 45 < Rg ≤ 75, and E of 75 < Rg ≤ 100. Their respective global risk estimates are low, moderate, moderate-high, high, and very high.
5. Results and Discussion
There are 61 educational establishments in Sangolquí [
122]. Of these, we evaluated twelve, presenting one exemplary case study about the degree of vulnerability with more details, namely, the private school called “Santa Ana”. This school complex comprises ten buildings, as indicated in the sketch of
Figure 4 (
Table 10). It has a student population of 420 students, 21 teachers, and 8 persons working in the administrative area. It should be noted that a student (woman) in the basic section with a disability would need priority attention.
For the evaluation of the response capacity (Cr), we used the aforementioned corresponding sheet which contained 25 questions related to risk management, for which the institutional plan for risk reduction of the Ministry of Education was used. The school capacity level was evaluated through this tool and field reconnaissance, as indicated in
Table 11.
Furthermore, the emergency operation plan could not be revised entirely. However, given some characteristics observed in the field and based on the institutional plan for risk reduction, it was possible to evaluate the school capacity level. For example, better signage is recommended to distinguish evacuation routes, safe points, and imminent dangers. In addition, the value obtained indicates an acceptable strategy to face threats within the school. The aforementioned physical vulnerability and degree of vulnerability forms have been used to evaluate the vulnerability level.
In some cases, the Level 1 and Level 2 forms of FEMA P-154 are the same document. Here, we evaluated the physical conditions of the buildings that make up the school. In this sense, the degree of vulnerability of the nine structures within the Santa Ana Private School was evaluated, of which the results obtained are listed in
Table 12. Additionally, the degrees of total vulnerability were also obtained, listed, and illustrated in
Figure 5. Based on these conditions, all evaluations of all other educative establishments have been listed in
Table 12.
From the response capacity evaluation, the capacity coefficient that determines the global risk is obtained in this case.
Finally, the global risk is obtained with the variables calculated to be:
The global risk value allows the Santa Ana Private School to be accredited as category “B”. However, since between 6% and 22% of unfavorable characteristics can be improved within the school, preventive measures must be implemented to reduce potential risks significantly. This can be achieved mainly by considering the physical vulnerabilities of the E2, E7, and E8 buildings, which deserve immediate attention; if they do not do so, they would not be able to go up to category “A”. In general, the structures within the institution present a low vulnerability because there has been an analysis and intervention by a structural engineer. Therefore, its total global vulnerability value is in the medium range.
Building E2, E7, and E8 require a structural analysis because they present a high vulnerability, which as evaluated by FEMA, have a 50% probability of collapse; among other aspects, these buildings are located next to another of greater height without a seismic joint, which translates into a potential risk of falling masonry. Building E1 presents a medium vulnerability because it is adjacent to building E2. However, it does not require a detailed evaluation since it is a more robust and taller structure than E2. The Santa Ana Private School has a high response capacity since it has an exemplary implementation of risk management, which translates into a lower overall risk for the institution.
Therefore, it is recommended to improve capacities through prevention and mitigation measures and to prepare the entire educational community, including direct and indirect actors. Furthermore, they should reinforce the structures which obtained a medium or high vulnerability by conducting a complete structural analysis for each one. Additionally, the folding doors should be replaced by sliding doors to prevent them from obstructing the occupants’ pushing abilities and allow people to exit in an emergency. Finally, they have to implement the basic standards for universal accessibility, for example, by placing handrails on stairs and ensuring that there are no objects protruding from the walls by more than 15 cm.
Table 13 lists the twelve evaluated schools in Sangolquí, of which the majority of structures are type C3. Some schools also use hybrid structural systems in one-story buildings, such as unreinforced masonry with wood or steel roof systems. Only a few buildings were identified as old existing RC-framed buildings susceptible to brittle collapse.
Regarding the soil type, the most common is type C and D. The results exhibited the lack of emergency access doors and the usage of tempered but not laminated glass in windows. On the other hand, the institutions demonstrate a good response capacity, with a rating greater than 60 being “High”. Finally, the highest percentage of the institutions presents a category type B of moderate global risk, and only one of those evaluated was category D, representing a high global risk.
Model of Victims of Schools
A seismic risk evaluation is a multidisciplinary task, which, apart from direct physical damage, requires other types of attempts, and even more so when a probabilistic analysis is performed [
120]. A complementary analysis is detailed to approximate the number of victims based on the number of people generally counted in schools. In this respect, victims are the number of injured and deceased persons. Specifically, the applied model considers four categories of victims: slightly injured, injured requiring hospitalization, severely injured and also obviously require hospitalization, and finally, deceased persons. The model requires basic data to estimate victims, the probability of occurrence of the damage states, and the density and distribution of the population at the moment of the earthquake [
119]. Given a type of building and a category of people damaged, they model the number of victims with the following equation, particularly for each building:
where:
D5 is the number of collapsed buildings, which is obtained by multiplying the number of buildings of a specific class by the corresponding probability of collapse.
M1 is the number of people in the school at the time of the earthquake (educational community).
M2 is the occupancy percentage of the student population within the school during a regular school day. The worst scenario is considered a typical school day from 9:00 am to 1:00 pm during the school year.
M3 is the occupancy percentage of the student population within the buildings trapped by their collapse. This percentage is determined based on detailed estimates for each class of structural typology, which can be a bit subjective if you do not have an approximate idea of the possible behavior of the building.
M1 × M2 × M3 represents the number of people trapped in a building damaged by the effects of the earthquake.
M4 represents the number of deaths caused directly by the collapse of the building.
M5 represents post-earthquake mortality.
As an example, calculating the number of different types of victims may serve the following case [
123]. In a collapsed school, there are 100 people among the teachers, students, and administrative staff (
M1). At the time of the earthquake, 90% of the people are inside the facilities (
M2), of which 50% (
M3) are trapped. Then, the product
M1 ×
M2 ×
M3 = 45 represents the number of people who have not been able to leave the buildings, considering
M4 with values of 30% (
M4A), 25% (
M4B), 20% (
M4C), and 25% (
M4D) for minor injuries, injuries requiring hospitalization, severe injuries, and direct deaths, respectively.
Therefore, there are 13.5 slightly injured (45 × 30%), 11.25 injured requiring hospitalization (45 × 25%), 9 serious injuries (45 × 20%), and 11.25 direct deaths (45 × 25%). The model assumes that these four classes of victims represent 100% of the people trapped. Therefore, there are 33.75 people trapped alive (45-11.25). Finally, post-collapse mortality among trapped people is about 30% (M5), namely, 10.13 post-earthquake casualties (33.75 × 30%), resulting in a total amount of deaths of 21.38 (10.13 + 11.25).
This procedure agrees with this part of the equation from the work of Coburn et al. [
124]:
As this is a probabilistic study, we fine-tuned the parameters’ values. Since we are dealing with probabilities or rates of occurrence, we kept the numbers with decimals.
According to the latest information record from the Ministry of Education in Sangolquí, in the 2022–2023 school year, there were 25,502 students and 1274 teachers [
122]. In the current study, we counted 13,754 students and 695 individuals from the teaching and administrative staff, resulting in 14,449 people distributed in the studied schools, as listed in
Table 14. Thus, given the previous data, the present investigative work takes as a sample 54% of the total population of schools registered for the parish of Sangolquí.
A critical scenario is considered to estimate a correct model of victims. In this case, it is established that an earthquake of magnitude 7 on the Richter scale occurs on a typical working day (e.g., Tuesday) at approximately 9:00 a.m. Therefore, 98% (
M2) of the facilities of the school would be in use, and the probability of people who may be trapped (
M3) is determined based on the global risk that they are 50% of
M2 (
Table 14). Then, the parameters of the percentage of people probably dead due to the collapse of the structure (
M4A–D) and the percentage of post-collapse mortality (
M5) are calculated as the total deaths (
Table 15). Of all the schools studied, there would possibly be 7080 people trapped (students, teachers, and administrative staff), of which 3363 would correspond to the total casualties, which is about 23.27% of the educational community. However, these mass balances are based only on the highest vulnerabilities existing, without considering fewer collapsed buildings when norms and regulations of seismic resistant constructions are respected.
6. Conclusions
The response capacity is a factor that depends on the physical vulnerability of the building itself to reduce the global risk. No matter how high the capacity, if the group of buildings evaluated is very vulnerable to seismic effects, they would collapse without allowing the application of emergency operation plans.
The construction systems and the year of construction are determining factors when assessing buildings’ vulnerability since the structure’s acceptable behavior depends on them when a seismic event occurs.
Through the case study, the necessity of implementing the vulnerability evaluation guide has been identified. Although it is a preliminary evaluation, it allows knowing the current state of the structure and the probabilities of damage that a seismic movement with defined characteristics could cause. It also determines the global risk value, which allows schools to be categorized based on the security it provides.
Twelve schools in Sangolquí, Ecuador, were assessed through the proposed methodology. Most structures have reinforced concrete frames with unreinforced masonry infill walls on C and D soil types. Regarding the response capacity, the majority reached a “High” level, with a rating greater than 60. However, the highest percentage of the schools registered a moderate global risk category. Only one was evaluated with a low global risk category, and another one as category D, representing a high global risk.
As a representative case, the Santa Ana School presents nine buildings. Four had the most significant vulnerabilities, where three present a common characteristic: the adjacency between buildings without an adequate seismic joint, which causes a potential risk of knocking that would cause considerable damage to the structural elements of both buildings.
Further in-field studies are still required to implement sustainable solutions to improve the evaluated schools’ seismic performance. However, the proposed methodology constitutes a valuable instrument for prioritizing actions to reduce the seismic risk in schools in Ecuador.

 ,
, 


