Article

An Ontology-Based Holistic and Probabilistic Framework for Seismic Risk Assessment of Buildings

Department of Civil Engineering, Dalian Maritime University, Dalian 116026, China
*
Author to whom correspondence should be addressed.
Buildings 2022, 12(9), 1391; https://doi.org/10.3390/buildings12091391
Submission received: 23 July 2022 / Revised: 22 August 2022 / Accepted: 31 August 2022 / Published: 5 September 2022

Abstract

:
To avoid over-reliance on the identification of building damage states post-earthquake in the seismic risk assessment process, an ontology-based holistic and probabilistic framework is proposed here for seismic risk prediction of buildings with various purposes and different damage states. Based on vulnerability analysis, the seismic risk probabilities of buildings are first obtained by considering the on-site seismic hazard. Taking economic losses and casualties as assessment indicators, a system for seismic risk assessment of buildings, OntoBSRA (Ontology for Building Seismic Risk Assessment), is then developed by combining ontology and semantic web rule language. A case study is carried out to demonstrate the application of the proposed framework and further validate the semantic web rules. The results show that the proposed framework can provide a holistic knowledge base that allows risk assessors or asset managers to predict the consequences of earthquakes effectively, thereby improving efficiency in decision-making.

1. Introduction

Earthquake, as one of the most destructive natural disasters, causes huge economic losses and casualties annually. Taking the USA as an example, the annual economic loss caused by earthquakes is estimated to be USD 4.5 billion, and this estimate does not include casualties [1,2] Therefore, to analyze the seismic performance of structures for decision-making for more effective disaster prevention and mitigation measures, researchers have carried out extensive research using shaking table tests and time-history analyses on the deformation mechanism, weak links, and characteristics of mechanical responses of structures subjected to earthquakes [3,4,5].
It should be noted that the shaking table tests and the time-history analysis method can only obtain the mechanical performance of a structure under specific ground motions; they have limitations in analyzing the randomness of the seismic response caused by the uncertainty in both the ground motion and the structure (e.g., design, construction, size and material strength, etc.) [6]. Therefore, in order to fully consider the uncertainties in multiple factors, performance-based earthquake engineering (PBEE) research has been conducted based on probability theory, in which probability is used as the basic measure to estimate the seismic performance of a structure [7,8,9,10]. Koutsourelakis [11] used fragility curves to evaluate the seismic performance of a structure constructed on a saturated sand deposit and provided confidence intervals of the vulnerability by combining Bayesian theory with the Markov Chain Monte Carlo technique. Cimellaro and Reinhorn [12] used the combination of acceleration and inter-story drift as a response variable and defined a generalized multidimensional limit state function. Then, multidimensional fragility curves were established for a California hospital considering the correlations among the thresholds. Michel et al. [13] obtained fragility curves for a reinforced concrete (RC) structure based on two complete methodologies. One is to use a multiple degrees of freedom system considering higher modes, while the other is to use a single degree of freedom model considering the fundamental mode. Furthermore, Ruggieri and Gentile et al. [14,15,16] discussed the trade-off between complexity (modelling effort and computational time) and accuracy in seismic fragility analysis of RC structures so as to provide proper methods of seismic fragility for practical PBEE assessment. Bakhshi and Asadi [17] quantified the impact of overall structural ductility on failure probability using vulnerability curves. Karapetrou et al. [18] studied the influence of corrosion on the seismic performance of RC structures using time-dependent fragility curves based on the incremental dynamic analysis (IDA) method. Based on vulnerability analysis, Yu et al. [19] took four groups of buildings with low-to-medium heights corresponding to 3, 5, 8, and 10 stories as examples in order to investigate the influence of seismic design levels on the seismic performance of RC moment-resisting frame buildings designed according to the provisions of the current Chinese code for seismic design of buildings. Generally speaking, according to Dowrick [20], seismic risks can be divided into three parts: seismic vulnerability, seismic hazard, and seismic loss. Therefore, assuming that the seismic hazard function can be approximated by the extreme value type II distribution, Cornell et al. [21] conducted vulnerability analysis and derived an analytical solution to the seismic risk probability for structures with different damage states using convolving seismic vulnerability function and seismic hazard function based on the full probability theory. Along with later collaborators, they further established the second-generation PBEE theory to establish a probabilistic framework for seismic performance evaluation of structures [22,23,24]. Furthermore, Lu et al. [25] clarified the distinctions and connections of five seismic fragility models in the second-generation PBEE theory, namely, the seismic demand fragility model, the seismic capacity fragility model, the seismic damage fragility model, the seismic loss fragility model, and the seismic decision fragility model, and put forward the concepts of forward and backward PBEE theory to integrate the traditional seismic risk theory and the second-generation PBEE theory into a unified framework.
According to ISO 31000-2018 [26], risk is defined as the effect of uncertainty on the objectives. However, the previous theoretical studies on seismic risk theory for structures only predict the probability of a structure with different damage states subjected to random seismic loads. They cannot quantitatively evaluate the consequences caused by earthquakes from a macroscopic point of view, such as economic losses and casualties, while traditional seismic risk assessment heavily relies on the investigation of actual earthquake damage. Wang et al. [27] conducted statistical analysis of the measured damage loss from the Tianjin and Lancang–Gengma earthquakes, determining the ratio of the indirect losses to the initial construction cost of buildings with different damage states. Spence et al. [28] proposed a global earthquake vulnerability estimation system to determine the mean damage ratio for buildings with different purposes under earthquake loads. Sahar et al. [29] developed an algorithm for automatic extraction and identification of two-dimensional building shape information using aerial images and geographic information systems, and further evaluated the seismic risks of cities. Lu et al. [30] proposed a near real-time method for estimation of building seismic losses based on combined satellite or aerial images and dynamic nonlinear time history analysis. Xiong et al. [31] put forward a seismic damage evaluation method for regional buildings on the basis of drones and a convolutional neural network, which was capable of accurately evaluating the seismic damage in regional buildings through collected detailed damage information on buildings. Using photographs of buildings, Ruggieri et al. [32] proposed a VULMA (vulnerability analysis using machine-learning) framework based on machine learning to evaluate seismic vulnerability of existing buildings. More accurate seismic risk assessment results can be obtained by applying the methods mentioned above. However, these methods are heavily dependent on the identification of structural damage states after a specific earthquake, and the statistical process is tedious and complicated. In addition, these methods cannot take into account earthquake uncertainty, and there is a lack of a unified seismic risk assessment framework to predict earthquake losses for existing buildings with various purposes and different damage states.
Ontology, as a new semantic technology, can be used for knowledge sharing in different areas. Its semantic structures and ability for logical inference provide an effective method for integrated decision-making based on multi-objective knowledge. Ever since its emergence, ontology technology has been widely applied in many aspects, such as agriculture, biology, economy, medicine, construction, etc. [33]. Tserng et al. [34] proposed an ontology-based risk management method for managing the risks in construction stages. Taking into account the relationship between risk sources and cost overruns, Fidan et al. [35] proposed an ontology-based model to predict cost overruns. Scheuer et al. [36] established an ontology-based knowledge base for flood risk management using the accessibility and repeatability of multi-criteria risk assessment of floods. Du et al. [37] combined the hierarchical clustering method with ontology and developed an integrated system for risk information of surface subsidence of underground tunnels. Ding et al. [38] proposed an information management framework for construction risks in the Building Information Modeling (BIM) environment by making full use of the advantages of the BIM, ontology, and semantic web technologies. Meng et al. [39] developed an ontology of a pile integrity evaluation system for quantitative identification and qualitative evaluation of piles with defects combined with an analytical methodology for pile vibrations. Ontology is capable of integrating multi-objective knowledge into a unified system. However, no studies have been conducted to apply ontology in order to develop a knowledge base for seismic risk assessment of buildings.
Based on an extensive literature review, it is paramount to develop an efficient building seismic risk prediction framework based on probability and ontology to predict economic losses and casualties for better disaster prevention and mitigation. This paper aims to develop an ontology-based probabilistic framework for seismic risk assessment of buildings. In the developed framework, seismic risk probabilities of buildings with different damage states are first derived based on seismic vulnerability analysis and seismic hazard analysis. On this basis, an Ontology for Building Seismic Risk Assessment (OntoBSRA) system is developed to integrate knowledge on seismic risk assessments of buildings into a unified knowledge base by combining ontology and semantic web rule language (SWRL). Thus, automated seismic risk prediction including direct losses, indirect losses, and casualties related to buildings with various purposes and different damage states can be realized. The flow chart of the seismic risk prediction framework is shown in Figure 1. In addition, a case study is conducted in order to illustrate the application of the framework for seismic risk prediction.
The remainder of this paper is organized as follows: Section 2 presents the method for seismic risk probability analysis; Section 3 discusses the details of the OntoBSRA; a case study is conducted to illustrate the details of the application of the proposed framework in Section 4; finally, in Section 5 the major findings and limitations of this study are summarized in the course of concluding this paper.

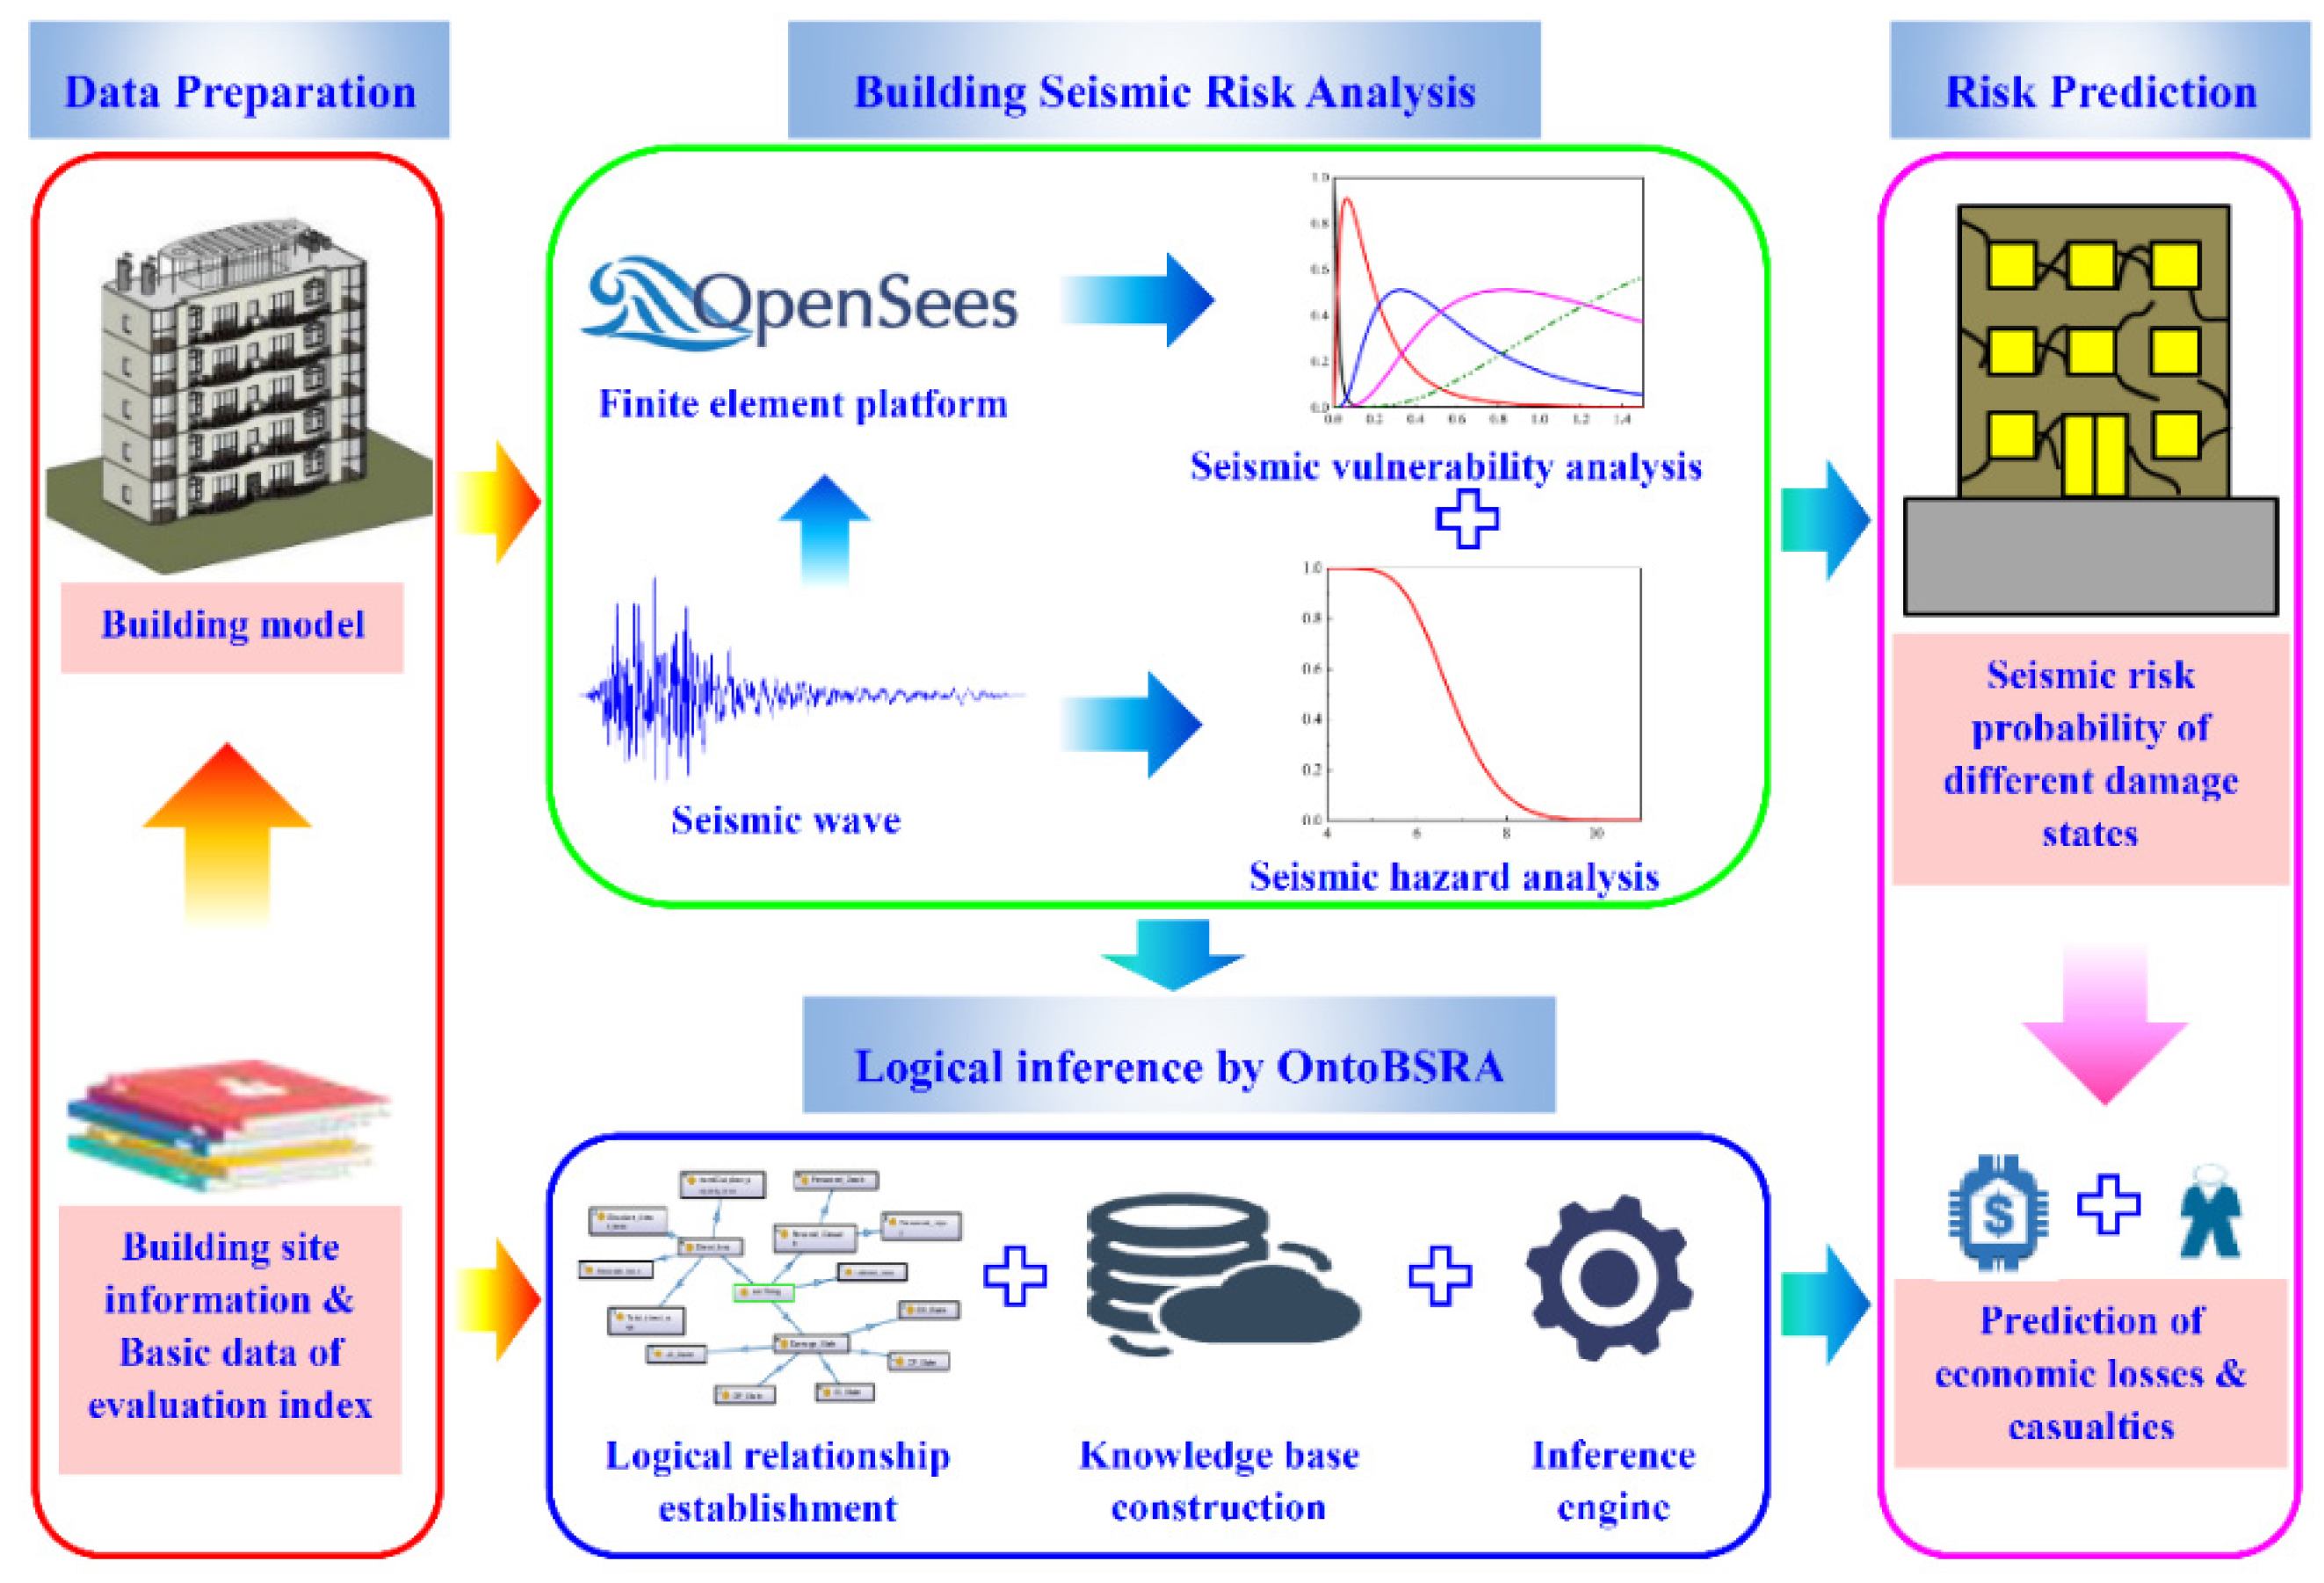
2. Method for Seismic Risk Probability Analysis

Because of the need to take into account the uncertainty in both the earthquake and the structure while meeting the explicit requirements of various stakeholders in terms of performance targets seismic risk-oriented performance-based earthquake engineering has attracted the attention of many researchers, and full-probability seismic performance assessment methods have been proposed for engineering structures. Seismic risk probability analysis mainly includes seismic vulnerability analysis and seismic hazard analysis.

2.1. Seismic Vulnerability Analysis

In vulnerability analysis, the first step is to conduct a probabilistic seismic demand analysis. Considering the randomness of earthquake loads, a large number of selected seismic waves are input into the structural model for nonlinear dynamic time-history analysis in order to obtain the engineering demand parameter (EDP). Then, the relationship between the EDP and the ground motion intensity measure (IM) is obtained through data fitting. In this paper, the maximum inter-story drift of a structure is selected as the EDP and the peak ground acceleration (PGA) is used as the IM. According to Cornell and Krawinkler [19], the relationship between the EDP and IM is as follows:
E D P = a ( I M ) b or ln ( E D P ) = ln a + b ln I M
where a and b are the fitting parameters.
Seismic fragility quantitatively describes the ability of a structure to resist a certain level of seismic damage based on probability theory, and is defined as the conditional probability of the EDP of the structure subjected to an earthquake exceeding a certain limit state. It is generally assumed that seismic fragility follows a lognormal distribution, which can be expressed as follows [25]:
P f = P ( E D P D I | I M ) = 1 Φ ( ln ( D I ) ln ( a ( I M ) b ) β d 2 + β c 2 )
where Pf is the probability of the limit being exceeded, DI is the damage state thresholds, and β d and β c are the logarithmic standard deviations of the engineering demand parameter and the seismic capacity, respectively. According to literature [40], when the ground peak acceleration PGA is selected as the IM, β d 2 + β c 2 is equal to 0.5.
According to GB50011-2010 [41] and Mwafy and Almorad [42], the structural performance level in this paper is categorized into five groups, namely, Normal Occupancy (OP), Immediate Occupancy (IO), Life Safety (LS), Collapse Prevention (CP), and Destruction (DS). The corresponding damage states are termed as no damage, slight damage, moderate damage, extensive damage, and complete collapse. The thresholds of these damage states are shown in Table 1 [41,43].
Based on the above analysis, the occurrence probability curves for various damage states of a structure can be obtained by Equation (3):
F d s , j = P ( E D P = d s j | I M ) = {     1 P f , j j = 1 P f , j 1 P f , j j = 2 , 3 , 4 P f , j 1 j = 5
where ds denotes the damage state and j = 1, 2, 3, 4, 5 represent no damage, slight damage, moderate damage, extensive damage, and complete collapse, respectively.
Moreover, seismic intensity can intuitively reflect the severity of the seismic damage and accelerate the process of assessing seismic risks. To this end, in this paper the occurrence probability curves are converted into probability matrixes related to the seismic intensity according to the relationship between the seismic intensity and the PGA, as shown in Equation (4) [44]:
I = 3.70 log ( P G A ) 1.60
where I is the seismic intensity level.

2.2. Seismic Hazard Analysis

Seismic hazard refers to the probability distribution of the ground motion in the studied area within a certain period, among which the exceeding or occurrence probability of the seismic intensity is an important index. It is assumed that the seismic intensity follows a Weibull distribution [45]. Hence, the exceeding probability of the seismic intensity within 50 years is expressed as follows:
P ( I i ) = 1 F III ( i ) = 1 exp ( ( ω i ω I 0 ) k / 10 0.9773 )
where ω is the upper limit value of the seismic intensity (generally, ω = 12), I0 is the basic intensity, i is the specific value of seismic intensity, and k is the shape parameter, which can be determined by the least-square method. For regions with a seismic precautionary intensity of grades VI, VII, VIII, and IX, the values of k are 9.7932, 8.3339, 6.8713, and 5.4028, respectively.

2.3. Seismic Risk Probability Analysis

Seismic risk probability refers to the probability of certain disaster consequences in the area of interest caused by earthquakes. In this paper, it is defined as the occurrence probability of a structure in different damage states, which is based on the seismic vulnerability analysis and the seismic hazard analysis. The seismic risk probability can be expressed as follows:
P d s , j = i F ( d s j | I i ) P ( I i )
where Pds,j is the seismic risk probability of a structure in the jth damage state, F ( d s j | I i ) is the conditional probability of the jth damage state when the seismic intensity is equal to I i (which is determined by Equations (3) and (4)), and P ( I i ) is the occurrence probability of the seismic intensity I i , also termed the seismic hazard.

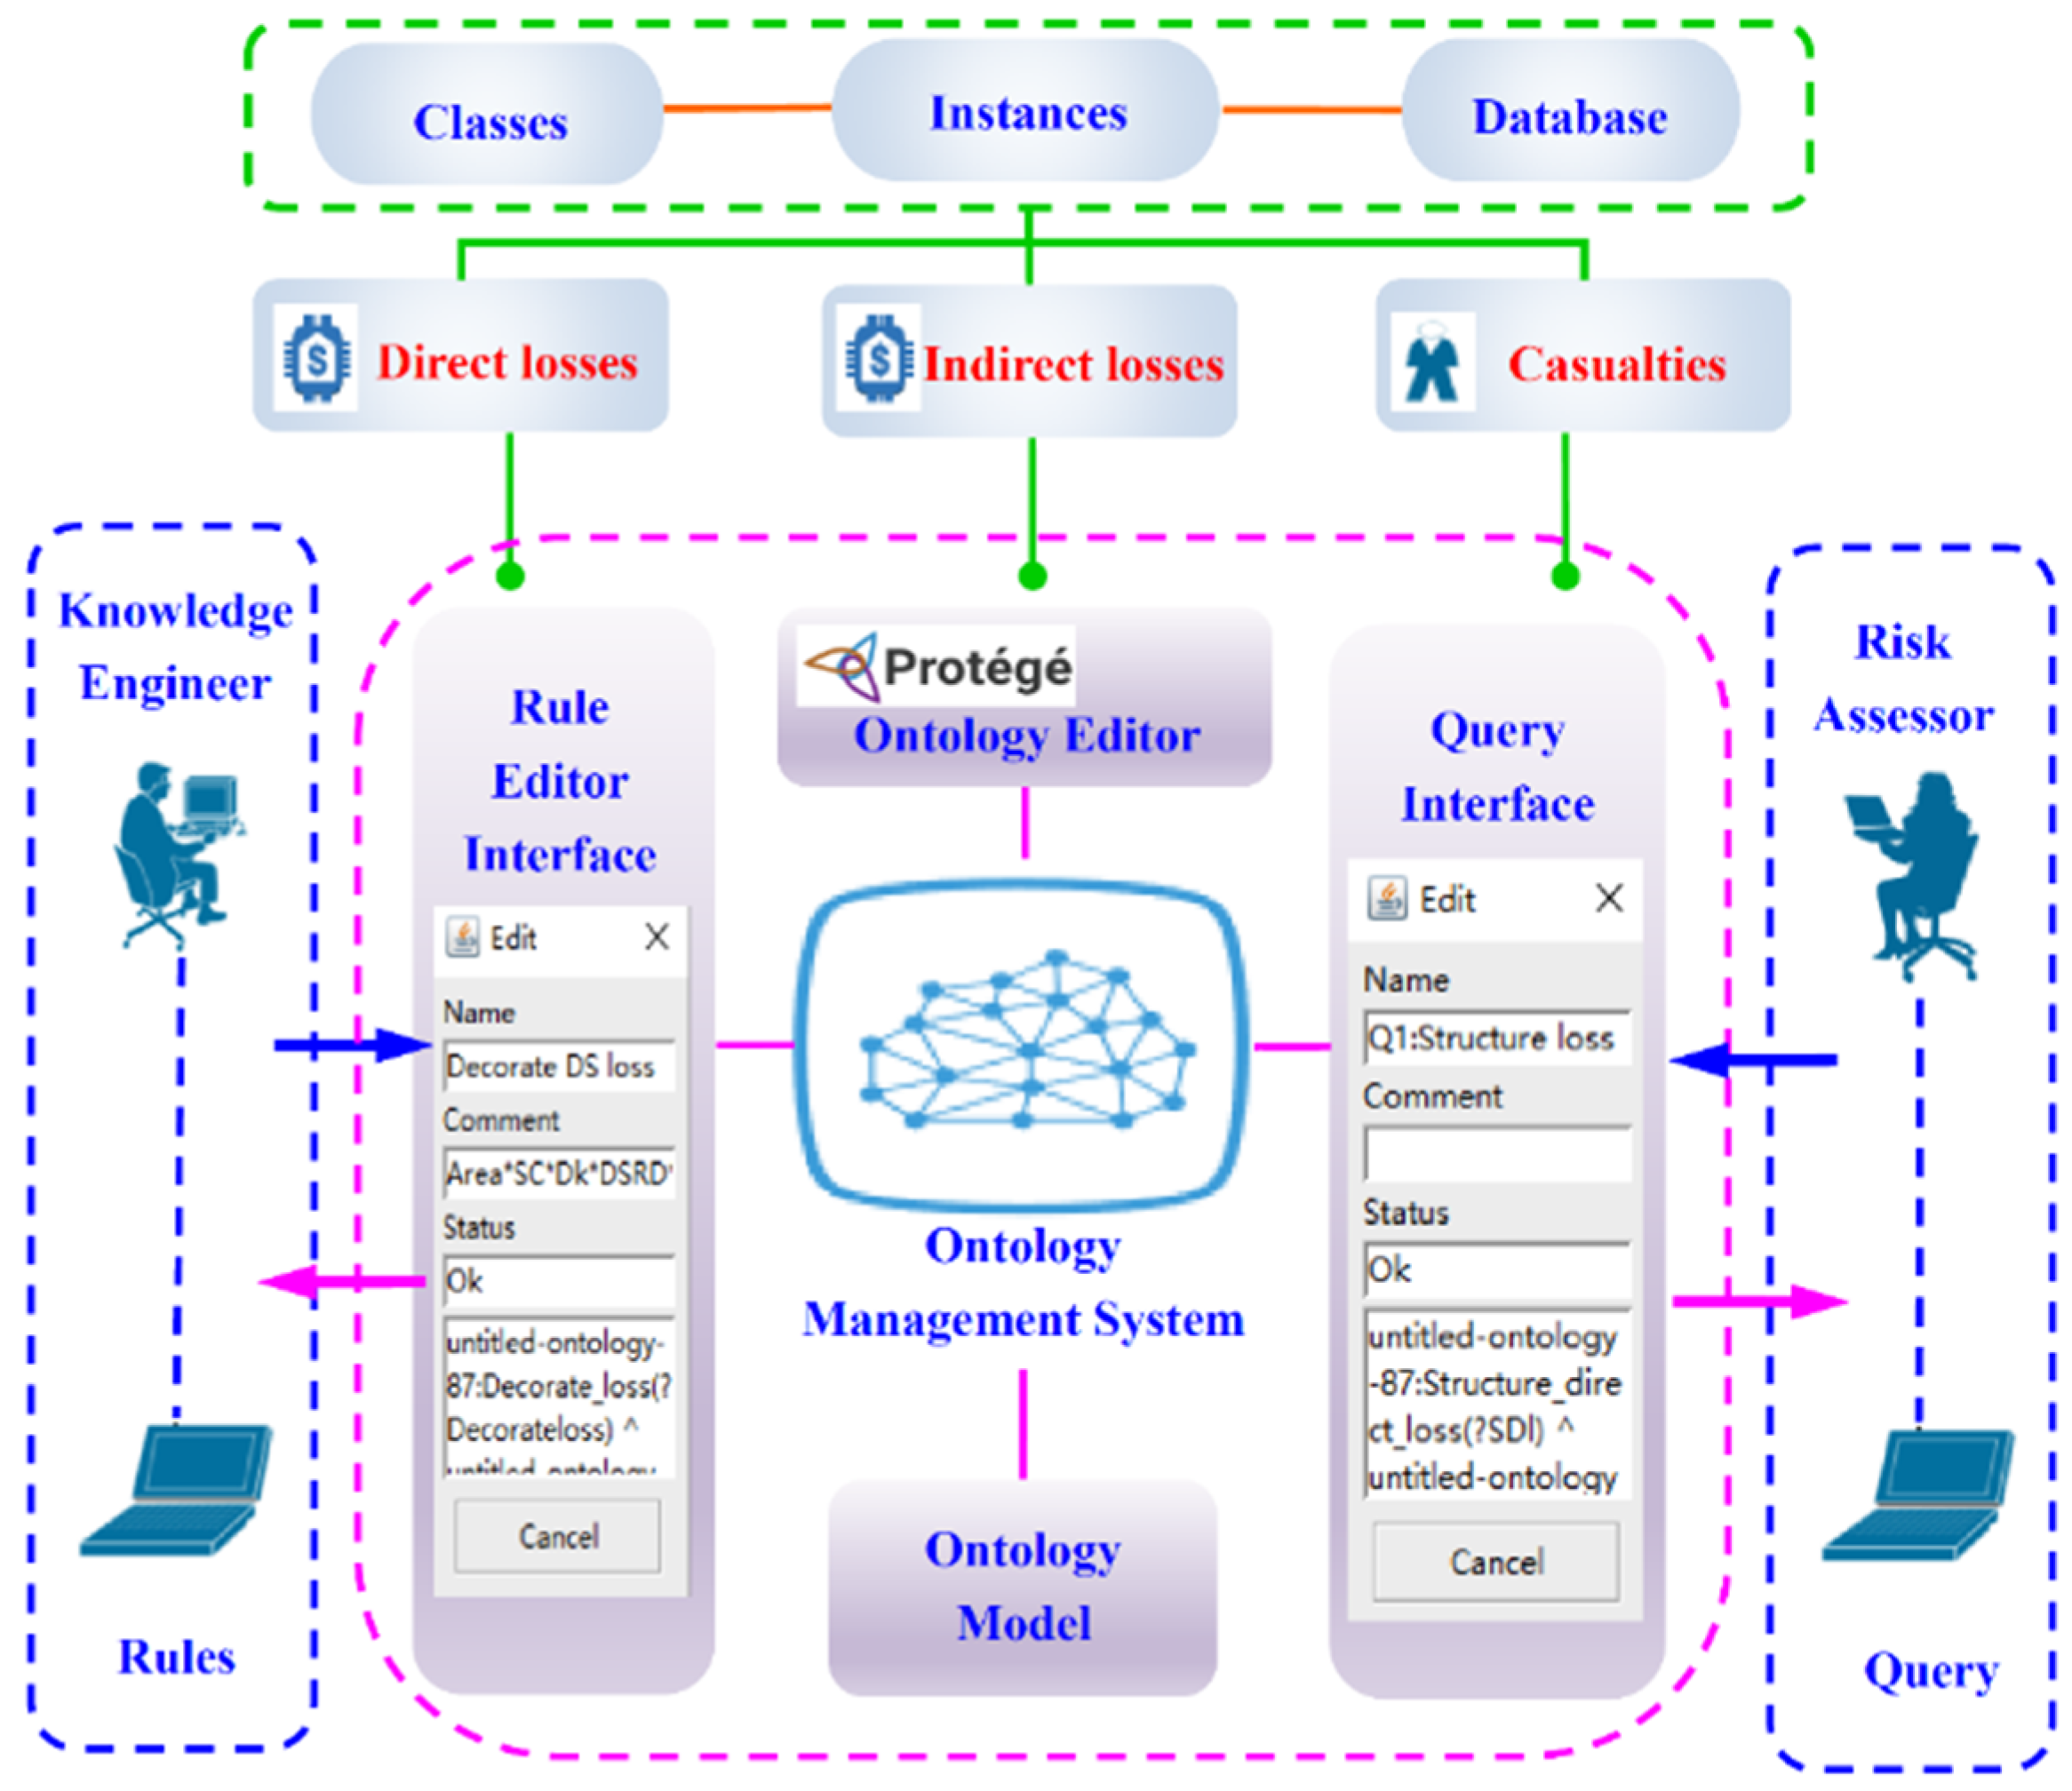
3. Design and Development of the OntoBSRA

3.1. Framework of the OntoBSRA

The developed OntoBSRA includes a knowledge base, ontology management system, rule editor, and query function. The ontology knowledge base stores all seismic risk-related knowledge in the form of an Ontology Web Language (OWL) file, which plays an important role in the OntoBSRA. The ontology management system provides the rule-editing function, which can achieve the deductive reasoning ability of the developed ontology, and has the function of creating as well as updating the ontology. Moreover, users can obtain the final reasoning results by editing the query language rules, (such as the simple protocol and RDF query language (SPAQRL) and the semantic query-enhanced web rule language (SQWRL), using the query function according to their demands [46]. In addition, as Protégé software [36] can realize the establishment of classes, logical relationships, attributes, and instances as well as provide the SWRLTab and SQWRLQueryTab interfaces for SWRL and SQWRL editing, respectively, the OntoBSRA proposed in this paper was developed based on Protégé. The schematic diagram of the OntoBSRA system is shown in Figure 2.

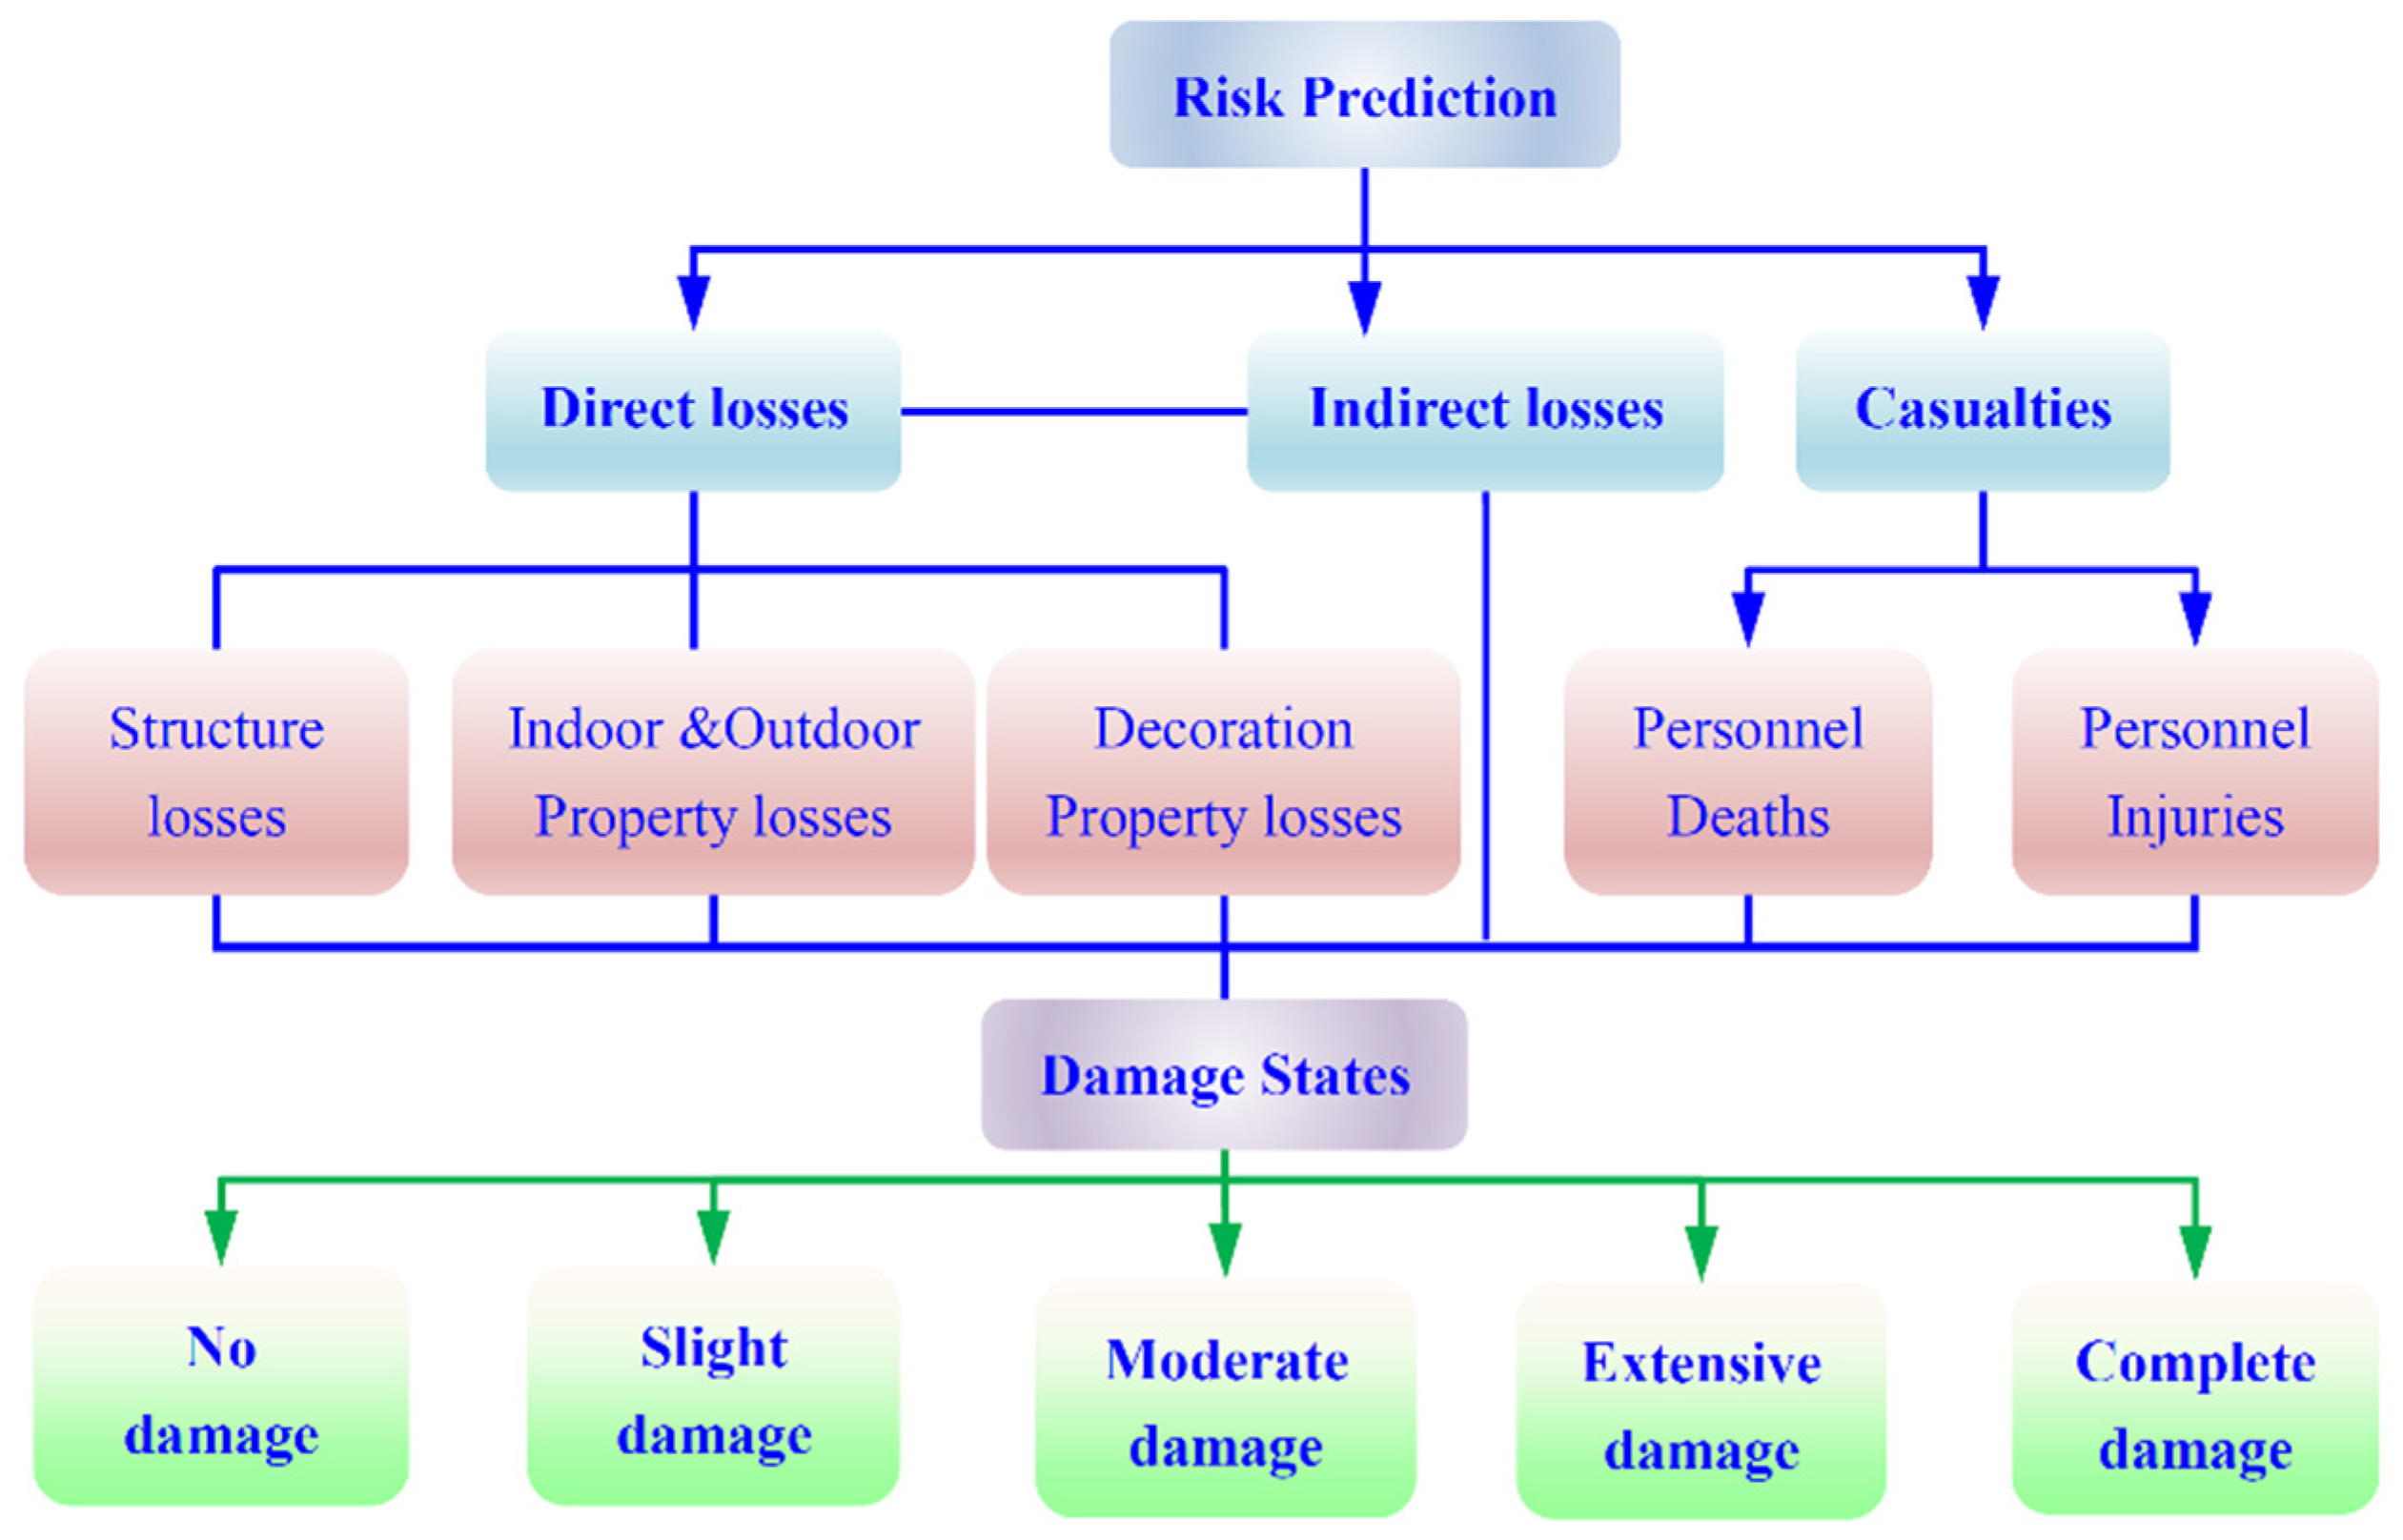
3.2. Determination of Primary Indicators for the OntoBSRA

Seismic risk prediction of a building mainly includes direct losses, indirect losses, and casualties, among which direct losses include structural losses, indoor and outdoor property losses, and decoration property losses.

3.2.1. Direct Losses

(1)
Structural losses
Structural losses can be obtained using the following equation:
S L d s , j = S C × A × P d s , j × R B d s , j
S L = j = 1 5 S L d s , j
where SL denotes the total structural damage losses, SLds,j indicates the loss of the total value of a structure ( S C × A ) in the jth damage state, S C and A represent the unit construction cost and total area of the RC structure, respectively, P d s , j is the seismic risk probability, and R B d s , j is the direct loss ratio of the structure in the jth damage state.
(2)
Indoor and outdoor property losses
Indoor and outdoor property losses caused by an earthquake can be determined using the following equation:
C L d s , j = S C × A × C k × P d s , j × R C d s , j
C L = j = 1 5 C L d s , j
where CL denotes the total indoor and outdoor property losses, C L d s , j represents the losses of total indoor and outdoor property ( S C × A × C k ) in the jth damage state, Ck is the ratio of the indoor and outdoor property replacement cost to the construction cost of the RC structure, and R C d s , j is the direct loss ratio of the indoor and outdoor property in the jth damage state.
(3)
Decoration property losses
Decoration property losses can be obtained using the following equation:
D L d s , j = S C × A × D k × P d s , j × R D d s , j
D L = j = 1 5 D L d s , j
where DL denotes the total decoration property losses, D L d s , j represents the total losses of decoration property ( S C × A × D k ) in the jth damage state, Dk is the ratio of the decoration property replacement cost to the construction cost of the RC structure, and R D d s , j is the direct loss ratio of the decoration property in the jth damage state.
(4)
Total direct losses
Total direct losses can be calculated using the following equation:
D i r L d s , j = S L d s , j + C L d s , j + D L d s , j
D i r L = j = 1 5 D i r L d s , j
where DirL denotes the total direct losses and DirLds,j represents the direct losses in the jth damage state.
The direct loss ratio and the ratio of the indoor and outdoor property and decoration property replacement cost to the construction cost of the RC structure according to the relevant literature [43,47] are shown in Table 2 and Table 3, respectively.

3.2.2. Indirect Losses

Indirect losses can be calculated using the following equation:
I n d L d s , j = D i r L d s , j × R d s , j
I n d L = j = 1 5 I n d L d s , j
where IndL denotes the total indirect losses, while IndLds,j and R d s , j are the indirect losses and the ratio of the indirect losses to the direct losses in the jth damage state, respectively. The values of R d s , j are shown in Table 4 [27].

3.2.3. Casualties

(1)
Number of Deaths
The number of deaths in a building as a result of an earthquake can be obtained using the following equation:
D N d s , j = P D × A × D R d s , j × P d s , j
D N = j = 1 5 D N d s , j
where DN denotes the total number of deaths, DNds,j represents the number of deaths in the jth damage state, PD is the personnel density, and D R d s , j is the death rate in the jth damage state.
(2)
Number of injuries
The number of injuries in a building as a result of an earthquake can be determined using the following equation:
I N d s , j = P D × A × I R d s , j × P d s , j
I N = j = 1 5 I N d s , j
where IN denotes the total number of injuries, INds,j is the number of injuries in the jth damage state, and IRds,j is the injury rate in the jth damage state.
The death rate and injury rate in different damage states of buildings and the personnel density of buildings with various purposes according to Comerio [48] and Wang [49] are shown in Table 5 and Table 6, respectively.

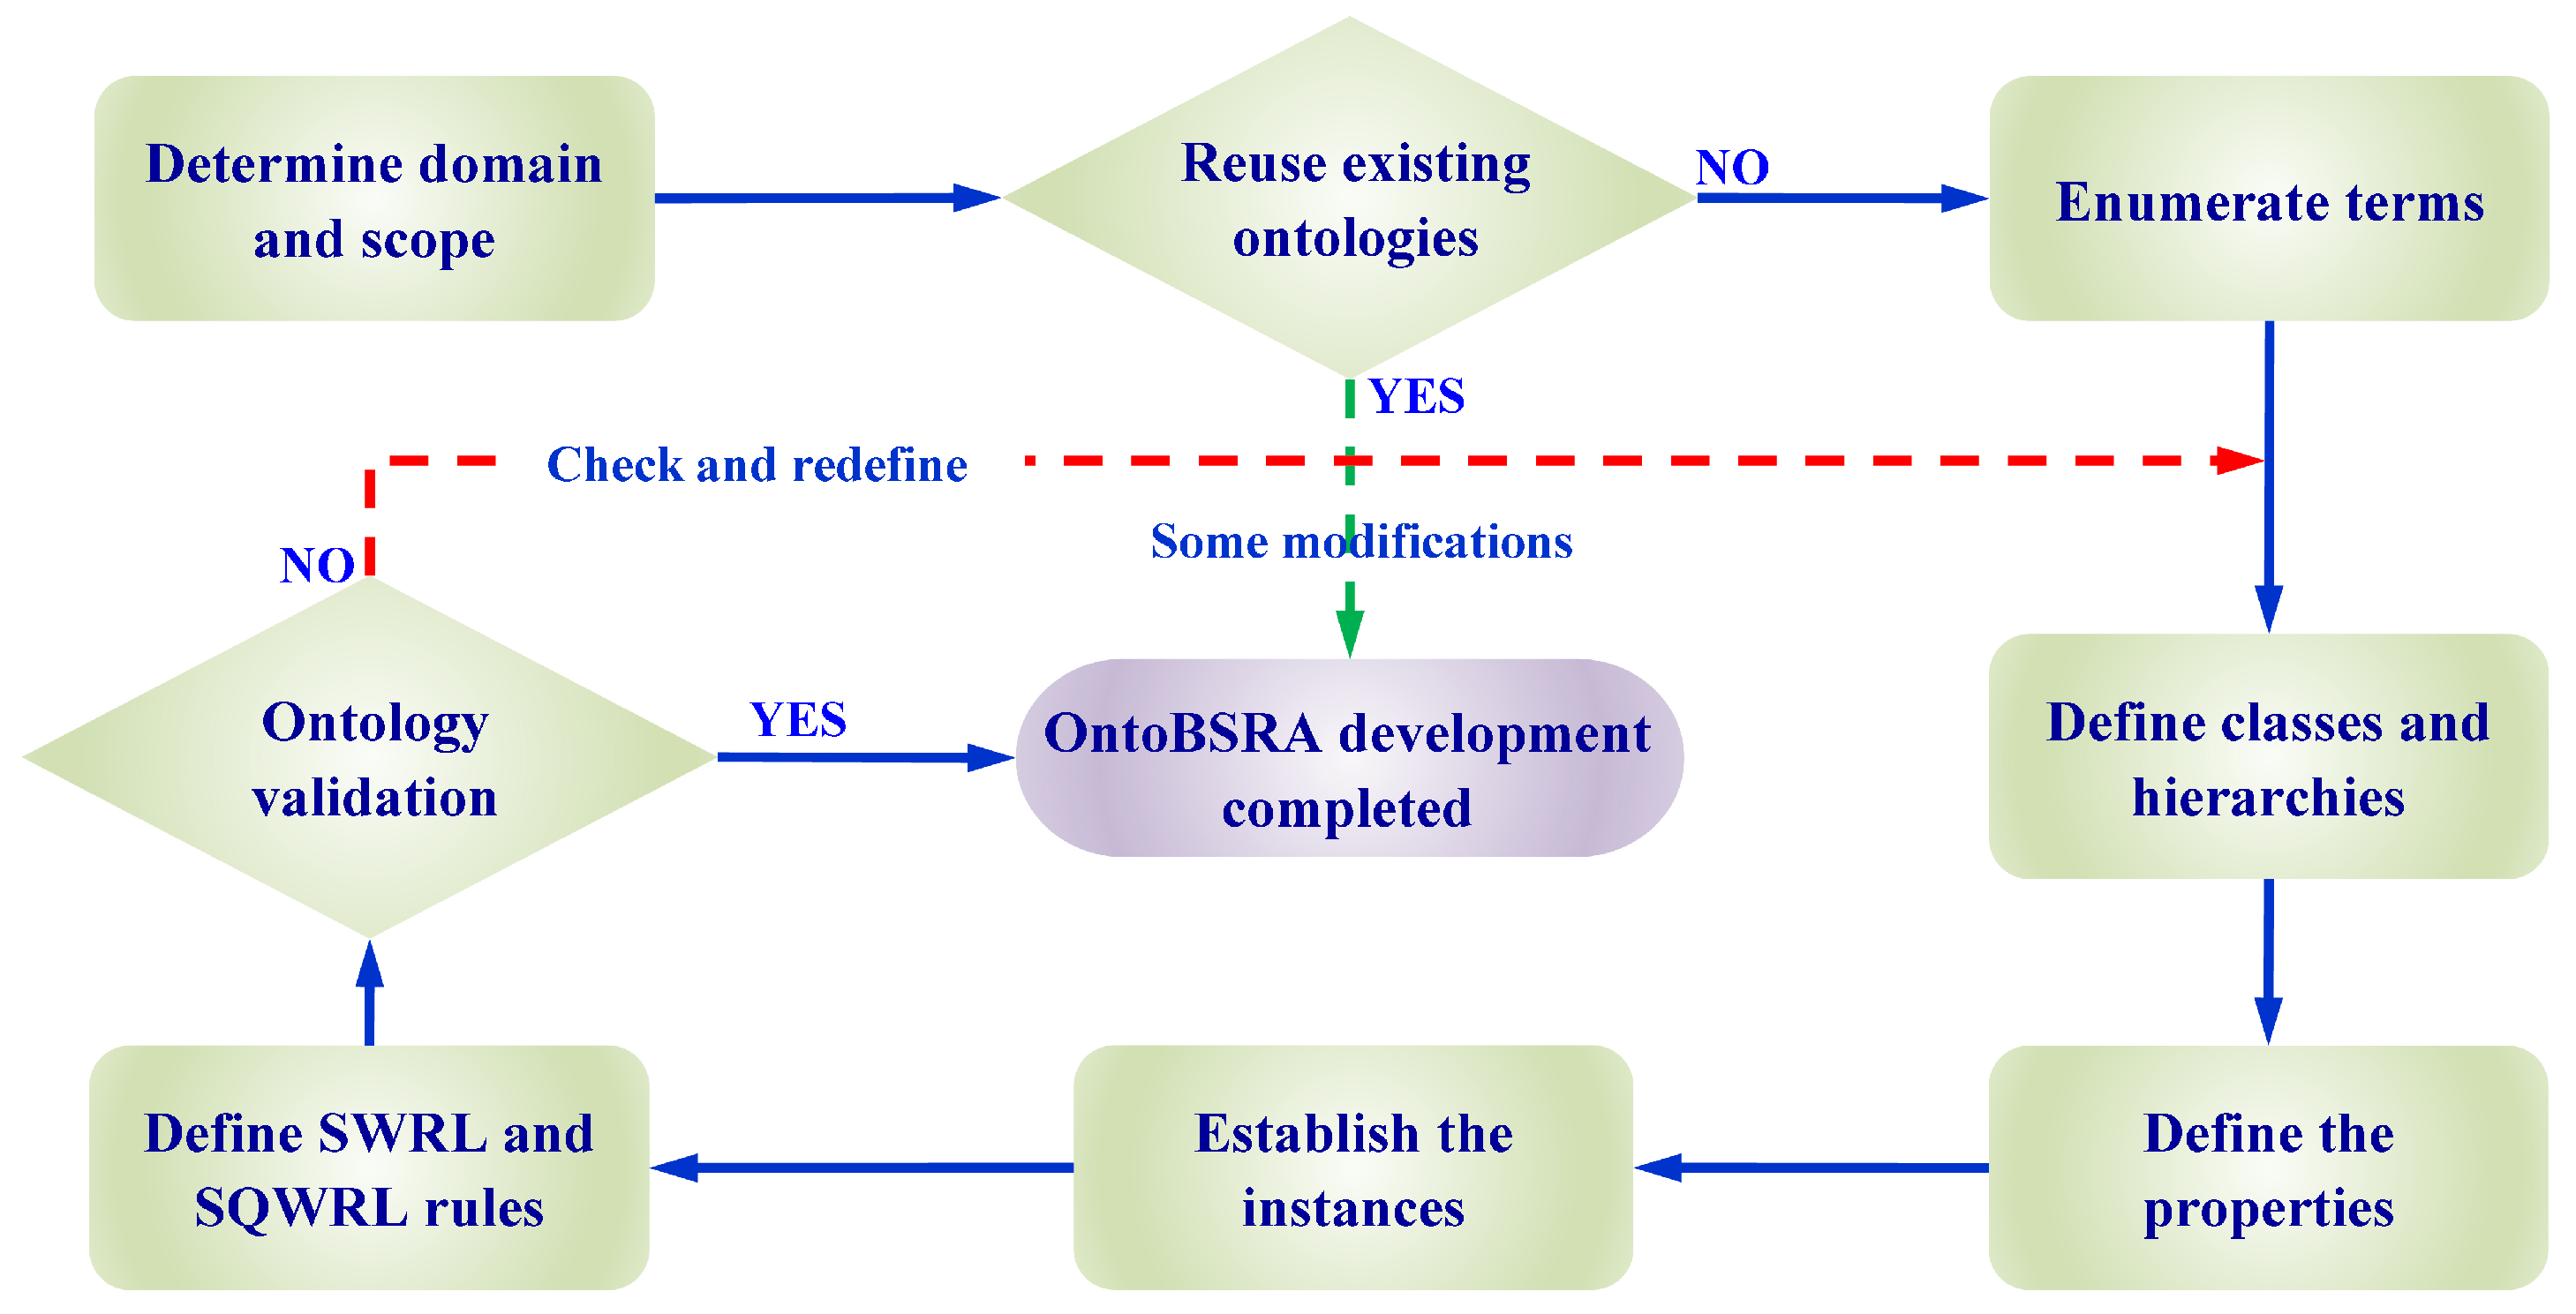
3.3. Development of the OntoBSRA

The methods used for developing the ontology include the Uschold and King method, the Gruninger and Fox method, the Methontology method, the KACTUS method, and the Ontology Development 101 method [50]. In this paper, the Ontology Development 101 method is employed, as shown in Figure 3. According to this method, new ontologies can be developed using the Protégé software by following specified steps or reusing the existing semantic resources and ontologies. The steps for developing the OntoBSRA are explained in details below.
  • Step 1. Determine the domain and scope of the OntoBSRA.
In the early design stage of the ontology, the following questions in Table 7 are raised to check whether the ontology involves enough information to correct any missing and wrong information.
  • Step 2. Consider reusing the existing ontologies.
Newly developed ontologies can share knowledge information with existing ontology models owing to the interactivity of the OWL language. Therefore, ontologies can be extended across multiple disciplines for wider applications. In this study, the content structure of the OntoBSRA is designed based on the common characteristics of existing ontology frameworks and the semantic rule language [33,34,35,39,50] in order to avoid unnecessary mistakes in developing a new ontology. The content structure of the OntoBSRA is shown in Figure 4.
  • Step 3. Enumerate important terms for the OntoBSRA.
In this step, a glossary of knowledge fields such as seismic risk probabilities, economic losses, and casualties is obtained by review and analysis of the basic terms in the relevant literature. Moreover, through extensive research, basic data in the relevant knowledge field, such as loss ratios, ratios of indirect losses to direct losses, casualty rates, personnel densities, etc., are summarized in this paper in tables, as shown in Section 3.2.
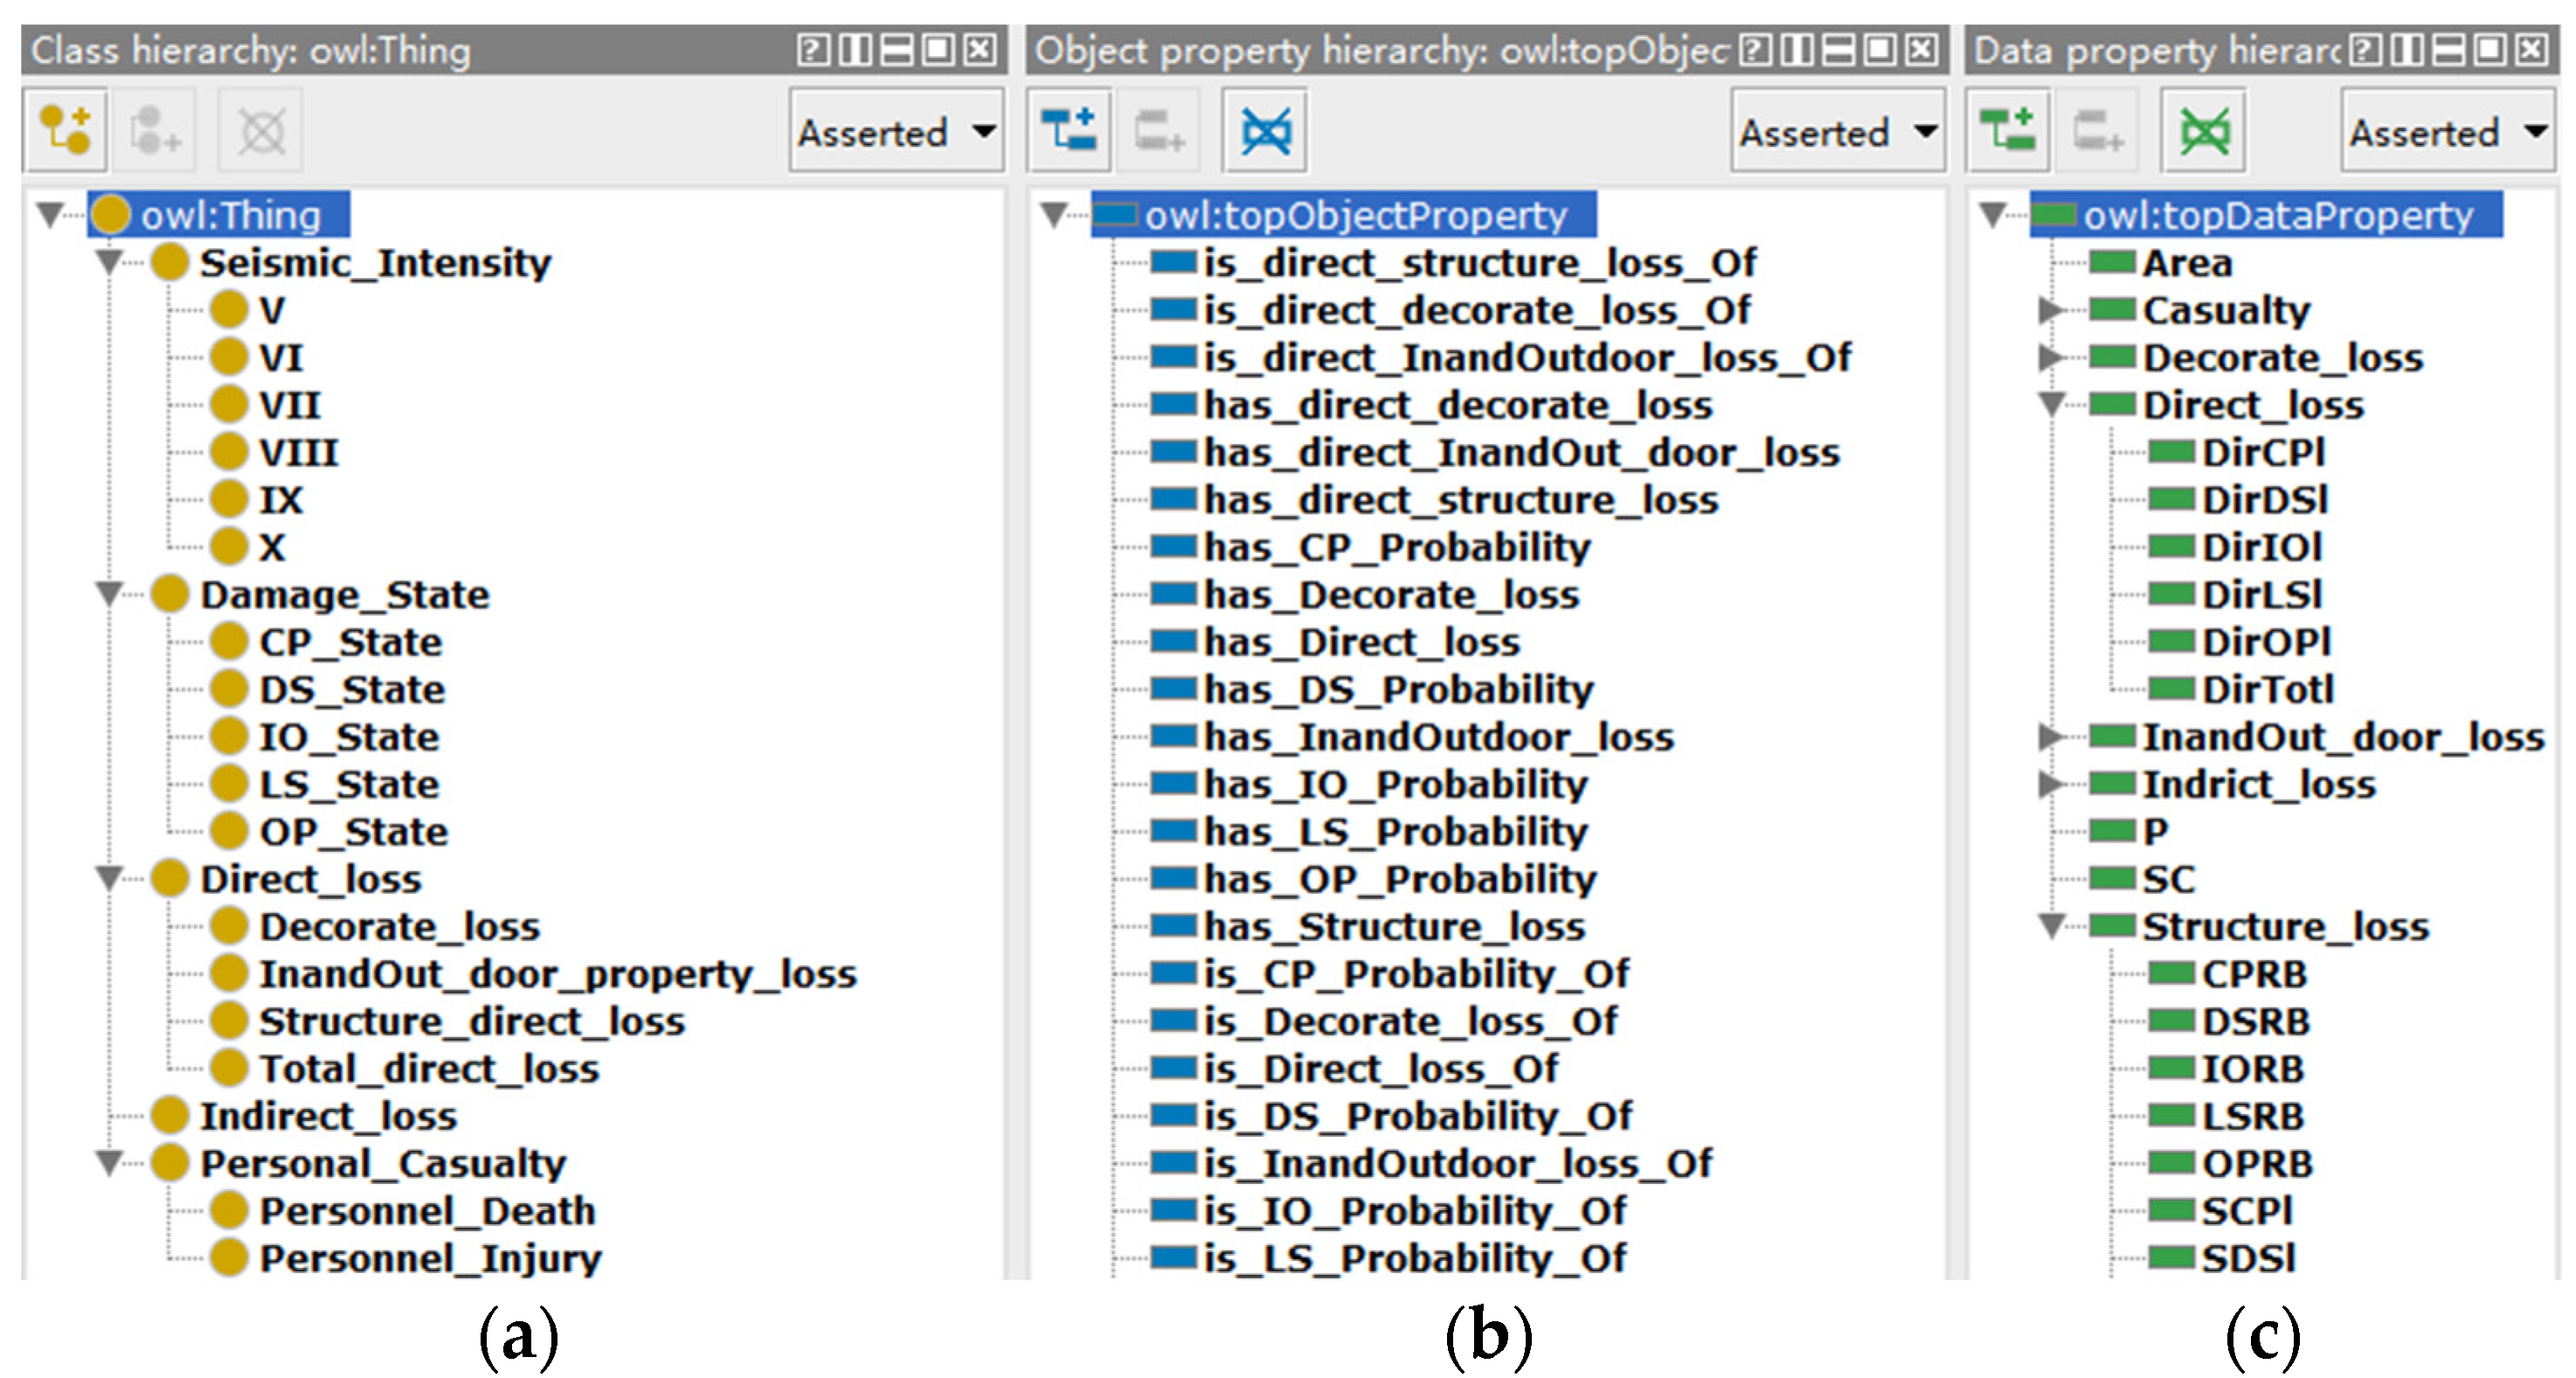
  • Step 4. Define classes and class hierarchies.
Defining the classes and class hierarchies is the primary stage in the process of developing an ontology. In this paper, a top-down method is adopted to define the classes. The superclasses for seismic intensities, damage states, direct losses, indirect losses, casualties, etc., are first created. Each superclass is then refined to establish subclasses. The specific details are shown in Figure 5a.
  • Step 5. Define the properties of classes.
The OntoBSRA includes two types of properties, namely, the object property and the data property. The object property represents the relationship among different classes, such as ‘has OP Probability’ and ‘is OP Probability Of’. The data property represents the characteristics of instances quantitatively and qualitatively; its data type includes Number, String, Boolean and Enumerated. In the OntoBSRA, the data property is adopted to describe the created instances quantitatively, and the data format adopts the “float” type, e.g., the risk probability of the LS performance level is 0.260f. Figure 5b,c shows the detailed object and data properties.
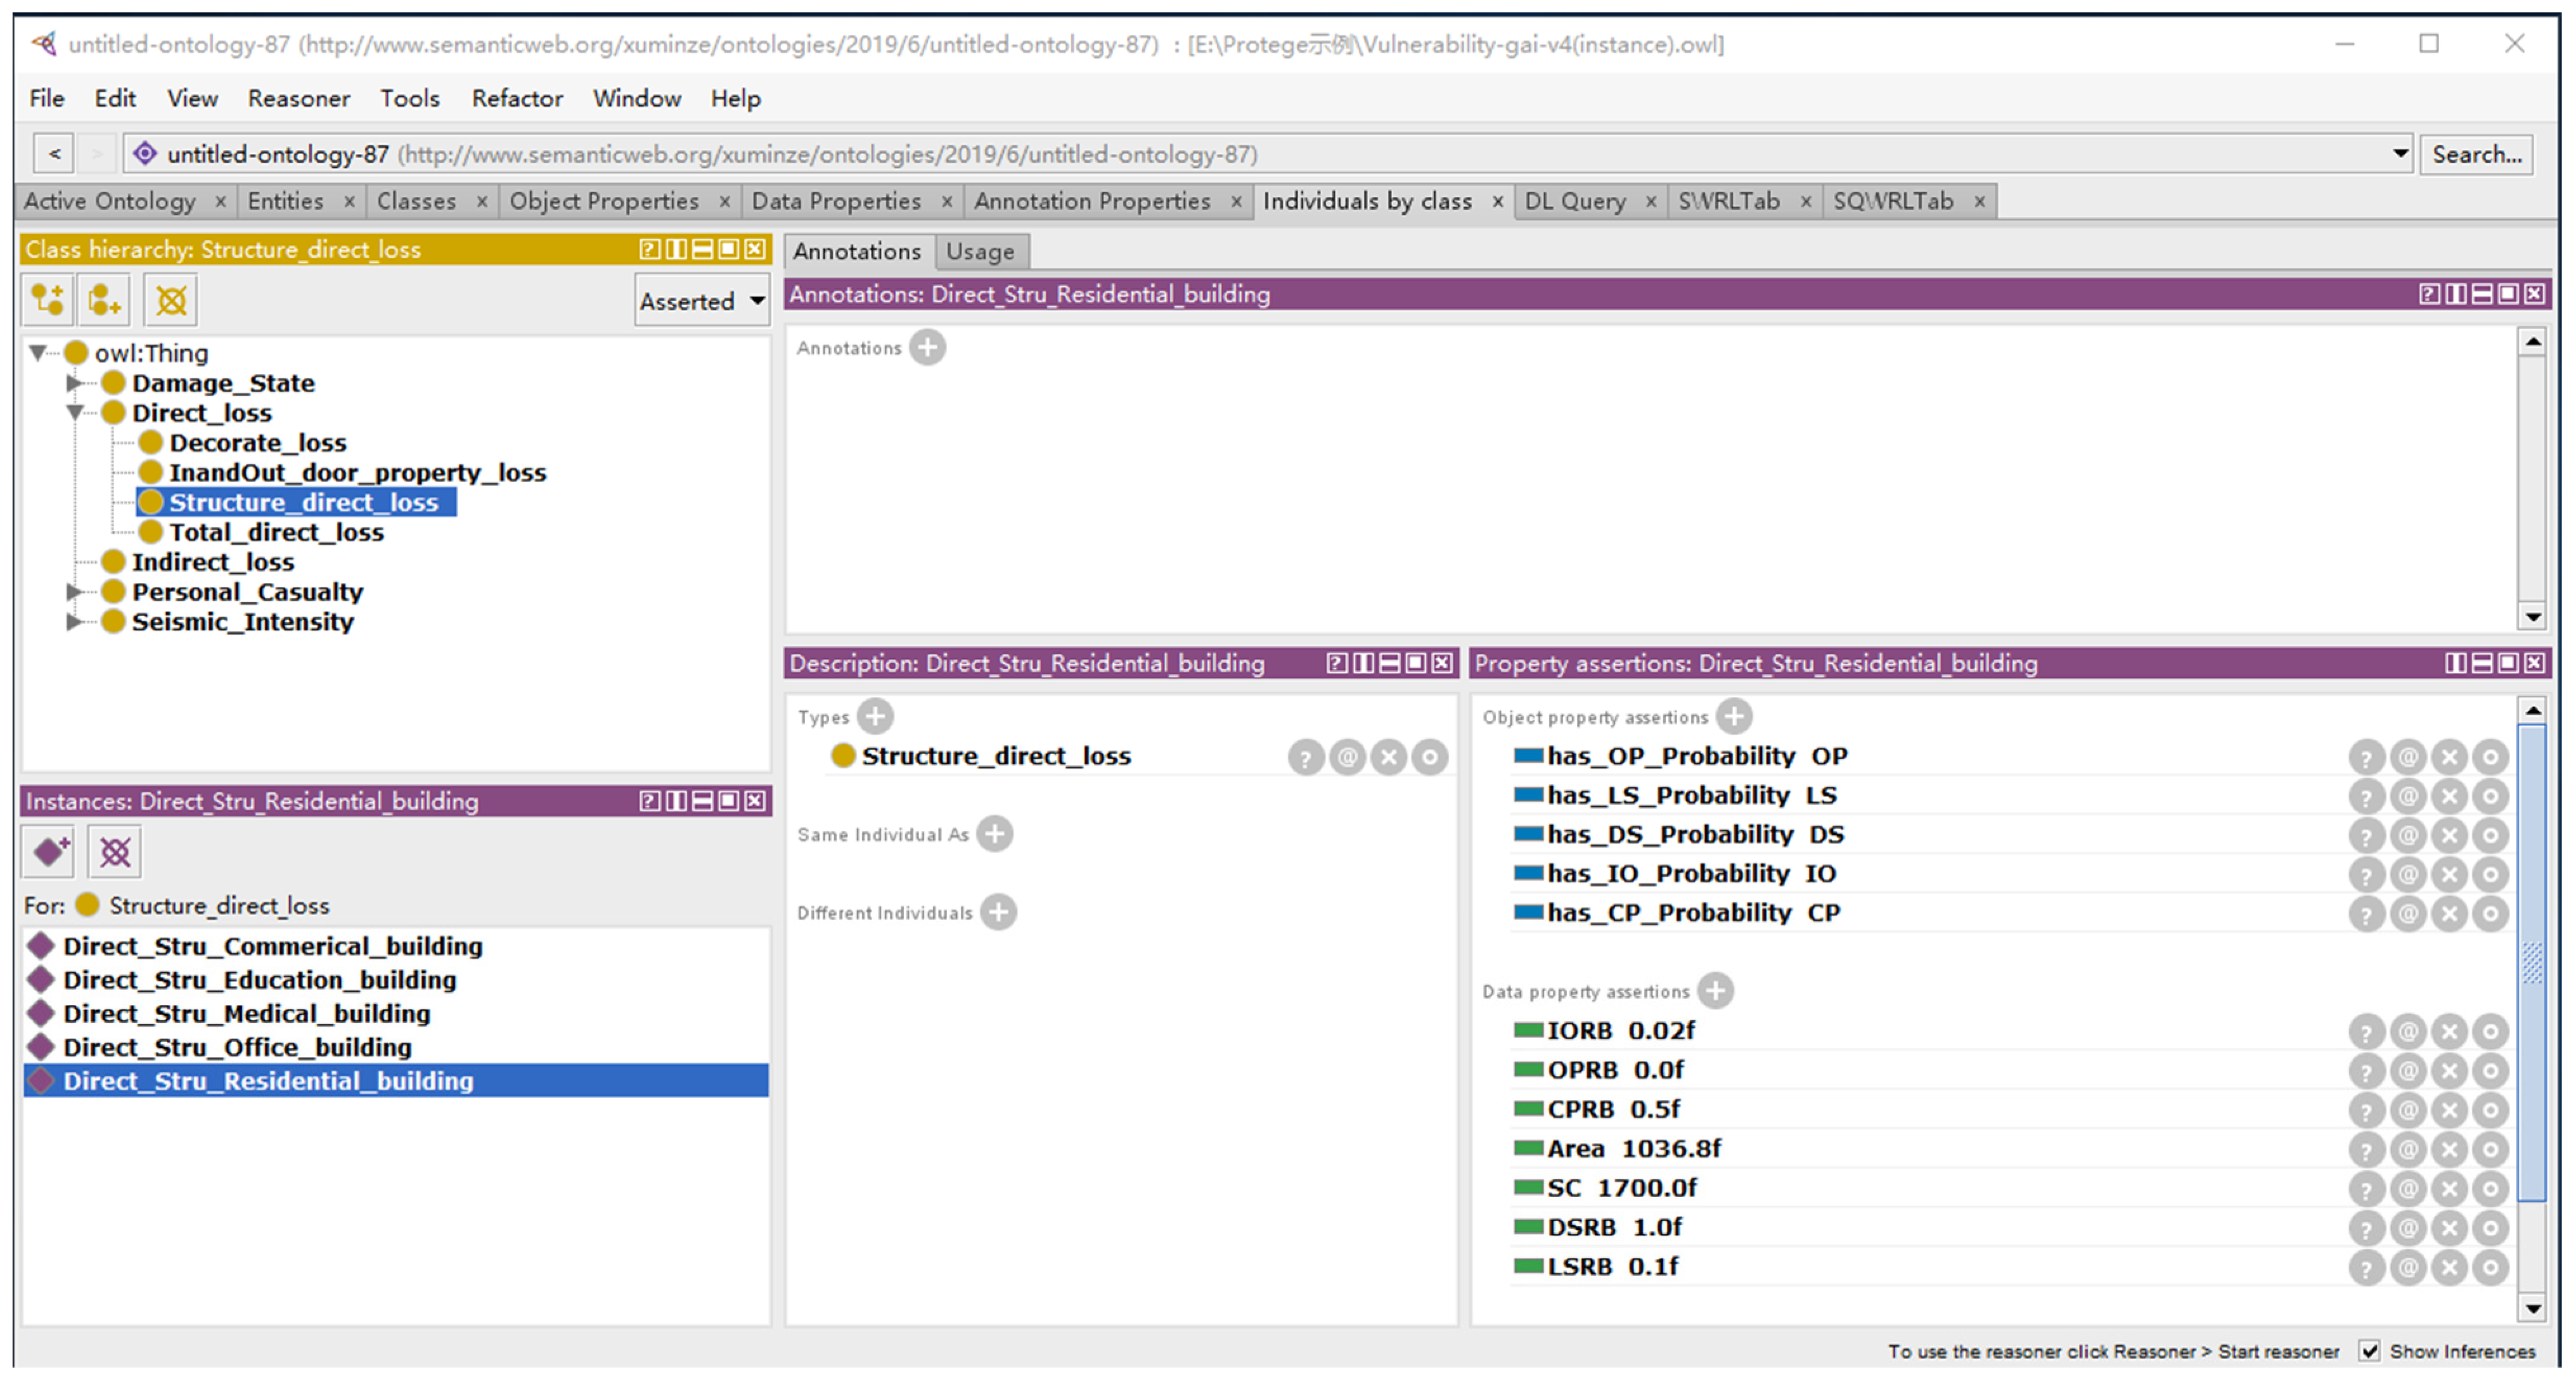
  • Step 6. Establish instances.
The instances in the classes have their own locations and hierarchies, and the object property and data property of instances must be defined in OntoBSRA. In OntoBSRA, different building types such as residential buildings, medical buildings, commercial buildings, office buildings, and educational buildings are established as instances in the classes. The basic data, such as loss ratios and casualty rates, are manually input in the established instances, while the evaluation indices, such as direct losses and casualties, need to be inferred by the inference machine using the SWRL rules. Figure 6 shows the instances in the class of the structural losses.
  • Step 7. Define SWRL rules.
SWRL rules can represent the relationship among the classes and meet the reasoning requirements of the ontology. There are Class atoms, Individual Property atoms, Data Valued Property atoms, and Built-in atoms in the OntoBSRA, all of which are connected by the symbol “^”. The symbol “?” represents variables, and the antecedent and the consequence are connected by the symbol “→”. Furthermore, computing ability can be realized through the SWRL rules in SWRLTab interface of the Protégé software. For example, the SWRL rule of the structural losses in the OP performance level is shown below.
EquationSLds,1 = A × SC × Pds,1 × RBds,1
SWRLStructure_direct_loss(?SDl)^SC(?SDl,?sc)^Area(?SDl,?A)^OPRB(?SDl,?S_OPR-
B) ^ has_OP_Probability(?SDl, ?OPstate) ^ OP_State(?OPstate) ^P(?OPstate,?O-
P_Probability) ^ swrlb: multiply (?S_OPl, ?sc, ?A, ?S_OPRB, ?OP_Probability) ->SOPl(?SDl, ?S_OPl)
  • Step 8. Define SQWRL rules
The query function is implemented by the SQWRL rules. In the Protégé software, the SQWRLTab interface is adopted to compile the SQWRL rules, compare the results of the ontology inference, and query and filter out the information of interest. For example, the SQWRL rule of the structural losses in different damage states is shown below.
SQWRLStructure_direct_loss(?SDl) ^ SOPl (?SDl, ?S_OPl) ^ SIOl (?SDl, ?S_IOl) ^ SLSl (?SDl, ?S_LSl) ^ SCPl (? SDl, ?SCPl) ^ SDSl (?SDl, ?S_DSl) ^ STotl (?SDl, ?S_Totl) -> sqwrl: select(?SDl, ?S_OPl, ?S_IOl, ?S_LSl, ?S_CPl, ?S_DSl, ?S_Totl)
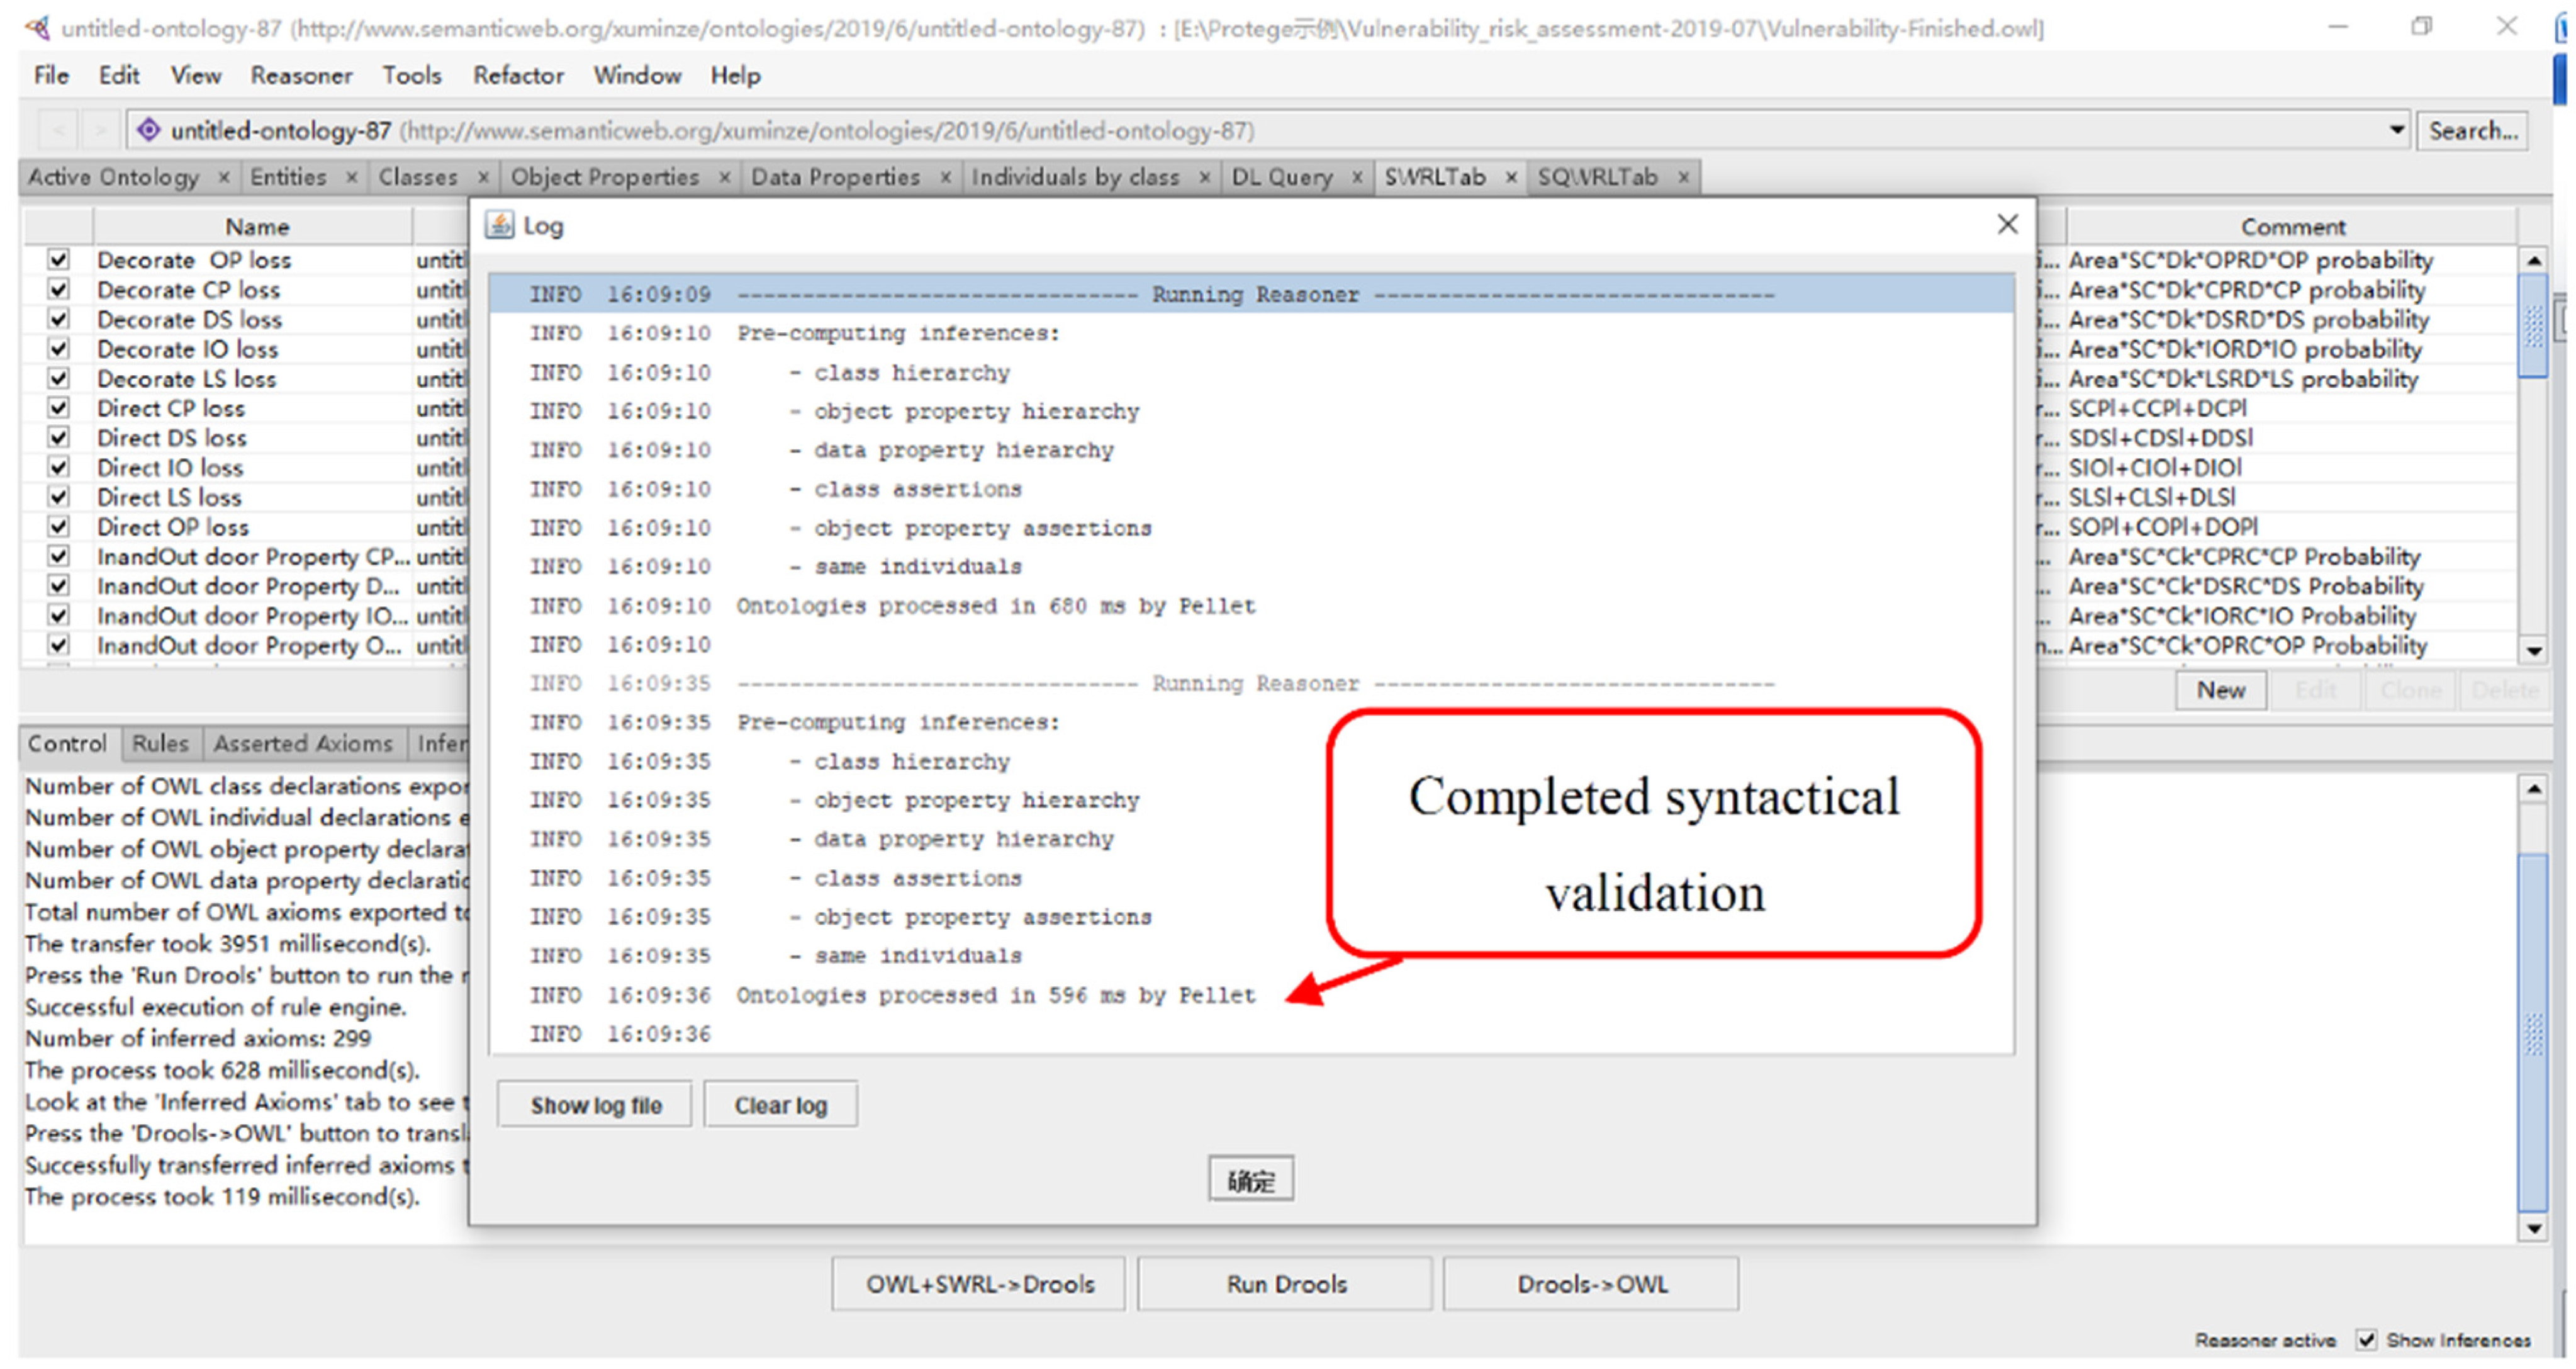
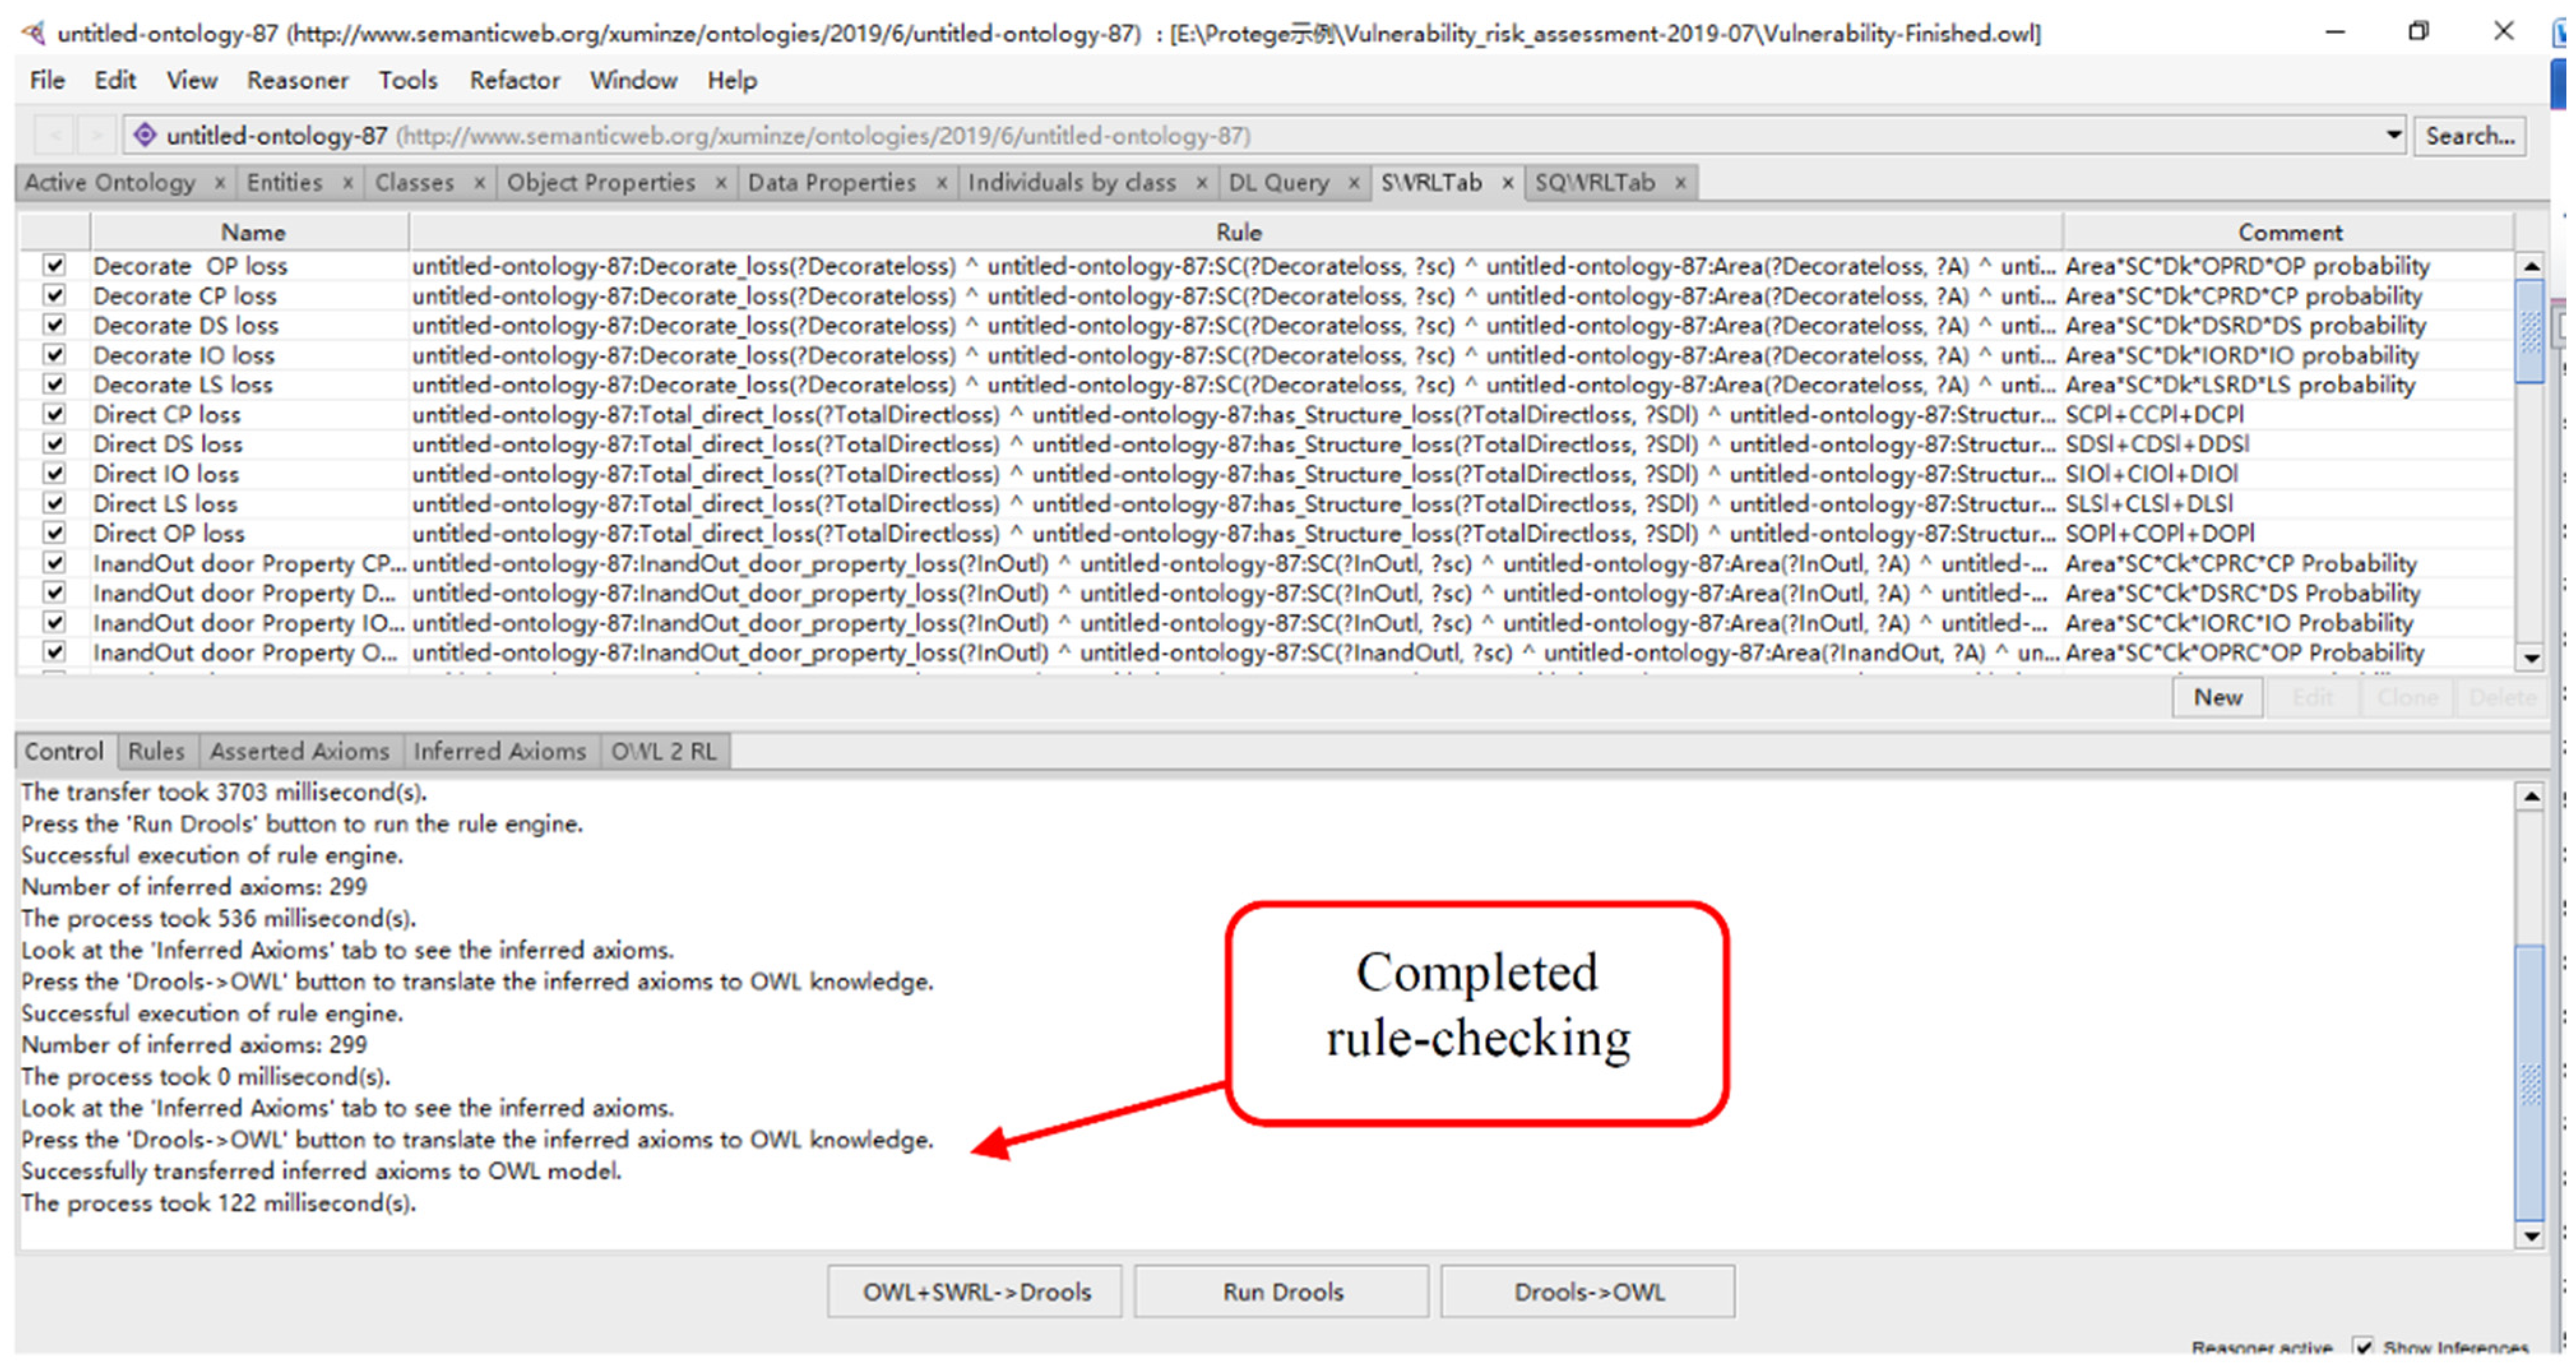
  • Step 9. Ontology validation.
Syntactical validation.
Syntactical validation is conducted to ensure a correct hierarchical structure and logical relationship which can infer and calculate the explicit and implicit relationships and data accurately in the developed ontology [51]. In this study, the pellet reasoner in the Protégé software is used to complete the syntactical validation. The schematic diagram of successful syntactical validation is shown in Figure 7.
Rule validation.
Rule validation is conducted to make sure that the developed rules are compatible with the OntoBSRA and can carry out logical inference and data calculation correctly. In this study, the SWRLTab plug-in in the Protégé software is adopted for the rule-checking. The schematic diagram of successful rule validation is shown in Figure 8.

4. Case Study

In this section, an example using a single residential building is provided to illustrate the application of the presented framework for predicting the seismic risk of a building and to demonstrate the validity of the semantic web rules. The residential building is a five-story RC frame structure with an area of 1036.8 m2 and a unit cost of 1700 USD/m2. The seismic precautionary intensity of the region is grade VIII. The building model is shown in Figure 9.

4.1. Seismic Risk Probability of the Building

Current methods used for probabilistic seismic demand analysis include the cloud method, strip method, IDA method, etc. Of those methods, the IDA method can simulate the whole collapse process of a structure subjected to seismic action [52], and is consequently adopted here for seismic demand analysis.
On the basis of the IDA of the structure determined by the OpenSees finite element platform, the exceeding probability and occurrence probability curves in various damage states were obtained using Equations (1)–(3) and the thresholds of the damage states specified in Table 1, as shown in Figure 10 and Figure 11, respectively.
According to Equation (4), the occurrence curves were converted into a probability matrix related to the seismic intensity, as shown in Table 8.
Furthermore, through seismic hazard analysis using Equation (5), the occurrence probabilities of the seismic intensity over 50 years were determined as summarized in Table 9.
Considering the vulnerability and the seismic hazard, the seismic risk probabilities of the building in different damage states were obtained according to Equation (6) as shown in Table 10.

4.2. Application of the OntoBSRA

The seismic risk probabilities obtained from the analysis in Section 4.1 were manually input into the OntoBSRA, and new facts were generated by running the pre-set SWRL rules. The main SWRL rules based on the evaluation index equation in Section 3.2 are shown in Table 11. Taking the decoration property losses as an example, the new facts shown in Figure 12 were deduced by running the pre-set SWRL rules, thus validating the correction of syntax and SWRL rules for decoration property losses.
Moreover, the specialized assessment results can be queried using the SQWRL rules according to the user’s demand. Table 12 shows the SQWRL querying command for the assessment indicators of the OntoBSRA. In the application of the OntoBSRA, if the users/stakeholders attach importance to the economic losses (such as direct losses), the assessment results can be obtained by running the pre-set SQWRL rule Q4 in Table 12. The querying results are illustrated in Figure 13. Furthermore, if users/stakeholders pay more attention to the casualties, they can run the SQWRL rules Q6 and Q7 to obtain the assessment results. The querying results of the number of injuries is shown in Figure 14. It can be seen from Figure 13 and Figure 14 that the OntoBSRA system can provide the total economic losses or casualties as well as the related assessment indicators of buildings in different damage states. This function can assist engineers, provide guidance on earthquake hazard mitigation, and improve efficiency in decision-making.
To assess the seismic risk of the building comprehensively, users/stakeholders can query direct losses, indirect losses, and casualties by running all the SQWRL rules in Table 12 according to building type. The querying results for the building in this case study are shown in Table 13.
In addition, it should be noted that although numerical simulation-based seismic vulnerability analysis can evaluate the seismic performance of buildings, it cannot assess seismic risk from the macro perspective. This has been verified by comparison between numerical and ontology-based results. On the other hand, the developed OntoBSRA system can achieve seismic risk assessment of buildings with various functions in different damage states (such as direct losses, indirect losses and casualties) from the macro perspective, and is thus beneficial in decision-making based on the principle of targeted-risk.

5. Conclusions

This paper has developed an ontology-based probabilistic framework for seismic risk assessment of buildings. In the developed framework, seismic risk probabilities are first obtained based on vulnerability analysis and seismic hazard analysis. Then, the developed OntoBSRA system is used to integrate the knowledge on seismic risk assessments of buildings into a unified knowledge base by combining the ontology with SWRL, which achieved automated seismic risk prediction (such as direct losses, indirect losses, and casualties) of buildings with various purposes in different damage states. In this way, over-reliance on identification of the damage states of buildings after earthquake can be avoided. Based on the developed framework, risk assessors and asset managers can estimate the consequences of earthquakes effectively within a certain period considering the actual construction cost, thus providing guidance on earthquake prevention and mitigation and improving efficiency in decision-making.
A case study of a residential RC frame structure has been conducted to illustrate the detailed application of the proposed framework to predict seismic risk as quantified by indexes including direct losses, indirect, losses and casualties, demonstrating the validity of the semantic web rules.
It should be noted that the OntoBSRA proposed in this paper was developed based only on the seismic damage information of RC structures. Our future work will focus on the extension of OntoBSRA using knowledge information related to other structures, such as wood structures, brick–concrete structures, etc., and the development of data interfaces between the BIM, Protégé software, and finite element software in order to avoid tedious manual data input in OntoBSRA.

Author Contributions

Conceptualization and methodology, M.X.; software, C.C. and P.Z.; validation, M.X., P.Z. and J.Z.; data curation, J.Z.; writing—original draft preparation, M.X.; writing—review and editing, C.C.; supervision, C.C. and P.Z.; funding acquisition, C.C. All authors have read and agreed to the published version of the manuscript.

Funding

This research is funded by the National Key Research and Development Program of China (Grant No. 2021YFB2601102), the National Natural Science Foundation of China (Grant No. 51878109 & 51578100), and the Special Foundation for ‘Double First-Class’ Construction Project (Grant No. BSCXXM022).

Institutional Review Board Statement

Not applicable.

Informed Consent Statement

Not applicable.

Data Availability Statement

The data reported in this article are available from the corresponding author upon request.

Conflicts of Interest

The authors declare no conflict of interest.

References

  1. Jaiswal, K.S.; Bausch, D.; Chen, R.; Bouabid, J.; Seligson, H. Estimating Annualized Earthquake Losses for the Conterminous United States. Earthq. Spectra 2015, 31, S221–S243. [Google Scholar] [CrossRef]
  2. Cui, C.; Meng, K.; Xu, C.; Wang, B.; Xin, Y. Vertical vibration of a floating pile considering the incomplete bonding effect of the pile-soil interface. Comput. Geotech. 2022, 150, 104894. [Google Scholar] [CrossRef]
  3. Dai, K.-Y.; Liu, C.; Lu, D.-G.; Yu, X.-H. Experimental investigation on seismic behavior of corroded RC columns under artificial climate environment and electrochemical chloride extraction: A comparative study. Constr. Build. Mater. 2020, 242, 118014. [Google Scholar] [CrossRef]
  4. Tian, K.; Liu, W.; Feng, D.; Yang, Q. Dynamic characteristic analysis and shaking table test for a curved surface isolated structure. Eng. Struct. 2019, 203, 109847. [Google Scholar] [CrossRef]
  5. Meng, K.; Cui, C.; Liang, Z. A new approach for longitudinal vibration of a large-diameter floating pipe pile in visco-elastic soil considering the three-dimensional wave effects. Comput. Geotech. 2020, 128, 103840. [Google Scholar] [CrossRef]
  6. Chen, J.; Wan, Z. A compatible probabilistic framework for quantification of simultaneous aleatory and epistemic uncertainty of basic parameters of structures by synthesizing the change of measure and change of random variables. Struct. Saf. 2019, 78, 76–87. [Google Scholar] [CrossRef]
  7. Celik, O.C.; Ellingwood, B.R. Seismic fragilities for non-ductile reinforced concrete frames—Role of aleatoric and epistemic uncertainties. Struct. Saf. 2010, 32, 1–12. [Google Scholar] [CrossRef]
  8. Gautam, D.; Rupakhety, R.; Adhikari, R. Empirical fragility functions for Nepali highway bridges affected by the 2015 Gorkha Earthquake. Soil. Dyn. Earthq. Eng. 2019, 126, 105778. [Google Scholar] [CrossRef]
  9. Lu, D.; Yu, X.; Jia, M.; Wang, G. Seismic risk assessment for a reinforced concrete frame designed according to Chinese codes. Struct. Infrastruct. Eng. 2013, 10, 1295–1310. [Google Scholar] [CrossRef]
  10. Gautam, D.; Rupakhety, R. Empirical seismic vulnerability analysis of infrastructure systems in Nepal. Bull. Earthq. Eng. 2021, 19, 6113–6127. [Google Scholar] [CrossRef]
  11. Koutsourelakis, P. Assessing structural vulnerability against earthquakes using multi-dimensional fragility surfaces: A Bayesian framework. Probabilistic Eng. Mech. 2009, 25, 49–60. [Google Scholar] [CrossRef]
  12. Cimellaro, G.P.; Reinhorn, A.M. Multidimensional Performance Limit State for Hazard Fragility Functions. J. Eng. Mech. 2011, 137, 47–60. [Google Scholar] [CrossRef]
  13. Michel, C.; Guéguen, P.; Causse, M. Seismic vulnerability assessment to slight damage based on experimental modal parameters. Earthq. Eng. Struct. Dyn. 2011, 41, 81–98. [Google Scholar] [CrossRef]
  14. Ruggieri, S.; Porco, F.; Uva, G.; Vamvatsikos, D. Two frugal options to assess class fragility and seismic safety for low-rise reinforced concrete school buildings in Southern Italy. Bull. Earthq. Eng. 2021, 19, 1415–1439. [Google Scholar] [CrossRef]
  15. Gentile, R.; Galasso, C. Simplicity versus accuracy trade-off in estimating seismic fragility of existing reinforced concrete buildings. Soil Dyn. Earthq. Eng. 2021, 144, 106678. [Google Scholar] [CrossRef]
  16. Silva, V.; Akkar, S.; Baker, J.; Bazzurro, P.; Castro, J.M.; Crowley, H.; Dolsek, M.; Galasso, C.; Lagomarsino, S.; Monteiro, R.; et al. Current Challenges and Future Trends in Analytical Fragility and Vulnerability Modeling. Earthq. Spectra 2019, 35, 1927–1952. [Google Scholar] [CrossRef]
  17. Bakhshi, A.; Asadi, P. Probabilistic evaluation of seismic design parameters of RC frames based on fragility curve. Sci. Iran. 2013, 20, 231–241. [Google Scholar] [CrossRef]
  18. Karapetrou, S.; Fotopoulou, S.; Pitilakis, K. Seismic Vulnerability of RC Buildings under the Effect of Aging. Procedia Environ. Sci. 2017, 38, 461–468. [Google Scholar] [CrossRef]
  19. Yu, X.-H.; Lu, D.-G.; Li, B. Relating Seismic Design Level and Seismic Performance: Fragility-Based Investigation of RC Moment-Resisting Frame Buildings in China. J. Perform. Constr. Facil. 2017, 31, 4017075. [Google Scholar] [CrossRef]
  20. Dowrick, D.J. Earthquake Resistant Design and Risk Reduction; Wiley: Hoboken, NJ, USA, 2009. [Google Scholar]
  21. Cornell, C.A.; Jalayer, F.; Hamburger, R.O.; Foutch, D.A. Probabilistic Basis for 2000 SAC Federal Emergency Management Agency Steel Moment Frame Guidelines. J. Struct. Eng. 2002, 128, 526–533. [Google Scholar] [CrossRef] [Green Version]
  22. Cornell, C.A.; Krawinkler, H. Progress and challenges in seismic performance assessment. PEER Cent. News 2000, 3, 1–4. [Google Scholar] [CrossRef]
  23. Moehle, J.; Deierlein, G.G. A framework for performance-based earthquake resistive design. In Proceedings of the 13th World Conference on Earthquake Engineering, Vancouver, BC, Canada, 1–6 August 2004. [Google Scholar]
  24. Federal Emergency Management Agency (FEMA). Seismic Performance Assessment of Buildings; Applied Technology Council: Redwood City, CA, USA, 2012.
  25. Lu, D.-G.; Liu, Y.; Yu, X.-H. Seismic fragility models and forward-backward probabilistic risk analysis in second-generation performance-based earthquake engineering. Eng. Mech. 2019, 36, 1–11. (In Chinese) [Google Scholar] [CrossRef]
  26. ISO 31000; Risk management-Guidelines. ISO: Geneva, Switzerland, 2018.
  27. Wang, G.-Y.; Cheng, G.-D.; Shao, Z.-M. Optimal Fortification Intensity and Reliability of Anti-Seismic Struct; Science Press: Beijing, China, 1999. [Google Scholar]
  28. Spence, R.; So, E.; Jenny, S.; Castella, H.; Ewald, M.; Booth, E. The Global Earthquake Vulnerability Estimation System (GEVES): An approach for earthquake risk assessment for insurance applications. Bull. Earthq. Eng. 2008, 6, 463–483. [Google Scholar] [CrossRef]
  29. Sahar, L.; Muthukumar, S.; French, S.P. Using Aerial Imagery and GIS in Automated Building Footprint Extraction and Shape Recognition for Earthquake Risk Assessment of Urban Inventories. IEEE Trans. Geosci. Remote Sens. 2010, 48, 3511–3520. [Google Scholar] [CrossRef]
  30. Lu, X.; Zeng, X.; Xu, Z.; Guan, H. Improving the Accuracy of near Real-Time Seismic Loss Estimation using Post-Earthquake Remote Sensing Images. Earthq. Spectra 2018, 34, 1219–1245. [Google Scholar] [CrossRef]
  31. Xiong, C.; Li, Q.; Lu, X. Automated regional seismic damage assessment of buildings using an unmanned aerial vehicle and a convolutional neural network. Autom. Constr. 2020, 109, 102994. [Google Scholar] [CrossRef]
  32. Ruggieri, S.; Cardellicchio, A.; Leggieri, V.; Uva, G. Machine-learning based vulnerability analysis of existing buildings. Autom. Constr. 2021, 132, 103936. [Google Scholar] [CrossRef]
  33. Hou, S.; Li, H.; Rezgui, Y. Ontology-based approach for structural design considering low embodied energy and carbon. Energy Build. 2015, 102, 75–90. [Google Scholar] [CrossRef]
  34. Tserng, H.P.; Yin, S.Y.L.; Dzeng, R.-J.; Wou, B.; Tsai, M.D.; Chen, W.Y. A study of ontology-based risk management framework of construction projects through project life cycle. Autom. Constr. 2009, 18, 994–1008. [Google Scholar] [CrossRef]
  35. Fidan, G.; Dikmen, I.; Tanyer, A.M.; Birgonul, M.T. Ontology for Relating Risk and Vulnerability to Cost Overrun in International Projects. J. Comput. Civ. Eng. 2011, 25, 302–315. [Google Scholar] [CrossRef]
  36. Scheuer, S.; Haase, D.; Meyer, V. Towards a flood risk assessment ontology—Knowledge integration into a multi-criteria risk assessment approach. Comput. Environ. Urban Syst. 2013, 37, 82–94. [Google Scholar] [CrossRef]
  37. Du, J.; He, R.; Sugumaran, V. Clustering and ontology-based information integration framework for surface subsidence risk mitigation in underground tunnels. Clust. Comput. 2016, 19, 2001–2014. [Google Scholar] [CrossRef]
  38. Ding, L.; Zhong, B.; Wu, S.; Luo, H. Construction risk knowledge management in BIM using ontology and semantic web technology. Saf. Sci. 2016, 87, 202–213. [Google Scholar] [CrossRef]
  39. Meng, K.; Cui, C.; Li, H. An Ontology Framework for Pile Integrity Evaluation Based on Analytical Methodology. IEEE Access 2020, 8, 72158–72168. [Google Scholar] [CrossRef]
  40. Li, H.; Cheng, H.; Wang, D. A review of advances in seismic fragility research on bridge structures. Eng. Mech. 2018, 35, 1–16. (In Chinese) [Google Scholar] [CrossRef]
  41. Ministry of Transport of the People’s Republic of China. Code for Seismic Design of Buildings; China Architecture & Building Press: Beijing, China, 2010.
  42. Mwafy, A.; Almorad, B. Verification of performance criteria using shake table testing for the vulnerability assessment of reinforced concrete buildings. Struct. Des. Tall Spéc. Build. 2019, 28, e1601. [Google Scholar] [CrossRef]
  43. Federal Emergency Management Agency. NEHRP Guidelines for the Seismic Rehabilitation of Buildings; Federal Emergency Management Agency: Redwood City, CA, USA, 2009.
  44. Worden, C.B.; Gerstenberger, M.C.; Rhoades, D.; Wald, D. Probabilistic Relationships between Ground-Motion Parameters and Modified Mercalli Intensity in California. Bull. Seism. Soc. Am. 2012, 102, 204–221. [Google Scholar] [CrossRef]
  45. Gao, X.-W.; Bao, A.-B. Probabilistic model and its statistical parameters for seismic load. Earthq. Eng. Eng. Vib. 1985, 5, 13–22. (In Chinese) [Google Scholar] [CrossRef]
  46. Ma, Z.; Liu, Z. Ontology- and freeware-based platform for rapid development of BIM applications with reasoning support. Autom. Constr. 2018, 90, 1–8. [Google Scholar] [CrossRef]
  47. Kircher, C.A.; Whitman, R.V.; Holmes, W.T. HAZUS Earthquake Loss Estimation Methods. Nat. Hazards Rev. 2006, 7, 45–59. [Google Scholar] [CrossRef]
  48. Comerio, M. Earthquake Protection, 2nd Edition. Earthq. Spectra 2003, 19, 731–732. [Google Scholar] [CrossRef]
  49. Wang, D. Seismic Fragility Analysis and Probabilistic Risk Analysis of Steel Frame Structures. Ph.D. Thesis, Harbin Institute of Technology, Harbin, China, 2006. [Google Scholar]
  50. Zhang, J.; Li, H.; Zhao, Y.; Ren, G. An ontology-based approach supporting holistic structural design with the consideration of safety, environmental impact and cost. Adv. Eng. Softw. 2018, 115, 26–39. [Google Scholar] [CrossRef]
  51. Sirin, E.; Parsia, B.; Grau, B.C.; Kalyanpur, A.; Katz, Y. Pellet: A practical OWL-DL reasoner. SSRN Electron. J. SSRN Electron. J. 2007, 5, 51–53. [Google Scholar] [CrossRef]
  52. Pang, Y.; Wang, X. Cloud-IDA-MSA Conversion of Fragility Curves for Efficient and High-Fidelity Resilience Assessment. J. Struct. Eng. 2021, 147, 4021049. [Google Scholar] [CrossRef]
Figure 1. Seismic risk prediction framework flow chart.
Buildings 12 01391 g001
Figure 2. Schematic diagram of the OntoBSRA system.
Buildings 12 01391 g002
Figure 3. Procedure of the OntoBSRA development.
Buildings 12 01391 g003
Figure 4. Content structure of OntoBSRA.
Buildings 12 01391 g004
Figure 5. Development of OntoBSRA in Protégé-OWL 5.2. (a) Classes; (b) Object properties; (c) Data properties.
Buildings 12 01391 g005
Figure 6. Create instances.
Buildings 12 01391 g006
Figure 7. Syntactical validation of the OntoBSRA.
Buildings 12 01391 g007
Figure 8. Rule-checking.
Buildings 12 01391 g008
Figure 9. Model of the residential building.
Buildings 12 01391 g009
Figure 10. Exceeding probability curves.
Buildings 12 01391 g010
Figure 11. Occurrence probability curves.
Buildings 12 01391 g011
Figure 12. Inferred facts.
Buildings 12 01391 g012
Figure 13. Inference results of querying according to the SQWRL rule Q4 in Table 12.
Buildings 12 01391 g013
Figure 14. Inference results of querying according to the SQWRL rule Q7 in Table 12.
Buildings 12 01391 g014
Table 1. The thresholds of the different damage states.
No DamageSlight DamageModerate DamageExtensive DamageComplete Collapse
EDP ≤ 1/5501/550 < EDP ≤ 1%1% < EDP ≤ 2%2% < EDP ≤ 4%EDP > 4%
Table 2. Direct loss ratio.
Damage StatesNo
Damage
Slight
Damage
Moderate DamageExtensive DamageComplete
Collapse
Structural losses00.020.100.501.00
Indoor and Outdoor property losses00.010.050.200.60
Decoration property losses0.10.250.60.851
Table 3. Ratio of the replacement cost to the construction cost.
Building TypesResidential BuildingCommercial BuildingMedical BuildingOffice
Building
Educational Building
Indoor and Outdoor property0.20.11.51.01.0
Decoration property0.30.430.250.350.25
Table 4. Ratio of indirect losses to direct losses.
Damage StatesNo DamageSlight DamageModerate DamageExtensive DamageComplete Collapse
Ratio000.50–1.003.00–6.008.00–20.00
Table 5. Deaths and injury rates.
Damage StatesNo DamageSlight DamageModerate DamageExtensive DamageComplete Collapse
Death rate000–0.0010.001–0.010.02–0.3
Injury rate00–0.00050.0002–0.030.001–0.050.05–0.7
Table 6. Personnel density.
Building TypesResidential BuildingCommercial BuildingMedical BuildingOffice BuildingEducational Building
Personnel density (person/m2)0.330.720.910.41.12
Table 7. Question table for determining the domain and scope of the OntoBSRA.
QuestionsAnswers
What is the purpose of developing this ontology?To establish a unified knowledge base to enable rapid seismic risk assessments of buildings.
Who are the users of the developed ontology?The engineers with responsibility for seismic risk evaluation.
What is the premise behind OntoBSRA?Nonlinear time-domain analysis using finite element software, seismic vulnerability analysis, and seismic hazard analysis.
What types of structures is OntoBSRA developed for?Reinforced concrete structures.
How is seismic risk quantified by OntoBSRA?By economic losses (direct losses and indirect losses) and casualties.
Table 8. Vulnerability matrix.
IntensityVVIVIIVIIIIXX
None0.04820.00490.0002000
Slight0.91150.79030.46610.15800.02740.0023
Moderate0.03950.19130.43720.49140.26910.0712
Extensive0.00080.01340.09290.31220.50630.4010
Complete00.00010.00360.03840.19720.5255
Table 9. Occurrence probability of the seismic intensity.
IntensityVVIVIIVIIIIXX
Probability0.17380.43270.28630.08550.01360.0009
Table 10. Seismic risk probability.
Damage StatesNo
Damage
Slight DamageModerate DamageExtensive DamageComplete Collapse
Risk probability0.01060.64770.26050.06650.0075
Table 11. Main SWRL rules for the seismic risk assessment.
Rule NumberSWRL Rules
Rule 1Calculation of the total structural damage losses:
Structure_direct_loss(?SDl) ^ SOPl(?SDl, ?S_OPl) ^ SIOl(?SDl, ?S_IOl) ^ SLSl(?SDl, ?S_LSl) ^ SCPl(?SDl,?S_CPl) ^ DSl(?SDl,?S_DSl) ^ swrlb: add(?S_Totl, ?S_OPl, ?S_IOl, ?S_LSl, ?S_CPl,?S_DSl) ->STotl(?SDl,?S_Totl)
Rule 2Calculation of the total indoor and outdoor property losses:
InandOut_door_property_loss(?InOutl) ^ COPl(?InOutl, ?InOut_OPl) ^ CIOl(?InOutl, ?InOut_IOl) ^ CLSl(?InOutl, ?InOut_LSl) ^ CCPl(?InOutl, ?InOut_CPl) ^ CDSl(?InOutl, ?InOut_DSl) ^ swrlb:add(?InOut_Totl, ?InOut_OPl,?InOut_IOl,?InOut_LSl,?InOut_CPl,?InOut_DSl)->CTotl(?InOutl, ?InOut_Totl)
Rule 3Calculation of the total decoration property losses:
Decoration_loss(?Decorationloss) ^ DOPl(?Decorationloss, ?D_OPl) ^ DIOl(?Decorationloss, ?D_IOl) ^ DLSl(?Decorationloss, ?D_LSl) ^ DCPl(?Decorationloss, ?D_CPl) ^ DDSl(?Decorationloss, ?D_DSl) ^ swrlb:add(?D_Totl, ?D_OPl, ?D_IOl, ?D_LSl, ?D_CPl, ?D_DSl)->DTotl(?Decorationloss, ?D_Totl)
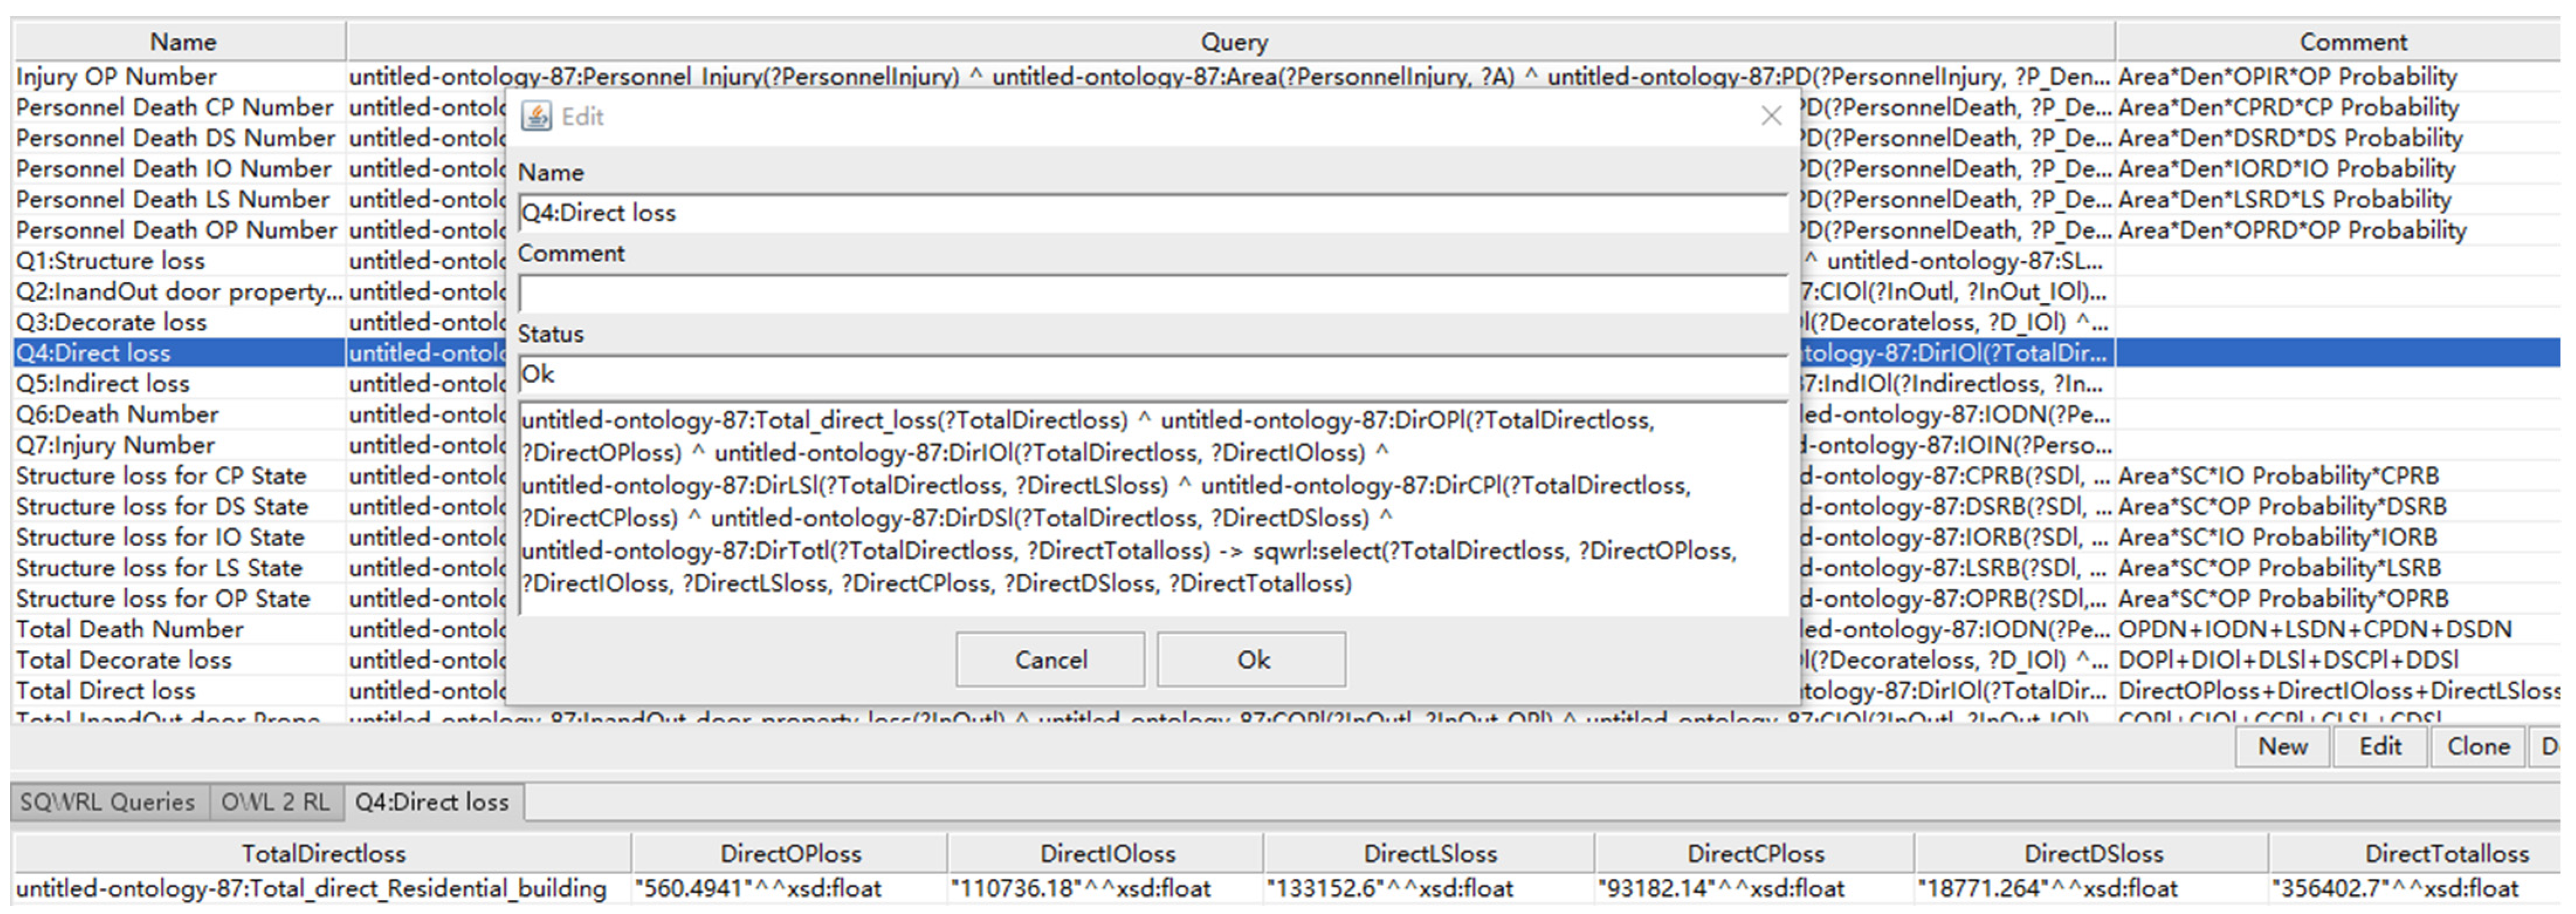
Rule 4Calculation of the total direct losses:
Total_direct_loss(?TotalDirectloss) ^ DirOPl(?TotalDirectloss, ?DirectOPloss) ^ DirIOl(?TotalDirectloss, ?DirectIOloss) ^ DirLSl(?TotalDirectloss, ?DirectLSloss) ^ DirCPl(?TotalDirectloss, ?DirectCPloss) ^ DirDSl(?TotalDirectloss, ?DirectDSloss) ^ swrlb:add(?DirectTotalloss, ?DirectOPloss, ?DirectIOloss, ?DirectLSloss, ?DirectCPloss, ?DirectDSloss) ->DirTotl(?TotalDirectloss, ?DirectTotalloss)
Rule 5Calculation of the total indirect losses:
Indirect_loss(?Indirectloss) ^ IndOPl(?Indirectloss, ?IndirectOPloss) ^ IndIOl(?Indirectloss, ?IndirectIOloss) ^ IndLSl(?Indirectloss, ?IndirectLSloss) ^ IndCPl(?Indirectloss, ?IndirectCPloss) ^ IndDSl(?Indirectloss, ?IndirectDSloss) ^ swrlb:add(?IndirectTotalloss, ?IndirectOPloss, ?IndirectIOloss, ?IndirectLSloss, ?IndirectCPloss, ?IndirectDSloss)->IndTotl(?Indirectloss, ?IndirectTotalloss)
Rule 6Calculation of the total number of deaths:
Personnel_Death(?PersonnelDeath) ^ OPDN(?PersonnelDeath, ?DeathOPNumber) ^ IODN(?PersonnelDeath, ?DeathIONumber) ^ LSDN(?PersonnelDeath, ?DeathLSNumber) ^ CPDN(?PersonnelDeath, DeathCPNumber)^DSDN(?PersonnelDeath,?DeathDSNumber)^swrlb:add(?DeathTotalNumber, ?De-
athOPNumber,?DeathIONumber,?DeathLSNumber,?DeathCPNumber,?DeathDSNumber)-> TotDN(?
PersonnelDeath, ?DeathTotalNumber)
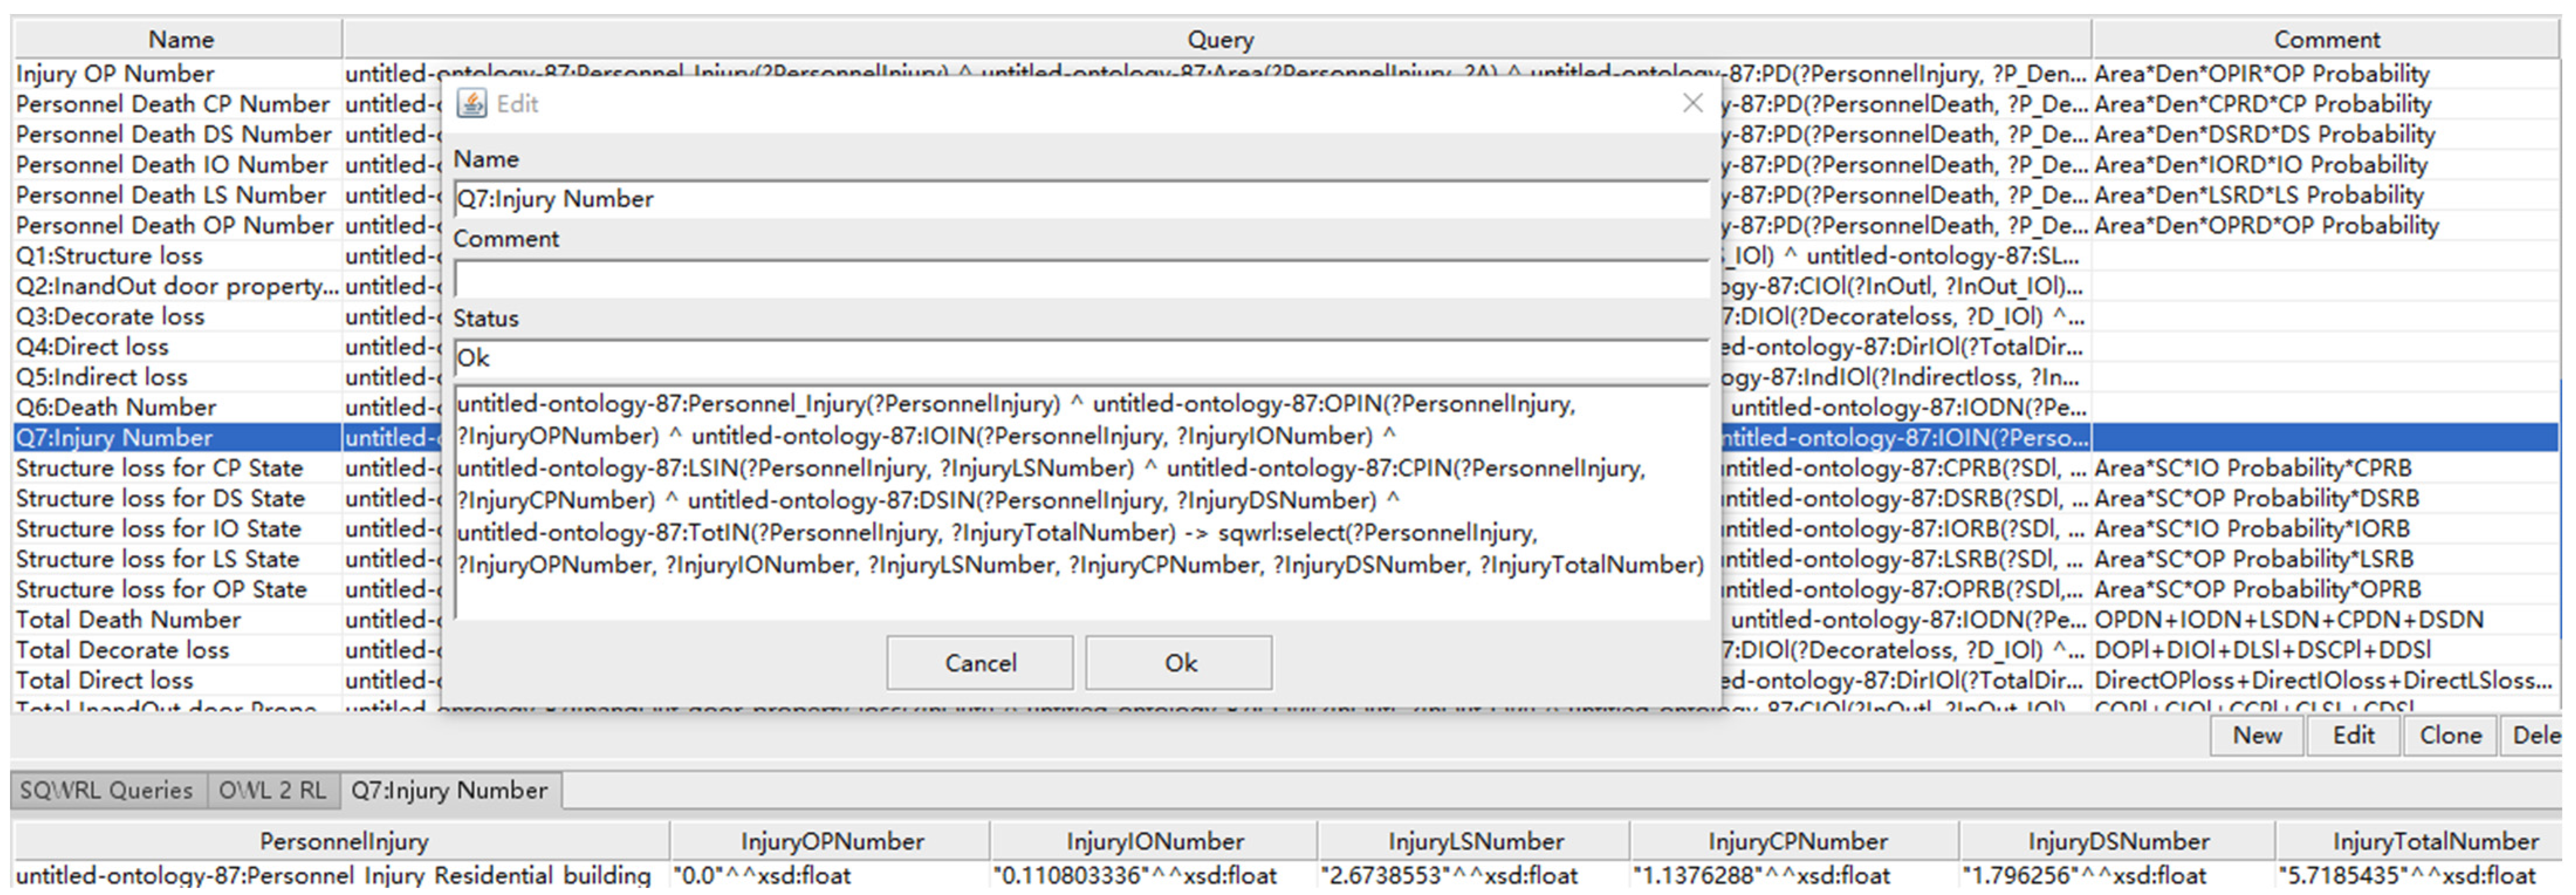
Rule 7Calculation of the total number of injuries:
Personnel_Injury(?PersonnelInjury) ^ OPIN(?PersonnelInjury, ?InjuryOPNumber) ^ IOIN(?PersonnelInjury, ?InjuryIONumber) ^ LSIN(?PersonnelInjury, ?InjuryLSNumber) ^ CPIN(?PersonnelInjury, ?InjuryCPNumber) ^ DSIN(?PersonnelInjury, ?InjuryDSNumber) ^ swrlb:add(?InjuryTotalNumber, ?InjuryOPNumber, ?InjuryIONumber, ?InjuryLSNumber, ?InjuryCPNumber, ?InjuryDSNumber) -> TotIN(?PersonnelInjury, ?InjuryTotalNumber)
Table 12. SQWRL rules.
Rule NumberSQWRL Rules
Q1: Structural lossesStructure_direct_loss(?SDl)^SOPl(?SDl,?S_OPl) ^IOl(?SDl,?S_IOl)^SCPl(?SDl,?S_C-
Pl)^SDSl(?SDl,?S_DSl)^STotl(?SDl,?S_Totl)->sqwrl:select(?SDl,?S_OPl,?S_IOl,?S_L-
Sl,?S_CPl,?S_DSl,?S_Totl)
Q2: Indoor and Outdoor property lossesInandOut_door_property_loss(?InOutl)^COPl(?InOutl,?InOut_OPl)^CIOl(?InOutl,
?InOut_IOl)^CLSl(?InOutl,?InOut_LSl)^CCPl(?InOutl,?InOut_CPl)^CDSl(?InOutl,
?InOut_DSl)^CTotl(?InOutl,?InOut_Totl)->sqwrl:select(?InOutl,?InOut_OPl,?InO-
ut_IOl,?InOut_LSl,?InOut_CPl,?InOut_DSl,?InOut_Totl)
Q3: Decoration property lossesDecoration_loss(?Decorationloss)^DOPl(?Decorationloss,?D_OPl)^ DIOl(?Decorationloss,?D_IOl)^DLSl(?Decorationloss,?D_LSl) ^ DCPl(?Decorationloss, ?D_CPl) ^
DDSl(?Decorationloss,?D_DSl)^DTotl(?Decorationloss,?D_Totl)->sqwrl:select(?De-
corationloss,?D_OPl,?D_IOl,?D_LSl,?D_CPl,?D_DSl,?D_Totl)
Q4: Total direct lossesTotal_direct_loss(?TotalDirectloss)^DirOPl(?TotalDirectloss, ?DirectOPloss) ^ DirI-
Ol(?TotalDirectloss,?DirectIOloss)^DirLSl(?TotalDirectloss,?DirectLSloss) ^ DirCPl
?TotalDirectloss,?DirectCPloss)^DirDSl(?TotalDirectloss,?DirectDSloss) ^ DirTotl(?
TotalDirectloss,?DirectTotalloss)->sqwrl:select(?TotalDirectloss,?DirectOPloss,?Di-
rectIOloss,?DirectLSloss,?DirectCPloss,?DirectDSloss,?DirectTotalloss)
Q5: Indirect lossesIndirect_loss(?Indirectloss)^IndOPl(?Indirectloss,?IndirectOPloss) ^ IndIOl(?Indirectloss,?IndirectIOloss)^IndLSl(?Indirectloss,?IndirectLSloss) ^ IndCPl(?Indirectloss, ?IndirectCPloss) ^ IndDSl(?Indirectloss, ?IndirectDSloss) ^ IndTotl(?Indirectloss, ?IndirectTotalloss) -> sqwrl: select(?Indirectloss, ?IndirectOPloss, ?IndirectIOloss,?IndirectLSloss,?IndirectCPloss,?IndirectDSloss,?IndirectTotalloss)
Q6: Personnel deathsPersonnel_Death(?PersonnelDeath)^OPDN(?PersonnelDeath,?DeathOPNumber) ^
IODN(?PersonnelDeath,?DeathIONumber)^LSDN(?PersonnelDeath,?DeathLSNu-
mber)^CPDN(?PersonnelDeath,?DeathCPNumber)^DSDN(?PersonnelDeath,?De-
athDSNumber)^TotDN(?PersonnelDeath,?DeathTotalNumber)->sqwrl:select(?PersonnelDeath,?DeathOPNumber,?DeathIONumber, ?DeathLSNumber,?DeathCPN-
umber,?DeathDSNumber,?DeathTotalNumber)
Q7: Personnel injuriesPersonnel_Injury(?PersonnelInjury)^OPIN(?PersonnelInjury,?InjuryOPNumber) ^
IOIN(?PersonnelInjury,?InjuryIONumber)^LSIN(?PersonnelInjury, ?InjuryLSNum
ber)^CPIN(?PersonnelInjury,?InjuryCPNumber)^DSIN(?PersonnelInjury, ?Injury-
DSNumber)^TotIN(?PersonnelInjury,?InjuryTotalNumber)->sqwrl: select(?Person-
nelInjury?InjuryOPNumber,?InjuryIONumber,?InjuryLSNumber, ?InjuryCPNum-
ber,?InjuryDSNumber,?InjuryTotalNumber)
Table 13. Seismic risk assessment results.
No
Damage
Slight
Damage
Moderate DamageExtensive DamageComplete CollapseTotal Losses
Direct losses ($)Structure losses022,832.245,914.658,605.113,219.2140,571.1
Indoor and outdoor property losses02283.24591.44688.41586.313,149.3
Decoration property losses560.485,620.7682,646.429,888.63965.7202,681.86
Total direct losses560.4110,736.1133,152.693,182.118,771.2356,402.4
Indirect losses ($)00133,152.6559,092.8375,425.21,067,670.6
CasualtiesPersonnel deaths000.10.20.81.1
Personnel injuries00.12.71.11.85.7
Publisher’s Note: MDPI stays neutral with regard to jurisdictional claims in published maps and institutional affiliations.

