Article

Application of LightGBM Algorithm in the Initial Design of a Library in the Cold Area of China Based on Comprehensive Performance

School of Architecture and Engineering, Xinjiang University, Urumqi 830047, China
*
Author to whom correspondence should be addressed.
Buildings 2022, 12(9), 1309; https://doi.org/10.3390/buildings12091309
Submission received: 18 July 2022 / Revised: 19 August 2022 / Accepted: 22 August 2022 / Published: 26 August 2022

Abstract

:
The proper application of machine learning and genetic algorithms in the early stage of library design can obtain better all-around building performance. The all-around performance of the library, such as indoor temperature, solar radiation, indoor lighting, etc., must be fully considered in the initial design stage. Aiming at building performance optimization and based on the method of “generative design”, this paper constructs the library’s comprehensive performance evaluation workflow and rapid prediction combined with the LightGBM algorithm. A library in a cold region of China is taken as the research object to verify its application. In this study, 5000 scheme samples generated in the iterative genetic optimization process were taken as data sets. The LightGBM algorithm was used to classify and predict design schemes, with a precision of 0.78, recall rate of 0.93, and F1-Score of 0.851. This method can help architects to fully exploit the optimization potential of the building’s all-around performance in the initial stage of library design and ensure the timely interaction and feedback between design decisions and performance evaluation.

1. Introduction

According to China Building Energy Consumption Research Report 2020, by 2018, the country’s total floor area reached 67.1 billion m2, of which public floor area was about 12.9 billion m2, accounting for 19% [1]. However, the energy consumption of public buildings is generally higher, and the energy consumption of public buildings accounts for a more significant proportion of the total building energy consumption. In China, the total energy consumption per square meter of public buildings is more than twice that of residential buildings [2]. As a type of public building, the library also has excellent energy-saving potential [3]. In order to realize the goal of energy conservation and emission reduction in a library, it is of great significance to explore the library design method oriented by comprehensive performance optimization [4].
The architects have made many attempts to optimize the performance of the library building, such as setting large windows, using light-colored skin, and setting sun shading components [5,6]. However, the effect of optimization can only be investigated after the completion of building construction in most cases, so it is essential to study the optimization and prediction of building performance in the early stage of the design [7]. Because the comprehensive performance evaluation process is complex and time-consuming and the parameter setting is highly specialized, professionals usually conduct systematic and objective analysis and summary of the comprehensive performance of the scheme after the design is completed [8]. Making a reasonable decision in the initial stage of architectural design can affect the comprehensive performance of the building at a lower cost [9]. During the compact design process, the architects wanted more timely feedback during design. Therefore, the generative design method based on building performance simulation has emerged in recent years [10].
With the deepening of research and practice, generative design and multi-objective optimization combined with better design methods have been widely used in architectural design [11]. Manav et al. developed an approach that combines “modeling with building information” and “Machine learning” to rapidly provide building performance information [12]. Yan et al. proposed a performance-driven early design optimization workflow, taking office buildings as an example, and introduced a genetic algorithm and XGBoost algorithm into the early design [13]. Based on the process of “modeling-computation-optimization”, Zhang et al. proposed a form optimization method for large-space buildings, which applied a multi-objective genetic algorithm to perform iterative optimization of architectural modeling. Pareto Frontier, formed from the optimization results, provided sufficient alternative plans for designers [14].
However, the design process based on building performance simulation and algorithm optimization are still to be improved. First, this design method has a high time cost and an incredible amount of work, which requires architects to set parameters for various schemes. At the same time, simulation and iterative optimization need much time. Secondly, this design method requires architects to be highly skilled in using various software [15]. Currently, widely recognized building performance simulation software, such as Energy Plus, Equest, DesignBuilder, and OpenStudio, requires users to have a thorough understanding of building physics and set the parameters involved in the simulation in detail [16]. However, in this process, it is difficult for architects to choose the appropriate parameters and obtain the optimal scheme of all aspects based on their experience [17]. This kind of workflow of building comprehensive performance simulation and iterative algorithm optimization are combined to obtain a better scheme. Generally speaking, the process is complex, the workload is heavy, and the feedback cannot be timely. Moreover, the architect lacks subjectivity in adjusting various parameters in the design and selecting the final scheme [18].
To solve these problems, construction industry researchers have begun exploring the combination of artificial intelligence and building design. With the updating and development of algorithms in recent years, architecture has introduced the fast prediction model based on machine learning model to solve problems [19,20,21]. Santos et al. developed a prediction model based on artificial neural network (ANN) to obtain the final prediction model by training massive hourly data. In the study of existing public buildings, this model can obtain the prediction results of energy consumption and thermal performance with acceptable accuracy and no effort in modeling [22]. Xie et al., based on a commonly used multi-layer neural network (MLNN), optimized the building layout by Genetic Algorithm (GA) and Back Propagation (BP) algorithm to predict the distribution of the Mean Radiation Temperature (MRT) around the building [23]. Palladino et al. used ANN to establish a simplified algorithm to evaluate summer PMV using only three input variables (indoor air temperature, relative humidity, and clothing insulation) [24]. Using data from 550 buildings, Xu et al. proposed a data-driven approach to summarize the effects of retroactive projects and predict future savings potential [25]. Pittarello et al. found that ANN is very useful for assessing the energy consumption of buildings, supporting rapid comparative analysis of different schemes and facilitating subsequent optimization [26].
Although machine learning has been widely applied in architecture in recent years, most of the current applications of machine learning algorithms in architecture solve regression problems, and few studies apply multi-classification prediction to architectural design. Previous research mainly focuses on predicting indoor or outdoor building performance and building energy consumption. Few researchers combine the simulation of comprehensive building performance, algorithm optimization, and scheme classification according to the advantages and disadvantages of building performance to guide architectural design. Second, most of the current performance prediction research tends to take specific buildings as the research object, and excessive pursuit of the accuracy of prediction results in poor generalization ability, which makes it challenging to combine the established prediction framework with the actual architectural design.
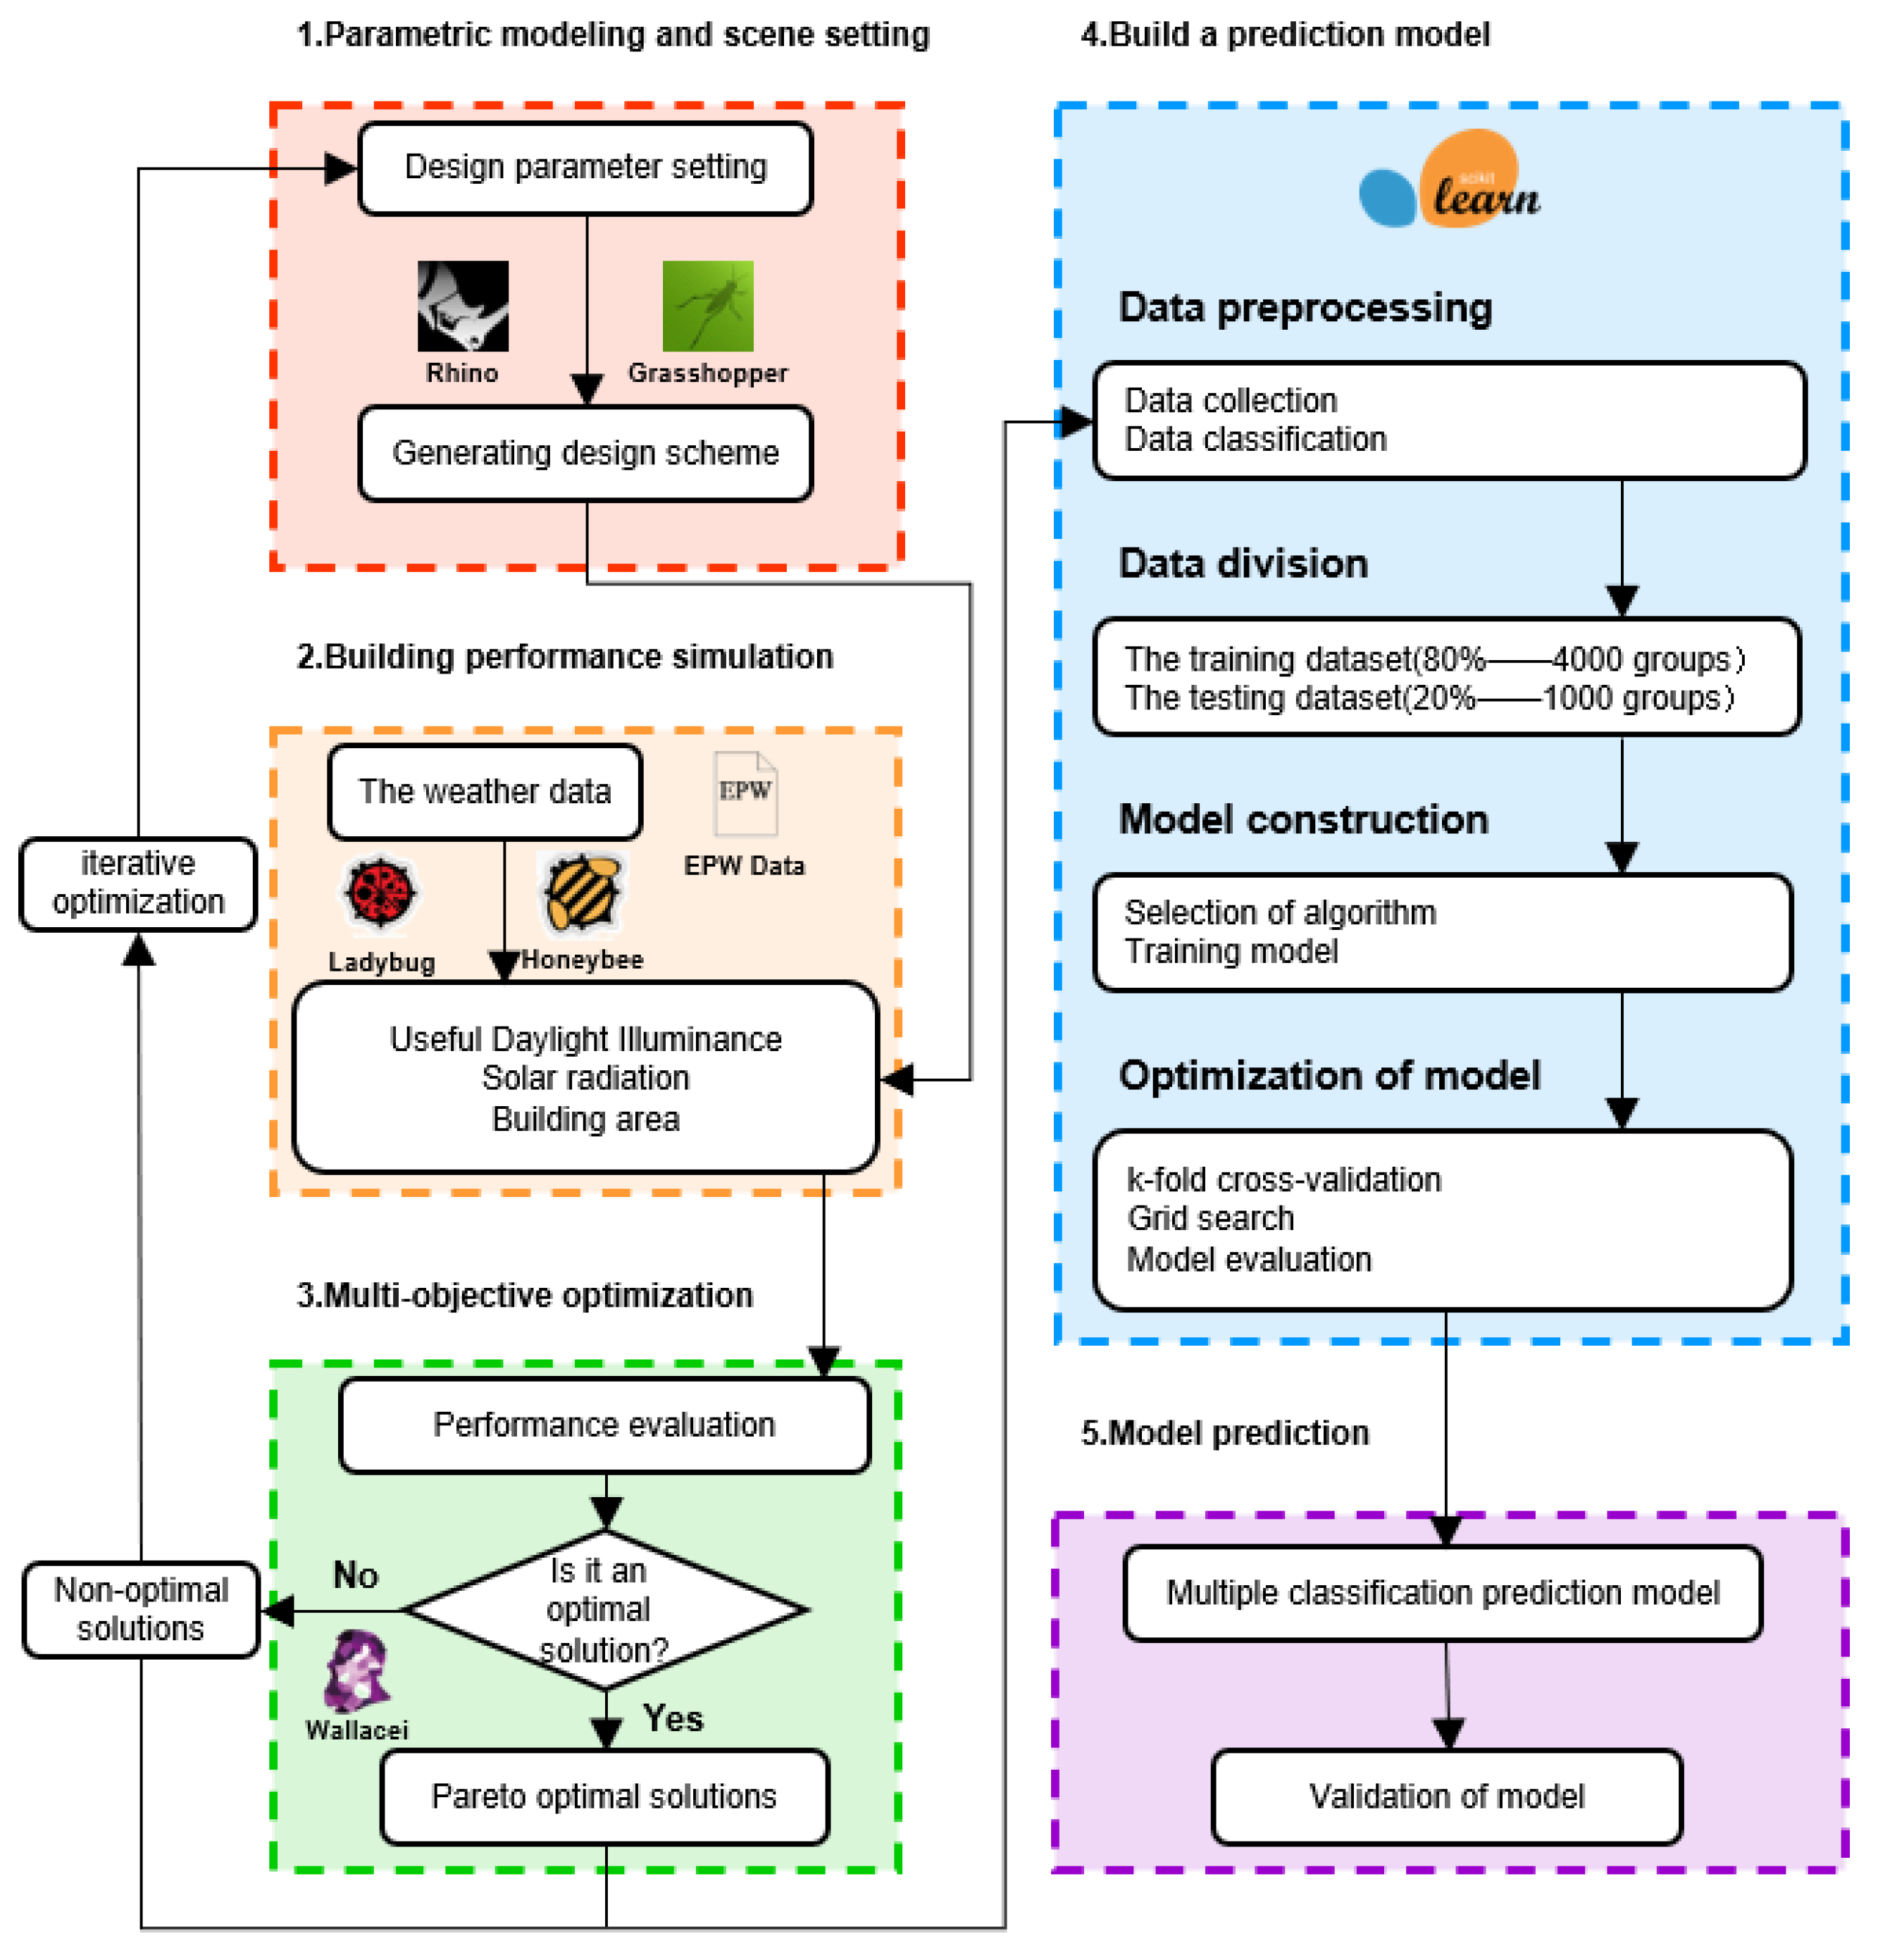
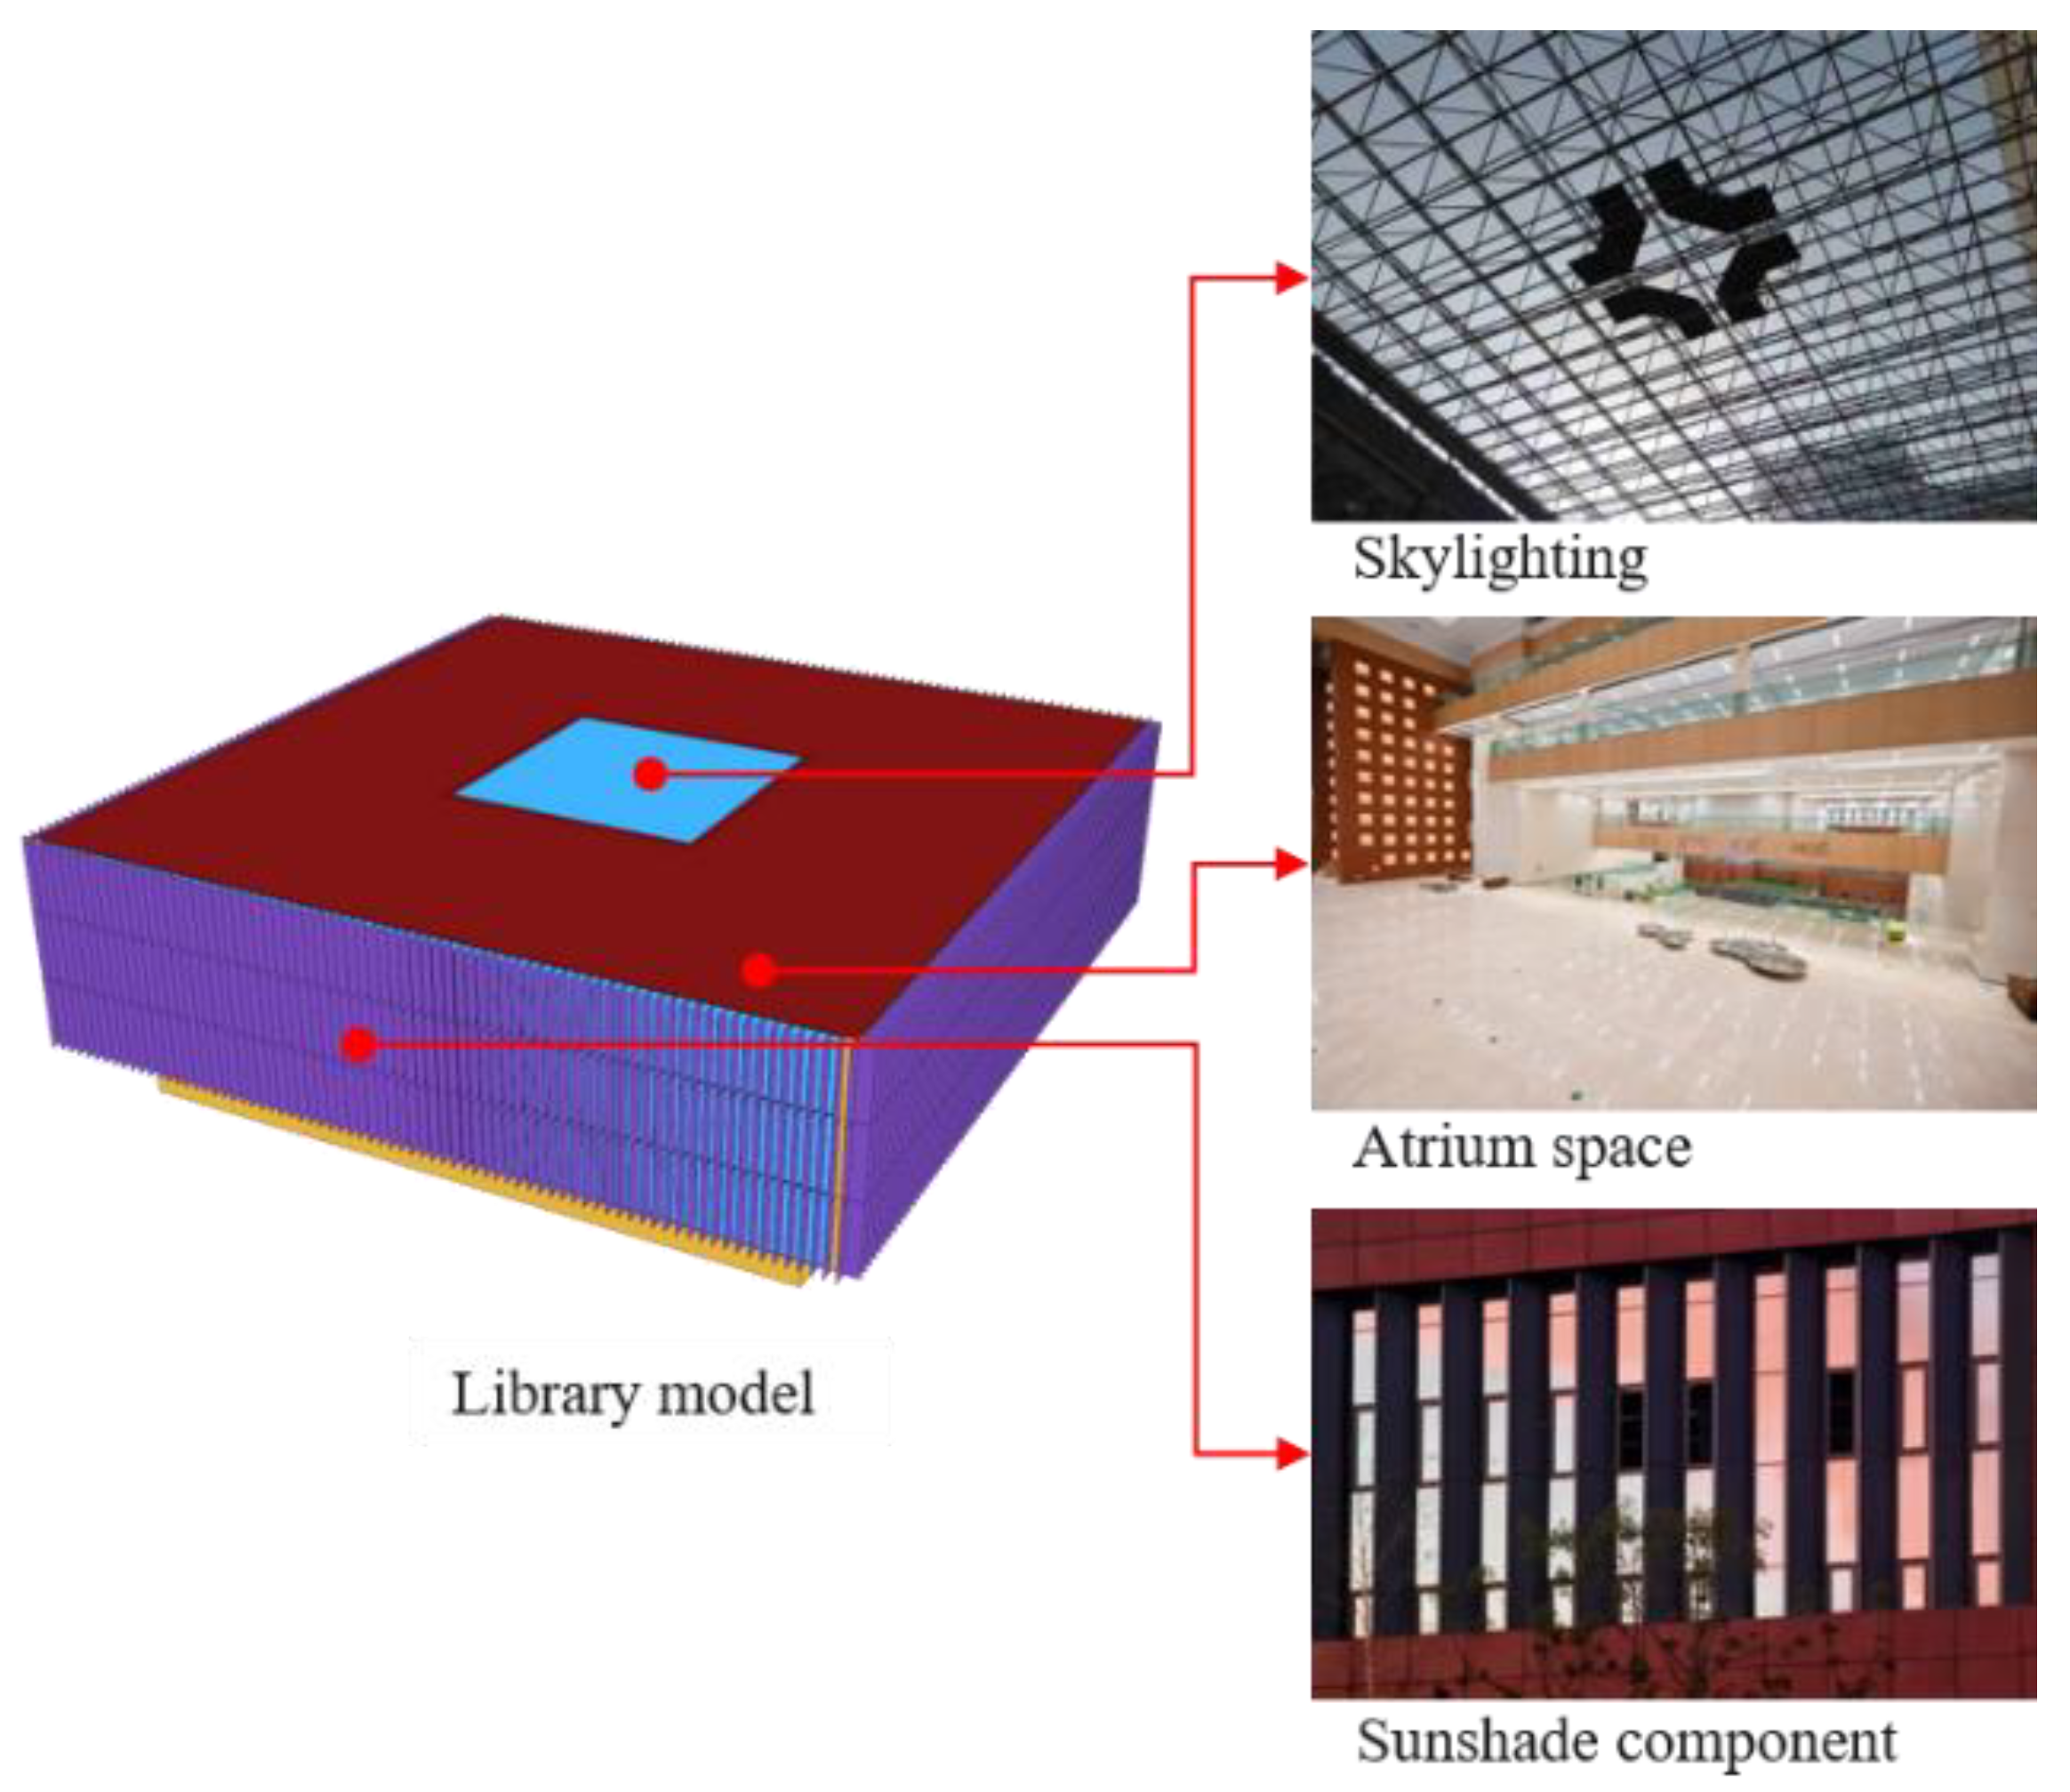
Because of the current research status, this paper constructs a library architectural design method based on the LightGBM algorithm, which is used to predict and classify the performance of different schemes at the initial stage of library design, providing ideas for architects’ subsequent design. In the Methods part, this paper selects a university library in Xinjiang, China, as the research object. The library fully considers the use of sustainable energy in the design and reduces building energy consumption while improving indoor comfort. Taking the library as the research object is very beneficial for exploring the energy-saving design of the library. The building scheme is generated by setting various building parameters, and much data are obtained by building performance simulation and multi-objective optimization (MOO). Then, by selecting the algorithm model, dividing the training set and test set, hyperparameter tuning, and cross-validation, an efficient and reasonable multi-classification algorithm model is built, which can quickly and accurately classify different schemes according to their performance and guide the subsequent design of architects. In the result section, the prediction results of the multi-classification prediction model established in this paper are summarized and analyzed, and the model’s prediction accuracy is investigated. In the Discussions section, the established LightGBM algorithm model is compared with several other mainstream algorithms, and the following research directions are analyzed and summarized. In the Conclusions part, the research results of this paper are summarized.
In this study, the innovations mainly include:
  • This paper proposes a design method that combines the generative architectural design process based on building performance with the LightGBM algorithm, which can guide architects to better carry out the subsequent design;
  • This paper uses the LightGBM algorithm to evaluate, predict, and classify library performance, and the possibility of applying LightGBM algorithm in architectural design is verified;
  • This paper compares the prediction performance of the LightGBM algorithm with several other commonly used multi-classification algorithms in detail, and the superiority of applying LightGBM algorithm in architectural design is verified.

2. Methods

2.1. Technical Route Overview

This study can be divided into five stages. In the first stage: the parametric design method is used to generate the initial design scheme. The main body and shading of the library are generated by setting various parameters according to the functional requirements and local climate conditions and referring to the existing library. The second stage: building performance simulation. The evaluation of library performance took into account three aspects: indoor natural lighting, solar radiation in winter and summer, and usable area of the building. The third stage: MOO, is used to adjust the design parameters to generate new schemes continuously. The performance of these schemes is simulated, and the optimal combination of design parameters is sought through iterative optimization schemes. Data sets, including Pareto optimal and non-optimal solution schemes, can be obtained as the original data for subsequent research. The fourth stage: Use the LightGBM algorithm to build and train a multi-classification prediction model. The fifth stage: verification of the multi-classification prediction model. The validated and optimized algorithm model is used to predict and classify the performance of the design scheme at the initial stage of construction, guiding the subsequent design of architects. The technical roadmap for this article is shown in Figure 1 and will be described in more detail later.

2.2. Case Studies and Data Generation

This paper selects a library in a university in Urumqi (lat: 43.78, lon: 87.65, tz: 8.0, elev: 935.00), China, as the research object. The library was built in 2022 and is located southeast of Urumqi city. The construction area of the library is 61,333 m2, with one underground floor and five floors above ground. The total construction area above ground is 49,924 m2, the total underground construction area is 11,408 m2, and the building height is 26.4 m, as shown in Figure 2. Because readers need high illumination when reading, and the library as a public building generally has a considerable depth, it is not easy to achieve appropriate illumination only by side window lighting. Hence, most library buildings have extensive lighting energy consumption. The library studied in this paper is designed with full consideration of the use of sunlight. The design strategies of the library in terms of lighting are as follows:
  • Skylights in the library atrium provide good natural lighting;
  • Vertical louvers are set on the exterior facade to shade the sun while ensuring a transparent and open indoor vision;
  • An atrium is set in the center of the building so that the skylight lighting can be utilized by each floor as much as possible.
Through these strategies, the library has better internal lighting, lower lighting energy consumption, and less summer solar radiation to achieve the purpose of energy saving.

2.2.1. Parameter Modeling and Scenario Setting

Parameter modeling. The library selected for this study is located in the center of a university campus in the southeast corner of Urumqi, Xinjiang, China. Based on the design strategy of the library and the Code of Chinese Library Architectural Design, five characteristic variables are set up: change of orientation (CO), width of the atrium (WA), story height (SH), spacing of sunshades (SS), and width of sunshade (WS). CO mainly affects the lighting and energy consumption of buildings, and the building orientation in China is mainly southward. The atrium in the center is often used in the design of Chinese libraries, which can disperse the light incident through skylights to each floor inside the library, so the WA should not be too large or too small. SH, SS, and WS affect the indoor lighting, the overall amount of solar radiation in the building, and the experience and comfort of indoor readers. They should not be too small or too large. So set their reasonable change interval, as shown in Table 1. In this study, we use Grasshopper (one of the mainstream software in the field of parametric design), a visual programming plug-in based on the 3D modeling software Rhino platform, for generative modeling. A new design scheme is immediately generated when the characteristic variables are adjusted.
Scenario setting. Load local weather data with Ladybug Tools, a free open-source environment plug-in based on Grasshopper that helps designers create environmentally conscious building designs. According to the Code for Thermal Design of Civil Buildings in China, Urumqi belongs to the cold region in the thermal design zone of buildings. The average annual meteorological data of Urumqi is shown in Table 2, showing that summer temperature is relatively suitable and winter temperature is extremely low.

2.2.2. Performance Simulation

Ladybug Tools is a free, open-source simulation plugin based on Grasshopper that helps architects create environmentally conscious building designs. Ladybug and Honeybee can simulate building energy consumption, light, and thermal environments. Ladybug and Honeybee are simulation software that many practitioners have proven many times and are widely recognized in architecture. Ladybug l.4.0 and Honeybee l.4.0 versions of open-source plugins were used in this study.
As mentioned above, this paper mainly studies the library’s natural lighting and thermal performance. Three specific performance indicators are selected: useful daylight illuminance (UDI, it is calculated as a percentage of the year’s working time that the illumination on the working plane is within the comfortable range [27]), summer solar radiation (SRS), and winter solar radiation (SRW). This section describes several performance indicators in detail.
Previously, the architects mainly considered daylight factor (DF) when evaluating indoor lighting in the initial design stage. Some more scientific and reasonable evaluation indexes of indoor lighting have emerged in recent years, such as daylight autonomy (DA) and UDI [28]. As DF does not consider uncomfortable illumination, UDI also considers the condition that excessive illumination causes visual discomfort on this basis. It can be seen that compared with DF, UDI can more accurately describe the quality of the indoor light environment of a building. Therefore, this paper selects UDI as the index of indoor lighting throughout the year. According to relevant specifications, the UDI of the library is the percentage of the working time in the range of 300 lx~2000 lx on the working plane in the annual working time [29]. In this study, when lighting simulation parameters are set, the components of each part of the model are set as the same or similar materials as the reference building, and the reflectivity of each component is shown in Table 3. The honeybee-annual daylight plug-in calculated UDI. The measuring point of the lighting simulation was set at the height of 0.75 m from the ground, and the size of the measuring grid was 1 × 1 m.
Solar radiation is an essential factor in building design. Most architects pay little attention to the design strategies related to solar radiation in the design process or even to meet the design specifications, failing to guide the optimization of design schemes. When designing buildings in cold regions, architects should consider increasing beneficial radiation in winter and reducing harmful radiation in summer as much as possible. Considering the influence of solar radiation on the indoor environment and building energy consumption, SRS and SRW received by the library surface were calculated in this study. SRS represents solar radiation received by the building between June and August, and SRW represents solar radiation received between December and February. Ladybug-incident radiation plug-in was used to calculate solar radiation in winter and summer. To ensure the accuracy of simulation results, the measurement grid size was set as 1 × 1 m.
The building area (BA) is also an essential factor in library design. The design scheme in this paper improves indoor lighting by adjusting the size of the atrium, which will change the size of the building area. While optimizing the building performance, the usable area of the building should be as large as possible to meet various user requirements. Therefore, the single-story area of the building is also taken as an evaluation index in this paper. The grasshopper-area calculation module can calculate BA.

2.2.3. MOO

GA was first proposed by American John Holland in the 1970s and is an important new branch of artificial intelligence [30]. GA is based on Darwin’s theory of evolution and on the survival of the fittest, survival of the fittest, and other natural evolutionary mechanisms to search and solve problems. In recent years, GA-based MOO has been widely recognized in the research of performance optimization in architecture [31]. The advantages of applying MOO in architectural design are as follows: (1) It is a global optimization algorithm; (2) when a MOO problem is involved in the design process, multiple Pareto optimal solutions corresponding to the scheme can be obtained at the same time for architects to choose.
Wallacei, a genetic algorithm optimization plug-in used in this paper, is an evolutionary engine developed on the Grasshopper platform. Users can conduct evolution simulations in Grasshopper. Users can better understand the optimization results using their analysis and visualization tools to show the evolution results [32]. During GA iterative optimization, various parameter settings are shown in Table 4.

2.3. Model Training

This section establishes a machine learning algorithm model that can quickly predict and evaluate the comprehensive performance of the library. The primary process includes data preprocessing, model selection, training and test set division, hyperparameter tuning, cross-validation, and model evaluation. The algorithm model is built by the Scikit-Learn library, an open-source machine learning library that supports both supervised and unsupervised learning. It provides various tools for model fitting, data preprocessing, model selection and evaluation, and many other utilities widely used in data science. Several essential steps are detailed in the following sections.

2.3.1. Data Preprocessing

First, the data are classified. The setting of classification labels allows machine learning models to learn, optimize, and predict. The classification results can guide architects in improving the design scheme during the design process. The initial data set is the corresponding design parameters and performance parameters of 5000 design schemes obtained after iterative optimization on the Wallacei platform. Pareto optimal solution is the best solution obtained by balancing multiple objectives when the optimization task has multiple objectives. The curve or surface formed by all Pareto optimal solutions is the Pareto frontier. Non-optimal solutions are the set of non-Pareto optimal solutions [33]. According to the optimization objectives and design requirements, the solutions generated in the iterative optimization process of Wallacei are divided into three categories, each of which has a specific label, as shown in Figure 3 and Table 5. The solutions corresponding to Pareto optimal solutions are ideal design schemes, while those corresponding to non-optimal solutions need to be improved and optimized. In addition, this study prioritizes the indoor lighting situation of the library, so the UDI of each scheme is considered more in classification. The design schemes with UDI ≥ 60% in Pareto optimal solution are marked as A, which has good performance in all aspects. The design schemes with UDI < 60% in Pareto optimal solution are marked as B. These schemes have better performance in other aspects, but design parameters need to be adjusted to improve lighting further. The design schemes corresponding to the non-optimal solution are marked as C. These schemes have poor performance in all aspects and need to readjust the design parameters.

2.3.2. Algorithm Selection and Model Setting

After data preprocessing is completed, machine learning models can be constructed to train and learn existing data sets and predict and give feedback on the performance of architectural schemes generated by different parameters. By comparing and analyzing various machine learning models [34,35,36,37], the LightGBM algorithm is finally adopted in this study for multi-classification prediction.
LightGBM, a widely used Boosting algorithm known for its efficiency and flexibility, was proposed in 2016 [38]. It has been applied in various fields, such as building energy consumption prediction, indoor comfort prediction, housing price prediction, and so on [39]. The research shows that compared with traditional machine learning methods, LightGBM has the advantages of fast learning speed, high parallel efficiency, and a large amount of data [40].
The algorithm is used for supervised learning problems to predict the label of target Y by training data X. Given a supervised training set X, the goal of the LightGBM algorithm is to minimize the expected value of a particular loss function L ( y , f ( x ) ) by finding an approximation of f ^ ( x ) of a function f * ( x ) .
f ^ = arg m i n f E y , X L ( y , f ( x ) )
LightGBM integrates multiple T regression trees to approximate the final model as follows:
f T ( X ) = t = 1 T f t ( X )
The regression tree can be expressed as w q ( x ) , q ( 1 , 2 , , J ) , where J represents the number of leaves, q represents the decision rule of the tree, and w represents the sample weight vector of leaf nodes. Therefore, at step T, the additive training for LightGBM is as follows:
Γ t = i = 1 n L ( y i , F t 1 ( x i ) + f t ( x i ) )
In LightGBM, the objective function is expanded by second-order Taylor formula. For simplicity, after removing the constant term in Example (3), it can be transformed as follows:
Γ t i = 1 n ( g i f t ( x i ) + 1 2 h i f t 2 ( x i ) )
where g i and h i are the first-order and second-order gradient statistics of the loss function respectively. I j is used to represent the sample set of leaf J , then Example (4) can be transformed into:
Γ t = j = 1 J ( ( i I j g i ) w j + 1 2 ( i I j h i + λ ) w j 2 )
For the tree structure q ( x ) , the optimal leaf weight score w j * and extreme value Γ x can be solved as follows:
w j * = i I j g i i I j h i + λ
Γ T * = 1 2 j = 1 J ( i I j g i ) 2 i I j h i + λ
Γ T * can be thought of as a score function structure q that measures the quality of the regression tree. Finally, the objective function can be expressed as:
G = 1 2 ( ( i I L g i ) 2 i I L h i + λ + ( i I R g i ) 2 i I R h i + λ ( i I g i ) 2 i I h i + λ )
where I L and I R are the sample sets of the left and right branches respectively. Unlike traditional GBDT-based technologies such as XGBoost and GBDT, LightGBM is a vertical growing tree. At the same time, other algorithms are horizontal growing trees, making LightGBM an efficient way to process large-scale data and features.
Machine learning models are used to predict and give feedback on new data, so it is essential to ensure they have good accuracy and generalization ability. In this study, GridSearchCV is used to optimize and select the hyperparameters that affect the generalization ability and model accuracy, and k-fold cross validation is used to verify the generalization ability of the LightGBM algorithm.
GridSearchCV is used to select the optimal hyperparameters of the model. There are many combinations of hyperparameters in machine learning models, and GridSearchCV can be used to find the optimal combination of hyperparameters. In this study, we mainly consider four hyperparameters, “learning rate”, “num leaves”, “max depth”, and “n_estimators”, that affect the performance of the LightGBM multi-classification model. The process of searching and optimizing hyperparameters is to construct a new classifier and reduce the loss function step by step. Hyperparameter tuning can reduce the instability of the algorithm model and get the optimal prediction performance.
Cross-validation is a standard machine learning model building and model parameter verification method. It is generally used to evaluate the performance of a machine learning model to determine its generalization ability [41]. Since the data set is small, 5-fold cross-validation is used in this paper [42]. 80% of the data (4000 cases) were randomly divided into training data sets, and the remaining 20% (1000 cases) were used as test data sets.

2.3.3. Model Evaluation

After constructing the prediction classification model, the evaluation criteria include the efficiency of prediction, the accuracy of prediction, and the generalization ability of the prediction model. In this paper, the classification performance of the algorithm model is evaluated by two key indicators: accuracy rate and recall rate. Accuracy rate indicates how many of the samples with optimistic predictions are genuinely positive, while recall rate indicates how many of the samples with optimistic predictions are correct. The calculation methods of accuracy rate and recall rate are Examples (9) and (10).
p r e c i s i o m   =   T P   T P +   F P
r e c a l l   =   T P T P +   F N  
TP: True Positives, indicating the number of samples that were positive and determined as positive by the classifier;
FP: False Positives, indicating the number of samples that were negative and determined as positive by the classifier;
FN: False Negatives, indicating the number of samples that were positive but determined as negative by the classifier.
The calculation of F1-Score takes into account accuracy rate and recall rate. Example (11) represents the calculation of F1-Score.
F 1 -Score   = 2 ×   p r e c i s i o m   ×   r e c a l l     p r e c i s i o m   +   r e c a l l  
F1-Score is a measure of classification problems. F1-Score is often used as the final evaluation method in some machine learning models with multi-classification problems. It is the harmonic mean of accuracy rate and recall rate, with a maximum of 1 and a minimum of 0. F1-Score can evaluate the model well and is suitable for dichotomous and multi-classification problems. In the multi-classification problem, Micro-F1 and Macro-F1 are the combined results of F1-Score, which are used to evaluate multi-classification tasks. The Macro-F1 is suitable for multi-classification problems and is not affected by data imbalance. Therefore, Macro-F1 is mainly studied in this paper. The Macro-F1 calculation method in Scikit-Learn library on Python platform is adopted in this study.
In addition, sensitivity analysis of design parameters involved in the predictive classification process is explored. Sensitivity analysis can help architects to understand the influence of various design parameters on building performance and put forward reasonable design strategies accordingly [43].

3. Results

3.1. Data Preprocessing

A total of 5000 sets of data are generated after 100 generations of Wallacei iteration. Figure 4 shows partial Pareto optimal solution and non-optimal solution. All Pareto optimal solutions constitute the Pareto optimal solution set, and these solutions form the Pareto frontier [44] (red surface in the figure) through mapping the objective function. These designs reflect different performance characteristics through different positions in 3D space and different colors. The points on the outside of the red surface are Pareto optimal solutions. In contrast, the solutions inside the surface close to the origin of the coordinate axes are non-optimal solution.
According to the classification method above, 5000 design schemes generated by MOO are given their own labels, and the distribution of different labels is shown in Figure 5. It can be seen that among the 5000 groups of schemes, there is more class A schemes with good comprehensive performance and class C schemes with poor comprehensive performance, while class B schemes with poor lighting and other good performance only accounts for a small part.
The distribution of each design variable is shown in Figure 6. The horizontal axis represents the value, and the vertical axis represents the number of schemes corresponding to the value. The value of CO is mainly distributed at 0°. That is to say, and most schemes are oriented due south. There are many schemes with SS values at 0.6 m and 1.4 m, while the WS values of most schemes are mainly distributed around 0.2 m and 1.2 m. This value range can be used as a reference in the design of shading components in subsequent studies.

3.2. Hyperparameter Tuning

When building the LightGBM model, several basic hyperparameters must be determined. The hyperparameters used in this study are as follows:
“boosting Type”: Defaults to “gbdt”, a traditional gradient enhanced decision tree.
“learning rate”: indicates the learning rate.
“num leaves”: The largest leaves for the basic learner.
“max depth”: indicates the maximum depth of the base tree model. The more complex the base tree model, the greater the value.
“n_estimators”: num boosting rounds, the maximum number of trees generated, and the maximum number of iterations. The more iterations, the higher the value.
The hyperparameter values determined by GridSearchCV and the measurement index scores of the model are shown in Table 6. It can be seen that the recall rate of the model is high, and F1-Score is 0.851, which proves that the classification prediction performance of the model is good.
Figure 7 shows the confusion matrix of the result of prediction classification obtained by the LightGBM model after tuning, which shows that the prediction result is good. The classification prediction of most class C schemes is accurate, while some class A and B schemes are wrong.
Figure 8 shows the sensitivity analysis of each design variable. The results show that WA significantly influences performance label classification, followed by CO and SH. In contrast, building SS and WS have much less impact on the overall performance of the building.

3.3. Verification of Prediction Model

After the prediction model was built, seven schemes were randomly selected for performance simulation and classification prediction to verify the accuracy of the model prediction. Since most of the 5000 design schemes used in this paper are labeled as C, this paper selects two class A schemes, one class B scheme, and four class C schemes for prediction verification. We compared actual and predicted labels; the results are shown in Table 7 and Figure 9.
It can be seen from Table 7 that the prediction performance of the model is good, but in the prediction process, the scheme is marked as C and is predicted as A. In addition, by comparing the schemes corresponding to labels A, B, and C, the WA of schemes A and B ranges from 12 to 16, and the orientation of these schemes is due south.

4. Discussion

This paper proposes a library design process combining MOO and LightGBM algorithm. The design process has advantages in efficiency and practicability, which is convenient for architects to get feedback quickly and make a more reasonable design strategy in the initial design. Compared with previous studies that only carried out a numerical prediction for specific schemes, the proposed label classification of schemes according to their comprehensive performance is more intuitive.
In order to further verify the advantages of the LightGBM algorithm, this study uses Decision Tree, KNN, and Random Forest for comparative analysis. The classification prediction performance of the four algorithms is shown in Table 8. As can be seen, the LightGBM algorithm has the highest F1-Score of 0.851, which is an ideal classification prediction algorithm. The worst prediction algorithm was the Random Forest algorithm, with an F1-Score of 0.816.
In addition, the efficiency of the LightGBM algorithm is noteworthy. Compared with the traditional process of “modeling-setting parameters-building performance simulation”, the trained LightGBM algorithm can accurately predict the building performance of the design scheme in a short time, significantly saving labor and time costs.
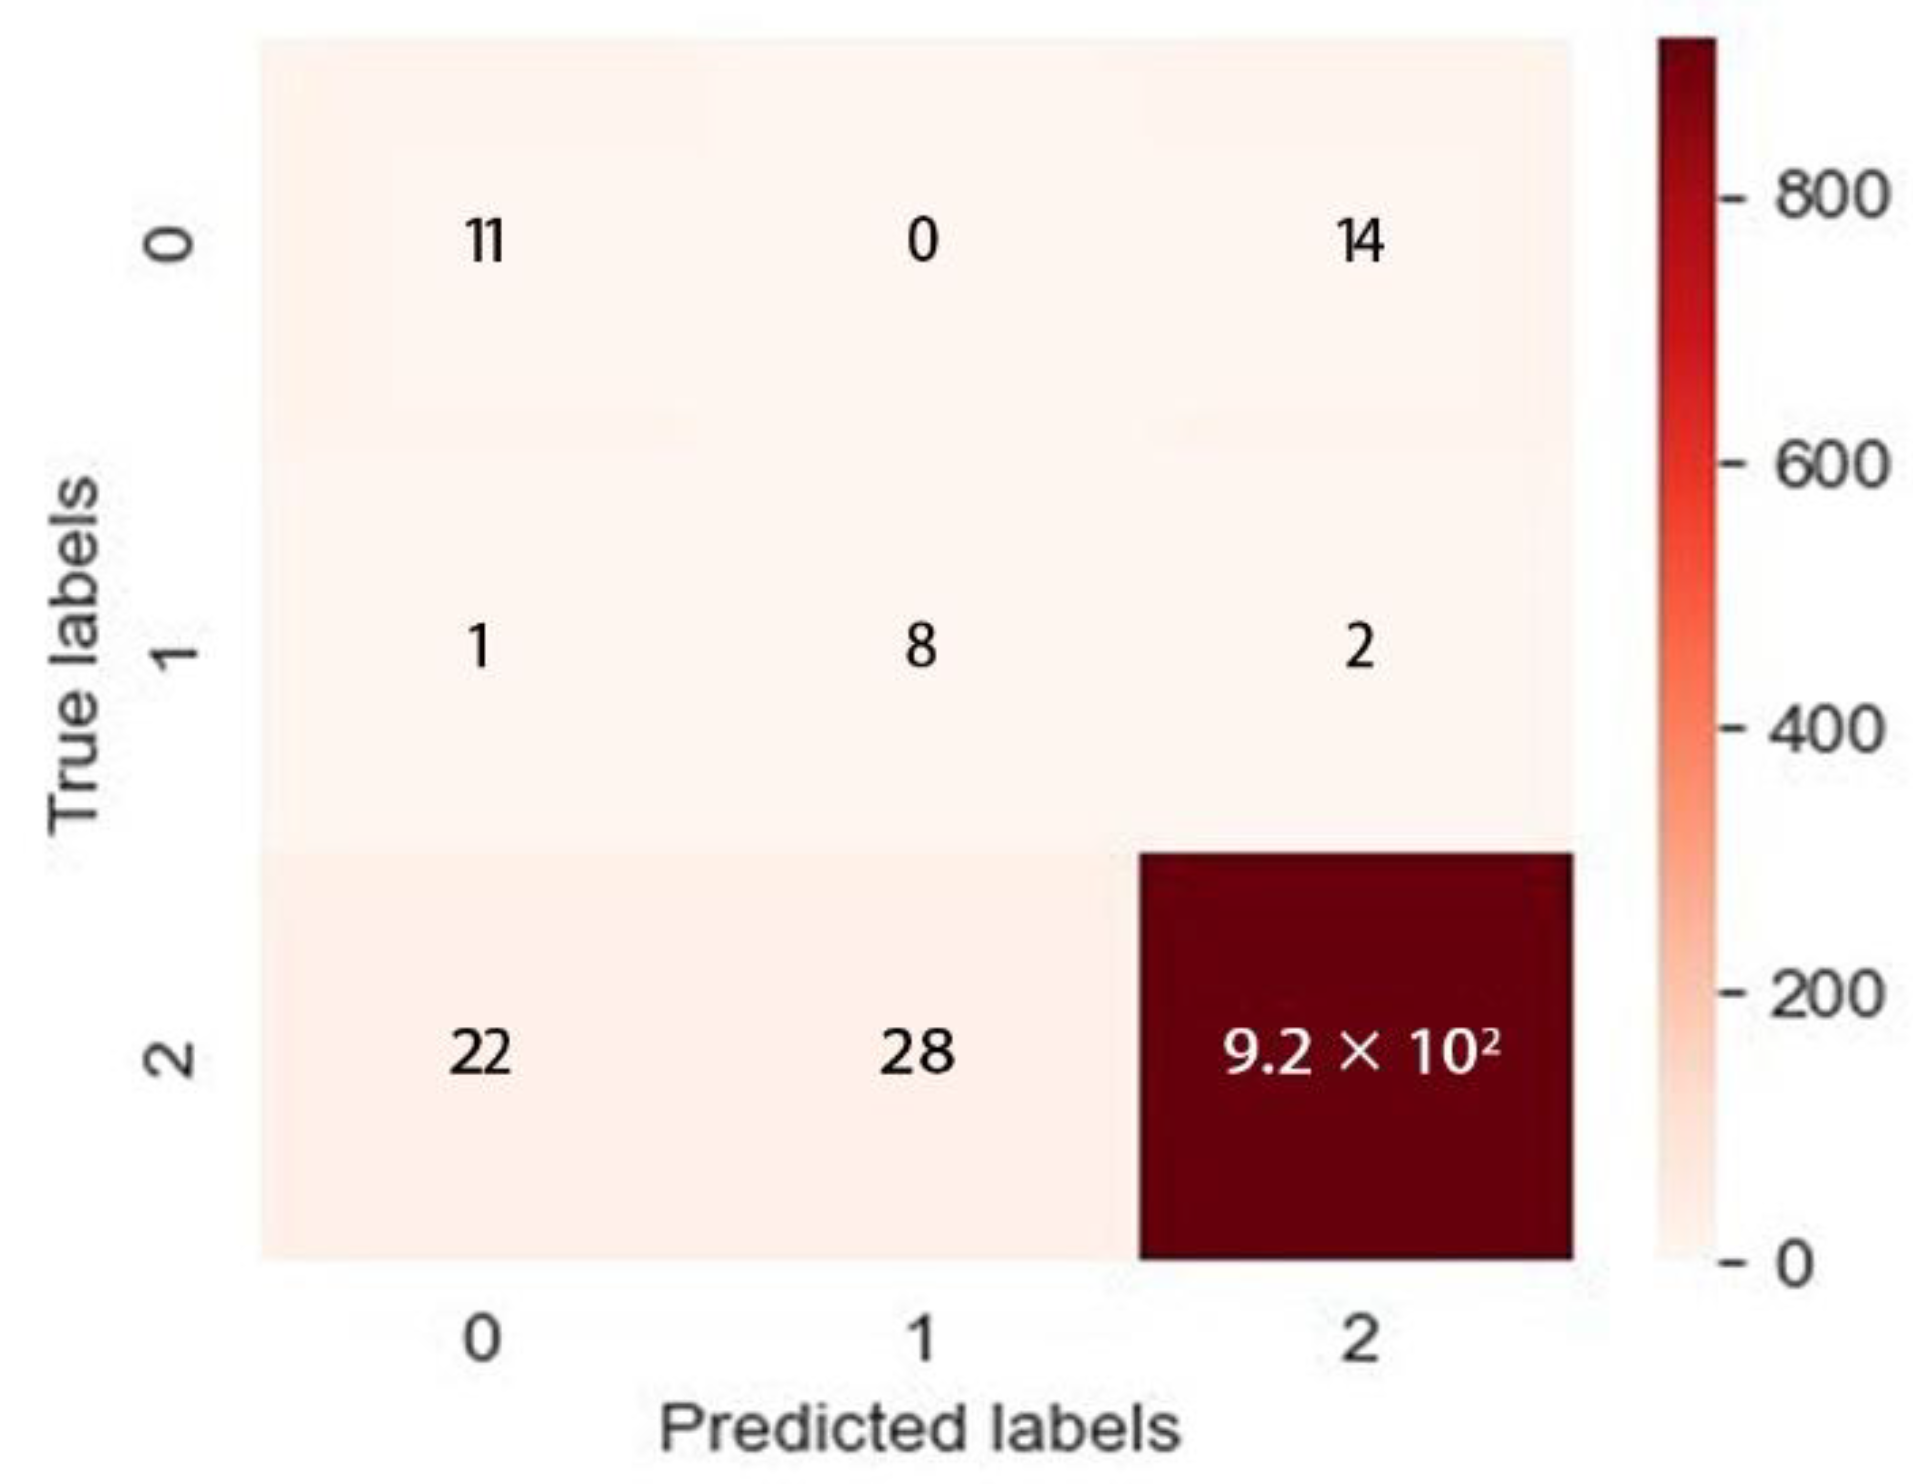
Nevertheless, objectively speaking, the classification prediction model proposed in this study needs to be further optimized. Through the confusion matrix of the prediction model, we can see that there are still some errors in the prediction results. Consider that the feature variables set in this paper are only 5, and the dataset is only 5000 groups. Due to the small data sets, the accuracy and generalization ability of the model can be further optimized. Follow-up research can consider adding more characteristic variables and expanding the number of data sets to try to build a more accurate and effective algorithm model.
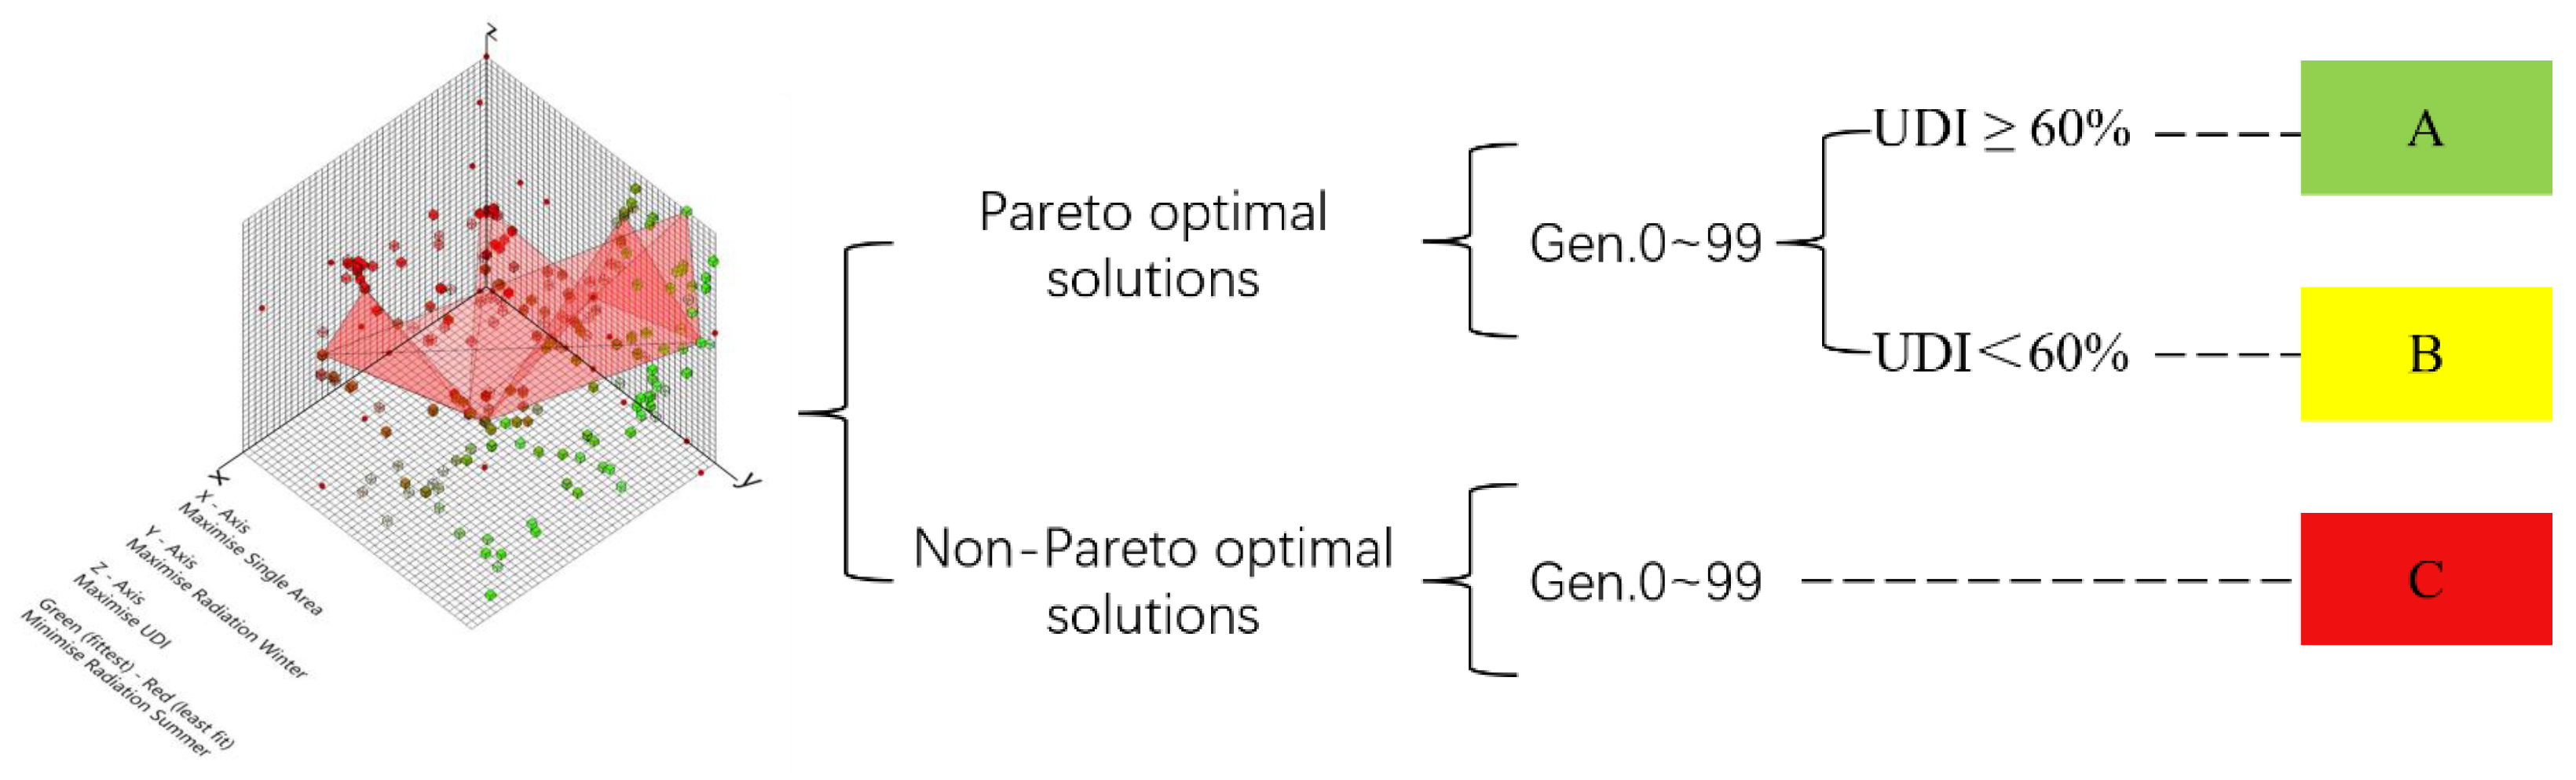
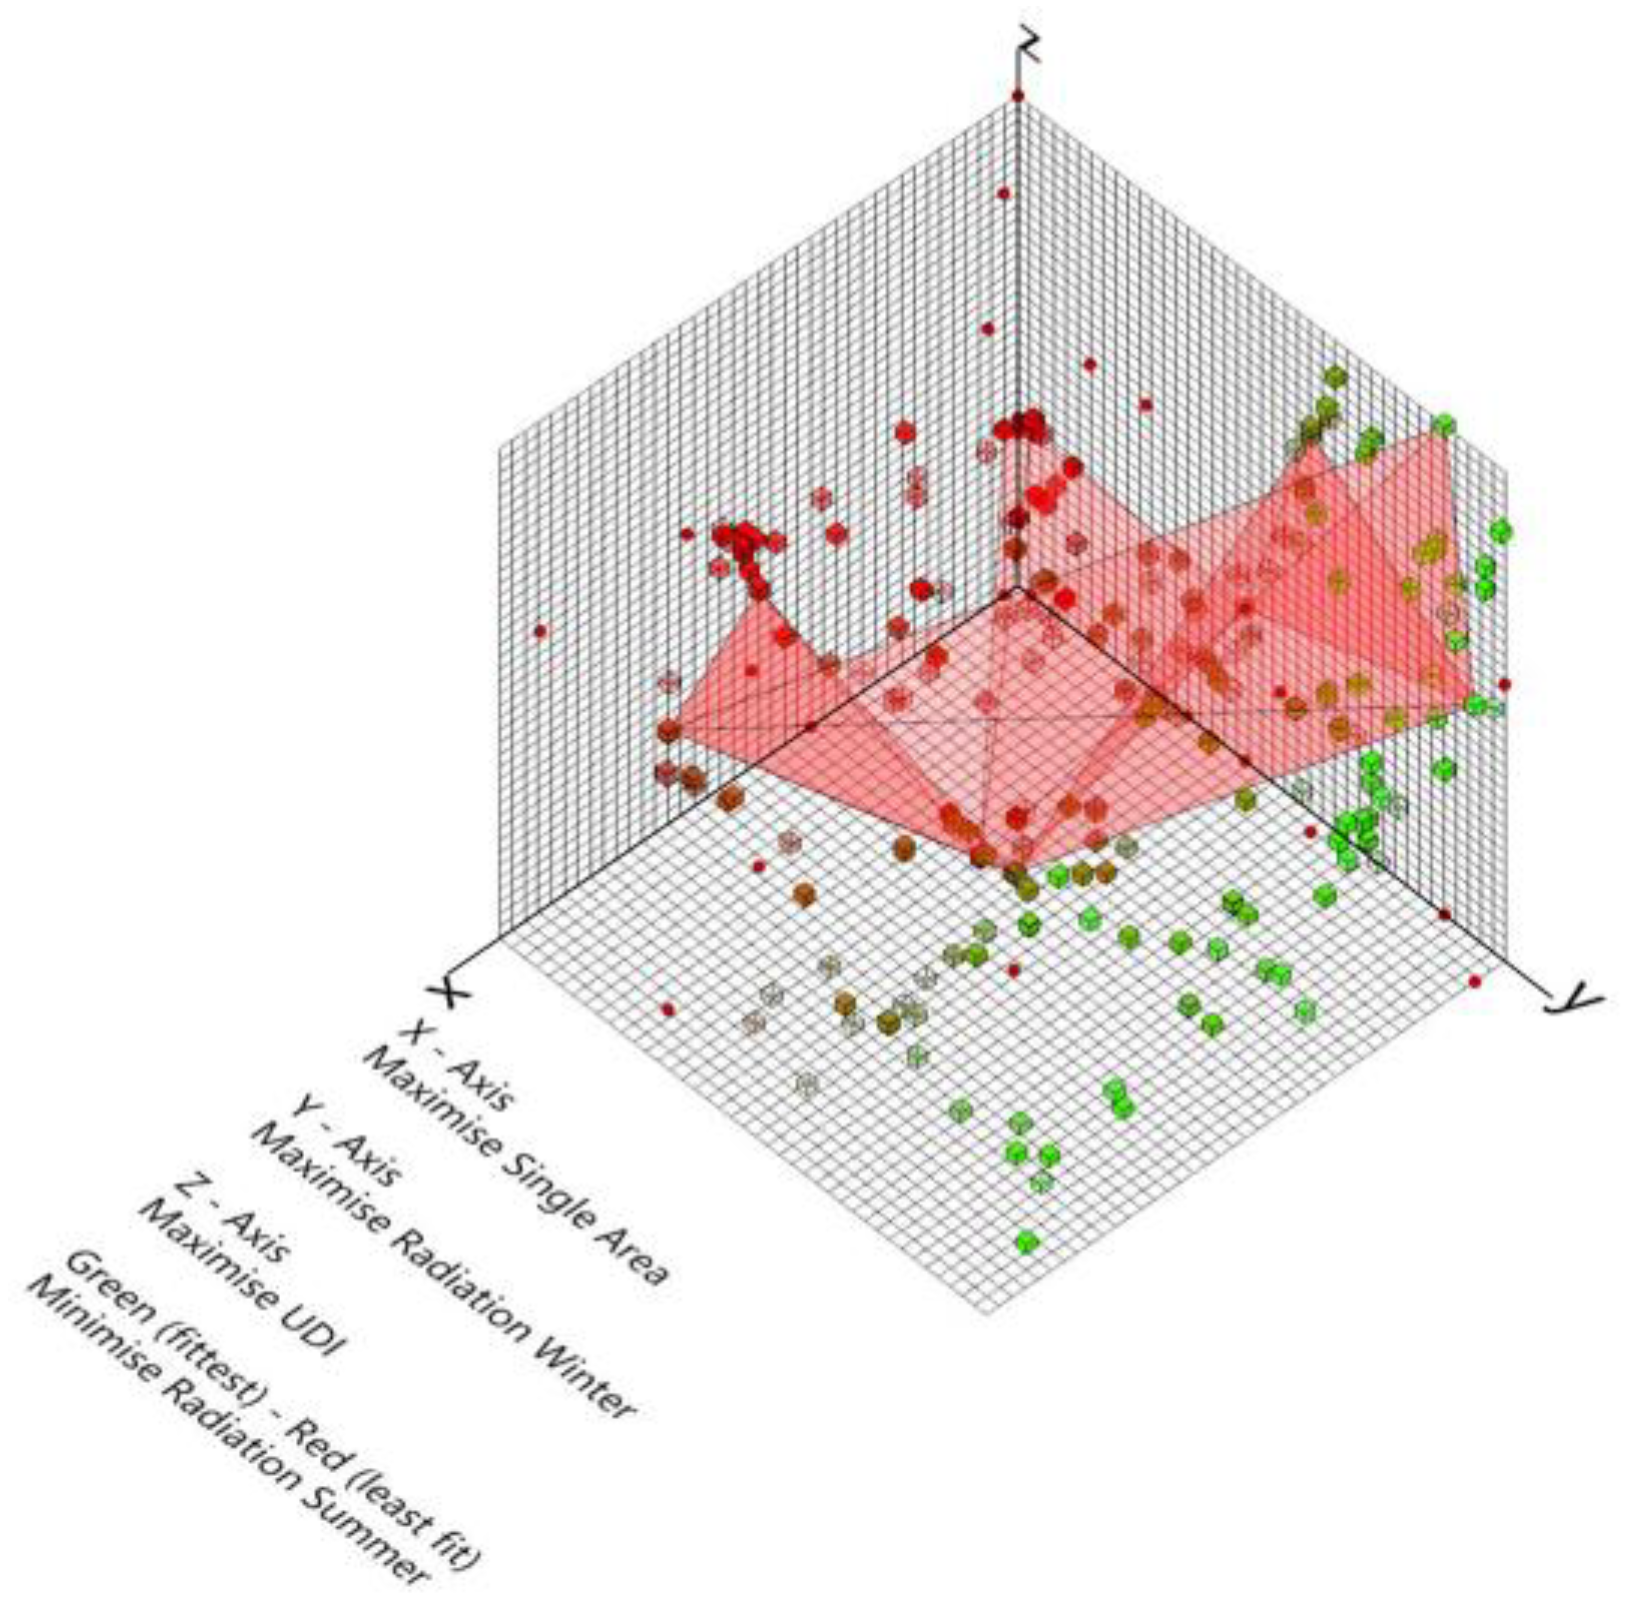
Finally, it is worth noting that UDI is used as the primary reference variable in this study to predict and classify design schemes and reflect the indoor lighting situation of the library. In this paper, the lighting performance of the building is mainly investigated, but the thermal environment, acoustic environment, and other performance indexes are not thoroughly investigated. Due to the large area of the research object in this paper, it takes a long time to simulate the thermal environment of many different schemes, so it is not involved. Other performance indicators, such as APMV, DA, and building energy consumption, can be used as the standard of design scheme classification in subsequent studies. For example, APMV has a clear classification standard for thermal comforts, such as “0” corresponds to “comfortable” and “+3” corresponds to “hot”, which is very suitable for building a multi-classification algorithm model.

5. Conclusions

In order to quickly predict and effectively optimize the comprehensive performance of the library, this study analyzes the feasibility of the LightGBM algorithm applied to architectural design and constructs the corresponding research framework. Taking a university library in Urumqi as the research object, this study generates 5000 groups of design schemes by adjusting five feature variables and classifies the labels according to the comprehensive performance to train the LightGBM multi-classification prediction model. Second, the GridSearchCV method was used to adjust the hyperparameters of the prediction model, and the F1-score of the optimized LightGBM model reached 0.851. Finally, the supervised learning method constructed several multi-classification prediction models to compare the performance with the LightGBM model. The conclusion of this paper shows that the LightGBM algorithm applied to the early design of libraries can help architects to design the design scheme with excellent comprehensive performance quickly and effectively and has better performance than other prediction models.
Most of the previous studies focused on the numerical prediction of specific performance indexes of specific buildings, which can be studied on a single performance index but cannot quickly and intuitively reflect the comprehensive performance of buildings. The multi-classification prediction model proposed in this paper can classify different schemes according to the comprehensive performance of the building so that the architect can choose the better scheme in the early stage of the design.
However, this study also has many areas that deserve improvement. First, this study only focuses on the architectural form and facade design at the initial stage of library design and fails to consider other design variables more comprehensively. Second, this paper only focuses on studying the building’s light environmental performance, which can be further carried into the study of other performance objectives. Finally, the research framework proposed in this study applies to specific studies and can be used as a reference for similar studies, but its universality is limited.
Subsequent studies must consider more complex design variables and comprehensive performance indicators to carry out multi-objective optimization and fast and accurate prediction classification. Subsequent research should continue to explore the application of other algorithmic models in the field of architectural design to assist architects in solving complex problems in the design process and provide reasonable and practical solutions. We can also try to link it to BIM to make it more automated.

Author Contributions

Conceptualization, Y.Z. and W.W.; methodology, Y.Z., W.W. and K.W.; software, Y.Z. and J.S.; validation, K.W. and Y.Z.; formal analysis, Y.Z.; investigation, Y.Z.; writing—original draft preparation, Y.Z.; writing—review and editing, Y.Z., W.W. and J.S.; All authors have read and agreed to the published version of the manuscript.

Funding

This work was supported by the National Natural Science Foundation of China Study on Thermal Protection Mechanism and Tectonic System of Buildings in Turpan Area (Grant 431No. XJEDU2019I006).

Institutional Review Board Statement

Not applicable.

Informed Consent Statement

Informed consent was obtained from all subjects involved in the study.

Data Availability Statement

The data presented in this study are available on request from the first author.

Conflicts of Interest

The authors declare no conflict of interest.

References

  1. China Association of Building Energy Efficiency. China Building Energy Consumption Research Report 2020. Available online: https://adminht.cabee.org/upload/file/20201231/1609385995876762.pdf (accessed on 15 June 2022).
  2. Ma, H.; Du, N.; Yu, S.; Lu, W.; Zhang, Z.; Deng, N.; Li, C. Analysis of typical public building energy consumption in northern China. Energy Build. 2017, 136, 139–150. [Google Scholar] [CrossRef]
  3. Li, Y. Energy Conservation and Green Building Design of Library Case Study on the New Hubei Library. Appl. Mech. Mater. 2013, 438–439, 1746–1750. [Google Scholar] [CrossRef]
  4. Abdullahi, A.; Monica, M.; Andrew, A.; Kassim, C. Integrated Performance Optimization of Higher Education Buildings Using Low-Energy Renovation Process and User Engagement. Energies 2021, 14, 1475. [Google Scholar]
  5. Jiao, X.; Yibo, W.; Mingxiang, W. Smart Design of Portable Indoor Shading Device for Visual Comfort—A Case Study of a College Library. Appl. Sci. 2021, 11, 10644. [Google Scholar]
  6. Urdangarín, G.M.G.; Cruz, S.J.A.; Luiz, P.F. A simulated case study of a library in Brazil to improve energy efficiency. Acta Sci. Technol. 2020, 42, e47262. [Google Scholar]
  7. Röck, M.; Hollberg, A.; Habert, G.; Passer, A. LCA and BIM: Visualization of environmental potentials in building construction at early design stages. Build. Environ. 2018, 140, 153–161. [Google Scholar] [CrossRef]
  8. Fang’ai, C.; Ying, X. Building performance optimization for university dormitory through integration of digital gene map into multi-objective genetic algorithm. Appl. Energy 2022, 307, 118211. [Google Scholar]
  9. Ruochen, Z.; Abdol, C.; Robert, R. Innovative design for sustainability:Integrating embodied impacts and costs during the early design phase. Eng. Constr. Archit. Manag. 2020. ahead-of-print. [Google Scholar]
  10. Faridaddin, V.; Negar, S.; Amin, H. Optimization of PV modules layout on high-rise building skins using a BIM-based generative design approach. Energy Build. 2022, 258, 111787. [Google Scholar]
  11. Chandra, P.H.; Clinton, A.; Tianzhen, H. Generating synthetic occupants for use in building performance simulation. J. Build. Perform. Simul. 2021, 14, 712–729. [Google Scholar]
  12. Mahan, S.M.; Chirag, D.; Philipp, G. Early-stage design support combining machine learning and building information modelling. Autom. Constr. 2022, 136, 104147. [Google Scholar]
  13. Hainan, Y.; Ke, Y.; Guohua, J. Optimization and prediction in the early design stage of office buildings using genetic and XGBoost algorithms. Build. Environ. 2022, 218, 109081. [Google Scholar]
  14. Longwei, Z.; Chao, W.; Yu, C.; Lingling, Z. Multi-Objective Optimization Method for the Shape of Large-Space Buildings Dominated by Solar Energy Gain in the Early Design Stage. Front. Energy Res. 2021, 2021, 700. [Google Scholar]
  15. Giovanna, D.L.; Franz, B.M.D.; Ilaria, B.; Vincenzo, C. Accuracy of Simplified Modelling Assumptions on External and Internal Driving Forces in the Building Energy Performance Simulation. Energies 2021, 14, 6841. [Google Scholar]
  16. Paola, V.A.; Leon, H. Thermal Energy Performance Simulation of a Residential Building Retrofitted with Passive Design Strategies: A Case Study in Mexico. Sustainability 2021, 13, 8064. [Google Scholar]
  17. Xinyun, C.; Kaixuan, W.; Lin, X.; Wei, Y.; Baizhan, L.; Jinyang, Y.; Runming, Y. A three-stage decision-making process for cost-effective passive solutions in office buildings in the hot summer and cold winter zone in China. Energy Build. 2022, 268, 112173. [Google Scholar]
  18. Salata, F.; Ciancio, V.; Dell’Olmo, J.; Golasi, I.; Palusci, O.; Coppi, M. Effects of local conditions on the multi-variable and multi-objective energy optimization of residential buildings using genetic algorithms. Appl. Energy 2020, 260, 114289. [Google Scholar] [CrossRef]
  19. Giovanni, T.; Ricardo, F.; Pierre, B.; Dimitrios, N. An Innovative Modelling Approach Based on Building Physics and Machine Learning for the Prediction of Indoor Thermal Comfort in an Office Building. Buildings 2022, 12, 475. [Google Scholar]
  20. Zhuang, D.; Wang, T.; Gan, V.J.; Zhao, X.; Yang, Y.; Shi, X. Supervised learning-based assessment of office layout satisfaction in academic buildings. Build. Environ. 2022, 216, 109032. [Google Scholar] [CrossRef]
  21. Jia, B.; Hou, D.; Kamal, A.; Hassan, I.G.; Wang, L. Developing machine-learning meta-models for high-rise residential district cooling in hot and humid climate. J. Build. Perform. Simul. 2022, 15, 553–573. [Google Scholar] [CrossRef]
  22. Maria, S.H.J.; Manuel, L.G.J.; Ivan, F.A.; Ekaitz, Z. Energy and thermal modelling of an office building to develop an artificial neural networks model. Sci. Rep. 2022, 12, 8935. [Google Scholar]
  23. Yuquan, X.; Wen, H.; Xilin, Z.; Shuting, Y.; Chuancheng, L. Artificial Neural Network Modeling for Predicting and Evaluating the Mean Radiant Temperature around Buildings on Hot Summer Days. Buildings 2022, 12, 513. [Google Scholar]
  24. Domenico, P.; Iole, N.; Cinzia, B. Artificial Neural Network for the Thermal Comfort Index Prediction: Development of a New Simplified Algorithm. Energies 2020, 13, 4500. [Google Scholar]
  25. Yujie, X.; Vivian, L.; Edson, S. Using Machine Learning to Predict Retrofit Effects for a Commercial Building Portfolio. Energies 2021, 14, 4334. [Google Scholar]
  26. Marco, P.; Massimiliano, S.; Greta, R.A.; Laura, G.; Luigi, S. Artificial Neural Networks to Optimize Zero Energy Building (ZEB) Projects from the Early Design Stages. Appl. Sci. 2021, 11, 5377. [Google Scholar]
  27. Fernández, E.; Beckers, B.; Besuievsky, G. A fast daylighting method to optimize opening configurations in building design. Energy Build. 2016, 125, 205–218. [Google Scholar] [CrossRef]
  28. Mahsa, R.; Shahnaz, P.; Haniyeh, S. Daylight optimization through architectural aspects in an office building atrium in Tehran. J. Build. Eng. 2020, 33, 101718. [Google Scholar]
  29. Cantin, F.; Dubois, M.-C. Daylighting metrics based on illuminance, distribution, glare and directivity. Light. Res. Technol. 2011, 43, 291–307. [Google Scholar] [CrossRef]
  30. Stevenin, M. Genetic Algorithm Reflects the Process of Natural Selection. Int. J. Swarm Intell. Evol. Comput. 2020, 9, 197. [Google Scholar]
  31. Pilechiha, P.; Mahdavinejad, M.; Pour Rahimian, F.; Carnemolla, P.; Seyedzadeh, S. Multi-objective optimisation framework for designing office windows: Quality of view, daylight and energy efficiency. Appl. Energy 2020, 261, 114356. [Google Scholar] [CrossRef]
  32. Chi, D.A.; González, M.E.; Valdivia, R.; Gutiérrez, J.E. Parametric Design and Comfort Optimization of Dynamic Shading Structures. Sustainability 2021, 13, 7670. [Google Scholar] [CrossRef]
  33. Zhongbo, H.; Ting, Z.; Qinghua, S.; Mianfang, L. A niching backtracking search algorithm with adaptive local search for multimodal multiobjective optimization. Swarm Evol. Comput. 2022, 69, 101031. [Google Scholar]
  34. Xinwei, L.; Haixia, D.; Wubin, H.; Runxia, G.; Bolong, D. Classified Early Warning and Forecast of Severe Convective Weather Based on LightGBM Algorithm. Atmos. Clim. Sci. 2021, 11, 284–301. [Google Scholar]
  35. Mohammadiziazi, R.; Bilec, M.M. Application of Machine Learning for Predicting Building Energy Use at Different Temporal and Spatial Resolution under Climate Change in USA. Buildings 2020, 10, 139. [Google Scholar] [CrossRef]
  36. Saigal, P.; Chandra, S.; Rastogi, R. Multi-category ternion support vector machine. Eng. Appl. Artif. Intell. 2019, 85, 229–242. [Google Scholar] [CrossRef]
  37. Qian, R.; Wu, Y.; Duan, X.; Kong, G.; Long, H. SVM Multi-Classification Optimization Research based on Multi-Chromosome Genetic Algorithm. Int. J. Perform. Eng. 2018, 14, 631. [Google Scholar] [CrossRef]
  38. Sun, X.; Liu, M.; Sima, Z. A novel cryptocurrency price trend forecasting model based on LightGBM. Financ. Res. Lett. 2020, 32, 101084. [Google Scholar] [CrossRef]
  39. Gu, J. A Novel Credit Risk Assessment Model Based on LightGBM. J. Simul. 2020, 8, 71. [Google Scholar]
  40. Yang, S.; Zhang, H. Comparison of Several Data Mining Methods in Credit Card Default Prediction. Intell. Inf. Manag. 2018, 10, 115–122. [Google Scholar] [CrossRef] [Green Version]
  41. Lan, V.H.; Wai, N.K.T.; Amy, R.; Chunjiang, A. Analysis of input set characteristics and variances on k-fold cross validation for a Recurrent Neural Network model on waste disposal rate estimation. J. Environ. Manag. 2022, 311, 114869. [Google Scholar]
  42. Yevenyo, Z.Y.; Hu, Y.; Rodrigo, T.A.; Basommi, L.P. Coordinate Transformation between Global and Local Datums Based on Artificial Neural Network with K-Fold Cross-Validation: A Case Study, Ghana. Earth Sci. Res. J. 2019, 23, 67. [Google Scholar]
  43. Sara, E.; Zoltan, O. A Sensitivity Analysis for Thermal Performance of Building Envelope Design Parameters. Sustainability 2021, 13, 14018. [Google Scholar]
  44. Anqi, Z.; Rui, C.; Fang, Q.; Wenyao, Z.; Qiuwang, W.; Cunlu, Z. Topology optimization for a water-cooled heat sink in micro-electronics based on Pareto frontier. Appl. Therm. Eng. 2022, 207, 118128. [Google Scholar]
Figure 1. Technical route.
Buildings 12 01309 g001
Figure 2. Energy saving design strategy.
Buildings 12 01309 g002
Figure 3. Data set label classification.
Buildings 12 01309 g003
Figure 4. Pareto optimal and non-optimal solutions.
Buildings 12 01309 g004
Figure 5. Distribution of different labels.
Buildings 12 01309 g005
Figure 6. Distribution of each design variable.
Buildings 12 01309 g006
Figure 7. Confusion matrix for predictive classification.
Buildings 12 01309 g007
Figure 8. Sensitivity analysis of each design variable.
Buildings 12 01309 g008
Figure 9. Performance simulation results for seven random cases.
Buildings 12 01309 g009
Table 1. Setting of independent variables.
Characteristics of the VariableUnitsValue RangeStep Length
COdegree−30~301
WAm10~301
SHm4.2~5.20.1
SSm0.5~1.50.1
WSm0.2~1.20.1
Table 2. Weather data for the Nanjing area on an annual basis.
Meteorological ParameterValues
Dry bulb temperature7.14 °C
Dew point temperature3.26 °C
Relative humidity75.46%
Wind speed2.23 m/s
Wind direction166.40°
Direct normal radiation183.32 Wh/m2
Diffuse horizontal radiation48.44 Wh/m2
Mean summer temperature13~24 °C
Mean winter temperature−13~−4 °C
Barometric pressure91,350.82 Pa
Table 3. Boundary condition settings for office buildings.
Building ComponentsReflectance
Interior wall0.8
Floor0.3
Interior ceiling0.5
Exterior shade0.3
Windows0.15
Table 4. The genetic algorithm settings.
Boundary ConditionsValues
Generation Size50
Generation Count100
Crossover Probability0.9
Crossover Distribution Index20
Mutation Distribution Index20
Random Seed1
Table 5. Description of the classification label.
LabelDescription
ADesirable scheme
BAcceptable scheme, lighting scheme needs to be improved
CPoor scheme, poor performance in all aspects
Table 6. The tuned hyperparameters and evaluation metrics of LightGBM model.
Boosting TypeNum LeavesMax DepthLearning Raten_EstimatorsPrecisionRecallF1-Score
gbdt16None0.011000.780.930.851
Table 7. Design variables and labels for five random cases.
Serial NumberWACOSHSSWSTrue LabelPredicted Label
11624.90.50.5AA
21424.21.20.5AA
312−105.21.50.2BB
414−255.11.50.8CC
527−65.11.50.3CA
61114.91.40.2CC
71004.20.51.2CC
Table 8. Performance comparison of different algorithms.
AlgorithmF1-Score
Decision Tree0.832
KNN0.832
Random Forest0.816
LightGBM0.851
Publisher’s Note: MDPI stays neutral with regard to jurisdictional claims in published maps and institutional affiliations.

