1. Introduction
During its long-term service, the mine hoisting headframe usually suffered from different damages induced by frequent lifting and atmospheric corrosion. For towering headframe structures composed of closed steel trusses, the corrosion damages are difficult to detect, which threatens the safety of the structure and even leads to collapse accidents. Research on the rapid damage identification method for towering headframe structures is of practical significance [
1].
At present, the modal parameter-based method is most widely used for damage identification of structures [
2,
3,
4,
5,
6,
7,
8]. Pandy et al. [
9] firstly realized the damage location of simply supported beams via curvature mode and quantified the damage degree using the change value of curvature mode. The damage detection method of truss bridges based on frequency variation was proposed and verified by Patil et al. [
10] through numerical simulation. Zhang et al. [
11] identified structural damage of a single-layer reticulated shell via combined modal strain energy index. Le et al. [
12] presented an enhanced method to locate and quantify damage in beam-like structures using changes in deflections estimated from modal flexibility (MF) matrices. Zare et al. [
13] combined the modal assurance criterion with the compliance matrix to identify the damage of a five-story shear frame structure. A method for estimating the mass distribution compliance matrix through only output of the vibration data was proposed by Bernagozzi et al. [
14] and was used for damage detection. However, there are certain limitations and different sensitivities to damage in existing methods. In practical engineering, towering structures with trusses such as steel headframes often suffer damage in multiple locations, and the single index method is easily disturbed by the undamaged position, resulting in misjudgment and reducing identification accuracy.
Due to limitations of the single damage index method, many scholars introduce data fusion into structural damage identification to improve the identification accuracy [
15,
16,
17,
18,
19,
20]. Grande et al. [
21,
22] used the D-S evidence theory to realize beam structural damage based on the classical index of flexibility matrix and modal strain energy. Then, a multi-stage approach for damage detection in structural applications in the case of multiple damage locations and three-dimensional systems was proposed by Grande et al. [
23]. Based on Bayesian theory and improved immune genetic algorithm (IGA), Guo et al. [
15,
24] fused modal strain energy and frequency to identify multi-position damage and identify structural damage extent. A multiple damage identification method based on multi-scale space theory and data fusion was proposed by Guo et al. [
25], which has good anti-noise ability. Bao et al. [
26] fused the multi-sensor data by using D-S evidence theory for truss structure damage identification. Wang, et al. [
27] combined the strain modal flexibility and data fusion technique, which effectively identifies multiple minor damage. Information from different data sources was combined through data fusion technology to realize information complementarity [
28], which obtains a more reliable damage condition and improves the accuracy of multi-position damage identification.
According to the existing research results, the mine steel headframe was taken as the research object to study the damage and degradation law through numerical simulation and field test in this paper. The novelty of the paper includes: (1) The rapid parametric modeling of the towering steel truss headframe was implemented by using the ANSYS secondary development. (2) The multi-index data fusion method based on D-S evidence theory was proposed, which could locate the damage of headframe accurately. (3) A multi-point corrosion damage random distribution modeling method was developed, which verifies the accuracy of the proposed damage identification method.
2. Methodology
During its long-term service, the mine hoisting headframe usually suffered from different damages, which affects the safety of the structure. Therefore, the damage and degradation law of towering steel truss headframes was studied by finite element simulation and field test. However, for towering headframe structures composed with closed steel trusses, the conventional static test cannot obtain the corrosion of internal composition.
The stiffness would be reduced when the structure was damaged locally, which would cause its modal characteristic parameters (such as natural frequency, vibration mode, et al.) to be different from the nondestructive status. The damage location would then be determined by parameter variation. Therefore, the damage identification of headframe was carried out based on the modal data in this paper. The process of damage identification is shown in
Figure 1. First of all, the rapid parametric modeling and analysis of the towering steel truss headframe was implemented by using the ANSYS secondary development. The modal data of the headframe were obtained by numerical simulation. Then, based on modal data obtained by finite element simulation, single damage indexes were calculated. Finally, an approach which combines traditional damage indexes with D-S evidence theory was proposed, and the location of damage was identified.
This section is devoted to providing the necessary background to the approach proposed in this paper as follows and presented in detail in
Section 4.
2.1. Secondary Development of ANSYS
There is a good secondary development function in ANSYS, APDL (ANSYS Parametric Design Language), in that it has the advantage of realizing a finite element analysis process, making it widely used. In this paper, a special headframe parametric modeling and modal analysis program was designed. The basic flow of the program is shown in
Figure 1. Firstly, macro files were created for each function module. Then, toolbar buttons were added defined to call each macro. The macro files that were created in this process and their accompanying functions were as follows:
Model.mac: finite element modeling module, geometric dimensions and mesh partition parameters of vertical frame and diagonal brace were input interactively, and then finite element model was established.
Damage.mac: simulating headframe damages, inputting the location and degree of damage interactively and simulating corrosion damage by reducing the section size.
Solve.mac: solving calculation module, defining constraints and applying loads, setting the solution parameters and solving.
Modal-displacement.mac: modal displacement extraction module, viewing and saving the modal displacement of the headframe structure.
When the ANSYS program is running, the FEA-Model button on the toolbar is clicked, and the geometric parameters of the headframe are input in the pop-up dialog box. Clicking OK will have the program run automatically to complete the rapid modeling of the headframe. Then, the Damage button, Load-solve button and Modal-Displacement button in the toolbar are clicked successively. The corresponding parameters are in the pop-up Inputting dialog box, and we then wait for the automatic operation of the program to realize simulation damage, modal analysis and modal displacement extraction.
2.2. Damage Identification Index
In this paper, superimposed curvature modal difference [
29] and modal flexibility difference curvature [
30] were selected for damage identification.
2.2.1. Superimposed Curvature Mode Difference
Curvature modes cannot be obtained directly. In this paper, curvature modes were calculated by displacement mode difference method:
In the above formula, and are the i-th displacement mode and curvature mode of the k-th measuring point, respectively, and h is the distance between two adjacent measuring points.
The curvature mode difference is not sensitive to modal node damage, and the sensitivity of different curvature modes to structural damage is also different. Therefore, the multi-order curvature modes are superimposed: the absolute value of curvature mode was taken and then divided by the maximum value of the absolute value of the curvature mode in the non-damaged state for normalization. Finally, the first n superimposed curvature modal difference (SCMD) is as follows:
2.2.2. Modal Flexibility Difference Curvature
Given the natural frequency and mode shape of the structure, the structural flexibility matrix can be constructed as follows:
In the above formula, is the natural frequency of the structure, and is the corresponding modal mass normalized vibration mode (). It can be seen from the above formula that the structural flexibility matrix is inversely proportional to the change of the natural frequency. Therefore, the relatively accurate flexibility matrix can be constructed by the low order frequencies and vibration mode.
and
are used to represent the flexibility matrix of damaged and undamaged structure, respectively. The difference of modal flexibility matrix
is then as follows:
The diagonal elements
of the matrix
are used for damage identification, and the finite difference method is used to calculate its curvature to obtain the modal flexibility difference curvature (MFDC). In the formula,
is the distance between two adjacent measuring points:
2.3. D-S Evidence Theory
Data fusion represents a procedure where information derived from multiple sources is combined to enhance the accuracy and the efficiency of the answer. The local decisions provided by each source can be fused and a global decision can be obtained. D-S evidence theory was popularly used in the damage identification because of a strong mathematical basis [
31].
is used to represent the i-th element of column, and all elements of headframe column constitute a damage identification frame
. The power set of
expressed
is composed of all the subset of
. It contains the possible solutions of all damage states, including no damage, single damage and multiple damage.
The elements in
are mutually exclusive and complete. For any subset A, there exists a mapping of the basic probability distribution function m to A satisfies m:
, and the following conditions are also satisfied:
m(A) is the basic probability assignment of the possible solution A of headframe column damage. Assuming that there is evidence X and its corresponding basic probability distribution function
on the recognition framework, then:
The classical conflict coefficient is positively correlated with the degree of conflict between evidence, calculated by formula . n is the number of damage identification indexes.
Based on D-S evidence theory, the multi-index data fusion damage identification method consisting of the one-stage fusion method and two-stage fusion method was proposed, and the identification process is shown in
Figure 2.
3. Analysis of Damage and Degradation Law of Towering Steel Headframe
During its long-term service, the mine hoisting steel headframe suffered from different damages, such as corrosion, excision, bending and support subsidence, et al. The stiffness, strength and stability of the headframe were reduced due to this damage. Therefore, the damage and degradation law of towering steel truss headframes was studied by finite element simulation and field test in this section.
3.1. Finite Element Modeling
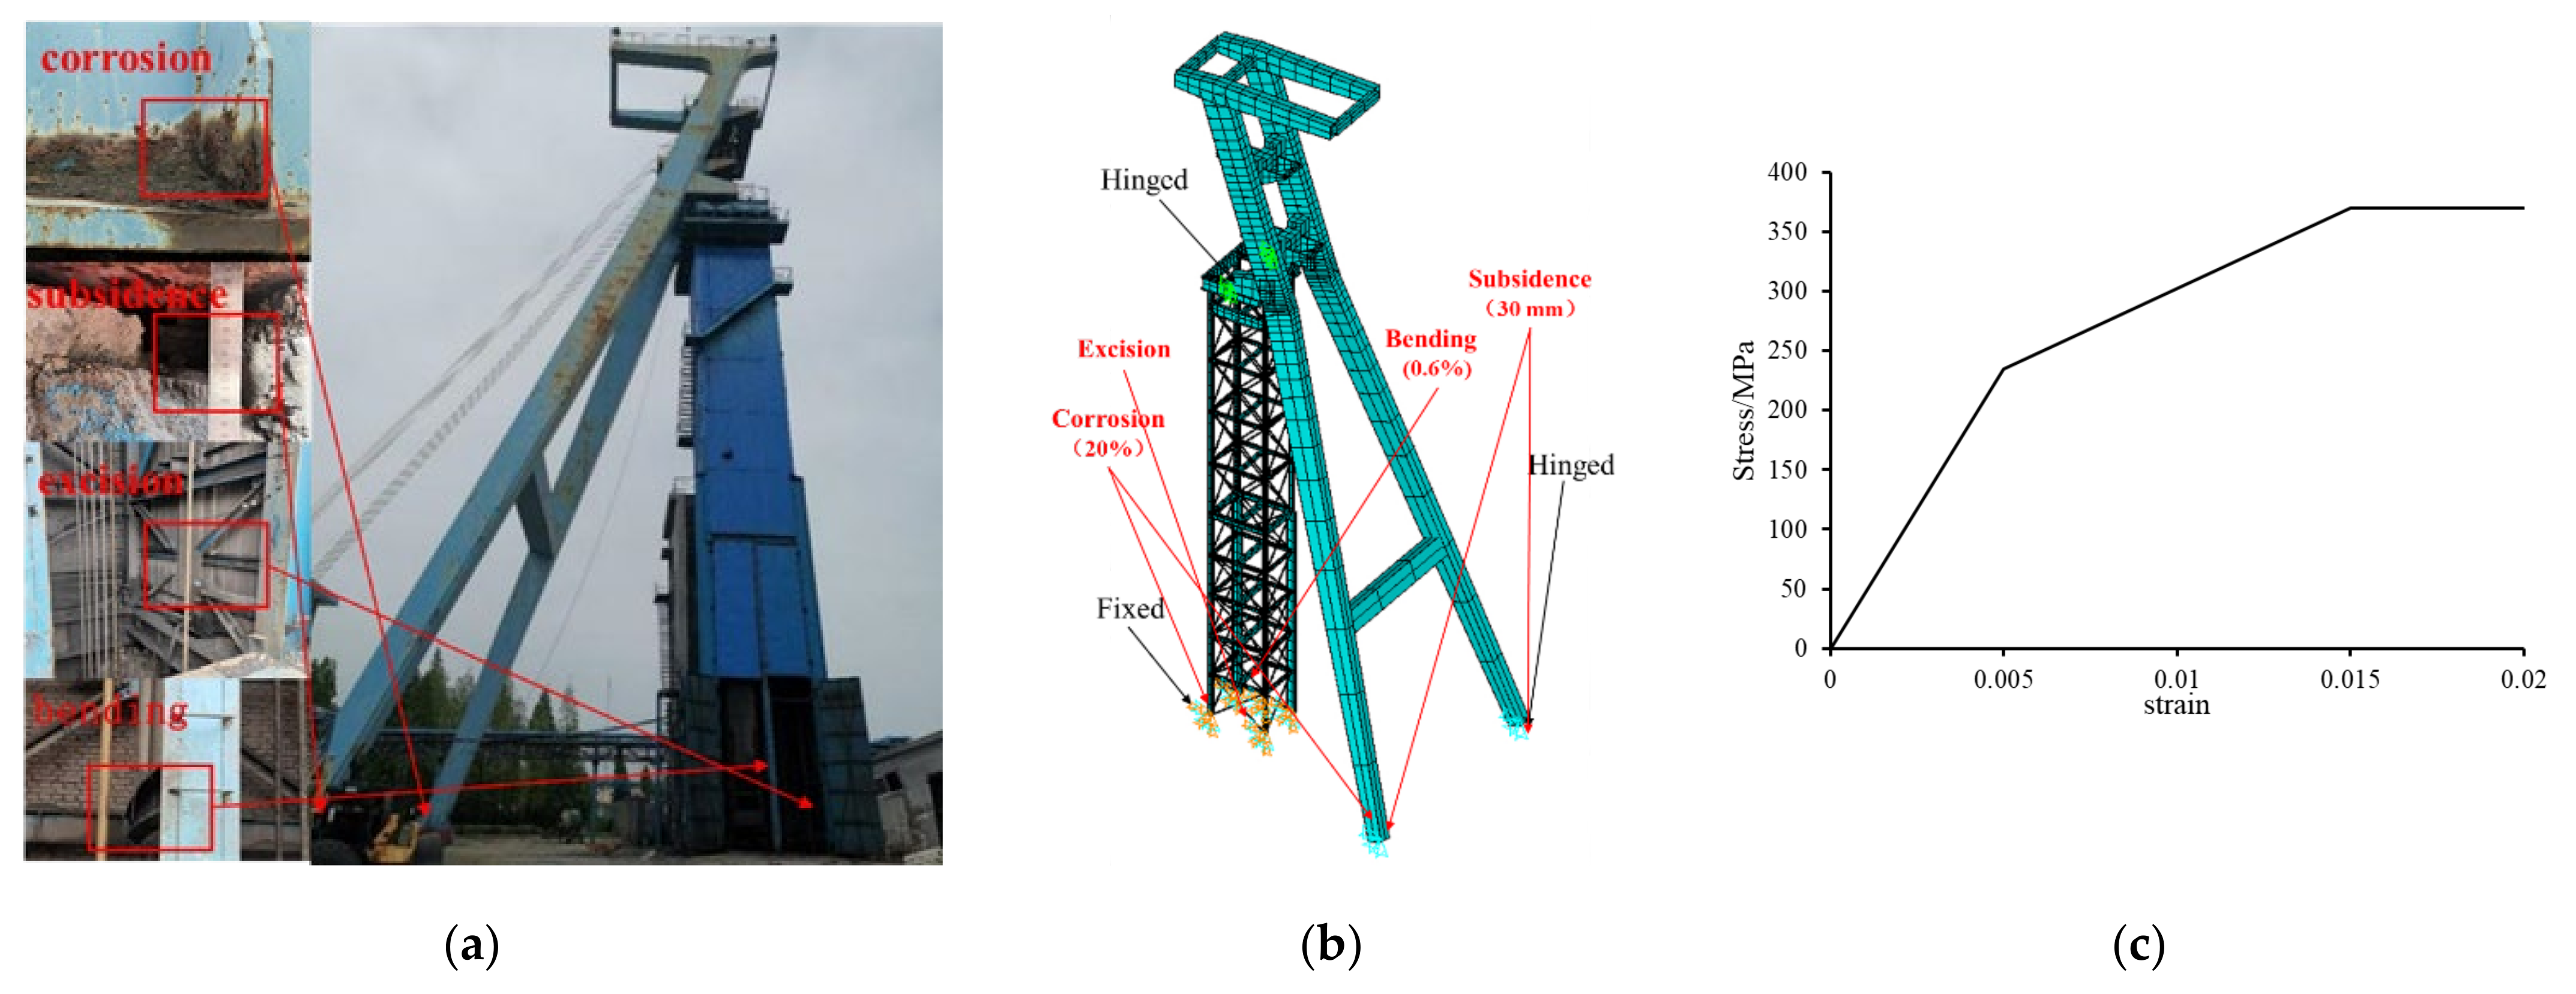
ANSYS was used for finite element modeling of headframes. In order to simplify the model and save time, BEAM188 element was used to model beams and columns, and LINK180 element was used to model inter-column supports. The FE model consisted of two parts: the vertical frame and the diagonal brace, as shown in
Figure 3. The effective height of the vertical frame was 34.5 m. The bottom of vertical frame was fixed, and the diagonal brace was hinged at the bottom. The vertical frame and the diagonal brace were connected by bolts, which was simplified as hinged. The main components of the headframe were made of Q235 steel with elastic modulus
, yield strength 235 MPa and density
. The calculation diagram of steel material properties is shown in
Figure 3c. In addition, damage was imposed on the headframe structure according to the field test results. The 20% corrosion of columns and brackets was simulated by reducing the section size. The loss of 7 inter-column supports and 3 beams of the vertical frame was simulated by life-and-death element technology. Beam bending with an offset of 0.6% of the beam length was simulated by defining curve. The support subsidence of 30 mm was simulated by applying displacement constraint. The loads acting on the headframe include permanent load, lifting load, tank beam load, wind load and other variable loads. For the convenience of calculation, the loads are simplified, and the self-weight of the headframe is simplified to the corners of each layer.
3.2. Field Test
In order to verify the accuracy of the finite element calculation results, DH1205 surface strain gauge of Donghua Testing Technology Co., Ltd., (Taizhou, China) was used to measure the headframe strain. The strain gauge can be connected with the static and dynamic strain data acquisition system to measure the strain value of the surface of the tested structure. This can realize synchronous testing and analysis of dynamic stress and strain or vibration signals. In advance, finite element simulation was used to analyze headframe stress, and the measuring points were arranged in the position of high stress, as shown in
Figure 4a. Taking a complete lift process as the time period for the measuring process, a total of 18 groups of strain data including 1 group of headframe static, 2 groups of headframe no-load operation and 15 groups of headframe heavy lifting were measured. The stress results of the test and finite element are shown in
Figure 4b and
Table 1. The damages obtained from the field test were considered in the finite element model.
Taking the stress of headframe in static as the reference state, the corresponding stress result of headframe in lifting state was calculated, and the simulated stress value of headframe structure measuring point was obtained by calculation. The relative error between simulated value and measured value was used as the basis to judge the accuracy of the simulation results.
Table 1 shows the relative error of each measurement point. The maximum relative error of the uncorroded headframe structure is 110.12%, while for the corroded headframe it is reduced to 54.01%. In general, the error of finite element simulation results is within an acceptable range, so the calculation results are reliable. Existing detection technology cannot judge the overall corrosion of the towering headframe accurately, and the damage of the internal components is not clear because the vertical frame was closed. Therefore, only the corrosion at the bottom of the column and the diagonal brace was simulated, which is part of the reason for the difference between the simulated value and the measured value.
3.3. Analysis of Damage and Degradation Law
During the long service of headframe, the surface of the component was not treated timely or improperly perhaps because the anti-corrosion protection layer fell off. Corroded elements will have a bad influence on the performance of the headframe. Therefore, we analyze the influence of different element corrosion on the mechanical properties of the headframe in this section. The corrosion was simulated by cutting the thickness. We define the corrosion rate as
, in which t and
are, respectively, the thickness of the corroded element and uncorroded element. In the actual environment, the corrosion of bottom column and the diagonal brace are more likely to occur and more serious, so the influence of the bottom column corrosion and the bottom of the diagonal brace corrosion on the mechanical properties of the headframe are studied, respectively. The stress changes of headframe by varying corrosion rates are shown in
Figure 5.
As shown in the chart, the corrosion has a great influence on the stress of the corroded element itself but has little effect on the stress of the whole headframe. When the corrosion rate increases from 0 to 50%, the maximum stress at the bottom of the diagonal brace increases by 32.68%, which is 62.49 MPa, and does not exceed the yield strength of steel. When the corrosion rate of bottom column increases from 0 to 50%, the maximum stress of bottom column increases by 68.85% and reaches 235.13 MPa, that exceeds the yield strength of steel and threatens the safety performance of the headframe in service. In conclusion, column corrosion has a greater impact on the safety of the headframe structure.
4. Damage Localization of the Headframe
In this section, parametric modeling was used to simulate different corrosion damage conditions of an actual mine headframe, and the accuracy of damage identification results of different damage identification methods was compared.
4.1. Damage Simulation
The damage was simulated by reducing the section size of the component in this section, whose essence is to reduce the section stiffness, and the change rate of thickness was defined as the damage degree X
. In order to simulate headframe damage more realistically, the random distribution function *VFILL was defined in
Section 2.1 Damage.mac was used to randomly generate damage conditions of different positions and degrees (10–50%). Three damage conditions were selected for detailed analysis as shown in
Table 2.
The headframe model shown in
Figure 6a was used for damage identification research. The model was simplified from the headframe structure in
Section 3, and the element type, material properties and constraint conditions were the same as the headframe model in
Section 3. The vertical frame was divided into ten layers according to height, and each layer column was divided into four elements. The number of column nodes and elements are shown in
Figure 6b, where the black numbers are the node numbers, and the red numbers are the element numbers.
4.2. Identification Results of Single Damage Index Method
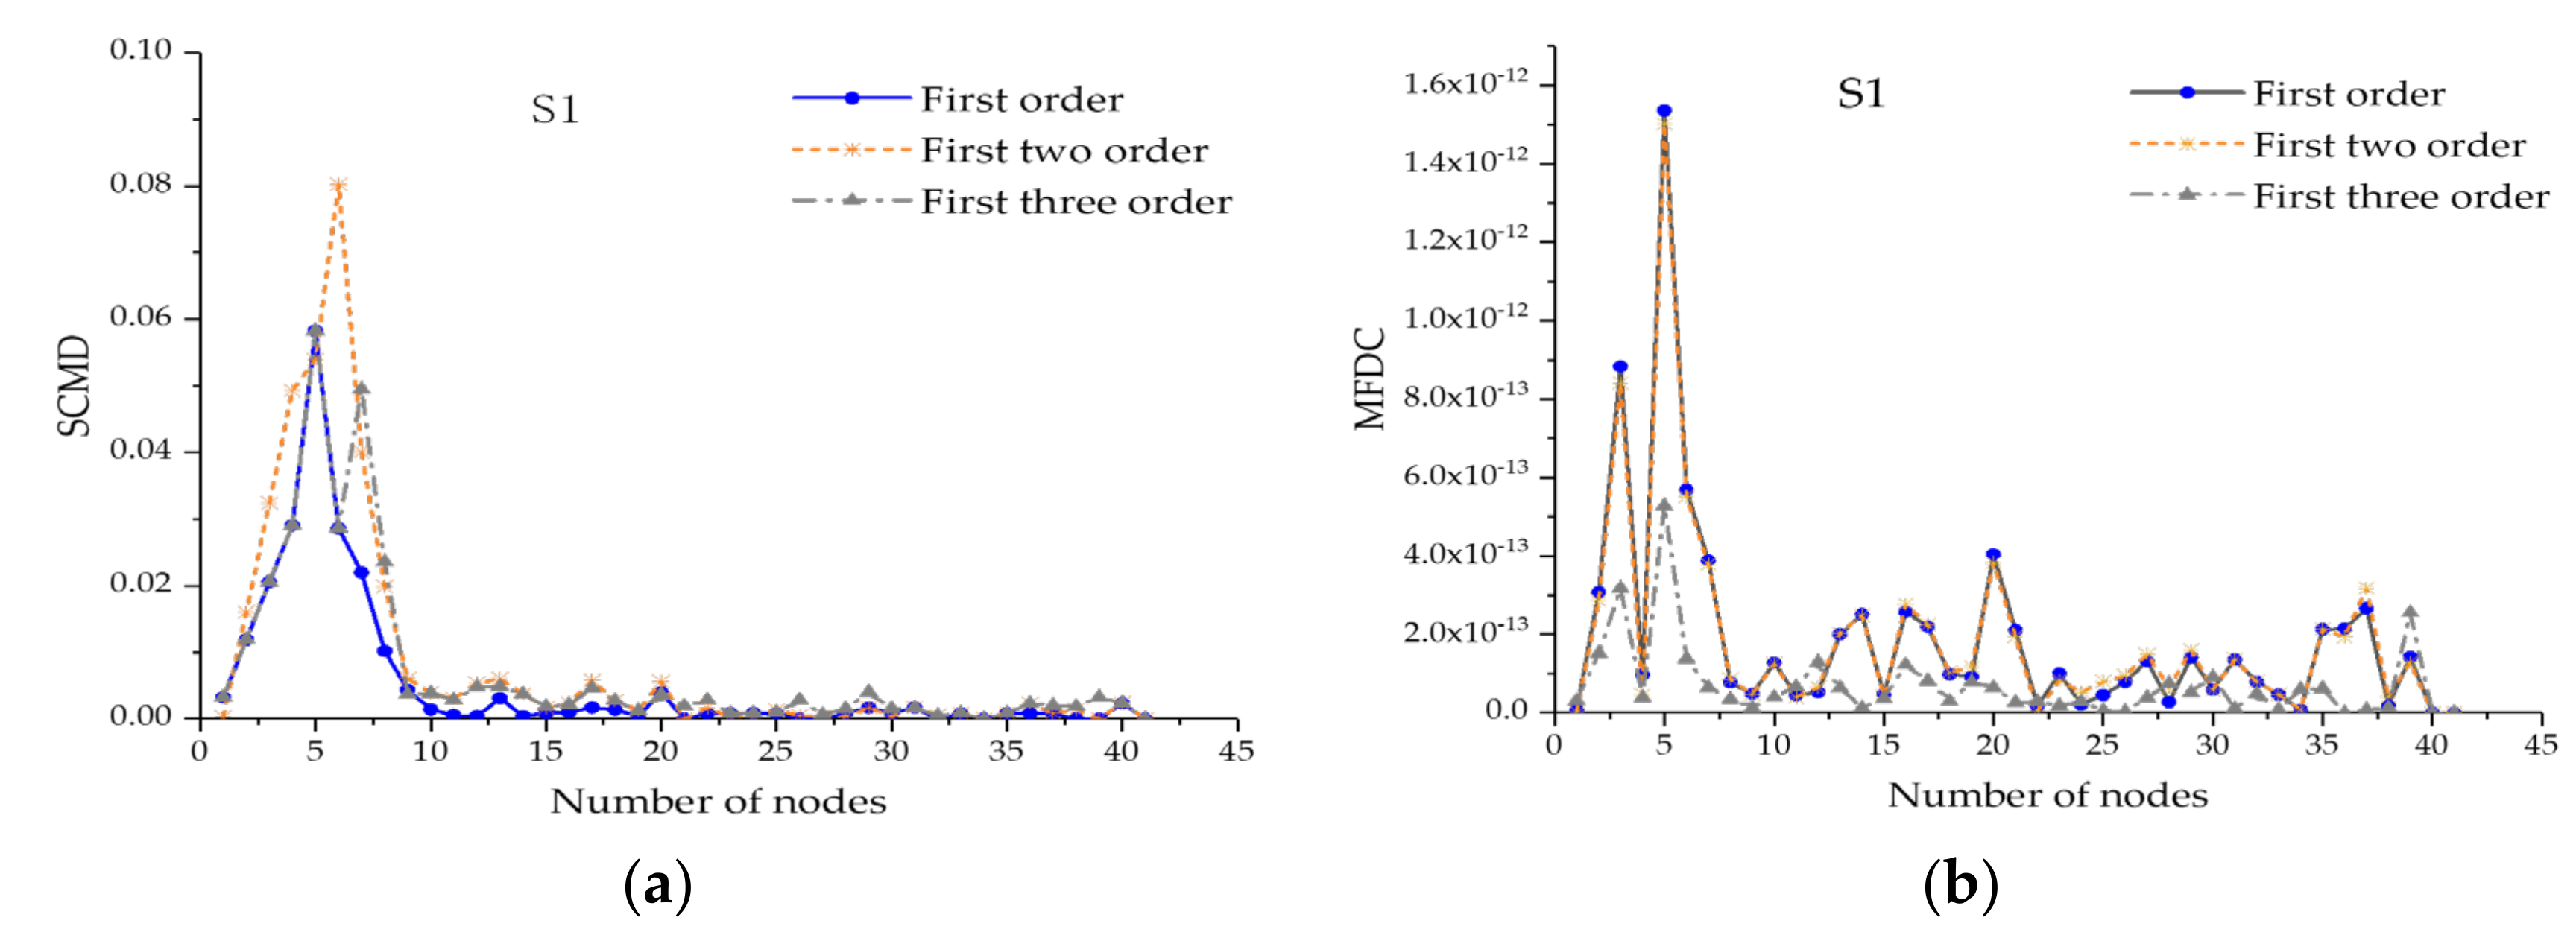
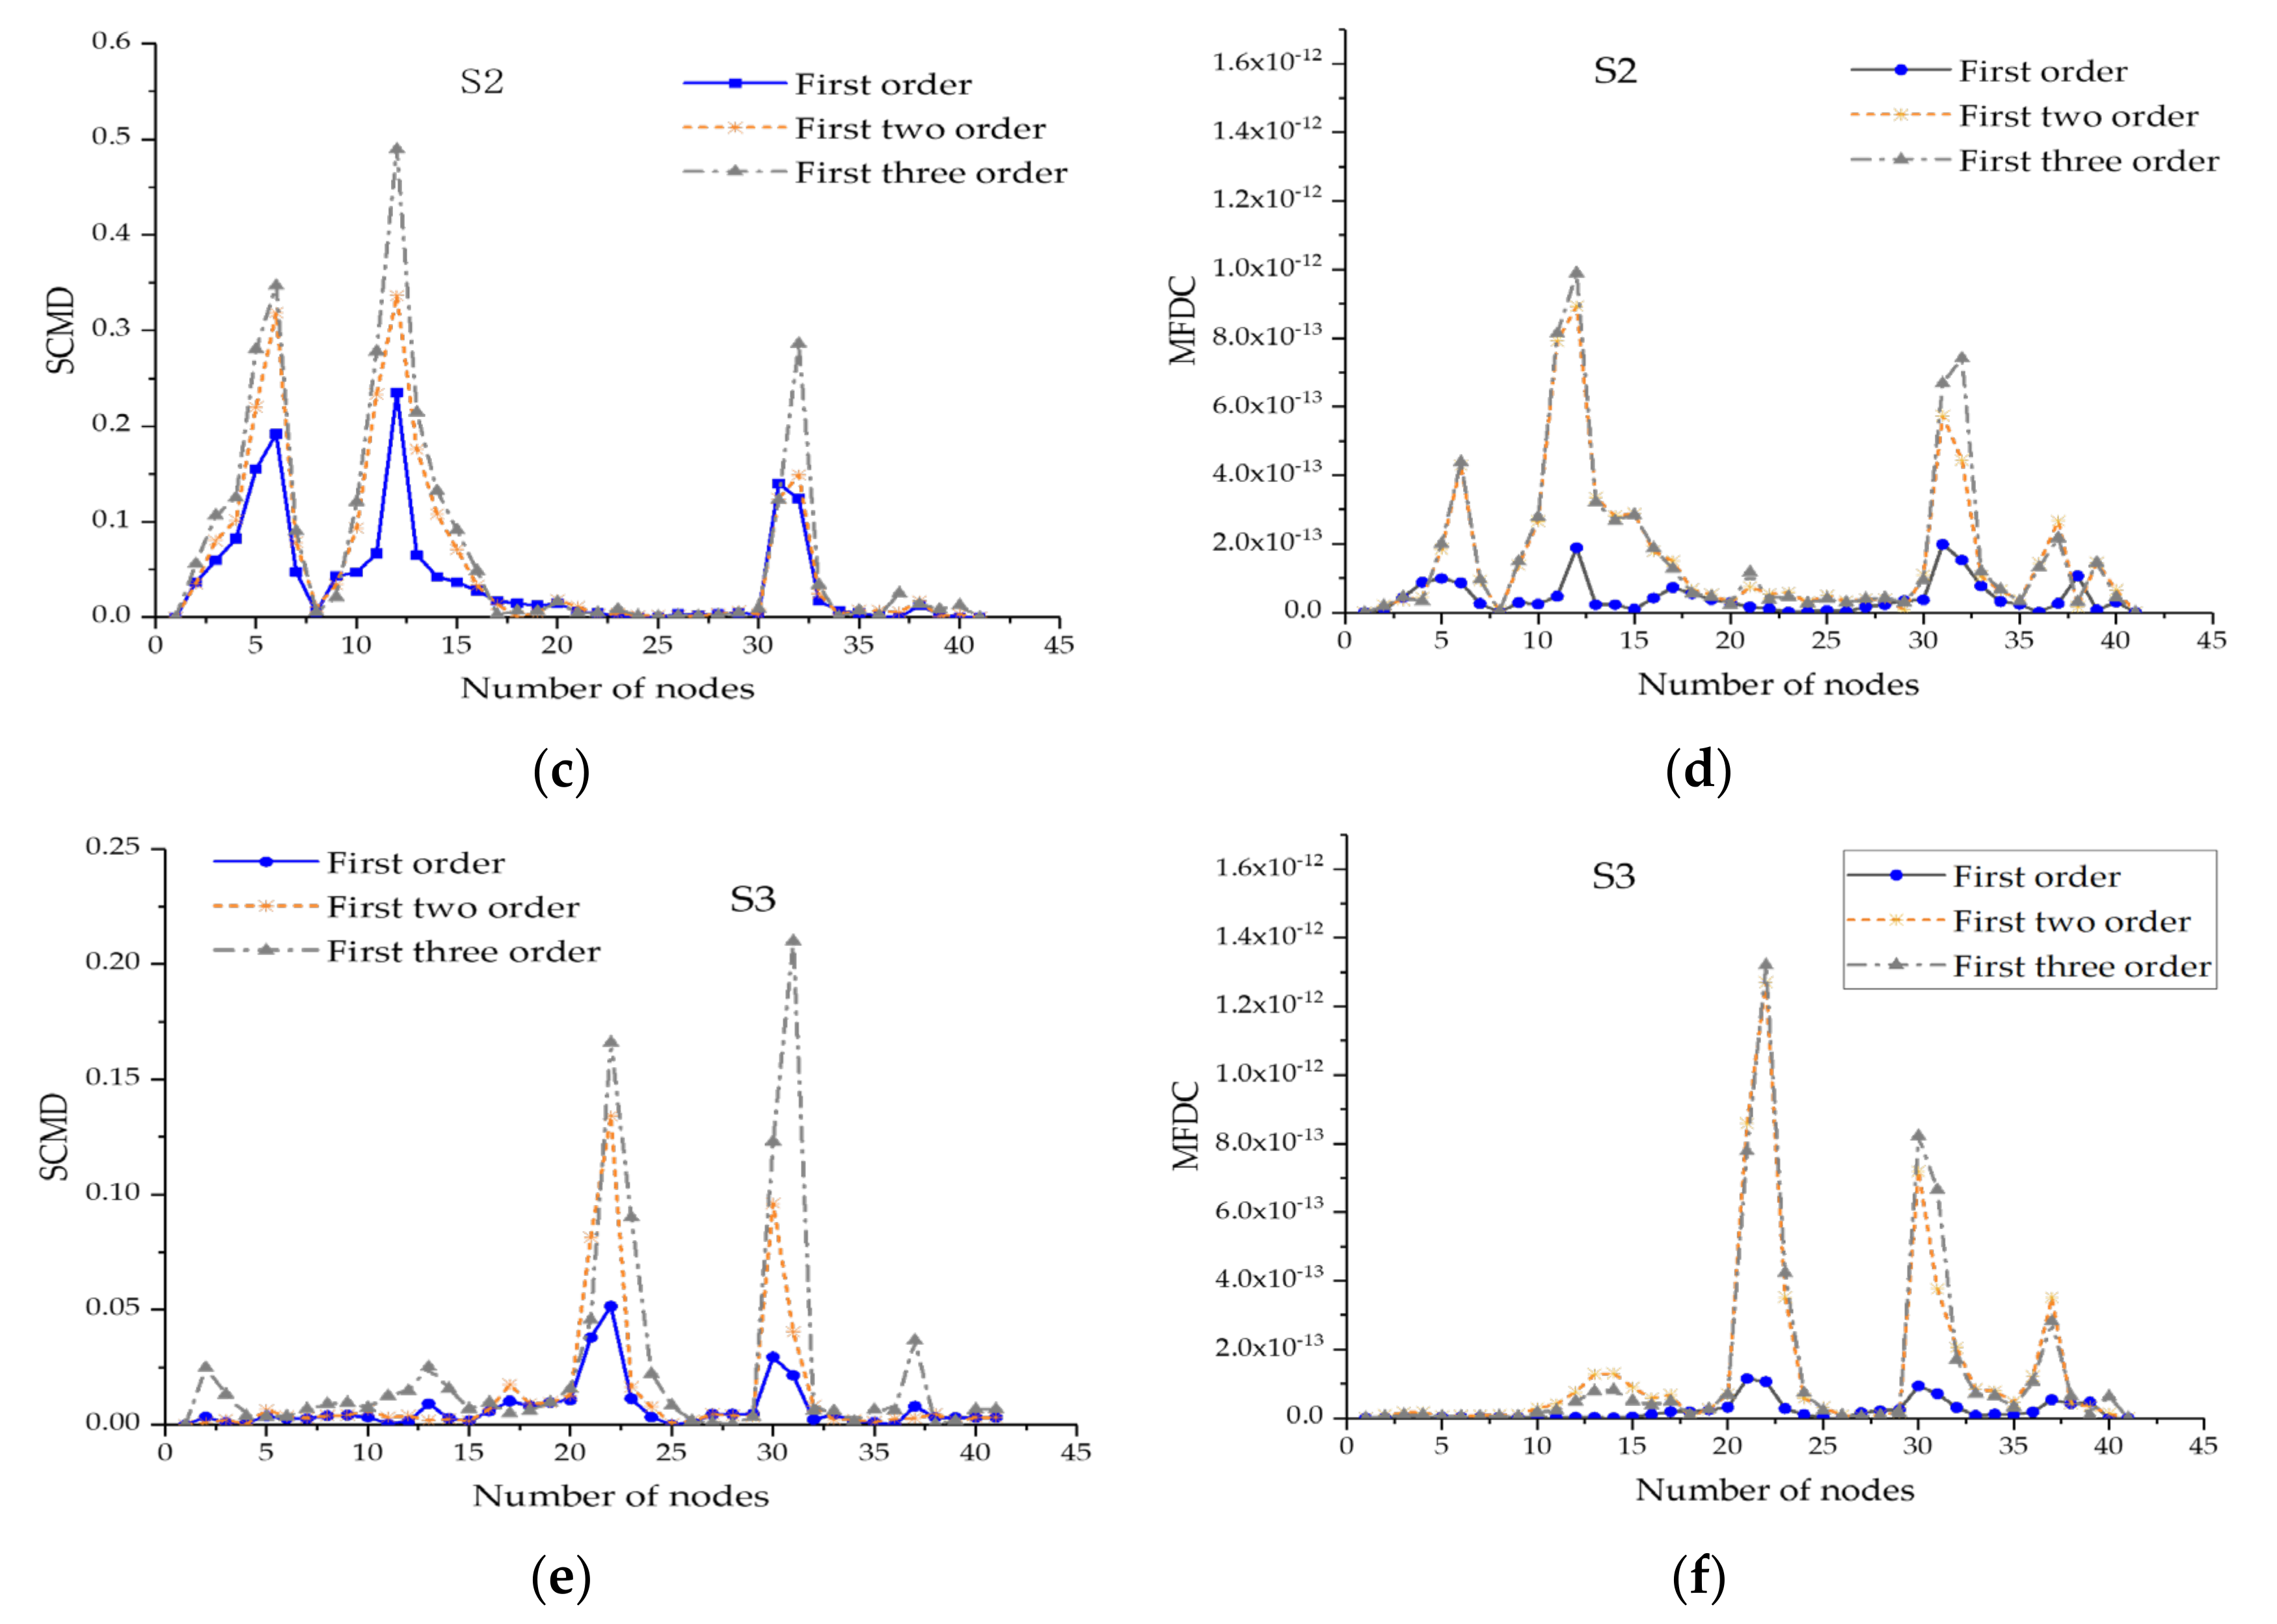
Based on the first three modal data of headframe obtained by finite element simulation, the identification results using the single damage index method were shown in
Figure 7:
For the single damage condition S1, the maximum mutation occurs between nodes 5–6, and mutations also occur between nodes 15–20, which will interfere with the judgment of damage location, as shown in
Figure 7b.
For the multiple damage condition S2, the curve of modal flexibility difference curvature fluctuates greatly in the position without damage, and the recognition effect of superimposed curvature modal difference is better. For condition S3, when the same degree of damage occurs at different positions, the peak value of the curve is significantly different, which interfered with damage judgment. In
Figure 7e,f, the curve also has certain mutation between nodes 37–38, resulting in misjudgment.
When the single damage index method was used for damage identification, it can be seen that the curve at the undamaged position will fluctuate, resulting in interference. Moreover, the identification results of different damage indexes are also different, and the identification result of multiple damage is not ideal.
4.3. One-Stage Fusion Damage Localization Method of Headframe
The damage localization method of one-stage fusion is as follows. Firstly, the damage location of headframe is determined by SCMD and MFDC. Then, the results of both are fused through D-S evidence matrix. Finally, the node damage probability is obtained, and the damage position of headframe is determined. The specific process is as follows:
Analysis preparation. The first three modal data for damaged and initial headframe were obtained by finite element simulation, and the modal data for damage identification was constructed.
Single damage identification indexes are calculated. Superposed curvature modal difference (SCMD) and modal compliance curvature (MFDC) are calculated by using the first three modal data of the headframe.
The results of the SCMD and MFDC are assigned probability, which determines the basic probability distribution function m(A); Then, the results of one-stage fusion (DF) are obtained by using the fusion rule.
The damage position is determined. The node range with high damage probability.
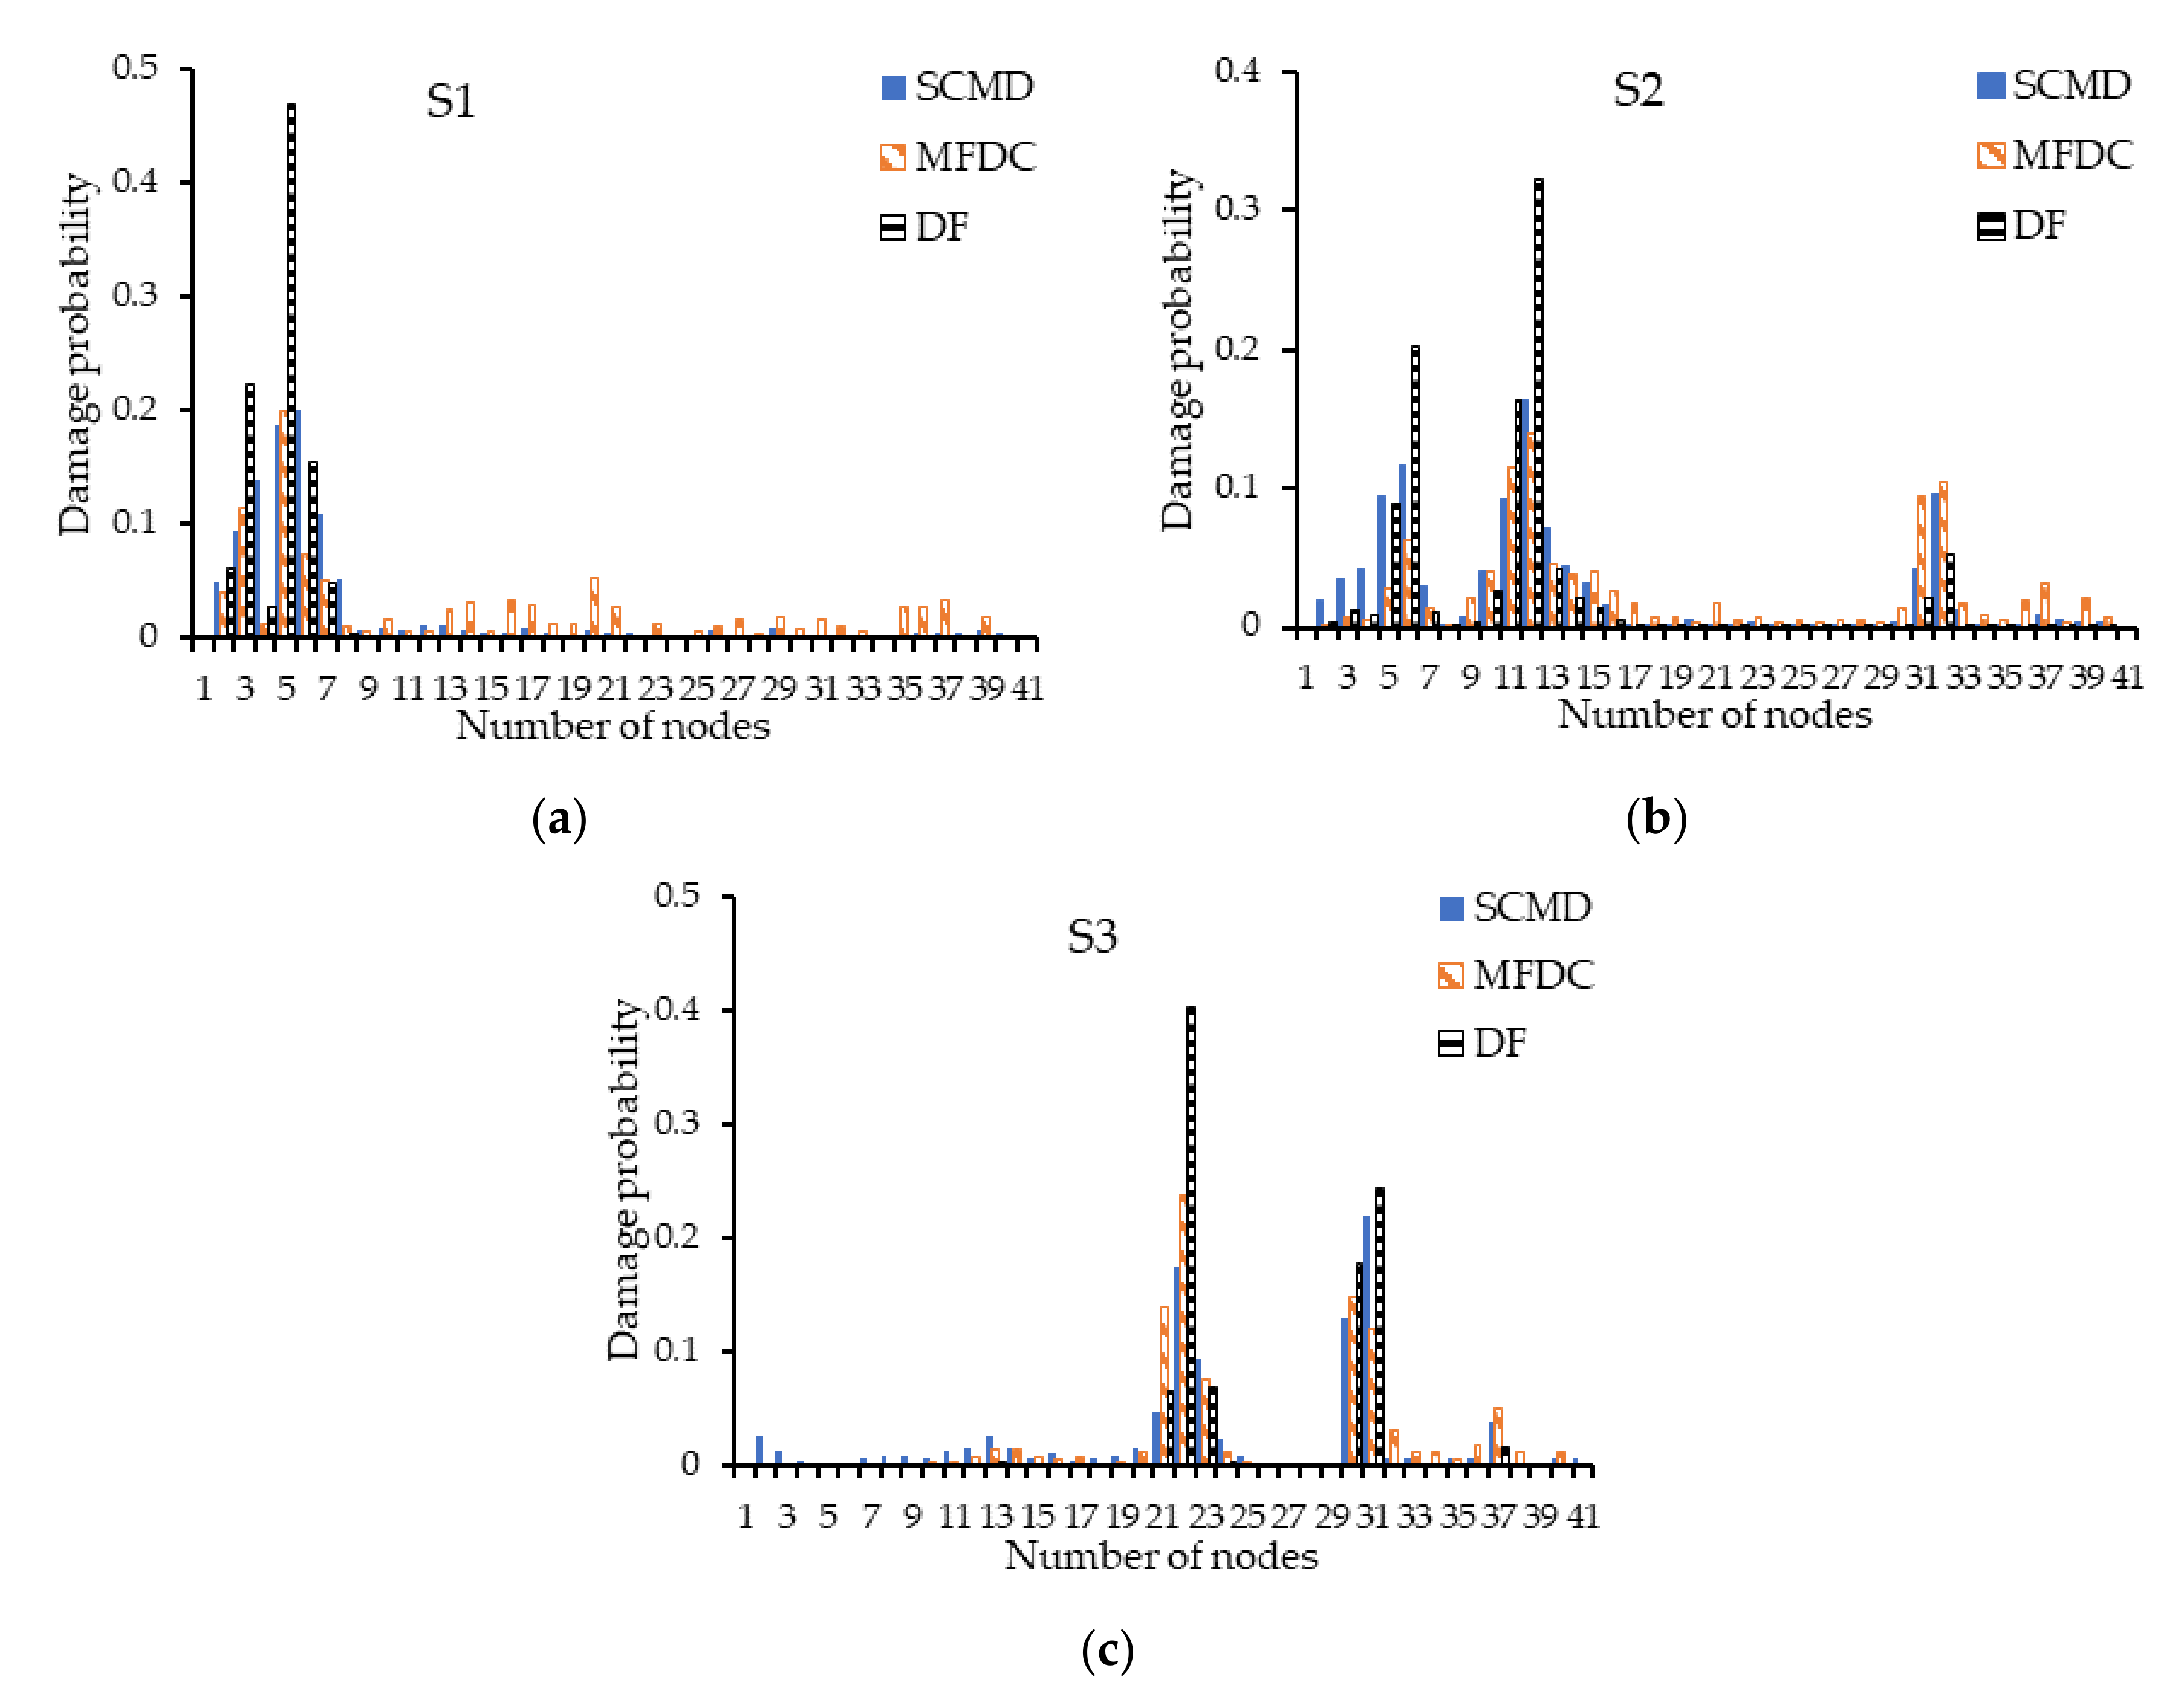
Figure 8 shows the identification results of headframes under different damage conditions by one-stage fusion method, and the SCMD and MFDC are normalized. The plots reported in the figures show the following:
The results of single damage condition by one-stage fusion method show that the damage probability between nodes 5–6 is the highest, which is consistent with the actual damage location. However, between the nodes 2–3 with high damage probability may cause interference.
For multiple damage condition S2, the damage locations at nodes 5–6 and 11–12 were accurately identified by using the one-stage fusion, and the damage probability of nodes 31–32 is smaller than the former. For multiple damage condition S3, the damage location at nodes 22–23 and nodes 30–31 was accurately identified by using the one-stage fusion, which corrects misjudgment of the single damage index method.
Compared with the single damage index method, one-stage fusion method can effectively improve the accuracy of damage identification by reducing the interference of the undamaged position and increasing the damage probability of nodes at the damaged position.
4.4. Two-Stage Fusion Damage Localization Method of Headframe
The damage localization method of two-stage fusion is as follows: In the first stage, the results of damage indexes calculated by different modal data are fused internally. In the second stage, the results of two indexes are fused. The steps are as follows:
Analysis preparation. The first three modal data for damaged and initial headframe were obtained by finite element simulation, and the modal data for damage identification was constructed. .
First-stage fusion. A group of 3 sources, denoted as , is defined by considering different sets of mode shapes . The result of the single damage identification index is calculated according to sources . And then, the same damage index accounted for the different sources are fused, and the internal fusion results of single damage index DF1 and DF2 are obtained.
Second-stage fusion. With DF1 and DF2 calculated as the basic probability distribution function of the next fusion, the two damage indexes are fused, and then the damage index MDF is obtained, which is the damage probability of each node.
The damage position is determined: the node range with high damage probability.
Figure 9 shows the identification results of headframes under different damage conditions by two-stage fusion method. As can be seen from the figure:
Compared with the single index method, the damage probability after the first stage fusion at the undamaged position and damaged position is significantly reduced and increased respectively, and the former tending to 0.
For the single damage condition S1, the damage probability after two-stage fusion at the undamaged position is further reduced or even reduced to 0. As shown in
Figure 9a, the damage probability of node 3 calculated by MFDC is reduced from 0.15 to 0.02.
For multiple damage condition S2, the interference of undamaged position after two-stage fusion is completely eliminated, which makes the damage location of the nodes 5–6 is highlighted, while the damage probability between nodes 11–12 and 31–32 is relatively small. This is because after the first stage fusion, the first two and last two damages are highlighted by SCMD and MFDC respectively.
For multiple damage condition S3, the results of two indexes are comprehensively considered, the damage probability at two damage locations after the two-stage fusion tends to be the same, which improves the reliability of damage location.
4.5. Comparison of Data Fusion Methods
As shown in
Figure 9a, the damage probability calculated by the two-stage fusion at nodes 3, 4 and 7 is almost reduced to zero, comparing the results using one-stage fusion in
Figure 8a. Therefore, the anti-interference ability and the recognition effect of the two-stage fusion method are better than those of the one-stage fusion method. In order to further compare the identification effects of different data fusion methods, ten conditions with different positions and degrees of damage (10–50%) are randomly simulated through the finite element model, and the results are shown in
Table 3. In the table, A5 represents the fifth element of column A.
The results demonstrate that both fusion methods can identify headframe damage location. The two-stage fusion method can gradually eliminate the effect of the undamaged position and highlight the damage location, which makes the recognition results more accurate. For example, 7 misjudgments and 1 missed judgment were identified by using the one-stage fusion method, while only a missed judgment in condition D8 and a misjudgment in condition D10 by using two-stage fusion method, and the misjudgment rate is reduced by 75%, the recognition accuracy is improved by 42.9%. Moreover, the recognition effect of the two-stage fusion method is better than that of the one-stage fusion method only for a certain condition.
5. Conclusions
In this paper, the degradation law of towering steel headframes under different damage was analyzed by numerical simulation and verified by field measurement. Then, the improved multi-index data fusion damage identification method based on D-S evidence theory was proposed, which can identify multi-position damage accurately. The main conclusions are as follows:
The influence range of element corrosion is localized. The corrosion damage has great influence on the corroded element but little influence on the overall performance of headframe. When the corrosion rate of bottom column increases to 50%, its maximum stress increases by 68.85%, reaching 235.13 MPa, which exceeds the yield strength of steel.
Parametric modeling and analysis of headframe was realized by using ANSYS secondary development. After then, the single index method, of SCMD and MFDC, was used to identify corrosion damage of headframe column. The results show that the above identification method has no significant effect because there was great interference in the undamaged position.
Based on the D-S evidence theory, the multi-index data fusion method was proposed, which not only significantly reduced the interference of undamaged position but also improved the accuracy of damage identification due to combining two damage indexes. By simulating ten random damage conditions, we found that compared with the one-stage fusion method, the improved two-stage fusion method demonstrates the better anti-interference ability with an increase of 42.9% for identification accuracy, and a reduction of 75% for misjudgment.
The above method is suitable for damage identification of towering truss structures. However, there are also some limitations, such as only damage location but not damage quantification. In addition, only the finite element method was used to realize damage identification, and the feasibility of this method needs to be further verified by field application. Therefore, the following aspects will be studied going forward: (1) Quantitative analysis of damage degree; (2) Engineering case application of the damage identification method.
Author Contributions
Conceptualization, R.Z., H.C. and J.X.; methodology, R.Z. and X.S.; formal analysis, R.Z.; investigation, Z.L.; resources, H.C. and J.X.; software, R.Z.; data curation, R.Z.; supervision, H.C.; writing—original draft preparation, R.Z.; writing—review and editing, H.C., R.Z., Z.L., X.S. and J.Y. contributed equally to this paper. All authors have read and agreed to the published version of the manuscript.
Funding
This research was funded by the National Science Foundation of China (grant number 51978657) and the international collaborative project of Jiangsu Collaborative Innovation Center for Building Energy Saving and Construct Technology (grant number SJXTGJ2101), and the Fundamental Research Funds for the Central Universities (2021ZDPY0209).
Institutional Review Board Statement
Not applicable.
Informed Consent Statement
Not applicable.
Data Availability Statement
Data is contained within the article.
Conflicts of Interest
The authors declare no conflict of interest.
References
- Khan, M.A.; Akhtar, K.; Ahmad, N.; Shah, F.; Khattak, N. Vibration analysis of damaged and undamaged steel structure systems: Cantilever column and frame. Earthq. Eng. Eng. Vib. 2020, 19, 725–737. [Google Scholar] [CrossRef]
- Cao, M.; Radzieński, M.; Xu, W.; Ostachowicz, W. Identification of multiple damage in beams based on robust curvature mode shapes. Mech. Syst. Signal Proc. 2014, 46, 468–480. [Google Scholar] [CrossRef]
- Chang, K.-C.; Kim, C.-W. Modal-parameter identification and vibration-based damage detection of a damaged steel truss bridge. Eng. Struct. 2016, 122, 156–173. [Google Scholar] [CrossRef]
- Nobahari, M.; Ghasemi, M.R.; Shabakhty, N. A fast and robust method for damage detection of truss structures. Appl. Math. Model. 2019, 68, 368–382. [Google Scholar] [CrossRef]
- Alavinezhad, M.; Hassanabad, M.G.; Ketabdari, M.J.; Nekooei, M. Numerical and experimental structural damage detection in an offshore flare bridge using a proposed modal strain energy method. Ocean Eng. 2022, 252, 111055. [Google Scholar] [CrossRef]
- Pooya, S.M.H.; Massumi, A. A novel damage detection method in beam-like structures based on the relation between modal kinetic energy and modal strain energy and using only damaged structure data. J. Sound Vibr. 2022, 530, 116943. [Google Scholar] [CrossRef]
- Hou, R.; Xia, Y. Review on the new development of vibration-based damage identification for civil engineering structures: 2010–2019. J. Sound Vibr. 2021, 491, 115741. [Google Scholar] [CrossRef]
- Patel, B.; Dewangan, U.K. Damage Detection Techniques to Identify the Unknown Damage Parameters from the Structural Response Data in Beam: A Review. In Proceedings of the Recent Trends in Civil Engineering; Springer: Singapore, 2021; pp. 175–183. [Google Scholar]
- Pandey, A.K.; Biswas, M.; Samman, M.M. Damage detection from changes in curvature mode shapes. J. Sound Vibr. 1991, 145, 321–332. [Google Scholar] [CrossRef]
- Patil, V.; Ahiwale, D. Damage detection of warren truss bridge using frequency change correlation. Mater. Today Proc. 2022, 56, 18–28. [Google Scholar] [CrossRef]
- Zhang, Y.; Luo, Y.; Guo, X.; Li, Y. A new damage detection method of single-layer latticed shells based on combined modal strain energy index. Mech. Syst. Signal Proc. 2022, 172, 109011. [Google Scholar] [CrossRef]
- Le, N.T.; Nguyen, A.; Thambiratnam, D.P.; Chan, T.H.T.; Khuc, T. Locating and Quantifying Damage in Beam-like Structures Using Modal Flexibility-based Deflection Changes. Int. J. Struct. Stab. Dyn. 2020, 20, 2042008. [Google Scholar] [CrossRef]
- Zare Hosseinzadeh, A.; Ghodrati Amiri, G.; Seyed Razzaghi, S.A.; Koo, K.Y.; Sung, S.H. Structural damage detection using sparse sensors installation by optimization procedure based on the modal flexibility matrix. J. Sound Vibr. 2016, 381, 65–82. [Google Scholar] [CrossRef]
- Bernagozzi, G.; Mukhopadhyay, S.; Betti, R.; Landi, L.; Diotallevi, P.P. Proportional flexibility-based damage detection for buildings in unknown mass scenarios: The case of severely truncated modal spaces. Eng. Struct. 2022, 259, 114145. [Google Scholar] [CrossRef]
- Guo, H.Y.; Li, Z.L. A two-stage method to identify structural damage sites and extents by using evidence theory and micro-search genetic algorithm. Mech. Syst. Signal Proc. 2009, 23, 769–782. [Google Scholar] [CrossRef]
- Zhou, Q.; Ning, Y.; Zhou, Q.; Luo, L.; Lei, J. Structural damage detection method based on random forests and data fusion. Struct. Health Monit. 2013, 12, 48–58. [Google Scholar] [CrossRef]
- Fei, Q.; Li, A.; Han, X. Simulation study on damage localization of a beam using evidence theory. Procedia Eng. 2009, 1, 147–150. [Google Scholar] [CrossRef]
- Avci, O.; Abdeljaber, O.; Kiranyaz, S.; Hussein, M.; Gabbouj, M.; Inman, D.J. A review of vibration-based damage detection in civil structures: From traditional methods to Machine Learning and Deep Learning applications. Mech. Syst. Signal Proc. 2021, 147, 107077. [Google Scholar] [CrossRef]
- Cao, S.; Lu, Z.; Wang, D.; Xu, C. Robust multi-damage localization in plate-type structures via adaptive denoising and data fusion based on full-field vibration measurements. Measurement 2021, 178, 109393. [Google Scholar] [CrossRef]
- Shih, H.W.; Thambiratnam, D.P.; Chan, T.H.T. Vibration based structural damage detection in flexural members using multi-criteria approach. J. Sound Vibr. 2009, 323, 645–661. [Google Scholar] [CrossRef]
- Grande, E.; Imbimbo, M. A multi-stage data-fusion procedure for damage detection of linear systems based on modal strain energy. J. Civ. Struct. Health Monit. 2013, 4, 107–118. [Google Scholar] [CrossRef]
- Grande, E.; Imbimbo, M. A data fusion based approach for damage detection in linear systems. Frat. Integrita Strut. 2014, 8, 325–333. [Google Scholar] [CrossRef]
- Grande, E.; Imbimbo, M. A multi-stage approach for damage detection in structural systems based on flexibility. Mech. Syst. Signal Proc. 2016, 76–77, 455–475. [Google Scholar] [CrossRef]
- Guo, H.Y.; Li, Z.L. Structural damage identification based on Bayesian theory and improved immune genetic algorithm. Expert Syst. Appl. 2012, 39, 6426–6434. [Google Scholar] [CrossRef]
- Guo, T.; Xu, Z. Data fusion of multi-scale representations for structural damage detection. Mech. Syst. Signal Proc. 2018, 98, 1020–1033. [Google Scholar] [CrossRef]
- Bao, X.; Fan, T.; Shi, C.; Yang, G. Deep learning methods for damage detection of jacket-type offshore platforms. Process Saf. Environ. Protect. 2021, 154, 249–261. [Google Scholar] [CrossRef]
- Wang, F.; Li, R.; Xiao, Y.; Deng, Q.; Li, X.; Song, X. A strain modal flexibility method to multiple slight damage localization combined with a data fusion technique. Measurement 2021, 182, 109647. [Google Scholar] [CrossRef]
- Guo, H.Y. Structural damage detection using information fusion technique. Mech. Syst. Signal Proc. 2006, 20, 1173–1188. [Google Scholar] [CrossRef]
- Tomaszewska, A. Influence of statistical errors on damage detection based on structural flexibility and mode shape curvature. Comput. Struct. 2010, 88, 154–164. [Google Scholar] [CrossRef]
- Pandey, A.; Biswas, M. Experimental verification of flexibility difference method for locating damage in structures. J. Sound Vibr. 1995, 184, 311–328. [Google Scholar] [CrossRef]
- Guo, H.; Zhang, L. A weighted balance evidence theory for structural multiple damage localization. Comput. Meth. Appl. Mech. Eng. 2006, 195, 6225–6238. [Google Scholar] [CrossRef]
| Publisher’s Note: MDPI stays neutral with regard to jurisdictional claims in published maps and institutional affiliations. |
© 2022 by the authors. Licensee MDPI, Basel, Switzerland. This article is an open access article distributed under the terms and conditions of the Creative Commons Attribution (CC BY) license (https://creativecommons.org/licenses/by/4.0/).


 ,
, 


