1. Introduction
Bridge flutter is a disastrous phenomenon related to aerodynamic instability. The study of flutter aerodynamic measures to improve flutter stability has always been a hot topic amongst bridge wind resistance experts. In particular, long-span flexible bridges are sensitive to wind, and the shape of the main beam determines the aerodynamic performance of a bridge. Poor aerodynamic shape directly leads to the destruction of the bridge. For example, the old Tacoma Strait Bridge has flutter damage due to a blunt section under low wind speed, meaning that the shape of the main beam section is the main factor that affects the aerodynamic stability of the bridge. In the design process of wind-resistant long-span bridges, different aerodynamic measures are mainly applied to the main beam section to improve the flutter stability. Cid Montoya et al. [
1,
2] found that the gap size in a double box bridge plays an important role in flutter stability, and they optimized the short-gap double box bridge deck structure to meet the flutter performance requirements. Bulkac et al. [
3] studied the influence of wind barriers on the flutter performance of long-span cable-stayed bridges, and the results showed that a bridge deck with wind barriers was more prone to fluttering under higher wind speeds. Zhang et al. [
4] compared and analyzed the influence of a central stable version on the flutter stability of plate truss composite beams and plate truss separated beams through wind tunnel tests and numerical simulations. Zhang et al. [
5] proposed an optimization method of flutter control based on a nonlinear unsteady model to achieve the most economical TMD parameters of nonlinear objectives. Chen et al. [
6] studied the effectiveness of TMD in controlling the flutter of multi-modal coupled long-span bridges and found that it had a good effect on soft flutter.
The methods used to study the flutter performance of bridges include wind tunnel tests and numerical simulations. Through wind tunnel tests or numerical simulations, the relationship between flutter critical wind speed and flutter test wind speed under different aerodynamic measures has been studied to determine the effectiveness of aerodynamic measures [
7,
8]. Numerical simulations are widely used because of their low cost and easy operation, but due to theoretical limitations, the accuracy and scope of the application of numerical simulation methods need to be improved further [
9,
10,
11,
12]. Wind tunnel tests are widely used, and the test results have high accuracy. However, the test cycle is long, and the cost is high for these tests. Compared with the bridge wind tunnel vibration test, the ATCC wind tunnel test is simple and has a low cost. The study of the relationship between the ATCC and flutter stability and the rapid evaluation of bridge flutter performance could replace the bridge flutter wind tunnel test, which would be a very competitive method. Mei et al. [
13] proved that the flutter stability performance of a streamlined box girder was improved after a central stabilizer plate was installed, and the resistance coefficient increased with the increase in critical flutter wind speed. Li et al. [
14] proposed a method to quickly evaluate the flutter stability of streamlined box girders by using aerostatic coefficients in combination with artificial neural networks and CFD. Farquharson [
15,
16] conducted a segmental model wind tunnel test on six main beam sections, including the original Tacoma Bridge. The results showed that the ATCC reflected the stable state of aerodynamics, and the structural damping ratio of the Tacoma Strait Bridge correlated well with the flutter derivative when it was damaged. Nikhil et al. [
17] conducted wind tunnel tests and numerical simulations on cuboids with different degrees of corner cutting. The results showed that the section cut exceeds 22% would lead to changes in the ATCC and the aerodynamic instability of the structure. Chen et al. [
18] proved that flutter stability is related to the lift coefficient and the lift moment coefficient. As the sum becomes smaller, the flutter stability becomes better. Simiu et al. [
19] deduced the relationship between the ATCC and the flutter derivative on the basis of the Scanlan assumption. Fang et al. [
20] discussed the effect of the flutter derivative on the change in critical wind speed. Fung [
21] assumed that a wing was in simple harmonic motion and deduced the relationship between the ATCC and the modified flutter derivative by using the Theodorsen function. Bai et al. [
22,
23,
24] obtained the parameter
f for the rapid evaluation of a bridge’s flutter stability based on the study of the relationship between the ATCC and flutter stability, combined with the influence of the
D-term aerodynamic force on flutter stability.
Although some experts and scholars have studied the relationship between the ATCC and flutter stability and have reached some valuable conclusions, the following problems still require further study:
- (1)
Previous studies have only proposed the relationship between the ATCC of a specific type of girder section and flutter stability. Therefore, it is necessary to classify the typical sections of long-span bridges from the perspective of the flutter aerodynamic damping drive and to study the influence of the ATCC on flutter stability under different damping drives.
- (2)
Combined with the existing research results, the correlation between the ATCC and flutter stability.
- (3)
Regarding the common section types driven by aerodynamic damping, the specific method used to determine flutter stability by using the ATCC.
Based on the classical flexural torsional coupling flutter driving mechanism, in this paper, we divided bridge fluttering into three damping driving mechanisms: the
D-term damping driving mechanism, the
X-term damping driving mechanism and the
X + D-term damping driving mechanism. Nine bridge examples (shown in
Table 1) were used to verify the rationality of this division. For
D-term damping-driven flutter, an empirical judgment parameter based on the ATCC was proposed to quickly evaluate the flutter performance of bridges, and three bridge examples were used to verify this. The research method proposed in this paper can be used to quickly and accurately determine the flutter performance of bridges and to optimize the flutter performance of preliminary bridge design schemes.
2. Flutter Stability of Different Girder Sections
In classical torsional bending coupled vibration, the divergence of the torsional implicated motion of the system is because the negative aerodynamic damping offsets the positive aerodynamic damping and structural damping on the stability of the system. According to the Scanlan [
25] aerodynamic self-excitation theory, the aerodynamic damping of the torsional implicated motion of the system is composed of five parts, as shown in Equation (1):
where
is the air density;
B is the bridge width;
m is the equivalent mass;
I is the equivalent mass moment of inertia; parameter
;
,
,
,
, and
are the flutter derivatives;
is the damping ratio of the vertical bending motion;
is the frequency of the vertical bending motion circle; and
is the frequency of the torsional motion circle. For ease, we made the following brief notes on the above-mentioned aerodynamic damping:
is denoted as the
A-term;
is denoted as the B-term;
is denoted as the C-term;
is denoted as the
D-term; and
is denoted as the E-term.
When the shape of the bridge deck is different, the aerodynamic characteristics are different [
26]. In terms of flutter performance, this is mainly reflected in the different negative aerodynamic damping terms that lead to divergence, meaning the flutter driving mechanisms in different girder sections are different. Among the five aerodynamic damping terms, positive aerodynamic damping is beneficial to the stability of a structure, and negative aerodynamic damping causes vibration divergence and instability in a structure. Generally, the absolute value of aerodynamic damping increases with the increase in wind speed, but in some cases, there is an inflection point with the increase in wind speed. For example, the
A-term increases with the wind speed first, which is beneficial to the stability of a structure. After a certain value of wind speed is reached, the
A-term begins to decrease, and its effect on the stability of a structure gradually decreases or even starts to increase negatively, which is not conducive to the stability of the structural stability. In the stage in which a model is about to lose stability, the absolute values of the aerodynamic damping
A-term and
D-term are larger than the other three terms, and the
A-term is positive, which is conducive to structural stability, whereas the
D-term is negative, which is a divergent driving term. This situation is called
D-term driving. When
D-term damping is positive, the aerodynamic damping term with the largest absolute value and negative value among the remaining four aerodynamic damping terms is the main driving term, which is called the
X-term drive, e.g., the
A-term drive. When the
D-term and one or more of the remaining four aerodynamic damping terms are negative, this is called the
X +
D-term common drive, e.g., the
A + D-term drive.
In torsional implicated motion, the absolute value of the aerodynamic damping of the
A-term and
D-term is larger, and the other three aerodynamic damping values are smaller. Therefore, the aerodynamic damping of the torsional implicated motion of a system is simplified as the sum of the
A-term and
D-term, and the specific expression is shown in Equation (2):
E. Simiu and R. H. Scanlan [
27] determined the relationship between the flutter derivative of two degrees of freedom and the ATCC according to the assumption of quasi-steady aerodynamic theory [
28]. Scanlan applied the derived equation to calculate the flutter derivatives of the Hoga Kusten Bridge, Messina Strait Bridge and Normandy Bridge;
and
. The calculated flutter derivative was compared with the flutter derivative measured in the test, and the results showed that
,
,
and
were in good agreement with the flutter derivative measured via the test, whereas the values of
and
deviated from the test data greatly, which is why the quasi-steady aerodynamic theory was assumed. The flutter derivatives mainly used in this paper are
and
, and the expression of these are shown in Equation (3):
where
K is the reduced frequency, and
and
are the derivatives of the static aerodynamic lift coefficient and static aerodynamic lift moment coefficient to the wind angle of attack, respectively. (
CD,
CL and
CM were obtained from the force measurement test of the wind tunnel test and changed with the wind power angle. In the process of using the ATCC to study flutter stability, the slope
CD,
CL and
CM of the ATCC at a certain angle of attack was derived from fitting the original data curve of the wind tunnel.)
Fung [
29] calculated the following expression by assuming that a wing vibrates harmonically and by applying the Theodorsen function. Li [
30] calculated the
of a section of a flat steel box girder and compared it with the
value obtained in the test. It was found that Fung’s equation obtained results very similar to the test results; therefore, Fung’s equation was used when calculating the flutter derivative, as shown in Equation (4):
where
and
are the real and imaginary parts of Theodorsen function
C (
u*), respectively.
Therefore, the aerodynamic damping equation expressed by the ATCC is shown in Equation (5):
It can be seen that the flutter stability of the bridge is related to the ATCC. Therefore, combined with the flutter driving mechanism of the torsional implicated motion, the flutter driving term is preliminarily determined by using the ATCC. Then, the flutter stability is determined, and the main beam is directly aerodynamically selected using the ATCC. The following section takes a typical section as an example for verification.
2.1. Instability Driven by X-Term Aerodynamic Damping
To verify the aerodynamic damping driving the instability of the X-term, we took a three-tower cable-stayed bridge (NO. 9) with a central slotted box girder as an example. The span of the bridge was 129 + 258 + 258 + 129 m, with a total length of 774 m. The section in the construction state was denoted as scheme 1, the wind barrier in the completed bridge state was denoted as scheme 2 and the wind barrier free bridge state was denoted as scheme 3. The main beam width of the three schemes was 38.8 m.
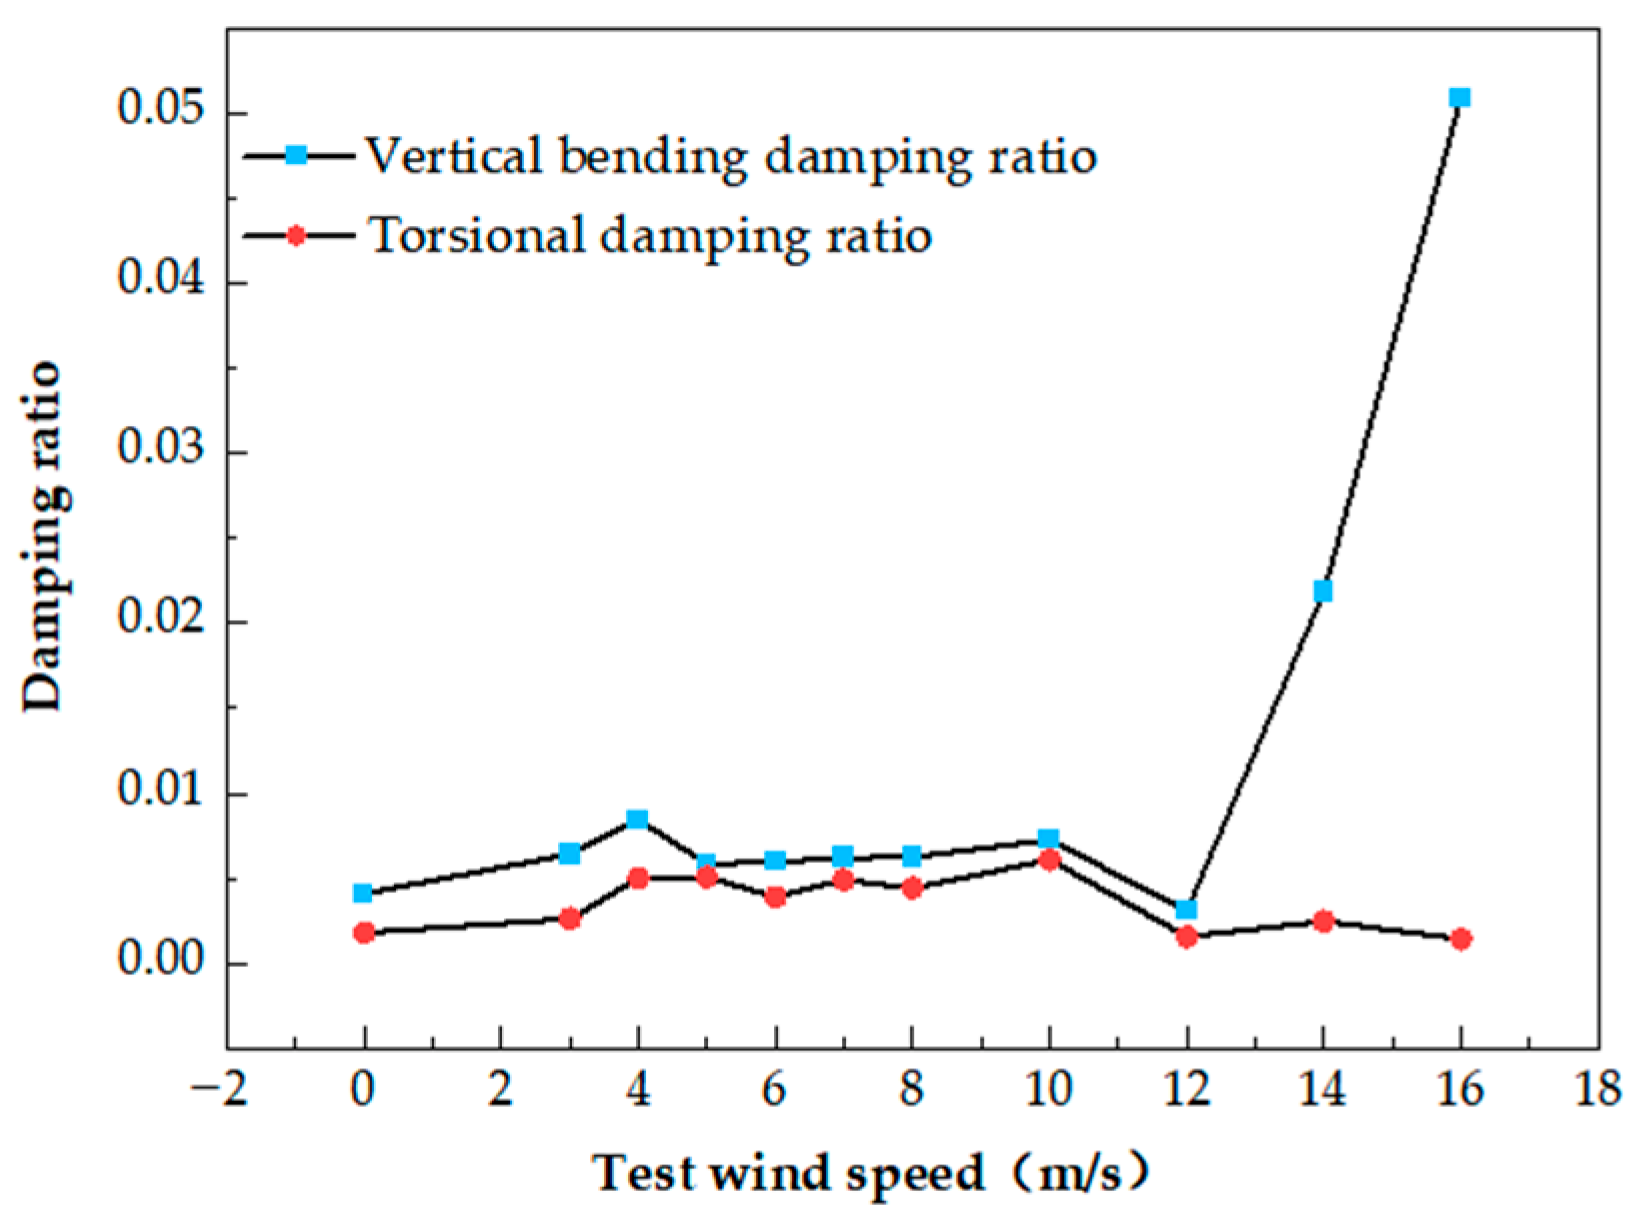
The cross section of the girder is shown in
Figure 1. The model is shown in
Figure 2. According to the change in the damping ratio with wind speed, the scheme had torsional divergence, as shown in
Figure 3. The flutter derivative was identified through the wind tunnel test. The variation values of
and
with reduced wind speed were positive, and
was negative with reduced wind speed. According to Equation (2), we determined that the aerodynamic damping of the
A-term was positive, and the aerodynamic damping of the
D-term was positive, which is the
X-term driving the instability of aerodynamic damping. The flutter derivatives after test fitting are shown in
Figure 4.
By analyzing the
and
of the main beam of scheme 3 under a 0° angle of attack, it was concluded that the
D-term damping was positive, and it was determined to be driven by the
X-term. This was consistent with the result that was achieved by determining the flutter driving term by the flutter derivative. The ATCC is shown in
Figure 5.
Table 2 displays the flutter driving items identified by the ATCC. The critical flutter wind speed in this section was high, and the flutter stability was good.
2.2. Instability Driven by D-Term Aerodynamic Damping
To verify the
D-term pneumatic damping drive instability, we took an edge-box open girder section in a suspension bridge (No. 6) as an example. The main span of the bridge was 218 m, and the main girder width was 28.5 m. The standard cross section of the girder is shown in
Figure 6. The model is shown in
Figure 7.
Figure 8 illustrates the ATCC of Bridge 6.
and
were positive. The aerodynamic damping of the
A-term and
D-term were analyzed using the ATCC, which is shown in
Table 3. As determined using Equation (5), the
A-term was negative, and the
D-term was positive, which verified the
D-term aerodynamic damping drive instability.
2.3. Instability Driven by X + D-Term Aerodynamic Damping
The
X + D-term damping drive was obtained when the
D-term damping and other negative aerodynamic damping were combined as the driving term. The old Tacoma Bridge suffered flutter failure at a low wind speed of 19 m/s. Through wind tunnel tests, Farquharson found that the cross-section lift coefficient of the H-shaped main girder of the old Tacoma Bridge had a negative change rate near the angle of attack of 0°. This showed that the negative rate of change in the ATCC of the bridge was related to its aerodynamic instability. Farquharson also performed circular hole correction on the original bridge web. When the open porosity was small, aerodynamic instability occurred, and a negative slope appeared near the angle of attack of 0°. It could be seen that the steady state of aerodynamics was related to the rate of change in the ATCC. Huston [
31] found that
changed from negative to positive in seven H-shaped-section flutter derivatives with different aspect ratios. According to the classical torsional bending coupled flutter driving mechanism, due to the above-mentioned changes in the flutter derivative
, the corresponding aerodynamic damping of the
A-term changed from positive to negative, i.e., the flutter stability effect of the system changed from favorable to unfavorable with the reduced wind speed, which belonged to the X + D damping drive. The above shows that the flutter stability of the old Tacoma Bridge was related to the change rate of the ATCC from the perspective of the ATCC coefficient, and the flutter stability was explained from the perspective of the aerodynamic damping driving mechanism by using the flutter derivative. The critical flutter wind speed of the H-shaped section was low, and the flutter stability was poor.
Table 4 analyzes the flutter driving terms and flutter stability of six main girder section types for nine bridges. There are three types of aerodynamic damping driving that cause flutter instability. The flutter aerodynamic performance is the worst under the
X + D-term aerodynamic damping drive. The
X-item aerodynamic damping drive has good flutter stability, and the critical flutter wind speed is high, which is generally found in the slotted section. The
D-term-type pneumatic damping drive is the most common, and this kind of section flutter stability was measured as being between the first two.
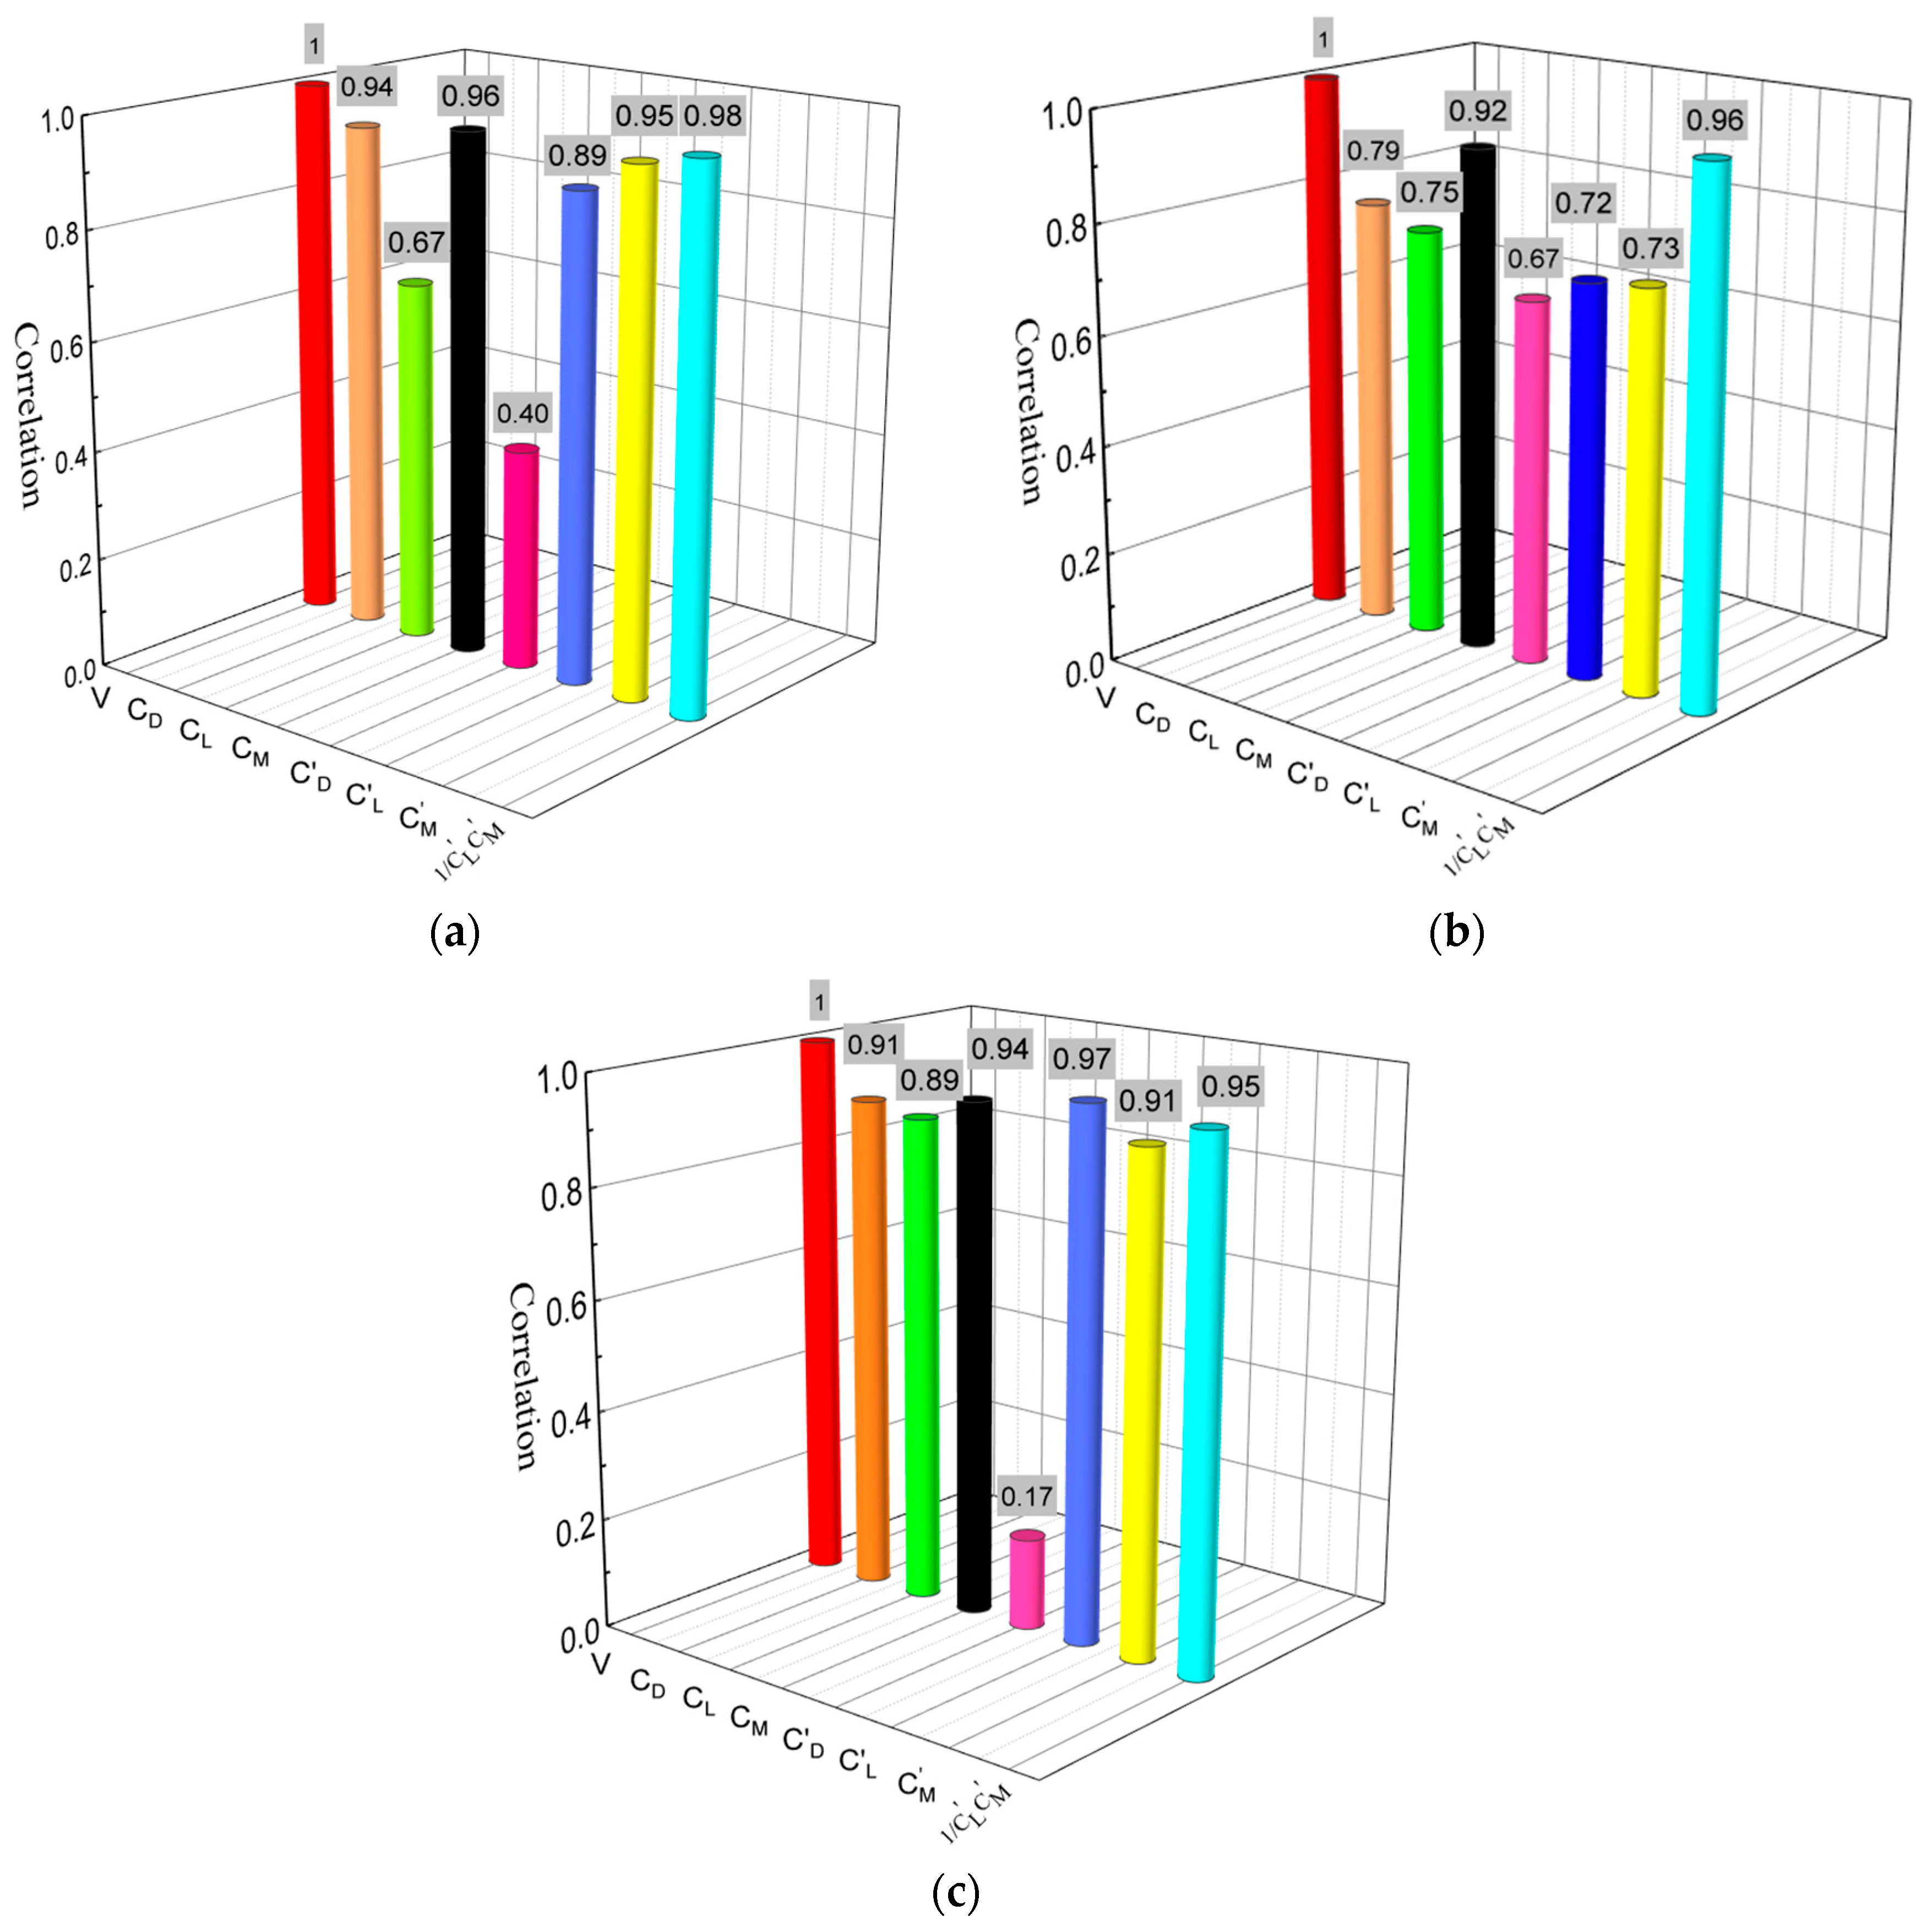
2.4. Gray Correlation Analysis of the ATCC and Critical Flutter Wind Speed
The gray correlation analysis method was used to analyze the correlation degree between the ATCC and flutter critical wind speed and to determine the key parameters affecting flutter stability:
- (1)
The flutter derivatives
~
and
~
, obtained by E. Simiu and R.H. Scanlan [
27], are related to
C′L and
C′M, respectively;
- (2)
The main beam section is driven by the D-term, and C′L·C′M provides negative aerodynamic damping. As its value becomes larger, the flutter stability becomes smaller;
- (3)
The correlation between the ATCC value and flutter critical wind speed is compared and analyzed.
The analysis results are shown in
Figure 9. The results show that, among the seven parameters
,
,
,
,
and
of the ATCC, the parameter with the largest correlation with flutter critical wind speed was
.
3. Using the ATCC to Make Quick Pneumatic Selection
In selecting the aerodynamic parameters of the main girder, the ATCC was used to determine the flutter drive terms. When the flutter drive was the
D-term of aerodynamic damping, the structural characteristic parameters of the main girder were similar due to different aerodynamic measurements.
was the
A-term of aerodynamic damping and was suitable for structural stability.
was unsuitable for structural stability in the
D-term of aerodynamic damping. Therefore, the damping ratio of the torsional motion involved in the system
is shown in Formula (6):
where, when the positive aerodynamic damping is larger and the absolute value of the negative aerodynamic damping is smaller, as the
K value becomes larger, the structural flutter stability becomes better. Typical bridge sections were used as examples to verify the accuracy of applying parameter
K to the rapid pneumatic selection.
- (1)
Closed box girder section
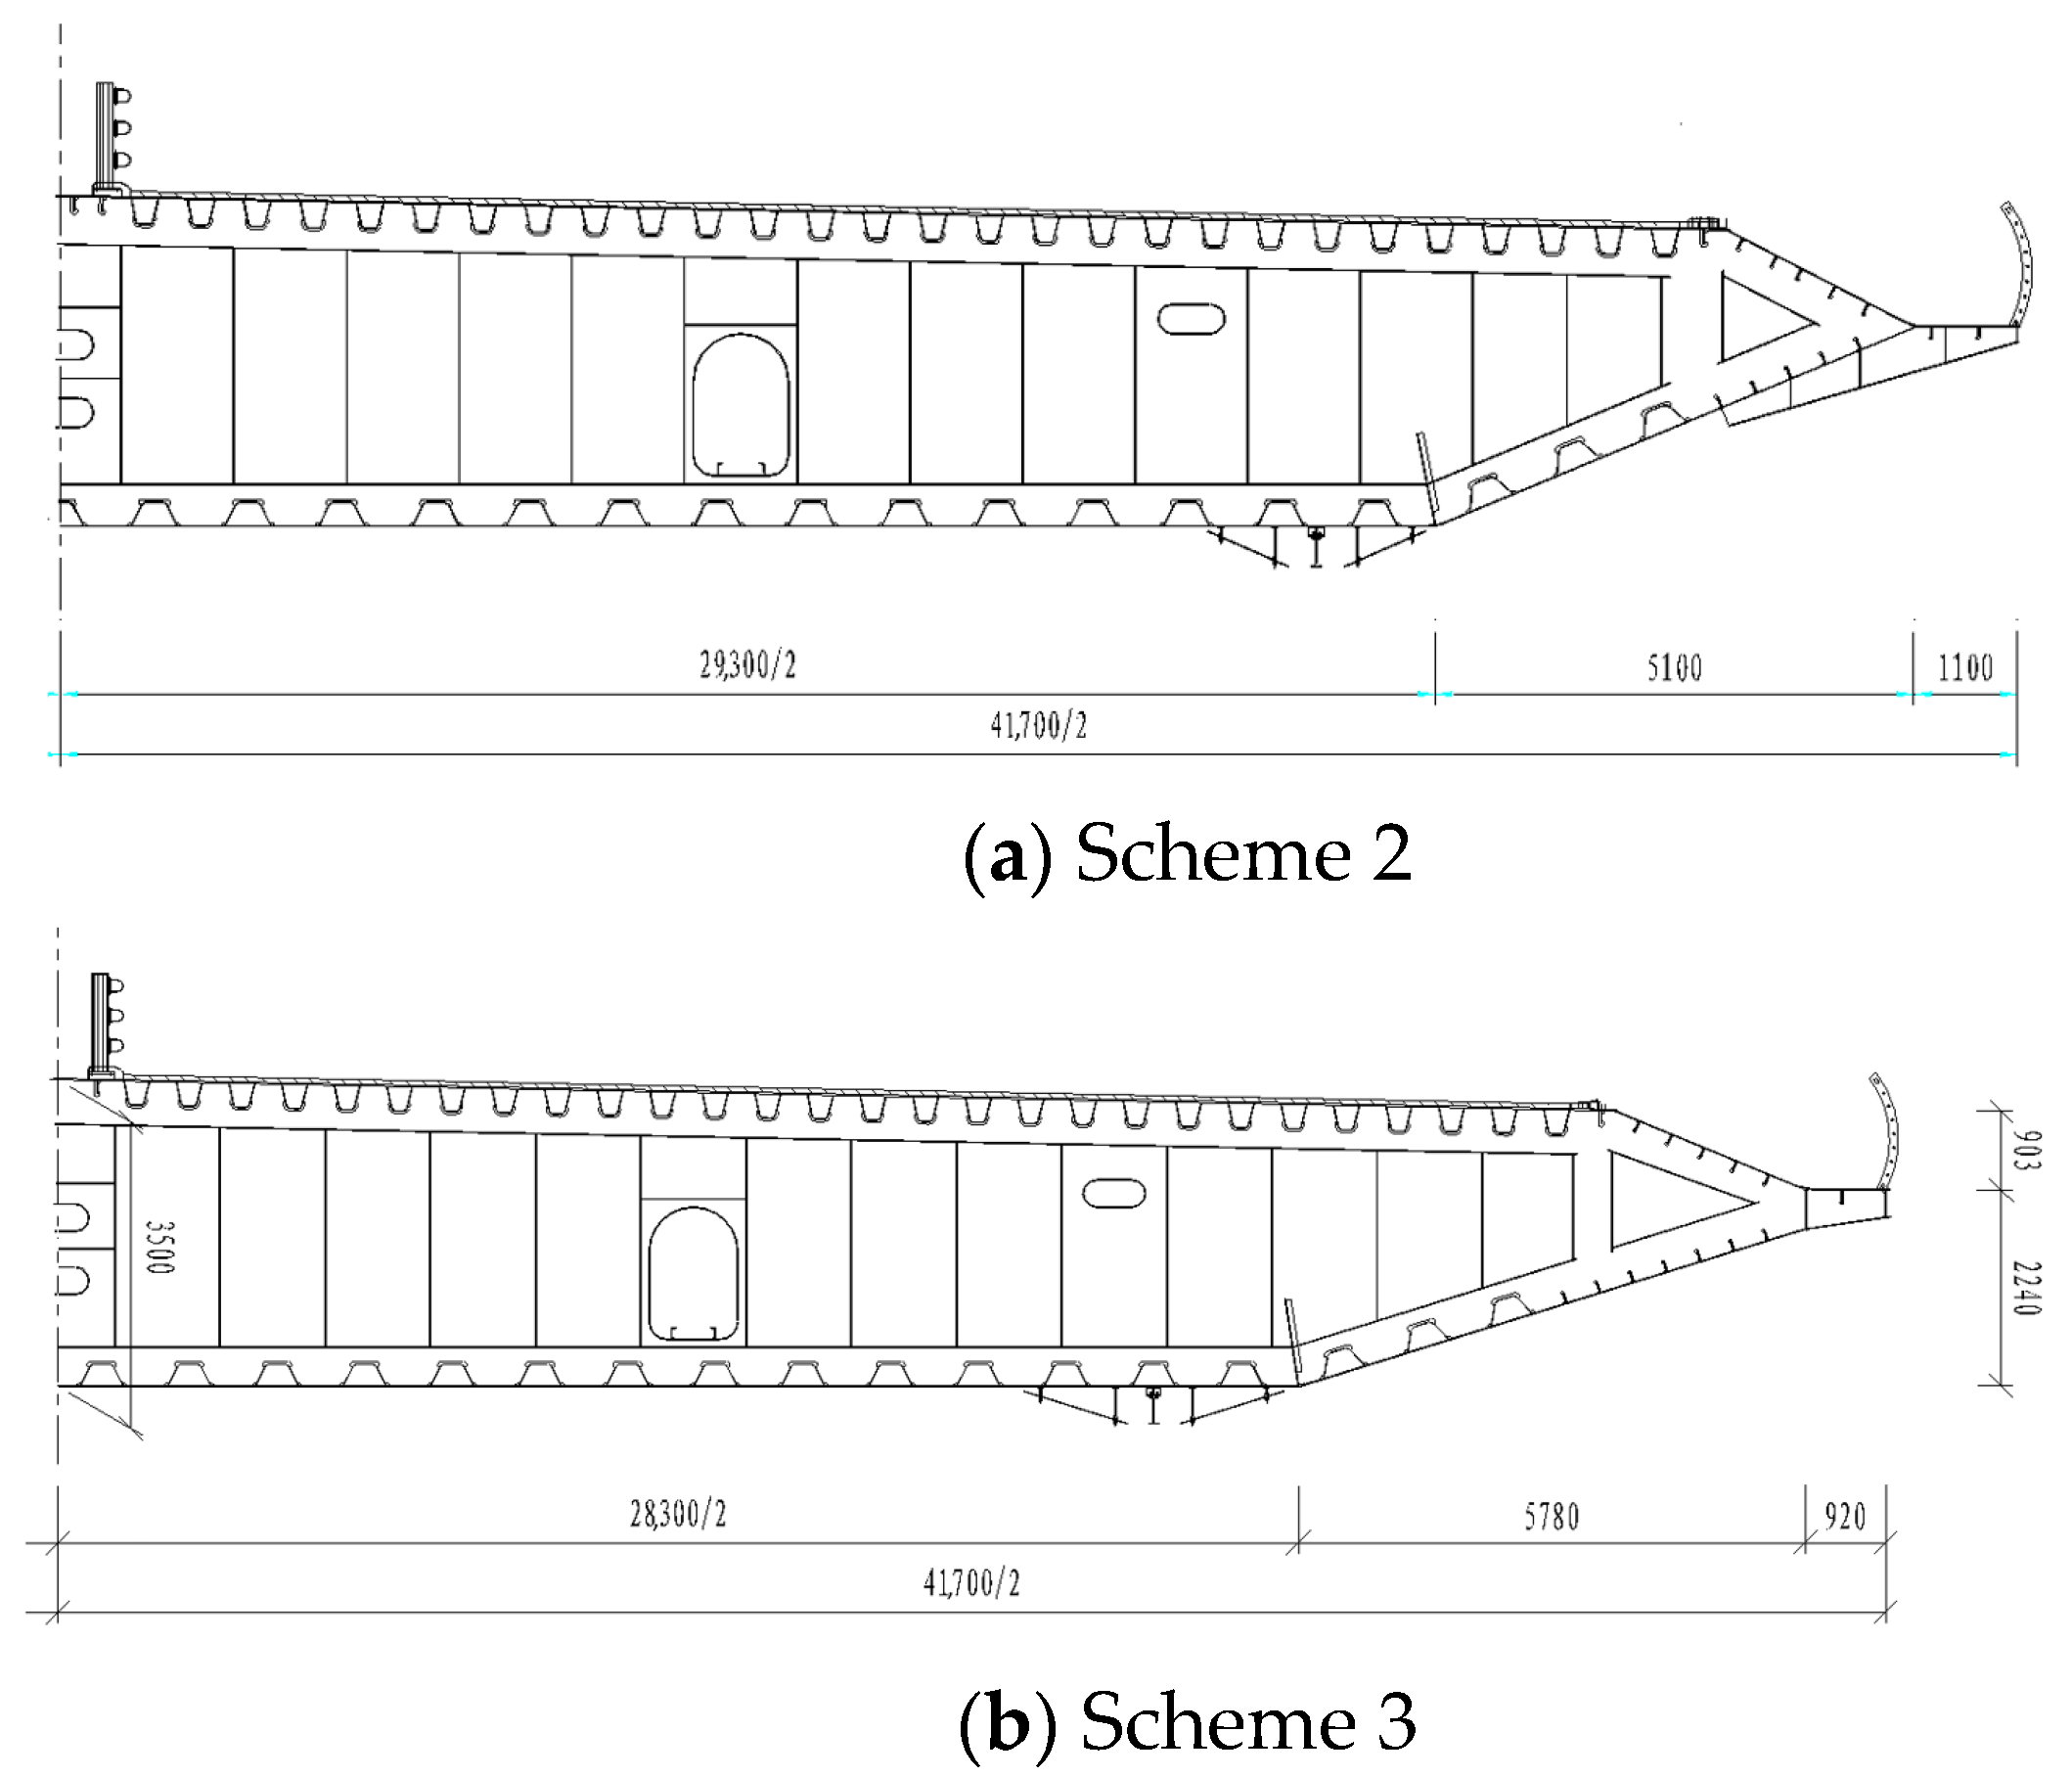
A closed box girder suspension bridge (No. 4) was considered. The main span of the bridge was 1688 m. In the preliminary design stage, there were three different comparison schemes for the main beam section. Scheme 1 was a wide-beam scheme, with a beam width of 44.6 m. Scheme 2 and scheme 3 were narrow beam schemes with different wind fairing forms. The beam width of both schemes was 41.7 m, and the beam height was 3.5 m.
Figure 10 illustrates the two schemes of the main beam section. The model is shown in
Figure 11. According to the change in the damping ratio with wind speed, we determined the scheme to be a torsional divergence scheme, as shown in
Figure 12. The flutter derivative was identified through wind tunnel tests.
and
were negative following a reduction in wind speed.
was positive; the
A-term of aerodynamic damping was positive; and the
D-term of aerodynamic damping was negative, as determined using Equation (2), which was the
D-term pneumatic damping drive instability. The flutter derivatives after fitting
and
are shown in
Figure 13. The aerodynamic damping of the
A-term and
D-term was analyzed using the flutter derivatives presented in
Table 5.
According to Equation (5), when the angle of attack was 3°, the
D-term of scheme 3 was negative, and the
A-term is positive. Therefore, it was determined that the flutter driving term was
D-term driving, which was consistent with the result obtained when determining the aerodynamic damping driving term by the flutter derivative.
Figure 14 shows the ATCC of Bridge 4, and
Table 5 uses the ATCC of two schemes to determine the flutter driving term. Using the ATCC of the two schemes to calculate the
K value, the result of scheme 3 was greater than that of scheme 2, indicating that the torsional divergent flutter critical wind speed of scheme 2 was small. The flutter critical wind speeds of the two schemes obtained from wind tunnel tests verified the correctness of the method.
Table 6 shows the calculation results of the
K value.
We considered a steel truss suspension bridge (No. 3) as an example here. The main span of the bridge was 536 m. The critical flutter wind speed (0° angle of attack) obtained through the original wind tunnel test (Scheme 1) was 43.8 m/s, which was less than that of the simulated flutter wind speed test. Through wind tunnel tests on the main girder, it was shown that scheme 2 effectively increased the critical flutter wind speed of the bridge.
Figure 15 shows the two schemes of the main beam section.
Table 7 shows pneumatic measurements for the two schemes. The sectional model for flutter tests in a wind tunnel is shown in
Figure 16. Using the ATCC to calculate the
K value of scheme 2, the result was greater than that of scheme 1, indicating that the overall positive aerodynamic damping of scheme 2 was larger than that of scheme 1, and the absolute value of negative aerodynamic damping was smaller than that of scheme 1. Therefore, the critical wind speed of torsional divergence flutter in scheme 2 was small. The
K values of the schemes are presented in
Table 8.
Figure 17 shows their ATCC values.
- (3)
Flat steel box girder section
Here, we considered a suspension bridge (No. 2) as an example. The bridge had a total width of 69.8 m and a height of 4.2 m. Under the condition that the ventilation rate of the guardrail is 75%, aerodynamic tests are conducted on the upper central stabilizer set at different intervals to improve the flutter stability of the bridge..
Figure 18 illustrates the main beam section. The sectional model for flutter tests in a wind tunnel is shown in
Figure 19. Using the ATCC to calculate the
K value of the scheme with pneumatic measurements (scheme 2), the result was greater than that of the scheme without pneumatic measurements (scheme 1), indicating that the overall positive aerodynamic damping of the scheme 2 was larger than that of the scheme 1, and the absolute value of negative aerodynamic damping was smaller than that of the scheme 1. Therefore, the critical wind speed of torsional divergence flutter in the scheme 1 was small.
Table 9 presents the ATCC and calculation results of the
K value.
Table 10 displays the ATCC for Bridge No. 7.
Table 11 summarizes the flutter stability of four types of sections, including five bridges, under different aerodynamic measures using parameter
K to judge the flutter stability, and the critical flutter wind speed of the wind tunnel was used to verify the correctness of this method.


