Review

Rheometry for Concrete 3D Printing: A Review and an Experimental Comparison

by
Roshan Jayathilakage
*,
Pathmanathan Rajeev
and
Jay Sanjayan
Department of Civil & Construction Engineering, Swinburne University of Technology, Melbourne 3122, Australia
*
Author to whom correspondence should be addressed.
Buildings 2022, 12(8), 1190; https://doi.org/10.3390/buildings12081190
Submission received: 12 July 2022 / Revised: 1 August 2022 / Accepted: 5 August 2022 / Published: 8 August 2022

Abstract

:
The rapid advancement of 3D concrete printing (3DCP) and the development of relevant cementitious material compositions can be seen in the last few decades. The commonly used 3DCP method is to build the structure layer by layer after extruding the material through a nozzle. Initially, the pumping and extrusion of the material should be done with considerable fluidity and workability. The extruded layers should retain their shape immediately after extruding and depositing. While constructing the structure in a layerwise manner, the bottom layers should have enough early age strength to support the layers at the top. Therefore, at different processes in 3DCP, the rheological requirement is contradictory. As the rheology of the material is the deterministic factor which decides the fluidity or workability of the mix, proper rheological characterization should be completed accurately. In some instances, due to the higher stiffness, and higher time and rate-dependent material behavior (thixotropic behavior) compared to the conventional concrete, standard rheology measurement techniques have many limitations when used for 3DCP material. Therefore, non-conventional and novel techniques can be implemented with suitable material models to characterize the rheology of 3DCP material. In this study, a comprehensive review was conducted on conventional and non-conventional methods used for characterizing the rheological parameters for 3DCP material. The previously conducted studies were highlighted with the targeted 3DCP processes in the study (if applicable), and rheological parameters achieved from the test (i.e., yield stress, viscosity, and thixotropy). In addition, some experimental studies were conducted to compare several selected testing methods. The rheological parameters achieved from different test methods were compared to identify the similarities, dissimilarities, pros, and cons between the test methods. Furthermore, the extrudability and buildability studies were conducted for the mixes to demonstrate the usage of the mixes in 3DCP applications and to correlate the achieved rheological parameters with these processes.

1. Introduction

Originally, 3D concrete printing (3DCP) was first introduced by Pegna [1], and later implemented on a larger scale by Khoshnevis as contour crafting [2,3]. Since then, the method has evolved rapidly, and in the last few decades, large-scale structures were developed showing the capability of the 3DCP method as a potential technology for overcoming the barriers in conventional concrete construction [4,5,6,7]. The 3DCP method reduces formwork usage and lowers wastage compared to conventional construction. Additionally, complex geometrical shapes can be achieved free from rectilinear shapes. Due to the usage of robots in the 3DCP method, worksite hazards can be reduced as manual labor will be minimized, and dangerous jobs such as working in heights can be eliminated.
Currently, in many countries, large-scale 3D printing construction projects have been completed and are ongoing. Rapid advancement in robotics technology, material, process, and research and development within the last few decades made real-world applications possible for concrete 3D printing. Some of the large-scale real-world projects using concrete 3D printing include the 3D printed community by ICON BUILD in the USA [8], the two-storey building constructed by Kamp C in Belgium [9], and the 3D concrete printing projects completed by Winsun, China [10].
Of several methods available for 3DCP, such as smart dynamic casting [11,12], particle-bed 3D printing [13,14], and extrusion-based 3DCP, extrusion-based 3DCP is the commonly used method implemented on a larger scale. In the extrusion-based 3DCP method, the material will be pumped and will be extruded through a nozzle to print the structure. At these two stages, in general, the material should have enough fluidity and workability to flow inside the pump and the nozzle system without any blockages, segregation, or phase separation [15,16,17]. After the extrusion, layer-wise construction will be completed. Immediately after the deposition of the layers, each layer should have enough early strength to retain its shape. While constructing the structure, the bottom layers should have enough stiffness and early strength to carry the weight from the top layers without collapsing or deforming excessively [18,19,20,21]. Additionally, the printed layers should exhibit a good surface quality without any cracks, pores, splitting, or tearing of the filament printed. Furthermore, each layer should have enough bond strength to ensure structural rigidity, specifically at the hardened state of the material [22,23,24,25].
The rheology of the mixes is the key factor that determines the fluidity, rigidity, or workability of the mixes at each stage of the 3DCP process. Controlling the rheology is the key concept in the 3DCP process. Therefore, important physical parameters that define rheology should be accurately identified and characterized. The following sections focus on the key rheological parameters important for each process in 3DCP and the existing rheology measurement techniques specifically used in 3DCP applications to characterize those parameters.
From the up-to-date literature for 3D printable concrete, the rheological parameters obtained in each of the studies are massively varying according to the test method used for the rheology measurement. There are no comparison attempts on how and why the parameters are changing according to the test method used, what the selection criteria are for each test, and what to expect when using different test methods. In addition, there is not any work that discusses the pros and cons of each test method and the importance of the 3D printing process when selecting the test method. Furthermore, most of the previous review papers only compare either conventional methods (such as rheometers or slump) [26,27,28] or non-conventional methods separately [29]. Therefore, to address the above gaps, the authors introduce the in-hand review paper, which addresses all of the above aspects. Additionally, to strengthen the review, the authors have conducted experiments to analyze the rheological parameters obtained from several test methods and relevant process parameters to consider in 3D printing. This type of work has not been done in past studies and will address most unanswered questions relevant to the rheological test methods used in 3D concrete printing applications.

Structure of the Paper In-Hand

This review paper consists of five main sections. In Section 1, we introduce the current research gaps, the importance of the current study, and the structure of this paper. In Section 2, the rheological parameters important for 3D concrete printing, process parameters, and rheology measurement techniques (conventional and non-conventional) used for concrete 3D printing are reviewed, with highlighting of their pros and cons. In Section 3, experimental work for selected rheological testing methods (standard and non-standard) and laboratory scale printing procedures are presented for different printable concrete mixes. The results from the experimental work and discussion of the results will be presented in Section 4, and the conclusions of the study are presented in Section 5.

2. Process Parameters and Rheology Measurement Techniques

This comprehensive review of the rheological characterization techniques was conducted systematically. Initially, the keywords such as rheology, concrete 3D printing, 3DCP, rheometry, yield stress, extrudability, buildability, and viscosity as well as key phrases such as “rheology for concrete 3D printing” and “measurement of rheology for concrete” were used. Then, the relevant literature was selected considering the 3D printing applications and disregarding other concrete materials such as self-compacting concrete or normal concrete mixes. This was done by looking at the keywords used in the papers as well as skimming through the abstracts of each paper. The year of publication was not restricted after narrowing down the relevant literature specific to concrete 3D printing. As concrete 3D printing is a considerably new research area, the publications currently available in this regard are deemed to be within the past few decades. Mainly papers published in tier 1 and tier 2 journals were considered for the review and the initial searching was completed using Google Scholar, Swinburne University of Technology (Australia) online library, and journal websites.

2.1. Rheology and Process Parameters for the Material Used in 3DCP

2.1.1. Rheological Parameters for 3DCP

The main rheological parameters relevant to 3DCP material can be identified as yield stress, viscosity, and thixotropy. The yield stress ( τ 0 ) can be defined as the minimum shear stress at the onset of material flow. Below the yield stress limit, the material can exhibit solid-like behavior.
After exceeding the yield stress, the material can flow. If one considers the concrete as a fluid with different infinite layers divided parallel to the flow direction, the resistance between the infinite fluid layers can be defined as viscosity ( μ ). The higher the material viscosity, the lower the flowability.
Concrete is a complex composite material with cement particles, fluid (i.e., water and admixtures), and granular material interactions. Many chemical reactions are occurring between the components in a concrete mix. Specifically, the cement particles tend to flocculate with time and form a structure when kept at rest. As a result, the yield stress and viscosity can increase with time. A parameter can be defined as the structural built-up rate ( A t h i x ), which quantifies the time-dependent rate of increase in the yield stress of the material. At the same time, the shearing or mixing of concrete may result in deflocculation of the cement particles and can reduce the yield stress and the viscosity of the mix. This type of time and rate-dependent behavior can be identified as the thixotropic behavior of concrete [27,28,30,31].
These three parameters mainly decide the pumping, extrusion, and layer-wise construction capability of 3DCP mixes. For each process, multiple parameters or a single parameter would be the governing factor for controlling the process, and it is useful to identify which parameter(s) has a significant effect on the process considered.

2.1.2. Pumping and Extrusion

Initially, the mixed material should be pumped through a hose or a pipe system directly to a nozzle or an intermediate mixing device [30]. At the pumping stage, the material should not get blocked inside the pump, hose, or pipe system. Progressive cavity pumps are the commonly used pumping device in 3DCP applications to pump and transport the material to the desired location. According to the previous studies, material viscosity is the most important parameter to be considered while pumping the material [31,32,33]. However, for a very high yield stress material, the yield stress to viscosity ratio could be a governing factor. Typically, for flowable concrete such as self-compacting concrete and conventional concrete, the lubrication layer (LL) formation inside the pipe or hose wall can improve the pumpability and decrease the pumping pressure [34]. As mentioned in the previous literature, two flow regimes can be identified while pumping concrete. These are (1) slip flow behavior with unsheared bulk, and (2) combined shear and slip flow behavior where there is a plug flow + a partial shearing of the bulk in combination with the slip flow [35]. Therefore, characterizing viscosity and yield stress in the lubrication layer and the bulk material will be important.
If a concrete mix has a higher viscosity or very high yield stress, the pumpability will be reduced. Therefore, to improve the pumpability, the viscosity and the yield stress should be kept at a minimum. However, in 3DCP applications, these rheological parameters cannot be minimized extensively because, after the pumping and extrusion process, the material will not have enough strength to retain the layer geometry or to support the top layers. Therefore, during the pumping and extrusion process, the optimum rheological parameters should be considered, which are favorable for pumping, extrusion, and layer-wise construction.
Therefore, in practice, very high thixotropic material will be used in 3DCP applications (i.e., if no accelerators are added near to the nozzle head). In the pumping and extrusion stages, higher shear rates will be applied due to higher pumping pressures, higher velocities inside the hose or pipes, and higher rotational speeds applied in some pump screws and screw extruder devices. For very high thixotropic material, at higher shear rates, the viscosity will be reduced, and the material will flow easily. However, after the extrusion and deposition stages, the material will almost become static, and very low shear rates may apply due to the material flow under gravitational forces. Hence, the viscosity values will become higher and due to the time-dependent structural build-up, the yield stress will increase rapidly, giving a higher early age strength in the layers. In addition, it should be noted that even though the yield stress and viscosity are kept at an optimum level favorable for pumping and extrusion, the structural build-up rate may also have a significant effect at the pumping and extrusion stage. It was found, in previous studies, that a short interruption (after around 20 min) in pumping can cause blockages inside a pumping system if the thixotropic build-up rate is around 0.3 Pa.s−1 [33]. Therefore, the structural build-up rate also should be considered an important parameter when making decisions on allowable pausing time frames of the pumping and extrusion processes.
The material extrusion or extrudability requires a similar rheological requirement as in the pumping stage. However, the extrusion ability also depends on the nozzle sizes used, nozzle geometries, extrusion speed, and also the type of extruder used [36]. It goes without saying that the higher the nozzle sizes, the higher the extrudability without any aggregate blocking [37]. Furthermore, in terms of nozzle geometry, if the die length is higher, the extrudability will become lower [17,38]. However, in the current study, only the rheological and material parameters are of interest, and further discussion of the influence of geometrical parameters of the extruder on extrudability is out of the scope of this study.

2.1.3. Buildability

After the pumping and extrusion processes, layer-wise construction should be completed, and the individual layers should have enough strength to support the self-weight of the layers. In addition, the bottom layers should be stiff enough to prevent excessive deformations and collapsing due to the vertical forces (due to gravity) induced by the top layers. Two common failure modes were identified by several researchers for the 3DCP technique. Due to exceeding the material strength limit, a strength-based failure could occur. Mainly, if the stresses induced by the vertical forces reach the strength limit of the material, the particular strength-based failure occurs. Different researchers followed different approaches and material models to define the particular strength limits of the material. Di Carlo [39] used a linear Drucker–Prager yield criterion to predict the failure of the 3D printed layers. The unconfined compression test and parameters were used in the model. Wangler et al. [40] proposed a rheology-based model, where the strength-based failure occurs when ρ g H / 3     τ y t . Here, ρ , g , H and τ y t are material density, gravitational constant, total build height, and the time-dependent material yield stress, respectively. The same rheology-based model was used by Roussel et al. [41] and many other researchers [7,42,43,44].
Kruger et al. [42] also used a rheology-based material model to predict the early age strength-based failure occurring in 3D printed layers. They used a bi-linear material model considering both the structural build-up rate and the re-flocculation rate for defining the material thixotropic behavior. The Tresca failure criterion was used in the study to predict a lower bound failure layer number rather than achieving the exact value.
Wolfs et al. [20] developed a finite element model based on a time-dependent Mohr–Coulomb failure criterion to predict the strength-based failure as well as the buckling failure. However, the numerical model overestimated the failure heights achieved experimentally. The major reasons for the discrepancies between the numerical and experimental results were predicted as the overestimation of the Mohr–Coulomb and elastic modulus parameters in the tests due to material compaction.
Jayathilakage et al. [18,19] also used a time-dependent Mohr–Coulomb-based material model and a finite difference simulation technique to predict the strength-based failure of 3DCP. The tests were conducted to determine Mohr–Coulomb parameters and elastic modulus parameters, and care was taken to reduce the material compaction. The simulation was able to predict the failure heights accurately. In addition, in the study, it was concluded that the rheology-based models underestimated the failure heights, specifically, due to neglecting the frictional components acting in the material. In addition, in the study, it was concluded that the Mohr–Coulomb-based model had higher accuracy than the rheological-based models. Therefore, a simplified analytical model based on the time-dependent Mohr–Coulomb failure criterion was introduced in the study.
In addition to the strength-based failure, stability failure also can be seen frequently in 3DCP. Most of the printed structures consist of thin walls and higher slenderness. Therefore, stability failure may occur in larger print heights frequently. Furthermore, the eccentricities occurring at layer placement can cause stability failure. Wolfs et al. [20] developed a finite element model to predict the stability failure occurring in 3DCP as mentioned earlier. Mainly due to the radial deformations occurring in the structure, stability failure was initiated in combination with the strength-based failure in that study. Suiker et al. [43] developed parametric models to determine the buckling failure of printed straight walls. Later, Wolfs et al. [44] used experimental and numerical studies to determine the accuracy of the analytical equations developed by Suiker et al. [43]. The parametric model by Suiker et al. [43] considered the time-dependent material properties and print velocities (defined by a curing function), support conditions of the printed wall, and the geometrical imperfections.
From the studies available in the literature, Roussel et al. [41] pointed out that the critical height ( H T ) which transitioned between the strength-based failure and stability failure of 3DCP could be found from H T = 2 δ ( 1 + ν ) / 3 3 γ c . Here, δ , ν , and γ c are the width of a layer, Poisson’s ratio, and the critical shear strain, respectively. The buckling failure may dominate if the print heights are higher than the transition heights, and plastic collapse will occur if the print heights are lower than the transition heights. However, this simplified calculation may only be valid for rectangular cross-sections similar to straight walls. In addition, it should be noted that in 3DCP applications, the material parameters can vary rapidly with the concrete age due to the higher thixotropic characteristics when compared with the material used in conventional concrete applications and self-compacting concrete applications. Therefore, it is important to accurately determine the time-dependent rheological parameters of the 3DCP as well as the time-dependent elastic material behavior.
As discussed in earlier sections, rheology plays a major role in achieving a pumpable, extrudable, and buildable concrete mix. Therefore, accurate measurements of rheological parameters relevant to 3D printing processes are of the utmost importance. There are already established standard methods as well as non-conventional methods for measuring the rheological parameters. However, one of the important factors to consider when selecting a rheology testing method is the rheological model used for the material. The following sections describe the rheological models frequently used for 3DCP material, and the commonly used conventional and non-conventional methods used for characterizing the rheological parameters.

2.1.4. Rheological Models and Time-Dependent Rheological Behavior of 3DCP

Most commonly, the concrete is considered a Bingham fluid [45] with yield stress and viscosity. Therefore, simply the Bingham model [45] is used to define the shear stress vs. shear strain behavior as follows:
τ = τ 0   + μ γ ˙
In Equation (1), τ and γ ˙ are shear stress and shear rate, respectively. However, as mentioned earlier, concrete typically shows a thixotropic and shear-thinning behavior (i.e., the viscosity will reduce with the increasing shear rate). Therefore, to show the shear-thinning behavior of concrete, the Herschel–Bulkley model [46] is commonly used as shown in Equation (2).
τ = τ 0   + μ γ ˙ n
In Equation (2), n is the flow index and the value is usually lower than 1 for shear-thinning fluids ( n = 1 for Bingham fluids).
Additionally to the Bingham model and the Herschel–Bulkley model mentioned above, there are many other flow models such as the modified Bingham model [47], Casson model [48], De Kee model [49], Quemada model [50], Vom Berg model [51], Yahia and Khayat model [47], and Robertson–Stiff model [52]. The similarity between all the models mentioned (except the Quemada model [50]) is that they all define the yield stress parameter, which is the intercepting point of the flow curve in the shear stress axis (in shear stress vs. shear strain plot). However, most of the testing methods discussed in this study will be based on the Bingham and the Herschel–Bulkley rheological models.
Specifically, in 3DCP applications, time-dependent material behavior also should be considered for each rheological parameter. Typically, the yield stress increase with concrete age, and the Roussel model [53], and the Perrot model [54] explain the evolution of yield stress with time as shown in Equations (3) and (4), respectively.
τ y t = A t h i x t + τ y 0
τ y t = A t h i x t c e t t c 1 + τ y 0
In Equations (3) and (4), τ y t , τ y 0 , A t h i x , and t are the time-dependent yield stress, initial yield stress, thixotropic constant, and the concrete age, respectively. In Equation (4), t c is defined as characteristic time, which is a curve-fitting parameter. According to the Roussel model in Equation (3), the yield stress is increasing linearly. However, Perrot et al. [54] later found that for 3DCP concrete material, the yield stress will increase linearly up to around 60 min and keep increasing exponentially after around 60 min. However, the linear to exponential transition time duration may vary with the type of mix used.
In many studies, plastic viscosity ( μ ) also was identified as a time-dependent rheological parameter [55,56]. Papo et al. [55] developed an analytical model, as in Equation (5), to describe the time-dependent behavior of the viscosity in cement pastes and slurries.
μ t = t t v N 1000 μ 0 + μ 0
In Equation (5), μ 0 , t v , and N are initial viscosity, the time taken for the material to reach a comparatively high viscosity (correlated to water: cement ratio), and a parameter related to the kinetics of cement hydration, respectively. Typically, in most 3DCP applications as well as in rheology measurement techniques, consideration of time-dependent viscosity cannot be seen commonly. The main reason for this is that a considerable change in viscosity for cementitious material takes place after a concrete age of around 30 to 60 min depending on the mixed constituents [55]. However, in most 3DCP applications, the first few minutes can be the most critical.

2.2. Conventional Rheology Measurement Methods

According to the National Institute of Standards and Technology (NIST), the rheology measurement techniques for cementitious material can be categorized in Table 1 [57].
In Table 1, most of the free flow test methods such as slump flow tests, J-Ring tests, etc., are most suitable for normal concrete and self-compacting concrete (SCC), which have considerable flowability. For very stiff concrete and comparatively less flowable concrete used in 3DCP applications, the free flow tests may not be suitable because the stiff concrete may not flow freely due to its self-weight (due to higher yield stresses). From the free flow tests such as slump flow tests, yield stress can be measured primarily and will be discussed in detail in the following sections.
Similarly, confined flow tests are not suitable for very low to moderate slump concrete mixes which do not have sufficient fluidity to flow under confined conditions. Confined flow tests are commonly used for SCC, which highly flows. Using confined flow tests, not only the yield stress but also the apparent viscosity of a mix can be measured. Furthermore, physical phenomena such as passing ability and aggregate blocking can be measured using confined flow tests such as the L-box test.
Vibration test methods are most suitable for low and moderate slump concrete which are mostly vibrated in field applications. Vibration test methods are typically free flow or confined flow and are simple to perform. The flow table test with vibration is one of the methods frequently used to compare the rheology of different cementitious mixtures used in 3DCP. However, in this method, only a comparison between mixes can be made, as no quantifying method of rheology or any analytical solution is available for the method [59]. Therefore, the method should be used with another rheology testing method, such as rheometers, and is not very effective in measuring the rheological parameters directly, specifically for 3DCP applications.

2.2.1. Slump Test and Flow Table Test

The slump test is a free flow test method and is commonly used in field applications as a standard test method to measure workability. A standard slump cone will be filled with the material, compacted, and the cone will be lifted slowly, allowing the material to flow under gravity. Measurement of the difference in slump height (slump value) or the bottom diameter (slump flow value) will indicate the workability of the mix. The higher the slump flow or the slump value, the higher the workability of the mix. The slump cone consists of different dimensions according to the standards used. According to the standard ASTM C143/C143M [60], the slump cone mold has a bottom diameter of 200 mm, a top diameter of 100 mm, and a height of 300 mm.
The slump height typically correlates with the yield stress value of a concrete mix. The viscosity has a negligible effect on the slump value, and in most instances will be neglected. The higher the slump height, the lower the yield stress of a mix and vice versa. Few researchers have developed analytical models to predict the yield stress values from the measured slump height [61,62,63,64,65].
Kurokawa et al. [66] developed analytical equations correlating slump ( S L ) in cm and slump flow ( S F ) in mm values to concrete yield stress ( τ y ) as shown in Equations (6) and (7):
τ y S L = 7 ρ g H S L 1200 3
τ y S F = V s ρ g 25 3 π ( S F 2 ) × 10 8
In Equation (6), H is the slump mold height (i.e., 30 cm), and in Equation (7), V s is the volume of the slump cone in m3.
Similarly, Hu et al. [63] conducted finite element simulations on slump tests with varying slump values (0 to 25 cm) and introduced the BTRHEOM rheometer to correlate slump values with yield stress. The relationship between the slump value and the yield stress in [63] is given in Equation (8).
τ y S L = ρ 30 S L 27
In Equation (8), the slump value ( S L ) should be given in cm. It was found in the study that Equation (8) is only valid for the concrete where the viscosity is lower than 300 Pa.s.
Roussel et al. [64] developed an equation to calculate the yield stress values using the slump value. The computational fluid dynamics (CFD) simulations and different rheometer experiments were conducted to validate the model. According to [64], a simple linear expression between the slump (in cm) and the yield stress can be written for a slump range of 5 to 25 cm as in Equation (9).
τ y S L = ρ 25.5 S L 17.6
From Equations (6), (8) and (9), the maximum yield stress value can be measured from the slump test and is around 2.5 kPa (i.e., if the slump value is zero and the density is around 2300 kg.m−3). Therefore, it can be predicted that for concrete mixes used in 3DCP applications, the slump value will be nearly closer to zero because a typical 3DCP mix can initially have yield stress around 1 to 5 kPa or even more [31,42,56], and will increase with time rapidly, compared to a conventional or self-compacting concrete mix. Therefore, slump tests may not be very accurate or less sensitive in measuring the yield stress of 3DCP mixes. Therefore, it is obvious that the slump flow value also may not be accurate in measuring the yield stress values of 3DCP mixes due to very low flowability. It was found in [66] that Equation (7) is accurate for a slump flow value higher than 300 mm, which can be much smaller for 3DCP mixes. However, due to its availability (inexpensive) and the fact that it is easily conducted as a field test method, the test method is widely used in 3DCP applications.
Another test method similar to the slump test is the flow table test. However, the cone used for the flow table test is usually smaller than the one used for the slump test. According to standards ASTM C230/230M [67], the cone used for the flow table test has a base diameter of 100 mm, a top diameter of 70 mm, and a height of 50 mm. According to the ASTM C1437 [68], the cone should be filled with material and tamped and then the cone should be lifted, similar to the slump test. Afterward, the flow table is dropped 25 times in 15 s. Then, the spread diameter will be recorded and presented as the percentage change in the diameter before lifting the cone. The value is defined as the flow value of the mix. The method was used in previous research only to compare the mixes used in 3DCP [59,69]. As mentioned earlier, there is no analytical equation to correlate the spread value with the rheological parameters. However, it was found in earlier research that the final spread diameter is linearly proportional to the slump value for highly flowable concrete mixes [70].

2.2.2. Rotational Rheometers

The devices attempting to use methods of fluid rheology to measure the flow of concrete by measuring shear stress at varying shear rates are called rheometers [58]. The resistance to flow with varying shearing rates can be measured in the commercially available rheometers. Commercially available rheometers are mostly designed for polymer systems or measuring the rheology of cement pastes or mortar with very fine aggregate. Rotational rheometers have different geometries such as parallel plates, coaxial cylinders, and vane geometry. Due to the inclusion of large particles in concrete, the most commonly available rheometers cannot be used for concrete.
Many types of research have been conducted to develop rheometers for evaluating the rheology of highly fluid concrete mixes such as self-compacting concrete [71,72,73,74]. A considerable amount of research was conducted using commonly available or custom-made rheometers for cementitious material. However, the results achieved for rheological parameters may not be comparable due to the differences in the mixes used, the protocol followed, material preparation, etc. [72,75,76].
From a survey conducted in France [77], the results reported that, even with the same material and mixing conditions, large variations in yield stress and viscosity values can be observed. However, a good correlation between the rheometers can be seen and a qualitative comparison can be made in the values. Twelve different concrete mixes and five different rheometers (with different geometries such as parallel plate, coaxial, and mixing action with impeller) were used in this study. The slump values of the mixes ranged from 90 mm to 235 mm.
Nevertheless, rheometer usage in 3DCP applications may have many limitations in terms of the material model used, sample preparations, and also the measurable value range. Additionally, when including the larger particle sizes, the geometries used in many rheometers will not be adequate to measure the rheological parameters. For example, coaxial and parallel plate geometries may cause wall slippage as found in a few studies when used for low or no-slump concrete [75,78]. In addition, particle migration and segregation [76,79], not enough gap widths to include larger particles, and plug flow formation [80] are some well-known issues when using a parallel plate or co-axial cylinder geometries [75]. Hence, to eliminate issues such as wall slip and plug formation, vane geometries are used more often to measure the rheological parameters of 3D printable concrete mixes. However, the above-mentioned issues can still exist in a vane geometry when used for the higher yield stress concrete mixes typically used for 3DCP applications.
The torque ranges applied in the motors in standard rheometers are typically designed for measuring the shear stresses (ranges up to hundreds of pascals) of highly fluid mixes typically used in self-compacting concrete applications or cement pastes. Typically, the mortar or concrete used in 3DCP applications reaches up to thousands of pascals. Therefore, most of the rheometers available in the market are not suitable for measuring the shear stresses of 3DCP mixes. However, recently there are few rheometers available in the market which can measure up to thousands of pascals.
For 3DCP material as well as for other cementitious materials, the most commonly used rheology measurement protocols are the stress-growth test [54,81,82,83] and performing the hysteresis loop test [81,84,85,86]. For the stress-growth test, the material will be sheared with a very low constant shear rate (typically 0.01 to 0.001 s−1) and the shear stress variation will be recorded. The peak shear stress value where the structure is considered to break fully is then considered as the yield stress value of the material. For 3DCP mixes, this method is frequently used to achieve the yield stress evolution rate with the concrete age [18,56,84]. The same test method can be performed for different concrete ages to achieve the thixotropic build rate ( A t h i x ) of the mixes.
However, when applying the stress-growth test to measure the structural build-up in 3DCP material, several issues should be overcome according to the previously published literature [81,82]. Nerella et al. [81] proposed a strain-based stress-growth test rather than using a constant shear rate as small as 0.01 s1 to 0.001 s1. The main issue in using a small shear rate is the longer times taken by the material to reach a critical strain (i.e., where a peak shear stress is occurring). For 3DCP material, which is prepared as a single batch to measure the time-dependent structural build-up rate, longer testing times may give erroneous results. Therefore, according to the material used, one can select a minimum critical strain and an optimum total test duration to prevent structural build-up and achieve the peak shear stress of the material. Ultimately, the shear rate can be higher than the usually used range mentioned above. Nevertheless, the selection should be made to minimize viscous effects.
Ivanova et al. [82] discussed the challenges and applicability of the constant shear rate test using two rheometers, namely, the HAAKE MARS II and Viskomat XL. The single batch approach for measuring the time-dependent static yield stress and structural build-up rate was considered in the study. According to the study, similar static yield stress values as well as comparable thixotropic build-up rate values ( A t h i x ) can be achieved for the same mixes using the two rheometers. However, care should be taken to apply the same shear rates and the same structural breaking criteria without excessive deformations. Additionally, in the study, it was found that plug formation can happen if there is a large gap between the cell and the probe of a rheometer. Because of the plug formation, there can be inaccuracies in the formulas used to convert the torque and the rotational speeds into shear stress and shear rate, respectively. However, a considerable error will occur in shear rates when compared to the shear stresses due to the erroneous conversion.
In the hysteresis loop test, the material will be sheared from the rest with an increasing shear rate linearly within a certain period (up curve), and then decreased up to zero linearly (down curve). The up curve represents the structural breakdown of attractive cement particles, and the down curve shows the stress vs. strain behavior of the flowing material. Typically, the shear stresses in the up curve are higher than the down curve shear stresses because higher stresses are needed to break the structure and allow the structure to flow. Typically, in the up curve, the intercepting location of the shear stress axis at a zero shear rate will be taken as the static yield stress of the material, and the slope of the stress vs. strain curve as the viscosity. The intercepting location of the down curve in the shear stress axis (i.e., the shear rate at zero) is considered the dynamic yield stress. Dynamic yield stress is defined as the threshold shear stress needed to maintain the flow of the material. However, according to the total testing time and the thixotropic behavior of the material, the shape and the values of the up and down curve can vary (i.e., if the material has a higher structural build-up rate and the testing time is higher, the down curve can show higher shear stresses than the up curve due to the rapid structural build-up) [85]. Therefore, it is advisable to use lower testing periods for highly thixotropic material used in 3DCP applications. The total test times should be selected carefully to reproduce the up and down curves to achieve the rheological parameters accurately.
Small amplitude oscillatory shear (SAOS) rheometry is also a method used recently in 3DCP mixes to measure the rheological parameters [26,87]. Typically, rotational rheometers with parallel plate geometry or vane geometry are used commonly for the method. In the SAOS method, a sinusoidal oscillation will be applied to the sample continuously to reach a given displacement or stress. Typically, the displacement amplitudes or the strain amplitudes applied to the samples are very small (ranges from 10−6 to 10−4 magnitudes of strain for cement pastes). Therefore, samples will deform within the elastic range. Hence, the SAOS test is also considered a non-destructive test method and is commonly used to evaluate the time-dependent structural build-up parameters in 3DCP using a single batch of material. Two parameters, namely the storage modulus ( G ) and the loss modulus ( G ), can be measured using the method. The G represents the elastic component of the material stress and the G represents the viscous or the liquid component of the stress in the material. For example, if the material is ideally solid, the G component will be equal to zero because the material is perfectly elastic. Similarly, if the material is an ideal liquid, the G component will be zero because there is no rigidity. Therefore, the method simply measures the visco-elasticity of the material. The relationship between the time-dependent shear stress, storage modulus, and loss modulus can be written as in Equation (10).
τ t = γ 0 G sin ω t + G   cos ω t
In Equation (10), γ 0 and ω are the strain amplitude and the angular velocity, respectively. Three methods can be incorporated to do the test, namely the oscillatory frequency sweep, oscillatory amplitude sweep, and the time sweep method. In the frequency sweep test, the amplitude (strain) keeps constant and the frequency keeps increasing up to around 100 Hz. The method is used to find an appropriate frequency for the SAOS test [88]. In the oscillatory amplitude sweep test, the frequency keeps a constant (more than 0.2 Hz is recommended because no specific changes in G can be seen above that frequency [89]) and the amplitude keeps increasing incrementally above the critical strain limit of the mix (typically 10−5 to 10−1 range). From this method, a critical strain amplitude can be established. The time sweep test can be used to evaluate the structural build-up and rheological parameter evolution with concrete age. After selecting a critical strain limit from the amplitude sweep test and a frequency, the oscillation can be completed with a constant frequency and a suitable constant amplitude (lesser than the critical strain amplitude) within the selected time period. It was found in previous studies that the G increases with increasing concrete age similar to the static yield stress. However, the magnitudes of the static yield stress and G are not similar [90]. According to the intermittent tests carried out between the static yield stress measurement and SAOS measurement in a concentric cylinder geometry, it was explained by Yuan et al. [90] that the SAOS storage modulus measurement considers smaller critical strains occurring between the C-S-H structure in smaller cement grains. However, for static yield stress measurements, large critical strains in colloidal cement particles are incorporated.
Nevertheless, for measuring the time-dependent structural build-up of 3DCP, the method shows great potential due to the consideration of the solid-like region of the material. Specifically, for the 3DCP buildability assessment, this can be useful. Silva et al. [87] used the SAOS method to assess the time-dependant rheological parameters such as yield stress and elastic modulus to assess the strength and stability-based failure of 3DCP. Moeini et al. [26] used the SAOS method to evaluate the structural build-up of cement-based material used in 3DCP. The storage modulus evolution rate achieved in the study shows a good correlation with the extrudability and the shape stability of the printed layers. Moeini et al. [26] pointed out that the structural build-up of already printed material should be considered via the SAOS test, which considers the undisturbed material in the testing protocol. For newly deposited material after shearing and being disturbed in the pump and the extruder, the static yield stress measurements after pre-shearing protocols are more suitable. Hence, the SAOS method sheds some light in future research on assessing the rheological parameters useful for 3DCP applications.

2.3. Non-Conventional Methods

As discussed in previous sections, most conventional rheology measurement techniques have been designed for measuring the rheological parameters of highly or moderately fluid concrete typically used in self-compacting concrete or normal concrete. Even though some equipment such as rheometers were developed recently to overcome many barriers, there are still many limitations when applied to stiff and highly thixotropic mixes such as 3DCP mixes. In addition, the protocols used in most rheometers may not correlate with the 3DCP processes resulting in erroneous rheological values. It is also essential to identify the rheological properties of mortar and concrete in different loading conditions and strain rates. Therefore, several experimental methods were proposed and examined to find a better approach for measuring the rheological parameters of stiff and extrudable concrete. Physically, the cementitious material used in 3DCP applications is closer to moist clay. As a result, experimental methods developed in geotechnical applications to identify the soil parameters are being experimented with to determine the rheological parameters of cement pastes, cement mortar, and concrete by various researchers. The tri-axial test [91,92], vane shear test, and direct shear test [93,94,95,96] are some methods in geotechnics that are used to measure the rheological parameters of concrete, cement pastes, and mortar. Additionally, the testing methods such as squeeze flow test, ram extrusion, and cone penetration test method are also being used by a few researchers to characterize the useful rheological parameters for 3DCP. Some testing methods and implications for 3DCP are discussed in the following sections.

2.3.1. Direct Shear Test

The direct shear test is used commonly to study the shear behavior of soil under normal stresses. The apparatus consists of a box with a square or circular cross-section. There are two sections of the box where one part (top or bottom) can be moved horizontally with a constant displacement rate, while the other part stays stationary. This allows the material to fail in a pre-defined horizontal plane. Figure 1 shows the schematic diagram for a direct shear box.
Commonly, the linear Mohr–Coulomb behavior will be considered to determine the relationship between the shear strength ( τ ) and the applied normal stress ( σ ) as in Equation (11).
τ = C + σ tan
C and are the cohesion and the friction angle of the tested material. Initially, a constant normal load will be applied until the material reaches a constant consolidation. Afterward, the material will be sheared at a constant displacement rate, and the similar stress vs. displacement (time) curve as in rheometer static yield stress measurements can be achieved. The peak shear strength for a constant displacement rate and normal stress will be recorded as the failure strength. The test should be conducted for different normal stresses. Typically, the failure shear stress increases with the increasing normal stress. The linear Mohr–Coulomb failure envelope as in Equation (11) can be then used to determine the cohesion value (shear strength at zero normal stress) and the friction angle value (slope of the shear stress vs. normal stress line).
From previous research, it was found that the yield stress and cohesion value have a good correlation and have similar values, when terminate the possibilities of having a normal stress application in the considered testing method [96,97,98]. Therefore, few researchers use the direct shear test to determine the yield stress of cementitious material. The direct shear test was used by Lu et al. [99] for cement pastes and cement mortar to predict the yield behavior. The study concluded that the normal stress has a significant effect on the yield stress of paste with low w/c ratios (lower than or equal to 0.4), and the normal stress needs to be considered in the material rheological tests. Furthermore, the test results from the direct shear test for low w/c ratios are closer to the results from the rheometer tests.
Assaad et al. [93] have collected measurements of yield stress in cement pastes using the direct shear test method for different types of cement pastes, and compared those yield stress values with yield stress values achieved from the vane shear test. The yield stress computed from the direct shear test is lower than the vane shear test results in the study. However, the vane measurements (yield stress measurements) from the topmost part of the sample (where the normal stress exerts on the vane from the material is nearly zero) are closer to the yield stress values achieved from the direct shear test. In other cases of vane shear measurements (for shear stress measurements in different depths from the free material surface), the normal load applied from the self-weight of the top material part may lead to the overestimation of yield stress values.
Jayathilakage et al. [96] conducted a comprehensive study of implementing the direct shear test for measuring the rheological parameters of 3DCP material. They found that the displacement rates used in direct shear tests are typically low and do not affect the rheology measurements (cohesion values and friction angles are not changing). Therefore, a proper displacement rate can be selected to conduct the test and prevent structural build-up. Additionally, it is recommended in the study that the low w/c ratio mixes be used in the test due to the possibility of water drainage from the material.
Because of the drainage of water when applying normal stress, it was found that the low w/c ratio mixes are much more suitable to test in the direct shear test. Therefore, recently, few researchers have used the direct shear test for 3DCP mixes due to the low water content used in the mixes. Furthermore, the Mohr–Coulomb failure criterion is used to predict the strength-based failure of printed layers at an early age. Wolfs et al. [20] used the direct shear test to measure the time-dependent Mohr–Coulomb parameters to implement a finite element model to determine the strength-based failure. Jayathilakage et al. [18] used the direct shear test to measure the Mohr–Coulomb parameters (initial cohesion and friction angle) to implement a finite difference model and to predict the strength-based failure of 3DCP layers. However, in the study [18], it was proposed to use a vane shear test to measure the time-dependent yield stress, because the direct shear test takes a long time to conduct when compared with the vane shear test.
The direct shear test seems to have advantages when measuring friction angle values that cannot be extracted from other rheology measurement techniques. Additionally, the test is most suitable to study the rheological behavior of the material in a static state. For the 3DCP process, the rheological parameters achieved from the direct shear test are useful for determining the failure of printed layers [18,19,20,44,100]. Specifically, the failure criteria such as the Mohr–Coulomb failure seem to be suitable and accurate for predicting the strength-based failure of printed layers when compared with other rheology-based models [18]. Therefore, the direct shear test can be a useful test method, which gives the shear stress behavior under different applied normal stresses (similar to the stresses applied in a printed layer).
However, there are limitations to the test method when applied to cementitious material. Primarily, the time taken to complete a test is comparatively higher than a rheometer, and only a single sample can be used per one particular test. Therefore, measuring the time-dependent evolution of yield stress (cohesion) can be difficult and sometimes erroneous. Additionally, due to the drained conditions used in the test method, there is a possibility of water drainage from the material while applying the normal stresses. This can overestimate the measured shear stress values under normal stresses. The test only can be used as a static test due to the low shear rate range used in the test. Therefore, a flow curve cannot be achieved as, in the rheometers and viscosity, measurements cannot be achieved accurately. Furthermore, the friction between the two halves of the boxes should be prevented by using a roller mechanism [93] or by applying lubrication between the surfaces [96]. Otherwise, the measured shear stresses will be higher than the actual ones.

2.3.2. Vane Shear Test

A vane shear test is used commonly to measure the shear strength of the soil. Specifically, this is used on-site to measure the shear strength of soil due to the easiness of conducting. Additionally, there are laboratory-scale vane apparatuses as well. The vane shear test has a similar mechanism as the rotational rheometers with vane geometry. The difference in the vane shear test is that it has a lower rotational speed and only can be used to measure the static yield stress if considered cementitious material. Some vane shear test apparatuses have a simple handheld mechanical gauge fixed to the vane, which can be used easily to measure the shear strength (yield stress) of concrete immediately after mixing. This enables the ability to obtain quick onsite measurements of the shear strength while processing the material. The procedure applied in the vane shear test is similar to the static yield stress measurements followed in rheometer tests.
Le et al. [99] used the vane shear test to measure the yield stress evolution with time for 3DCP mixes. The main purpose of their study was to identify the open time (the material extrudability limit) and the correlated yield stress range. Rahul et al. [98] and Jayathilakage et al. [18] recently used a simple vane shear apparatus to measure the static yield stress evolution with time for 3DCP mixes. Rahul et al. [98] used it to compare the mixes used and the effect of mixed compositions (viscosity modifying agents, nano clay, and silica fume) on yield stress evolution with time. Jayathilakage et al. [18] used yield stress evolution data from the vane shear test in a numerical simulation to accurately model the strength-based failure of 3D printed layers at an early age.
From the studies conducted by previous authors, it can be concluded that the vane shear test is a cost-effective and accurate test method to evaluate the time-dependent yield stress evolution of 3D printable concrete. However, similar to the direct shear test method, only the static yield stress can be achieved using the vane shear test, which is useful for 3DCP buildability studies. Contrary to the direct shear test, the vane shear test can be quickly and easily conducted, and hence, can be used easily to evaluate the time-dependent yield stress behavior.

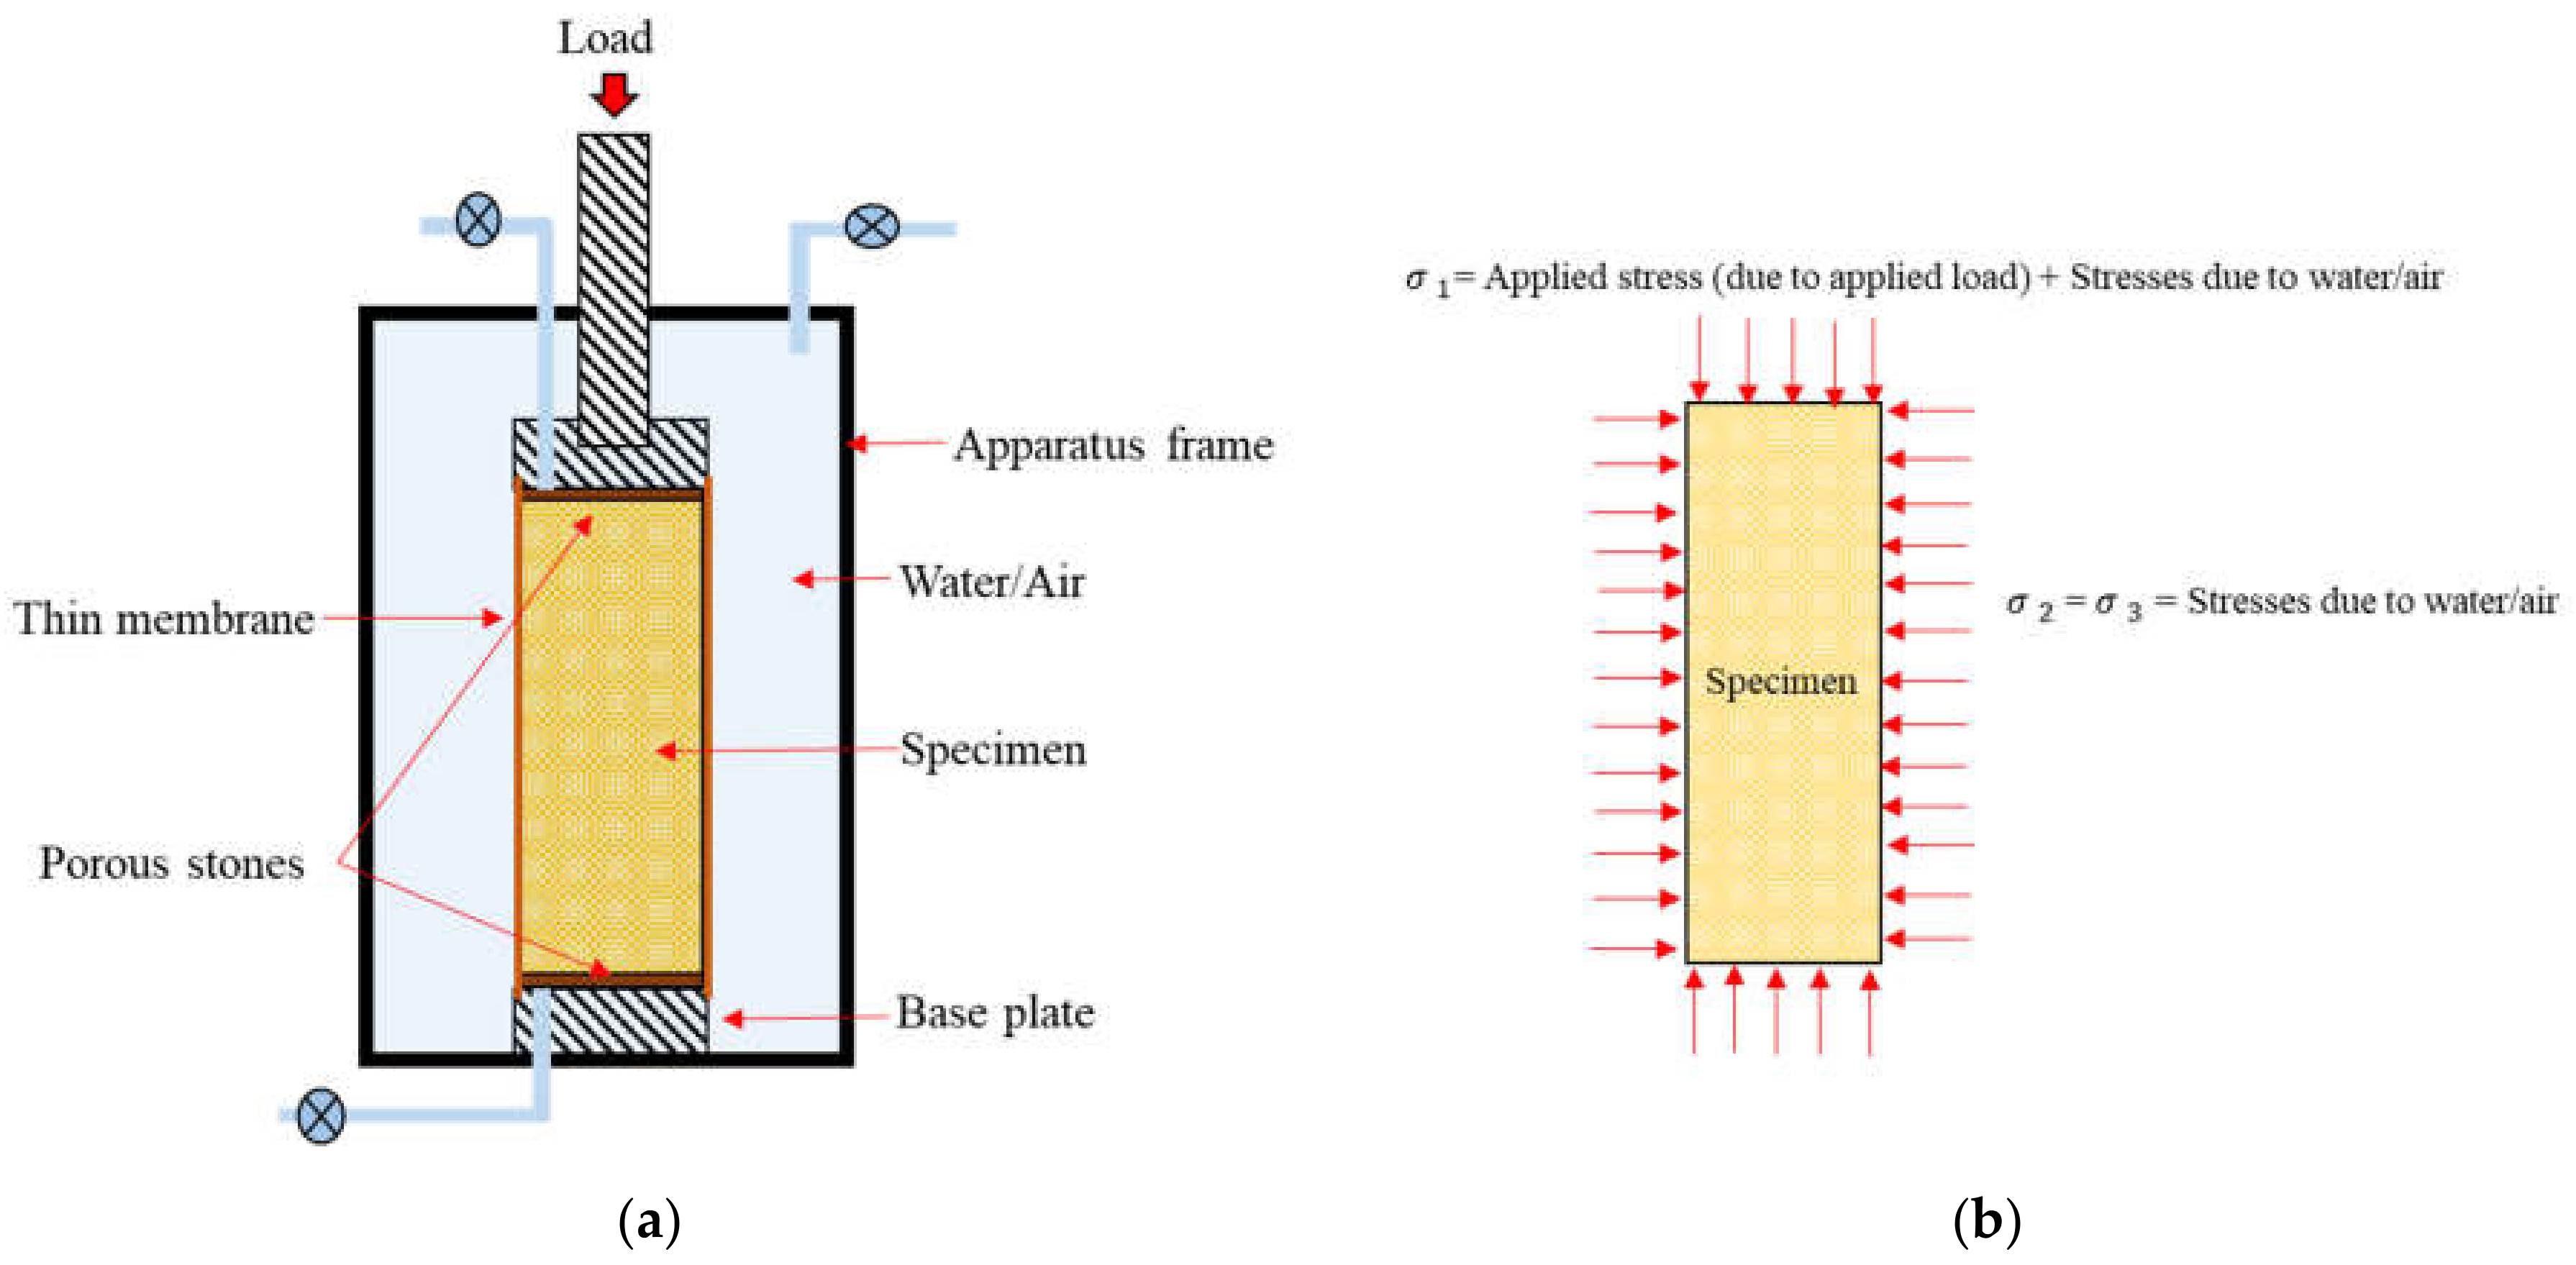
2.3.3. Tri-Axial Test

Similar to the direct shear test, the tri-axial test is also based on the Mohr–Coulomb failure criterion and is commonly implemented in geotechnical applications. Nevertheless, few researchers have used the method for normal concrete, self-compacting concrete [101,102,103,104,105], and also for 3DCP mixes [92].
A cylindrical sample should be prepared and the test should be completed according to the ASTM D2850 [106] or a similar standard. The testing will be completed in axis-symmetric loading conditions as shown in Figure 2. Using the principal stresses, the Mohr–Coulomb failure envelopes can be developed to obtain parameters such as cohesion and the friction angle value.
Wolfs et al. [92] conducted the tri-axial test for 3DCP mixes to evaluate the time-dependent Mohr–Coulomb parameters. The parameters assessed were then used in a finite element model to assess the early age failure in printed straight walls. The model predicted the buckling failure effectively for lower-length walls (lower print times). However, with increasing concrete age, the accuracy of the model weakens. The main reason pointed out by the authors is the temperature effects and confining effects occurring at the bottom-most layers, which are not incorporated in the numerical simulation. Nevertheless, the authors identified the tri-axial test as a useful test method to achieve not only the Mohr–Coulomb parameters but also the early age compressive strength and the elastic modulus variation with time. These parameters can determine both the strength-based failure as well as the stability failure commonly seen in 3DCP.
However, a major disadvantage of using the tri-axial test is that the time taken to complete a single test is longer. Therefore, very early age properties (in the first few minutes of printing) cannot be achieved. Wolfs et al. [92] used the tri-axial tests for concrete age equal to and more than 15 min. Then, they extrapolated the earlier age (less than 15 min) properties considering a linear relationship. However, this interpolation can only be valid for some mixes used in 3DCP. For mixes with a fast setting, the tri-axial test may not be effective. In addition, for faster print speeds and faster build rates (which can be a prospect in the future), the method will not be suitable to determine the early age Mohr–Coulomb and mechanical properties.
Another main disadvantage of the method is that the method is a static test. Hence, flow curves and viscous properties cannot be achieved. Nevertheless, post-yield behavior can be attained in terms of the dilation angle. The samples used in a single test will be destructed while doing the test and cannot be used in multiple tests. This is also a disadvantage that results in the wastage of material and more test trial requirements.

2.3.4. Ram Extrusion

When it comes to the extrusion-based 3DCP process, the extrudability of material depends on the material characteristics, process parameters, as well as the extruder setup as described in previous sections. Therefore, many researchers found the ram extrusion method as a potential rheological characterization method to define the rheological parameters which are important in characterizing the extrudability of the 3DCP material [15,16,107,108,109,110,111]. Alfani et al. [29] reviewed possible testing methods for extrudable cement-based material and mentioned the ram extruder as a promising test method specific to extrudable cementitious material. Figure 3 shows a ram extruder (which consists of an orifice) and a schematic diagram.
A ram extrusion test measures the pressure required to extrude the material through a die with a certain length, or through an orifice with zero die length. Initially, the material will be filled inside the extruder barrel and then extrude with different ram velocities. For a constant ram velocity, ram force at a steady state can be measured using a load cell attached to the ram. The force vs. displacement curve can be typically achieved as shown in Figure 4.
The average steady extrusion force (Figure 4) then can be converted to the extrusion pressure. The procedure should be conducted for different ram velocities and different die lengths to determine the rheological parameters. A simple analytical model based on the studies conducted by Benbow et al. [112] can be used directly to determine the rheological parameters as in Equation (12).
P = P e + P d =   2 ln D 0 D ( σ 0 + α V ) + 4 L D τ 0 + β V
In Equation (12), D 0 , D , and L are barrel diameter, the diameter of the die, and the length of the die, respectively. V is the material flow velocity of the die. σ 0 and τ 0 are the uniaxial yield stress and the shear yield stress, respectively. α and β are two parameters that characterize the speed at die entry and die exit, respectively. As shown in Equation (12), the total extrusion pressure ( P ) consists of two components. One is the pressure drop at the die entry ( P e ), and the other component is the pressure drop at die land ( P d ). The assumptions are made, such as the material is viscoplastic and incompressible. In addition, Equation (12) is only valid for square-ended barrels. The pressure drop at the extruder barrel is neglected. Another main drawback of using Equation (12) is that the values α and β have no physical meaning when defining the rheological parameters and can vary according to the extruder die length, die diameter, and barrel diameter [113].
Basterfield et al. [113] developed an analytical model to derive rheological parameters using an orifice extrusion. A uniaxial form of Herschel–Bulkley flow behavior is considered in the analytical model. The closed-form relationship between the extrusion pressure and the mean shear rate ( V / D ) can be written for an orifice extrusion as in Equation (13).
P = 2 σ 0 ln D 0 D + A k 2 V D n 1 D D 0 3 n
where
A = 2 3 n sin θ m a x 1 + cos θ m a x n
In Equation (13), the k and the n values are the flow consistency and the flow index parameters in the Herschel–Bulkley model. A parameter can be calculated from Equation (14), where θ m a x is the maximum flow convergent angle. The main advantage of using the analytical model in Equation (13) is that it gives important parameters to define the rheology of a mix, irrespective of the geometry used. In addition, the usage of the orifice extrusion is simple due to disregarding the shaping force (i.e., the friction forces acting on the material/die interface and the force required for the internal bulk deformation). However, for 3DCP applications that consist of different types of nozzles, the shaping force component and the shear yield stress can also be of importance [107,110]. Figueiredo et al. [110] proposed that the uniaxial yield stress has a direct correlation with the buildability of the mix component in 3DCP (the higher the uniaxial yield stress, the higher the buildability). The shear yield stress derived from the ram extrusion test provides a threshold value for the pumpability of the mix according to the same study.
Even though there are many advantages of using the ram extrusion test to characterize rheology in 3DCP applications, there can be many drawbacks as well. One of the major drawbacks is the filtration of water from the granular medium of the mix. Frequently, this phenomenon is occurring at low extrusion velocities according to the previously done studies [114,115]. As a result, the extrusion pressure will increase rapidly (without reaching the steady extrusion phase in Figure 4). Perrot et al. [114] proposed a model based on Darcy law and consolidation studies to predict the extrusion pressure evolution occurring due to liquid migration. Rahul et al. [116] proposed a disorptivity-based approach to determine the liquid migration occurring during a ram-type extrusion. Nevertheless, it is important to determine the extrusion pressure at low ram velocities accurately. The main reason is that when using least square error methods to fit analytical curves to the experimental data, more data points are required near zero extrusion velocity (mean shear rate) to accurately determine the uniaxial yield stress. Hence, 3DCP mixes which can be extrudable without any phase separation at lower extrusion speeds should only be selected for testing in this method.
Another major drawback of the ram extrusion test is the assumptions made of the material to be considered as perfectly plastic or viscoplastic. The expressions which are given in Equations (12) and (13) are only valid for the aforementioned type of material. However, typical cementitious material used in the 3DCP extrusion method can be frictional plastic material [117]. As a result, a frictional component should be considered between the extruder wall and the material interface. Hence, Perrot et al. [117] developed an analytical model considering the frictional plastic behavior of cementitious material used for extrusion applications. Therefore, to use the analytical equation as shown in Equations (12) and (13), the extruder wall surfaces must be smooth.
It was proposed by Basterfield et al. [113] to use larger barrel diameters and reduce the orifice (die) diameter to the barrel diameter ratio in ram extruders. From the experimental studies, it was proven in [113] that the smaller orifice diameters to barrel diameter ratios provide consistent results for measured rheological parameters irrespective of the diameters of the extruder used. Furthermore, using a large barrel volume gives the advantage of conducting higher test runs for several extrusion speeds in a single material loading inside the extruder. Hence, the data required to form a flow curve can be achieved from a single test run with a large barrel diameter (higher material volume). Nevertheless, there can be difficulties in measuring time-dependent material behavior, because generally several test runs should be needed to form one flow curve for a particular concrete age. In addition, the test can take a few minutes to complete depending on the extrusion length and speed.

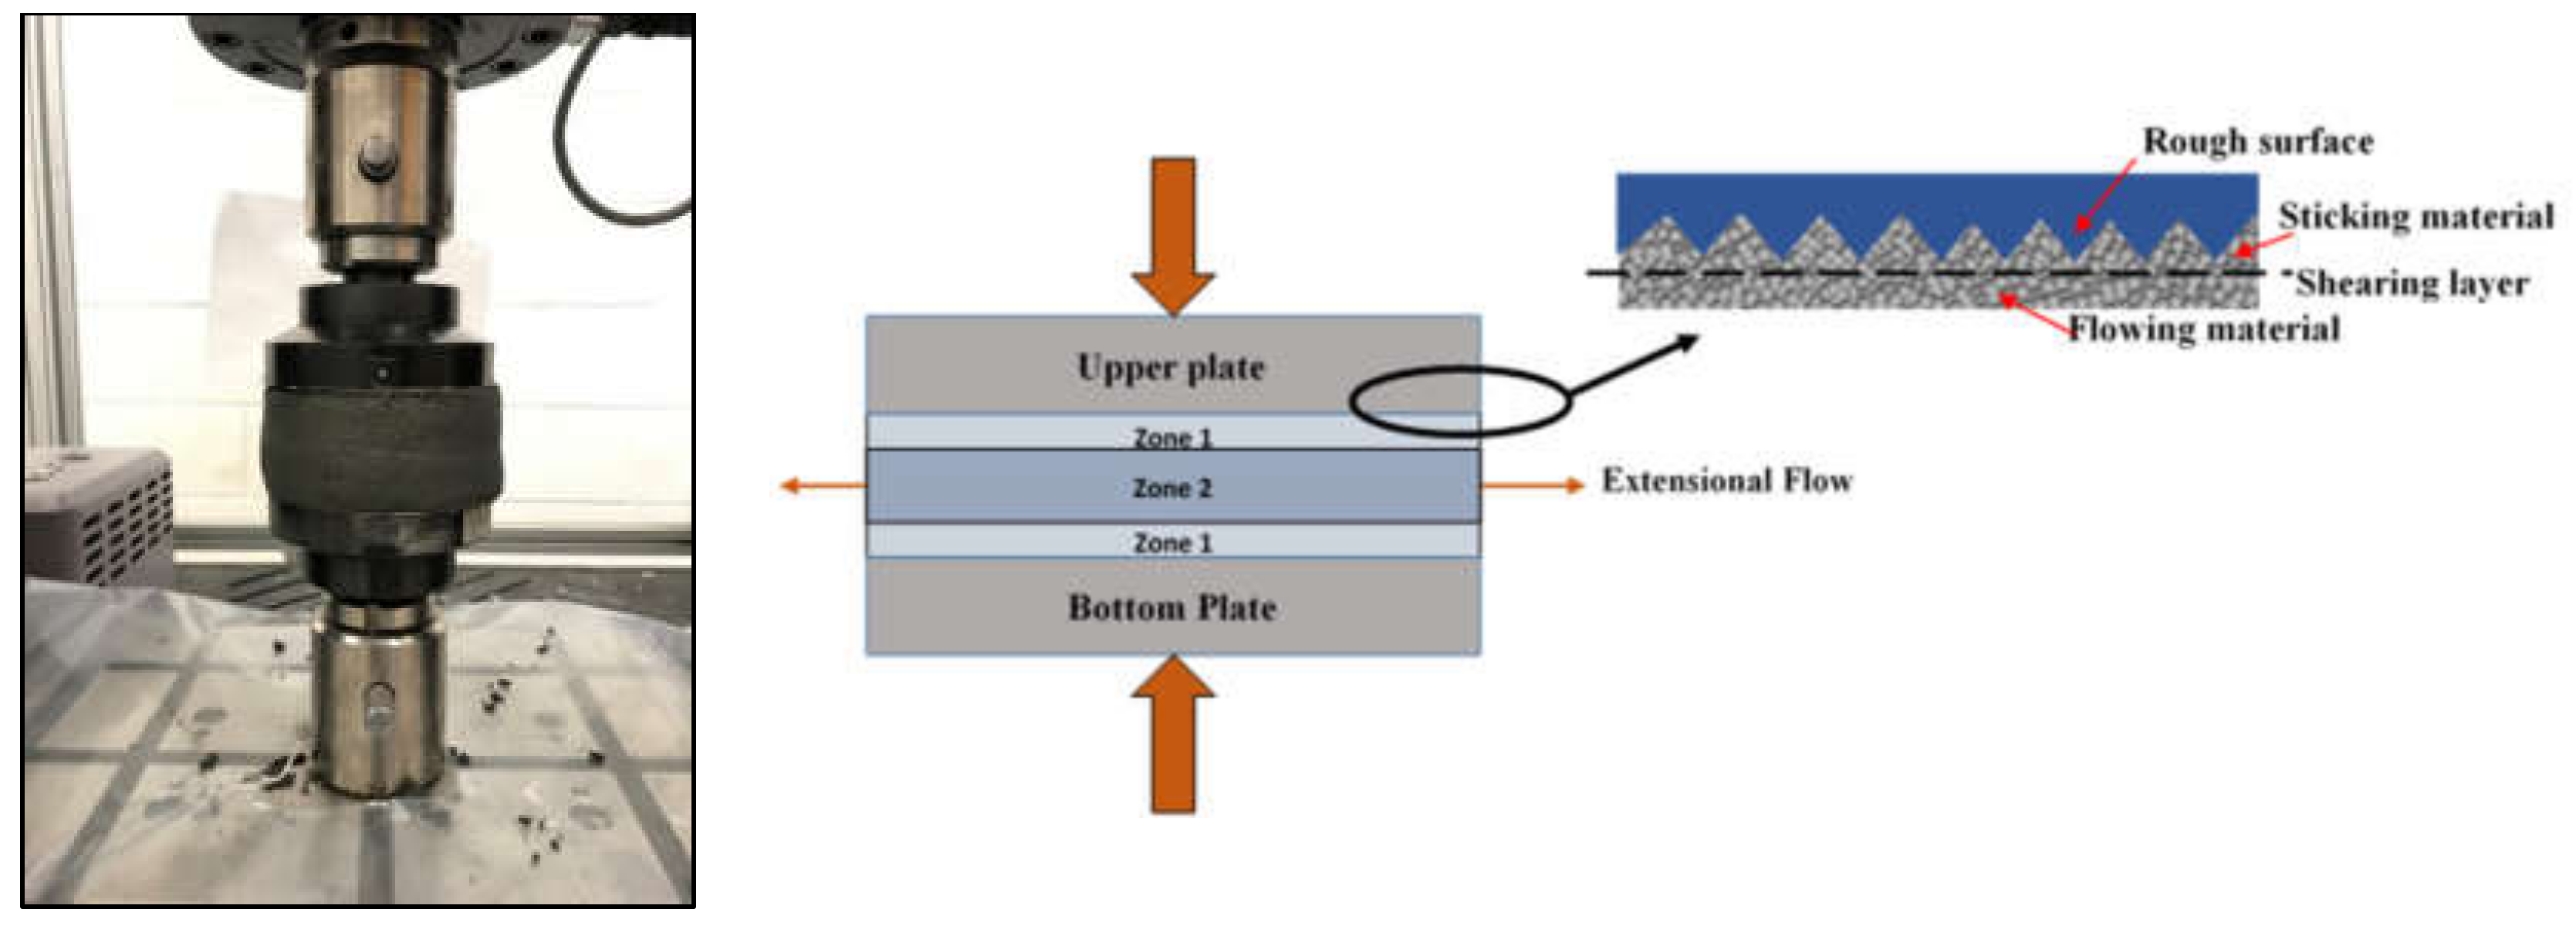
2.3.5. Squeeze Flow Test

Another technique commonly used to measure the rheological parameters of extrudable cement-based material is the squeeze flow test. In this method, generally, the material will be placed between two parallel circular plates with the aid of a cylindrical mold. Afterward, the mold will be removed and the material will be compressed with different displacement rates by moving the top or bottom plates. Typically, the sample height is chosen to be smaller than or equal to the sample radius to provide an extensional flow as shown in Figure 5. The analytical models to determine the rheological parameters in this test vary with the boundary conditions used (rough or smooth) and the test method used (constant volume or constant area) [118,119].
In a squeeze test, the flow conditions (extensional flow conditions and shear flow) are similar to the flow conditions occurring in the extrusion of material through a narrow nozzle [118]. Therefore, useful rheological parameters important for 3DCP extrusion can be achieved from the test method [111,120,121].
Roussel et al. [118] have formulated an analytical model to obtain Bingham parameters for a highly concentrated, stiff, non-Newtonian, yield stress fluid using a squeeze test. The formulations were built for rough and for slip boundary conditions separately using a 3-dimensional Von Mises yield criterion. The extensional flow region thickness is selected to minimize an energy dissipation function. The mix considered will be squeezed between two circular plates, where the height of the sample ( h ) is chosen very low compared to the radius ( R ) of the sample. The trial velocity fields chosen in the study consist of a central region of pure extensional flow, mid-way between the plates, and sheared regions adjacent to the plates (Figure 5). Equation (15) shows a general expression for the compressive force ( F ) in a squeeze flow for a Bingham material [118].
F = 6 π μ c R 4 h 3 1 β 2 + β 2 2 π K i R 2 3 β h + R h β + 2
In Equation (15), μ ,   K i , and c are the plastic viscosity, plastic yield value, and compression speed, respectively. β is a non-dimensional parameter describing the position of the boundary between the two flowing zones. The solution tends toward a perfect-plastic flow for larger h R ratios. For perfectly plastic material, β = 1 and μ = 0. Therefore, Equation (15) can be simplified in Equation (16) as follows:
F * = 2 K i 3 h R + 2 K i 3
In Equation (16), F * = F h / π R 2 . The first term in Equation (16) is associated with dissipation due to the extensional flow occurring at the mid-region of the sample height. The second term is linked with dissipation due to the shearing flow near the boundaries. It should be noted that the above expressions are valid only for the rough plates (rough boundary) conditions and Bingham material behavior. For the slip boundary conditions and other material models, there are different analytical models used in the literature [119].
Using the above model by Roussel et al. [118], Toutou et al. [122] conducted experimental work to find the extrusion ability of firm cement-based mixes. The rough boundary conditions are used for the experimental study and two compression speeds are used (low and high). At low compression speeds, an increase in apparent yield shear stress is observed due to the fluid drainage through the granular skeleton. For high compression speeds, the experimental responses are modeled with a Von Mises yield criterion allowing the identification of the material plastic yield value where the solution is perfectly plastic. For low compression speeds where the drainage happens, a model based on Coulomb frictional law and the Drucker Prager plastic criterion is used to explain the drained and frictional plastic behavior. This is a similar finding at low extrusion speeds in ram extrusion tests discussed in earlier sections [16,117].
The main advantage of the method is that the rheological parameters from the test method are more relevant to the ram extrusion, as mentioned earlier, and can be used for very firm cement-based material typically used in 3DCP applications. In addition, the test method can be used to measure the time-dependent extensional yield stress evolution and also to assess the viscosity of the mixes [123]. The test method and sample preparation are simple and can be done easily. Furthermore, the sample sizes are smaller compared to the other rheology test methods (i.e., rheometers, ram extrusion, slump test, etc.).
The main disadvantage of the squeeze flow test is that it only can be used for very firm cement-based material which retains its shape. For mixes used in 3DCP, this can be achieved due to its higher yield stress. However, at very early ages, the mixes can be generally flowable immediately after mixing due to the higher thixotropic behavior. Hence, at a very early age, the material may not retain the cylindrical shape due to low yield stress values. Therefore, the test may be suitable to assess the yield stresses after a few minutes of mixing (depending on the material) and will be most suitable to model the buildability of 3DCP material or time-dependant extrudability.
Another disadvantage of the test method is that phase separation occurs at low compression speeds as discussed earlier. Hence, suitable test speeds should be selected with suitable test sample dimensions to conduct the test. In addition, the single batch method cannot be followed in the test because the test is a destructive test method. Hence, multiple samples should be prepared for measuring time-dependant rheological behavior.

2.3.6. Penetration Tests

Several types of standard penetration tests are available and used for fresh cementitious material for measuring the initial and final setting times. Typically, the penetration depth or the force required to achieve a specific depth or velocity will be measured in the penetration test procedures. Some of the penetration test methods used for setting the time measurement are the Vicat apparatus, Proctor needle, penetrometer, and Hilti needle [124].
Even though the method was used originally to measure the setting time of cementitious material, some work has been conducted by a few researchers previously to correlate the static yield stress and penetrometer results with analytical relationships [120,121,124]. Some penetration test procedures, a description of the test, and the analytical model used for correlating the yield stress are summarized in Table 2 [124].
Due to its simplicity and ability to conduct as an onsite testing method, the penetration test was trialed by Mazhoud et al. [125] for 3DCP applications. Perrot et al. [126] used the penetration theory for nailing the printed layers in 3DCP applications as a reinforcing method. Mazhoud et al. [125] used the method to measure the yield stress evolution with the concrete age for underwater 3DCP applications. The authors pointed out that the easiness of conducting the experiment, smaller samples, and suitability for firm material are the reasons for using the method in their study. A cone with a mass of 80 g and a tip angle of 30° is dropped under gravity (starting from the surface of the sample), and the penetration depth measured. Then, using a force balance equation (between gravitational force and friction force), the yield stress is derived.
The main advantages of using penetration tests for measuring yield stress and yield stress evolution with time are easiness to prepare the samples (due to smaller samples), easiness in conducting the test, can be used as an onsite test method, and cost-effectiveness. Furthermore, the method can be specifically useful for assessing the structural build-up of 3DCP material when using the reinforcement by penetration methods (nailing and steel bar insertion) [126], because there are similarities between the test procedure and the particular reinforcing process.
Nevertheless, one of the main disadvantages of the method is that it is not suitable for samples with larger aggregates. The Vicat needle can be only used for cement pastes and most of the other penetrometers are suitable for cement pastes and mortar with fine aggregates due to the smaller dimensions of the tips used. Additionally, according to the ASTM standards C403/403 M, the penetration methods are only suitable for mortar mixes with a slump greater than zero. Hence, there can be limitations when implementing the method for some 3DCP mixes and longer concrete ages. Another main disadvantage is the drying out of the surface due to the smaller surface areas used. This can be seen in most 3DCP mixes due to the low w/c ratios used in the mixes. As a result, there can be errors (smaller penetration depths relative to the actual one) occurring specifically in free fall test methods such as the Vicat test. Proper precautions should be used to eliminate the drying of the top surface.

2.4. Summary and Comparison of the Test Methods

A comparison and a summary of the rheology testing methods which can be used for 3DCP applications are shown in Table 3. The pros and cons discussed are based on the usability of the methods for 3DCP material.
To compare the rheological parameters obtained from some of the selected test methods (standard and non-standard), and to analyze how these parameters are changing according to the test methods, experimental works are presented in the next section. In addition, the buildability and extrudability studies were completed for several mixes to identify the best-suited test method for each 3D printing process.

3. Experimental Work

3.1. Mix Design

To compare the mentioned testing methods and achieve rheological parameters from each test, the rheometer test, slump test, flow table test, direct shear test, ram extrusion test, vane shear test, and squeeze test were completed for three different mixes, namely M0, M0.1, and M0.3. Mixes have similar mix constituents except for different nano clay contents. The nano clay percentages (from the total solid weight used) are 0%, 0.1%, and 0.3%, respectively, for M0, M0.1, and M0.3. The purpose is to keep the effects of aggregates and fluid content of the mixes to a minimum and change the rheology (yield stress, viscosity, and thixotropy) of the mixes. The nano clay addition to a concrete mix changes the rheological parameters such as yield stress and thixotropy of the mix as per the previous studies by authors [128], as well as per the other studies previously completed [129,130]. Nano clay has a negative charge on its face and a positive charge on its end, and attracts dissimilar charges at rest. This results in typically higher yield stresses. Additionally, when sheared, the repulsion between the negative and positive charges of nano clay makes a composite more flowable, demonstrating a higher thixotropic behavior [129].
Table 4 shows the other mix constituents used.
All the sand used is silica sand supplied by Sibelco Australia. In Table 4, coarse sand is graded sand with a gradation of 16/30 and has a maximum particle size of 1.18 mm. Fine sand is also graded sand (with 30/60 gradation) with a maximum particle size of 600 μ m. The nano clay used is Acti-Gel® 208 (by Active Minerals Internationals, Sparks, MD, USA) with a maximum particle size of 30 η m. The cement used is general purpose (GP) cement supplied by Cement Australia which complies with AS 3972 (general purpose and blended cement). The specific densities for cement, silica fume, coarse aggregate, and fine aggregate are 3100, 2200, 2650, and 2650 kg/m3, respectively.
Initially, large batches (around 40 L) of material are prepared using a 60 L planetary mixer (Digital Construction Laboratory, Swinburne University of Technology, Australia) to achieve consistent results with a single batch. The dry mixes are mixed at a low mixing speed of around 7 min as per the specification requirement for nano clay dispersion. Afterward, the water is added, and the mixing is conducted for around 2 min at a slow speed. Then, the retarder and superplasticizers (by BASF, Australia) are added slowly while mixing at a high speed of around 4 to 6 min (depending on the nano clay amount). A dough-like 3D printable mix can be finally achieved.

3.2. Testing Protocol and Methods

After the mixing, the steps (Table 5 are followed for each test systematically, because the rheological parameters achieved are highly dependent on the time and the shearing history.
As shown in Table 5, the vane shear test is completed for each batch to make sure the material in all the batches has a similar initial yield stress at the beginning. A tolerance of around ± 20% from the value (yield stress from the vane shear test) achieved in batch number 1 is allowed. It should be noted that in Table 5, for batch number 2, mixing is completed in an intermediate stage after finishing both the vane shear test and the direct shear test. The reason is that the test should be repeated for a minimum of three numbers of normal stresses. Per one normal stress (one test), it will take around 180 s. Hence, by mixing the material, the initial state of the material can be achieved (checked with the vane shear test).
The rheometer tests are completed using a VISKOMAT XL rheometer (developed by Schleibinger testing systems, Germany). A 0.1 rpm rotational speed is used for the static yield stress measurements. Multiple samples are prepared from a single batch and tested for up to 60 min for different ages. Hence, no pre-shearing is done in the tests. For the hysteresis loop test, the samples are sheared from 0 to 70 rpm linearly within 60 s. Afterward, a 70-rpm rotational speed is applied for 10 seconds, and the rpm value is reduced to 0 rpm linearly within 60 s. The rpm values and the torque values are converted to shear rate and shear stress, respectively, using the equations developed by Barnes et al. [131].
The slump test and flow table tests are completed according to ASTM standards [60,67]. The slump cone used has a 100 mm top diameter, 200 mm bottom diameter, and 300 mm height. The mini cone used for the flow table test has a top diameter of 70 mm, a bottom diameter of 100 mm, and a height of 60 mm.
For the orifice extrusion test, a smaller scale ram extruder (developed by the authors) is used with a 20 mm orifice diameter and a 50 mm barrel diameter. The length of the extruder barrel used is 400 mm. The material is filled inside the extruder barrel and then compacted using a rod to remove the entrapped air. Afterward, starting from 10 mm.s−1 of constant ram velocity, the extrusion is completed for 5, 3.5, 2, 1, and 0.5 mm.s−1 constant ram velocities. Each velocity is kept around 10 s to achieve the steady-state extrusion force. A 5 s pausing between two ram velocities is kept. Hence, the whole test takes around 100 s to complete as shown in Table 5. A 5 kN load cell is used to measure the extrusion force and an ALMEMO 710 Data Acquisition (DAQ) System and AMR Win control software (developed by AHLBORN, Germany) are used to record the force and displacement data. It should be noted that lubrication oil is applied to the inner barrel surface to reduce the material and wall friction. This ensures the assumptions made in the analytical model used in the study [113]. The rheological parameters are achieved using the analytical model given in Equation (13).
The vane shear test is completed according to the ASTM D4648/D4648M standards. Initially, a large batch is prepared in a large container (around 40 L) and compacted and leveled using a vibrator. Afterward, a 4-blade vane with 70 mm height and 90 mm length is inserted and rotated manually at a slow rate. A mechanical gauge attached can be used to record the angle (and later can be converted to torque using the spring constant and the vane dimensions as given in the standards). As found by Assaad et al. [93] in a previous study, the normal stresses from the top material portion affect the overestimation of the failure stress achieved by the vane shear test, if inserting the vane in higher depths. Hence, the vane blade is only inserted up to around a 70 mm depth (similar to vane height). Therefore, the peak torque value can be recorded and can be converted to shear stress using the equations given in [93]. The failure (peak) and shear stresses (angle) are recorded from 0 to 15 min of concrete ages.
The direct shear test is completed according to the ASTM D3080/D3080M- 11 standards. A fully automated Shear Trac II device is used for applying and measuring the forces and displacements. Additionally, the device has the capability of converting the forces to stresses and displacements to strain values according to the given initial data before starting each test. The shear box used has a circular cross-section with a 72.5 mm diameter. The total height of the box is 43 mm. Four different vertical stresses ranging from 2 to 20 kPa are applied to conduct the test. The normal stress range is selected approximately to represent the vertical stresses induced due to 10 to 100 layers of construction (10 mm layer height). After applying normal stress, the material is sheared with a constant displacement rate of 8 mm.min−1. It was found, from previous studies by the authors, that the shearing rate used in the direct shear test has no prominent effect on the failure shear stress [96]. Hence, a displacement rate of 8 mm.min−1 is selected, which is fast enough to complete the tests neglecting the time-dependent effects. The peak shear stresses are selected as the failure shear stresses for each normal stress applied. The area corrections are completed for the peak shear stresses according to the ASTM standards. Afterward, shear stress vs. normal stress plots are developed to evaluate cohesion and friction angle values according to the Mohr–Coulomb relationship.
A squeeze flow test is also conducted to evaluate the rheological parameters of the mixes considered. A cylindrical mold is used to prepare four specimens from one batch which have 100 mm in diameter and 50 mm in height. The mold is lined with a thin cling wrap and the material is filled inside the mold in two layers. Each layer is vibrated to achieve proper compaction and a defect-free specimen. The specimen is then removed from the mold and placed in between two plates, which have a similar diameter as the specimen. Both the plate surfaces consist of sandpapers to enforce rough boundary conditions. The thin cling wrap is removed immediately after conducting the test. Then, the specimens are compressed by moving the top plate with a constant displacement rate of 120 mm.min−1. A higher displacement rate is used to ensure no phase separation occurs as mentioned earlier. The rheological parameters (yield stress) for concrete ages up to 30 min are evaluated using the perfect plastic assumption as given in Equation (16).
Figure 6 shows the test setups/schematic diagrams used in the experiments.

3.3. Extrudability Test

To compare the extrudability of the three mixes, the quantification of extrudability is completed using a simple power consumption and discharge measurement technique. The authors [111] and Nerella et al. [15] used the method in previous studies to characterize the extrudability of 3D printable concrete material. In this study, a screw-type extruder (developed at Digital Construction Lab, Swinburne University of Technology, Australia) (similar to [111]) is used for material extrusion. It has a nozzle of 30 mm in diameter. A digital power measuring device is installed between the printer and the controller of the printer. Initially, the power consumption is measured while rotating the extrusion screw with different rotational speeds (from 0.5 to 2.5 rev.s−1). This is completed without any material inside the hopper. The measured power values are considered as the initial power consumption ( P i ) . Then, the material is filled up to the top level of the hopper and the extrusion is finished. While extruding the material from the nozzle continuously for the same rotational speeds above, the power consumption is measured. This is taken as the final power consumption ( P f ) . The relative power ( P r ) consumption then can be calculated using the difference between the two values (i.e., P r = P f P i ). It should be noted that while extruding the material, the continuous filling of the material is completed inside the hopper to maintain a constant material level.
To measure the discharge ( Q ), continuously extruded material within 1 min is collected inside a container. Then, the weight of the material is measured. Later, the weight is converted to the volume using the densities of the material.
It was shown in the previous literature that an index ( I p ) can be introduced to quantify the extrudability or pumpability of 3DCP material [15,111]. I p is simply the ratio of P r Q . This can be defined as the unit extrusion energy of the material [15]. Typically, a higher value of I p denotes a higher energy requirement to extrude a unit volume of considered material at a specified rotational speed. Hence, the higher the I p , the lower the extrudability, and vice versa.

3.4. Buildability Assessment

To assess the buildability, printing tests are conducted until the printed structures reach failure. Circular columns with 200 mm diameter are printed using a gantry-type 3D printer at the Swinburne University of Technology, Australia. The screw rotational speed of 0.5 rev.s−1 and print speed of 48 mm.s−1 are selected for printing. The average printed layer width and height are 10 mm and 5 mm, respectively. The layer number at failure is recorded to assess the buildability of each mix. Additionally, the layer quality also is inspected visually.

4. Results and Discussion

The following sections show the rheological parameters achieved from each test and the results of the extrudability and buildability tests. Finally, the comparison and the discussion of the results are presented, followed by future recommendations in selecting suitable rheology characterization methods for 3DCP material.

4.1. Rheometer Test

The static yield stress evolution with concrete age and the hysteresis loop curves for the three mixes are shown in Figure 7.
As shown in Figure 7, the achieved initial static yield stress values are 0.9, 1.4, and 3.8 kPa for M0, M0.1, and M0.3, respectively. Similarly, the dynamic yield stress values and viscosity also are increasing from M0 to M0.3. Hence, as expected, the inclusion of nano clay results in increasing the yield stress and viscosity of the mixes [132,133,134].
From the hysteresis loop curves in Figure 7a, the thixotropic behavior of the mixes can be quantified in two ways. According to the study completed by Qian et al. [83], a thixotropic index ( I t h i x ) can be defined as the ratio between the initial (peak) yield stress and the equilibrium yield stress at the end of the up curve in a hysteresis loop. Hence, the I t h i x value denotes the structural breakdown capability (deflocculation) under shearing. Higher values of I t h i x denote a higher structural breakdown capability (thixotropic behavior) under shearing and vice versa.
Another method for evaluating thixotropic behavior is by considering the area between the hysteresis loops. This quantifies the structural breakdown capability under high shearing rates, and structural reforming (recovery) under low shear rates. The higher the thixotropic area, the higher the thixotropy of the mix.
The achieved I t h i x values for M0, M0.1, and M0.3 are 1.2, 1.7, and 2.5, respectively. The thixotropic areas are 9, 13, and 23 kPa.s−1 for M0, M0.1, and M0.3, respectively. Hence, it can be identified that the thixotropy is increasing from M0 to M0.3. This was an expected result due to the inclusion of nano clay in the M0.1 and M0.3 mixes. Additionally, increasing the nano clay amount increases the thixotropy and yield stress values. Similar findings were obtained in previous studies [132,133,134,135].
The time-dependent yield stress evolution is also shown in Figure 7b for the three mixes. The thixotropic build-up rate ( A t h i x ) is 0.02, 0.02, and 0.06 kPa.min−1 for the M0, M0.1, and M0.3 mixes, respectively. Interestingly, the M0 and M0.1 mixes have nearly similar A t h i x values, while the M0.3 mix has a higher A t h i x value as expected. It should be noteworthy that the maximum yield stress value that can be measured from the Viskomat XL rheometer is around 5.5 kPa. Higher yield stresses than around 5.5 kPa result in wall slippage and plug flow formation.

4.2. Slump Test and Flow Table

Figure 8 shows the slump height of the three mixes with respect to the slump cone height (300 mm).
The slump heights achieved for the mixes M0, M0.1, and M0.3 are 128 mm, 44 mm, and 15 mm, respectively. The slump flow diameters are 250 mm, 202 mm, and 200 mm, respectively, for M0, M0.1, and M0.3 mixes. Very low slump height and flow values can be achieved comparatively for M0.1 and M0.3 mixes when compared with the M0 mix due to the higher yield stresses. Using the analytical model shown in Equation 8, the yield stresses can be calculated for each mix using the slump heights and the densities. The calculated yield stress values are 1.4 kPa, 2.1 kPa, and 2.3 kPa, respectively, for M0, M0.1, and M0.3. The densities were obtained experimentally (by weighing a known volume of material) as 2169, 2211, and 2219 kg.m−3 for M0, M0.1, and M0.3, respectively. Even though the yield stresses calculated from the slump values increase from M0 to M0.3, it seems to have nearly similar values for M0.1 and M0.3. As mentioned earlier in this study, the maximum yield stress which can be achieved from a slump test is around 2.5 kPa, and for lower slump values, the analytical model may be less sensitive and inaccurate. A further comparison of the achieved values will be discussed in the following section.
The flow values from the flow table test can be achieved as 128%, 117%, and 110% for M0, M0.1, and M0.3, respectively, after 25 drops of the flow table. The slump value is zero for all the mixes before dropping the table due to the considerable shape retention capabilities and higher yield stresses compared to a self-compacting concrete mix or a normal concrete mix. After the 25 drops, the slump values changed to 28, 23, and 15 mm, respectively, for M0, M0.1, and M0.3.
The relationship between the slump height and flow values (flow table test) with the yield stress (calculated from the slump heights) can be shown in Figure 9.

4.3. Direct Shear Test

The linear Mohr–Coulomb failure envelopes for the three mixes are shown in Figure 10. The cohesion values and the friction angle values are also shown in the same figure.
From Figure 10, it can be seen that the shear stresses are increasing linearly with normal stresses, showing considerably good linearity (R2 of more than 0.9). In addition, the cohesion values are highest in M0.3 and lowest in M0 as expected (a comparison of the cohesion values with the rheological parameters achieved from other tests will be made in the following section). The friction angles of the M0.3 and M0.1 have nearly similar values. Nevertheless, the M0 mix shows a smaller friction angle value compared to the M0.3 and M0.1 mixes. From an earlier study, it was found by the authors that the coarse aggregate content mainly influences the friction angle values of cementitious material [96]. However, in this study, the aggregate content of the mixes is kept constant for all the mixes. Nevertheless, the M0 mix shows more fluid-like behavior compared to the other two mixes. Therefore, a lower friction angle can be expected.

4.4. Orifice Extrusion Test

Figure 11 shows the orifice extrusion pressure vs. mean shear rate plots for the three mixes considered. The analytical model (Equation (13)) was fitted for the experimental data using the least square error method. Table 6 shows the achieved rheological parameters considering a Herschel–Bulkley flow model.
The achieved uniaxial yield stress values show a similar increasing trend from M0 to M0.3 as achieved for shear yield stresses from the rheometer and other tests. A further comparison of the uniaxial yield stresses with the yield stresses achieved from other testing methods will be done in the Section 4.7.
As can be seen from Table 6, M0.3 and M0.1 mixes show a shear-thinning behavior (flow index of 0.5). The M0 mix shows a Bingham flow behavior and has a flow index of 1. To further analyze the viscosity variation with the strain rate range applied in the test, the viscosity can be plotted against the strain rate as in Figure 12. Here, the first derivative of stress with respect to the strain rate (i.e., simply the gradient of the curves in Figure 11) is considered as the viscosity.
From Figure 12, it can be visible that the viscosity of M0 is constant (around 2.9 kPa.s) and does not change with the applied shear rate. However, M0.1 and M0.3 have an initial viscosity around 47 and 62 kPa.s, respectively, and reduce with the increasing shear rate. Interestingly, the viscosity of M0.1 and M0.3 mixes reaches the viscosity of the M0 (control mix). The main reason for this effect is the inclusion of nano clay in M0.1 and M0.3 mixes. Nano clay particles have two different charges (positive and negative) at different ends. At rest (or very low shear rates), when the flocculation is occurring, two opposite charges in nano clay attract each other and increase the floc sizes of the mix. Hence, they have higher yield stress and viscosity. When the material is flowing under high shear rates, most of the flocs will be broken, and the repulsion between two different charges in nano clay increases the flowability. Hence, this reduces the viscosity. This phenomenon can be prominently important in 3DCP applications. This means at higher shear rates, the M0.1 and M0.3 mixes can flow easily, similar to the control mix. Hence, at pumping and extrusion (specifically screw-type extrusion) stages where high shear rates are applied, the high yield stress mixes (i.e., M0.1 and M0.3) can flow easily. Immediately after deposition, the printed layers only deform under their weight and the weight from the above layers. Hence, compared to the pumping and extrusion stages, the shear rates are considerably lower. Therefore, at flow onset, the deformations will be lower in the layers due to higher viscosity.

4.5. Squeeze Test

The F* vs. h/R curves are shown in Figure 13 for the three mixes.
At the beginning of the test (h/R = 1), for higher h/R ratios (from around 1 to 0.8), a rapid increase in F* can be seen followed by a rapid decrease in F*. This portion of the graph is considered as the placing phase where, after reaching the maximum compression force and at the end of the phase, the material starts to flow. After the placing phase, the perfect plastic response phase can be identified as highlighted in Figure 13. The perfect plastic response phase does not depend on the shear rate applied and seems to diminish with the increasing concrete age. For the M0 and M0.1 mixes, the perfect plastic phase generally exists from around a 0.7 to 0.5 h/R ratio. This slightly changes with the concrete age. However, for the high yield stress mix M0.3, the perfect plastic response phase exists from around 0.75 to 0.55, and this range reduces with the concrete age as shown in Figure 13. To achieve the yield stress, the linear function given in Equation (16) was used as shown in Figure 13 for the M0 mix. According to Equation (16), the yield stress ( K i ) can be achieved from the intercept of the linear graph in the F* axis or the gradient of the linear graph. However, the yield stresses from the gradient and the intercept show different values (typically the yield stress from the gradient has a higher value than the one from the intercept). According to a study conducted by Roussel et al. [136], this change is due to the radial traction stresses applied by the outcoming sample while compressing the sample. Hence, an energy dissipation component due to the breaking of the sample and outside the volume between the plates should be considered and added to the gradient. Therefore, the yield stress value achieved from the intercept can be considered the accurate value of the two values.
Figure 14 shows the yield stress ( K i ) evolution with concrete age for the three mixes using the squeeze test.
For the M0, M0.1, and M0.3 mixes, the initial yield stress values achieved are 3.6 kPa, 6.5 kPa, and 13.2 kPa, respectively. The A t h i x values are 0.1, 0.2, and 0.4 kPa.min−1 for the M0, M0.1, and M0.3 mixes, respectively.

4.6. Vane Shear Test

Figure 15 shows the yield stress evolution with concrete age achieved from the vane shear test.
The values achieved from the vane shear test also show a similar trend of initial yield stress variation within the mixes. It should be noted that the mechanical gauge used in this vane shear apparatus can only measure the yield stresses up to 4.5 kPa. Hence, only two points of yield stress values can be achieved for the M0.3 mix. The authors understand that the linear fitting for two points can cause errors and will not be accurate. Nevertheless, considering the yield stress evolution behavior achieved from the other tests, and for comparison purposes (the A t h i x values), the linear fitting was completed for the M0.3 mix.

4.7. Comparison of the Parameters

Table 7 shows a summary of the rheological parameters achieved from each test method. Here, the yield stress compared is the initial yield stress measured in each test.
The three mixes show a similar yield stress variation (i.e., lowest yield stress in M0 and highest in M0.3), irrespective of the test method used as shown in Table 7. Nevertheless, the values of the yield stresses achieved are not similar or identical. To compare the yield stress values from each test with respect to the commonly used standard rheometer test, the yield stress values can be plotted as a ratio of the yield stress values achieved from the rheometer test (Figure 16). This gives a measurement of the deviation of the yield stress from each test w.r.t the rheometer test. If the value from the considered test is equal to 1, the yield stress values are similar to the standard rheometer test results.
As shown in Figure 16 the vane shear test shows values of 1.2, 2, and 1.1 for mix M0, M0.1, and M0.3, respectively. This indicates that there are minor differences between the yield stress achieved from the rheometer test and the vane shear test. The maximum difference shown is for M0.1, which has nearly a yield stress value two times the one measured from the rheometer. In both the rheometer test and the vane shear test, the test protocol is similar in both tests. The main differences between the tests are the vane geometries used and the conversion equations used to convert the yield torque values to yield stress. In the rheometer test, a 6-blade vane was used, and for the vane shear test, a 4-blade vane was used. If comparing the analytical equations used for the conversion, the equation using [131] to convert the torque to shear stress in the rheometer test is τ 0 =   t o r q u e / π D 3 2 H D + 1 3 . For the vane shear test, the equation used is slightly changed to τ 0 = t o r q u e / π D 3 2 H D + 1 6 due to the assumptions made earlier (neglecting the normal stress applied from the top material weight). Here, H and D are the vane height and the diameter, respectively. Nevertheless, it can be seen that the vane shear test and the rheometer test both give generally a similar yield stress value for the mixes.
The slump test also typically gives a closer yield stress value to the one measured using the rheometer. However, the yield stress value for the M0.3 mix is lower than the one measured from the rheometer. As mentioned earlier, the slump test only provides a value range of around up to 2.5 kPa and is not suitable for very high yield stress mixes such as M0.3. Therefore, the measured yield stress for the M0.3 mix from the rheometer shows a higher yield stress value.
The direct shear test shows considerably higher yield stress values when compared to the values achieved from the rheometers. This was expected due to the time taken to complete one direct shear test (Table 5). It was expected to see a considerable deviation between the direct shear test and rheometer yield stress values for M0.3 due to the higher structural build-up rate in the M0.3 mix. However, the deviation is lower compared to the other two mixes. The most probable reason can be the drainage of water while applying the normal stress in the direct shear test. The drainage of water from the porous structure can result in increasing the yield stress of a mix [16,17,120]. The drainage effect is higher for high fluid mixes [96]. In this study, the M0 mix has the highest flowability (fluidity) and can cause the drainage of water easily compared to the other two mixes. This was visibly observed while doing several trials at high normal stresses such as 10 and 20 kPa. Due to the high flocculation capability in M0.1 and M0.3 (increased with the nano clay content), the drainage effect can be reduced due to higher attraction forces between cement particles. Hence, the M0.3 mix is least prone to water drainage when applying normal stress.
The uniaxial yield stress values are typically higher than the shear yield stress values achieved from the rheometer tests. In previous studies [115,116], it was found that the uniaxial yield stress to shear yield stress ratio is around 3 for the material that does not exhibit flow anisotropy. In this study, the uniaxial yield stress values are around 5 to 7 times higher than the shear yield stress values achieved.
Similar to the uniaxial yield stresses, the yield stresses achieved from the squeeze test also show higher values when compared with the rheometer yield stress values. In this study, the yield stresses from the squeeze test are 3 to 5 times higher than the rheometer yield stress values. The different flow behavior in the rheometer test (shear flow) and the squeeze test (shear flow and extensional flow, both) may result in providing different values for the measured yield stresses in the two tests. Another probable reason for the increase in the parameters in squeeze flow can be the compaction of the material when preparing the samples. Hence, the measured yield stress values in the squeeze test can display higher values.
In general, it can be concluded that the test methods based only on the shear flow behavior or shear failure of material give approximately similar yield stress values for the mixes. The orifice extrusion test and the squeeze test which show both the combination of shear flow and elongational flow, show higher yield values than other test methods. However, the testing time limitation, the flow model used, and the consistency of the sample while doing the test also affect the measured yield stress.
If comparing the structural build-up rate ( A t h i x ) achieved from the rheometer test and vane shear test, both show a similar trend of A t h i x variation within the mixes. From the rheometer test, the A t h i x values achieved for both M0 and M0.1 are similar (0.02 kPa.min−1). Similarly, A t h i x values achieved from the vane shear test are also similar for M0 and M0.1 (around 0.05 kPa.min−1). However, the A t h i x values achieved from the vane shear test seem to be higher than the ones achieved in the rheometer test. Additionally, regarding the differences in the test methods mentioned earlier, another probable reason for the discrepancies can be the disturbances occurring in the samples before testing. In vane shear tests, while doing the time-dependant material testing, multiple batches were used. Hence, there could be some disturbances to the samples while transferring the material to the rheometer container. Therefore, the measured time-dependent yield stresses can be slightly lower than the actual. In the vane shear test, a larger container was used, and the vane was inserted in several locations to take the measurements for the time-dependent material behavior. Hence, there will be less disturbances and the measured values can be higher. This can be a possible reason for the increased A t h i x value in the vane shear test compared to the rheometer test.

4.8. Extrudability Test

To assess the extrudability of the three mixes considered, the variation of the relative power consumption, discharge rate, and the I p index with different screw rotational speeds can be plotted as in Figure 17.
As shown in Figure 17a, the discharge rate is increasing linearly with the rotational speed of the screw. Mix M0 has the highest discharge rate due to the low viscosity and the yield stress (more fluid). M0.3, which has a higher viscosity, shows very low discharge rates. Contrarily, the M0.3 mix has the highest relative power consumption due to its higher yield stress, viscosity, and stiffness. For all the mixes, the relative power is increasing with the increase in rotational speed according to a power-law function (Figure 17b). Hence, the index I p is the highest for M0.3 and lowest for M0 as shown in Figure 17c. This shows that more energy should be needed to extrude a unit volume of material of M0.3, showing lesser extrudability compared with other mixes. Typically, the I p index tends to increase linearly with the rotational speed, because the increase rate in relative power with rotational speed is prominent when compared to the discharge rate increase. However, for the M0.3 mix, up to the 1.5 rev.s−1 screw rotational speed, the discharge rate increase seems to be higher compared to the power consumption increase rate. Hence, the I p index decreases up to 1.5 rev.s−1, and then increases afterwards. Nevertheless, the method seems to give an accurate quantification of extrudability which complies with the measured rheological parameters.

4.9. Buildability

The printing of circular columns was completed until it reached failure. Figure 18 shows the failure initiated in the columns while printing.
As shown in Figure 18, failure occurs at the 21st and 160th layer construction for M0 and M0.1, respectively. For the M0.3 mix, the failure does not occur and reaches the maximum print height limit which can be achieved from the gantry 3D printer used. The layers number printed for M0.3 is 320, which is around 1.6 m high. For the M0 and M0.1 mixes, the failure mode achieved is a strength-based failure, which occurs at the bottom-most layers. There are no large radial deformations visible before failure, which also confirms that the possible failure mode is a strength-based failure rather than a buckling failure.
The authors introduced a simplified Mohr–Coulomb analytical model in previous studies to determine the failure height ( H f ) of printed structures due to the strength-based failure as follows [18,19]:
H f       =     2 C t tan 2 + π 4 ρ g
The Mohr–Coulomb failure model has higher accuracy than the rheology-based models as shown by the authors in their study [18]. In Equation (17), C t and are cohesion (time-dependent) and friction angle values, respectively. The failure height of each mix can be predicted using Equation (17). Table 8 shows the predicted failure heights for each mix using different yield stress values and A t h i x values from each test. It should be noted that the C t value considered to be equivalent to the static yield stress value as found from previous studies [93,96] is shown here. The friction angles are assumed to be time-independent values. The values used for the friction angles are the ones found in the direct shear test as 35°, 42°, and 43° for mix M0, M0.1, and M0.3, respectively. Density values of 2169, 2211, and 2219 kg.m−3 are used for M0, M0.1, and M0.3, respectively, which also are considered time-independent.
As shown in Table 8, strength-based failure can be predicted using Equation (17) and the rheological parameters achieved from different test methods. Only the parameters from the rheometer test, vane shear test, and direct shear test are considered. A higher failure height (or no failure) can be achieved for M0.3, and the lowest failure height can be achieved for the M0 mix as in the experimental results. However, there are some deviations in the predicted values from the experimental values.
The predicted failure heights are considerably overestimated by the vane shear test parameters as well as the direct shear test parameters. However, the parameters achieved from the rheometer seem to predict the failure layer number considerably accurately with only a maximum of a 25% error margin. For the M0.3 mix, all the test methods show a failure layer number of more than 320 layers. Hence, a conclusion could not be made on the accuracy of the test method with respect to the M0.3 mix.
The direct shear test also gives a considerably accurate failure layer number for the M0.1 mix (only around 10% deviation from the experimental value). However, the failure layer number for the M0 mix is highly overestimated. This can be expected, because the considered cohesion values are higher and overestimated when compared with the initial yield stress values from the rheometer and vane shear test (due to aging, drainage effects, etc., as explained earlier).
Hence, the rheometer test seems to provide accurate rheological parameters for predicting the plastic failure of the structures when compared to other methods. The direct shear test also seems to have the potential of providing accurate rheological parameters, if one can design the test setup to conduct the test quickly within a few minutes. In addition, the direct shear test seems to provide more accurate results for low w/c ratio mixes, which are generally used in 3D concrete printing applications.

5. Summary and Conclusions

This study discusses and reviews some commonly used rheology measurement techniques applicable to 3DCP cementitious material. Some of the test methods discussed are standard test methods and some test methods have a potential for measuring rheological parameters (specifically for 3DCP material), even though they are not standardized methods. These non-standard methods are not new in other fields such as geomechanics, polymer, and steel extrusion. Many researchers implemented these non-standard methods in 3DCP applications due to some drawbacks and limitations seen in standard rheology measurement techniques commonly used for very flowable mixes such as SCC or normal concrete.
Furthermore, the authors have conducted experimental work to compare the achieved rheological parameters from standard and non-standard testing methods. The measured values were compared and also further used to analyze the buildability and extrudability of the mixes used. According to the authors’ knowledge, this study is one of the first to compare the rheology measurement techniques for 3D concrete printing focusing on both standard and non-standard methods. Furthermore, the study is the first to analyze the accuracy of buildability prediction (strength-based failure) using different rheological parameters from various test methods. Hence, the study will provide a solution for selecting a suitable rheology measurement technique according to the 3DCP process considered. The following are some of the major conclusions of the study.
There are pros and cons to every testing method, whether it is standard or non-standard. In addition, the measurable parameters are limited in some testing methods. The key concept is to identify the relevant 3DCP process (i.e., pumping, extrusion, or layer deposition and building the structure) and select the most suitable testing method. For example, if the 3DCP process considered is pumping or extrusion, the ram extrusion, and rheometers can provide useful information such as flow curves and viscosity data important in the process. For buildability or failure studies, the direct shear test, rheometers, vane shear test, and tri-axial test can provide useful rheological data. However, the direct shear test and the tri-axial test will be most accurate as they provide friction parameters useful for analyzing the normal stress effects in a layer-wise construction.
From the experiments conducted, it was found that the testing methods based on shear flow behavior give similar yield stress values for the mixes tested with minor changes. The squeeze test and orifice extrusion test, which are based on extensional and shear flow, may provide 5 to 7 times higher yield stresses than the shear yield stress values. The slump test is an inaccurate test method for measuring yield stress with values of around 1.5 kPa.
The A t h i x values measured using the rheometer and vane test show similar variation between the mixes (i.e., similar for M0 and M0.1, and highest for M0.3). However, the vane shear test shows higher values when compared with the values achieved from the rheometer. The main reason could be the disturbances occurring while preparing the multiple samples for the rheometer test. The major drawback of both testing methods is the measurable yield stress limit is around 5 kPa, and in some 3D printable concrete mixes, this value will exceed within a few minutes.
The power consumption and unit energy measurement techniques used in this study have the potential in quantifying the extrudability of the mixes used in 3DCP. The I p index of the mixes seems to have a direct correlation with the yield stress and viscosity values (higher I p index can be achieved for mixes with higher viscosity and yield stress).
The rheological parameters measured from the rheometers seem to be accurate when used for predicting the strength-based failure of 3D printed columns. Generally, the rheology parameters from the vane shear test overestimate the failure layer number. However, the direct shear test seems to have the potential in providing useful rheological and frictional parameters, if one can conduct the test within a few minutes. Nevertheless, the test is most suitable for low w/c ratio mixes (0.23 w/c ratio in this study) due to the drained conditions used in the test.
One of the main limitations of the current experimental work is that the tests were conducted for different batch numbers due to the limitation of human resources. Even though a vane shear was conducted initially to ensure consistency, the vane shear test is only a single-point test that only gives the yield stress value, and cannot ensure the changes in other rheological parameters, such as viscosity and thixotropy. Hence, the authors recommend all the tests be conducted for a single batch to reduce the inconsistencies in the results. Another drawback of the experimental work is the extensive time spent on the direct shear test, which requires a high rate of shearing/mixing at the end of a test to use the same material for another direct shear test run. However, this may also result in inaccuracies or inconsistencies in the test data. Specifically for high-yield stress mixes and mixes used in 3D printing applications, the mixes tend to set quickly, and sometimes high-speed mixing may not be enough to achieve the initial consistency of the material. Therefore, it is recommended to develop a custom-made direct shear test apparatus which can do the testing considerably quicker and more easily, as the currently available direct shear test apparatus uses a very slow shearing rate, and setting up the test equipment is time-consuming.

Author Contributions

Conceptualization, R.J., P.R. and J.S.; methodology, R.J.; software, R.J. and P.R.; validation, R.J., P.R. and J.S.; formal analysis, R.J. and P.R.; investigation, R.J., P.R. and J.S.; resources, P.R. and J.S.; data curation, R.J.; writing—original draft preparation, R.J.; writing—review and editing, R.J., P.R. and J.S.; visualization, R.J., P.R. and J.S.; supervision, P.R., and J.S.; project administration, P.R. and J.S.; funding acquisition, J.S. All authors have read and agreed to the published version of the manuscript.

Funding

This research received no external funding.

Institutional Review Board Statement

Not applicable.

Informed Consent Statement

Not applicable.

Conflicts of Interest

The authors declare no conflict of interest.

References

  1. Pegna, J. Exploratory investigation of solid freeform construction. Autom. Constr. 1997, 5, 427–437. [Google Scholar] [CrossRef]
  2. Khoshnevis, B. Automated construction by contour crafting—related robotics and information technologies. Autom. Constr. 2004, 13, 5–19. [Google Scholar] [CrossRef]
  3. Khoshnevis, B.; Hwang, D.; Yao, K.-T.; Yeh, Z. Mega-scale fabrication by contour crafting. Int. J. Ind. Syst. Eng. 2006, 1, 301–320. [Google Scholar] [CrossRef] [Green Version]
  4. Valencia, N. World’s First 3D Printed Bridge Opens in Spain. 2017. Available online: https://www.archdaily.com/804596/worlds-first-3d-printed-bridge-opens-in-spain (accessed on 1 August 2022).
  5. Buswell, R.A.; Soar, R.C.; Gibb, A.G.; Thorpe, A. Freeform construction: Mega-scale rapid manufacturing for construction. Autom. Constr. 2007, 16, 224–231. [Google Scholar] [CrossRef] [Green Version]
  6. Buswell, R.A.; de Silva, W.L.; Jones, S.; Dirrenberger, J. 3D printing using concrete extrusion: A roadmap for research. Cem. Concr. Res. 2018, 112, 37–49. [Google Scholar] [CrossRef]
  7. Mechtcherine, V.; Bos, F.P.; Perrot, A.; da Silva, W.L.; Nerella, V.; Fataei, S.; Wolfs, R.J.; Sonebi, M.; Roussel, N. Extrusion-based additive manufacturing with cement-based materials–Production steps, processes, and their underlying physics: A review. Cem. Concr. Res. 2020, 132, 106037. [Google Scholar] [CrossRef]
  8. ICON. Available online: https://www.iconbuild.com/projects (accessed on 1 August 2022).
  9. KampC. Available online: https://www.kampc.be/c3po_eng (accessed on 1 August 2022).
  10. Winsun. Available online: http://www.winsun3d.com/En/Product/prolist/id/1 (accessed on 1 August 2022).
  11. Lloret, E.; Shahab, A.R.; Linus, M.; Flatt, R.J.; Gramazio, F.; Kohler, M.; Langenberg, S. Complex concrete structures: Merging existing casting techniques with digital fabrication. Comput.-Aided Des. 2015, 60, 40–49. [Google Scholar] [CrossRef]
  12. Fritschi, E.L.; Reiter, L.; Wangler, T.; Gramazio, F.; Kohler, M.; Flatt, R.J. Smart dynamic casting: Slipforming with flexible formwork-inline measurement and control. In HPC/CIC Tromsø 2017; Norwegian Concrete Association: Oslo, Norway, 2017; p. 27. [Google Scholar]
  13. Lowke, D.; Dini, E.; Perrot, A.; Weger, D.; Gehlen, C.; Dillenburger, B. Particle-bed 3D printing in concrete construction–Possibilities and challenges. Cem. Concr. Res. 2018, 112, 50–65. [Google Scholar] [CrossRef]
  14. Xia, M.; Sanjayan, J. Method of formulating geopolymer for 3D printing for construction applications. Mater. Des. 2016, 110, 382–390. [Google Scholar] [CrossRef]
  15. Nerella, V.; Näther, M.; Iqbal, A.; Butler, M.; Mechtcherine, V. Inline quantification of extrudability of cementitious materials for digital construction. Cem. Concr. Compos. 2019, 95, 260–270. [Google Scholar] [CrossRef]
  16. Perrot, A.; Mélinge, Y.; Rangeard, D.; Estellé, P.; Lanos, C. Extrusion Criterion for Firm Cement-Based Materials. AIP Conf. Proc. 2008, 1027, 96–98. [Google Scholar]
  17. Perrot, A.; Mélinge, Y.; Rangeard, D.; Micaelli, F.; Estellé, P.; Lanos, C. Use of ram extruder as a combined rheo-tribometer to study the behaviour of high yield stress fluids at low strain rate. Rheol. Acta 2012, 51, 743–754. [Google Scholar] [CrossRef] [Green Version]
  18. Jayathilakage, R.; Rajeev, P.; Sanjayan, J. Yield stress criteria to assess the buildability of 3D concrete printing. Constr. Build. Mater. 2020, 240, 117989. [Google Scholar] [CrossRef]
  19. Jayathilakage, R.I.; Rajeev, P.; Sanjayan, J. Predication of strength-based failure in extrusion-based 3D concrete printing. In Rheology and Processing of Construction Materials; Springer: Berlin/Heidelberg, Germany, 2019; pp. 391–399. [Google Scholar]
  20. Wolfs, R.; Bos, F.; Salet, T. Early age mechanical behaviour of 3D printed concrete: Numerical modelling and experimental testing. Cem. Concr. Res. 2018, 106, 103–116. [Google Scholar] [CrossRef]
  21. Jayathilakage, R. Rheology and Buildability Investigation of Concrete for 3D Printing. Ph.D. Thesis, Swinburne University of Technology Melbourne, Melbourne, VIC, Australia, 2021. [Google Scholar]
  22. Marchment, T.; Sanjayan, J. Mesh reinforcing method for 3D Concrete Printing. Autom. Constr. 2020, 109, 102992. [Google Scholar] [CrossRef]
  23. Marchment, T.; Sanjayan, J.; Xia, M. Method of enhancing interlayer bond strength in construction scale 3D printing with mortar by effective bond area amplification. Mater. Des. 2019, 169, 107684. [Google Scholar] [CrossRef]
  24. Sanjayan, J.G.; Nematollahi, B.; Xia, M.; Marchment, T. Effect of surface moisture on inter-layer strength of 3D printed concrete. Constr. Build. Mater. 2018, 172, 468–475. [Google Scholar] [CrossRef]
  25. Rehman, A.U.; Kim, J.-H. 3D concrete printing: A systematic review of rheology, mix designs, mechanical, microstructural, and durability characteristics. Materials 2021, 14, 3800. [Google Scholar] [CrossRef]
  26. Moeini, M.A.; Hosseinpoor, M.; Yahia, A. Effectiveness of the rheometric methods to evaluate the build-up of cementitious mortars used for 3D printing. Constr. Build. Mater. 2020, 257, 119551. [Google Scholar] [CrossRef]
  27. Biricik, Ö.; Mardani, A. Parameters affecting thixotropic behavior of self compacting concrete and 3D printable concrete; a state-of-the-art review. Constr. Build. Mater. 2022, 339, 127688. [Google Scholar] [CrossRef]
  28. Jiao, D.; De Schryver, R.; Shi, C.; De Schutter, G. Thixotropic structural build-up of cement-based materials: A state-of-the-art review. Cem. Concr. Compos. 2021, 122, 104152. [Google Scholar] [CrossRef]
  29. Alfani, R.; Guerrini, G. Rheological test methods for the characterization of extrudable cement-based materials—A review. Mater. Struct. 2005, 38, 239–247. [Google Scholar]
  30. Wangler, T.; Scotto, F.; Lloret-Fritschi, E.; Flatt, R.J. Residence Time Distributions in Continuous Processing of Concrete. In Rheology and Processing of Construction Materials; Springer: Berlin/Heidelberg, Germany, 2019; pp. 448–456. [Google Scholar]
  31. Secrieru, E.; Cotardo, D.; Mechtcherine, V.; Lohaus, L.; Schröfl, C.; Begemann, C. Changes in concrete properties during pumping and formation of lubricating material under pressure. Cem. Concr. Res. 2018, 108, 129–139. [Google Scholar] [CrossRef]
  32. Mechtcherine, V.; Nerella, V.N.; Kasten, K. Testing pumpability of concrete using Sliding Pipe Rheometer. Constr. Build. Mater. 2014, 53, 312–323. [Google Scholar] [CrossRef]
  33. De Schutter, G.; Feys, D. Pumping of fresh concrete: Insights and challenges. RILEM Tech. Lett. 2016, 1, 76–80. [Google Scholar] [CrossRef] [Green Version]
  34. Choi, M.; Roussel, N.; Kim, Y.; Kim, J. Lubrication layer properties during concrete pumping. Cem. Concr. Res. 2013, 45, 69–78. [Google Scholar] [CrossRef]
  35. Kaplan, D.; de Larrard, F.; Sedran, T. Design of concrete pumping circuit. ACI Mater. J. 2005, 102, 110. [Google Scholar]
  36. Jayathilakage, R.; Rajeev, P.; Sanjayan, J. Extrusion rheometer for 3D concrete printing. Cem. Concr. Compos. 2021, 121, 104075. [Google Scholar] [CrossRef]
  37. El Cheikh, K.; Rémond, S.; Khalil, N.; Aouad, G. Numerical and experimental studies of aggregate blocking in mortar extrusion. Constr. Build. Mater. 2017, 145, 452–463. [Google Scholar] [CrossRef]
  38. Yang, P.; Nair, S.K.A.; Neithalath, N. Discrete Element Simulations of Rheological Response of Cementitious Binders as Applied to 3D Printing. In RILEM International Conference on Concrete and Digital Fabrication; Springer: Cham, Switzerland, 2018; pp. 102–112. [Google Scholar]
  39. Di Carlo, T.; Khoshnevis, B.; Carlson, A. Experimental and Numerical Techniques to Characterize Structural Properties of Fresh Concrete. In Proceedings of the ASME 2013 International Mechanical Engineering Congress and Exposition, San Diego, CA, USA, 15–21 November 2013; p. V009T010A062. [Google Scholar]
  40. Wangler, T.; Lloret, E.; Reiter, L.; Hack, N.; Gramazio, F.; Kohler, M.; Bernhard, M.; Dillenburger, B.; Buchli, J.; Roussel, N. Digital concrete: Opportunities and challenges. RILEM Tech. Lett. 2016, 1, 67–75. [Google Scholar] [CrossRef]
  41. Roussel, N. Rheological requirements for printable concretes. Cem. Concr. Res. 2018, 112, 76–85. [Google Scholar] [CrossRef]
  42. Kruger, J.; Zeranka, S.; van Zijl, G. 3D concrete printing: A lower bound analytical model for buildability performance quantification. Autom. Constr. 2019, 106, 102904. [Google Scholar] [CrossRef]
  43. Suiker, A. Mechanical performance of wall structures in 3D printing processes: Theory, design tools and experiments. Int. J. Mech. Sci. 2018, 137, 145–170. [Google Scholar] [CrossRef] [Green Version]
  44. Wolfs, R.; Suiker, A. Structural failure during extrusion-based 3D printing processes. Int. J. Adv. Manuf. Technol. 2019, 104, 565–584. [Google Scholar] [CrossRef] [Green Version]
  45. Bingham, E.C. Fluidity and Plasticity; McGraw-Hill: New York, NY, USA, 1922; Volume 2. [Google Scholar]
  46. Herschel, W.H. Consistency of rubber benzene solutions. Ind. Eng. Chem. 1924, 16, 927. [Google Scholar] [CrossRef]
  47. Yahia, A.; Khayat, K. Analytical models for estimating yield stress of high-performance pseudoplastic grout. Cem. Concr. Res. 2001, 31, 731–738. [Google Scholar] [CrossRef]
  48. Casson, N. A flow equation for pigment-oil suspensions of the printing ink type. Rheol. Disperse Syst. 1959. [Google Scholar]
  49. Banfill, P.F.G. The rheology of fresh cement and concrete-a review. In Proceedings of the 11th International Cement Chemistry Congress, Durban, South Africa, 11–16 May 2003; pp. 50–62. [Google Scholar]
  50. Quemada, D. Models for rheological behavior of concentrated disperse media under shear. Adv. Rheol. 1984, 2, 571–582. [Google Scholar]
  51. Vom Berg, W. Influence of specific surface and concentration of solids upon the flow behaviour of cement pastes. Mag. Concr. Res. 1979, 31, 211–216. [Google Scholar] [CrossRef]
  52. Jones, T.; Taylor, S. A mathematical model relating the flow curve of a cement paste to its water/cement ratio. Mag. Concr. Res. 1977, 29, 207–212. [Google Scholar] [CrossRef]
  53. Roussel, N.; Ovarlez, G.; Garrault, S.; Brumaud, C. The origins of thixotropy of fresh cement pastes. Cem. Concr. Res. 2012, 42, 148–157. [Google Scholar] [CrossRef]
  54. Perrot, A.; Rangeard, D.; Pierre, A. Structural built-up of cement-based materials used for 3D-printing extrusion techniques. Mater. Struct. 2016, 49, 1213–1220. [Google Scholar] [CrossRef]
  55. Papo, A.; Caufin, B. A study of the hydration process of cement pastes by means of oscillatory rheological techniques. Cem. Concr. Res. 1991, 21, 1111–1117. [Google Scholar] [CrossRef]
  56. Di, W.; Cai, S.-j.; Huang, G. Coupled effect of cement hydration and temperature on rheological properties of fresh cemented tailings backfill slurry. Trans. Nonferrous Met. Soc. China 2014, 24, 2954–2963. [Google Scholar]
  57. Koehler, E.P.; Fowler, D.W. Summary of Concrete Workability Test Methods; The University of Texas at Austin: Austin, TX, USA, 2003. [Google Scholar]
  58. Hackley, V.A.; Ferraris, C.F. Guide to Rheological Nomenclature: Measurements in Ceramic Particulate Systems; National Institute of Standards and Technology Gaithersburg: Gaithersburg, MD, USA, 2001. [Google Scholar]
  59. Tay, Y.W.D.; Qian, Y.; Tan, M.J. Printability region for 3D concrete printing using slump and slump flow test. Compos. Part B Eng. 2019, 174, 106968. [Google Scholar] [CrossRef]
  60. ASTM International. C143/C143M-12-Standard Test Method for Slump of Hydraulic-Cement Concrete; ASTM International: West Conshohocken, PA, USA, 2012. [CrossRef]
  61. Tanigawa, Y. Rheological study on slumping behavior of fresh concrete. Trans. Jpn. Concr. Inst. 1992, 14, 1–8. [Google Scholar]
  62. Chidiac, S.; Habibbeigi, F.; Chan, D. Slump and slump flow for characterizing yield stress of fresh concrete. ACI Mater. J. 2006, 103, 413. [Google Scholar]
  63. Hu, C.; de Larrard, F.; Sedran, T.; Boulay, C.; Bosc, F.; Deflorenne, F. Validation of BTRHEOM, the new rheometer for soft-to-fluid concrete. Mater. Struct. 1996, 29, 620–631. [Google Scholar] [CrossRef]
  64. Roussel, N. Correlation between yield stress and slump: Comparison between numerical simulations and concrete rheometers results. Mater. Struct. 2006, 39, 501. [Google Scholar] [CrossRef]
  65. Shyshko, S. Numerical Simulation of the Rheological Behavior of Fresh Concrete. 2013. Available online: https://nbn-resolving.org/urn:nbn:de:bsz:14-qucosa-131751 (accessed on 23 September 2013).
  66. Kurokawa, Y. Study on slump test and slump-flow test of fresh concrete. Trans. Jpn. Concr. Inst. 1996, 16, 25–32. [Google Scholar]
  67. ASTM, C. 230/C230-08; Standard Specification for Flow Table for Use in Test of Hydraulic Cement. ASTM International: West Conshohocken, PA, USA, 2009.
  68. ASTM, C. C1437; Standard Test Method for Flow of Hydraulic Cement Mortar. ASTM International: West Conshohocken, PA, USA, 2007.
  69. Papachristoforou, M.; Mitsopoulos, V.; Stefanidou, M. Evaluation of workability parameters in 3D printing concrete. Procedia Struct. Integr. 2018, 10, 155–162. [Google Scholar] [CrossRef]
  70. Tattersall, G.H. Workability and Quality Control of Concrete; CRC Press: Boca Raton, FL, USA, 2014. [Google Scholar]
  71. Struble, L.J.; Jiang, Q. Effects of air entrainment on rheology. Mater. J. 2004, 101, 448–456. [Google Scholar]
  72. De Larrard, F.; Szitcar, J.; Hu, C.; Joly, M. Design of a rheometer for fluid concretes. Spec. Concr. Work. Mix. 1993, 186, 208–210. [Google Scholar]
  73. Beaupre, D. Rheology of High Performance Shotcrete; University of British Columbia: Vancouver, BC, Canada, 1994. [Google Scholar]
  74. Domone, P.; Yongmo, X.; Banfill, P. Developments of the two-point workability test for high-performance concrete. Mag. Concr. Res. 1999, 51, 171–179. [Google Scholar] [CrossRef]
  75. Feys, D.; Cepuritis, R.; Jacobsen, S.; Lesage, K.; Secrieru, E.; Yahia, A. Measuring rheological properties of cement pastes: Most common techniques, procedures and challenges. RILEM Tech. Lett. 2018, 2, 129. [Google Scholar] [CrossRef] [Green Version]
  76. Hafid, H.; Ovarlez, G.; Toussaint, F.; Jézequel, P.-H.; Roussel, N. Estimating measurement artifacts in concrete rheometers from MRI measurement on model materials. In Design, Production and Placement of Self-Consolidating Concrete; Springer: Berlin/Heidelberg, Germany, 2010; pp. 127–137. [Google Scholar]
  77. Banfill, P.; Beaupr, D.; Chapdelaine, F.; De Larrard, F.; Domone, P.; Nachbaur, L.; Sedran, T.; Wallevik, J.; Wallevik, O. Comparison of Concrete Rheometers: International Tests at LCPC (Nantes, France); Report number: NISTDIR 6819; National Institute of Standards and Technology: Gaithersburg, MD, USA, 2000. [Google Scholar]
  78. Ferraris, C.F.; Brower, L.E.; Banfill, P.; Beaupré, D.; Chapdelaine, F.; de Larrard, F.; Domone, P. Comparison of Concrete Rheometers: International Test at LCPC (Nantes, France) in October, 2000; US Department of Commerce, National Institute of Standards and Technology: Gaithersburg, MD, USA, 2001. [Google Scholar]
  79. Leighton, D.; Acrivos, A. The shear-induced migration of particles in concentrated suspensions. J. Fluid Mech. 1987, 181, 415–439. [Google Scholar] [CrossRef]
  80. Wallevik, O.H.; Feys, D.; Wallevik, J.E.; Khayat, K.H. Avoiding inaccurate interpretations of rheological measurements for cement-based materials. Cem. Concr. Res. 2015, 78, 100–109. [Google Scholar] [CrossRef]
  81. Nerella, V.; Beigh, M.; Fataei, S.; Mechtcherine, V. Strain-based approach for measuring structural build-up of cement pastes in the context of digital construction. Cem. Concr. Res. 2019, 115, 530–544. [Google Scholar] [CrossRef]
  82. Ivanova, I.; Mechtcherine, V. Possibilities and challenges of constant shear rate test for evaluation of structural build-up rate of cementitious materials. Cem. Concr. Res. 2020, 130, 105974. [Google Scholar] [CrossRef]
  83. Qian, Y.; Kawashima, S. Distinguishing dynamic and static yield stress of fresh cement mortars through thixotropy. Cem. Concr. Compos. 2018, 86, 288–296. [Google Scholar] [CrossRef]
  84. Mbasha, W.; Masalova, I.; Haldenwang, R.; Malkin, A. The yield stress of cement pastes as obtained by different rheological approaches. Appl. Rheol. 2015, 25, 9–19. [Google Scholar]
  85. Banfill, P.F.G. Rheology of Fresh Cement and Concrete: Proceedings of an International Conference, Liverpool, 1990; CRC Press: Boca Raton, FL, USA, 1990. [Google Scholar]
  86. Banfill, P.; Saunders, D. On the viscometric examination of cement pastes. Cem. Concr. Res. 1981, 11, 363–370. [Google Scholar] [CrossRef]
  87. Da Silva, W.R.L.; Fryda, H.; Bousseau, J.-N.; Andreani, P.-A.; Andersen, T.J. Evaluation of Early-Age Concrete Structural Build-Up for 3D Concrete Printing by Oscillatory Rheometry. Advances in Additive Manufacturing. Modeling Syst. 3D Prototyp. 2020, 35–47. [Google Scholar]
  88. Yuan, Q.; Lu, X.; Khayat, K.H.; Feys, D.; Shi, C. Small amplitude oscillatory shear technique to evaluate structural build-up of cement paste. Mater. Struct. 2017, 50, 112. [Google Scholar] [CrossRef]
  89. Schultz, M.A.; Struble, L.J. Use of oscillatory shear to study flow behavior of fresh cement paste. Cem. Concr. Res. 1993, 23, 273–282. [Google Scholar] [CrossRef]
  90. Yuan, Q.; Zhou, D.; Khayat, K.H.; Feys, D.; Shi, C. On the measurement of evolution of structural build-up of cement paste with time by static yield stress test vs. small amplitude oscillatory shear test. Cem. Concr. Res. 2017, 99, 183–189. [Google Scholar] [CrossRef]
  91. Assaad, J.J.; Harb, J. Assessment of thixotropy of fresh mortars by triaxial and unconfined compression testing. Adv. Civ. Eng. Mater. 2012, 1, 1–18. [Google Scholar] [CrossRef]
  92. Wolfs, R.; Bos, F.; Salet, T. Triaxial compression testing on early age concrete for numerical analysis of 3D concrete printing. Cem. Concr. Compos. 2019, 104, 103344. [Google Scholar] [CrossRef]
  93. Assaad, J.J.; Harb, J.; Maalouf, Y. Measurement of yield stress of cement pastes using the direct shear test. J. Non-Newton. Fluid Mech. 2014, 214, 18–27. [Google Scholar] [CrossRef]
  94. Lu, G.; Wang, K. Theoretical and experimental study on shear behavior of fresh mortar. Cem. Concr. Compos. 2011, 33, 319–327. [Google Scholar] [CrossRef]
  95. Girish, S.; Santhosh, B. Determination of Bingham parameters of fresh Portland cement concrete using concrete shear box. Bonfring Int. J. Ind. Eng. Manag. Sci. 2012, 2, 84–90. [Google Scholar]
  96. Jayathilakage, R.; Sanjayan, J.; Rajeev, P. Direct shear test for the assessment of rheological parameters of concrete for 3D printing applications. Mater. Struct. 2019, 52, 12. [Google Scholar] [CrossRef]
  97. Le, T.T.; Austin, S.A.; Lim, S.; Buswell, R.A.; Gibb, A.G.; Thorpe, T. Mix design and fresh properties for high-performance printing concrete. Mater. Struct. 2012, 45, 1221–1232. [Google Scholar] [CrossRef] [Green Version]
  98. Rahul, A.; Santhanam, M.; Meena, H.; Ghani, Z. 3D printable concrete: Mixture design and test methods. Cem. Concr. Compos. 2019, 97, 13–23. [Google Scholar] [CrossRef]
  99. Lu, G.; Wang, K. Investigation into yield behavior of fresh cement paste: Model and experiment. ACI Mater. J. 2010, 107, 12. [Google Scholar]
  100. Kruger, J.; Zeranka, S.; van Zijl, G. A rheology-based quasi-static shape retention model for digitally fabricated concrete. Constr. Build. Mater. 2020, 254, 119241. [Google Scholar] [CrossRef]
  101. Alexandridis, A.; Gardner, N. Mechanical behaviour of fresh concrete. Cem. Concr. Res. 1981, 11, 323–339. [Google Scholar] [CrossRef]
  102. Ritchie, A. The triaxial testing of fresh concrete. Mag. Concr. Res. 1962, 14, 37–42. [Google Scholar] [CrossRef]
  103. Olsen, R.H. Lateral Pressure of Concrete on Formwork; Oklahoma State University: Stillwater, OK, USA, 1968. [Google Scholar]
  104. Assaad, J.J.; Harb, J.; Khayat, K.H. Use of triaxial compression test on mortars to evaluate formwork pressure of self-consolidating concrete. ACI Mater. J. 2009, 106, 439. [Google Scholar]
  105. Kohees, M.; Sanjayan, J.; Rajeev, P. Stress-strain relationship of cement mortar under triaxial compression. Constr. Build. Mater. 2019, 220, 456–463. [Google Scholar] [CrossRef]
  106. ASTM Committee D-18 on Soil and Rock. Standard Test Method for Unconsolidated-undrained Triaxial Compression Test on Cohesive Soils; ASTM International: West Conshohocken, PA, USA, 2007. [Google Scholar]
  107. Nair, S.A.; Panda, S.; Santhanam, M.; Sant, G.; Neithalath, N. A critical examination of the influence of material characteristics and extruder geometry on 3D printing of cementitious binders. Cem. Concr. Compos. 2020, 112, 103671. [Google Scholar] [CrossRef]
  108. Nair, S.A.; Alghamdi, H.; Arora, A.; Mehdipour, I.; Sant, G.; Neithalath, N. Linking fresh paste microstructure, rheology and extrusion characteristics of cementitious binders for 3D printing. J. Am. Ceram. Soc. 2019, 102, 3951–3964. [Google Scholar] [CrossRef]
  109. Chen, Y.; Chaves Figueiredo, S.; Yalçinkaya, Ç.; Çopuroğlu, O.; Veer, F.; Schlangen, E. The effect of viscosity-modifying admixture on the extrudability of limestone and calcined clay-based cementitious material for extrusion-based 3d concrete printing. Materials 2019, 12, 1374. [Google Scholar] [CrossRef] [PubMed] [Green Version]
  110. Figueiredo, S.C.; Rodríguez, C.R.; Ahmed, Z.Y.; Bos, D.H.; Xu, Y.; Salet, T.M.; Çopuroğlu, O.; Schlangen, E.; Bos, F.P. An approach to develop printable strain hardening cementitious composites. Mater. Des. 2019, 169, 107651. [Google Scholar] [CrossRef]
  111. Jayathilakage, R.; Sanjayan, J.; Rajeev, P. Characterizing Extrudability for 3D Concrete Printing Using Discrete Element Simulations. In RILEM International Conference on Concrete and Digital Fabrication; Springer: Cham, Switzerland, 2020; pp. 290–300. [Google Scholar]
  112. Benbow, J.; Bridgwater, J. Paste Flow and Extrusion Oxford Series on Advanced Manufacturing; Clarendon Press: Oxford, UK, 1993. [Google Scholar]
  113. Basterfield, R.; Lawrence, C.; Adams, M. On the interpretation of orifice extrusion data for viscoplastic materials. Chem. Eng. Sci. 2005, 60, 2599–2607. [Google Scholar] [CrossRef]
  114. Perrot, A.; Rangeard, D.; Mélinge, Y.; Estellé, P.; Lanos, C. Extrusion criterion for firm cement-based materials. Appl. Rheol. 2009, 19, 53042. [Google Scholar]
  115. Perrot, A.; Lanos, C.; Melinge, Y.; Estellé, P. Mortar physical properties evolution in extrusion flow. Rheol. Acta 2007, 46, 1065–1073. [Google Scholar] [CrossRef] [Green Version]
  116. Rahul, A.; Sharma, A.; Santhanam, M. A desorptivity-based approach for the assessment of phase separation during extrusion of cementitious materials. Cem. Concr. Compos. 2020, 108, 103546. [Google Scholar] [CrossRef]
  117. Perrot, A.; Lanos, C.; Estellé, P.; Melinge, Y. Ram extrusion force for a frictional plastic material: Model prediction and application to cement paste. Rheol. Acta 2006, 45, 457–467. [Google Scholar] [CrossRef] [Green Version]
  118. Roussel, N.; Lanos, C.; Toutou, Z. Identification of Bingham fluid flow parameters using a simple squeeze test. J. Non-Newton. Fluid Mech. 2006, 135, 1–7. [Google Scholar] [CrossRef]
  119. Engmann, J.; Servais, C.; Burbidge, A.S. Squeeze flow theory and applications to rheometry: A review. J. Non-Newton. Fluid Mech. 2005, 132, 1–27. [Google Scholar] [CrossRef]
  120. Lootens, D.; Flatt, R. Rheology of penetration tests II: Link to shear modulus. In Proceedings of the 12th Int. Conf. Cem. Chem., Montreal, QU, Canada, 8–13 July 2007; pp. 8–13. [Google Scholar]
  121. Jousset, P.; Lootens, D.; Roussel, N.; Flatt, R. Rheology of Penetrations Tests I: Theory and Finite Element Simulations. In Proceedings of the 12th ICCC, Montreal, QU, Canada, 8–13 July 2007; pp. 1–12. [Google Scholar]
  122. Toutou, Z.; Roussel, N.; Lanos, C. The squeezing test: A tool to identify firm cement-based material’s rheological behaviour and evaluate their extrusion ability. Cem. Concr. Res. 2005, 35, 1891–1899. [Google Scholar] [CrossRef]
  123. Cardoso, F.; John, V.; Pileggi, R.; Banfill, P.F.G. Characterisation of rendering mortars by squeeze-flow and rotational rheometry. Cem. Concr. Res. 2014, 57, 79–87. [Google Scholar] [CrossRef]
  124. Lootens, D.; Jousset, P.; Martinie, L.; Roussel, N.; Flatt, R. Yield stress during setting of cement pastes from penetration tests. Cem. Concr. Res. 2009, 39, 401–408. [Google Scholar] [CrossRef]
  125. Mazhoud, B.; Perrot, A.; Picandet, V.; Rangeard, D.; Courteille, E. Underwater 3D printing of cement-based mortar. Constr. Build. Mater. 2019, 214, 458–467. [Google Scholar] [CrossRef]
  126. Perrot, A.; Jacquet, Y.; Rangeard, D.; Courteille, E.; Sonebi, M. Nailing of Layers: A Promising Way to Reinforce Concrete 3D Printing Structures. Materials 2020, 13, 1518. [Google Scholar] [CrossRef] [Green Version]
  127. Jayathilakage, R.; Sanjayan, J.; Rajeev, P. Comparison of Rheology Measurement Techniques Used in 3D Concrete Printing Applications. In ICSECM 2019; Springer: Berlin/Heidelberg, Germany, 2021; pp. 261–273. [Google Scholar]
  128. Sanjayan, J.; Jayathilakage, R.; Rajeev, P. Vibration induced active rheology control for 3D concrete printing. Cem. Concr. Res. 2021, 140, 106293. [Google Scholar] [CrossRef]
  129. Panda, B.; Mohamed, N.; Ahamed, N.; Paul, S.C.; Bhagath Singh, G.; Tan, M.J.; Šavija, B. The effect of material fresh properties and process parameters on buildability and interlayer adhesion of 3D printed concrete. Materials 2019, 12, 2149. [Google Scholar] [CrossRef] [Green Version]
  130. Sikora, P.; Chougan, M.; Cuevas, K.; Liebscher, M.; Mechtcherine, V.; Ghaffar, S.H.; Liard, M.; Lootens, D.; Krivenko, P.; Sanytsky, M. The effects of nano-and micro-sized additives on 3D printable cementitious and alkali-activated composites: A review. Appl. Nanosci. 2022, 12, 805–823. [Google Scholar] [CrossRef]
  131. Barnes, H.A.; Nguyen, Q.D. Rotating vane rheometry—A review. J. Non-Newton. Fluid Mech. 2001, 98, 1–14. [Google Scholar] [CrossRef]
  132. Tregger, N.A.; Pakula, M.E.; Shah, S.P. Influence of clays on the rheology of cement pastes. Cem. Concr. Res. 2010, 40, 384–391. [Google Scholar] [CrossRef]
  133. Kawashima, S.; Kim, J.H.; Corr, D.J.; Shah, S.P. Study of the mechanisms underlying the fresh-state response of cementitious materials modified with nanoclays. Constr. Build. Mater. 2012, 36, 749–757. [Google Scholar] [CrossRef] [Green Version]
  134. Panda, B.; Hui, L.J.; Tan, M.J. Mechanical properties and deformation behaviour of early age concrete in the context of digital construction. Compos. Part B Eng. 2019, 165, 563–571. [Google Scholar] [CrossRef]
  135. Langaroudi, M.A.M.; Mohammadi, Y. Effect of nano-clay on workability, mechanical, and durability properties of self-consolidating concrete containing mineral admixtures. Constr. Build. Mater. 2018, 191, 619–634. [Google Scholar] [CrossRef]
  136. Roussel, N.; Lanos, C. Plastic fluid flow parameters identification using a simple squeezing test. Appl. Rheol. 2003, 13, 132–141. [Google Scholar] [CrossRef]
Figure 1. Direct shear test (schematic diagram).
Buildings 12 01190 g001
Figure 2. Schematic for tri-axial test setup (a) and the principal stresses acting on a specimen (b).
Buildings 12 01190 g002
Figure 3. Ram extruder schematic and the actual setup.
Buildings 12 01190 g003
Figure 4. Typical ram force vs. ram displacement plot for the ram extrusion test.
Buildings 12 01190 g004
Figure 5. Squeeze flow test setup and schematic for material flow (rough boundary conditions).
Buildings 12 01190 g005
Figure 6. Test setups/schematic diagrams.
Buildings 12 01190 g006
Figure 7. Rheometer test results of (a) hysteresis loop curves, (b) static yield stress evolution with time.
Buildings 12 01190 g007
Figure 8. Slump test.
Buildings 12 01190 g008
Figure 9. Slump height and flow percentage variation with yield stress.
Buildings 12 01190 g009
Figure 10. Direct shear test (linear Mohr–Coulomb envelopes).
Buildings 12 01190 g010
Figure 11. Orifice extrusion pressure vs. mean shear rate.
Buildings 12 01190 g011
Figure 12. Viscosity variation with the mean shear rate (orifice extrusion).
Buildings 12 01190 g012
Figure 13. Squeeze test (F* vs. h/R response and the perfect plastic behavior) for (a) Mix M0, (b) Mix M0.1 and. (c) Mix M0.3 [21].
Buildings 12 01190 g013
Figure 14. Yield stress evolution with concrete age (squeeze test).
Buildings 12 01190 g014
Figure 15. Yield stress evolution with time from vane shear test.
Buildings 12 01190 g015
Figure 16. Yield stress variation of the mixes compared to the rheometer yield stress.
Buildings 12 01190 g016
Figure 17. (a) Discharge rate vs. rotational speed; (b) relative power consumption vs. rotational speed; (c) I p index vs. rotational speed variation.
Buildings 12 01190 g017
Figure 18. Buildability of 3D printed columns.
Buildings 12 01190 g018
Table 1. Rheology testing methods for concrete according to NIST.
CategoryDefinition [58]
Free Flow Tests
  • Slump Test
  • Slump Flow Test
  • Cone Penetration Test
  • J-Ring Test, etc.
  • Flow Trough Test
  • Kelly Ball Test
  • Modified Slump Test Moving Sphere Viscometer Ring Penetration Test
The material either flows under its own weight, without any confinement, or an object penetrates the material by gravitational settling.
Confined Flow Tests
  • L-Box Test
  • Compaction Factor Test
  • V-Funnel Test
  • Free Orifice (Orimet) Test
  • K-Slump Test
The material flows under its own weight or under applied pressure through a narrow orifice.
Vibration Tests
  • Flow Table Test
  • Compaction Test
  • Vibropenetrator
  • Thaulow Tester
  • Vebe Consistometer Vertical Pipe Apparatus Vibrating Slope Apparatus
The material flows under the influence of applied vibration. The vibration is applied by using a vibrating table, dropping the base supporting the material, an external vibrator, or an internal vibrator.
Rotational Rheometers
  • BML Viscometer
  • BTRHEOM Rheometer
  • IBB Rheometer
  • Viskomat XL and NT
  • ICAR
High-precision, continuously-variable shear instruments in which the test fluid is sheared between rotating cylinders, cones, or plates, under controlled-stress or controlled-rate conditions.
Table 2. Penetration test methods, description, and analytical models for yield stress measurement.
Penetration Test MethodDescription of the TestYield Stress ( τ 0 ) Measurement
Vicat needle
(ASTM C191-19)
  • The loaded needle (300 g and 1 mm diameter) penetrates, and the depth of penetration is measured.
  • Initial setting time at 25 mm penetration depth.
  • Final setting time at 0 mm penetration depth.
  • Effective for mixes with smaller particle sizes (pastes) when measuring the yield stress.
τ 0 = 3 2 π r h
r = Vicat needle radius
h = Penetration depth under 300 g load
Penetrometer
(ASTM D3441-79)
  • Typically used in geotechnical applications as an onsite soil testing method.
  • The force ( F ) required to maintain a given speed is measured.
  • The needle tip can be wider than the connecting rod.
  • Can be used for paste mixes and mortar mixes as well for the yield stress measurements, due to the larger needle sizes.
τ 0 = F 3 π r 2 for Hemispherical penetrometer with radius r
τ 0 = F 3 π r 2 + 2 π r h for Hemispherical penetrometer with radius r and connected cylinder of height h
τ 0 = F π r r 2 + h c 2 + 2 π r h for Conical penetrometer with radius r , connected cylinder height h , and cone height of h c
Penetration needle (ASTM C403/403M)
  • Used for measuring the initial and final setting times of concrete.
  • The force required to penetrate the needle to a 25 mm depth (within 10 ± 2 s) is recorded. Need to conduct the test at least for 6 time periods (to plot the penetration resistance vs. time on the log scale).
  • The time taken to reach the penetration resistance of 3.5 MPa and 27.6 MPa is considered as the initial and final setting times, respectively.
Table 3. Comparison of the rheology testing methods used in 3DCP.
Rheology Testing MethodMeasurable Rheological ParametersProsConsReferences
Rotational rheometersYield stress (static and dynamic)
Viscosity
Structural build-up rate ( A t h i x )
Storage modulus (SAOS only)
Loss modulus (SAOS only)
  • Standard test method.
  • Fully automated and easily doable.
  • Full flow curves can be achievable.
  • Can use single batches to conduct the yield stress measurement with time.
  • Can easily achieve the rheological parameters.
  • Expensive.
  • Not enough torque capacity to measure the yield stresses of the firm cement-based material.
  • Shear localization, plug flow, wall slip, and tunneling effects can occur.
  • Difficulties of measuring static yield stress in high thixotropic material.
  • Difficulties in including larger aggregates.
[63,64,65,66,67,68,69,70,71,72,73,74,75,76,77,78,79,80,81,82,83,84]
Slump testYield stress
  • Standard test method for concrete.
  • Can do onsite.
  • Easily doable.
  • Comparatively cheaper.
  • Single point test. Hence, cannot achieve a full flow curve.
  • Less sensitive for 3DCP mixes (nearly a zero slump theoretically).
[60,61,62,63,64,65,66]
Flow table test-
  • Standard test method for concrete.
  • Easily doable.
  • Cannot achieve any rheological parameter. Only for comparing different mixes.
[59,67,68,69,70]
Direct shear test
  • Cohesion/Yield stress
  • Friction angle
  • Dilation angle
  • Can measure the frictional parameters.
  • Can measure the normal stress effect on shear stress.
  • Can measure the post-yield behavior such as dilation.
  • Fully automated in some instances.
  • Cannot achieve a flow curve. Only static conditions can be considered.
  • Water drainage can occur for high w/c ratio mixes under normal stress.
  • Cannot use a single sample/single batch to perform multiple tests.
  • Not a standard test method for concrete.
[18,20,93,94,95,96,97]
Vane shear testYield stress
A t h i x
  • Cost-effective method.
  • Easily doable.
  • Can be conducted as an onsite method.
  • Can use a single batch (a large sample) to get multiple measurements.
  • Fully automated in some instances.
  • Can eliminate wall slippage.
  • Not a standard test method for concrete.
  • Cannot achieve a flow curve.
  • Only the static yield stress and A t h i x parameters can be achieved.
  • Plug flow can occur for large samples in some instances.
[18,102,103]
Tri-axial testCohesion/Yield stress
Friction angle
Dilation angle
Elastic modulus at an early age
Compressive strength at an early age
  • Can measure the frictional parameters, dilation behavior, compressive strength, and the elastic modulus in the same test.
  • Can measure the normal stress effect on shear stress.
  • Fully automated in some instances.
  • Not a standard test method for concrete.
  • Difficulties in sample preparation.
  • Difficulties in measuring time-dependent yield stress at a very early age.
  • A long time is taken for completion. It may not be suitable for fast-setting mixes.
  • Cannot achieve the flow curves.
  • Sample compaction may overestimate the measured properties.
  • Need to use multiple samples to assess time-dependent material properties.
[92]
Ram extrusion testUniaxial yield stress
Shear yield stress
Flow consistency and Flow index (viscosity)
  • Useful rheological parameters specific to the extrusion process can be achieved.
  • Similar shear rates as in extrusion can be used in the test.
  • Material flow curves can be achieved.
  • Consistent results can be achieved with a larger barrel diameter to die diameter ratio.
  • Cost-effective method.
  • Not a standard test method for concrete.
  • Liquid migration can occur through the granular medium at low extrusion speeds (or for very firm material).
  • Several tests need to be done to achieve a flow curve.
  • There can be difficulties in measuring time-dependent material properties.
  • Simple analytical models are based on visco-plastic material or perfectly plastic material. 3DCP mixes can exhibit frictional visco-plastic behavior.
[15,16,29,107,108,109,110,112,113,114,115,116,117,127]
Squeeze flow testElongational yield stress
Cohesion
Friction angle
Viscosity
  • Useful rheological parameters specific to the extrusion process can be achieved.
  • Easily doable.
  • Time-dependant material properties can be easily measurable.
  • Cost-effective method.
  • Not a standard test method for concrete.
  • Liquid migration can occur through the granular medium at low extrusion speeds.
  • Preparation of the specimen has limitations and difficulties at a very early age.
  • Only a single specimen can be used for one test.
  • Simple analytical models are based on visco-plastic material or perfectly plastic material. 3DCP mixes can exhibit frictional visco-plastic behavior.
  • Sample compaction may overestimate the measured properties.
[108,118,119,122,123]
Penetration testYield stress
A t h i x
  • Fully automated in some instances.
  • Easy sample preparation due to the small samples used.
  • Can be used as an onsite method.
  • Standard test method for concrete.
  • Useful for assessing structural build-up of 3DCP in reinforcement insertion methods.
  • Cannot incorporate larger aggregates.
  • Not suitable for zero slump concrete.
  • Cannot achieve the flow curves.
  • Sample drying out can cause errors due to smaller penetration depths.
[120,121,124]
Table 4. Mix constituents used (except nano clay).
CementSilica Fume *Coarse Sand *Fine Sand *Water *Superplasticizers
(mL/100 g of Binder)
Retarders
(mL/100 g of Binder)
10.110.561.110.240.80.4
* mass ratio per 1 kg of cement mass.
Table 5. Testing time frame.
Batch NumberTime after Mixing until Starting the Activity
(Seconds)
ActivityAverage Time per Test/Activity (Seconds)
160* Rheometer test (static yield stress evolution—multiple samples)120
60* Vane shear test (static yield stress evolution—single batch)60
60* Slump test120
260* Vane shear test (static yield stress only)60
120* Direct shear test180
150Mixing the material again (high shear)60
Similar to the aboveTesting for vane and direct shearSimilar to the above
360* Vane shear test (static yield stress only)100
60* Orifice extrusion100
460* Vane shear test (static yield stress only)100
60* Squeeze test30
60* Flow table test 60
560* Vane shear test (static yield stress only)60
60* Rheometer test (hysteresis loop test)130
* Parallelly completed tests per single batch.
Table 6. Rheological parameters from ram extrusion.
MixUniaxial Yield Stress— σ 0
(kPa)
Flow Consistency— k (kPa.sn)Flow Index— n
M04.92.91.0
M0.19.510.10.5
M0.327.512.40.5
Table 7. Summary of the rheological parameters achieved from different tests.
MixTest Method
RheometerSlump TestDirect Shear TestOrifice ExtrusionSqueeze TestVane Shear Test
Static Yield Stress
(kPa)
Dynamic Yield Stress
(kPa)
Viscosity
(kPa.s)
A t h i x
(kPa.min−1)
Yield Stress (kPa)Cohesion
(kPa)
Uniaxial Yield Stress (kPa)Average VISCOSITY
(kPa.s)
Yield Stress (kPa) A t h i x
(kPa.min−1)
Yield Stress (kPa) A t h i x
(kPa.min−1)
M00.90.40.0350.021.42.34.92.93.60.091.10.051
M0.11.40.50.0420.022.13.59.524.96.50.213.00.053
M0.23.80.80.0460.062.36.427.532.813.20.444.40.240
Table 8. Prediction of failure layer number using rheological parameters from different testing methods.
MixFailure Layer Number from theBuildability TestFailure Layer Number Predicted
Rheometer ParametersVane Shear TestDirect Shear Test (Initial Cohesion and A t h i x from Rheometer)
M021296799
M0.1160128237177
M0.3320 +429No failure600
+ failure did not occur.
Publisher’s Note: MDPI stays neutral with regard to jurisdictional claims in published maps and institutional affiliations.

