Article

A Grammar-Based Optimization Approach for Designing Urban Fabrics and Locating Amenities for 15-Minute Cities

1
O’More College of Architecture and Design, Belmont University, Nashville, TN 37212, USA
2
Stuckeman Center for Design Computing, The Pennsylvania State University, University Park, State College, PA 16802, USA
3
Department of Architectural Engineering, The Pennsylvania State University, University Park, State College, PA 16802, USA
*
Author to whom correspondence should be addressed.
Buildings 2022, 12(8), 1157; https://doi.org/10.3390/buildings12081157
Submission received: 30 June 2022 / Revised: 27 July 2022 / Accepted: 1 August 2022 / Published: 3 August 2022

Abstract

:
Providing pedestrian accessibility to urban services is a big challenge and a key factor in creating more walkable urban areas. Moreover, it is a critical aspect of climate-resilient urban planning as it is broadly assumed that neighborhoods with greater walkability discourage automobile use and reduce CO2 emissions. The idea of 15-minute cities, defined as urban environments where most places that residents need to access are within a 15-minute walk, is gaining increasing attention worldwide. Because aspects of urban performance are increasingly quantifiable, generative, and data-driven design approaches can explore broader sets of potential solutions, while optimization can help identify designs with desired properties. This work demonstrates and tests a new approach that combines shape grammars, a formal method for shape generation that facilitates the elaboration of complex patterns and meaningful solutions, with multi-objective optimization. The goal was to optimize the design of urban fabric layouts and the location of amenities to provide 15-minute neighborhood configurations that minimize infrastructure cost (as estimated by cumulative street length) and the number of amenities, while maximizing pedestrian accessibility to urban services (as assessed by overall integration and the average distance from all plots to nearest amenities).

1. Introduction

Automobile dependency combined with urban population growth has resulted in significant challenges in cities worldwide. Increasing CO2 emissions, noise pollution, traffic jams, and social segregation are among the most harmful and severe impacts in contemporary urban life [1,2,3]. Cities are home to 56% of the world’s population [4] and are accountable for more than 70% of global CO2 emissions, while fuel combustion in automobiles creates up to 75% of urban air pollution [5]. Thus, designing areas where most daily needs can be accessed by either walking or cycling has been progressively adopted as a necessary premise regarding the current urban planning agenda.
The concept of 15-minute cities relies on locating urban services within walkable and bikeable distances from all places in a neighborhood. It envisions more sustainable communities by promoting proximity, diversity, density, and ubiquity, requiring a social, environmental, and urban reconfiguration of communities. The ultimate goal is to obtain neighborhoods with short perimeter access to essential social functions such as living, working, supplying, caring, learning, and enjoying [6].
The term 15-minute city was first coined in 2016 by Carlos Moreno [7]. Its main logic can be found in similar approaches that rely on “Spatio-temporal” metrics, such as the 15-minute walkable neighborhood proposed by Weng et al. [8] and the 20-Minute City model, explored by Da Silva et al. [9]. Cities such as Paris, Melbourne, Portland, and Bogotá have implemented urban models of neighborhoods that can be traversed in a few minutes [6].
At the same time, the advent of novel technologies within the urban design framework has brought a whole new set of possibilities for assessing the efficiency and performance of cities. As the 15-minute city concept relies on measurable features for evaluating its performance, computational approaches can contribute to the improvement of proposals within this scope. This work focuses on exploring computation to support decision-making concerning the layout of urban fabrics and the location of amenities in a neighborhood. These two critical features of pedestrian accessibility [8], essential for promoting 15-minute urban areas, are used to generate fabrics that minimize physical and topological distances to basic urban needs while reducing the street network length, a proxy for infrastructure costs.
The proposed grammar-based approach to the generation of urban fabrics falls within the category of discursive grammars [10,11], which are grammars that can generate designs that are both syntactically and semantically adequate, meaning that they match the design context, or in other words, they satisfy user and site requirements. Frameworks that implement a discursive grammar typically include a generative system to produce candidate solutions, an evaluation system to rate and rank the solutions, and a search mechanism to browse the design space in search of the most adequate solutions.
In previous work [12], we have shown a grammar-based optimization approach to generate fabrics that simultaneously minimize the physical distance between locations in a neighborhood, considering Physical Proximity Index [13,14] and its street network length. In sequence [15], we have investigated the generation of optimal urban grid layouts, considering both the Physical Proximity Index and topological measures from Space Syntax [16] like integration and connectivity. These works, however, focused just on generating and evaluating fabric layouts without addressing the location and distribution of facilities or desirable secondary goals between them, such as minimizing the distances between schools and parks, maximizing the distance between bars and schools, and prioritizing the location of retail in corners.
The work described in this article is focused on the design of new urban fabrics for 15-minute cities, that is, cities in which most amenities and other targets sought by people in their daily life are within a walking distance. In the assessment of walkability, we considered both dimensional (length) and topological (number of turns) measurements of physical and psychological distance, as proposed in Space Syntax and other urban planning and design literature concerned with walkability and accessibility. Shape grammars provide a suitable basis to develop a generative design system for this purpose because of their ability to generate solutions with dimensional and topological variation, thus yielding diverse solutions in potentially wide design spaces. They are thus used as the backbone of the generative system. Dimensional and topological measurements of walkability are encoded into the evaluation system. The coupling of shape grammars with space syntax was first proposed by [17] for the mass customization of housing but is applied to urban design in the present work. The use of optimization in the design of housing was introduced by [18], and the current work extends such research by utilizing optimization to find the best solutions in urban design.
For the application of the framework combining a grammar-based generative system with evaluation and optimization to the retrofitting of existing urban fabrics see, for instance, [19].
This paper aims to address the above limitations in the proposed grammar-based optimization approach. By developing and improving the design method, this research seeks to support proposals for 15-minute urban areas. We are interested in gaining a better understanding of how to maximize the overall integration of a given urban fabric while minimizing its street network length and maximizing the location of amenities, simultaneously considering physical and topological proximities and attending to a set of desirable secondary goals. To this end, we present an approach using a generative system combining (1) a parametric urban grammar interpreter, (2) a set of computational tools to assess conflicting metrics such as Physical Proximity Index, Space Syntax integration, and street network length, with (3) multi-objective optimization algorithms. The goal of the demonstrated method is to find urban arrangements that maximize proximity (from both physical and topological viewpoints) while minimizing the infrastructure cost and additional secondary goals. A shape grammar depicting the urban fabric of Chicago (one of the top 10 cities in the world with the largest carbon footprints) is used to (1) to ground the research on an existing, recognizable grid type to avoid generating designs that could be perceived as inappropriate, (2) address an orthogonal grid, paradigmatic of American cities, and (3) compare the performance of the obtained fabrics with an existing area.
In the proposed approach, design flexibility exists on three levels. In general terms, it exists in the selection of rules to generate different urban fabric types—orthogonal, organic, etc. The current research is focused on orthogonal grids, namely, Chicago’s grid, but for other grid types see [12,15,20]. In the case of the Chicago grammar, flexibility exists in how the rules are applied to generate regular or irregular grids [12,20]; for instance, in the subdivision of large blocks into small blocks, as shown in Section 2. Flexibility also exists in how the amenities are distributed within the selected grid. In the current approach it is used a two-step sequential optimization, with the grid layout being optimized first and the amenity distribution later. This decreases the complexity of the optimization process, but it may constitute a limitation, as theoretically it may miss designs with a higher overall score in which the grid layout might not be optimal. To overcome this limitation, concurrent optimization can be explored in the future.

2. Materials and Methods

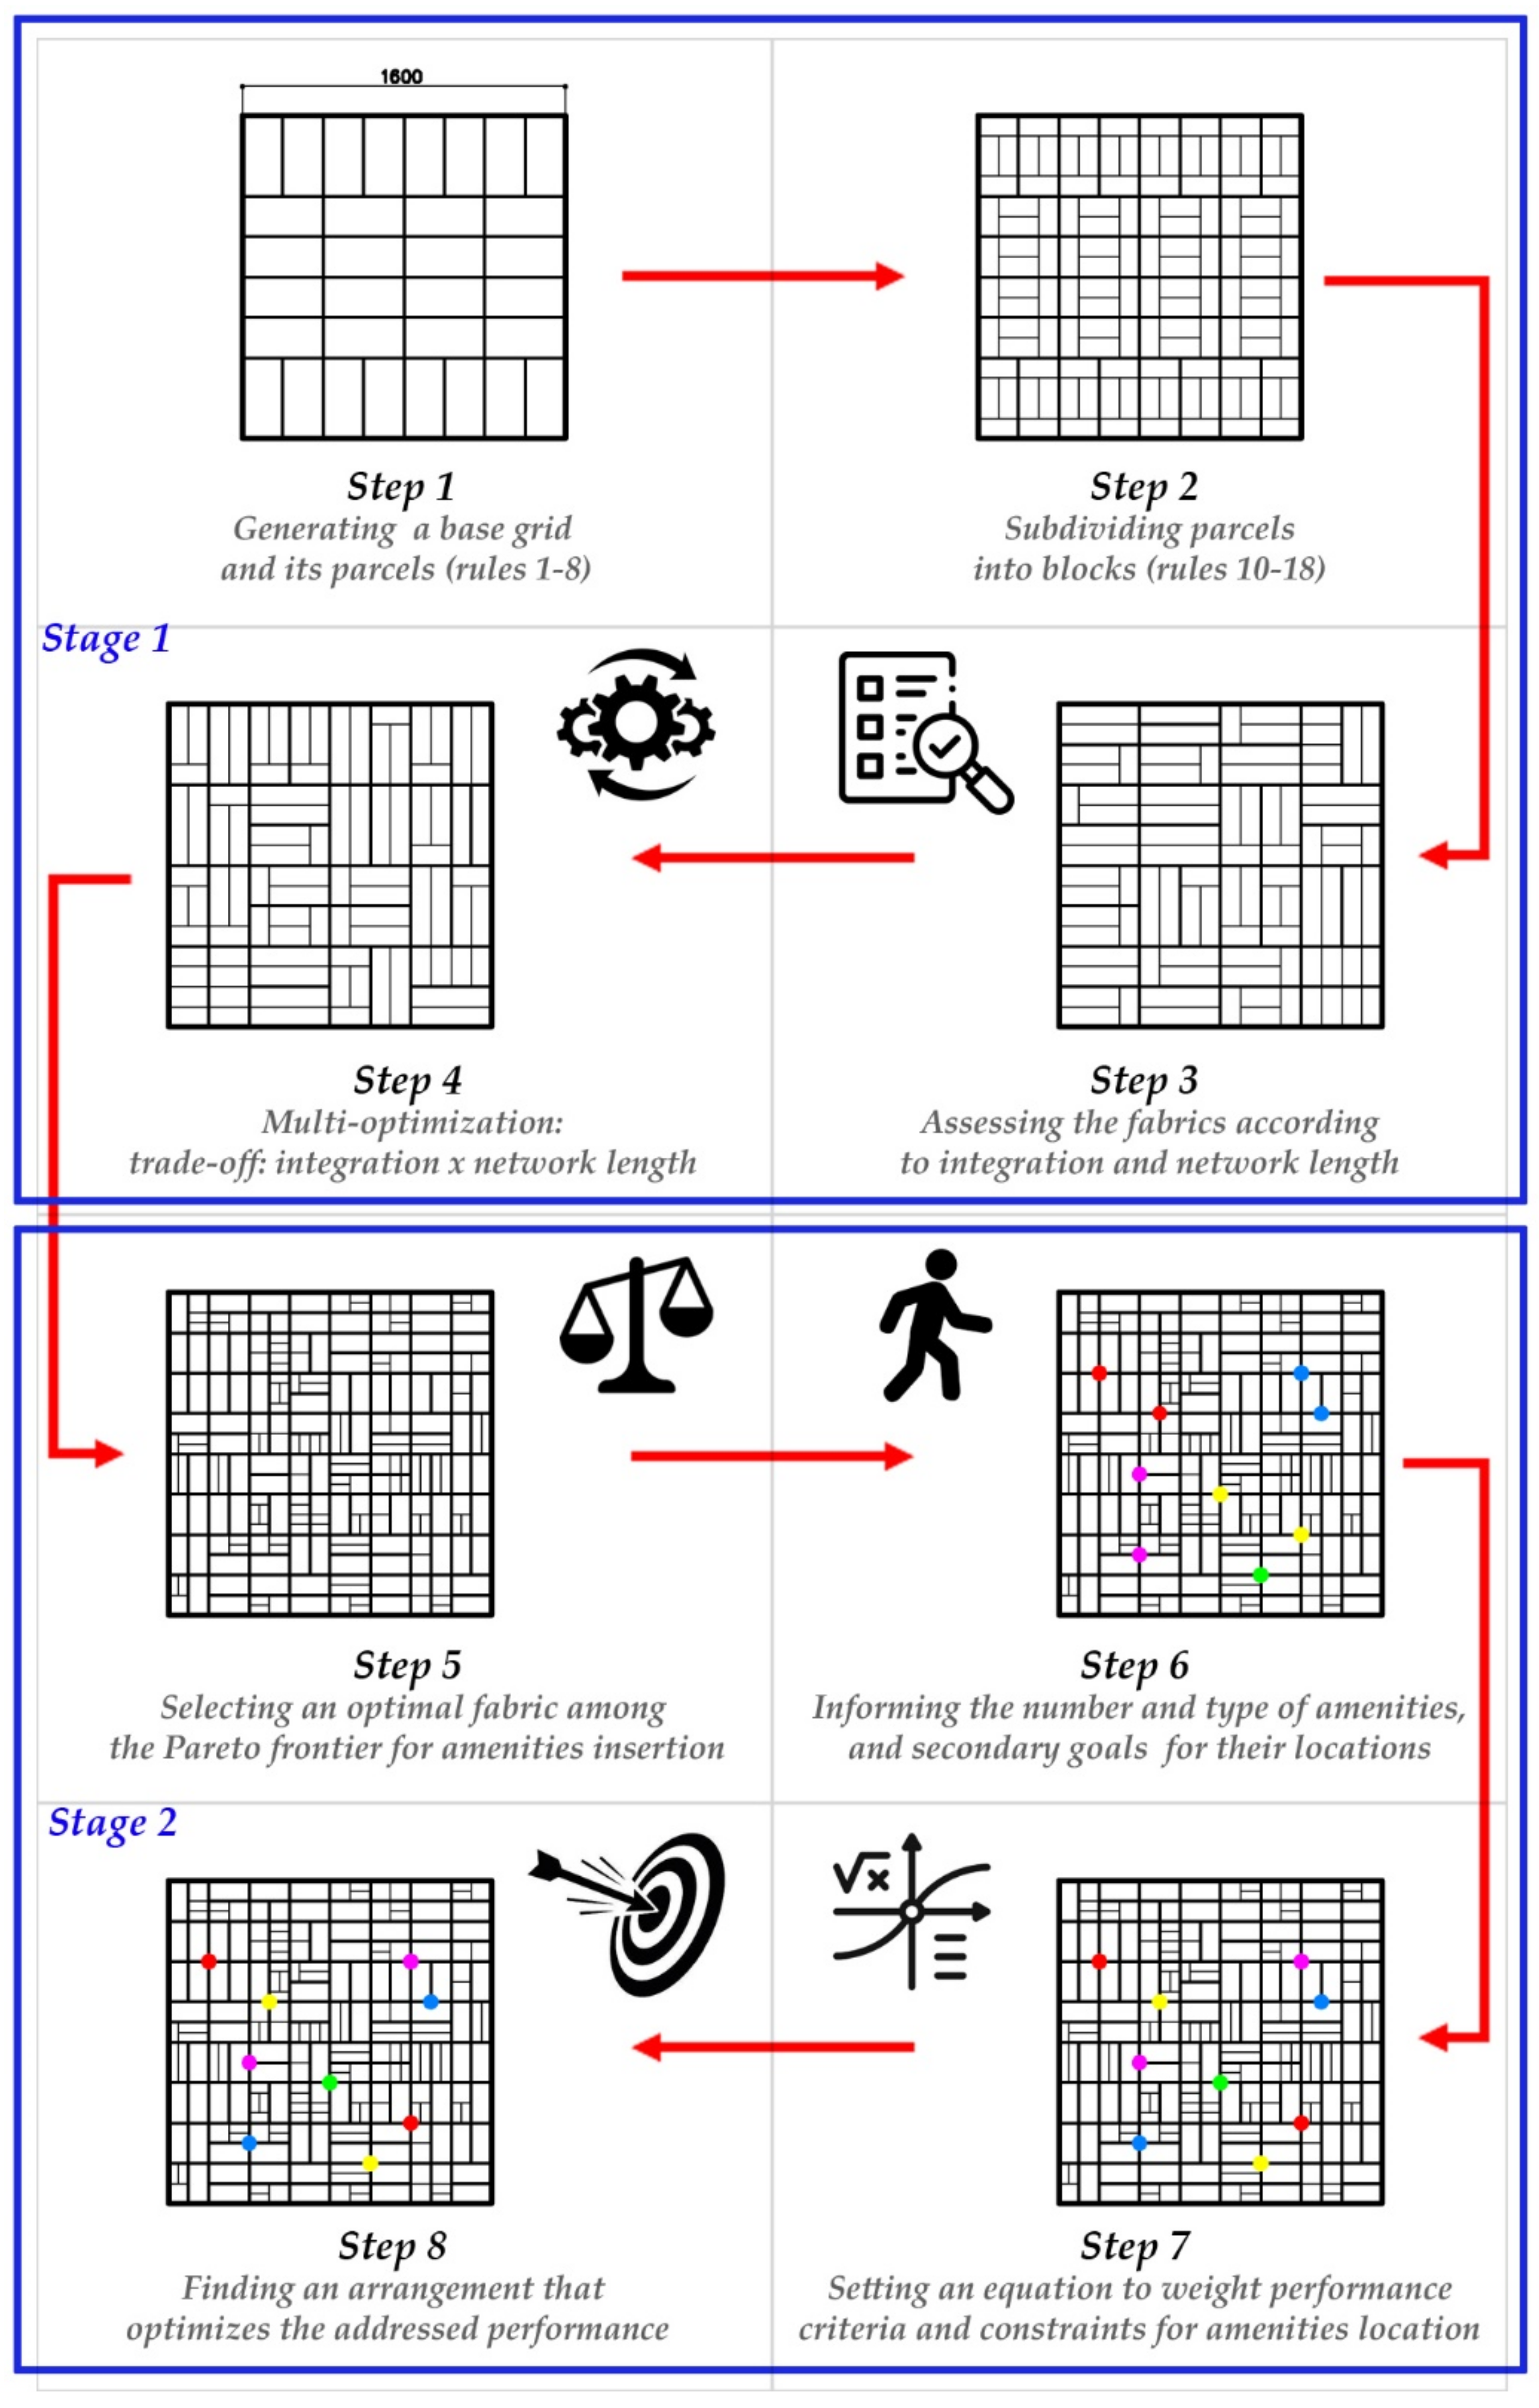
2.1. Parametric Urban Grammar Interpreter: Chicago Urban Grammar

Shape grammars are systems of simple visual rules used to transform one shape into another [20,21], which include an initial state, a set of instructions, and a termination condition. They support the exploration of designs within an existing design language, by providing the means to describe their generation, or the production of new design languages. Although their use is still more prominent in architecture, shape grammars have been increasingly used at the urban design scale [12,22,23,24,25,26], due to software and hardware improvements that have supported their use for flexible urban planning in recent years.
This work builds on the parametric implementation of the Chicago Urban Grammar developed previously [12]. The logic behind Chicago’s urban fabric was encoded into a shape grammar and then translated into a parametric system to support the generation of urban fabrics within the design language defined by the grammar.
The Chicago Urban Grammar consists of two sets of rules. The first set defines the compositional structure of Chicago’s street grid (Rules 1–6) and the orientation of blocks (Rules 7 and 8). It is used to create a series of perpendicular (vertical and horizontal) axes, creating a square grid of half a mile (roughly 800 m). These axes define the city’s major streets and establish proper subdivision operations resulting in standard blocks of 330 by 660 feet (approximately 100 m × 200 m) that can be oriented vertically or horizontally. Thus, this first set of rules can create urban plans that vary from four east-west blocks by eight north-south blocks to eight east-west blocks by four north-south blocks and all the combinations in between.
The second set of rules (Rules 10–18) defines alternatives for block arrangements by inserting alleys and dividing blocks into parcels that can then be further divided into plots. Additional rules can be utilized for deleting street segments when needed. Different applications of these rules result in various urban fabrics within the Chicago language. The resulting fabric layouts can be evaluated and optimized according to several performance-related metrics. In the context of this work, we consider Physical Proximity, integration, and street network length as metrics. Figure 1 depicts the two sets of rules and some example fabrics within the Chicago Urban Grammar.

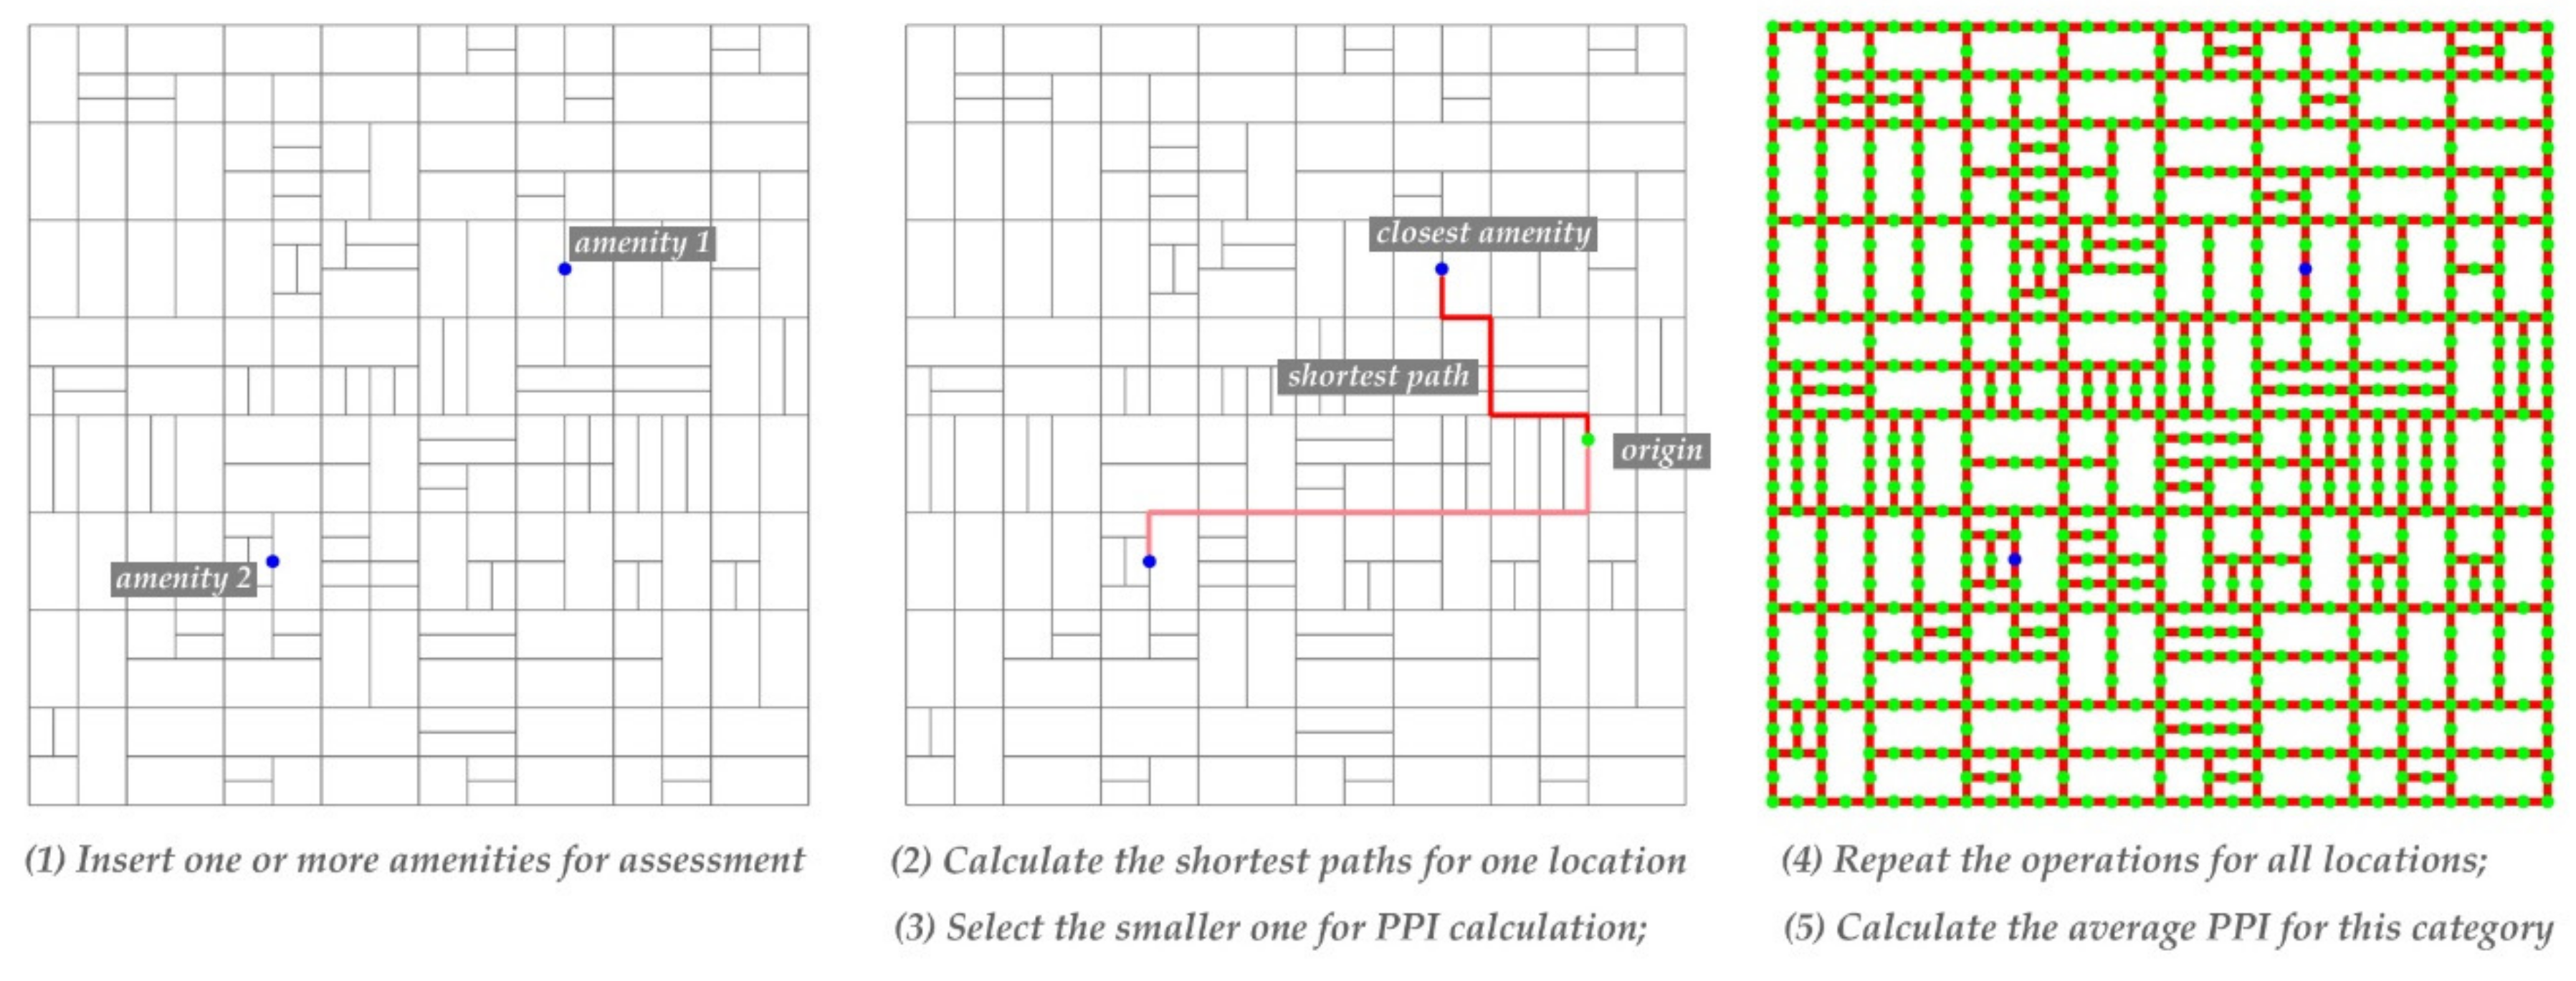
2.2. Physical Proximity—A Metric for Pedestrian Accessibility

Several scholars have assumed that pedestrian accessibility, as estimated by the proximity to everyday urban services, has substantial implications for the walkability of an urban area [27,28,29,30,31,32]. As the likelihood of walking trips decreases with greater distances [33], a robust body of research has estimated pedestrian accessibility by calculating distances to facilities, focusing on grid layout and the location of amenities.
This work employs the Physical Proximity Calculator (PPC), a CityMetrics tool developed by Lima [13], to measure pedestrian accessibility. The PPC computes the smallest distance between two or more points of interest, assigning a Physical Proximity Index (PPI) on a scale of 0–1. For example, a 400 m or less distance between two spots corresponds to a PPI of 1. The index decreases as the distance approaches 1600 m and is 0 when the distance becomes greater than 1600 m. Our experiments aim to estimate and optimize pedestrian accessibility. We use the PPC to calculate the PPIs between each block and identify possible locations for amenities considering six categories of urban services: educational (elementary and middle schools), food (bars and restaurants), retail (stores), entertainment (theaters), recreation (parks), and “others” (banks, gyms, etc.). Other categories can be considered in the proposed methodology, depending on the researcher’s goals. Figure 2 depicts the PPC procedure considered in this work.

2.3. Integration

Integration is a syntactic measure from Space Syntax, a set of techniques introduced by Hillier and Hanson [16] to model and analyze spatial configurations and understand social dynamics. Space Syntax advocates that spaces can be decomposed into system components, such as maps and graphs, that permit to assess different features (syntactic measures) related to these spaces. Integration captures how close one space is to everything else in an urban system, referring to the to-movement potential [34,35,36]. In other words, it is a normalized measure of distance from any place to all others in a system, similarly to how closeness centrality works in network science [35]. In theory, it shows the cognitive complexity of reaching a street, allowing one to predict its pedestrian importance by assessing how close one street segment is in relation to all others in a system.
The importance of coupling integration with Physical Proximity to assess pedestrian accessibility relies on the fact that, in addition to being physically accessible (providing smaller physical distances to basic urban amenities), a neighborhood should also provide smaller topological distances between its locations; that is, fewer street turns, aiming at more connected and legible fabrics [15]. Legibility, considered by Kevin Lynch [37] a major quality of a city, is a key feature that integration helps to assess, so we incorporate it in this study.

2.4. Street Network Length as a Proxy for Pedestrian Accessibility and Infrastructure Cost

It is hypothesized that pedestrian accessibility increases as fabrics become denser as the likelihood of connecting destinations through shorter routes rises within more extensive street networks. Sevtsuk et al. [27] concluded that when various dimensions for plots, block length, and street width are mixed, fabrics with smaller blocks provide higher pedestrian accessibility than the ones with larger blocks. Accordingly, Zhao et al. [38] confirmed that orthogonal street grids with high street density present greater accessibility, while Stahle et al. [39] explored the distribution of land uses while addressing physical proximity and Space Syntax. Feng and Peponis [40,41], in turn, explored different street network and grid typologies.
At the same time, as assessed by the network street length, infrastructure cost proportionally rises with the density of fabrics, defining a trade-off to be addressed toward less CO2 emitting and more climate-resilient cities—which is a primary goal of 15-minute cities. According to the American Road and Transportation Builders Association [42], the cost of constructing new roads can range from $2.8 million to $11.2 million per mile, depending on the location, the number of lanes, and the type of road. Therefore, the street network length is the third performance metric we explore in our proposed approach.

2.5. Computational Optimization in Urban Contexts

Computational optimization methods and tools to support design tasks have improved substantially in recent years. Their use on the urban scale is still limited compared to architecture due greater complexity and computational requirements. However, many scholars have explored optimization as a tool to discover potentially improved urban designs from several viewpoints [14,15,20,43,44]. In our work, we understand optimization as a resource for finding possibilities or even directions for further exploration and refinement instead of a deterministic approach to choose a single, perfect solution.
The proposed approach encompasses both single and multi-criteria optimization, depending on the goals and context. It uses several tools encoding different algorithms to generate optimized urban fabrics (multi-criteria) and locate amenities while attending to PPI, integration, and certain secondary goals (single criteria supported by a weighting equation).
In summary, we considered three Grasshopper optimization tools (Radical [45], Opossum [46], and Wallacei [47]) and their potential to implement the four following algorithms: (i) Radical—SBPLX; (ii) Opossum—RBFOpt; (iii) Opossum—CMAES, and; (iv) Wallacei—NSGA-2. The algorithms have varying strengths and weaknesses for different problem types. The algorithm SBPLX is a variant of the numerical Nelder-Mead simplex optimization method, RBFOpt builds and iteratively refines a surrogate model to reduce the number of simulations required during optimization, and CMAES and NSGA-2 are evolutionary strategies that create progressively better generations of possible design outcomes. As explained in below, these algorithms were utilized in two different stages of the proposed approach.

2.6. A Grammar-Based Optimization Approach for 15-Minute Fabrics—Exploring Pedestrian Accessibility and Infrastructure Cost

As mentioned above, the proposed approach combined a parametric interpreter for generating urban fabrics within a specific language and a set of computational tools developed to assess their performance within a multi-objective optimization framework. The approach included two main optimization stages. The first drove the generation of fabrics belonging to the Chicago Urban Grammar, maximizing their integration while minimizing street network length. The second stage focused on selecting an optimal fabric and finding optimal locations for different amenities while considering desired secondary goals. To this end, a workflow of eight steps was established, including the two optimization stages, as depicted in Figure 3: (1) the generation of a base grid and its parcels using the Chicago Urban Grammar rules 1 to 8; (2) the subdivision of the base grid parcels into blocks by inserting additional streets and alleys, according to the rules 10–18; (3) the assessment of the generated fabrics considering integration and street network length; (4) the multi-optimization step addressing the trade-off between the overall fabric integration and street network length (using Wallacei X); (5) the selection of one optimal fabric among the best solutions found (Pareto-frontier); (6) the elaboration of an algorithm informing the types and number of amenities to be located on the fabric and a collection of secondary goals (established by the users) to drive this location; (7) the setting of an equation that weights the performance criteria and secondary goals into a single fitness function for assessing the amenities distribution; and (8) the optimization step (testing SBPLX, RBFOpt, and CMAES) locating all amenities while maximizing pedestrian accessibility and attending to additional desired secondary goals.

3. Case Study

We explored a case study addressing an existing neighborhood in Chicago to test our grammar-based optimization approach. The main goal was to generate an alternative neighborhood configuration that maximized pedestrian accessibility, minimized the infrastructure cost, and attended to a set of desirable secondary goals. Considering the idea of 15-minute cities and the Chicago Urban Grammar framework, we opted for a one-mile square sample area. We did not consider the influence of nearby amenities located outside the studied fabric, although we recognize that they play an important role. The guidelines for determining the sort and number of amenities were extracted from the actual neighborhood features. At the end of the experiment, the existing site and the proposed one were compared.

3.1. Area of Study

The city of Chicago can be divided according to three different categories: wards, neighborhoods, and community areas. According to the City of Chicago website [48], a ward is a political district whose boundaries change after each United States census to reflect population shifts within the city and ensure that each ward has approximately the same population and representativity. Similarly, Chicago neighborhood names and boundaries can change over time. Different people may have different perceptions of specific neighborhood names and locations, and the city government does not recognize neighborhood boundaries for any official purposes. Community area boundaries, in turn, do not vary over time, meaning that information about the city can be consistently collected and analyzed over long periods. Chicago is divided into seventy-seven community areas, amongst which we selected Portage Park, a walkable-residential neighborhood located on the northwest side of the city.
According to the Chicago Metropolitan Agency for Planning [49], Portage Park has a population of 63,020 inhabitants, a population density of 15,834 hab/sq mile, and 100% of its population in areas of high walkability. In addition to that, it has a relatively large territorial area, allowing us to explore a one-mile square for the experiment. The idea was to test our approach’s potential in a highly walkable area and search for improvements within this context. Figure 4 illustrates the location of Portage Park, its boundaries, fabric, and the area we are addressing in the experiment.

3.2. Experiment

The experiment tests the grammar-based optimization approach by implementing two subsequent stages. The first consisted of generating an alternative fabric for the study area, maximizing its overall integration while minimizing its infrastructure cost. The second stage was to identify optimal locations for amenities within the fabric selected from the first stage, seeking to simultaneously: (1) maximize the average Physical Proximity between all the sites in the area and their nearest amenities, considering six categories (education, retail, food, entertainment, recreation, and others), (2) insert the amenities in street segments with higher integration, thereby maximizing their overall topological proximity, and (3) comply with a set of desired secondary goals between them (minimize the distances between food and retail, schools and recreation, retail and other, entertainment and food, and maximize the distances between schools and bars).
Additionally, it was established that retail should be on the corners and education should not so that we could ensure more accessibility to the former and more privacy to the latter. The criteria for choosing the number of amenities for each category followed the current Portage Park ratio for education, recreation, and entertainment [48]. A minimum number of four facilities for retail, food, and other categories was also established. Due to the 15-minute city concept and the scope of the study, which aimed at the distributing amenities within a walkable perimeter, it was decided to consider only amenities within the limits of the study area. Nevertheless, it is acknowledged that nearby facilities may serve the site and improve pedestrian accessibility. Consequently, the distribution of amenities was expected to be concentrated in the middle of the neighborhood. Future implementations considering a larger area may result in the distribution of amenities in a larger and continuous fabric. Table 1 summarizes the amenities categories, their numbers, and secondary goals.
Different optimization techniques were considered in the two experimental stages. To first find a fabric layout that addressed the trade-off between integration and infrastructure cost, Wallacei X [47] was used to employ NSGA-II, a common multi-objective evolutionary solver [50]. This tool enables the analysis and selection of one specific fabric from a set of equivalently efficient solutions (the Pareto Frontier).
The second stage consisted of: (1) proposing the amenities distribution visually, aiming to provide a balanced configuration based on their perceptions, and (2) using three different optimization algorithms (CMAES, RBFOpt, and SPBLX) to find optimal amenities distributions while considering several metrics and secondary goals. To accurately weigh the importance of multiple viewpoints, the following equation was developed to define a performance metric incorporating all viewpoints and secondary goals as a single fitness function to be optimized:
Performance metric = 5a + 2.5b + 0.5c + 0.5d + 0.5e + 0.5f + 0.5g
In the above scalarized objective function, a is the normalized average PPI of the neighborhood, b is the normalized average integration of the street segments where amenities are located, c is the normalized average distance between food and retail, d is the normalized average distance between others and retail, e is the normalized average distance between recreation and education, f is the normalized average distance between entertainment and food, and g is the normalized average distance between schools and food amenity number 4 (bar).
Finally, to guide the calculations and better identify the potential locations of the study area, we subdivided each street segment into smaller segments of 50 m. The resulting points of these operations were set as possible locations for the amenities. Figure 5 illustrates this subdivision.

4. Results

4.1. Optimization Step 1 Results—Fabric Layout Definition

Stage 1 optimization procedures lasted 25 h and 15 min on an Intel (R) Core (TM) i9-9900X, 3.50 GHz computer, with 128 GB of installed RAM. It led to 25,000 alternative configurations (500 generations with 50 individuals) for fabric layout. The Pareto frontier consisted of 50 solutions sorted into 31 clusters of designs with the same performance and different configurations. The clustering of designs is due to how the grammatical rules are established and translated through a parametric interpreter, as well as how the objectives are calculated. Because the rules add and take away discrete streets on a rectangular grid, many of the solutions snap to similar performance results. Nevertheless, the optimization algorithm demonstrates an ability to improve solutions over generations. Considering the integration vs. total streets length trade-off, most of the solutions found performed better than the existing fabric. Among the Pareto Frontier solutions, the one that provided the best average integration was selected to proceed to stage 2. This design provided an integration improvement of 0.305 (0.926–0.621) compared to the existing layout, and it decreased the total street length by 14,650 m (=68,400 − 53,750 m), meaning a 27.4 million US dollar cost reduction, following estimate guidelines by the American Road and Transportation Builders Association [42]. Figure 6 illustrates all step 1 solutions and highlights three fabrics from the Pareto Frontier: the one with the highest integration (A), the one with the smallest street length (C), and one solution in between them (B). Figure 7 compares the existing fabric and solution A, the fabric set as input to step 2.

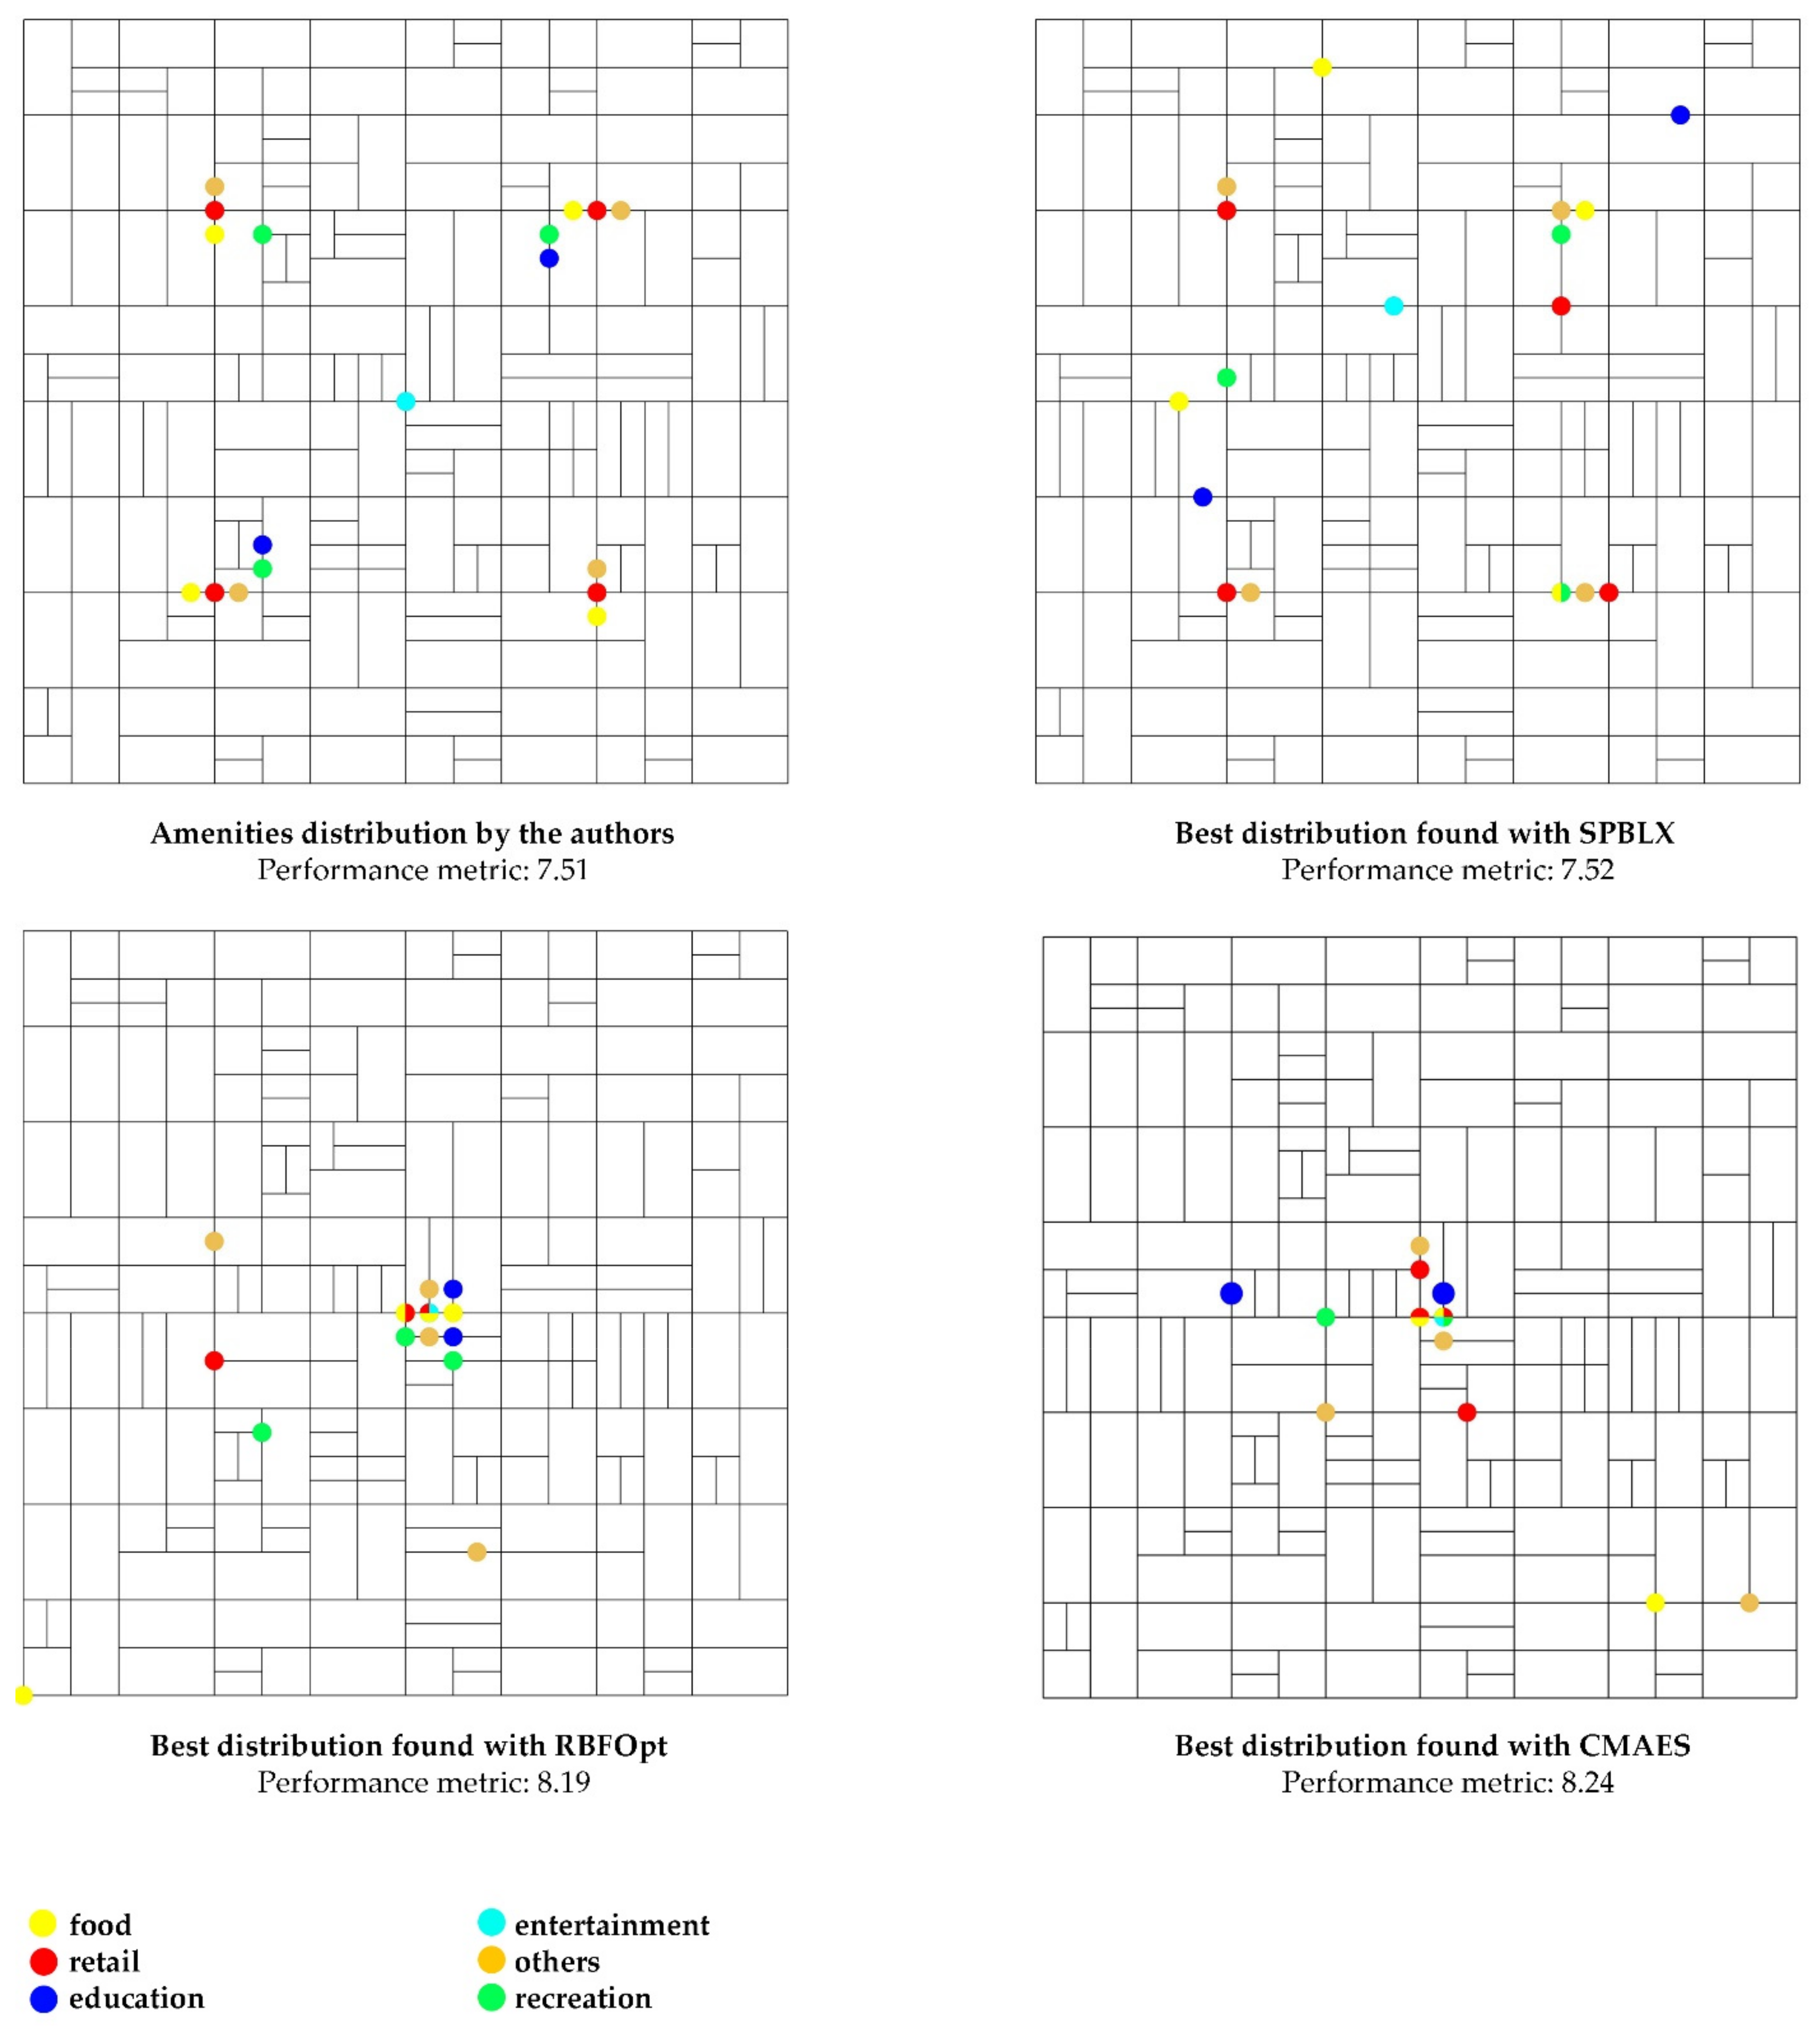
4.2. Optimization Step 2 Results—Distribution of Amenities

As indicated above, optimization step 2 resulted in four different amenities distributions, shown in Figure 8. The distribution manually proposed by the authors, which consisted of an attempt to visually balance the location of amenities within the fabric, had a performance metric of 7.51. This distribution was used as the starting configuration for the SBPLX optimization procedures, as the CMAES and RBFOpt algorithms start with a randomized solution. The best distribution found with this procedure after 4 h returned a configuration with slightly better performance: 7.52. The RBFOpt procedure yielded a configuration with a performance metric of 8.19 (after 8 h), and the CMAES procedure found a configuration with a performance metric of 8.24 (after 8 h). The ranking of solutions according to performance metrics did not correspond to the ranking of solutions considering PPI and integration. Table 2 presents the obtained solutions and their performance.

5. Discussion

Orthogonal grids like the Chicago grid can be extended indefinitely. The proposed approach could be applied to an entire city, but this possibility greatly increased computational and design complexity. As our main goal was to verify the affordances of the approach, it was decided to focus on a one-mile square area, encompassing four super-blocks. This allowed us to study the relationships between super-blocks and the entire area, and super-blocks and smaller blocks, while facilitating comparison with the actual area. In addition, if the entire city was considered, the increase in scale would require the use of other metrics and the consideration of other amenities, proper of such a large scale. Nonetheless, the application of the proposed approach to the entire city could, in fact, mimic its application to the one-mile area, with the relationship between the city and the super-blocks being “analogous” to the relationship between the super-blocks and the blocks, in a hierarchical fashion. In this fashion, the city would be considered as a polycentric entity with semi-autonomous neighborhoods. This would have clear advantages, such as decreasing the need for movements between neighborhoods and facilitating intermediate lockdowns [51] with positive impacts on CO2 emissions and on limiting the spread of infectious diseases [32], respectively. Ultimately, the choice of how to apply the proposed approach would depend on a variety of factors, including, the preferred urban design theory.
Our goal was not to validate shape grammars but to create a framework to support designers in their quest for producing urban designs that are as adequate as possible to the design context, while matching specific design objectives, which in the current case is walkability. It just happens that this goal cannot be achieved by shape grammars alone. This refers to the discussion between strong AI, like rule-based design systems of which shape grammars are an example, and weak AI, like search and learning. There is not enough domain and contextual knowledge to rely solely on shape grammars. Therefore, a hybrid system is proposed. The first work to propose such a system was by Cagan and Mitchell [52], and the concept was formalized by Duarte [10], where a more in depth discussion on the subject can be found.
Stage 1 results demonstrated a broad spectrum of possibilities to improve the overall integration of the existing fabric while minimizing its total street network length. The vast majority of the 25,000 solutions obtained performed better considering this trade-off than the existing fabric. The application of multi-criteria optimization in this stage enables a designer to view and choose from 50 different solutions found on the Pareto front. The chosen fabric (the one that provided the highest average integration) allowed for a 27.4 million dollars less expensive configuration while delivering a more integrated network within the Chicago urban language. Moreover, if the Pareto frontier solution that provided the less expensive fabric was chosen, this would mean a 32.3 million dollars cost decrease.
Step 2 results reflect an even more difficult problem. The distribution of amenities should deliver less than 15-minute distances (an average PPI of 0.6) between all locations and the closest amenities. In addition, we were seeking configurations that located urban services in street segments with higher integrations while complying with a set of secondary goals. The distribution proposed by the authors intended to respond to these conditions using their perception and expertise as designers. This solution provided the lowest performance metric value but the highest average PPI. The best solution for SPBLX started with the distribution proposed by the authors as input and could not significantly increase its performance (actually, it improved the integration and decreased the PPI) before getting stuck in a locally optimal solution.
Both the RBFOpt and the CMAES best solutions provided significantly better performance metric scores (8.19 and 8.84, respectively). However, these solutions delivered worse PPI performances (yet desirable for 15-minute neighborhoods as they are >0.6), probably due to their trend to centralize the amenities.

6. Conclusions

This study builds on the research thread of grammar-based optimization approaches to address the generation of urban fabrics in early design. The presented approach is intended to parametrically implement a shape grammar that codifies the rules for designing urban fabrics within the Chicago language while attending to multiple viewpoints related to the 15-minute cities concept.
In summary, this study contributes to 15-minute city design methods by exploiting the potential of coupling shape grammars and computational optimization to filter solutions at the urban design scale. A grammar-based optimization approach was used to find 15-minute neighborhood configurations that minimized infrastructure cost (as estimated by cumulative street length) and the number of facilities while maximizing pedestrian accessibility to urban services (as assessed by the fabrics overall integration and the average distance from all plots to nearest facilities). As the 15-minute city concept envisions more sustainable communities by promoting proximity, we believe the presented approach is an initial step toward computational methods to support its proposition.
Despite achieving meaningful findings, the authors acknowledge some limitations of the conducted study. The Chicago Urban Grammar does not address irregular or non-orthogonal urban block patterns, and the influence of nearby amenities located outside the studied fabric was not considered. In addition, other critical aspects related to the 15-minute city concept, like density or the number of street intersections, should be incorporated as objective functions or in the proposed performance metric equation. We also aim to explore shape grammars for irregular urban block patterns. Therefore, there is a wider spectrum of opportunities for future work and improvement of the presented approach.

Author Contributions

Methodology, F.T.L., N.C.B. and J.P.D.; analysis, F.T.L., N.C.B. and J.P.D.; investigation, F.T.L.; supervision, N.C.B. and J.P.D.; writing—original draft preparation, F.T.L.; writing—review and editing, N.C.B. and J.P.D. All authors have read and agreed to the published version of the manuscript.

Funding

This study was financed in part by the Stuckeman Center for Design Computing and the Stuckeman School of Architecture and Landscape Architecture, The Pennsylvania State University, United States, by the Brazilian Coordination of Superior Level Staff Improvement—Coordenação de Aperfeiçoamento de Pessoal de Nível Superior—Brasil (CAPES) Finance Code 001, and by FAPEMIG, the research supporting foundation of Minas Gerais state, Brazil.

Institutional Review Board Statement

Not applicable.

Informed Consent Statement

Not applicable.

Data Availability Statement

Not applicable.

Conflicts of Interest

The authors declare no conflict of interest.

References

  1. Appleyard, D. Livable Streets: Protected Neighborhoods? Ann. Am. Acad. Polit. Soc. Sci. 1980, 451, 106–117. [Google Scholar] [CrossRef]
  2. Gössling, S. Why cities need to take road space from cars—And how this could be done. J. Urban Des. 2020, 25, 443–448. [Google Scholar] [CrossRef]
  3. Brown, L. Redesigning Cities for People: Planning Cities for People; Earth Policy Institute: Washington, DC, USA, 2001. [Google Scholar]
  4. United Nations. World Urbanization Prospects; United Nations: New York, NY, USA, 2018. [Google Scholar]
  5. Global Fuel Economy. Available online: http://www.globalfueleconomy.org/ (accessed on 4 October 2016).
  6. Nicoli, T. 15-Minute City: A Vision for the Future?|Urban Design Lab. Available online: https://urbandesignlab.in/15-minute-city-a-vision-for-the-future/ (accessed on 25 April 2022).
  7. Moreno, C.; Allam, Z.; Chabaud, D.; Gall, C.; Pratlong, F. Introducing the “15-minute city”: Sustainability, resilience and place identity in future post-pandemic cities. Smart Cities 2021, 4, 93–111. [Google Scholar] [CrossRef]
  8. Weng, M.; Ding, N.; Li, J.; Jin, X.; Xiao, H.; He, Z.; Su, S. The 15-minute walkable neighborhoods: Measurement, social inequalities and implications for building healthy communities in urban China. J. Transp. Health 2019, 13, 259–273. [Google Scholar] [CrossRef]
  9. Capasso Da Silva, D.; King, D.A.; Lemar, S. Accessibility in practice: 20-minute city as a sustainability planning goal. Sustainability 2020, 12, 129. [Google Scholar] [CrossRef] [Green Version]
  10. Duarte, J.P. Customizing Mass Housing: A Discursive Grammar for Siza’s Malagueira Houses. Ph.D. Thesis, Massachusetts Institute of Technology, Cambridge, MA, USA, 2001. [Google Scholar]
  11. Duarte, J.P. A discursive grammar for customizing mass housing: The case of Siza’s houses at Malagueira. Autom. Constr. 2005, 14, 265–275. [Google Scholar] [CrossRef]
  12. Lima, F.; Brown, N.; Duarte, J.P. A grammar-based optimization approach for walkable urban fabrics considering pedestrian accessibility and infrastructure cost. Environ. Plan. B Urban Anal. City Sci. 2021, 498, 1489–1506. [Google Scholar] [CrossRef]
  13. Lima, F. Urban Metrics: (Para)metric System for Analysis and Optimization of Urban Configurations. Ph.D. Thesis, Federal University of Rio de Janeiro, Rio de Janeiro, Brazil, 2017. [Google Scholar]
  14. Lima, F.; Montenegro, N.; Paraizo, R.; Kós, J. Urbanmetrics: An algorithmic-(para)metric methodology for analysis and optimization of urban configurations. In Planning Support Science for Smarter Urban Futures; Lecture Notes in Geoinformation and Cartography; Geertman, S., Allan, A., Pettit, C., Stillwell, J., Eds.; Springer International Publishing: Cham, Switzerland, 2017; pp. 47–64. ISBN 978-3-319-57819-4. [Google Scholar]
  15. Lima, F.T.; Brown, N.; Duarte, J.P. Optimizing urban grid layouts using proximity metrics. In Artificial Intelligence in Urban Planning and Design; Elsevier: Amsterdam, The Netherlands, 2022. [Google Scholar]
  16. Hillier, B.; Hanson, J. The Social Logic of Space; Cambridge University Press: Cambridge, UK, 1984. [Google Scholar]
  17. Heitor, T.; Duarte, J.P.; Marques, R.P. Combining Grammars and Space Syntax. IJAC Int. J. Archit. Comput. 2004, 2, 491–515. [Google Scholar]
  18. Granadeiro, V.; Pina, L.; Duarte, J.P.; Correia, J.R.; Leal, V.M.S. A general indirect representation for optimization of generative design systems by genetic algorithms: Application to a shape grammar-based design system. Autom. Constr. 2013, 35, 374–382. [Google Scholar] [CrossRef]
  19. Noronha, M.; Celani, G.; Duarte, J.P. Computationally evaluating street retrofitting interventions. Nexus Netw. J. 2022, 24, 481–502. [Google Scholar] [CrossRef]
  20. Lima, F. Urban design optimization: Generative approaches towards urban fabrics with improved transit accessibility and walkability—Generative approaches towards urban fabrics with improved transit accessibility and walkability. In Proceedings of the PROJECTIONS—26th CAADRIA Conference, Hong Kong, China, 29 March–1 April 2021; Volume 2, pp. 719–728. [Google Scholar]
  21. Stiny, G. Introduction to shape and shape grammars. Environ. Plan. B Plan. Des. 1980, 7, 343–351. [Google Scholar] [CrossRef] [Green Version]
  22. Teeling, C. Algorithmic design: Generating urban form. Urban Des. Stud. 1996, 2, 89–100. [Google Scholar]
  23. Mayall, K.; Hall, G.B. Landscape grammar 1: Spatial grammar theory and landscape planning. Environ. Plan. B Plan. Des. 2005, 32, 895–920. [Google Scholar] [CrossRef]
  24. Duarte, J.P.; Rocha, J.; Soares, G. Unveiling the structure of the Marrakech Medina: A shape grammar and an interpreter for generating urban form. Artif. Intell. Eng. Des. Anal. Manuf. 2007, 21, 317–349. [Google Scholar] [CrossRef] [Green Version]
  25. Duarte, J.P.; Beirão, J. Towards a methodology for flexible urban design: Designing with urban patterns and shape grammars. Environ. Plan. B Plan. Des. 2011, 38, 879–902. [Google Scholar] [CrossRef]
  26. Beirão, J. CItyMaker: Designing Grammars for Urban Design; TU Delft: Delft, The Netherlands, 2012. [Google Scholar]
  27. Brewster, M.; Hurtado, D.; Olson, S.; Yen, J. Walkscore.com: A new methodology to explore associations between neighborhood resources, race, and health. In Proceedings of the 137st APHA Annual Meeting and Exposition 2009, Philadelphia, PA, USA, 10 November 2009. [Google Scholar]
  28. Carr, L.; Dunsigen, I.; Marcus, B. Validation of walk score for estimating access to walkable amenities. Br. J. Sports Med. 2011, 45, 1144–1158. [Google Scholar] [CrossRef]
  29. Dogan, T.; Yang, Y.; Samaranayake, S.; Saraf, N. Urbano: A tool to promote active mobility modeling and amenity analysis in urban design. Technol. Archit. Des. 2020, 4, 92–105. [Google Scholar] [CrossRef]
  30. Lima, F.; Paraízo, R.C.; Kós, J.R. Algorithms-aided sustainable urban design: Geometric and parametric tools for transit-oriented development. In Handbook of Research on Visual Computing and Emerging Geometrical Design Tools; Amoruso, G., Ed.; IGI Global: Hershey, PA, USA, 2016; pp. 875–897. [Google Scholar]
  31. Nourian, P.; Rezvani, S.; Sariyildiz, I.; Van der Hoeven, F. Configurbanist: Urban configuration analysis for walking and cycling via easiest paths. In Proceedings of the eCAADe 2015 33rd Annual Conference, Vienna, Austria, 16–18 September 2015. [Google Scholar]
  32. Lima, F.T.; Brown, N.C.; Duarte, J.P. Understanding the impact of walkability, population density, and population size on COVID-19 spread: A pilot study of the early contagion in the United States. Entropy 2021, 23, 1512. [Google Scholar] [CrossRef]
  33. Sevtsuk, A.; Kalvo, R.; Ekmekci, O. Pedestrian accessibility in grid layouts: The role of block, plot and street dimensions. Urban Morphol. 2016, 20, 89–106. [Google Scholar]
  34. Hillier, B.; Penn, A.; Hanson, J.; Grajewski, T.; Xu, J. Natural Movement: Or, configuration and attraction in urban pedestrian movement. Environ. Plan. B Plan. Des. 1993, 20, 29–66. [Google Scholar] [CrossRef] [Green Version]
  35. Hillier, B. A theory of the city as object: Or, how spatial laws mediate the social construction of urban space. Urban Des. Int. 2002, 7, 153–179. [Google Scholar] [CrossRef] [Green Version]
  36. Wasserman, S.; Faust, K. Social Network Analysis: Methods and Applications; Structural Analysis in the Social Sciences; Cambridge University Press: Cambridge, UK, 1994; ISBN 978-0-521-38707-1. [Google Scholar]
  37. Lynch, K. The Image of the City, Illustrated ed.; The MIT Press: Cambridge, MA, USA, 1960; ISBN 978-0-262-62001-7. [Google Scholar]
  38. Zhao, P.; Yen, Y.; Bailey, E.; Sohail, M.T. Analysis of urban drivable and walkable street networks of the ASEAN smart cities network. ISPRS Int. J. Geo-Inf. 2019, 8, 459. [Google Scholar] [CrossRef] [Green Version]
  39. Ståhle, A.; Marcus, L.; Karlström, A. Place syntax—Geographic accessibility with axial lines in GIS. In Proceedings of the Fifth International Space Syntax Symposium, Delft, The Netherlands, 13–17 June 2005; pp. 131–144. [Google Scholar]
  40. Feng, C.; Peponis, J. The definition of syntactic types: The generation, analysis, and sorting of universes of superblock designs. Environ. Plan. B Urban Anal. City Sci. 2020, 47, 1031–1046. [Google Scholar] [CrossRef]
  41. Feng, C.; Peponis, J. Pathways to creating differentiated grids: Types, benefits and costs. Environ. Plan. B Urban Anal. City Sci. 2021, 49, 535–548. [Google Scholar] [CrossRef]
  42. ARTBA. How Much Does It Cost to Build a Mile of Road; American Road & Transportation Builders Association Web Site: Washington, DC, USA, 2021. [Google Scholar]
  43. Navarro-Mateu, D.; Makki, M.; Cocho-Bermejo, A. Urban-Tissue Optimization through Evolutionary Computation. Mathematics 2018, 6, 189. [Google Scholar] [CrossRef] [Green Version]
  44. Makki, M.; Showkatbakhsh, M.; Tabony, A.; Weinstock, M. Evolutionary algorithms for generating urban morphology: Variations and multiple objectives. Int. J. Archit. Comput. 2019, 17, 5–35. [Google Scholar] [CrossRef]
  45. Brown, N.; Jusiega, V.; Mueller, C. Implementing data-driven parametric building design with a flexible toolbox. Autom. Constr. 2020, 118, 103252. [Google Scholar] [CrossRef]
  46. Wortmann, T. Opossum: Introducing and evaluating a model-based optimization tool for grasshopper. In Proceedings of the Protocols, Flows and Glitches, 22nd CAADRIA Conference, Suzhou, China, 5–8 April 2017; pp. 283–292. [Google Scholar]
  47. Makki, M.; Weinstock, M.; Showkatbajhsh, M. Wallacei. 2020. Available online: https://www.wallacei.com/ (accessed on 30 June 2022).
  48. Chicago Ward, Community Area and Neighborhood Maps. Available online: https://www.chicago.gov/content/city/en/depts/dgs/supp_info/citywide_maps.html (accessed on 13 May 2022).
  49. Chicago Metropolitan Agency for Planning CMAP Community Data Snapshot|Portage Park. Available online: https://www.cmap.illinois.gov/search?q=portage%20park (accessed on 17 May 2022).
  50. Deb, K.; Agrawal, S.; Pratap, A.; Meyarivan, T. A fast elitist non-dominated sorting genetic algorithm for multi-objective optimization: NSGA-II. In Lecture Notes in Computer Sciences, Proceedings of the Parallel Problem Solving from Nature PPSN VI, Paris, France, 18–20 September 2000; Schoenauer, M., Deb, K., Rudolph, G., Yao, X., Lutton, E., Merelo, J.J., Schwefel, H.-P., Eds.; Springer: Berlin/Heidelberg, Germany, 2000; pp. 849–858. [Google Scholar]
  51. Carpio-Pinedo, J.; Pozo Menéndez, E.; Lamíquiz Daudén, F.J.; Higueras García, E. When a city must be a tree: Rethinking the spatial approach to fighting epidemics based on the notion of ‘intermediate confinement’. Urban Des. Int. 2021, 26, 332–347. [Google Scholar] [CrossRef]
  52. Cagan, J.; Mitchell, W.J. Optimally directed shape generation by shape annealing. Environ. Plan. B Plan. Des. 1993, 20, 5–12. [Google Scholar] [CrossRef]
Figure 1. The basic logic of the Chicago Urban Grammar: example of rules for grid generation and urban fabrics within the grammar, obtained through different rules combinations.
Buildings 12 01157 g001
Figure 2. The main steps to calculate the PPI of a given fabric, considering only one type of amenity (e.g., educational). The used tool calculates the shortest path that connects an amenity and a dwelling and repeats that for all assigned locations. The same operations should be performed simultaneously or consecutively for all categories considered.
Buildings 12 01157 g002
Figure 3. A summarized description of the proposed workflow. The generation of the base grid and its parcels is followed by a subdivision of the parcels into blocks. These configurations are assessed and their performances are set as fitness functions in multi-optimization procedures to determine amenities optimal positions.
Buildings 12 01157 g003
Figure 4. Portage Park location, fabric, and the selected area for the experiment.
Buildings 12 01157 g004
Figure 5. The subdivision of a street network into segments of 50 m. Each point represents an approximate access point to amenities.
Buildings 12 01157 g005
Figure 6. All optimization step 1 solutions and three illustrating fabrics within the Pareto Frontier: the one with the highest integration (A), the one with the smallest street length (C), and one solution in between them (B).
Buildings 12 01157 g006
Figure 7. A comparison between the existing fabric and the one obtained in step 1 in terms of integration, with higher integrated streets shown in red and less integrated ones in blue.
Buildings 12 01157 g007
Figure 8. The distribution of amenities manually elaborated by the authors and the best distributions found with different optimization algorithms.
Buildings 12 01157 g008
Table 1. Amenities considered in this study: categories, number, and secondary goals.
Amenity CategoryNumber of AmenitiesSecondary Goals
education2not on corners
retail4on corners
food4minimize distances to retail 1
others4minimize distances to retail
recreation3minimize distances to education
entertainment1minimize distances to Food
1 One specific food amenity was considered a bar and set to maximize its distances to education.
Table 2. The performance of the solution manually proposed by the authors and of the best solutions found by the different optimization algorithms according to different viewpoints.
ProcedurePerformance MetricAverage PPIAverage Integration
By Authors7.510.840.79
SPBLX (Radical)7.520.830.80
RBFOpt (Opossum)8.190.720.86
CMAES (Opossum)8.240.740.87
Publisher’s Note: MDPI stays neutral with regard to jurisdictional claims in published maps and institutional affiliations.

