Article

Determining the Charred Layer of Wooden Beams with Finite Element Analysis Based on Enthalpy Approach

Department of Fire Protection, Faculty of Wood Sciences and Technology, Technical University in Zvolen, 960 01 Zvolen, Slovakia
*
Author to whom correspondence should be addressed.
Buildings 2022, 12(7), 875; https://doi.org/10.3390/buildings12070875
Submission received: 11 May 2022 / Revised: 16 June 2022 / Accepted: 17 June 2022 / Published: 21 June 2022
(This article belongs to the Special Issue Timber in Construction: Trends and Perspectives)

Abstract

:
In the process of computer modeling the formation of a charred layer in wood materials, it is important to implement the correct material data. In thermal analysis, there exist two different approaches of implementation: the temperature-dependent material data properties, heat capacity approach and enthalpy approach, which is not commonly used but which has a few advantages. This approach should be examined in more detail because it can solve the problem associated with inaccurate results at temperatures around 100 °C. This scientific paper deals with the assessment of the computer-aided fire modeling and simulation suitability based on the enthalpy approach for determining the charred layer of structural elements. The structural elements selected for testing were spruce wooden beams with rectangular and circular cross-sections. A finite element model (FEM) was created in ANSYS software. The model was validated by medium-scale fire tests data of the spruce wooden beams loaded with a radiation panel. Boundary conditions were identical to the medium-scale fire test. Due to the enthalpy approach, the temperature curves from the simulations also faithfully simulated the section with a constant temperature around 100 °C. Within the temperature profiles, the accuracy of simulations averaged 91.7%. The accuracy of the simulations describing the total area of the charred layer was 93.0% on average. Presented FEM can be used in the search for new construction solutions for wooden elements and modifications to the design of cross-sections of wooden beams or wooden joints so that they can better withstand fire conditions.

1. Introduction

Wood has excellent structural and mechanical properties and construction options. For timber building structures, this material ideally meets the increasingly dominant and uncompromising demand of the present and probably the foreseeable future for environmental friendliness in the environment, housing, industrial production, and construction. It turns out that the use of wood as a construction material in the construction industry and architecture will have a significantly progressive trend in the 21st century [1].
The role of the construction system of each building is to transfer the loading to its foundations. During its lifetime, the building is exposed to the effects of permanent and accidental loads, which also include fire loading. Fire poses a great threat to the users of the building, because in addition to the direct adverse effects on health, it can lead to the collapse of the entire building, and thus endanger persons in or near the building. Therefore, ensuring the fire safety of the building is extremely important and is reflected in the legislation of the member states of the European Union. Fire safety regulations impose strict requirements on building design, especially for timber buildings [2]. The collapse of a building due to a fire can occur for several reasons, namely the failure of a building construction product, structural element, or structural system. When a building construction’s capability to withstand the effects of a loading is reduced, e.g., below the applied loading, construction fails. The time to achieve this failure is presented as the value of fire resistance, which in wooden structural elements exposed to fire, depends on the rate of charred layer formation and the residual cross section, which is capable of transferring the loading. The process of forming the charred layer must be considered whenever wood surfaces or wood-based panels are directly exposed to fire.
Wood is a complex heterogeneous colloidal system of substances consisting of main and accompanying components. The main components are hemicelluloses, cellulose, and lignin [3,4,5,6]. The fire resistance of the basic building blocks of wood varies, with hemicelluloses being the least resistant to thermal decomposition, while lignin is the most resistant component of wood [7,8].
When wood is exposed to a sufficient thermal loading, a process of thermal degradation occurs, which produces flammable gases, accompanied by loss of weight and cross-section [9]. Pinto et al. [10] stated that the lack of oxygen in the wood burning process leads to the decomposition of wood into several components and the formation of a charred layer. According to Eurocode 5 [11], the process of forming a charred layer should always be considered if wood surfaces or wood-based panels are directly exposed to fire. Fonseca and Barreira [12] stated that a wooden cross-section exposed to fire consists of the following zones: charred layer, pyrolysis zone and intact wood.
The burning boundary is the layer of material that is formed between the charred layer and the wood in the process of wood burning. According to Eurocode 5 [11], this limit is characterized by a temperature of 300 °C. However, the authors dealing with the process of wood charring state other values [13]. Kačíková et al. [14] stated that charring of wood can occur even at temperatures of 250 °C. Shaffer [15] quoted a temperature at the interface of charred and uncharred wood of 288 °C. According to Osvald [16], charring of the wooden surface occurs at temperatures of 290 °C. The depth of wood charring we can define is the distance between the outer surface of the original element and the position of the charring line. The depth of the charred layer depends on the rate of carbonization. The rate of charring of wood and the loss of properties depend on the type of wood.
New progressive and complex designs in the field of wooden constructions place increasing demands on ensuring their fire safety. The calculations of fire resistance of complex structures according to Eurocode 5 [11] are complicated. With the complexity of buildings, the possibility of calculation errors increases. Computer-aided modeling based on finite element analysis (FEA) is offered as a modern alternative, but extensive research is still needed to collect suitable input data.
At present, fire safety design legislation does not consider the use of computer simulations as the equivalent method in the construction fire safety assessment in the Central European countries (e.g., Slovakia and Czech Republic). One of the main reasons is the absence of a functional model. Such a model should work on the principle of determining the worst possible values, which in practice means that there cannot be a situation where the fire resistance values obtained from the simulation will show better values than those from the real fire tests. To use such a model, the difference between the values obtained from real fire tests and simulations should be as small as possible, and at the same time smaller than fire resistance values determined by manual calculations in accordance with the relevant technical standards. Despite the advantages provided by simulations, simple computational models are still preferred. The main reason is the non-acceptance of computer simulations in the European Union countries as a way for determining the fire resistance of buildings. This is also related to the absence of technical standards and the necessary data usable in simulations [17]. From a practical point of view, this fact has an impact on the construction possibilities, which are limited due to the use of simple computational models.
In the process of developing a computer model, the correct selection of data is extremely important, because the modeling results are sensitive to the input data on the materials that are used in the assessment process [18]. As the response of materials exposed to fire is often not known in advance, the results obtained are always viewed with some uncertainty. Therefore, it is necessary to define the properties of the materials to be used in the process of model preparation, while their choice must also be justified. As a rule, further verification of the results obtained using validation tests are required. According to Naser [18], Zhang et al. [19] Molina et al. [20], Couto et al. [21], Regueira and Guaita [22], Dúbravská et al. [23], this illustrates the serious need for a systematic and modern representation of various temperature-dependent building material properties. The development of such models is one of the first steps toward implementing a unified approach to fire assessment [17].
Thermal conductivity is a parameter that describes the capability of a material to transfer heat. It is one of the basic parameters used to determine properties such as thermal resistance or alternative heat transfer coefficient [24]. The thermal conductivity of wood at a temperature of 20 °C is relatively low. It ranges from approximately 0.1 to 0.3 W·m−1·K−1. Unique, compared to other materials, is the decrease in thermal conductivity at a temperature from 200 to 320 °C. Subsequently, the thermal conductivity increases again due to the formation of a charred layer. The values of thermal conductivity that should be used in the calculations of fire resistance of wooden structures are given in Eurocode 5 [11]. According to Eurocode 5 [11], the thermal conductivity and heat capacity data are similar for all types of softwoods and hardwoods. However, when those were compared with results of other authors [25,26,27,28,29,30,31,32,33,34,35] studying the thermal conductivity of various softwoods and hardwoods, expressed as a function of temperature, different values from those reported in Eurocode 5 [11] were found (Figure 1).
According to Figure 1a, there is evidence of a significant variance of values in comparison with the standard recommended values for wood from Eurocode 5 [11]. The reason for such diverse results is probably the heterogeneity and diversity of the wood, from which it can be concluded that the right choice of input data is important for modeling purposes.
From the point of view of modeling temperature profiles in cross-section, the specific heat capacity of wood is also considered to be an important property. It is defined as the amount of heat that must be supplied to the “body” to increase its temperature by 1 K (J∙g−1∙K−1). It describes the capacity of a material to absorb, store and release heat and is greatly affected by its moisture. The graph of the dependence of the heat capacity of wood on temperature is therefore characterized by a sharp increase in values at temperature around 100 °C, when heat is consumed to change the state of the water and a subsequent sharp drop, after evaporation of the residual water in the wood (Figure 1b).
As can be seen from the graph in Figure 1b, an increase in specific heat capacity values has been recorded by several authors [27,28,29,30,31,35], and this increase in values is also considered in Eurocode 5. An important input for the development of a fire model is information about the investigated materials, i.e., wood in this case. The basic and at the same time necessary input into modeling and development of a fire model is information about the thermal conductivity of wood.
Wood burning is among the most dynamic of processes, which is difficult to simulate by computer software. When designing a combustion simulation, it is necessary to implement many boundary conditions into the simulations, such as, e.g., heat release rate, chemical composition of the material, chemical equations of combustion, material properties, air flow, air temperature, etc. It would also be necessary to create a three-dimensional model of the environment.
The widely used FEA software programs are SAFIR, ANSYS and ABAQUS. Peng and Hadjisophocleus [36] used the software ABAQUS to conduct a thermal analysis to determine the temperature profiles in timbers under fire exposure. Bedon and Fragiacomo [37,38] studied fire resistance of in-plane compressed log-house unprotected timber walls with partial thermal insulation with ABAQUS software. In another study, Bedon and Fragiacomo [39] analyzed fire resistance of thermally insulated log-house timber walls with ABAQUS software. Cachim and Franssen [40] performed FEA of timbers exposed to fire with SAFIR software. Werther et al. [41] compared thermal analysis with the SAFIR, ANSYS and ABAQUS software. The research shows that the programs give comparable results to each other and real fire tests. Software ANSYS from ANSYS, Inc. located in Canonsburg, Pennsylvania is one of the most used FEA software in the world and provides reliable results [19,20,21,22,23,42].
Pecenko Svensson and Hozjan [43,44] presented a new numerical model named PyCiF for determining the charring of wood exposed to standard and natural fire. The new model couples an advanced 2D heat-mass model with a pyrolysis model. The results showed great model accuracy for the evaluation of charring depths of timber elements exposed to the standard fire and natural fires.
The large number of boundary conditions creates a difficult problem to solve, in case it is necessary to perform a complete combustion simulation, e.g., ANSYS software allows one to perform combustion simulations, but from a practical point of view and mainly due to many boundary conditions, it is used mainly for combustion simulations of homogeneous gases. It was therefore necessary to find a simpler solution.
A simpler alternative is thermal analysis where the base element is heat conduction, in which Frangi, Erchinger and Fontana [42], Zhang et al. [19] Molina et al. [20], Couto et al. [21], Regueira and Guaita [22], and Dúbravská et al. [23] used this analysis to examine different types of wooden construction elements exposed to fire with the software ANSYS. In the case of the solution of heat conduction in wood, where it is heated above 100 °C, which is common in fire conditions, a nonlinear problem arises, including phase changes of the water contained in the wood. Wood as a hygroscopic material contains free and bound water. The problem can be solved by setting the input as the temperature-dependent properties regarding the data of the wood. Zhang et al. [19], Molina et al. [20], Couto et al. [21], Regueira and Guaita [22], and Dúbravská et al. [23] used in their numerical analysis studies a combination of three basic material properties: specific heat, density, and thermal conductivity (specific heat approach), according to Eurocode 5 [11]. The second possible combination of material properties is density, thermal conductivity, and enthalpy (enthalpy approach), which is not commonly used but has a few advantages. This approach should be examined in more detail because it can solve the problem associated with inaccurate results at temperatures around 100 °C [22,45].
This scientific paper deals with the assessment of the computer-aided fire modeling and simulation suitability based on the enthalpy approach for determining the charred layer of structural elements. The structural element selected for testing had to meet several criteria. The first was the extent of its use in the construction system. The second important criterion was that it must ensure the load-bearing capacity and stability of the building. In the case of wooden constructions, or constructions that at least partially use wooden structural elements, the previous criteria were best met by a wooden beam. In cross section, wooden beams have different shapes. The most common being a square or rectangular and circular cross-section beams. Wooden beams are widely used as vertical and horizontal structural elements in the construction of roofs, ceilings, walls, etc. The cross-section of the wooden beams selected for the medium-scale fire tests was of a square and circular cross-section. The beams were made from Norway spruce (lat. Picea abies) wood, which is one of the most used in the construction industry.

2. Materials and Methods

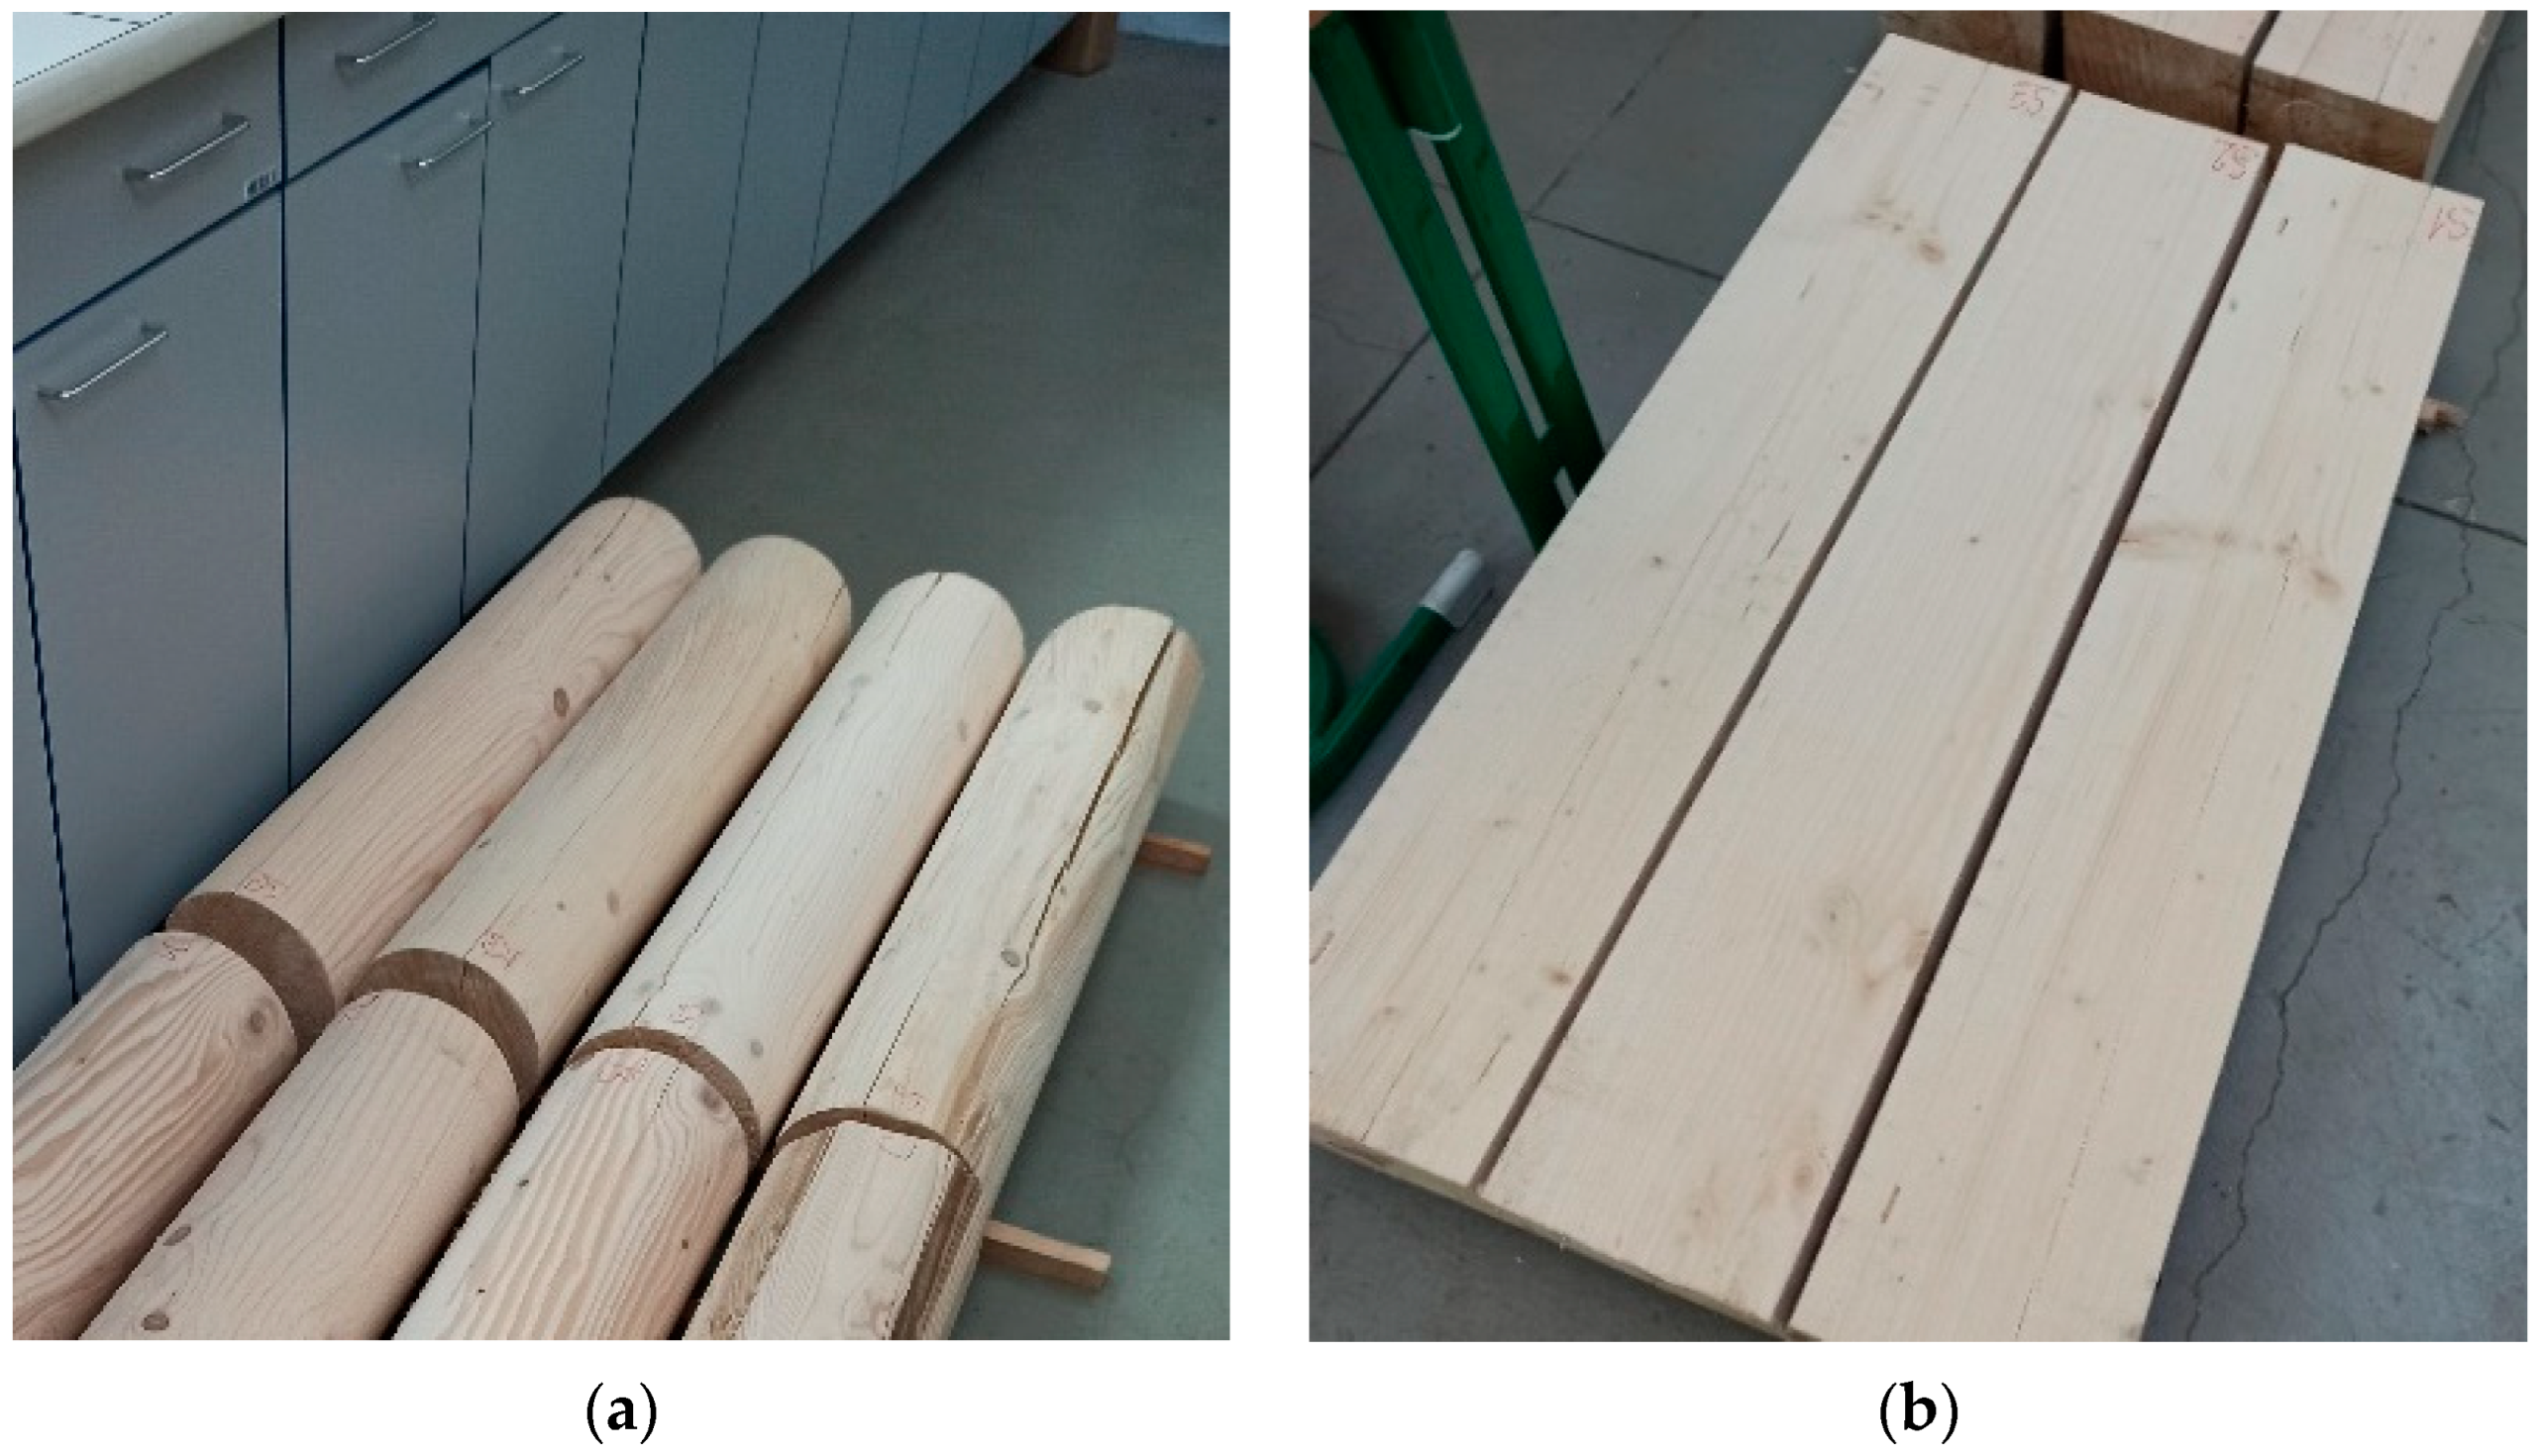
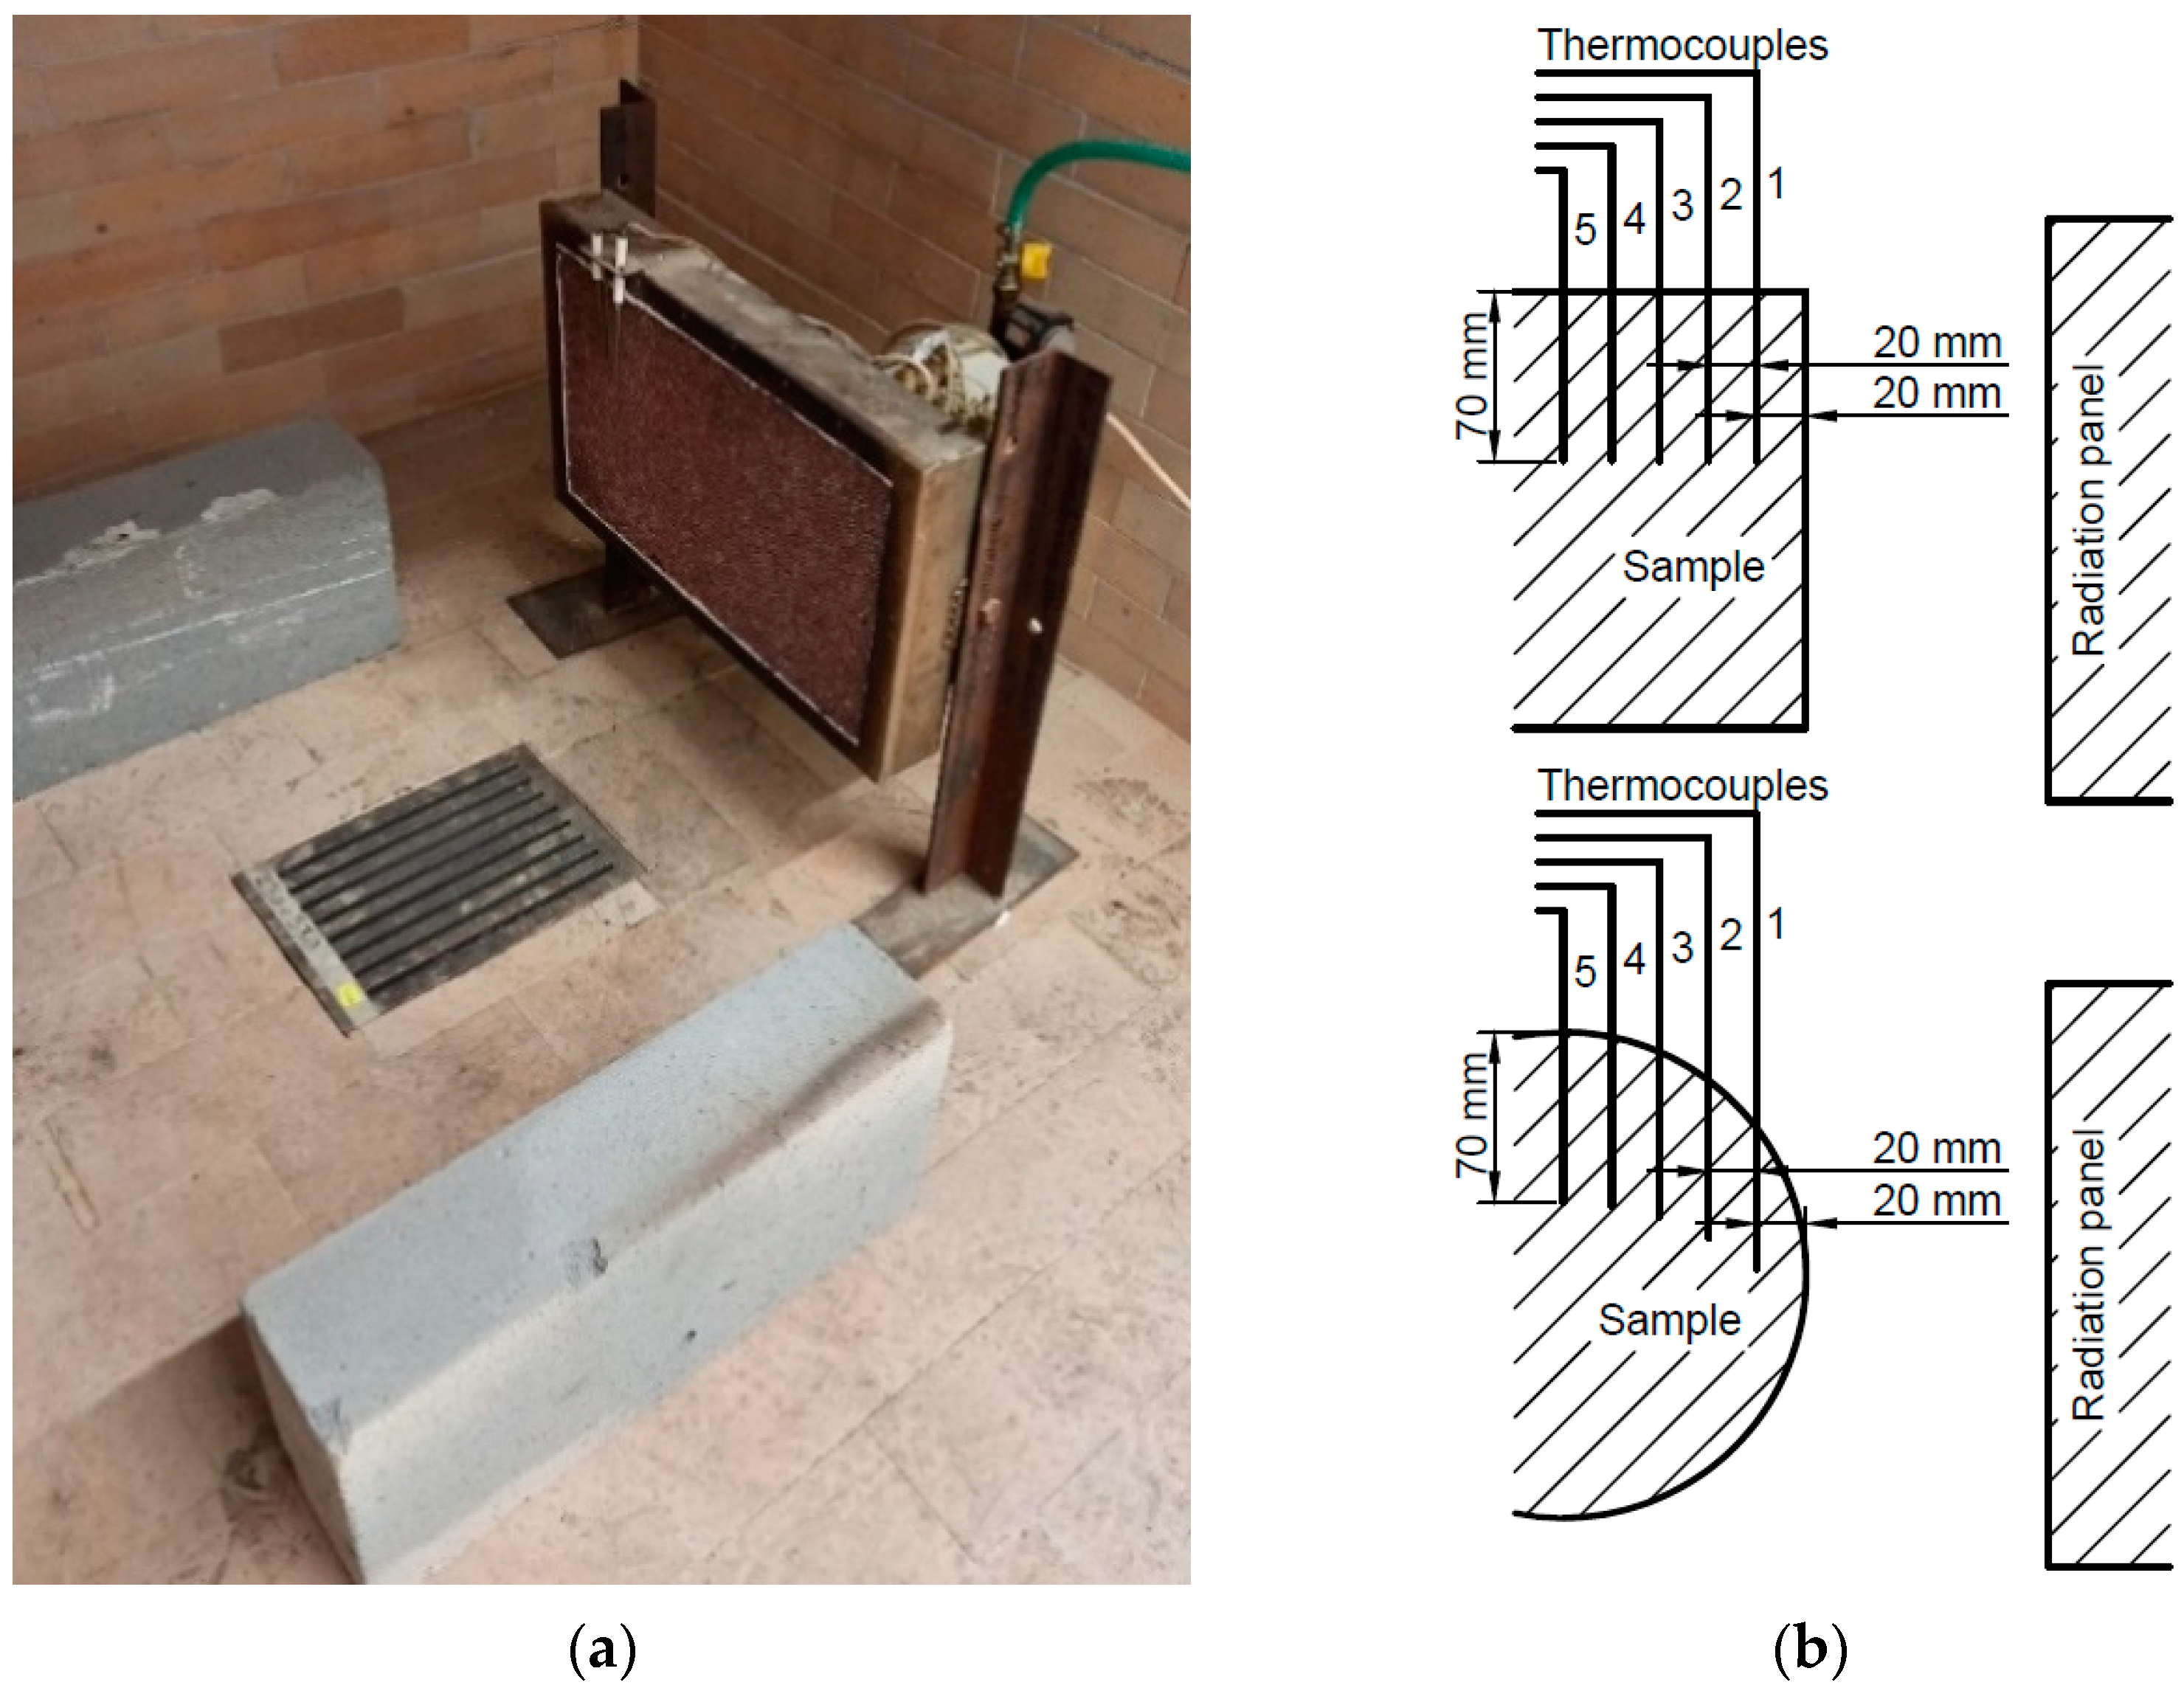
2.1. Medium-Scale Fire Tests of Wooden Beams

Based on the implementation of a medium-scale fire test, the depth of charring and temperature profiles measured in time at predetermined places on the beam were evaluated. The results of the medium-scale fire test were used for FEM validation in the ANSYS program. Test samples were made from Norway spruce trunks. A total of 6 samples were made, of which 3 were of circular cross-section (logs) and 3 were of square cross-section (prisms), see Figure 2a,b.
The length of all samples was 1000 mm. The dimension of the side of the square cross-section was of 177 ± 1 mm, and the diameter of the circular cross-section was of 200 ± 1 mm. The individual test samples were dried in an air-conditioned room to a moisture content of 13.00% ± 1.00%. No surface treatment was applied to the test samples.
As mentioned above, a total of 6 test samples were subjected to medium-scale fire tests. The test sample was placed on a structure made of aerated concrete blocks so that the thermally loaded area of the test sample was at a height level with the central axis of the radiation panel. The distance of the test sample from the radiation panel was 100 mm.
The size of the radiation area was of 480 × 280 mm. The energy source of the ceramic radiation panel was propane–butane gas with a constant flow (15 m3∙h−1). The prepared test set-up is shown in Figure 3a. The medium-scale fire test lasted 60 min, during which temperature profiles were recorded at predetermined locations of the test sample. Temperature profile was measured using NiCr-Ni type thermocouples with a measuring range of −40 °C to +1200 °C. The location of the thermocouples in the test sample is shown in Figure 3b.
At every 20 mm from the edge of the thermally loaded side of the sample up to 100 mm, five thermocouples were placed in pre-drilled openings for measuring the temperature inside the sample (thermocouples number 1, 2, 3, 4, 5).
AHLBORN ALMEMO 2290-8710 V7 was used to record temperatures. The thermocouples were positioned to measure the temperature in the middle of the cross section of the test sample. At the end of the test, the samples were allowed to cool. A cross-section about 1 cm wide was made from the sample center to determine the charring area.

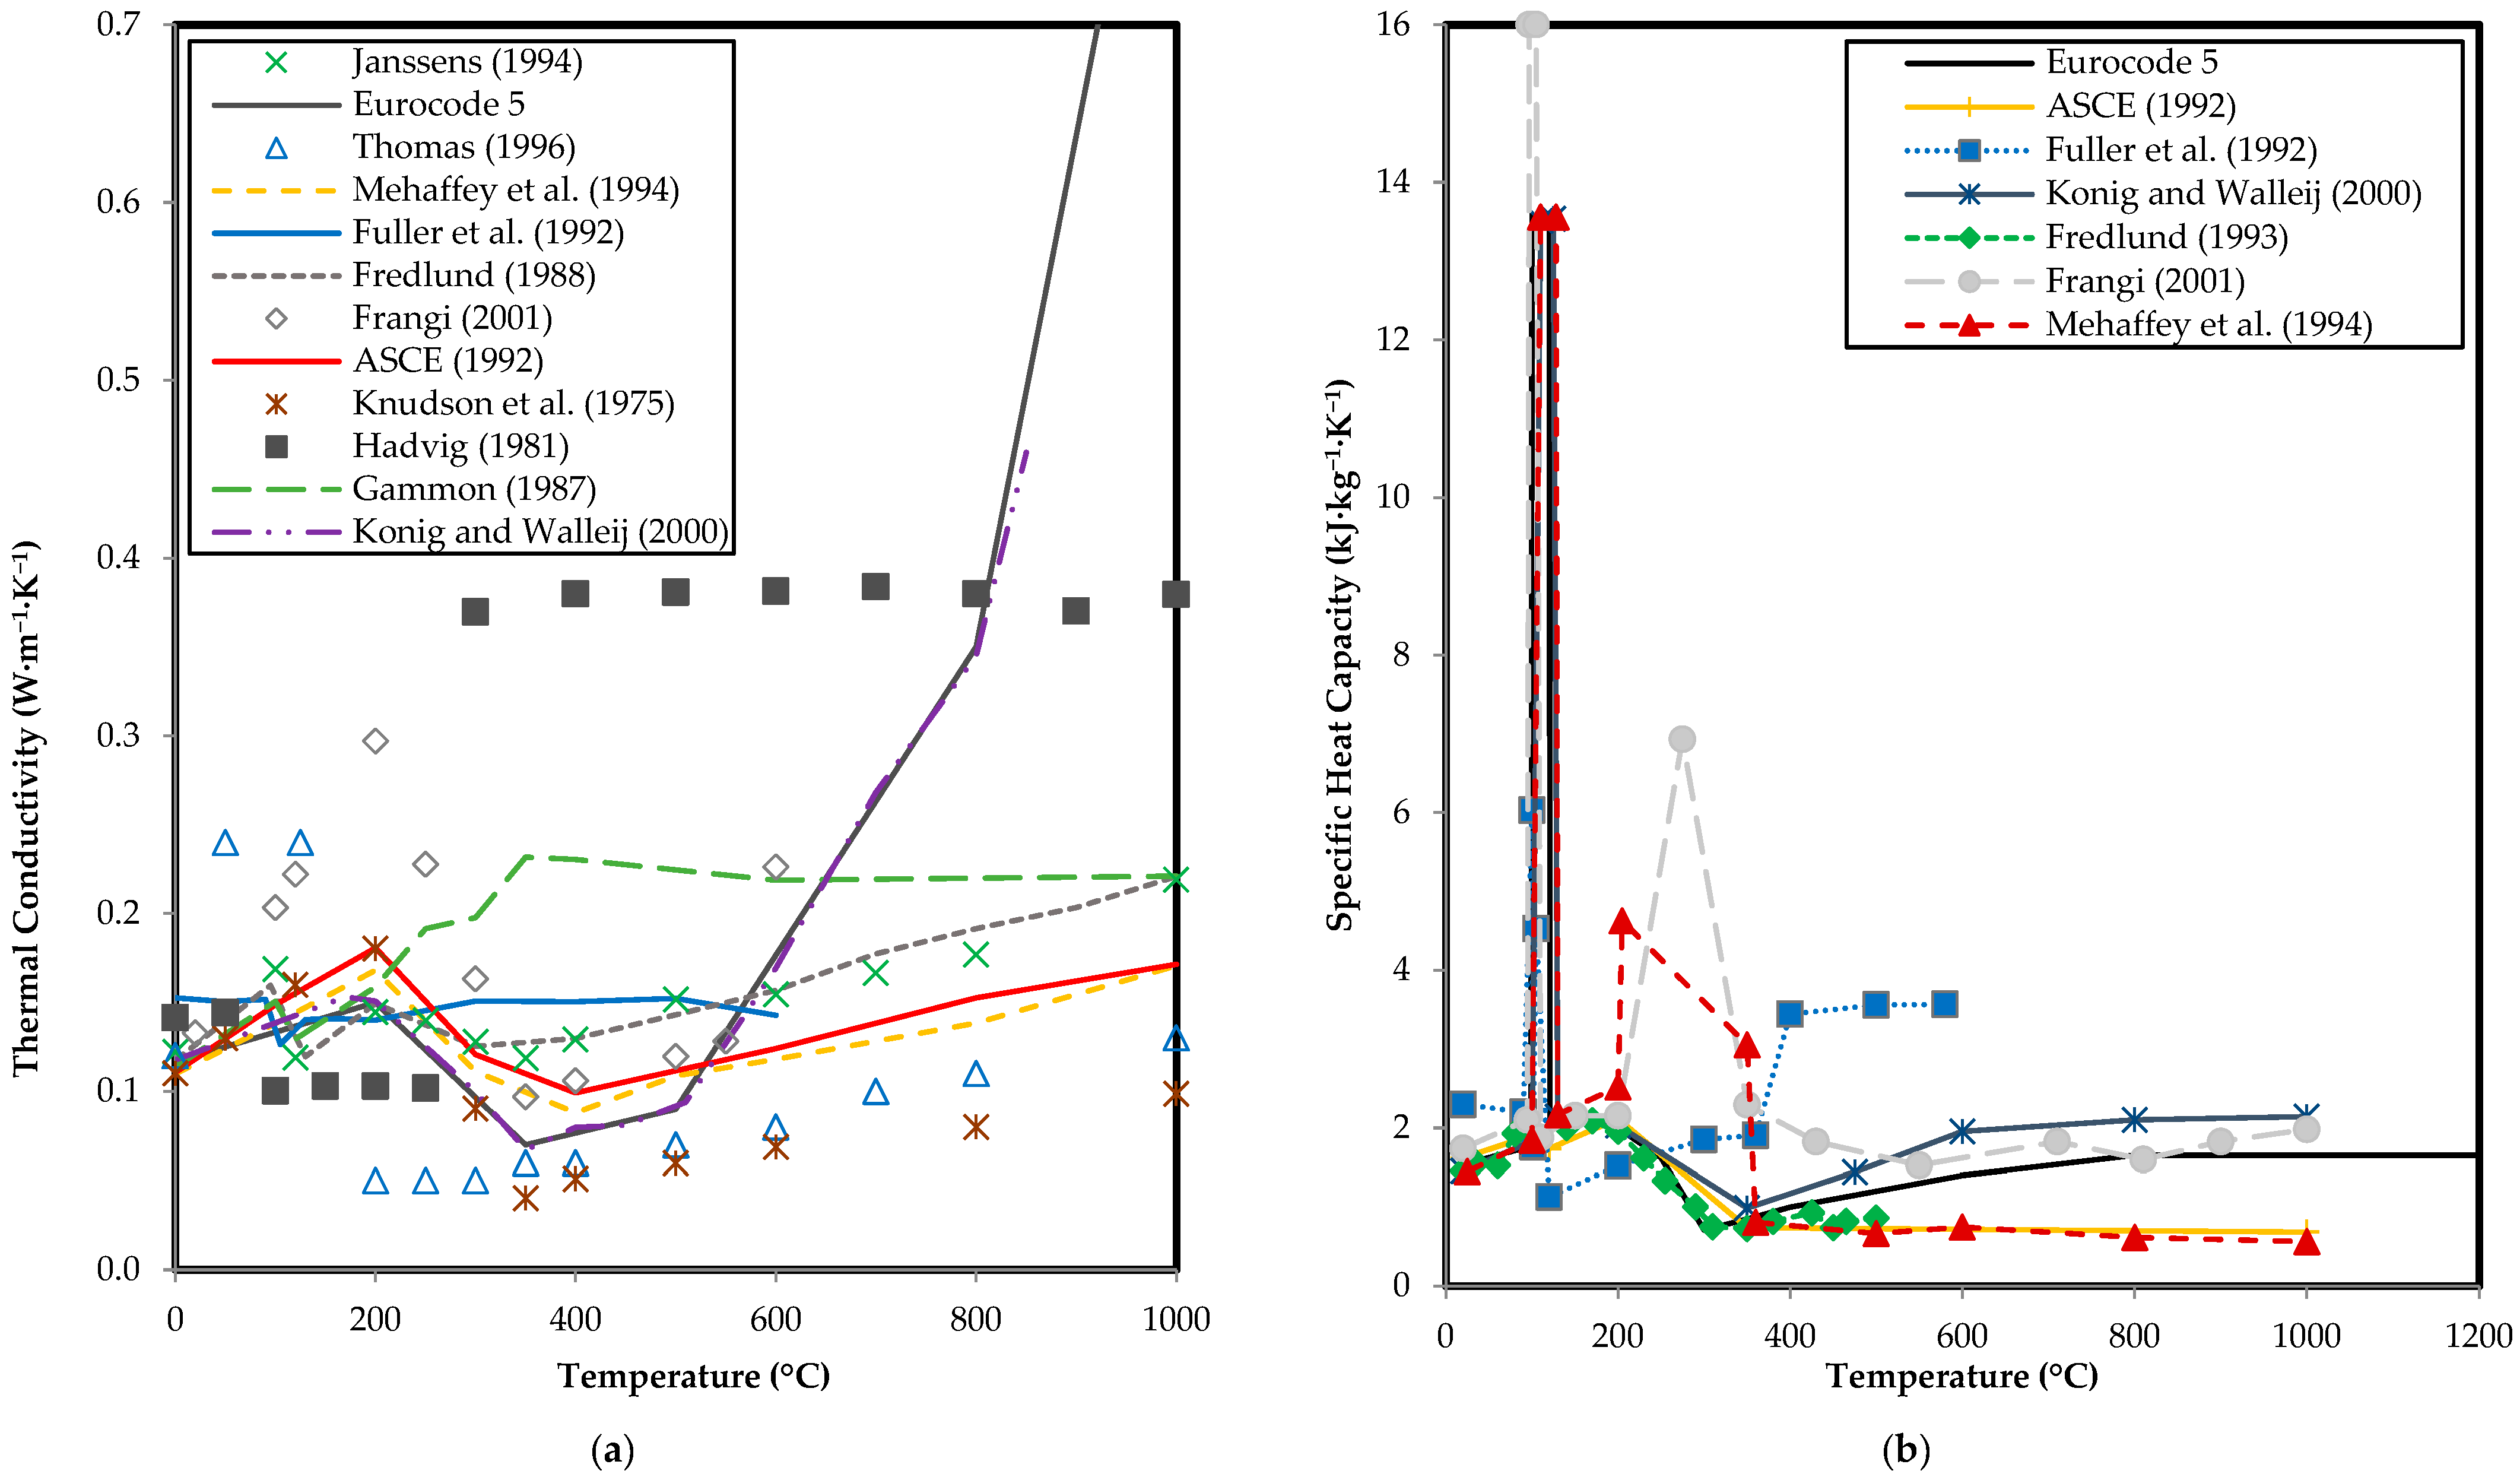
2.2. Selection and Verification of Suitable Fire Models

Based on a previous study, the wood burning process was simplified to conduct heat in the wood, where based on the achieved temperature, it was possible to determine the area (extent) of the charred layer and the intact wood of the wooden beam capable of carrying the load. To create a computer model, the ANSYS 2022/R1 software was selected, where a transient thermal analysis was used. In the ANSYS software, thermal energy in thermal analysis is quantified using Fourier’s law as follows [46]:
q = k d T d x
Thermal conductivity k represents the capability of a material to conduct heat but also expresses how fast the material conducts thermal energy. If the thermal conductivity changes with temperature, Fourier’s law is modified as follows, where the thermal conductivity 𝑘 is a function of temperature 𝑇 [47]:
q = k ( T ) T
Equation (2) describes heat conduction in a one-dimensional space. The dependence of k on temperature may not always be simple when considering a more complex two-to three-dimensional geometry. In these cases, the Newton–Raphson method (ANSYS (b), 2020) is used to solve the problem.
The difference between steady-state heat transfer and transient heat transfer is the existence of a non-stationary member with density, specific heat, and temperature derivation over time. Transient thermal analysis determines temperatures and other thermal quantities that change over time. The main equation for heat conduction through a solid is given by the relation using the thermal equilibrium as follows [48,49]:
k × ( 2 T x 2 + 2 T y 2 + 2 T z 2 ) + q = ρ × c T t
k 2 × T + q = ρ × c T t
Here, ρ is density of a material, c is specific heat capacity, k is thermal conductivity, q ¯ is heat flux and T is thermodynamic temperature. In the equation for transient heat conduction, the expression on the right side of the equation ( ρ × c T t ) represents the rate of energy storage in the body. After some time, when the temperature distribution no longer changes, the process has reached a steady state, which is governed by Fourier’s law [48].

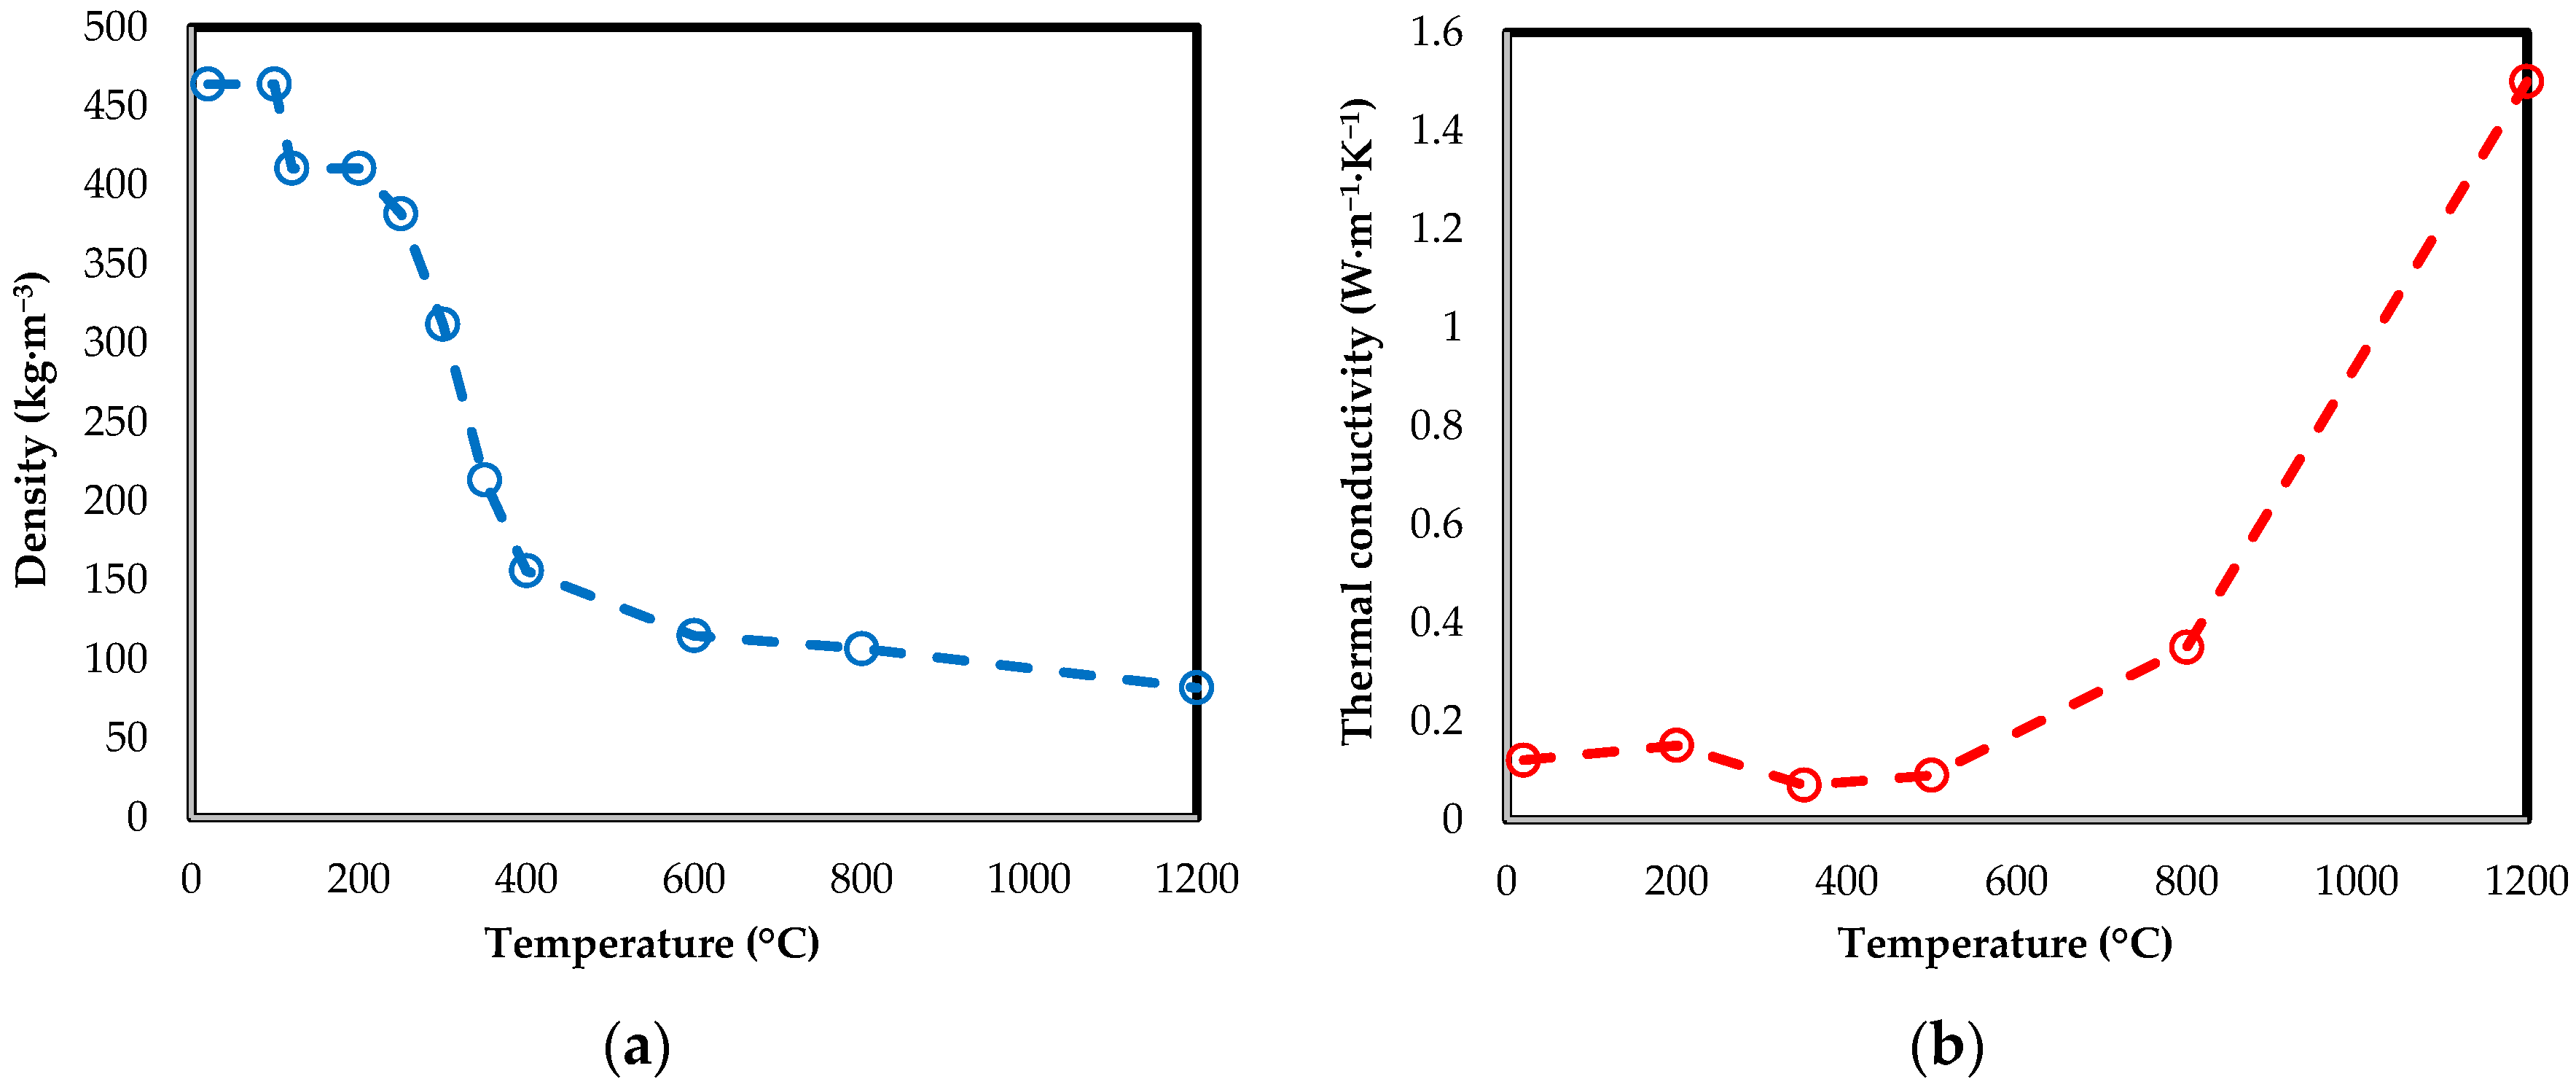
2.3. Modeling the Behavior of Structural Elements in Fire in ANSYS

The properties (density, thermal conductivity, enthalpy–enthalpy approach) of Norway spruce wood, which are necessary for the proper functioning of thermal analysis, were entered in the initial phase of model design. The initial density of Norway spruce samples at 20 °C was determined to 464.10 kg·m−3 by gravimetric method with moisture content 13%. Graph of wood density dependence from temperature was created in accordance with Eurocode 5 [11] (Figure 4a). Thermal conductivity values were implemented into wood properties in simulations according to the Eurocode 5 [11] (Figure 4b).
In the simulations, the definition of enthalpy is adjusted to represent the energy absorbed by the “unit volume” of the body. For wet wood, the derivation of the enthalpy curve is based on two different effects of heat, heating the wood, and evaporating the free water contained in the wood. After reaching a temperature of 100 °C, the contained water is converted into water vapor. This phase change consumes most of the heat received, which results in a slowdown in the heating of the wood.
The enthalpy values (Figure 5a) were calculated and entered the wood properties according to Equations (5)–(7) [50]. Calculation of enthalpy was based on values of specific heat capacity of wood according to Eurocode 5 [11] (Figure 5b).
H T 1 = H T 0 + c d w × ρ d w × ( T 1 T 0 ) + w 100 × c w × ρ w × ( T 1 T 0 ) ;   0 < T 1 < 99  
H T 2 = H T 1 + c d w × ρ d w × ( T 2 T 1 ) + w 100 × H e v a p × ρ w ;   99 T 2 120
H T 3 = H T 2 + c s d × ρ s d × ( T 3 T 2 ) ; 120 < T 3 < 1200
H T 0 represents the starting point of the volume enthalpy curve and is equal to 0, c d w is thermal capacity of a dry wood, c w is thermal capacity of water, ρ d w is density of the dry wood, ρ w is density of water and w is moisture content of the wet wood. In the case of implementation of H T 0 in simulations, simulation software usually does not tolerate zero numbers; therefore, the value lim n 1 n must be entered. Equation (5) represents the calculation of the enthalpy of dry wood and the water content of the wood at temperature T1. Equation (6) represents the calculation of enthalpy, when the state of water changes up to the temperature T2. In this equation, H e v a p is enthalpy of evaporation. Equation (7) represents the calculation of the enthalpy of dry wood at temperature T3. Enthalpy calculations have been performed separately for any change in wood properties.

2.3.1. Geometry of the Model
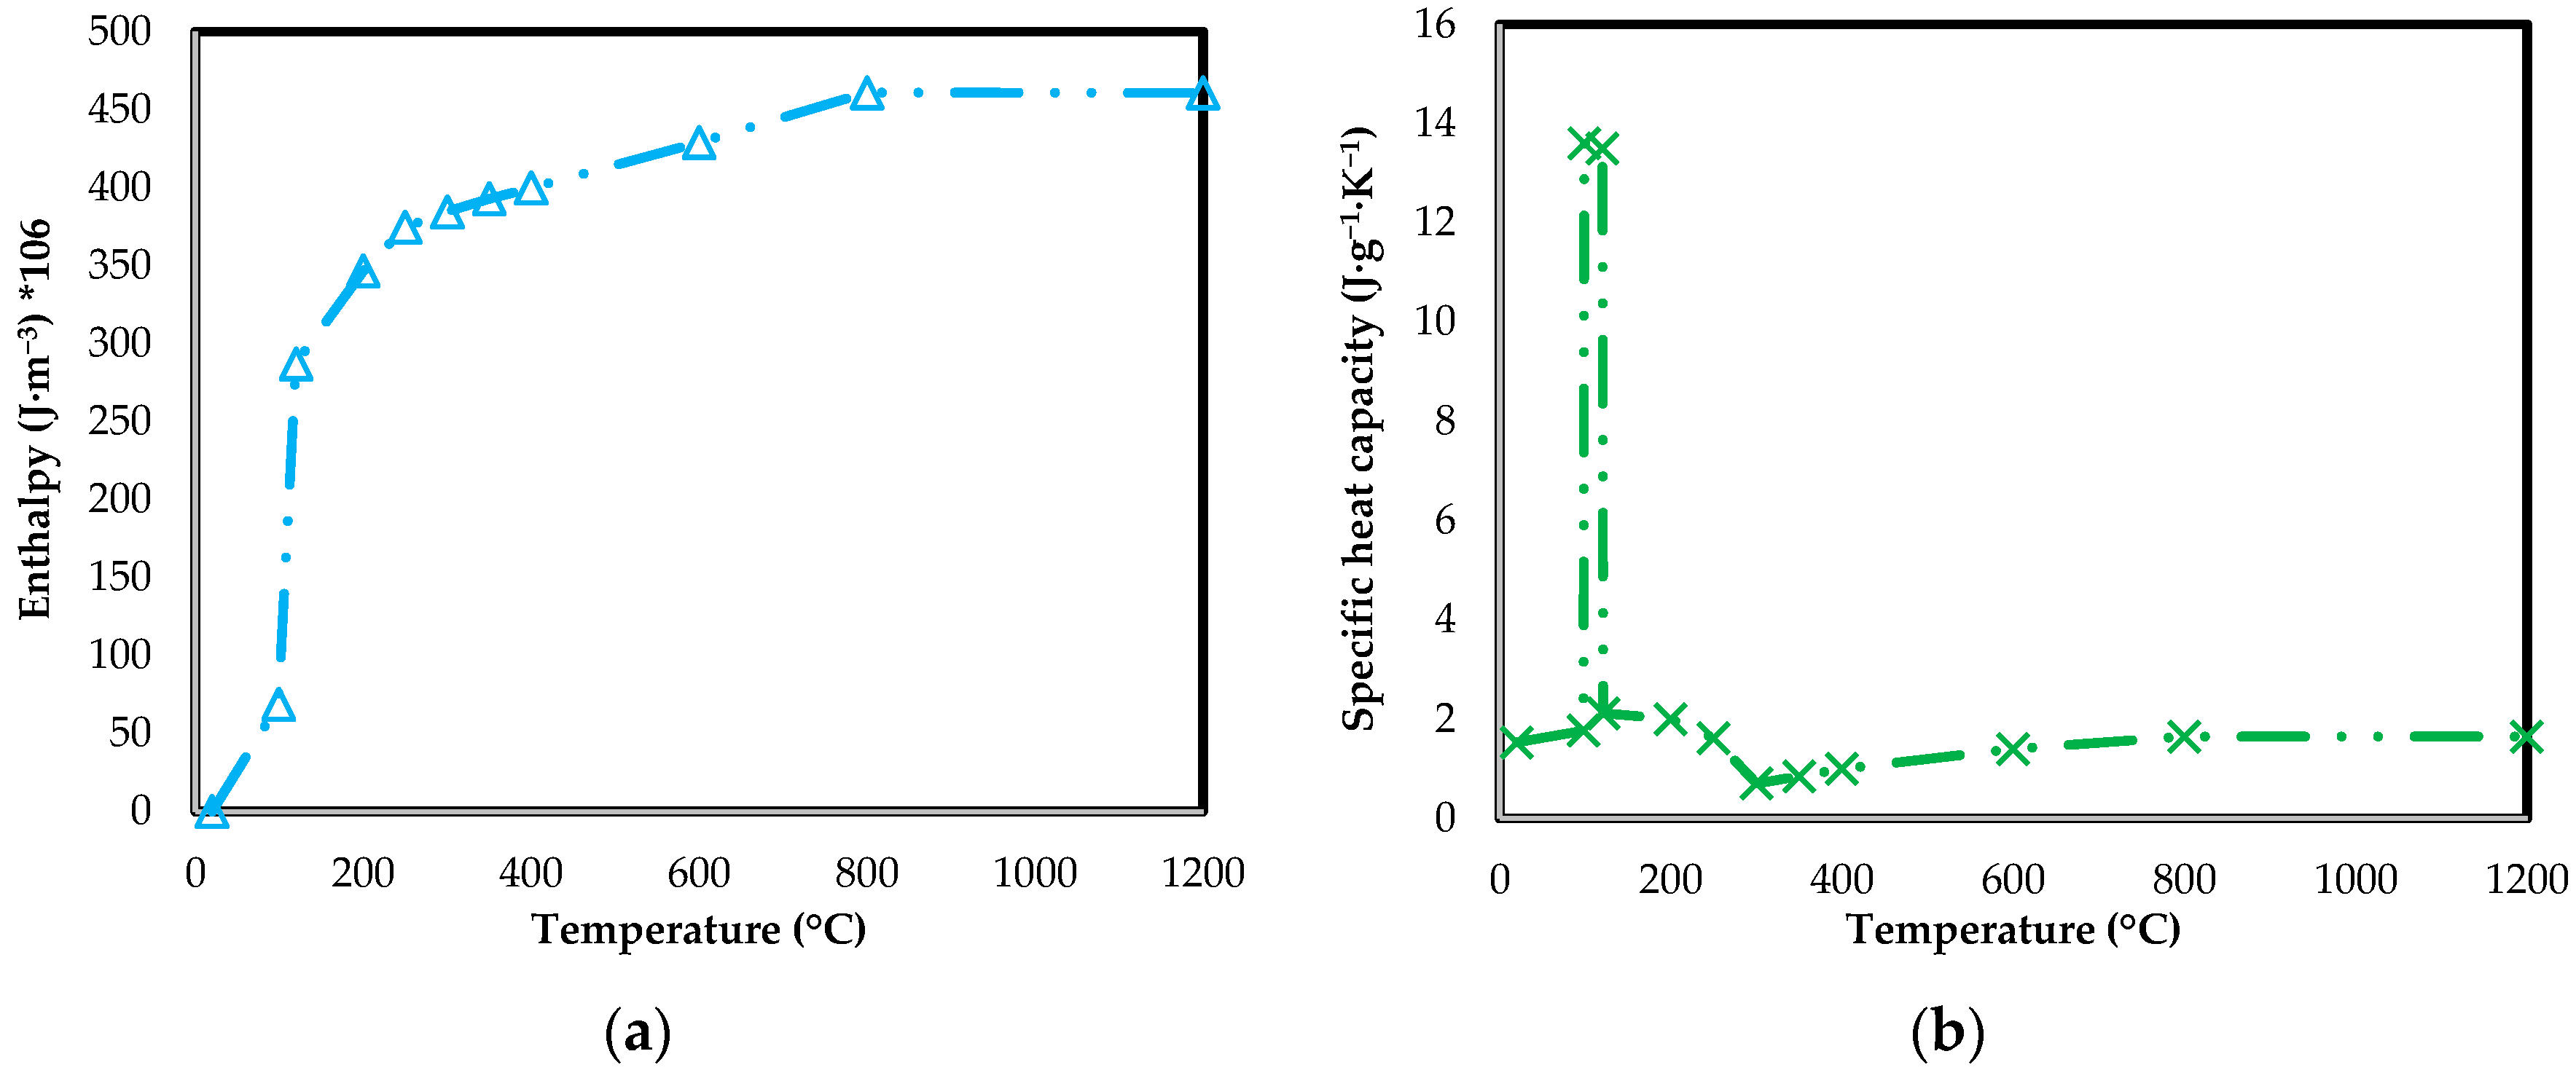
After entering the input data on the properties of materials, a model was created using the “SpaceClaim” environment. The one-dimensional model is not suitable for this study because it does not give information of the shape of the charred layer. The model can be solved in two-dimensional space but it is not possible to monitor the response of the solid elements of FEM to the results and the total computational time of larger wooden structures. According to the previous statement, the geometry of the model was made in three-dimensional space in an orthogonal coordinate system. The model was identical to the elements used in the medium-scale tests. For maximum simplification, the final model does not consider the whole test set, as in the case of a real fire test. The radiation panel, test sample (wood prism or log) supporting structures and environmental conditions were not considered in the resulting three-dimensional model. Their absence did not affect the simulation results and accelerated the calculation. As a replacement for the radiation panel, a simplified plate with a thickness of 1 mm was used in the model but with the same parameters of the produced fire loading as in the real fir test.
Within thermal conductivity, isotropic and orthotropic thermal conductivity are available. As wood is not a homogeneous material and the thermal conductivity is different in the direction of the fibers and perpendicular to the wood fibers, the use of orthotropic thermal conductivity is appropriate. However, as part of the simplification of the simulation, since the wooden beam is heated evenly to almost one side of it and heat transfer perpendicular to the fibers is dominant, the difference in results when using isotropic thermal conductivity or orthotropic thermal conductivity is negligible, while using isotropic thermal conductivity simplifies and speeds up the calculation.

2.3.2. Model

In the “Model” section, the meshing of the prepared models in the “Mesh” section was performed. Element sizes were entered using the “Body Sizing” function. For wooden elements, it was 5 mm and for the radiation panel, 1 mm. The “Patch Conforming Method” function was selected. For logs, it was a tetrahedral mesh and for a prism, a hexahedral mesh. The radiation panel was automatically meshed with a hexahedral mesh. In the case of the logs, the total number of elements was 2,561,900 and the nodes 5,279,000. The prism contained a total of 539,200 elements and 3,589,000 nodes. Subsequently, a thermal connection between the radiation panel and the loaded surface of the samples was created in the models with manual connection region.

2.3.3. Simulation Settings

In the “Setup” section, the initial temperature of 18 °C was set according to the values found in the medium-scale tests. The simulation time was 3600 s, and the numbers of sub-steps and iterations were set according to real fire tests. The duration of one sub-step was of 60 s. The maximum number of iterations was set to 1000. A change was made in the section for nonlinear solution settings, where the original value of thermal convergence was changed from 1.5% to 10%. This adjustment was necessary because the convergence criterion was not met in the initial phase of the simulation calculation (the first sub-step of the calculation), which the software evaluated as an error. The problem arose due to an imbalance in the system, where within one sub-step, there was a sharp rise in temperature, which the software could calculate only with a certain deviation, exceeding the pre-set criterion. As the only boundary condition in the simulation, a uniform surface radiation panel temperature of 1000 °C was defined. The value was measured using thermocouples during real fire tests from the radiational panel surface and was verified using the documentation for the radiation panel. The surface temperature of the radiational panel was constant throughout the tests.

2.3.4. Setting the Method of Solution and Processing of Results

Results processing has been set in the “Solution” and “Results” sections. Using the “Temperature” function, temperature profile was recorded at predefined locations. These were then processed into tabular form. The outputs from the simulation also included images of sections of individual samples, which were used to determine the area of the charred layer. According to Eurocode 5 [11], Zhang et al. [19], Couto et al. [21], Regueira and Guaita [22], and Dúbravská et al. [23], the isotherm position of 300 °C is taken to determine the depth of charring beyond the charring limit.

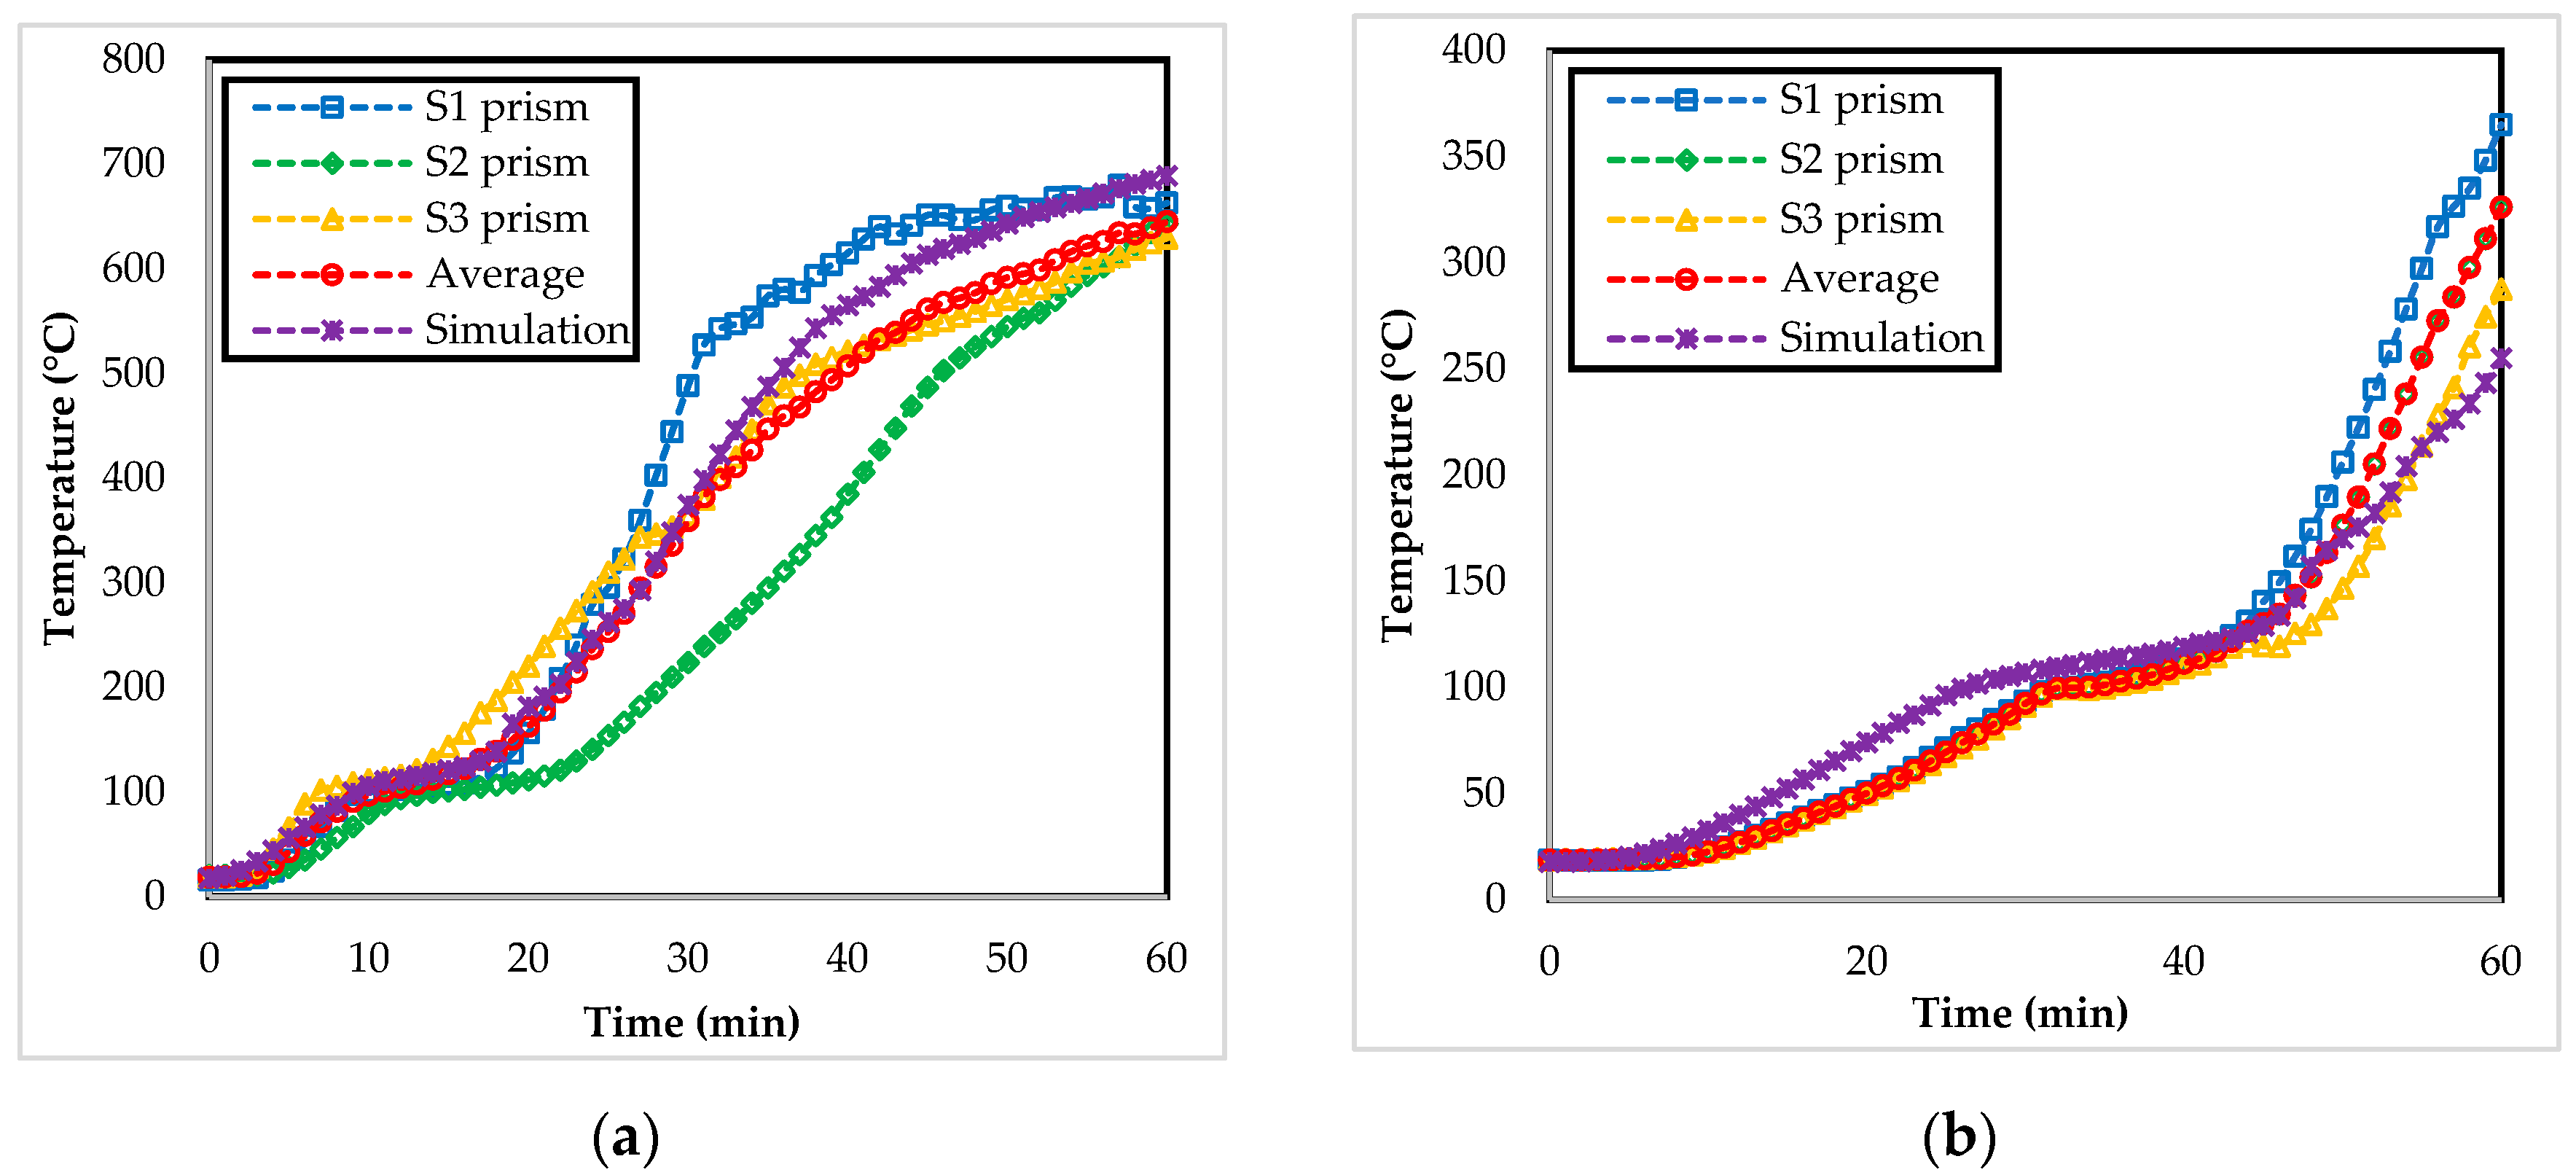
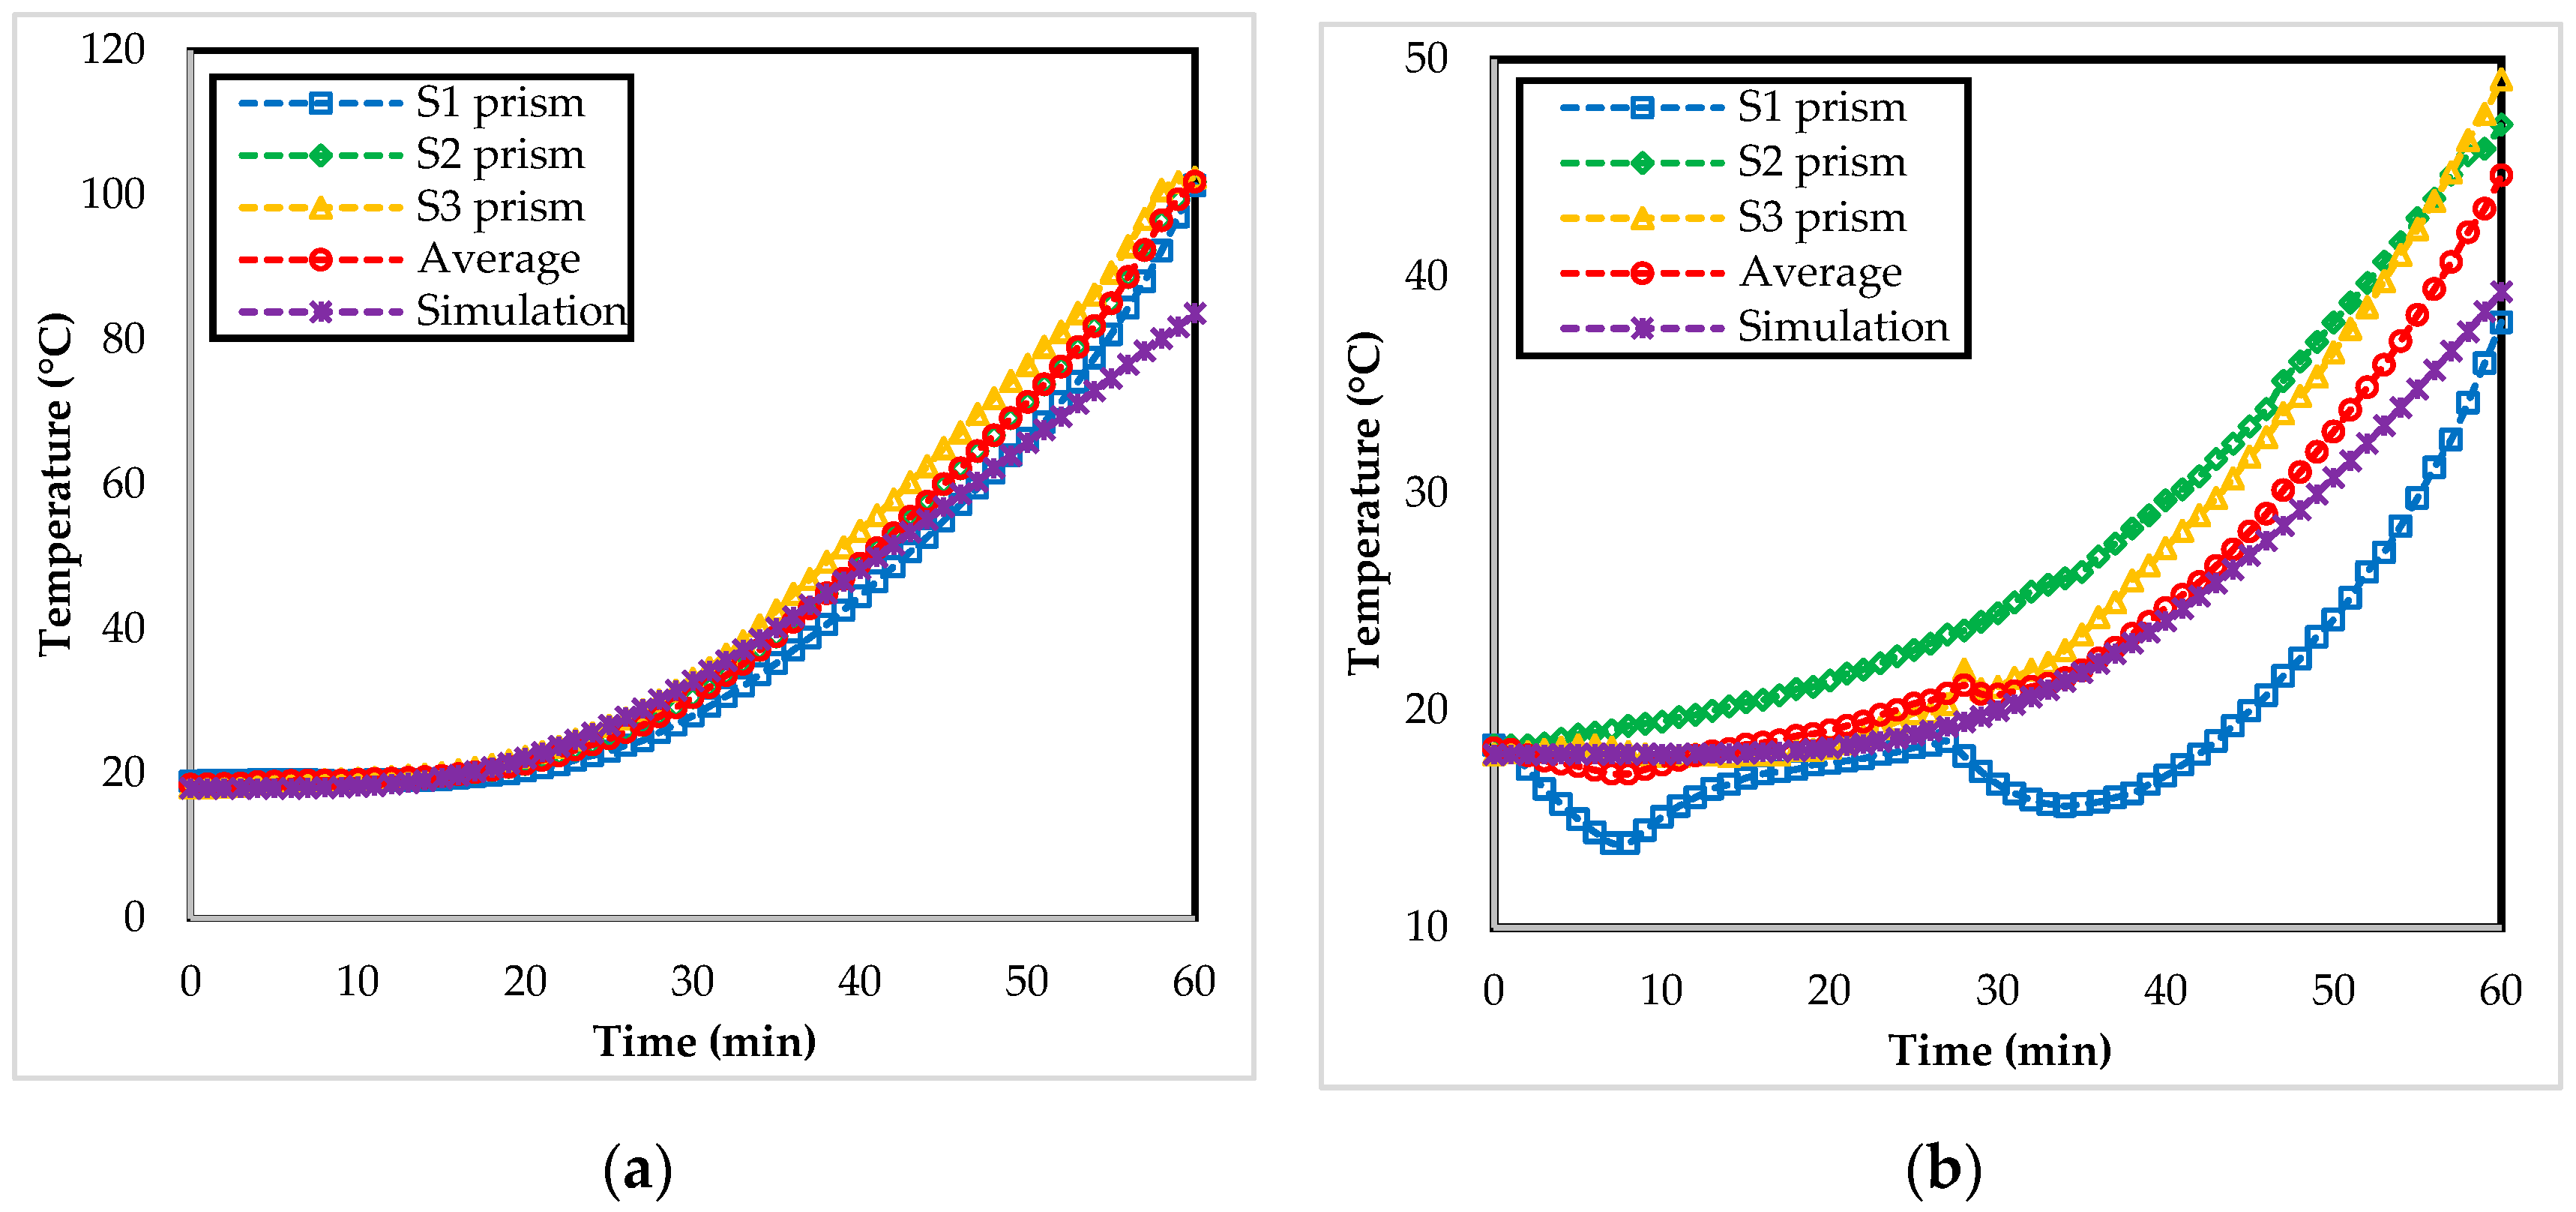
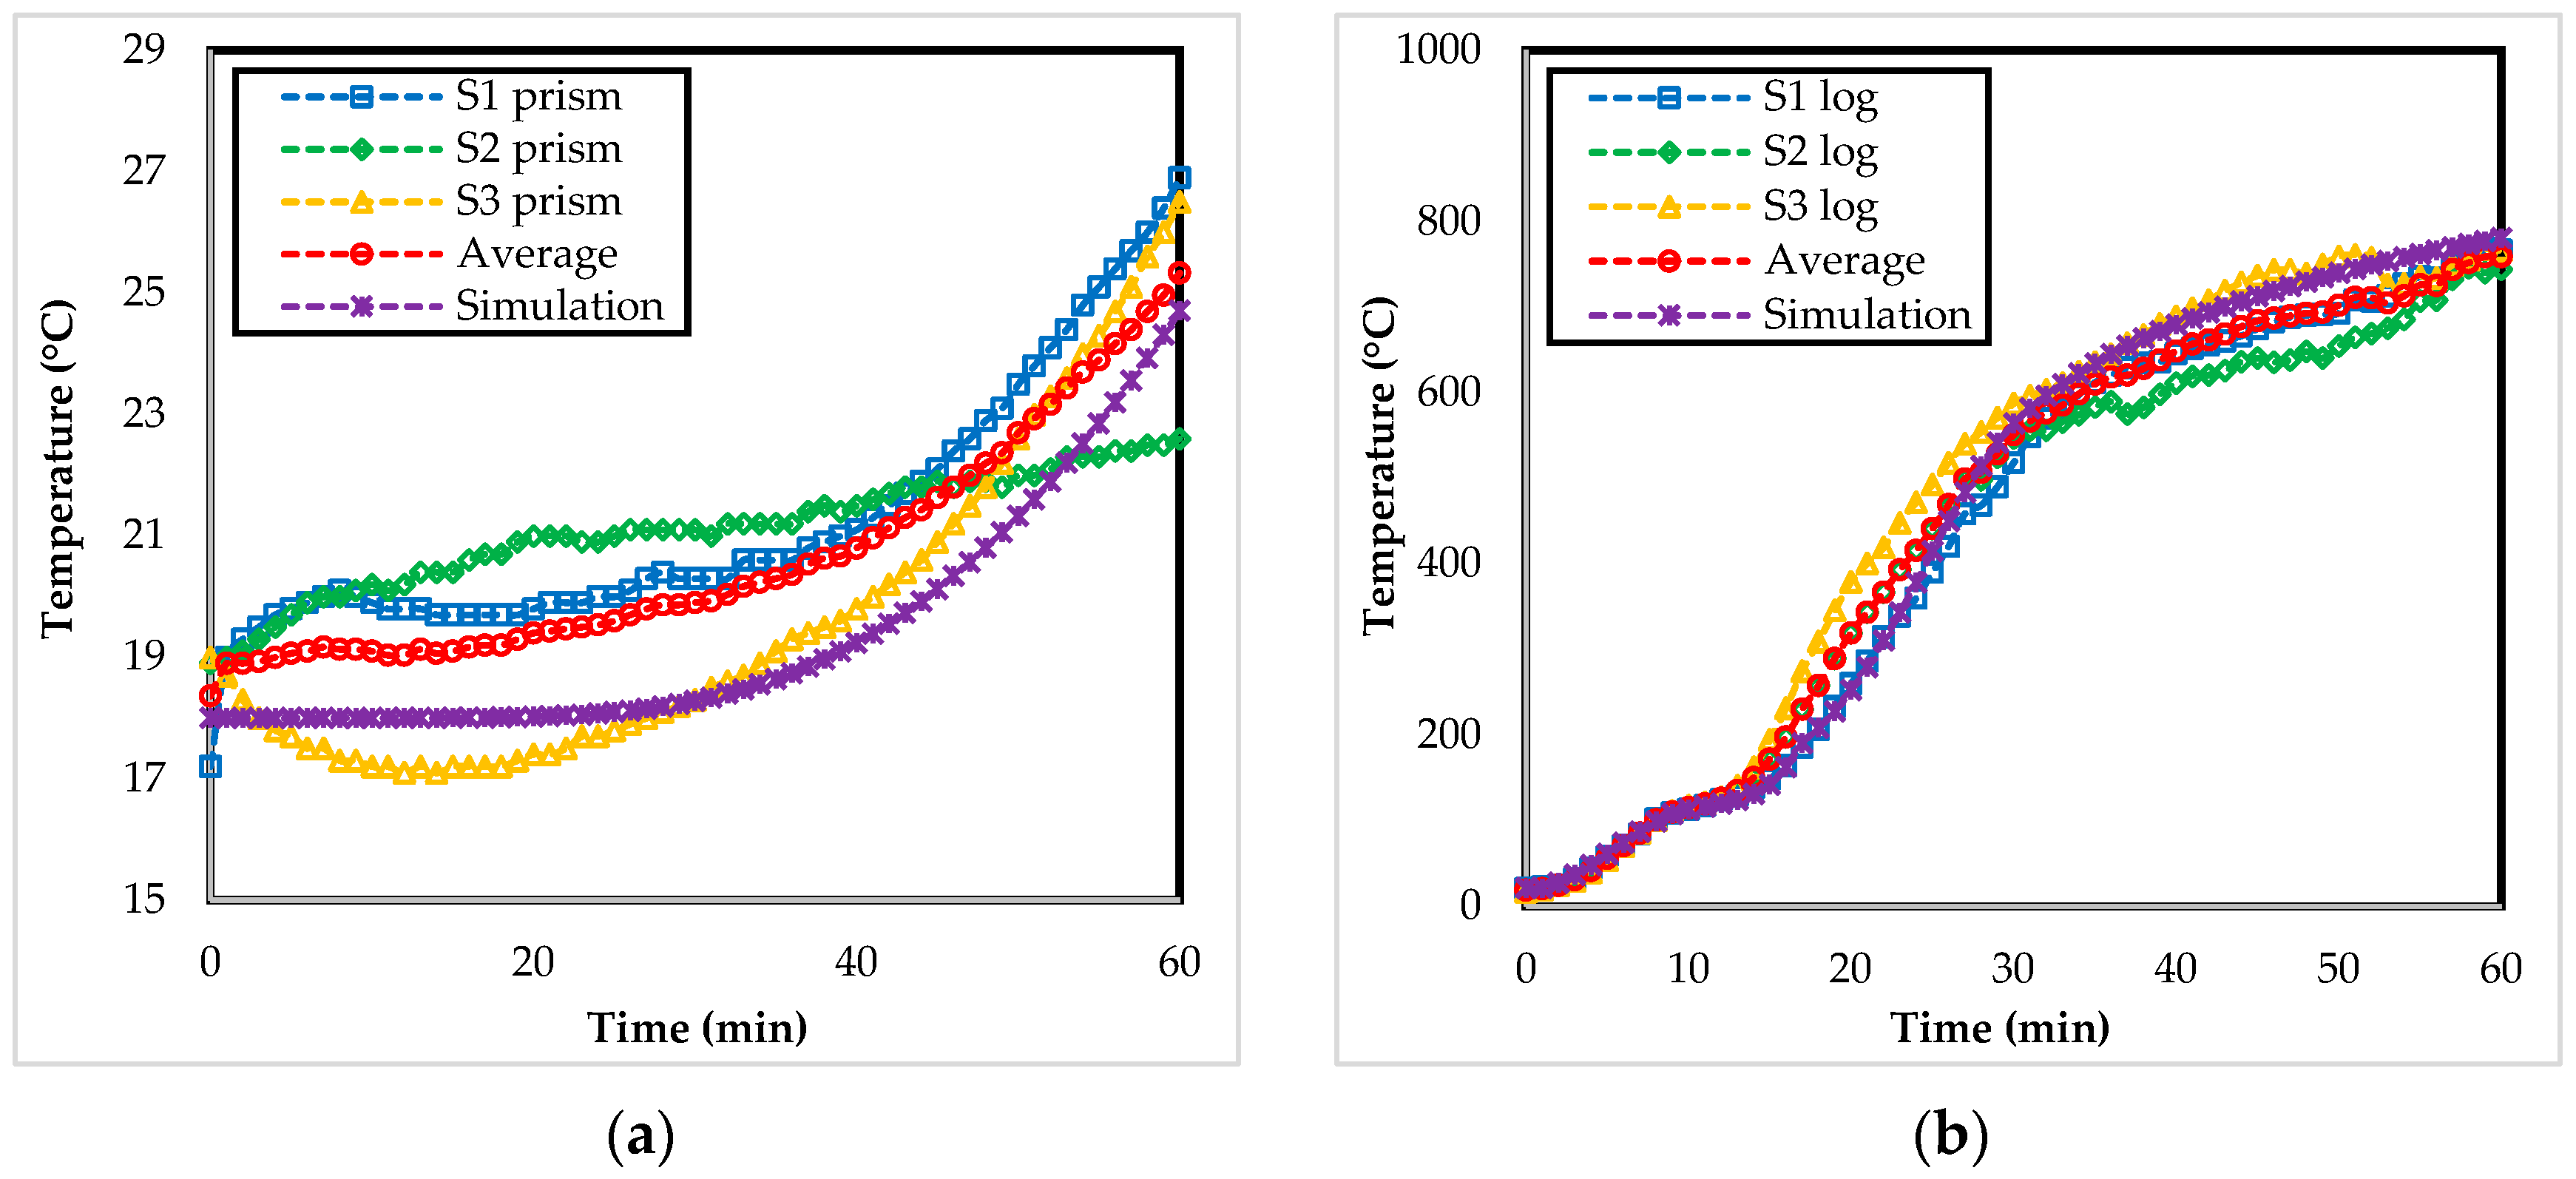
2.3.5. Validation of Applied Fire Models using the Results of Medium-Scale Fire Tests

Validation of a FEM is a process of verification of the exactitude of the models and the material characterization associated with the existing experimental results [51]. The validation of the prepared model was performed using the data on temperature profiles and the charred layer obtained from medium-scale fire tests. The basis of the validation process was the comparison of results from real fire tests and simulations, where the temperature profiles at different depths and the area of the charred layer were compared. The key was to achieve the greatest possible degree of accuracy of the simulation.

3. Results

The results of the comparison of medium-scale fire tests and simulations were processed in the form of graphs of temperature profiles and images of individual sections showing the depth of charred layer and graphs of charring rate. Each graph contains a record of the temperature from real fire tests from a certain depth, their average value and the temperature profile obtained from simulations (Figure 6, Figure 7, Figure 8, Figure 9 and Figure 10). Because the results of the medium-scale fire tests consist of three measurements, the following statistical indicators were processed: absolute temperature deviation, mean temperature deviation, standard temperature deviation of three measurements, variation range and variation coefficient. To compare the simulation results with real fire tests, the following statistical indicators were processed: absolute temperature deviation of simulation and average temperature of measurements, percentage deviation of simulation and average value from measurements, and simulation accuracy, which indicates the agreement of the simulation results with the results from the medium-scale fire tests (Table 1 and Table 2).
The average absolute deviation of all simulations for Norway spruce prism samples was 10.1 °C, the deviation was 9.5%, while the accuracy of the simulations was 91.8% on average (Table 1). The resulting values of the simulation accuracy strongly influenced the temperature profiles from the medium-scale fire tests in a depth of 4 cm (Figure 7a), where the simulation accuracy was only 83.7%.
The average absolute deviation of all simulations for Norway spruce logs was 12.8 °C, the deviation was 7.5%, while the accuracy of the simulations was 92.8% on average (Table 2).
After the completion of medium-scale fire tests and making cross-sections, the individual sections were marked according to the sample number and scanned into a computer, where the area of the charred layer was measured using CAD software.
The boundary of the charred layer is clearly visible after increasing the color contrast, while at several approximations the interface was sharp enough. Figure 11 and Figure 12 show the scanned individual samples. The average area of the charred layer for the prism samples (Figure 11) was 71.8 cm2, with a standard deviation of 12.2 cm2. In percentage terms, the charred layer represented 22.9% of the original area. The average area of the charred layer for log samples (Figure 12) was 81.0 cm2, with a standard deviation of 8.4 cm2. In percentage terms, the charred layer represented 25.8% of the original area.
The results of the simulation are processed in the form of images of temperature fields, where the area with a temperature exceeding 300 °C was removed (Figure 13a,b).
The area of the charred layer for the Norway spruce prism obtained from the simulation (Figure 13a) was 80.3 cm2, which represents a deviation of 0.7 cm2 from the average value of the real fire tests. The accuracy of the simulation was 99.2%. The area of the charred layer for the Norway spruce log obtained from the simulation (Figure 13b) was 80.3 cm2, which represents a deviation of 0.7 cm2 from the average value of the real fire tests. The accuracy of the simulation was 99.2%.

4. Discussion

The comparison of the obtained modeling results showed an accuracy of more than 90%. The temperature curves from the simulations also faithfully simulated the section with a constant temperature at 100 °C, which Regueira and Guaito [22], Pecenko, Svensson and Hozjan [43] simulated only partially. The results of Martínez et al. [45] did not simulate this range at all.
Of all the simulations, the largest deviations showed temperature profiles at a depth of 4 cm, which significantly reduced the overall accuracy of the simulations. According to Couto et al. [21], who examined the fire resistance of cellular wooden slabs using medium-scaled fire tests and FEA, many differences between experimental and numerical results may be due to different levels of moisture in the material as well as the relative position of thermocouples where there may be a slight deviation from their intended deposition. Therefore, the most probable cause of higher deviations at a depth of 4 cm is the deflection of the template used for drilling, which was used to drill openings (holes) for the placement of thermocouples. Pierin, Silva and La Rovere [52] stated that one of the other reasons for simulation deviations from real fire tests is that wood and wood products may have different cavities filled with air, which transfers heat by convection and radiation to neighboring areas when heated, which distorts the results obtained with FEA.
It is further clear from the simulation results that the accuracy of the simulation increased with increasing distance of the thermocouples position from the radiation panel, which is the exact opposite of what Martínez et al. [45] stated. Their FEM did not consider the effect of moisture, which had a significant effect on the results. They further stated that it is necessary to examine the influence of parameters such as water evaporation, mass transfer, pyrolysis, and various thermal properties of contacts between individual layers of wood, which will help to optimize the results of simulations. Zhang et al. [19] investigated the fire resistance of wooden beams exposed to fire by FEA. The results showed the high accuracy of FEM at 50 mm compared to real fire tests. At 25 mm from the edge, the temperature from the real fire tests is slightly higher than the temperature determined from the FEA. The authors justified this by the fact that during a real fire test, cracks formed in the wood, which resulted in a faster course of the coaling process. They did not consider the formation of cracks in the FEA.
It is the formation of cracks in the wood that causes higher deviations of the simulation results from the results obtained by real fire tests, within the total area of the charred layer. Cracks were formed in different locations at each test sample. The formation of cracks in the layer of charred coal locally led to a significant increase in heat penetration into the pyrolysis zone and thus an increase in temperature. Another possible cause of the deviations could be the sporadic occurrence of flames at the front of the samples during the test, with a partial flash of the flame to the unloaded side of the sample. Due to the high unpredictability and dynamism of the process, this effect could not be simulated with sufficient accuracy in this type of FEA.
Another possibility to improve the simulations is to refine the input data on materials. Molina et al. [20], Pierin, Silva and La Roverey [52], Couto et al. [21], Regueira and Guaita, [22] and Martínez et al. [45] used the properties of wood specified in Eurocode 5 [11]. Molina et al. [20], who in their study performed a numerical analysis of the behavior of structural wooden elements with a cross section of 6 × 16 cm in fire conditions using ANSYS software, stated that to improve numerical results, research should focus on obtaining data on thermal properties of different types of wood due to the lack of data; the generalized data for hardwood and softwood available from technical standards [11] still have to be used. This leads to inaccuracies in the numerical results of the simulation.

5. Conclusions

The aim of the study was to assess the suitability of the application of computer modeling in ANSYS on the example of assessing the charred layer of structural elements of wooden buildings. The developed fire model was used in the process of modeling the behavior of wooden beams in a fire. All simulations were performed using transient thermal analysis. The modeling results were compared with the performed medium-scale tests results, focusing on the charred layer of wooden beams.
The comparison of the results of real fire tests and simulations showed the following facts. Information on the thermal properties of wood entered in the simulation, which was based on Eurocode 5 [11], represents a good basis in the process of FEM creation after additional modifications. The created FEM based on the enthalpy approach provides sufficiently accurate information about the temperature profiles and the formation of a charred layer of wooden beams exposed to thermal loading. Due to the enthalpy approach, the temperature curves from the simulations also faithfully simulated the section with a constant temperature at about 100 °C. Within the temperature profiles, the accuracy of simulations averaged 91.7%. The accuracy of the simulations describing the total area of the charred layer was 93.0% on average. The accuracy of the simulations increased with increasing distance of the thermocouples from the radiation panel. The shape of the charred wood layer predicted by simulations is in good correspondence with real fire tests results.
Based on the high correlation of numerical and experimental results, the created FEM is validated and usable for further research. Deviations of the simulation results from the results of real fire tests could be caused by different values of moisture content in individual layers of wood, relative position of thermocouples where there could be a slight deviation from their planned placement, and the water evaporation process from wood and unpredictable cracking.
The FEM presented in this study can be used as a possible replacement for manual calculations or medium-scale tests in determining the fire resistance of wooden structural elements using the residual cross-section. It can also be used in the search for new construction solutions for wooden elements and modifications to the design of cross-sections of wooden beams or wooden joints so that they can better withstand fire conditions. The model can be another step in the development of technical standards aimed at assessing fire resistance using computer-aided modeling.
The created FEM also makes it possible to combine thermal analysis with static analysis, due to which it is possible to monitor the effect of temperature on the mechanical response of wooden beams. With the help of transient static analysis, it is possible to monitor the size of the deflection of wooden beams and the mechanism of deformation, which makes it easier to determine the loading criterion of a given structural element loaded with fire.
To improve the results of computer-aided modeling, in the future, it is necessary to focus research to the material properties of various species of wood. Due to the lack of data, the generalized data for hard and soft woods available from technical standards [11] must still be used. Data collection should focus on obtaining information on material density, thermal conductivity, and mass thermal capacity as the most important properties for non-stationary thermal analyses. According to the mechanical properties, data collection should focus on strength properties and the modulus of elasticity.

Author Contributions

Conceptualization, A.M. and P.T.; methodology, D.Š. and D.K.; software, D.Š.; validation, D.Š. and A.M.; formal analysis, A.M. and D.K.; investigation, D.Š.; resources, D.Š.; data curation, D.Š.; writing—original draft preparation, D.Š.; writing—review and editing, D.Š. and D.K.; visualization, P.T.; supervision, A.M. All authors have read and agreed to the published version of the manuscript.

Funding

This research was funded by the Slovak Research and Development Agency, grant number APVV-17-0005; the Slovak Research and Development Agency, grant number SK-CN-21-0002; Cultural and Educational Grant Agency Ministry of Education, Science, Research and Sport of the Slovak Republic, grant number 001TU Z-4/2020; Progressive research of performance properties of wood-based materials and products (LignoPro); ITMS 313011T720, supported by the Operational Programme Integrated Infrastructure (OPII) funded by the ERDF.

Conflicts of Interest

The authors declare no conflict of interest.

References

  1. Gosselin, A.; Cimon, Y.; Lehoux, N.; Blanchet, P. Main Features of the Timber Structure Building Industry Business Models. Buildings 2021, 11, 170. [Google Scholar] [CrossRef]
  2. Kincelova, K.; Boton, C.; Blanchet, P.; Dagenais, C. Fire Safety in Tall Timber Building: A BIM-Based Automated Code-Checking Approach. Buildings 2020, 10, 121. [Google Scholar] [CrossRef]
  3. Waliszewska, B.; Mleczek, M.; Zborowska, M.; Goliński, P.; Rutkowski, P.; Szentner, K. Changes in the chemical composition and the structure of cellulose and lignin in elm wood exposed to various forms of arsenic. Cellulose 2019, 26, 6303–6315. [Google Scholar] [CrossRef] [Green Version]
  4. Mania, P.; Wróblewski, M.; Wójciak, A.; Roszyk, E.; Moliński, W. Hardness of Densified Wood in Relation to Changed Chemical Composition. Forests 2020, 11, 506. [Google Scholar] [CrossRef]
  5. Faleeva, J.M.; Sinelshchikov, V.A.; Sytchev, G.A.; Zaichenko, V.M. Exothermic effect during torrefaction. In Proceedings of the 32nd International Conference on Interaction of Intense Energy Fluxes with Matter, Elbrus, Russia, 1–6 March 2017. [Google Scholar]
  6. Carpita, N.C.; McCann, M.C. Redesigning plant cell walls for the biomass-based bioeconomy. J. Biol. Chem. 2020, 295, 15144–15157. [Google Scholar] [CrossRef]
  7. Yang, H.; Yan, R.; Chen, H.; Lee, D.H.; Zheng, C. Characteristics of hemicellulose, cellulose and lignin pyrolysis. Fuel 2007, 86, 1781–1788. [Google Scholar] [CrossRef]
  8. Machová, D.; Oberle, A.; Zárybnická, L.; Dohnal, J.; Šeda, V.; Dömény, J.; Vacenovská, V.; Kloiber, M.; Pěnčík, J.; Tippner, J.; et al. Surface Characteristics of One-Sided Charred Beech Wood. Polymers 2021, 13, 1551. [Google Scholar] [CrossRef]
  9. Frangi, A.; Fontana, M. Charring rates and temperature profiles of wood sections. Fire Mater. 2003, 27, 91–102. [Google Scholar] [CrossRef]
  10. Limin, L.; Zhaoyi, H.; Weidong, L.; Cheng, H.; Yang, L.; Pinto, E.; Machado, G.; Felipetto, R.; Christoforo, A.; Lahr, F.; et al. Rutting and Fatigue Performance Evaluation of Qingchuan Rock Modified Asphalt Mixture. Open Constr. Build. Technol. J. 2016, 10, 511–523. [Google Scholar] [CrossRef] [Green Version]
  11. EN 1995-1-2; Eurocode 5: Design of Timber Structures—Part 1-2: General—Structural Fire Design. European Committee for Standardization: Brussels, Belgium, 2004.
  12. Fonseca, E.M.M.; Barreira, L.M.S. Charring rate determination of wood pine profiles submitted to high temperatures. WIT Trans. Built Environ. 2009, 108, 449–457. [Google Scholar] [CrossRef] [Green Version]
  13. Lange, D.; Boström, L.; Schmid, J.; Albrektsson, J. The Reduced Cross Section Method Applied to Glulam Timber Exposed to Non-standard Fire Curves. Fire Technol. 2015, 51, 1311–1340. [Google Scholar] [CrossRef]
  14. Kačíková, D.; Kačík, F.; Hrnčiarik, P. Temperature influence on chemical a mechanical properties of wood. Delta 2011, 5, 16–20. [Google Scholar]
  15. Schaffer, E.L. Structural Fire Design: Wood; Research Paper, FPL 450; Forest Products Laboratory: Madison, WI, USA, 1984. [Google Scholar]
  16. Osvald, A. Timber Structure ≠ Fire; Technical University in Zvolen: Zvolen, Slovakia, 2011; p. 336. [Google Scholar]
  17. Ferreira, J.D.R.; Gernay, T.; Franssen, J.-M. Discussion on a systematic approach to validation of software for structures in fire. In Proceedings of the 10th International Conference on Structures in Fire, Blefast, UK, 5–8 June 2018. [Google Scholar]
  18. Naser, M. Properties and material models for modern construction materials at elevated temperatures. Comput. Mater. Sci. 2019, 160, 16–29. [Google Scholar] [CrossRef]
  19. Zhang, J.; Xu, Q.-F.; Xu, Y.-X.; Wang, B.; Shang, J.-X. A numerical study on fire endurance of wood beams exposed to three-side fire. J. Zhejiang Univ. A 2012, 13, 491–505. [Google Scholar] [CrossRef]
  20. Molina, J.C.; Calil, C.; Kimura, F.A.; Pinto, E.M.; Regobello, R.; Scheer, M.B.; Carneiro, C.; Bressan, O.A.; Dos Santos, K.G. Análise Numérica do Comportamento de Elementos de Madeira em Situação de Incêndio. Floresta Ambient. 2012, 19, 162–170. [Google Scholar] [CrossRef]
  21. Couto, D.L.; Fonseca, E.M.; Piloto, P.; Meireles, J.M.; Barreira, L.M.; Ferreira, D.R. Perforated cellular wooden slabs under fire: Numerical and experimental approaches. J. Build. Eng. 2016, 8, 218–224. [Google Scholar] [CrossRef]
  22. Regueira, R.; Guaita, M. Numerical simulation of the fire behaviour of timber dovetail connections. Fire Saf. J. 2018, 96, 1–12. [Google Scholar] [CrossRef]
  23. Dubravska, K.; Špilák, D.; Tereňová, L.; Štefková, J. Charring Layer on a Cross-laminated Timber Panel Construction. Acta Fac. Xylologiae Zvolen 2019, 61, 109–119. [Google Scholar] [CrossRef]
  24. Yoon, S.; Macphee, D.E.; Imbabi, M.S. Estimation of the thermal properties of hardened cement paste on the basis of guarded heat flow meter measurements. Thermochim. Acta 2014, 588, 1–10. [Google Scholar] [CrossRef]
  25. Janssens, M.L.; White, R.H. Short communication: Temperature profiles in wood members exposed to fire. Fire Mater. 1994, 18, 263–265. [Google Scholar] [CrossRef]
  26. Thomas, G. Fire Resistance of Light Timber Framed Walls and Floors. Ph.D. Thesis, Victoria University of Wellington, Welington, New Zealand, 1996. [Google Scholar]
  27. Mehaffey, J.R.; Cuerrier, P.; Carisse, G. A model for predicting heat transfer through gypsum-board/wood-stud walls exposed to fire. Fire Mater. 1994, 18, 297–305. [Google Scholar] [CrossRef]
  28. Fuller, J.J.; Leichti, R.J.; White, R.H. Temperature distribution in a nailed gypsum-stud joint exposed to fire. Fire Mater. 1992, 16, 95–99. [Google Scholar] [CrossRef]
  29. Fredlund, B. A Model for Heat and Mass Transfer in Timber Structures During Fire: A Theoretical, Numerical and Experimental Study. Ph.D. Thesis, Lund University, Sweden Institute of Science and Technology, Department of Fire Safety Engineering, Lund, Sweden, 1988. [Google Scholar]
  30. Frangi, A. Brandverhalten von Holz-Beton-Verbunddecken. 2001, Birkhäuser. Available online: https://www.research-collection.ethz.ch/bitstream/handle/20.500.11850/145666/eth-24596-01.pdf?sequence=1&isAllowed=y (accessed on 28 July 2020).
  31. Babrauskas, V. Structural Fire Protection—ASCE Manuals and Reports on Engineering Practice No. 78. In Structural Fire Engineering; American Society of Civil Engineers: New York, NY, USA, 1992. [Google Scholar]
  32. Knudson, R.M.; Schniewind, A.P. Performance of structural wood members exposed to fire. Forest Prod. J. 1975, 25, 23–32. [Google Scholar]
  33. Hadvig, S. Charring of Wood in Building Fires: Practice, Theory, Instrumentation, Measurements; Technical University of Denmark/Laboratory of Heating and Air-conditioning: Lyngby, Denmark, 1981. [Google Scholar]
  34. Gammon, B.W. Reliability Analysis of Wood-Frame Wall Assemblies Exposed to Fire; University of California: Berkeley, CA, USA, 1987. [Google Scholar]
  35. König, J.; Walleij, L. Timber Frame Assemblies Exposed to Standard and Parametric Fires: Part 2: A Design Model for Standard Fire Exposure; Swedish Institute for Wood Technology Research: Stockholm, Sweden, 2000. [Google Scholar]
  36. Peng, L.; Hadjisophocleus, G.; Mehaffey, J.; Mohammad, M. Predicting the Fire Resistance of Wood–Steel–Wood Timber Connections. Fire Technol. 2009, 47, 1101–1119. [Google Scholar] [CrossRef]
  37. Bedon, C.; Fragiacomo, M. Fire Resistance of In-Plane Compressed Log-House Timber Walls with Partial Thermal Insulation. Buildings 2018, 8, 131. [Google Scholar] [CrossRef] [Green Version]
  38. Bedon, C.; Fragiacomo, M. Experimental and numerical analysis of in-plane compressed unprotected log-haus timber walls in fire conditions. Fire Saf. J. 2019, 107, 89–103. [Google Scholar] [CrossRef]
  39. Bedon, C.; Fragiacomo, M. Fire Resistance of Thermally Insulated Log-House Timber Walls. Fire Technol. 2018, 55, 307–341. [Google Scholar] [CrossRef]
  40. Cachim, P.B.; Franssen, J.-M. Numerical modelling of timber connections under fire loading using a component model. Fire Saf. J. 2009, 44, 840–853. [Google Scholar] [CrossRef]
  41. Werther, N.; O’Neill, J.W.; Spellman, P.M.; Abu, A.K.; Moss, P.J.; Buchanan, A.H.; Winter, S. Parametric Study of Modelling Structural Timber in Fire with Different Software Packages. In Proceedings of the 7th International Conference on Structures in Fire, Zurich, Switzerland, 6–8 June 2012. [Google Scholar]
  42. Frangi, A.; Erchinger, C.; Fontana, M. Charring model for timber frame floor assemblies with void cavities. Fire Saf. J. 2008, 43, 551–564. [Google Scholar] [CrossRef]
  43. Pečenko, R.; Hozjan, T. A novel approach to determine charring of wood in natural fire implemented in a coupled heat-mass-pyrolysis model. Holzforschung 2020, 75, 148–158. [Google Scholar] [CrossRef]
  44. Pečenko, R.; Svensson, S.; Hozjan, T. Modelling heat and moisture transfer in timber exposed to fire. Int. J. Heat Mass Transf. 2015, 87, 598–605. [Google Scholar] [CrossRef]
  45. Martínez-Martínez, J.E.; Alonso-Martínez, M.; Rabanal, F.P.; Díaz, J.J.D.C. Study of the influence of heat transfer of a CLT beam through FEM. In Journal of Physics: Conference Series; IOP Publishing: Bristol, UK, 2018; Volume 1107, p. 032003. [Google Scholar] [CrossRef]
  46. ANSYS. Thermal Conductivity in Heat Transfer. Introduction to Fouriers Law. 2020. Available online: https://courses.ansys.com/index.php/courses/learn-physics-structural-mechanics-heat-transfer-copy/lessons/lesson-1-introduction-to-fouriers-law-2/ (accessed on 28 July 2020).
  47. ANSYS. Thermal Conductivity in Heat Transfer. Thermal Conductivity of Materials. 2020. Available online: https://courses.ansys.com/index.php/courses/learn-physics-structural-mechanics-heat-transfer-copy/lessons/lesson-2-thermal-conductivity-of-materials-2/ (accessed on 28 July 2020).
  48. ANSYS. Thermal Conductivity in Heat Transfer. Thermal Contact Conductance. 2020. Available online: https://courses.ansys.com/index.php/courses/learn-physics-structural-mechanics-heat-transfer-copy/lessons/thermal-contact-lesson-3/ (accessed on 28 July 2020).
  49. ANSYS. Thermal Capacitance in Heat Transfer Analysis. Specific Heat of Materials. 2020. Available online: https://courses.ansys.com/index.php/courses/thermal-capacitance-in-heat-transfer/lessons/lesson-2-specific-heat-of-materials/ (accessed on 28 July 2020).
  50. ANSYS. Thermal Capacitance in Heat Transfer Analysis. Phase Change and Enthalpy. 2020. Available online: https://courses.ansys.com/index.php/courses/thermal-capacitance-in-heat-transfer/lessons/lesson-4-phase-change-and-enthalpy/ (accessed on 28 July 2020).
  51. Suntharalingam, T.; Upasiri, I.; Nagaratnam, B.; Poologanathan, K.; Gatheeshgar, P.; Tsavdaridis, K.D.; Nuwanthika, D. Finite Element Modelling to Predict the Fire Performance of Bio-Inspired 3D-Printed Concrete Wall Panels Exposed to Realistic Fire. Buildings 2022, 12, 111. [Google Scholar] [CrossRef]
  52. Pierin, I.; Silva, V.P.; La Rovere, H.L. Thermal analysis of two-dimensional structures in fire. Rev. Ibracon De Estrut. Mater. 2015, 8, 25–36. [Google Scholar] [CrossRef] [Green Version]
Figure 1. Properties of wood: (a) dependence of thermal conductivity of wood on temperature; (b) dependence of specific heat capacity of wood on temperature.
Buildings 12 00875 g001
Figure 2. Samples for medium-scale fire tests: (a) circular cross-section (logs); (b) square cross-section (prisms).
Buildings 12 00875 g002
Figure 3. (a) Assembly for medium-scale fire test; (b) location of thermocouples in the test samples.
Buildings 12 00875 g003
Figure 4. Properties of Norway spruce: (a) density; (b) thermal conductivity.
Buildings 12 00875 g004
Figure 5. Properties of Norway spruce: (a) enthalpy; (b) specific heat capacity.
Buildings 12 00875 g005
Figure 6. Temperature profile: (a) depth of 20 mm (prisms); (b) depth of 40 mm (prisms).
Buildings 12 00875 g006
Figure 7. Temperature profile: (a) depth of 60 mm (prisms); (b) depth of 80 mm (prisms).
Buildings 12 00875 g007
Figure 8. Temperature profile: (a) depth of 100 mm (prisms); (b) depth of 20 mm (logs).
Buildings 12 00875 g008
Figure 9. Temperature profile: (a) depth of 40 mm (logs); (b) depth of 60 mm (logs).
Buildings 12 00875 g009
Figure 10. Temperature profile: (a) depth of 80 mm (logs); (b) depth of 100 mm (logs).
Buildings 12 00875 g010
Figure 11. Sample slices—Norway spruce prisms.
Buildings 12 00875 g011
Figure 12. Sample slices—Norway spruce logs.
Buildings 12 00875 g012
Figure 13. Simulation results: (a) Norway spruce prism; (b) Norway spruce log.
Buildings 12 00875 g013
Table 1. Statistical indicators—Norway spruce prisms.
PrismMedium Scale testSimulation
Absolute Temperature Deviation (°C)Average Temperature Deviation (°C)Standard Temperature Deviation (°C)Temperature Range (°C)Variation Coefficient (%)Absolute Temperature Deviation (°C)Deviation (%)Simulation Accuracy (%)
S1S2S3
2 cm52.862.223.246.163.9124.122.727.89.691.7
4 cm9.20.89.26.19.218.35.117.021.183.7
6 cm2.50.22.51.72.55.05.43.25.994.2
8 cm4.73.21.83.34.38.116.81.24.395.7
10 cm0.61.11.21.01.32.56.41.36.393.7
Average14.013.37.611.616.231.611.310.19.591.8
Table 2. Statistical indicators—Norway spruce logs.
LogMedium Scale TestSimulation
Absolute Temperature Deviation (°C)Average Temperature Deviation (°C)Standard Temperature Deviation (°C)Temperature Range (°C)Variation Coefficient (%)Absolute Temperature Deviation (°C)Deviation (%)Simulation Accuracy (%)
S1S2S3
2 cm15.716.429.420.529.658.46.926.07.193.1
4 cm9.437.435.027.337.472.419.223.49.091.8
6 cm14.75.98.99.813.123.912.25.94.895.3
8 cm2.75.56.64.96.712.713.14.98.591.5
10 cm13.412.21.28.912.825.526.13.87.892.2
Average11.215.516.214.319.938.615.512.87.592.8
Publisher’s Note: MDPI stays neutral with regard to jurisdictional claims in published maps and institutional affiliations.

