Systematic Review

Predictive Analytics for Early-Stage Construction Costs Estimation

by
Sergio Lautaro Castro Miranda
1,
Enrique Del Rey Castillo
1,*,
Vicente Gonzalez
2 and
Johnson Adafin
3
1
Department of Civil and Environmental Engineering, University of Auckland, Auckland 1010, New Zealand
2
Construction Engineering and Management, Faculty of Engineering—Civil and Environmental Engineering Department, University of Alberta, Edmonton, AB T6G 2R3, Canada
3
Department of Quantity Surveying and Construction Management, Northland Polytechnic, Auckland 1010, New Zealand
*
Author to whom correspondence should be addressed.
Buildings 2022, 12(7), 1043; https://doi.org/10.3390/buildings12071043
Submission received: 8 May 2022 / Revised: 4 July 2022 / Accepted: 15 July 2022 / Published: 19 July 2022
(This article belongs to the Topic Advances in Construction and Project Management)

Abstract

:
Low accuracy in the estimation of construction costs at early stages of projects has driven the research on alternative costing methods that take advantage of computing advances, however, direct implications in their use for practice is not clear. The purpose of this study was to investigate how predictive analytics could enhance cost estimation of buildings at early stages by performing a systematic literature review on predictive analytics implementations for the early-stage cost estimation of building projects. The outputs of the study are: (1) an extensive database; (2) a list of cost drivers; and (3) a comparison between the various techniques. The findings suggest that predictive analytic techniques are appropriate for practice due to their higher level of accuracy. The discussion has three main implications: (a) predictive analytics for cost estimation have not followed the best practices and standard methodologies; (b) predictive analytics techniques are ready for industry adoption; and (c) the study can be a reference for high-level decision-makers to implement predictive analytics in cost estimation. Knowledge of predictive analytics could assist stakeholders in playing a key role in improving the accuracy of cost forecast in the construction market, thus, enabling pro-active management of the project owner’s budget.

1. Introduction

Cost management and knowing whether a final account is on budget or not is critical to measure a project’s success [1]. As an example, the Project Management Institute [2] highlights the importance of monitoring and controlling costs using estimates as baselines to achieve budgeting goals. Cost estimation is the process of producing cost estimates by quantifying and valuing the necessary resources to develop a project [3]. The process is iterative in the sense that estimates are updated according to the level of information that becomes available during the inception and design stages, which is fundamental for the decision-making process. The estimation of costs enables the determining of the project’s economic feasibility and the evaluation of alternatives, moreover, it can be a driver for the scope given the greater influence project owners have in the initial stages [2].
The most commonly used method to estimate costs in the early stages of building projects is the superficial area method [4]. This method, also called floor area method, consists of multiplying the total gross internal floor area (GIFA) by an appropriate cost/m², based on historical data [5]. This traditional method provides low accuracy ranging between −15% to +25% [6,7]. Increasing the accuracy and reliability of cost estimates is of utmost importance for the decision-maker’s ability to optimally assess alternatives and improve investment decisions early on in projects.
Predictive analytics is a term that has been used since 2006 to find and exploit relationships in data [8]. Some methods, such as regression analysis, have been used in statistics for 200 years, starting with the early Legendre and Gauss Least Squares Method, used to determine orbits about the sun from astronomical observations [9]. Other more recent techniques, including Artificial Neural Networks (ANN), Decision Trees (DT), and Case-Based Reasoning (CBR), have evolved with the increase in computation capabilities and the growing volume of data stored [10]. Predictive analytics has been classified as a subset of data science [11], with the aim being to elaborate empirical predictions [12]. Predictive analytics started being applied in credit scoring in the decade beginning in 1950 and has increased its presence and benefits in the areas of fraud detection, healthcare, marketing, insurance, and retail [13,14].
In the process of creating predictive models, the initial stages consider the collection and preparation of observational data related to the desired phenomenon to forecast. The amount of data is critical to achieving higher accuracy in the results [12,15]. Given the data-intensive nature of predictive analytics, two characteristics of construction information can make predictive analytics suitable for cost estimation. First, construction projects consume a large amount of information in the form of drawings, schedules, contract documents, and specifications [10]. Secondly, project data, including cost, are becoming highly structured with the aim of 5D building information modelling, which provides quantities in real time from the information linked to virtual models [16]. The potential of predictive analytics in the construction industry has been widely supported by the research developed since 2000 [15,17].
A review of 27 studies on the use of artificial intelligence to construction-cost estimation has revealed three main drawbacks in the research area: (1) the need to consider more modeling parameters; (2) the need for standard validation methods to estimate the accuracy of models; and (3) ambiguity and opacity of the experimental results [17]. In a later review, the modeling process sorted by technique was identified by analysing more than 100 publications related to artificial intelligence and parametric estimation for construction cost [15]. Elfaki [17] and Elmousalami [15] focused on providing guidelines to improve the experimentation and the modelling process from a research perspective. Yet, explicit benefits and implications for practice, such as the accuracy levels, have not been addressed. Predictive analytics has tremendous potential to benefit construction projects, but the industry has not widely adopted this new technology [10].
In this paper, a systematic literature review based on the approach suggested by Kitchenham and Charters [18] was conducted to explore the applications of predictive analytic techniques on the early-stage cost estimation of building projects. This review aimed to investigate how predictive analytics can enhance the practice by: (1) exploring the model’s input determination; (2) identifying the techniques used and accuracy of models; and (3) examining the direct benefits and challenges identified by the authors. The structure of the paper follows with a background of cost estimation and predictive analytics. Next, Section 3 reports the methodology, then the results and discussion are presented in Section 4. Finally, the conclusion is provided in Section 5.

2. Background

2.1. Cost Estimation

Industry organisations, such as the Royal Institute of Chartered Surveyors (RICS) in the UK and the Association for the Advancement of Cost Engineering (AACE) in the USA, have promoted the development of cost estimation, leading the engineering practice into the standardisation of cost-information management. The guides developed by the Royal Institution of Chartered Surveyors [5] have provided significant advances and contain sets of rules to estimate construction projects’ costs. Researchers have also contributed to the knowledge domain by providing crucial educational training material on cost estimation, presenting it as a control measure for all the stages of construction projects [3,4,19,20]. Nevertheless, the need remains for improvements in the understanding of the key factors of construction costs and their estimates accuracy [4].
Researchers have encouraged paradigm shifts in the construction industry, especially in the area of cost estimation [21]. Brandon [22] stressed the importance of putting under scrutiny the philosophy of estimation, proposing that the advance in computer hardware and utilisation of large databases would provide means to reduce the limitations of human abilities and move into simulations to model the reality. In the same line, understanding of the construction activity through principles found in the Japanese industrial production has intensified the research within the construction industry [23,24]. The need for innovation towards lean construction has led to different proposals to manage costs in construction projects, such as Activity Based Costing (ABC) [25] or Target Costing [26]. Despite these promising advances, the traditional philosophy to estimate costs remains broadly utilised in practice.
The main objective of cost-estimation practice, since its establishment within the discipline of quantity survey in the decade beginning in 1950, has been to provide a basis to control project costs with the elaboration of cost estimates [4]. Framed within the knowledge area of cost management, different cost estimates provide the necessary information for the decision-making process in the development of projects [2]. With the same perspective, [19] argues that the Royal Institute of British Architects’ (RIBA) Plan of Work (PoW) is conceived as an organised procedure for taking design decisions, with accompanying data to be included at various stages of the design evolution. And RICS New Rules of Measurement NRM 1 [5] identified the RIBA Plan of Work as a construction-industry-recognised model that organises the processes of designing and administering/managing building projects.
Given the nature of the link between cost estimations and the evolution of the projects’ designs, the techniques used to estimate costs will depend on the objective of the stage at which the project is in and the level of information available. In the inception stage, when the information about the project is limited and the main goal is to determine feasibility and viability of projects, cost estimates provide the information for investment decisions and a cost reference for the initiation of the design stage. In this early stage, preliminary cost estimates, also called Order of Magnitude estimates or Rough Cost estimates, use the statistical square area (superficial) method, also called floor-area method [2,4,5]. The superficial method relies on statistical data from previous building projects that are adjusted according to the location and year of construction, and it is widely used due to its simplicity, quick calculation because most published cost data are expressed in this form (square area), and is easily understood by the architect/designers and client. Alternative methods, such as cube and storey enclosure methods, are available in the early stages, but they have not been widely adopted in the construction industry as they involve more rigorous calculations than any of the previous methods and historical rates for use are not usually published.
In the design stage, the objective is to create a building design within the scope defined by the owner’s requirements and within the cost target defined in the earlier stages. This objective makes cost estimation a tool of control for the design in terms of cost. The estimate is called cost plan in the stage of design, and it evolves with the increasing level of detail in the design. This cost plan follows an analogous approach in which unitary costs from historical databases are assigned to the different project elements that are aggregated according to the total quantities and then adjusted using location and time indexes [4]. The subdivision of the buildings in elemental constituent parts, such as substructure, frame, upper floors, and roof, follow standard guidelines [5].
Contractors estimate costs in the tendering stage with the objective of elaborating budgets and controlling later expenses. Since the design is usually completed in the tender stage, it includes the details of the project, and, contrarily to the early stage Rough Cost estimate, the detailed cost-estimation process follows a bottom–up approach, in which the cost is estimated based on complete design documentation and by work packages associated with the work breakdown structure considering the necessary resources, e.g., labour, equipment, materials, and subcontractors [2].
Further, the RICS [5] illustrates the key components of a cost estimate. The base cost estimate is the total estimated cost of the building works, the main contractor’s preliminaries, and the main contractor’s margin (profit and overheads). Therefore, the base cost estimate contains no allowances for risk or inflation (that is, the risk-free estimate). Also, allowances for risk and inflation (i.e., fluctuations allowance in the basic prices of materials, labour, and plant during the period from the date of tender return to the mid-point of the construction period) are to be calculated separately and added to the base cost estimate to determine the client’s cost limit for the building project. In comparison with the foregoing submission, Smith and Jaggar [27] categorised contingency factors, including the risks involved during design development stages, as:
  • Planning contingency (e.g., planning restrictions, legal requirements, environmental concerns, and statutory constraints);
  • Design contingency (e.g., inadequate brief, aesthetics and space concerns, changes in estimating data, incomplete drawings, and little or no information about M&E services).
In an attempt to address uncertainty in cost estimation, risk management recognises that factors may affect the design phase of the development process, and the traditional way of dealing with them is to make a percentage contingency allowance. For example, the RICS [5] identified contingency provision as a key element that could be incorporated into a cost estimate. These contingencies are to provide for risks associated with design development, construction, employer-driven changes, and other employer-restrictive concerns.
In the early stages of projects, accuracy remains a challenge [6]. The accuracy of final estimates falls within the range of ±5% as the project approaches the tendering process [7]. Despite the critical importance of the early stages mentioned in the previous paragraphs and the low accuracy of traditional methods, alternatives supported by computational advances have not been widely adopted in the construction industry [4].

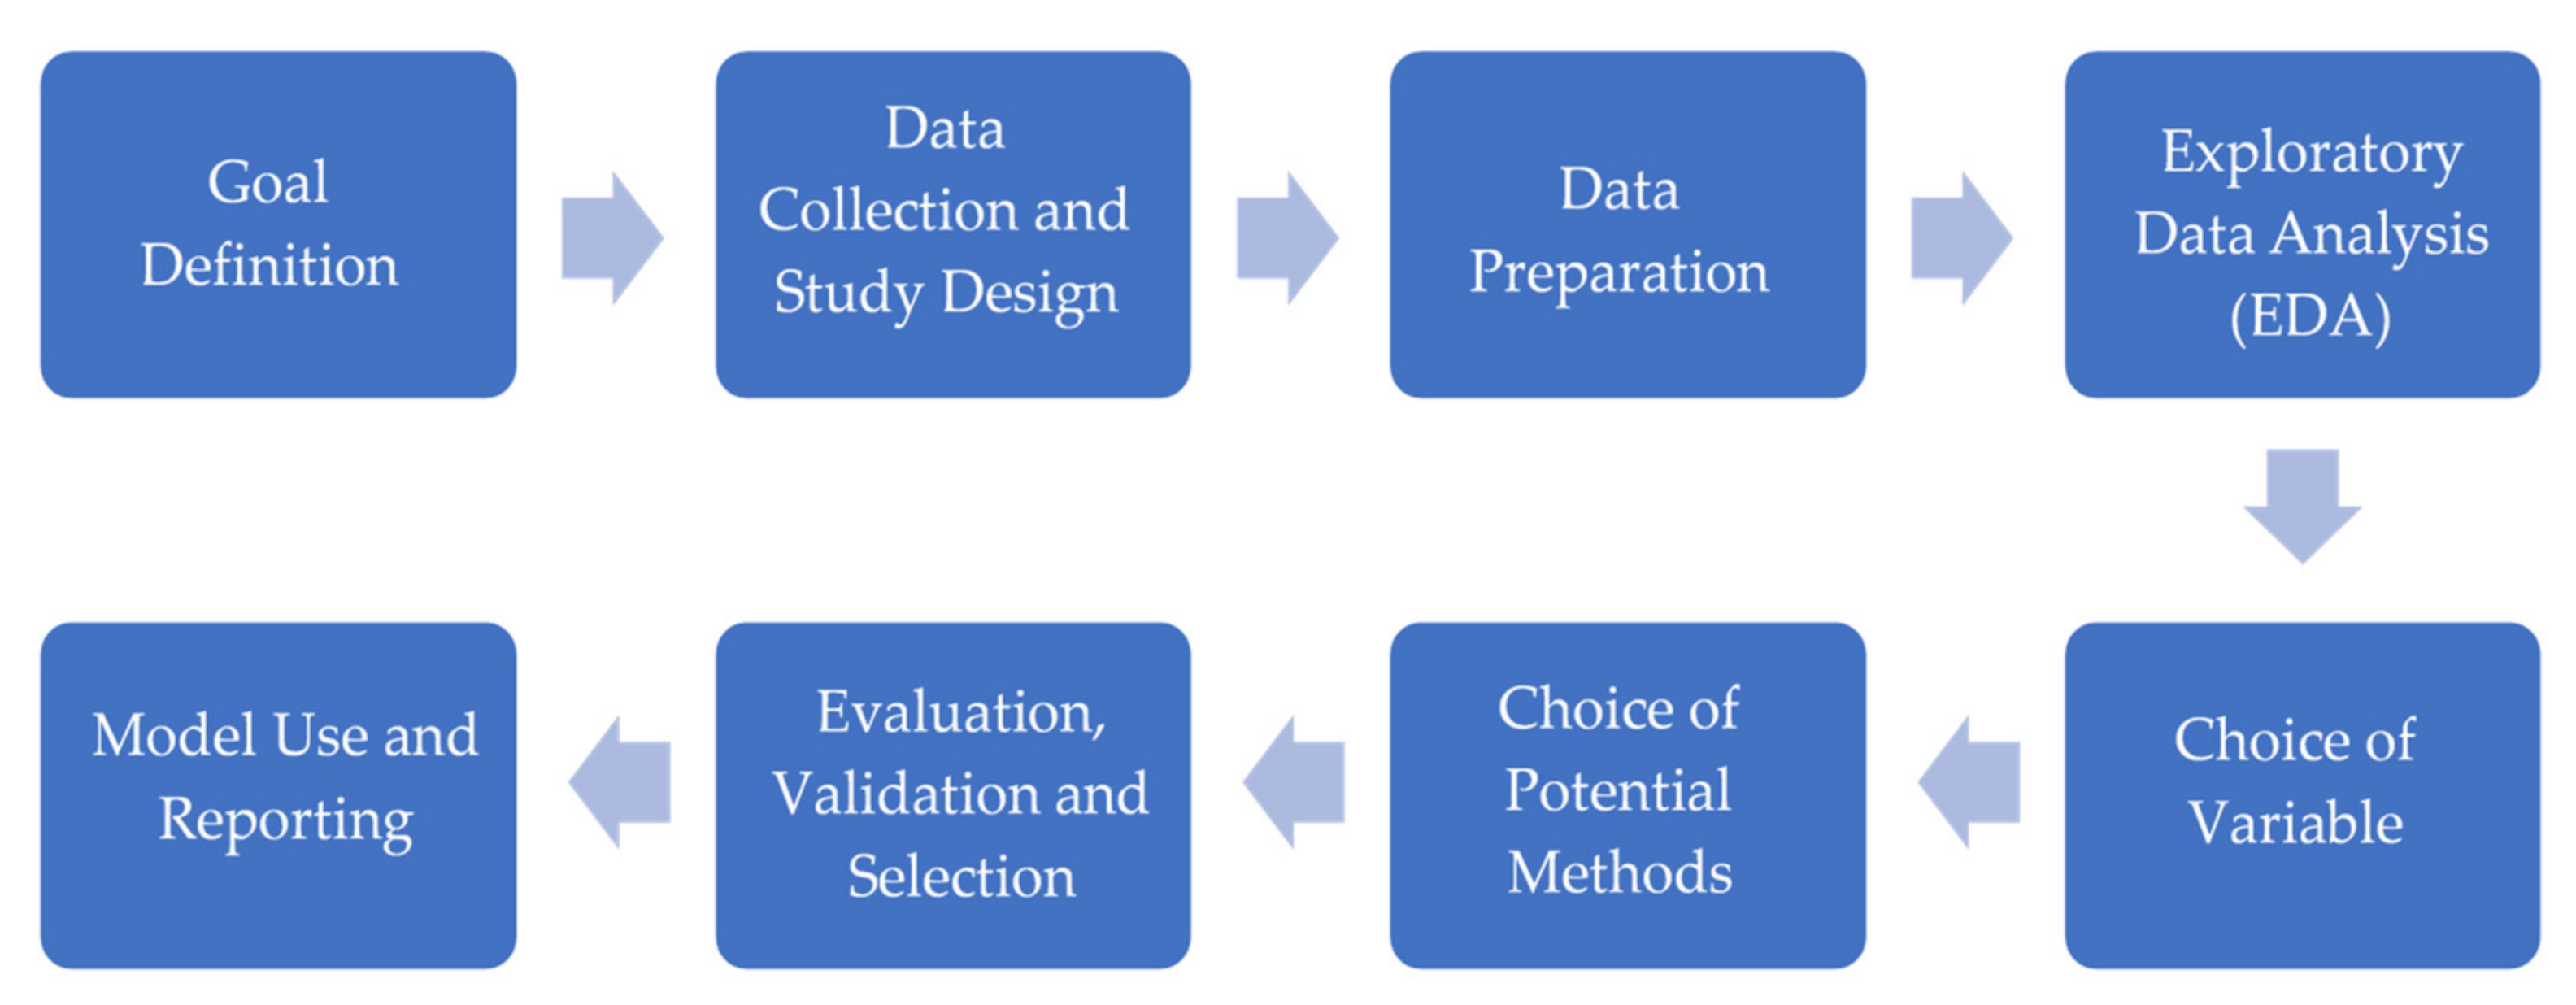
2.2. Predictive Analytics
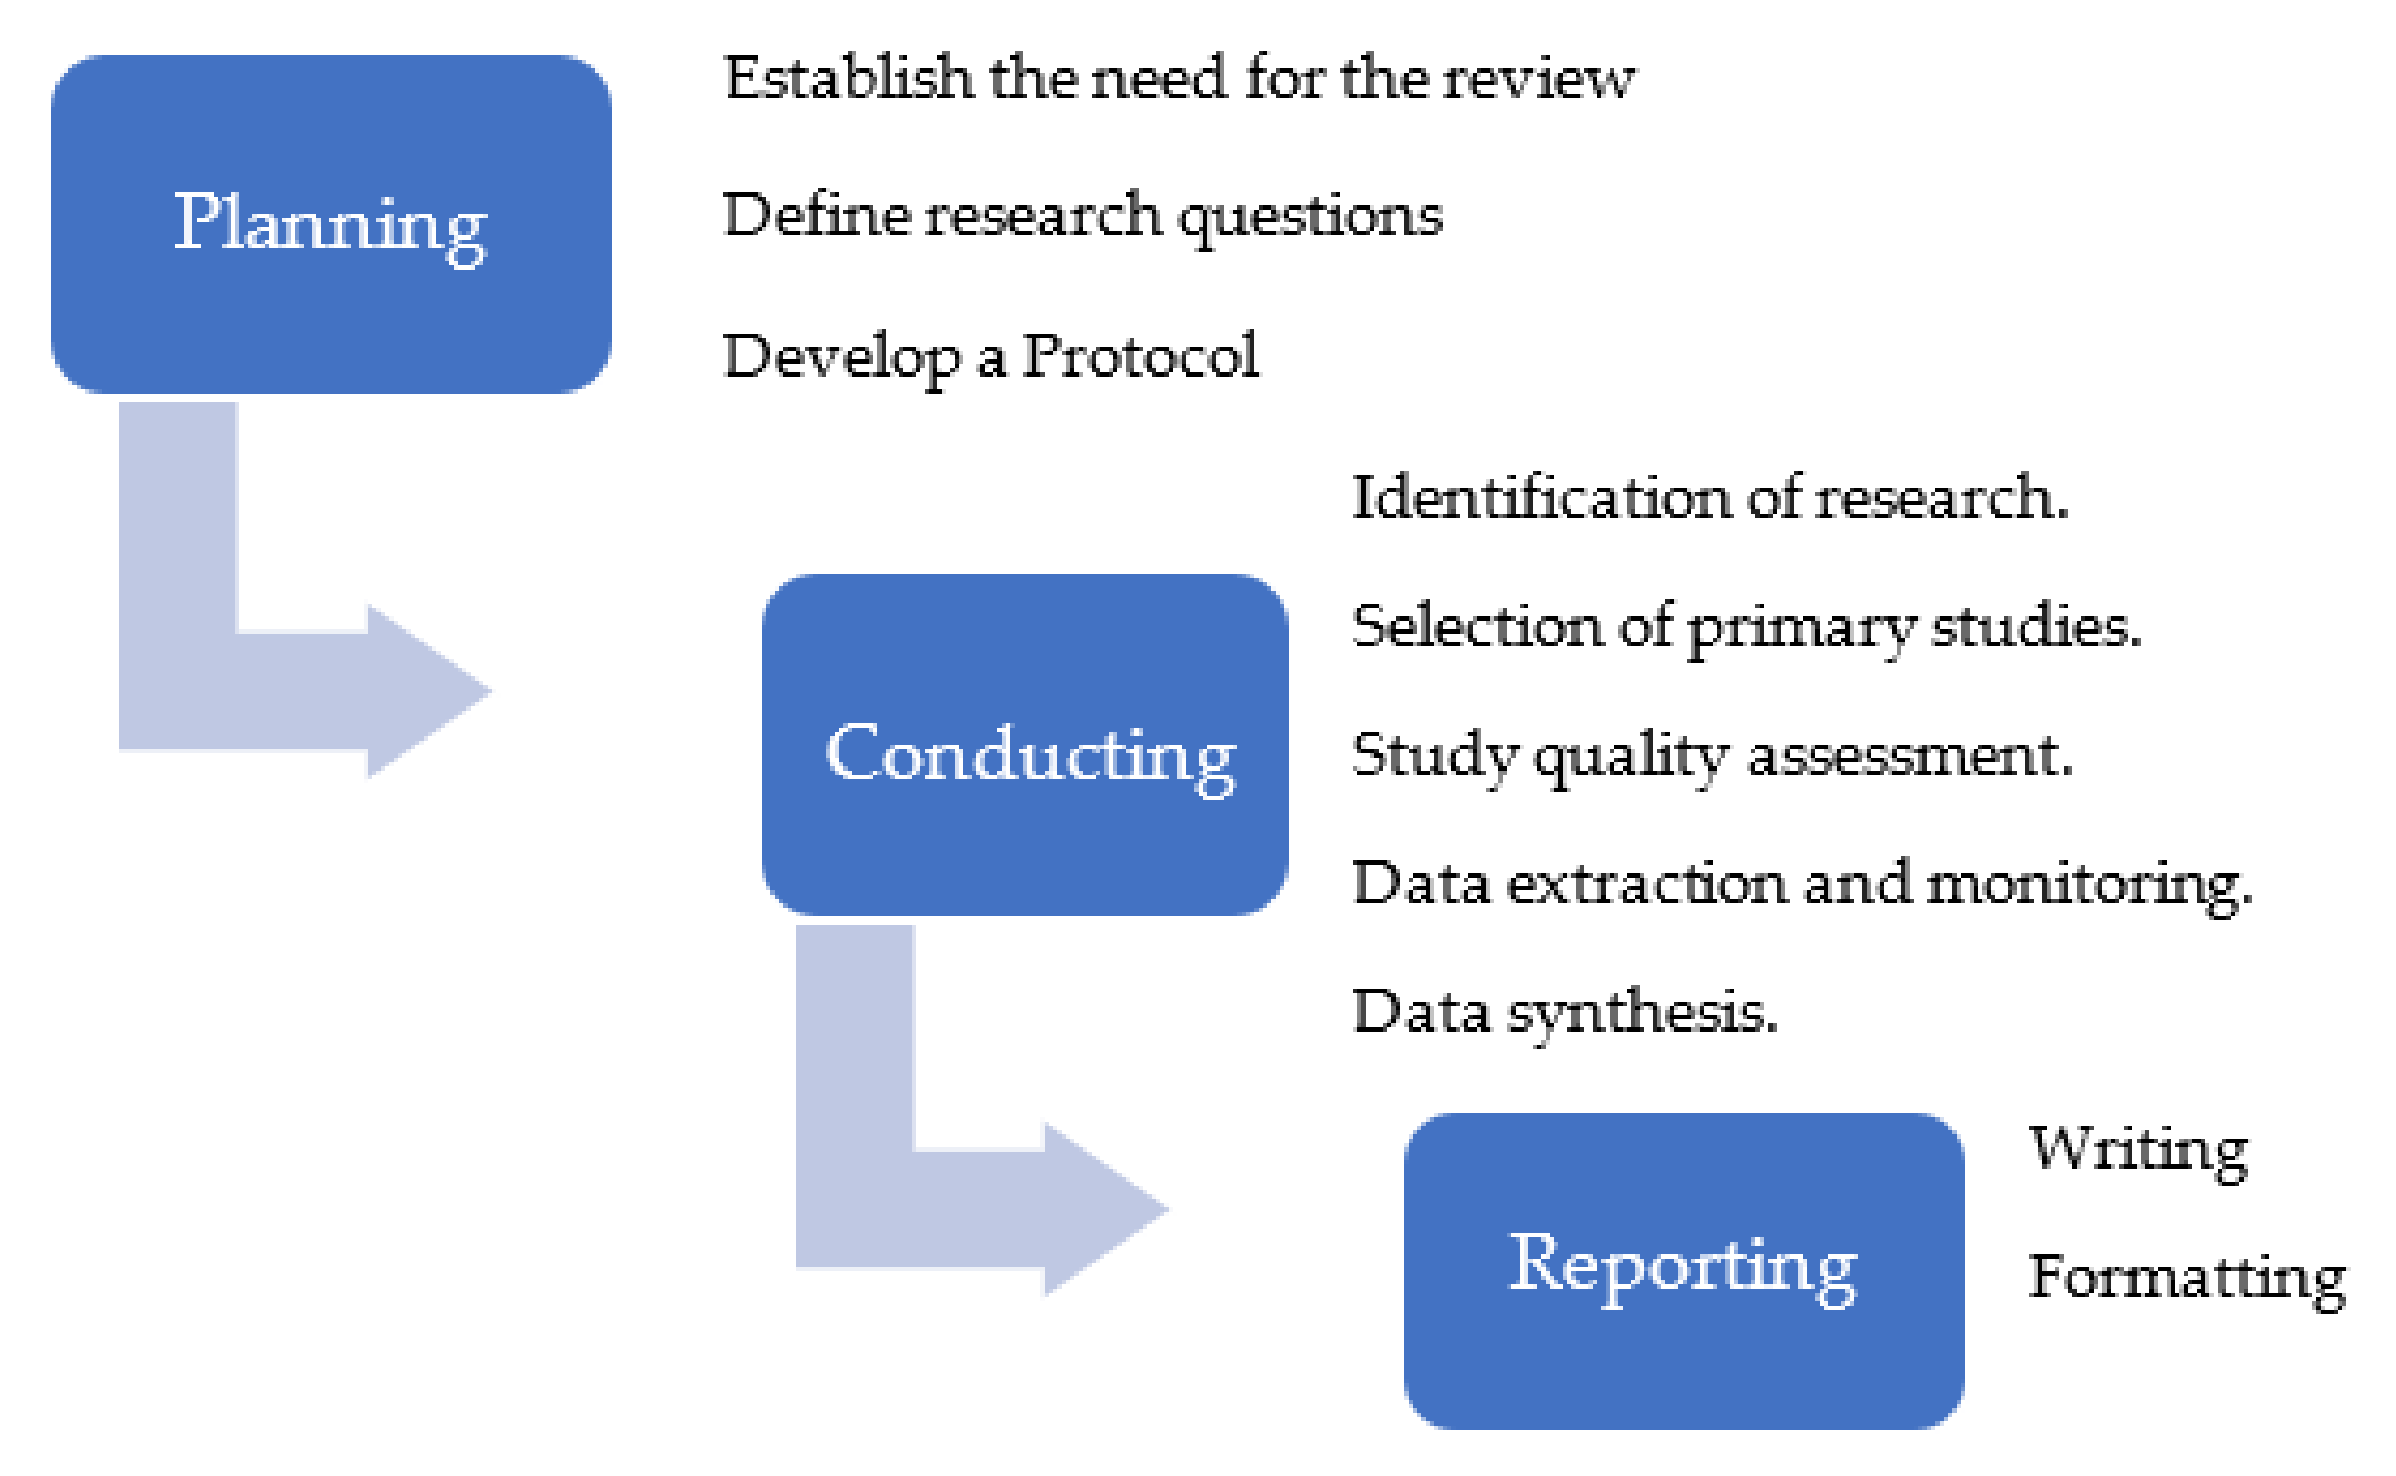
The concept of predictive analytics can be understood as the systematic analysis of data to elaborate models for prediction using computational techniques. Predictive analytics has been used since the decade of the 1950s [28]. Shmueli [29] stated that predictive modelling aims to predict future observations as a process using data-mining algorithms or statistical models to data. Predictive analytics techniques have been applied successfully in different areas, such as marketing and finance [30], to prevent bank fraud, according to Boyacioglu [31], and in medical areas, for the prediction of diseases, such as diabetes [32]. The increasing capacity of data transmission, the increasing amount of data stored by organisations, and the higher processing capacities have boosted the use of predictive analytics in industry [33]. Despite these advances, the uptake in the construction industry is behind compared to other industries, such as financial services, transportation and logistics, and energy and resources [10,34].
A complete process of constructing predictive models consists of the steps shown in Figure 1, where the initial consideration in the modelling process is the appropriate identification of the main model’s objective from a predictive perspective, followed by the data collection and study design. Large-size data and data of an observational nature within the same population are considered optimal for higher accuracies. The data-preparation step has two main issues. Missing information can be helpful if the data is informative enough of the output, but, if not, these data need to be handled by removing observations or parameters by utilising dummy variables or developing different models according to the missing data distribution [29]. The second issue relates to data partitioning for testing purposes. The data set should be randomly partitioned into two parts, one for training the model and the other one to evaluate the predictive performance of the final model.
The Exploratory Data Analysis (EDA) follows the data-preparation step and is used informally in predictive analytics to synthesise the data graphically and numerically to capture unknown or not formulated relationships [12]. Additionally, EDA is used to reduce the dimensionality of the data by reducing the number of parameters and to reduce the sample variance. Some methods, such as Principal Component Analysis (PCA) and Factor Analysis, can be used to assess relations between parameters of potential models. Variable inputs or parameters are chosen considering the relation between input and output, the data quality, and the availability of the parameters at the moment of prediction. Although the accuracy of the models mainly influences the model’s choice, techniques with higher accuracy sacrifice interpretability and objectivity of models. The many available techniques used in predictive analytics can be classified as linear and nonlinear models. Linear and logistic regressions are the most common techniques used for data modelling. Although, with higher chances of overfitting models, techniques such as Decision Trees, Artificial Neural Networks, Support Vector Machine (SVM), and Fuzzy Logic Systems (FLS) have the capacity of modelling nonlinear relationships [30]. Case-Based Reasoning (CBR) is also a common technique studied to elaborate predictive models.
The evaluation and validation are the main criteria for assessing the predictive power of a model [12]. The model selection aims at identifying the appropriate level of complexity leveraging bias and variance for higher accuracy. Model evaluation is conducted by assessing the accuracy of the models using out-of-sample data. The use of statistical significance variables such as R-squared are considered a minor role, while generic predictive measures on observational data such as Root Mean Square Error (RMSE) and Mean Absolute Percentage Error (MAPE) are more typical metrics of accuracy. The selection of out-of-sample data depends on the method of validation used for the model’s evaluation. The two methods, hold-out cross-validation and k-fold cross-validation, are standard for validation of models [35]. The hold-out cross-validation method is the most straightforward approach and involves splitting the data into a training dataset and a testing dataset. In the second method, k-fold cross-validation, the same data is used to train and test several models. The data selected for testing and training purposes are different on each train session, but the average of the test results should provide better estimates than individual test results [35].The extreme case is when the number of subsets is the total number of data points, and it is called Leave One Out Cross Validation (LOOCV). Validation methods also help to overcome the challenge of model overfitting, which occurs when a model fits the data for training to the extreme of not being able to predict new data [12]. The model use and reporting stage relate closely to the predictions and the performance measures where results need to be translated into new knowledge following the initial objectives.
The following section describes the research method followed in this paper to investigate how predictive analytics can enhance the practice of cost estimation.

3. Methodology

Systematic literature reviews can support the development of a new knowledge base for practitioners and managers to provide collective insights [36]. According to Borrego [37], these rigorous reviews have become a significant source of evidence in medical research and are gaining importance in areas such as psychology and education. On the other hand, Denyer and Tranfield [38] highlighted the potential of systematic literature reviews as an evidence-based approach for management research. According to Pan [39], the two guidelines have become well-known guidelines for systematic reviews, the Preferred Reporting Items for Systematic Reviews and Meta-Analyses (PRISMA) and Kitchenham guide [18,40]. Although the PRISMA has been designed primarily for studies that evaluate the effects of health interventions, Page [40] argues that its check lists items are applicable to other areas and it has been adopted for global standards when conducting systematic literature reviews. However, Denyer and Tranfield [38] exposed that fit-for-purpose methodologies should be developed according to the unique characteristics of the study’s design. The present review focused on implementing predictive analytics techniques, which have evolved in the area of informatics requiring intensive use of computation applications. Since the guidelines by Kitchenham and S. Charters [18] for systematic literature reviews have been adapted from the medical and psychology, and according to Ayodele [41], implemented in computer science, the study has followed such guidelines considering them appropriate to address the research objective. A step-by-step description of the methodology is illustrated in Figure 2. Overall, the review process consisted of three main stages—planning, conducting, and reporting the review.
The planning stage was the most crucial part of the review because it provided a guide for the activities necessary to address the research objective. Accordingly, the first step in this stage was to identify the need for the review. For this purpose, a scoping review was conducted in the area of estimation, focusing on their challenges and future trends. A further review of cost modelling techniques allowed to establish the need to aggregate the individual results of the studies and transform them into recommendations for its uptake. In the second step, the consequent objective of investigating how predictive analytics can enhance cost estimation was divided into three questions:
Q1. How does predictive analytics determine the input parameters of models, and what are the parameters commonly used?
Q2. What is the predictive power of the predictive analytics techniques to forecast the construction cost in the early stages of building projects, and what are the most explored techniques?
Q3. What are the benefits and challenges in the use of predictive analytics techniques in cost estimation?
Following the suggestions on Kitchenham and Charters [18], the third step was to create a protocol for the inclusion of the fundamental procedures for the conduction of the review. This formal document is essential in systematic literature reviews because it is a plan helping to maintain objectivity in the research [36].
The second stage, conducting the review started with the identification of research. The database search engine selected was Scopus and the target material for the review was published applications of predictive analytics for estimating the costs of building construction projects in the early stages. The search syntax was TITLE ((cost OR costs) AND (estimation OR prediction OR modeling OR modelling OR model OR estimate) AND (buildings OR construction OR projects)) and it returned 1586 documents.
Aiming at finding resources to answer the research questions, the selection of primary studies was done based on the inclusion criteria which also considered as excluded from the review any study not fulfilling all the indicators. The following list contains the criteria used to include and exclude literature:
  • Only literature published between 1974 and May 2022;
  • Only studies from journals and conferences written in English;
  • Only studies focusing on early-stage cost estimation;
  • Only studies implementing predictive analytic models to estimate cost;
  • Only focusing on building projects;
  • Only studies using percentage error as accuracy measure of the final cost;
  • Only studies providing the accuracy results and parameters used; and
  • Only studies using real data of buildings.
The selection of primary studies was conducted in two phases, first, by analysing the titles and abstracts and, then, a second selection was made by fully reviewing the studies. In the first filter, candidates were excluded when their characteristics were clearly against the selection criteria. In the second filter, a study was selected only when it fulfilled all the selection criteria. The preselection narrowed the list of papers from 1586 down to 127, and then, the full review allowed to identify 30 papers. A backward and forward snowballing process was performed on the 30 articles following the previous approach and following the suggestions provided by Wohlin [42]. With this process 16 additional studies were identified, finalising with 46 papers in total.
Quality assessment of studies using a variety of empirical methods remains a major problem [43]. In order to control the quality of the studies in the review, the presence of their publication venues in the Scimago H index and Google h5 index, together with the number of citations on Google Scholar were part of a quality-monitoring process.
In data extraction and monitoring the necessary information from the articles was imported from the Scopus search list in an XML format extraction and stored in an Excel sheet. This information consisted of title, authors, year of publication, venue, and number of citations until May 2022. In addition to the bibliographical data, the following content data items were sought to answer the research questions.
-
Venue type;
-
Venue name;
-
Country of study;
-
Publication date;
-
Number of citations;
-
Scimago H index;
-
Google h5 index;
-
Type of buildings;
-
Data source;
-
Sample size of data set;
-
Number of parameters used in the models;
-
Mean absolute percentage error;
-
Parameter identification method;
-
Method to optimise parameters;
-
Rankings of parameters;
-
Type of technique;
-
Sub technique compared;
-
Component of the model improved;
-
Techniques compared;
-
Type of validation;
-
Sample size;
-
Benefits; and
-
Challenges.
Systematic literature reviews typically use meta-analysis to combine and assess quantitative experimental results [44], but the present study used a statistical descriptive and content analysis approach. The bibliographic information was first analysed to have an overview of the publications and to understand the context of the research area. The compilation was synthesised into the items, date of publication, number of publications distributed in time, and origin country of the study.
The synthesis of the data to answer the research question one provided the number of techniques used in the process of selecting the initial parameters of the models and the parameters most used. To determine the parameters, the ranked lists of parameters provided in the studies were aggregated by the Borda–Kendall technique. This method was selected because its use has been widely implemented for rank aggregation and the derived techniques are intuitive and easy to understand [45,46,47].
The techniques implemented in the studies and the accuracy of the models were collected to answer the second research question. The numbers of techniques most explored were grouped as percentages. The accuracy of the models was summarised in averages and distributed in quartiles, while the second component of predictive power, validation methods, were grouped by type.
In answering research question three, benefits and drawbacks of the utilisation of predictive analytics techniques in cost modelling were compiled using reciprocal translation, which allowed integrating different terms describing the same meaning [18]. The ideas were extracted only from the discussion and conclusion sections to ensure they were derived from the experimentation. These were tabulated and ranked according to the number of authors mentioning them. The last stage of systematic literature reviews is the report. For this purpose, the report followed the protocol structure since it contains the fundamental elements of the review.

4. Results and Discussion

This section presents a synthesis and discussion of the data extracted from the 46 studies selected in the systematic literature review. The first subsection provides an overview of the bibliographical features of the publications, followed by a discussion of the input parameters, the predictive power, the techniques used, and the benefits and challenges of predictive analytics techniques implemented in the studies.

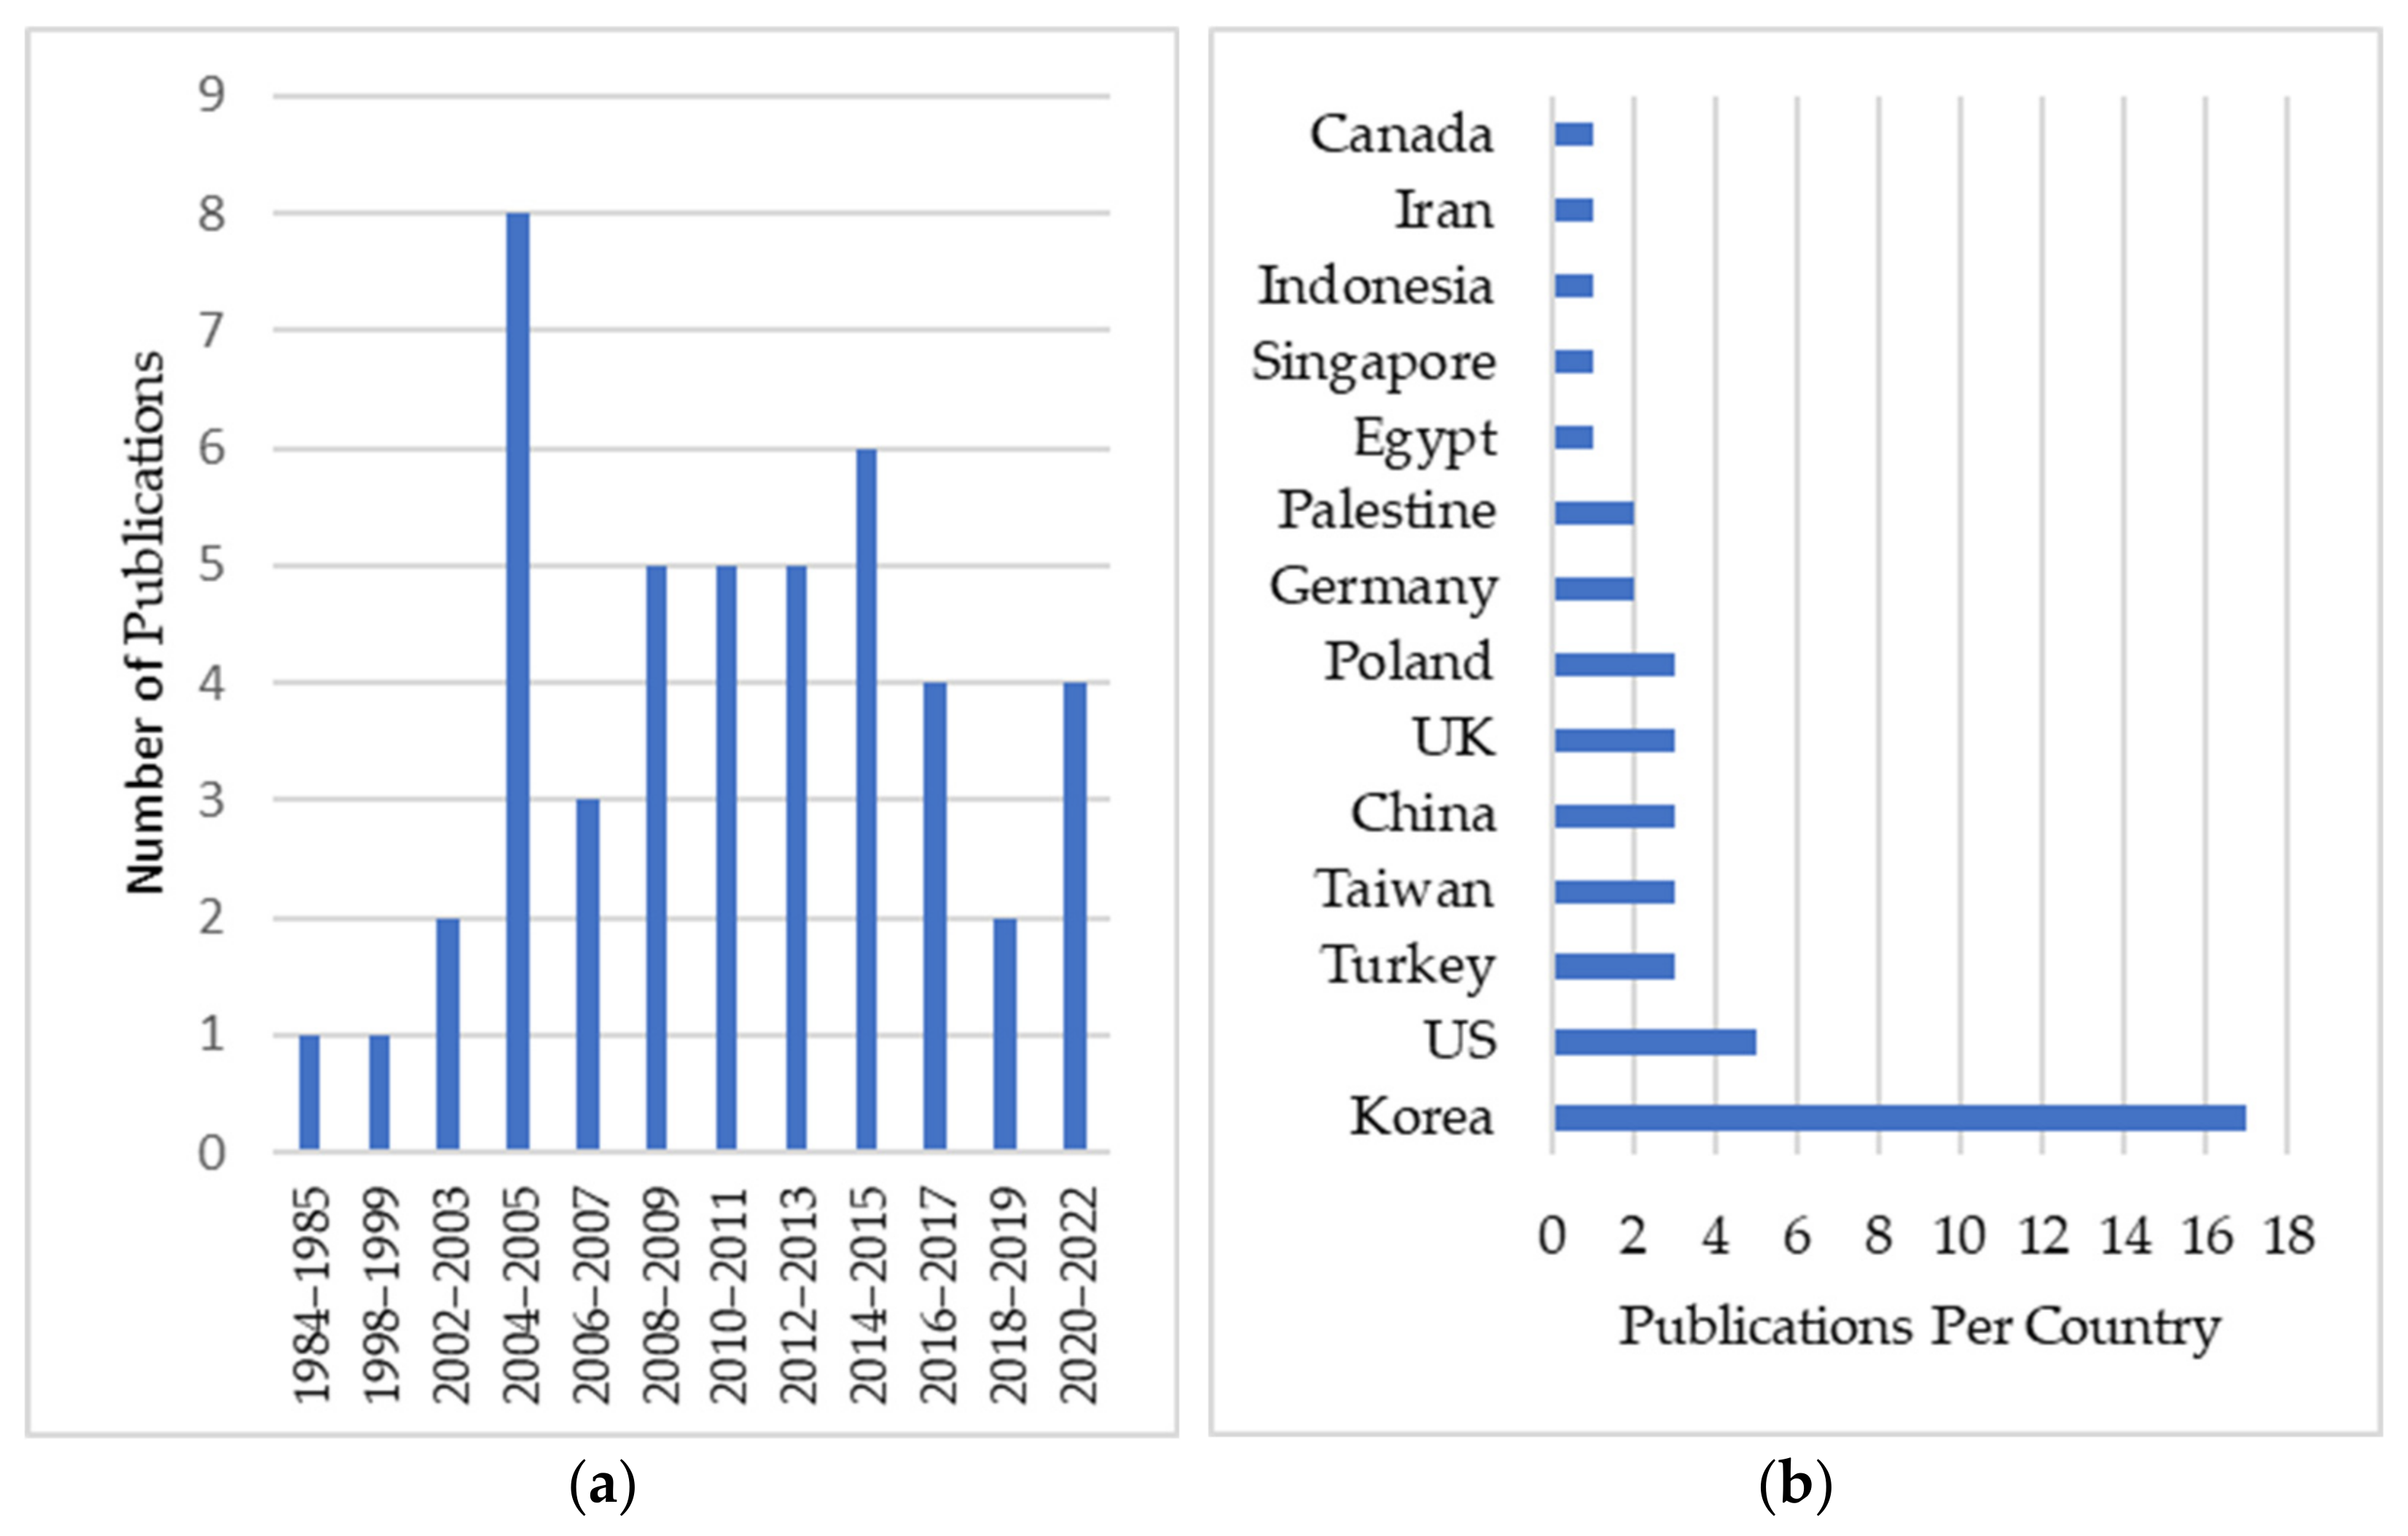
4.1. Studies Description

From the 46 selected studies five were from conference papers and 41 from journals. The largest number of publications corresponded by far to the Journal of Construction Engineering and Management with 11 studies (24% of the total). The studies dated from 1974 to 2022, but only two of them were published before 2000, Elhag and Boussabaine [48] and Karshenas [49]. These papers have seminal material in the area of cost modelling of building projects. As can be seen in Figure 3, the number of publications in the research area increased from 2000 and until 2014–2015, presenting a spike in 2004–2005. From 2014–2015 until 2018–2019 the research activity decreased, and in the last period of 2020–2022 the publications increased. The reduction of publications suggested that the research area may have reached a maturity level, where a next stage in the research area may be appropriate to be explored. The graph of the same figure presents Korea as the most prolific country after the United States with 17 and five studies, respectively. The Korean presence in the research area can be explained by the dedication of researchers, such as Gwang-Hee Kim and Sae-Hyun Ji, who together are authors of 13 of the 17 studies.
The top 10 most cited documents in Google Scholar are shown below in Table 1. Kim et al. [50] present the highest number of citations, 617, and was the first publication comparing the most promising techniques for cost estimation, Multiple Regression Analysis (MRA), Artificial Neural Networks (ANN), and Case-Based Reasoning (CBR). In this study the high accuracy achieved by the three techniques, and, particularly, the transparency of CBR in explaining the results, suggest predictive analytics techniques can be a feasible alternative to traditional cost estimation in the early stages of projects. Kim et al. [50] and the rest of the top 10 publications, having over 100 citations each, have become a reference in the research area of cost modelling not only for building projects but for general construction projects.

4.2. Models Input Parameters

Even though the performance of cost models heavily relies on the appropriate identification of the cost drivers, the data available is the fundamental input to elaborate the models. This section starts presenting the relevant features of the data used in the studies, such as data source, type of buildings, and quantity of data. Next, two approaches used to identify and select the parameters from the data are presented. Then, the most predominant parameters used in the studies are shown in the form of an aggregated ranking.

4.2.1. Data Utilised in the Studies

In predictive analytics, the data used for modelling should, ideally, be extracted from a population of similar characteristics to achieve more accurate predictions (Shmueli and Koppius [12]. In this sense, prediction accuracy is strongly linked to the data characteristics. The general type of buildings identified in the systematic literature review was multistorey, and subclassifications were identified according to their use, e.g., residential, schools, office use, or mixed. Also, seven studies specified the structure type of the building used. The source of data was also not uniform. Twenty-three studies expressed that its data origin were general contractors, public databases, theses, and other public and private organsations. General contractors and databases were the most commonly used data sources, and 22 did not provide details about the source of data. Transparency in this regard is an issue to improve in the research domain due to the fact that reliability of the input data is crucial to achieve reliable results [10].

4.2.2. Qualitative Identification/Selection Approach

Selecting the initial parameters is a fundamental step in the modelling process. Shmueli and Koppius [12] and Elmousalami [15] have identified the first of two phases as a qualitative process in which combining domain knowledge, theory, and exploratory analysis is fundamental to give grounds for the inclusion of inputs. The method to identify the potential parameters and the number of related studies is shown in Table 2, where 23 studies identified potential parameters from literature reviews or/and expert knowledge, and six used the researchers’ criteria. Two studies selected the parameters from the data available, and the rest did not specify the process to select them. Notably, publications from journals provided initial parameters for the studies [53,54,60,61,62,63,64]. The compilation of expert knowledge was realised by interviews and questionnaire surveys. Elaborated techniques to acquire information, such as a Likert Scale, Delphi method, and Analytic Hierarchy Process, are standard according to Elmousalami (2020), but only five studies implemented them.
The process followed in the studies to identify potential parameters can be improved by the use of both expert knowledge and previous literature, in order to increase the credibility of the outcomes and to improve the model’s performance. Predictive analytics is a relatively new area of research that has evolved with the developments in informatics. Therefore, its guidelines are still being tested, but robustness in research needs to be a priority regardless of the innovations in technology. Secondly, experts in the area of cost estimation and architects were surveyed, but developers’ knowledge was considered only in Stoy et al. [65], where the developers are the individuals making crucial decisions regarding investment options in the early stages of projects.

4.2.3. Quantitative Identification/Selection Approach

Dimension reduction is a method within exploratory data analysis used to reduce the number of parameters and to increase predictive accuracy [12,15]. In this regard, of the 46 studies, 27 utilised exploratory methods, used also to weight the parameters in the CBR models [59,66,67,68,69]. Table 3 shows the optimization parameters methods reviewed and the number of related studies. Nine of the studies implemented stepwise regression analysis. Methods such as PCA, Correlation Analysis, and Factor Analysis are commonly used to analyse cause–effect relationships, but these also provide a reduction in the number of parameters to achieve more accurate models. Although the main objective of predictive analytics is to produce models that forecast costs, the techniques used in the studies can determine the strength of the relationship between parameters and also the relative strength of its effect on the output. This information can serve decision-makers as guides in the subsequent stages to optimise the building features in the design stage.

4.2.4. Parameters Used

The size of the data has significant effects on the accuracy of the model. The more extensive databases are, the less sample variance and model bias are obtained. In addition, testing the modelling process requires the use of additional data. Shmueli and Koppius [12] stated that guidelines to set the minimum data size are difficult to define, although a commonly used rule of thumb of using 10 times the number of parameters is considered reasonable in computer experiments [86]. Following this criterion, 19 of the 46 studies had less than 10 data points per parameter, 24 had 10 or more data points per parameter, and three did not mention the total number of datapoints. Meta-analysis was not performed in this review, but the average MAPE of studies using 10 or more data points by parameter was 7.6%. On the other hand, the studies using less than 10 data points per parameter achieved 10.7% of average MAPE. This situation suggests that more extensive data relative to the number of parameters may produce better results.
The studies considered different parameters for their models, classifying them as quantitative and qualitative. Twenty-seven of the 46 studies (59%) provided the parameters used in the models in the form of ranks. The different authors developed these lists with the different methods from the quantitative approach and mean sensitivity ANN analyses from the results of the modelling processes. The Borda–Kendall technique, was used to synthesise the lists of the individual rankings into one aggregated ranking list. This method was used to acquire a generic view of the relative importance of the parameters within the studies.
For the calculation of the ranking of parameters the Borda rule represented as the vector of weights:
w = (n, n − 1, …, 2, 1),
which applies to a set of complete or partial ranked lists of n alternatives where wi is the weight attached to an alternative located at the ith rank in any given list. Then, the cumulative score Cs for the ith alternative is given by:
Csi = ∑wij,
which is the weighted sum over all the lists, j, corresponding to the rank in each list for the ith alternative [87].
In the study, 78 were the total alternative parameters n from 27 lists, so the parameters in the first place of the lists had a score of 78, the ones in the second, a score of 77 and so forth. Then, the sum of scores by parameter allowed to elaborate the rank.
Note that the ranking corresponds to data from different locations, and it would require further examination to consider it a representative ranking of general buildings in different locations.
The rank aggregation provided a rank of 78 parameters. The 10 parameters with the highest scores are shown in Table 4. The Gross Floor Area (GFA) and the number of floors are the two most important parameters, having scores significantly higher. The rest of the parameters may not be the principal source of costs, but their consideration in the cost models elaboration may increase their predictive power. Notably, the parameters of foundation type, type of roof, structure type, and location are measured in categorical scales. Therefore, the ability of predictive analytics to deal with categorical scales enhances its usability for cost estimation.

4.3. Predictive Power
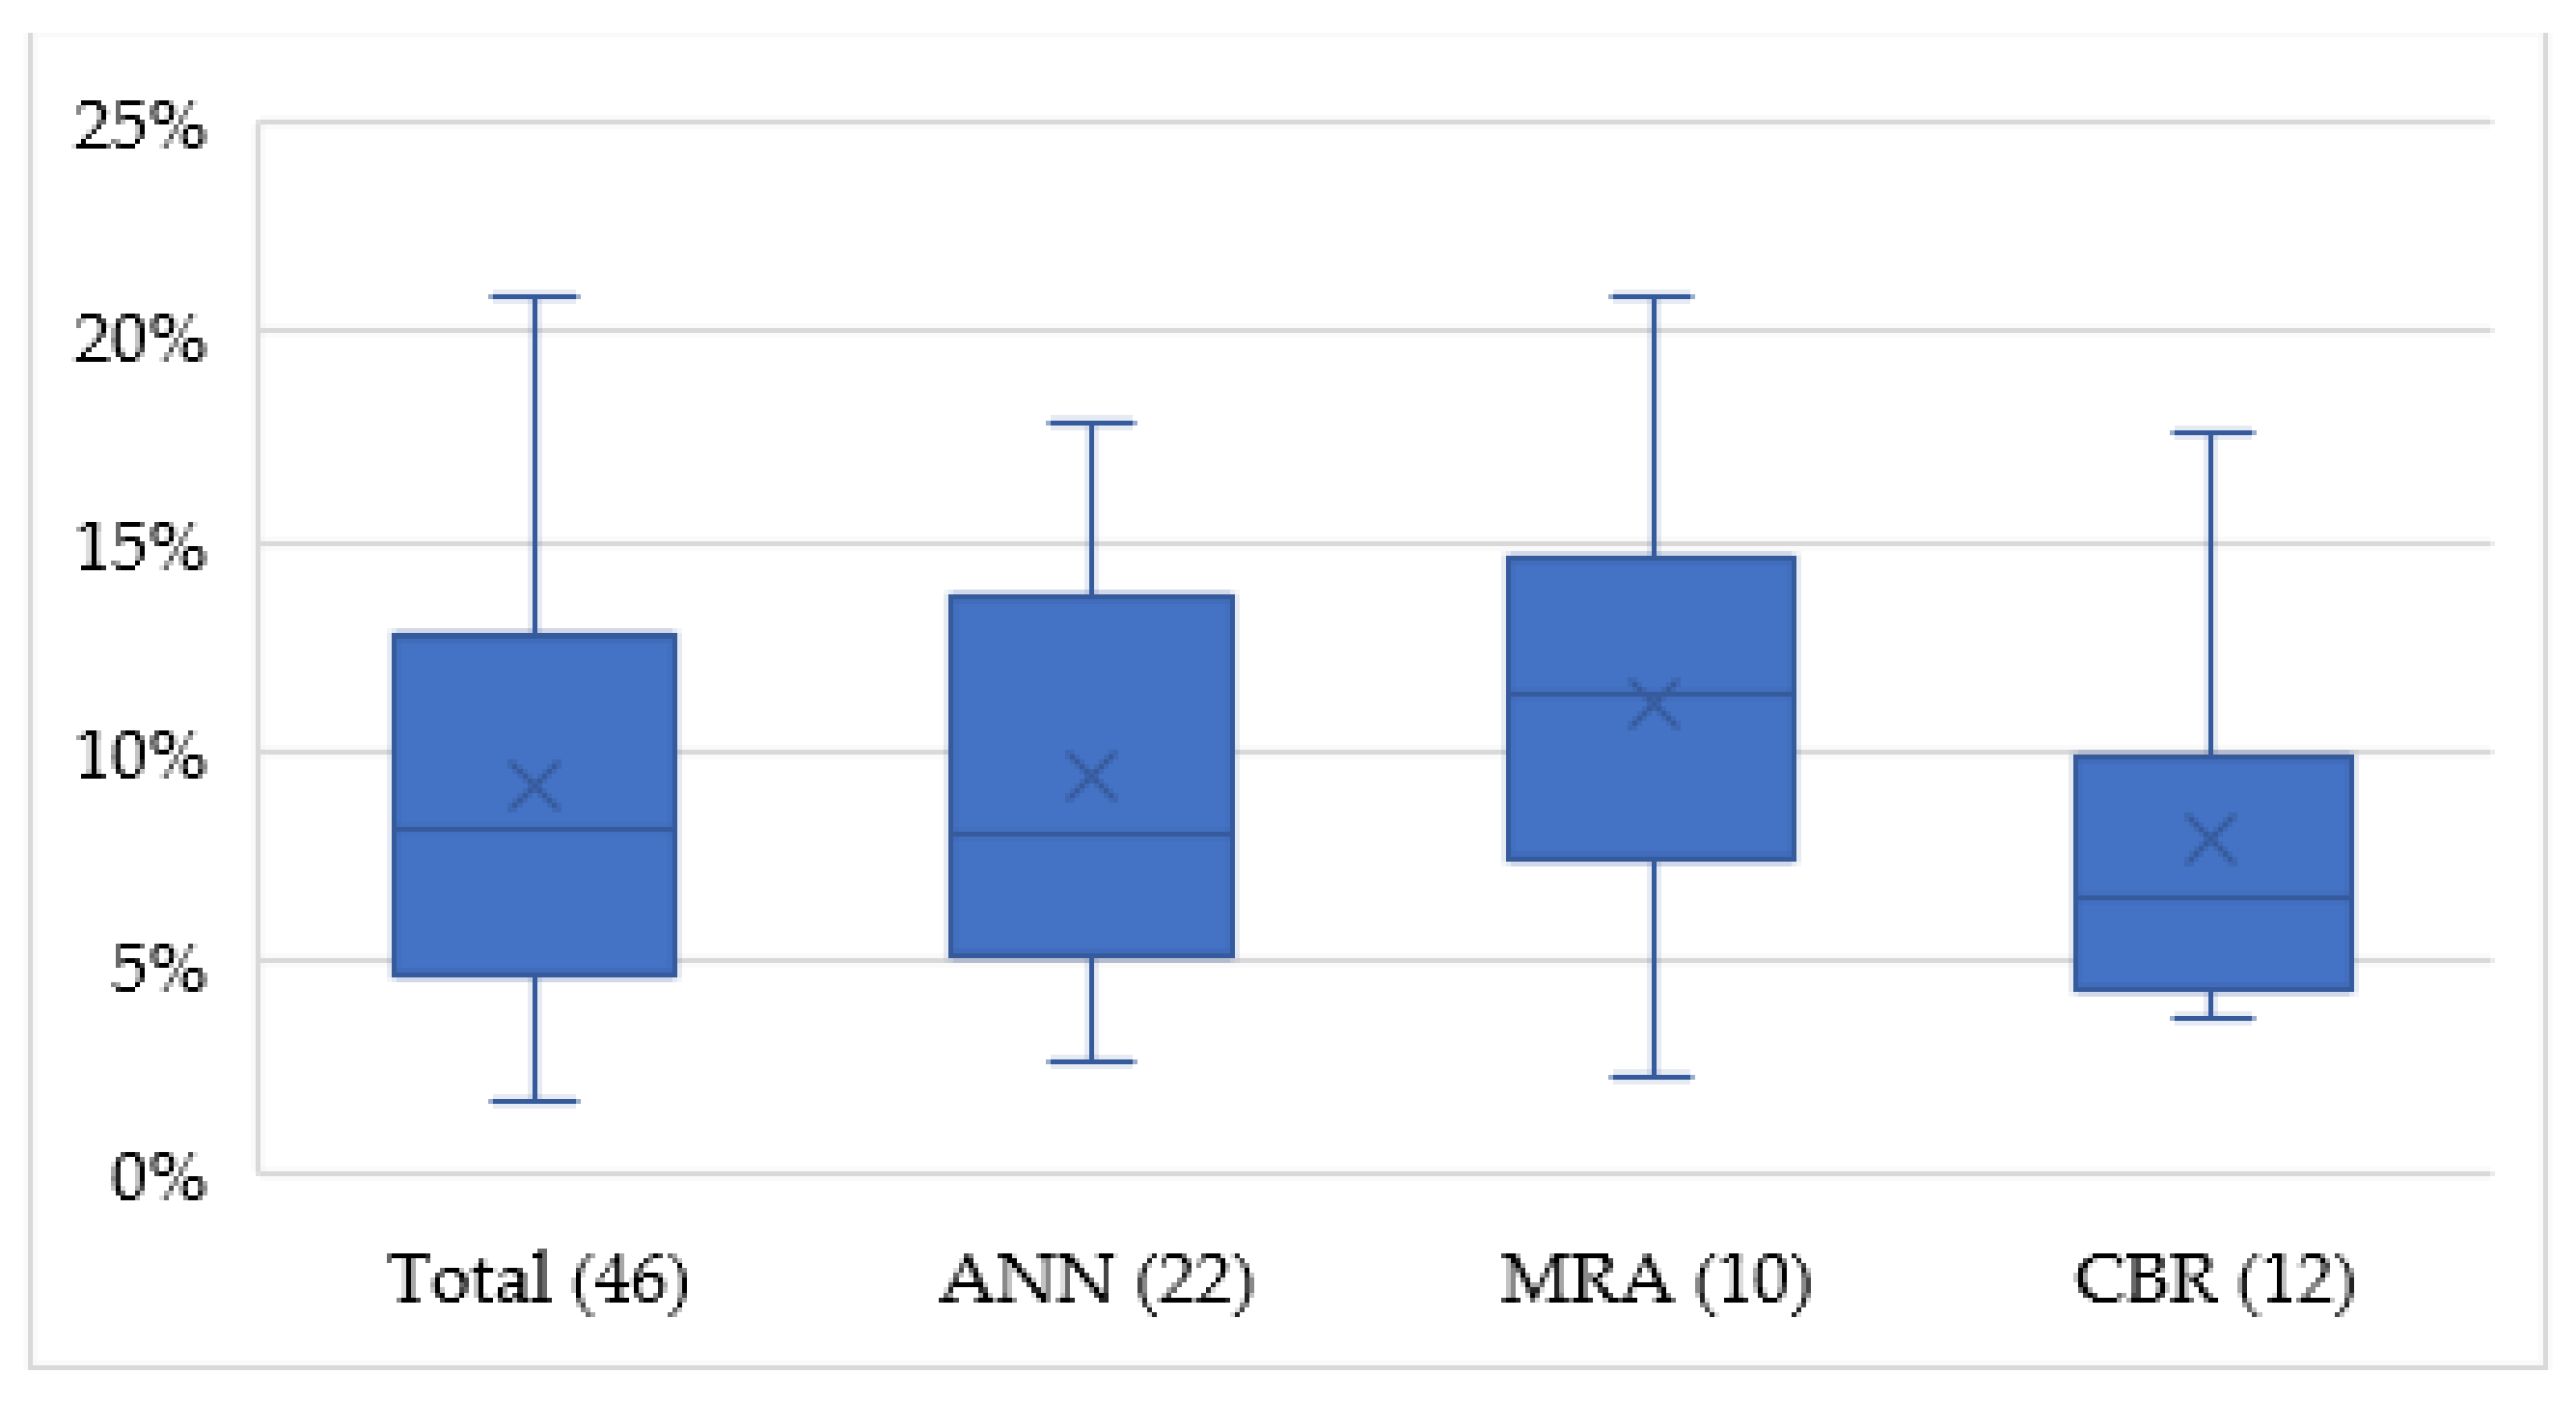
Predictive accuracy, also known as predictive power, is the model’s ability to elaborate accurate predictions of new observations [12]. Two criteria need to be met for an adequate test of predictive performance: assessment of the model’s accuracy using adequate predictive measures, and determination of the appropriate validation method [12]. Root Mean Square Error (RMSE), Mean Square Error (MSE), and MAPE were commonly used generic predictive measures, but the first two are scale-dependent and should not be used when comparing across datasets that have different scales [88]. MAPE, being scale-independent, was an appropriate measurement to analyse the studies’ models under a standard accuracy measurement. For the second criterion, the review synthesised the method of validation, which defines how the data is partitioned and tested for accuracy. The following subsection introduces accuracy measurements in the studies, followed by the validation methods.

4.3.1. Accuracy

The most critical feature of models for predicting events is its accuracy. It is fundamental, especially for decision-makers, when assessing investment opportunities with rather limited information. The average accuracy error of all the models included was under 10%, with a standard deviation of 5%, as shown in Figure 4. The use of ANN resulted in a slightly more dispersed distribution of the second and third quartile compared to MRA and CBR, but its overall dispersion is smaller than MRA. On the other hand, CBR presented the narrowest overall and second-third quartile distribution of MAPE, additionally, the range position of the two quartiles and its mean are lower than those of ANN and CBR. Although additional studies would deliver more substantial grounds to advocate for a particular technique, the collected data suggest that the CBR technique tends to provide higher accuracies than others. The MAPE of the overall models ranged between 2 and 21%, with the second and third quartile between 5 and 13%, respectively. Considering that the accuracy error in traditional cost estimation ranges from −15% to +25%, which, in absolute terms, is 35%, the three techniques can perform significantly better, presenting errors under 21%, indicating that the absolute limit of 21% can serve as a baseline for an acceptance range of error for building projects’ cost estimations in the early stages.

4.3.2. Validation

The method of validation in the studies was collected to assess the satisfaction of the second criterion stated by [12]. As part of the modelling process exposed earlier, models need an appropriate assessment of their accuracy using an independent data set. Forty-five of the studies considered out-of-sample data for testing, and only Chan and Park [58] did not specify whether a subset was set aside or not. Hold-out cross-validation, k-fold cross-validation, and Leave One Out Cross Validation (LOOCV) were used on 33, eight, and four studies, respectively. Two considerations were pondered to assess suitability of the method used. First, for small samples, k-fold cross validation would be pertinent because it should provide better estimates of accuracy according to [35]. A second consideration was extracted from Shmueli and Koppius [12], where a sample size of 213 data points was considered small in the modeling process, and cross-validation was preferred to a simple hold-out. Therefore, in this research the method of hold-out is considered appropriate for samples of more than 213 data points. Accordingly, only 20 of the studies in this review conducted appropriate validation methods utilizing cross-validation or hold-out for data samples bigger than 213 data points, 22 studies did not implement the best validation method, and four studies did not indicate the type of validation nor the sample size. These results agree with Elfaki et al. [17] by evidencing a urgent need for standard validation methods to determine the level of accuracy of models and ease the implementation of predictive analytics.

4.4. Modelling Techniques

The five main techniques applied in the studies for the estimation of building construction costs at the early stages were:
-
Artificial Neural Networks (ANN);
-
Case-Based Reasoning (CBR);
-
Multiple Regression Analysis (MRA);
-
Boosting Regression Trees (BRT); and
-
Support Vector Machine (SVM).
ANN, CBR, and MRA were the predominant techniques used to elaborate the cost-prediction models. ANNs were used in 48% of the studies, while MRA and CBR were used in 22% and 26%, respectively. The other two techniques, BRT and SVM, represented only 4% each. Three approaches were followed by the reviewed papers to evaluate the techniques. The first approach used a single technique to develop a model, such as Chan and Park [58], who proposed a technique based on Principal Component Analysis to identify the most significant parameters to develop a linear function to model the costs of buildings. In the second approach, the studies compared different alternatives to improve a single technique. For example, Kim et al. [57] incorporated genetic algorithms to optimise the architecture of the artificial neural network model, and Doğan et al. [59] used genetic algorithms in a case-based model to determine the optimal weights of the case attributes. The third approach considered the comparison of different techniques, e.g., Kim et al. [50] based its research methodology comparing ANN, CBR, and MRA in cost modelling of buildings. Overall, 24% of the studies developed models without performing comparisons, 50% evaluated alternatives enhancing a single technique, and 26% compared different techniques. The studies comparing variations of one technique provided valuable outcomes regarding the component on which technique has the potential to increase the accuracy of the models. The areas to improve and the methods successfully used are shown in the following subsections.

4.4.1. Artificial Neural Networks

In 22 studies, ANNs were considered the primary technique. Seven of the 22, compared the ANN models with other techniques, such as MRA, CBR, and SVM. In six studies there were no comparisons, and the main objective was only to introduce ANN as an accurate technique for cost estimation. The comparisons between different ANNs were considered in nine of the publications listed in Table 5, which shows that the improvements of the models were achieved predominately by optimising the ANN architecture by different techniques or methods. Generally, Genetic Algorithms (GA) were utilised to improve the ANN architecture components. Kim et al. [52] optimised the number of neurons in the hidden layer and the learning rate of the neural network. On the other hand, Elhag and Boussabaine [48] compared two ANNs, using 13 parameters and using only four.

4.4.2. Case-Based Reasoning

From the 12 studies implementing CBR to model the costs of building projects, only Kim et al. [72] conducted a comparison with a different technique—ANN. The 11 other papers shown in Table 6 presented attribute weight and case similarity measures as the primary concern at the time of developing improvements in CBR, utilising GA and MRA to assign the optimum weight of the attributes.

4.4.3. Multiple-Regression Analysis

The use of multiple-regression analysis as a primary technique was utilised in 10 of the 46 articles. Five of them did not create additional models to compare results. Sonmez [55] and Dursun and Stoy [73] compared their accuracy with models developed with ANN, and Li et al. [74] compared an MRA model with the Unit Area Cost method. Lowe et al. [52] and Ji et al. [71] utilised techniques of Stepwise Regression and Principal Component Analysis to select the optimal parameters, respectively. Although MRA was not the most explored technique by the studies, it can support other techniques and enhance their effectiveness, e.g., it was used in CBR modelling to improve the adaptation capability [77]. Additionally, MRA is a technique more accessible for cost-estimation practitioners because it has broadly studied and implemented in statistics.

4.5. Benefits and Challenges

The commonly reported benefit in virtually all studies was the higher accuracy of the models in comparison to the traditional cost estimation techniques. This benefit has not been included in the benefits and challenges analysis because it was included in the Predictive Power section, where it was quantitatively analysed. The next two most mentioned benefits were (1) the suitability of the techniques for real practice, and (2) the possibility of improvement by combining them with other techniques. Cheng et al. [56] concluded that the techniques implemented were suitable for practice, where the authors highlighted that the model can enhance the ability of designers, owners, and contractors in the decision-making process leading to higher possibilities to achieve project success. Regarding the improvement in the techniques, Sonmez [55] concluded that the simultaneous use of ANN and MRA could provide satisfactory conceptual models.
Some authors of the publications have found limitations that make predictive analytics in cost estimation an area still in development with drawbacks to address. The main challenges expressed were (1) the need for more data, (2) to generalise models towards location and different project types, and (3) the improvement of attribute weighting. Predictive analytics bases its performance on data. Therefore, it becomes essential for cost modelling to have access to building-projects data. Models use input data to learn and larger data sets would increase their performance [51]. Since construction is an economic activity, the nature of competition does not incentivise sharing information because it is an element of competitive advantage, but individual companies may be able to implement predictive analytics by themselves. Ngo et al. [10] found that construction companies in Singapore do have pertinent data to implement predictive analytics. In this sense, the availability of data is a drawback in research, but, from the perspective of companies, it can be considered as a benefit due to a large amount of data they store from previous projects in the form of contract documents, schedules, drawings, specifications, and images. The second area to overcome, according to researchers, is the need for generalisation about location and typologies. Generalisation means an increase in the number of input parameters, and, therefore, more parameters require more data [86]. So, the increase in generalisation is strongly related to the first challenge—data availability. The third challenge perceived in the studies is the need to improve the techniques. The studies exposed that ANNs need improvement in the methods to optimise the network architecture and CBR needs to address attribute weighting, but other techniques not yet explored in the cost estimating of buildings may provide alternatives that suit the particular circumstances of the estimation case.

5. Conclusions

Several emergent techniques from predictive analytics have become a major area for researchers seeking to improve the practice of construction-cost estimation in the early stages of projects. Advances in methodology and techniques have become available in the last 20 years, but the explicit benefits and implications for cost-estimation practice have not been sufficiently highlighted to ignite the uptake by the industry. As an initial stimulus for the adoption, a systematic literature review was conducted in this study to investigate how predictive analytics can enhance early-stage cost estimation of buildings, resulting in three main contributions to the body of research:
  • An extensive database of 46 relevant publications on the use of predictive analytics for construction-costs estimations at the early stages of the development process was compiled and analysed;
  • A large number of cost-drivers were identified and ranked;
  • The various predictive analytics tools were compared to understand their applicability and ability to predict construction costs at the early stages of the development process.
We found that previously published research identified structured processes to apply predictive analytics on cost estimation, and that the accuracy of the models developed has surpassed that of the traditional practices of building construction-cost estimation. Additionally, the practices for modelling costs with predictive analytics have been structured and well documented. Three main implications can be drawn from this discussion:
  • Predictive analytics for cost-estimation research has not widely followed the best practices and standard methodologies. By following more strict parameters identification methods, using better data and predictive power considerations, models would produce more reliable predictions. Methodologies to apply predictive analytics for cost estimation have been recently standardised by Elmousalami [15] and Elfaki et al. [17];
  • The already accurate predictive analytics techniques investigated in previous studies and the tested modelling methodologies represent the necessary evidence to lead research into the next stage of progress, focusing on adoption and implementation of predictive analytics by the industry;
  • The study serves as a reference for high-level decision-makers in organisations developing building projects, providing them with the incremental developments in predictive analytics applications to promote a change of paradigm in the practice of cost estimation.
Future research perspectives relate to implementation issues of predictive analytics in cost estimation, focusing on investigating the current state of uptake in the industry, and the necessary ground conditions in organisations to deploy them, such as necessary skills of practitioners and decision-makers’ awareness regarding the implications of predictive analytics for construction project success. The main limitation possibly influencing the results of the review was identified. There was a possibility of not having found all the relevant papers due to the different words used to describe a concept within predictive analytics in cost estimation. The implementation of backward and forward snowballing contributed to addressing the first limitation identifying papers out of the search performed using the search engines.

Author Contributions

Conceptualization, S.L.C.M. and E.D.R.C.; methodology, S.L.C.M., E.D.R.C. and V.G.; validation, S.L.C.M., E.D.R.C., V.G. and J.A.; formal analysis, S.L.C.M. and E.D.R.C.; investigation, S.L.C.M. and E.D.R.C.; resources, S.L.C.M., E.D.R.C., V.G. and J.A.; data curation, S.L.C.M., E.D.R.C., V.G. and J.A.; writing—original draft preparation, S.L.C.M. and E.D.R.C.; writing—review and editing, S.L.C.M., E.D.R.C., V.G. and J.A.; visualization, S.L.C.M. and E.D.R.C.; supervision, E.D.R.C. and V.G.; project administration, E.D.R.C.; funding acquisition, E.D.R.C. All authors have read and agreed to the published version of the manuscript.

Funding

This research was funded by the New Zealand Earthquake Commission (grant number 18/U777).

Institutional Review Board Statement

Not applicable.

Data Availability Statement

No new data were created or analyzed in this study. Data sharing is not applicable to this article.

Conflicts of Interest

The authors declare no conflict of interest. The funders had no role in the design of the study; in the collection, analyses, or interpretation of data; in the writing of the manuscript; or in the decision to publish the results.

References

  1. Sanvido, V.; Grobler, F.; Parfitt, K.; Guvenis, M.; Coyle, M. Critical Success Factors for Construction Projects. J. Constr. Eng. Manag. 1992, 118, 94–111. [Google Scholar] [CrossRef]
  2. Project Management Institute (PMI). Construction Extension to the PMBOK® Guide, 2nd ed.; Project Management Institute: Newtown Square, PA, USA, 2016. [Google Scholar]
  3. Amos, S. Skills & Knowledge of Cost Engineering: A Project of the Education Board of AACE International, 5th ed.; AACE International: Morgantown, WV, USA, 2004. [Google Scholar]
  4. Ashworth, A.; Perera, S. Cost Studies of Buildings, 6th ed.; Routledge: Abingdon Oxon, UK; New York, NY, USA, 2015. [Google Scholar]
  5. Royal Institution of Chartered Surveyors. RICS New Rules of Measurement. In NRM 1, Order of Cost Estimating and Cost Planning for Capital Building Works; RICS: London, UK, 2012. [Google Scholar]
  6. Abourizk, S.M.; Babey, G.M.; Karumanasseri, G. Estimating the cost of capital projects: An empirical study of accuracy levels for municipal government projects. Can. J. Civ. Eng. 2002, 29, 653–661. [Google Scholar] [CrossRef]
  7. Ashworth, A. Pre-Contract Studies: Development Economics, Tendering, and Estimating; Blackwell: Oxford, UK; Melden, MA, USA, 2008. [Google Scholar]
  8. Nisbet, R.; Miner, G.; Yale, K. The Data Mining and Predictive Analytic Process. In Handbook of Statistical Analysis and Data Mining Applications; Nisbet, R., Miner, G., Yale, K., Eds.; Academic Press: Cambridge, MA, USA, 2018; pp. 39–54. [Google Scholar] [CrossRef]
  9. Yan, X.; Su, X. Linear Regression Analysis: Theory and Computing; World Scientific: Singapore, 2009. [Google Scholar]
  10. Ngo, J.; Hwang, B.-G.; Zhang, C. Big Data and Predictive Analytics in the Construction Industry: Applications, Status Quo, and Potential in Singapore’s Construction Industry. In Proceedings of the Construction Research Congress 2020: Computer Applications, Tempe, AZ, USA, 8–10 March 2020; American Society of Civil Engineers (ASCE): Reston, VA, USA, 2020; pp. 715–724. [Google Scholar]
  11. Waller, M.A.; Fawcett, S.E. Data Science, Predictive Analytics, and Big Data: A Revolution That Will Transform Supply Chain Design and Management. J. Bus. Logist. 2013, 34, 77–84. [Google Scholar] [CrossRef]
  12. Shmueli, G.; Koppius, O.R. Predictive Analytics in Information Systems Research. MIS Q. Manag. Inf. Syst. 2011, 35, 553–572. [Google Scholar] [CrossRef] [Green Version]
  13. Mishra, N.; Silakari, S. Predictive Analytics: A Survey, Trends, Applications. Int. J. Comput. Sci. Inf. Technol. 2012, 3, 4434–4438. [Google Scholar]
  14. Shah, N.D.; Steyerberg, E.W.; Kent, D.M. Big Data and Predictive Analytics: Recalibrating Expectations. JAMA—J. Am. Med. Assoc. 2018, 320, 27–28. [Google Scholar] [CrossRef]
  15. Elmousalami, H.H. Artificial Intelligence and Parametric Construction Cost Estimate Modeling: State-of-The-Art Review. J. Constr. Eng. Manag. 2020, 146, 03119008. [Google Scholar] [CrossRef]
  16. Forgues, D.; Iordanova, I.; Valdivesio, F.; Staub-French, S. Rethinking the Cost Estimating Process through 5D BIM: A Case Study. Constr. Res. Congr. 2012, 778–786. [Google Scholar] [CrossRef] [Green Version]
  17. Elfaki, A.O.; Alatawi, S.; Abushandi, E. Using Intelligent Techniques in Construction Project Cost Estimation: 10-Year Survey. Adv. Civ. Eng. 2014, 2014, 107926. [Google Scholar] [CrossRef] [Green Version]
  18. Kitchenham, B.; Charters, S.M. Guidelines for Performing Systematic Literature Reviews in Software Engineering; Keele University: Keele, UK; University of Durham: Durham, UK, 2007. [Google Scholar]
  19. Kirkham, R.; Brandon, P.; Ferry, D. Ferry and Brandon’s Cost Planning of Buildings; Blackwell: Oxford, UK; Malden, MA, USA, 2007. [Google Scholar]
  20. Potts, K. Construction Cost Management: Learning from Case Studies; Taylor & Francis: London, UK; New York, NY, USA, 2008. [Google Scholar]
  21. Fellows, R. New research paradigms in the built environment. Constr. Innov. 2010, 10, 5–13. [Google Scholar] [CrossRef]
  22. Brandon, P. Building Cost Research: Need for a Paradigm Shift? In Building Cost Techniques: New Directions; E&FN Spon: London, UK, 1982. [Google Scholar]
  23. Contasfor; Egan, S.J.; Williams, D. [Summary of] “Rethinking construction”—The report of the construction task force. Ice briefing sheet. Proc. Inst. Civ. Eng. Munic. Eng. 1998, 127, 199–203. [Google Scholar] [CrossRef]
  24. Koskela, L. Theory of Lean Construction. In Lean Construction; Tzortzopoulos, P., Kagioglou, M., Koskela, L., Eds.; Routledge: Oxfordshire, UK, 2020; pp. 2–13. [Google Scholar] [CrossRef]
  25. Kim, Y.; Ballard, G. Activity-Based Costing and Its Application to Lean Construction. In Proceedings of the 9th Annual Conference of the International Group for Lean Construction, Singapore, 6–8 August 2001; pp. 6–8. [Google Scholar]
  26. Ballard, G. The Lean Project Delivery System: An Update. Lean Constr. J. 2008, 1, 1–19. [Google Scholar]
  27. Smith, J.; Jaggar, D. Building Cost Planning for the Design Team, 2nd ed.; Elsevier: Oxford, UK, 2007. [Google Scholar]
  28. Finlay, S. Predictive Analytics, Data Mining and Big Data; Springer: Amsterdam, The Netherlands, 2014. [Google Scholar] [CrossRef] [Green Version]
  29. Shmueli, G. To Explain or to Predict? Stat. Sci. 2010, 25, 289–310. [Google Scholar] [CrossRef]
  30. Wu, J.; Coggeshall, S. Foundations of Predictive Analytics; CRC Press: Boca Raton, FL, USA, 2012. [Google Scholar] [CrossRef]
  31. Boyacioglu, M.A.; Kara, Y.; Baykan, K. Predicting bank financial failures using neural networks, support vector machines and multivariate statistical methods: A comparative analysis in the sample of savings deposit insurance fund (SDIF) transferred banks in Turkey. Expert Syst. Appl. 2009, 36 Pt 2, 3355–3366. [Google Scholar] [CrossRef]
  32. Mamuda, M.; Sathasivam, S. Predicting the Survival of Diabetes Using Neural Network. AIP Conf. Proc. 2017, 1870, 040046. [Google Scholar] [CrossRef]
  33. Saggi, M.K.; Jain, S. A survey towards an integration of big data analytics to big insights for value-creation. Inf. Process. Manag. 2018, 54, 758–790. [Google Scholar] [CrossRef]
  34. Blanco, J.L.; Fuchs, S.; Parsons, M.; Ribeirinho, M.J. Artificial intelligence: Construction technology’s next frontier. Build. Econ. 2018, 7–13. Available online: https://search.informit.org/doi/abs/10.3316/informit.048712291685521 (accessed on 7 May 2022).
  35. Russell, S.; Norvig, P. Artificial Intelligence a Modern Approach, 3rd ed.; Pearson: London, UK, 2010. [Google Scholar]
  36. Tranfield, D.; Denyer, D.; Smart, P. Towards a Methodology for Developing Evidence-Informed Management Knowledge by Means of Systematic Review. Br. J. Manag. 2003, 14, 207–222. [Google Scholar] [CrossRef]
  37. Borrego, M.; Foster, M.J.; Froyd, J.E. Systematic Literature Reviews in Engineering Education and Other Developing Interdisciplinary Fields. J. Eng. Educ. 2014, 103, 45–76. [Google Scholar] [CrossRef]
  38. Denyer, D.; Tranfield, D. Producing a Systematic Review. In The SAGE Handbook of Organizational Research Methods; SAGE: Thousand Oaks, CA, USA, 2009; pp. 671–689. [Google Scholar] [CrossRef]
  39. Pan, M.; Yang, Y.; Zheng, Z.; Pan, W. Artificial Intelligence and Robotics for Prefabricated and Modular Construction: A Systematic Literature Review. J. Constr. Eng. Manag. 2022, 148, 03122004. [Google Scholar] [CrossRef]
  40. Page, M.J.; McKenzie, J.E.; Bossuyt, P.M.; Boutron, I.; Hoffmann, T.C.; Mulrow, C.D.; Shamseer, L.; Tetzlaff, J.M.; Akl, E.A.; Brennan, S.E.; et al. The PRISMA 2020 Statement: An Updated Guideline for Reporting Systematic Reviews. Syst. Rev. 2021, 10, 89. [Google Scholar] [CrossRef] [PubMed]
  41. Ayodele, O.A.; Chang-Richards, A.; González, V. Factors Affecting Workforce Turnover in the Construction Sector: A Systematic Review. J. Constr. Eng. Manag. 2020, 146, 03119010. [Google Scholar] [CrossRef]
  42. Wohlin, C. Guidelines for Snowballing in Systematic Literature Studies and a Replication in Software Engineering. In Proceedings of the 18th International Conference on Evaluation and Assessment in Software Engineering, London, UK, 13–14 May 2014; pp. 1–10. [Google Scholar] [CrossRef]
  43. Kitchenham, B.; Brereton, P.A. Systematic Review of Systematic Review Process Research in Software Engineering. Inf. Softw. Technol. 2013, 55, 2049–2075. [Google Scholar] [CrossRef]
  44. Rosenthal, R.; DiMatteo, M.R. Meta-Analysis: Recent Developments in Quantitative Methods for Literature Reviews. Annu. Rev. Psychol. 2001, 52, 59–82. [Google Scholar] [CrossRef] [Green Version]
  45. Lin, S. Rank Aggregation Methods. Wiley Interdiscip. Rev. Comput. Stat. 2010, 2, 555–570. [Google Scholar] [CrossRef]
  46. Fields, E.B.; Okudan, G.E.; Ashour, O.M. Rank aggregation methods comparison: A case for triage prioritization. Expert Syst. Appl. 2013, 40, 1305–1311. [Google Scholar] [CrossRef]
  47. Wang, Y.-M.; Yang, J.-B.; Xu, D.-L. A preference aggregation method through the estimation of utility intervals. Comput. Oper. Res. 2005, 32, 2027–2049. [Google Scholar] [CrossRef]
  48. Elhag, T.M.S.; Boussabaine, A.H. An Artificial Neural System for Cost Estimation of Construction Projects. In Proceedings of the 14th Annual ARCOM Conference, Reading, UK, 1 September 1998; Volume 1, pp. 219–226. [Google Scholar]
  49. Karshenas, S. Predesign Cost Estimating Method for Multistory Buildings. J. Constr. Eng. Manag. 1984, 110, 79–86. [Google Scholar] [CrossRef]
  50. Kim, G.-H.; An, S.-H.; Kang, K.-I. Comparison of construction cost estimating models based on regression analysis, neural networks, and case-based reasoning. Build. Environ. 2004, 39, 1235–1242. [Google Scholar] [CrossRef]
  51. Günaydın, H.M.; Doğan, S.Z. A neural network approach for early cost estimation of structural systems of buildings. Int. J. Proj. Manag. 2004, 22, 595–602. [Google Scholar] [CrossRef] [Green Version]
  52. Lowe, D.J.; Emsley, M.W.; Harding, A. Predicting Construction Cost Using Multiple Regression Techniques. J. Constr. Eng. Manag. 2006, 132, 750–758. [Google Scholar] [CrossRef] [Green Version]
  53. An, S.-H.; Kim, G.-H.; Kang, K.-I. A case-based reasoning cost estimating model using experience by analytic hierarchy process. Build. Environ. 2007, 42, 2573–2579. [Google Scholar] [CrossRef]
  54. Emsley, M.W.; Lowe, D.J.; Duff, A.R.; Harding, A.; Hickson, A. Data modelling and the application of a neural network approach to the prediction of total construction costs. Constr. Manag. Econ. 2002, 20, 465–472. [Google Scholar] [CrossRef]
  55. Sonmez, R. Conceptual cost estimation of building projects with regression analysis and neural networks. Can. J. Civ. Eng. 2004, 31, 677–683. [Google Scholar] [CrossRef]
  56. Cheng, M.-Y.; Tsai, H.-C.; Sudjono, E. Conceptual cost estimates using evolutionary fuzzy hybrid neural network for projects in construction industry. Expert Syst. Appl. 2010, 37, 4224–4231. [Google Scholar] [CrossRef]
  57. Kim, G.-H.; Yoon, J.-E.; An, S.-H.; Cho, H.-H.; Kang, K.-I. Neural network model incorporating a genetic algorithm in estimating construction costs. Build. Environ. 2004, 39, 1333–1340. [Google Scholar] [CrossRef]
  58. Chan, S.L.; Park, M. Project cost estimation using principal component regression. Constr. Manag. Econ. 2005, 23, 295–304. [Google Scholar] [CrossRef]
  59. Doğan, S.Z.; Arditi, D.; Günaydın, H.M. Determining Attribute Weights in a CBR Model for Early Cost Prediction of Structural Systems. J. Constr. Eng. Manag. 2006, 132, 1092–1098. [Google Scholar] [CrossRef] [Green Version]
  60. Park, U.Y.; Kim, G.H. A Study on Predicting Construction Cost of Apartment Housing Projects Based on Support Vector Regression at the Early Project Stage. J. Archit. Inst. Korea 2007, 23, 165–172. [Google Scholar]
  61. Skitmore, M. The Effect of Project Information on the Accuracy of Building Price Forecasts. In Building Cost Modelling and Computers; E& FN Spon: London, UK, 1987; pp. 327–336. [Google Scholar]
  62. Picken, D.H.; Ilozor, B.D. Height and construction costs of buildings in Hong Kong. Constr. Manag. Econ. 2003, 21, 107–111. [Google Scholar] [CrossRef]
  63. Elhag, T.M.S.; Boussabaine, A.H.; Ballal, T.M.A. Critical determinants of construction tendering costs: Quantity surveyors’ standpoint. Int. J. Proj. Manag. 2005, 23, 538–545. [Google Scholar] [CrossRef]
  64. Wheaton, W.C.; Simonton, W.E. The Secular and Cyclic Behavior of “True” Construction Costs. J. Real Estate Res. 2007, 29, 1–25. [Google Scholar] [CrossRef]
  65. Stoy, C.; Pollalis, S.; Schalcher, H.-R. Drivers for Cost Estimating in Early Design: Case Study of Residential Construction. J. Constr. Eng. Manag. 2008, 134, 32–39. [Google Scholar] [CrossRef]
  66. Ahn, J.; Ji, S.-H.; Park, M.; Lee, H.-S.; Kim, S.; Suh, S.-W. The attribute impact concept: Applications in case-based reasoning and parametric cost estimation. Autom. Constr. 2014, 43, 195–203. [Google Scholar] [CrossRef]
  67. Ahn, J.; Park, M.; Lee, H.-S.; Ahn, S.J.; Ji, S.-H.; Song, K.; Son, B.-S. Covariance effect analysis of similarity measurement methods for early construction cost estimation using case-based reasoning. Autom. Constr. 2017, 81, 254–266. [Google Scholar] [CrossRef]
  68. Doğan, S.Z.; Arditi, D.; Günaydin, H.M. Using Decision Trees for Determining Attribute Weights in a Case-Based Model of Early Cost Prediction. J. Constr. Eng. Manag. 2008, 134, 146–152. [Google Scholar] [CrossRef] [Green Version]
  69. Jin, R.; Cho, K.; Hyun, C.; Son, M. MRA-based revised CBR model for cost prediction in the early stage of construction projects. Expert Syst. Appl. 2012, 39, 5214–5222. [Google Scholar] [CrossRef]
  70. Kim, G.-H.; Shin, J.-M.; Kim, S.; Shin, Y. Comparison of School Building Construction Costs Estimation Methods Using Regression Analysis, Neural Network, and Support Vector Machine. J. Build. Constr. Plan. Res. 2013, 1, 29576. [Google Scholar] [CrossRef] [Green Version]
  71. Ji, S.-H.; Park, M.; Lee, H.-S. Data Preprocessing–Based Parametric Cost Model for Building Projects: Case Studies of Korean Construction Projects. J. Constr. Eng. Manag. 2010, 136, 844–853. [Google Scholar] [CrossRef]
  72. Kim, S.-Y.; Choi, J.-W.; Kim, G.-H.; Kang, K.-I. Comparing Cost Prediction Methods for Apartment Housing Projects: CBR versus ANN. J. Asian Arch. Build. Eng. 2005, 4, 113–120. [Google Scholar] [CrossRef]
  73. Dursun, O.; Stoy, C. Conceptual Estimation of Construction Costs Using the Multistep Ahead Approach. J. Constr. Eng. Manag. 2016, 142, 04016038. [Google Scholar] [CrossRef]
  74. Li, H.; Shen, Q.; Love, P.E. Cost modelling of office buildings in Hong Kong: An exploratory study. Facilities 2005, 23, 438–452. [Google Scholar] [CrossRef]
  75. Jin, R.; Han, S.; Hyun, C.; Kim, J. Improving Accuracy of Early Stage Cost Estimation by Revising Categorical Variables in a Case-Based Reasoning Model. J. Constr. Eng. Manag. 2014, 140, 04014025. [Google Scholar] [CrossRef]
  76. Sonmez, R. Parametric Range Estimating of Building Costs Using Regression Models and Bootstrap. J. Constr. Eng. Manag. 2008, 134, 1011–1016. [Google Scholar] [CrossRef]
  77. Ji, S.-H.; Park, M.; Lee, H.-S. Case Adaptation Method of Case-Based Reasoning for Construction Cost Estimation in Korea. J. Constr. Eng. Manag. 2012, 138, 43–52. [Google Scholar] [CrossRef]
  78. Juszczyk, M. Application of PCA-Based Data Compression in the ANN-Supported Conceptual Cost Estimation of Residential Buildings. In Proceedings of the AIP Conference, Rhodes, Greece, 22 September 2015; American Institute of Physics: College Park, MD, USA, 2016; Volume 1738, p. 200007. [Google Scholar] [CrossRef]
  79. Ahn, J.; Ji, S.-H.; Ahn, S.J.; Park, M.; Lee, H.-S.; Kwon, N.; Lee, E.-B.; Kim, Y. Performance evaluation of normalization-based CBR models for improving construction cost estimation. Autom. Constr. 2020, 119, 103329. [Google Scholar] [CrossRef]
  80. Hyung, W.-G.; Kim, S.; Jo, J.-K. Improved similarity measure in case-based reasoning: A case study of construction cost estimation. Eng. Constr. Arch. Manag. 2019, 27, 561–578. [Google Scholar] [CrossRef]
  81. Ji, S.-H.; Park, M.; Lee, H.-S. Cost estimation model for building projects using case-based reasoning. Can. J. Civ. Eng. 2011, 38, 570–581. [Google Scholar] [CrossRef]
  82. Wang, R.; Asghari, V.; Cheung, C.M.; Hsu, S.-C.; Lee, C.-J. Assessing effects of economic factors on construction cost estimation using deep neural networks. Autom. Constr. 2021, 134, 104080. [Google Scholar] [CrossRef]
  83. Shin, Y. Application of Boosting Regression Trees to Preliminary Cost Estimation in Building Construction Projects. Comput. Intell. Neurosci. 2015, 2015, 149702. [Google Scholar] [CrossRef] [Green Version]
  84. Feng, K.; Xiaojuan, W.; Liya, C. Application of RS-SVM in Construction Project Cost Forecasting. In Proceedings of the 2008 4th International Conference on Wireless Communications, Networking and Mobile Computing, Dalian, China, 12–17 October 2008; pp. 3–6. [Google Scholar] [CrossRef]
  85. Wang, W.-C.; Bilozerov, T.; Dzeng, R.-J.; Hsiao, F.-Y.; Wang, K.-C. Conceptual Cost Estimations Using Neu-ro-Fuzzy and Multi-Factor Evaluation Methods for Building Projects. J. Civ. Eng. Manag. 2017, 23, 1–14. [Google Scholar] [CrossRef] [Green Version]
  86. Loeppky, J.L.; Sacks, J.; Welch, W.J. Choosing the Sample Size of a Computer Experiment: A Practical Guide. Technometrics 2009, 51, 366–376. [Google Scholar] [CrossRef] [Green Version]
  87. Fraenkel, J.; Grofman, B. The Borda Count and its real-world alternatives: Comparing scoring rules in Nauru and Slovenia. Aust. J. Polit. Sci. 2014, 49, 186–205. [Google Scholar] [CrossRef]
  88. Hyndman, R.; Koehler, A.B. Another look at measures of forecast accuracy. Int. J. Forecast. 2006, 22, 679–688. [Google Scholar] [CrossRef] [Green Version]
  89. Kim, G.H.; Seo, D.S.; Kang, K.I. Hybrid Models of Neural Networks and Genetic Algorithms for Predicting Preliminary Cost Estimates. J. Comput. Civ. Eng. 2005, 19, 208–211. [Google Scholar] [CrossRef]
  90. Cheng, M.-Y.; Tsai, H.-C.; Hsieh, W.-S. Web-based conceptual cost estimates for construction projects using Evolutionary Fuzzy Neural Inference Model. Autom. Constr. 2009, 18, 164–172. [Google Scholar] [CrossRef]
  91. Sonmez, R. Range estimation of construction costs using neural networks with bootstrap prediction intervals. Expert Syst. Appl. 2011, 38, 9913–9917. [Google Scholar] [CrossRef]
  92. Rafiei, M.H.; Adeli, H. Novel Machine-Learning Model for Estimating Construction Costs Considering Economic Variables and Indexes. J. Constr. Eng. Manag. 2018, 144, 04018106. [Google Scholar] [CrossRef]
  93. Jumas, D.; Mohd-Rahim, F.A.; Zainon, N.; Utama, W.P. Improving accuracy of conceptual cost estimation using MRA and ANFIS in Indonesian building projects. Built Environ. Proj. Asset Manag. 2018, 8, 348–357. [Google Scholar] [CrossRef] [Green Version]
  94. Badawy, M. A hybrid approach for a cost estimate of residential buildings in Egypt at the early stage. Asian J. Civ. Eng. 2020, 21, 763–774. [Google Scholar] [CrossRef]
  95. Jung, S.; Pyeon, J.-H.; Lee, H.-S.; Park, M.; Yoon, I.; Rho, J. Construction Cost Estimation Using a Case-Based Reasoning Hybrid Genetic Algorithm Based on Local Search Method. Sustainability 2020, 12, 7920. [Google Scholar] [CrossRef]
Figure 1. Empirical model-building steps schematic. Adapted from Shmueli and Koppius [12].
Buildings 12 01043 g001
Figure 2. Methodology.
Buildings 12 01043 g002
Figure 3. Statistical properties of the publications: (a) biannual distribution of publications of the review; and (b) distribution of publications per country.
Buildings 12 01043 g003
Figure 4. Box and whiskers chart of the average MAPE by technique.
Buildings 12 01043 g004
Table 1. Most cited papers.
No.Authors/YearTitleCountryCitations
1Kim et al. [50]Comparison of construction-cost-estimating models based on regression analysis, neural networks, and case-based reasoning.Korea617
2Günaydin and ΞDoǧan [51]A neural network approach for early cost estimation of structural systems of buildings.Turkey314
3Lowe et al. [52]Predicting construction cost using multiple regression techniques.UK320
4An et al. [53]A case-based reasoning cost-estimating model using experience by analytic hierarchy process.Korea248
5Emsley et al. [54]Data modelling and the application of a neural network approach to the prediction of total construction costs.UK192
6Sonmez [55]Conceptual cost estimation of building projects with regression analysis and neural networks.US176
7Cheng et al. [56]Conceptual cost estimates using evolutionary fuzzy hybrid neural network for projects in the construction industry.Taiwan176
8Kim et al. [57]Neural network model incorporating a genetic algorithm in estimating construction costs.Korea173
9Chan and Park [58]Project cost estimation using principal component regression.Singapore147
10Doğan et al. [59] Determining attribute weights in a case-based reasoning model for early cost prediction of structural systems.Turkey139
Table 2. Number of methods to identify the parameters.
Parameter Identification MethodNumber of Studies
Not mentioned14
Literature review10
Literature review and expert survey9
Author criteria6
Expert survey4
From data available2
Expert survey and MCA1
Grand Total46
Table 3. Methods used to optimise the parameters.
Parameter Identification MethodStudiesNumber of Studies
Stepwise Regression Analysis[52,55,70,71,72,73,74,75,76]9
Principal Component Analysis[58,77,78]3
Correlation Analysis[67,79,80]3
ANOVA[50,65]2
Genetic Algorithm[59,81]2
Attribute Impact[66]1
Shapley Additive Explanations[82]1
MRA Standard Coefficients[69]1
Analytic Hierarchy Process[53]1
Boosting Regression Trees[83]1
Rough Set[84]1
Multifactor Evaluation[85]1
Factor Analysis[54]1
Decision Tree[68]1
Table 4. Ranked parameters.
ParameterRankScore
GFA11301
Number of floors21137
Foundation type3803
Number of units4647
Number of elevators5589
Type of roof6506
Structure type7434
Duration8373
Number of unit floor households9304
Location10299
Table 5. Improvements in ANN models from studies.
AuthorYearModel Component ImprovementTechnique or Method Used
Elhag and Boussabaine [48]1998Input parametersInclusion of additional parameters
Kim et al. [52]2004ANN ArchitectureGA
Kim et al. [89]2005ANN ArchitectureGA
Cheng et al. [90]2009ANN ArchitectureFL/GA
Cheng et al. [56]2010ANN ArchitectureHigh Order NN/FL/GA
Sonmez [91]2011Input parameters/ANN ArchitectureBayesian regularisation/Bootstraps prediction intervals
Rafiei and Adeli [92]2018Model architectureDBM combination
Jumas et al. [93]2018Input parametersMRA
Badawy [94]2020Model architectureMRA combination
Table 6. Improvements on CBR models from studies.
AuthorYearModel Component
Improvement
Technique or
Method Used
An, et al. [53]2006Attribute weightingAnalytic Hierarchy Process (AHP)
Doğan et al. [59]2006Attribute weightingGA
Doğan et al. [68]2008Attribute weightingDecision Trees
Ji et al. [81]2011Case Similarity
Measurement
Attribute weighting
Euclidean distance-based
similarity function
GA
Jin et al. [69]2012Result errorMRA-based revision method
Ji et al. [77]2012Case adaptationMRA
Jin et al. [75]2014Input parametersInclusion of categorical attributes
Ahn et al. [66]2014Attribute weightingAttribute impact method
Ahn et al. [67]2017Case Similarity
Measurement
Euclidean distance
Mahalanobis distance
Arithmetic summation
Fractional function
Ahn et al. [79]2020Input parametersGA
Euclidean distance
Jung et al. [95]2020Attribute weightingGA
Local search technique
Publisher’s Note: MDPI stays neutral with regard to jurisdictional claims in published maps and institutional affiliations.

