Article

Health Risk Assessment and Influencing Factors Analysis of High Temperatures on Negative Emotions

1
College of Landscape Architecture, Nanjing Forestry University, Nanjing 210037, China
2
Institute of Strategic Planning, Chinese Academy of Environmental Planning, Beijing 100043, China
3
National Meteorological Information Center, Beijing 100081, China
*
Author to whom correspondence should be addressed.
Buildings 2022, 12(7), 1040; https://doi.org/10.3390/buildings12071040
Submission received: 30 May 2022 / Revised: 13 July 2022 / Accepted: 15 July 2022 / Published: 19 July 2022
(This article belongs to the Topic Climate Change and Environmental Sustainability)

Abstract

:
The emotional health of urban residents has been seriously threatened by frequent and normalized heat waves. This study constructed the VI-level assessment standard for emotional health risk using data from satellite images, meteorological sites, questionnaire surveys, and statistical yearbooks to assess the effect of high temperatures on negative emotions in Hangzhou. The results showed that the morphological changes of urban high-temperature areas were aggregated from a cross-shape to a large patch shape, then dispersed into cracked patch shapes. Additionally, the health risk of daytime negative emotions peaked at the VI-level from 1984 to 2020, and the influence level of the typical period risk increased by 1–2 levels compared with the daytime. Additionally, driven by urban spatial structure policies, the risk pattern of emotional health expanded outward from a single center into multiple centers. The emotional health risk level rose and then descended in urban centers, and the innovation industries drove the variation tendency of hot spots. Furthermore, high educational background, employment, and couples living together were critical variables that could alleviate the emotional health risk to the middle-aged and elderly population. This study aimed to optimize the urban spatial structure and alleviate residents’ emotional health hazards for healthy urban planning.

1. Introduction

Due to rapid urbanization and global population growth, cities are seriously threatened by severe eco-environmental issues, such as global warming, storms and floods, and air pollution [1,2,3]. In particular, urban heat waves, a recognized public health hazard [4,5,6], may be caused by global warming. According to the Sixth Assessment Report of the Intergovernmental Panel on Climate Change (IPCC), worldwide extreme heat waves will increase in both frequency and intensity in the future [7], and the health of urban residents will be greatly threatened [8,9]. Furthermore, extremely high temperatures can easily cause public health emergencies, such as heat exhaustion and heat stroke [10,11], as well as increase morbidity and mortality rates among those with chronic diseases, such as respiratory and cardiovascular diseases [12,13,14,15]. The average annual death toll from the negative effects of heat waves is much higher than that of other extreme weather events [16]. More than 70,000 additional deaths occurred in Europe during the summer of 2003 [17]. The death toll from Australia’s heat waves in 2013 exceeded that of natural disasters, such as floods and forest fires [18]. In 2019, up to 26,800 deaths in China resulted from heat-related diseases [19]. Meanwhile, urban residents’ emotional health also requires attention, as they are likely to experience negative emotions such as anxiety, anger, and depression after prolonged exposure to a high temperature [20]. Noelke et al. found that, when the ambient temperature exceeds 21 °C, especially above 32 °C, residents’ emotional happiness significantly drops [21]. Tan et al. proposed that affective disorder would increase considerably in a living environment above 35°C [22]. Consequently, high temperatures, combined with high population density and the age of the population in East Asia, severely threaten residents’ health and safety, a fact made even more serious in the Yangtze River Delta in China, considering its significance and rapid economic growth [23].
However, studies about high temperatures affecting human health tended to be divided into physical or mental aspects. Most of the studies were based on the correlation of data analysis, such as morbidity and mortality [5,24], emergency frequency [25,26], or social service survey of physical or mental diseases from the medical perspective [27]. Studies are rare in the field of the effects of high temperatures on human emotions. Gopinathan et al. found from experiments that when the human body evaporates 2% heat or more, people’s mental function would dramatically deteriorate [28]. Liu et al. probed into the summer high temperatures and the daily medical treatment of patients with mental disorders in Jinan City, China, in 2010 and demonstrated a positive correlation between heat waves and mental disorder risk [29]. Using the social media data from the United States and Mexico, it was reported by Burke et al. that, as the average monthly temperature rose, residents’ ability to control their emotions declined, and the usage of negative language and suicide rates increased [30]. Younan et al. pointed out that, as the average annual temperature rises, teenagers in cities may exhibit increasingly aggressive behaviors [31]. All of these studies revealed the significant correlation between high temperatures and mental health, and proved the relevance between critical temperature thresholds and emotional experience. However, some difficulties still exist in assessing the intensity and form of high temperatures’ effects on emotions. In one study of adolescent aggressive behavior, behavioral records and hourly meteorological data from a 6-month period were used [31]. There was a lag effect in emotional surveys, and the instantaneous temperature for negative behavior was not measured. In a telephone survey of emotional well-being, based on the emotional performance on the day prior to the day of the interview, binary variables were used to recode well-being [21]. It had a short-term lag effect, and the binary variables were not ordered variables and could not present the intensity of emotion. Therefore, the negative emotion scale must be used to measure the emotional intensity of residents exposed to high temperatures and to construct a health-risk-level standard to evaluate the high temperatures’ emotional damage.
In terms of the emotional risk caused by high temperatures, the perception and resistance vary between different people. It was generally believed that, due to the weak physiological regulation function, the elderly and children were more vulnerable to high temperatures [32]. In previous studies, children and teenagers (up to 14 years old), the elderly (not less than 65 years old), and adults with chronic diseases were treated as vulnerability indexes in assessing high-temperature disasters [33,34,35]. Li et al. studied the cross-sectional data in China and found that meteorological factors were associated with the blood lipid levels, and the risk was higher in middle-aged women, elderly people, and urban residents [36]. The middle-aged and elderly people in cities were less sensitive to high temperatures and more prone to fatigue and discomfort [37,38]. However, the entire middle-aged and elderly population has not been covered in the current research.
Additionally, urban residents’ socioeconomic status had a positive linear causality with their health condition, which was useful for predicting people’s adaptive behaviors during heat waves to alleviate the impact of high temperatures on human health [39]. Hence, the relationship between socioeconomic factors and the emotional health of the middle-aged and elderly population needs to be assessed. Principal Component Analysis (PCA) was used by Xie et al. to evaluate social vulnerability, and they found that the greater the proportion of the population with less than high school education, the higher the vulnerability [40]. Murage et al. found that higher income and higher vegetation coverage in the living area could be beneficial in reducing heat exposure through a Logistic Regression Model [41]. The Ordered Probit Model was applied by Zhou et al. and demonstrated that different living arrangements were significantly correlated with the health of the elderly population [42]. In the present study, education background, employment status, and living arrangements were used to represent socioeconomic factors, and the effects of socioeconomic factors on the middle-aged and elderly population were evaluated.
A standard for assessing high temperature’s influence on emotional health was constructed based on sample data from satellite images, meteorological stations, subjective emotions, and tools, such as ENVI, MATLAB, and ArcGIS. Taking Hangzhou City as an example, this study evaluated the form and intensity of high temperature on negative emotions and analyzed the evolution of urban residents’ health risk patterns. Then, the influence of socioeconomic factors on middle-aged and elderly populations was studied. The study’s conclusions provide some strategies and advice on optimizing the urban spatial layout and alleviating emotional health damage in residents. The theory of healthy urban planning can thus be enriched, and more cases for empirical research can be provided.

2. Materials and Methods
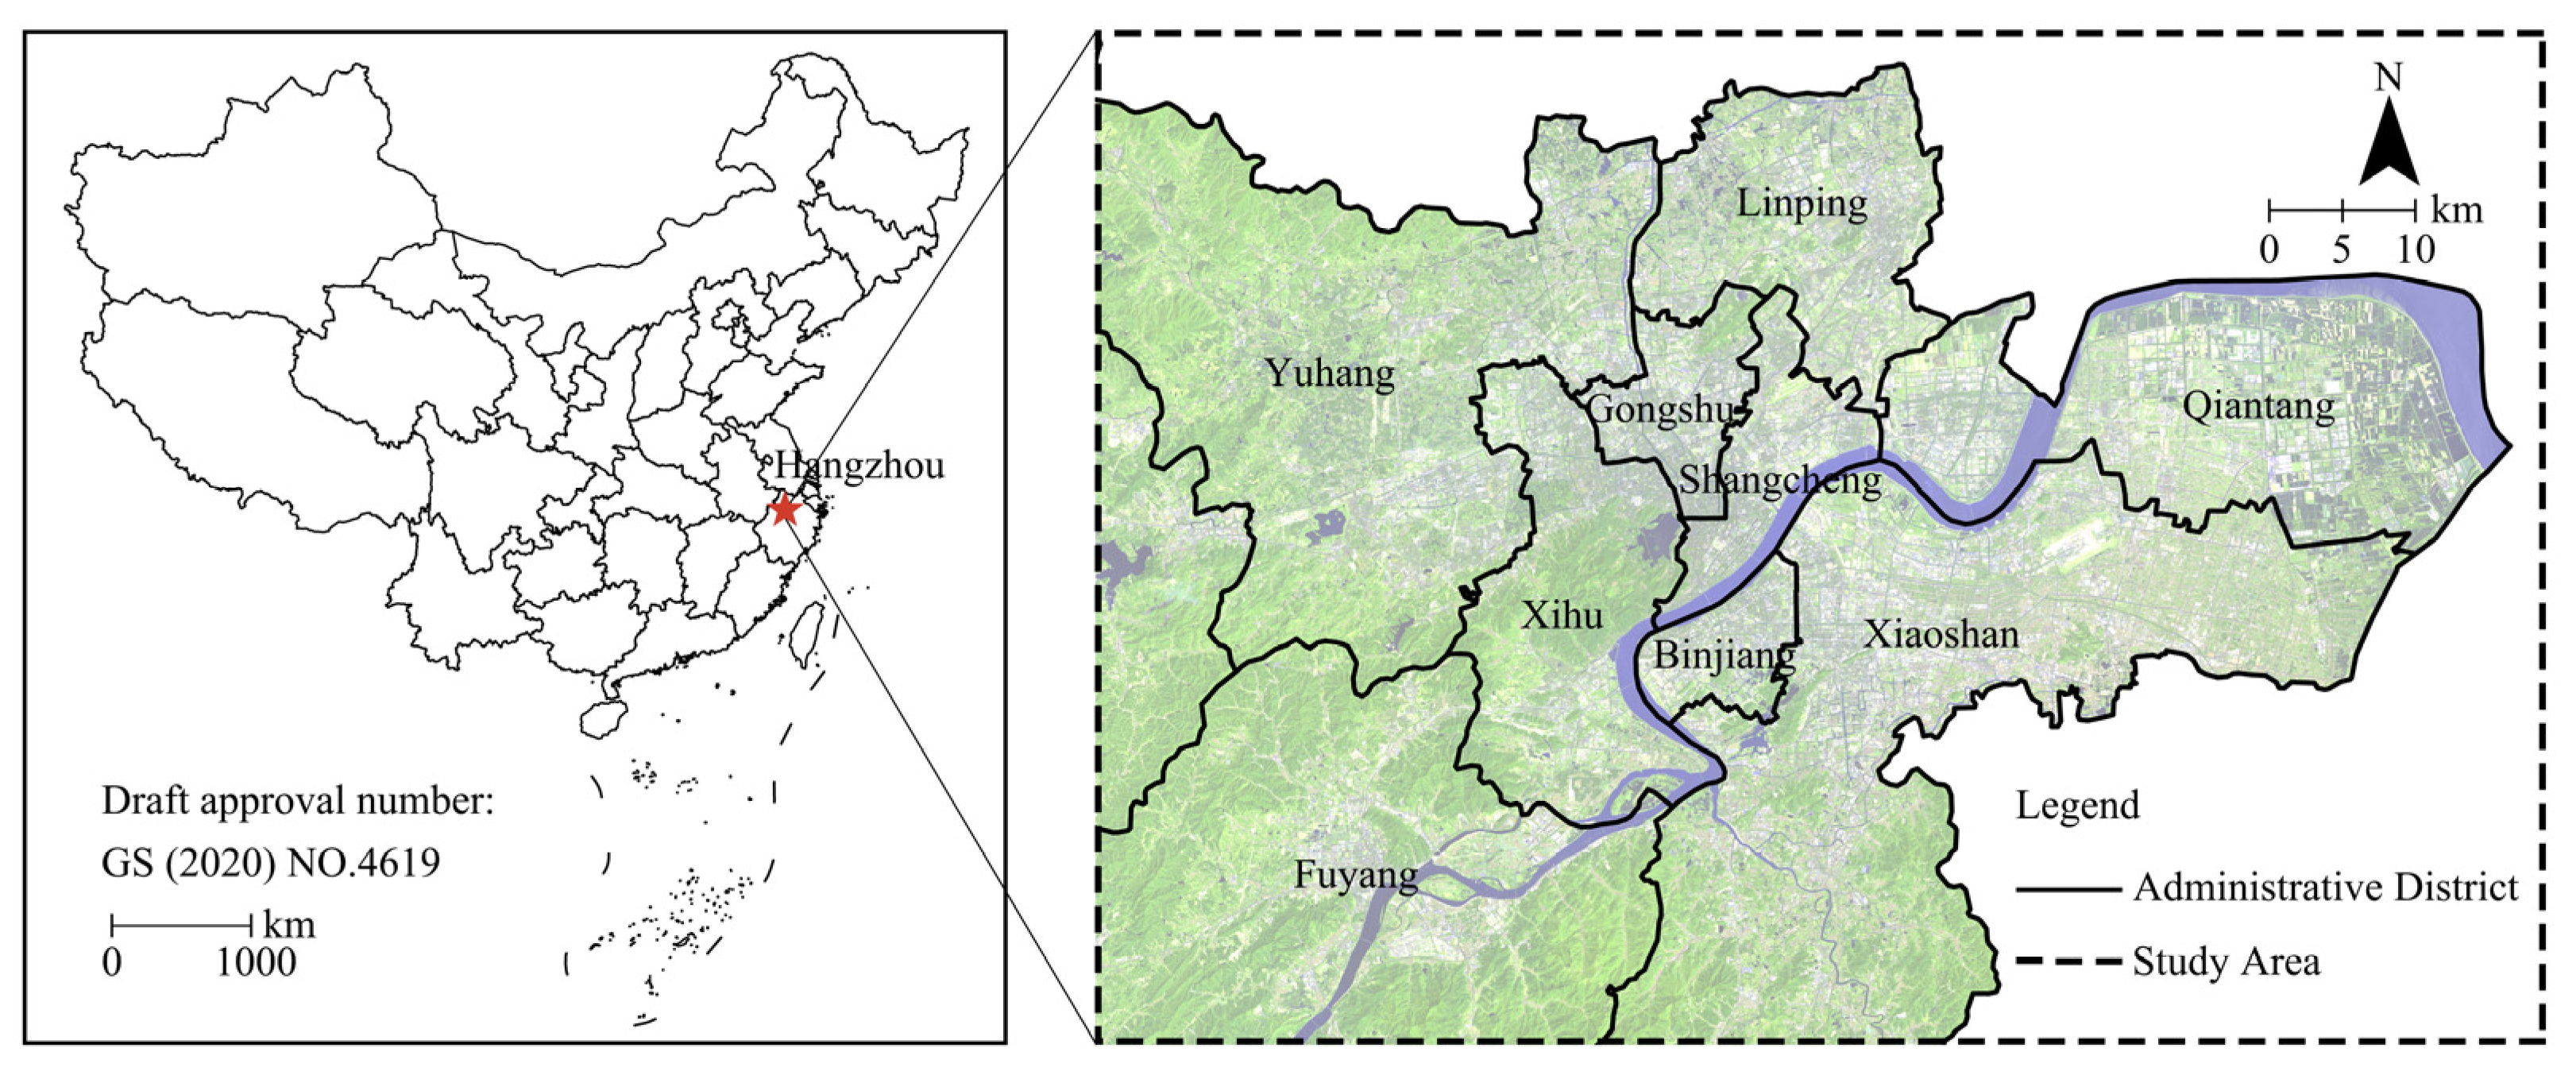
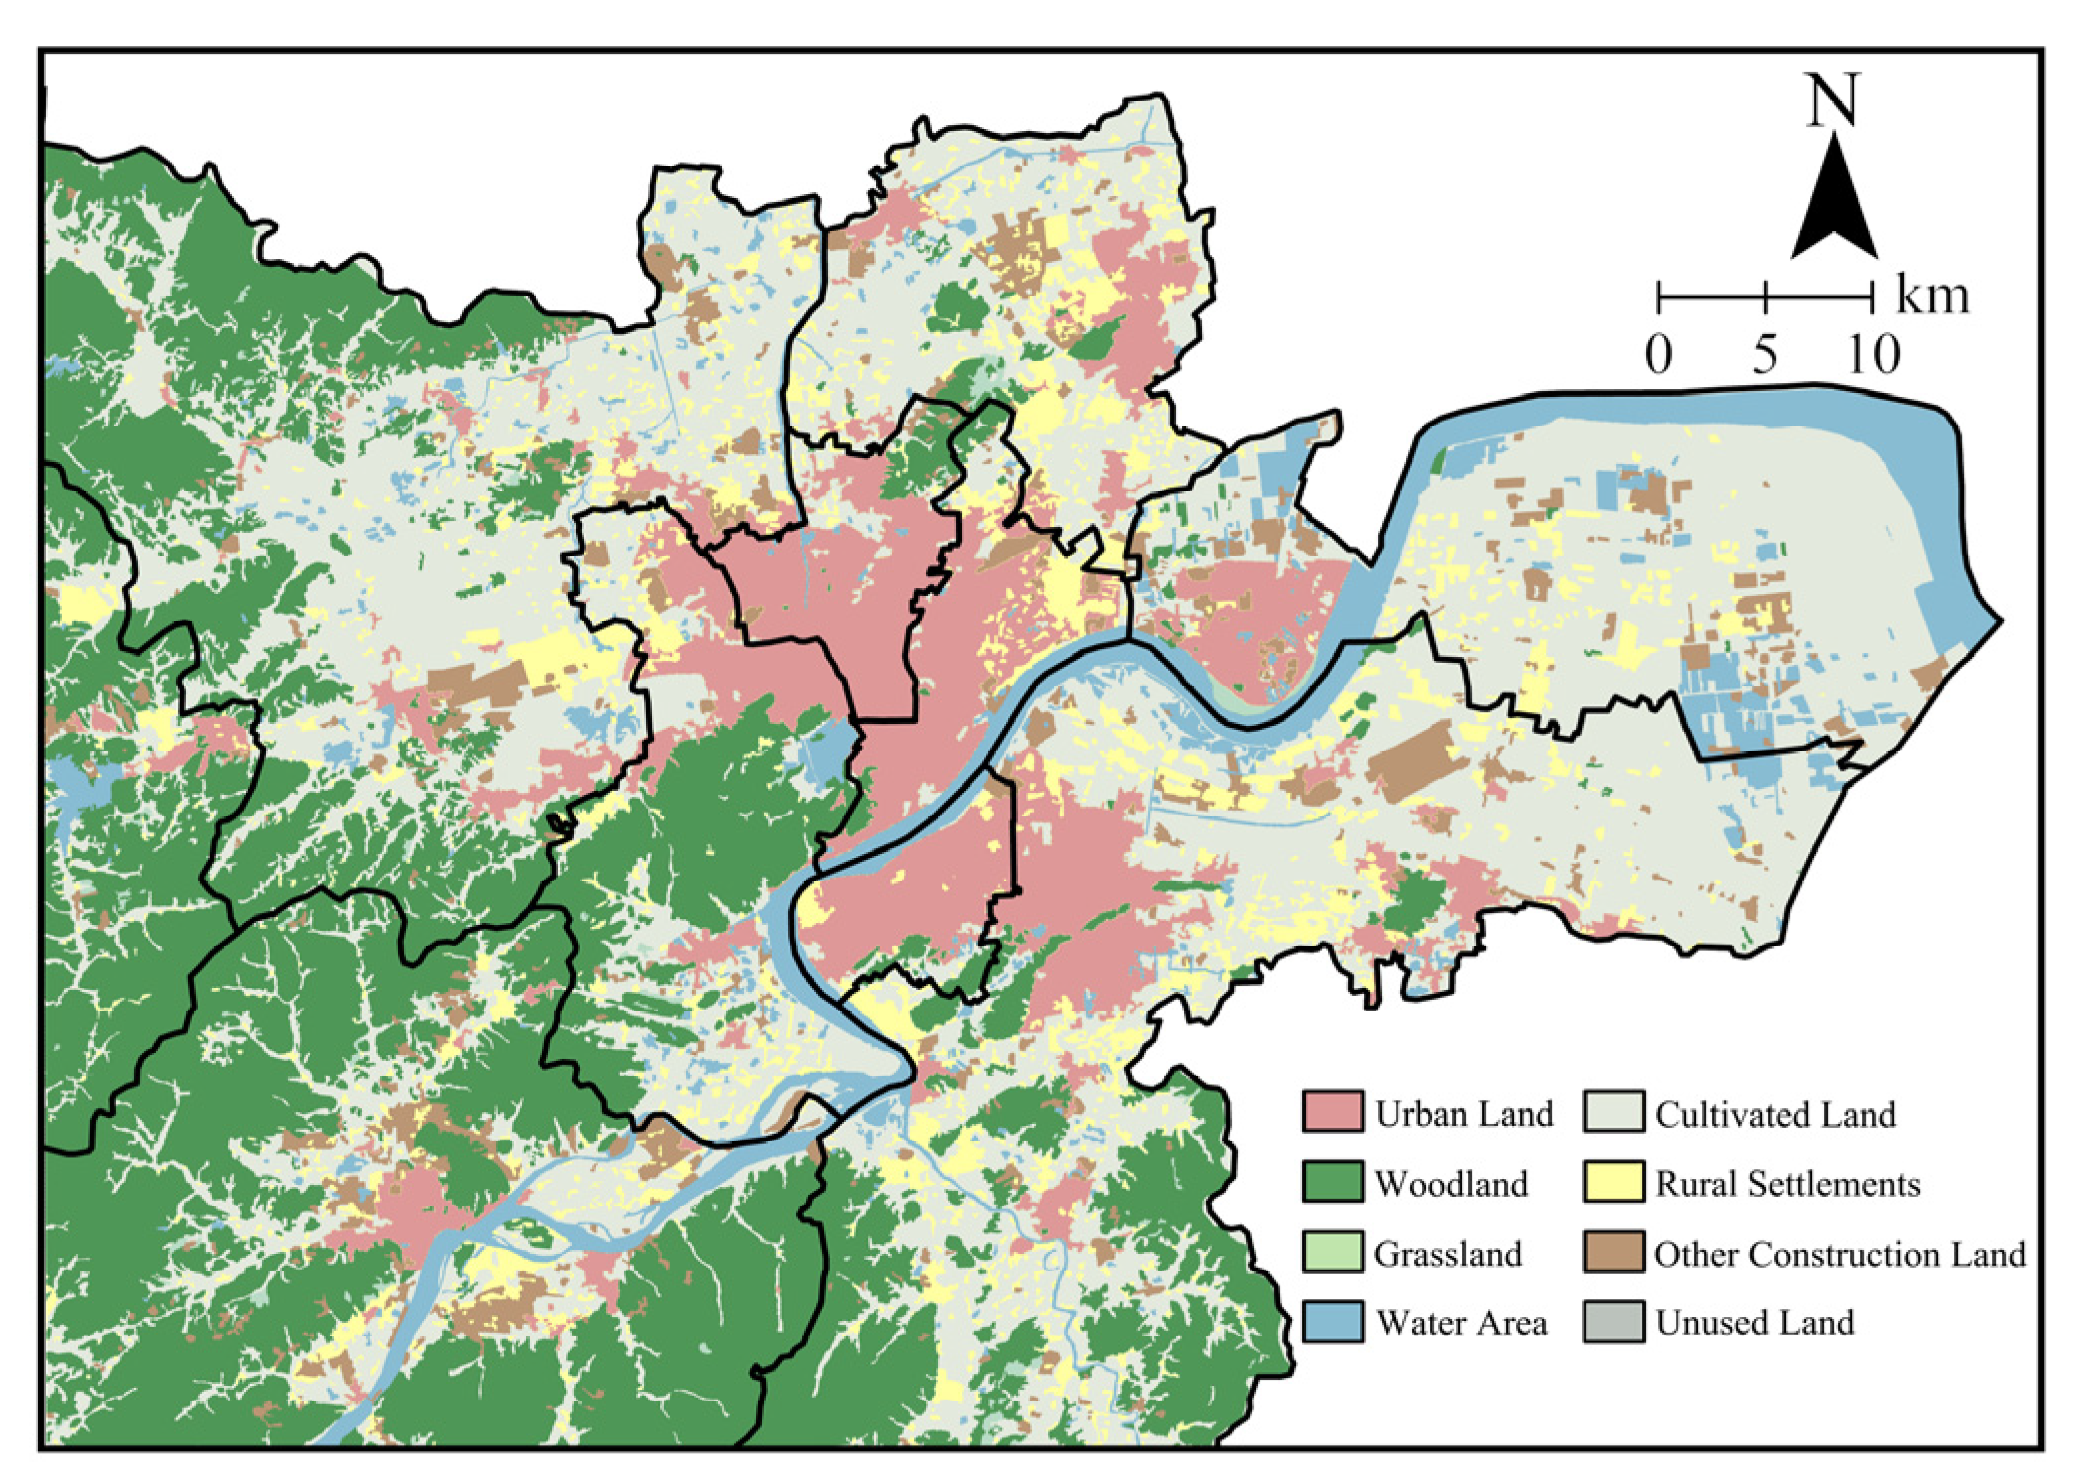
2.1. Study Area

Hangzhou is one of China’s first international metropolises with a smart and healthy governance system. This city is located at 29°11′–30°34′ N,118°20′–120°37′ E, south of the Yangtze River Delta metropolitan area of China, in the eastern part of Asia. Hangzhou is in the subtropical monsoon climate zone, which is hot and rainy in the summer, with the highest temperatures in the past two decades surpassing 38 °C, especially in 2017, when it reached 41.3 °C. As the city sprawled and the economy grew, permanent urban residents reached 83.29 percent of the population in 2020 [43], and this rapid urbanization led to drastic changes in land development, greatly altering the thermal environment’s patterns [44]. Moreover, high temperatures brought direct and indirect health risks to residents, elevating their incidence and mortality, and damaging their mental health. The vulnerable population finds it more difficult to cope with hot temperatures [45]. Additionally, in 2020, the number of residents over or equal to 60 years old surpassed 2 million, accounting for 16.87% of the total population [43], which further expands the area of health risk. Therefore, this study chose Hangzhou as the study area (Figure 1), covering an area of about 4520 km2, including Shangcheng District, Gongshu District, Xihu District, Linping District, Yuhang District, Binjiang District, Xiaoshan District, Qiantang District, and Fuyang District.

2.2. Data

2.2.1. Remote Sensing Data

This study applied Landsat TM/OLI image data from 4 August 1984, 11 August 1998, and 8 September 2020, provided by the United States Geological Survey (USGS) [46]. The Landsat data from these three different periods covered the socioeconomic change stages of the study area well, which was conducive to the analysis of urban space and surface temperature changes. When the remote sensing image was taken, it was a hot summer, no precipitation occurred 72 h before the imaging time, and the average wind velocity was less than 2.3 m/s. Hence, the image data were relatively accurate due to the sound climatic conditions, which benefited temperature retrieval. WGS 1984 is currently the most popular geographic coordinate system, and all data were based on WGS 1984 data to ensure data consistency.

2.2.2. Meteorological Data

In this study, Hangzhou City’s surface meteorological hourly observation data in July and August of 1984–2021 were collected from the China Meteorological Data Service Center (CMDC) [47]. The instantaneous temperature of the questionnaire survey was taken via small WS-30 handheld weather stations 1.5 m above-ground (±0.3 °C in accuracy, ±3% in humidity, ±0.3 m/s in wind velocity), which was appropriate for the urban outdoor environment.

2.2.3. Negative Emotions and Socioeconomic Data
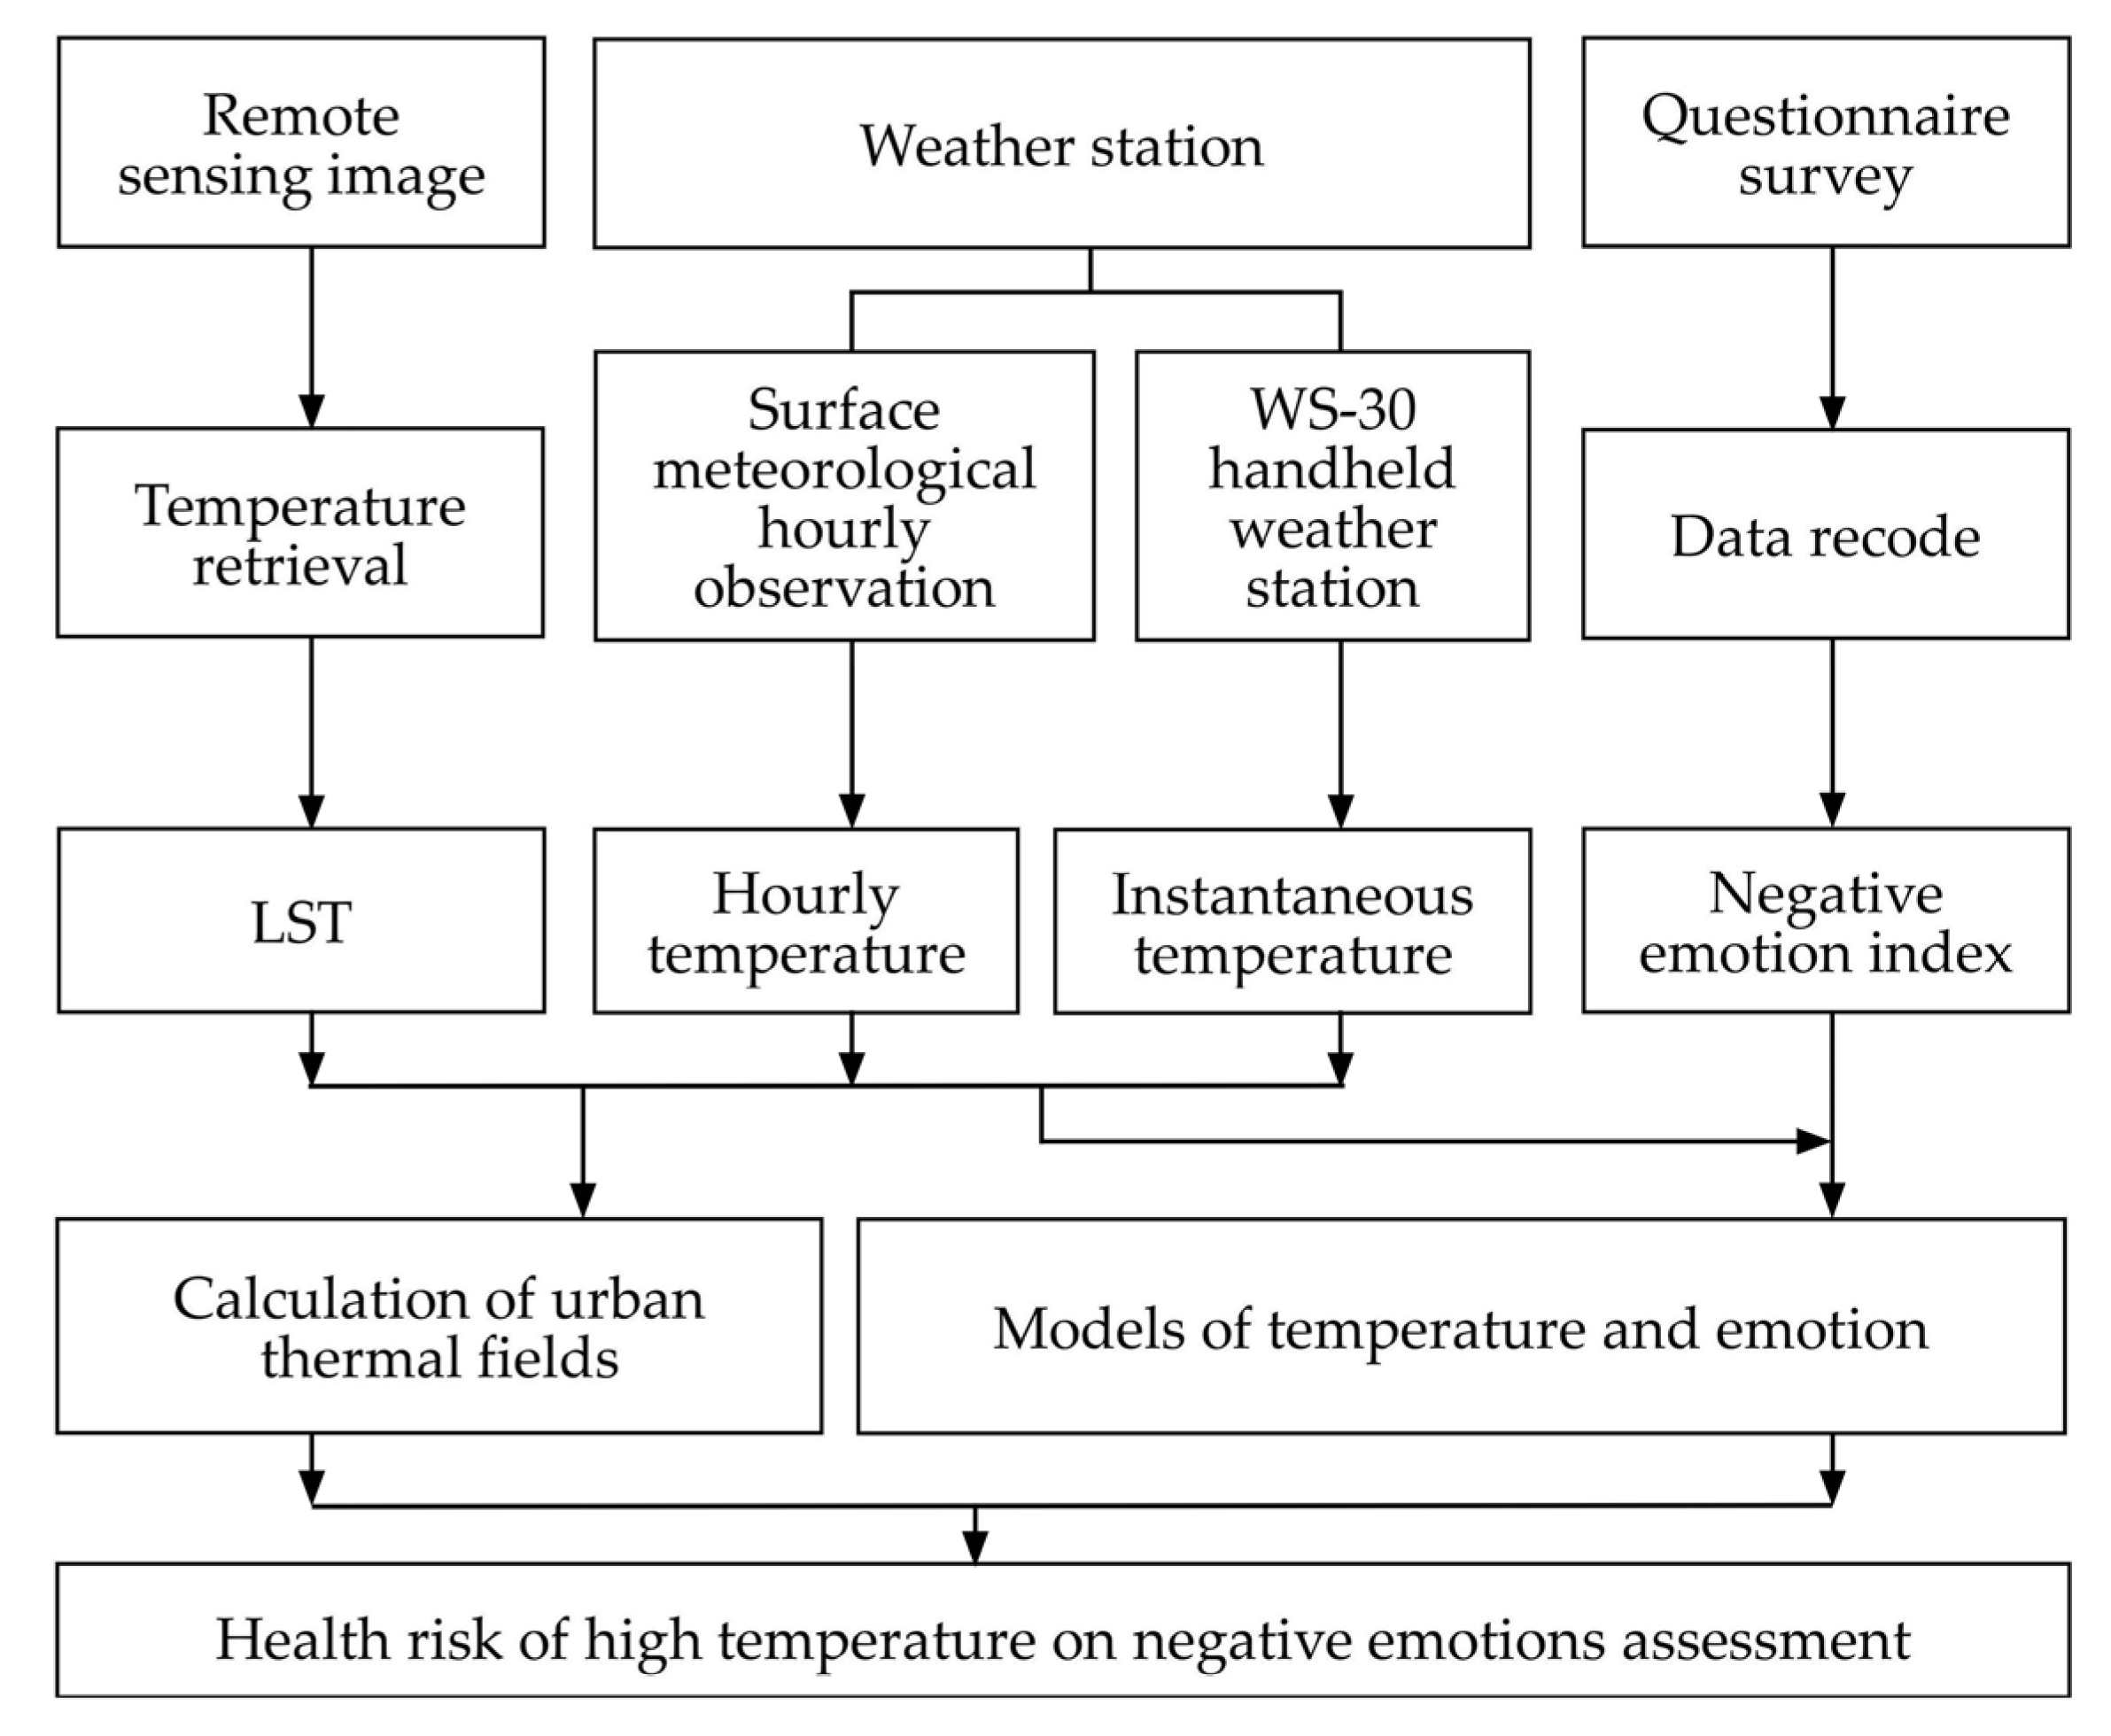
Negative emotions and socioeconomic data were collected from the questionnaire survey. The questionnaire was composed of two parts: background information and emotional measurement, in line with the emotion scales suitable for Chinese and elderly people [48,49,50]. Specifically, the background information form was about the residents’ personal characteristics, including age, gender, living arrangements, education background, employment status, outdoor travel time, and activity type (Table 1). The emotion scale was a survey of negative emotions, containing four factors: distressed, hostile, irritable, and nervous. Respondents were asked four questions “Do you feel distressed, hostile, irritable or nervous now?”, and they could answer “never” “almost never”, “sometimes”, “almost always”, or “always”. This study recoded the negative emotions into ordered variables and assigned scores to the answers accordingly, from the score of “1” for “never” to the score of “5” for “always”. Inspection showed that the Cronbach’s α of our questionnaire was over 0.71 and the KMO value was 0.715, indicating sound reliability and validity.
This study selected open spaces in the daily lives of residents, including residential areas, city squares, and green spaces, for the interviews. These survey areas covered the city’s high-temperature, medium-temperature, and low-temperature areas, and the three areas accounted for 59%, 33%, and 8% of the total, respectively. The temperature sample size was adequate, and it had a typical representative of emotions in these temperature ranges. The survey period was from 31 July 2020 to 14 August 2020. The questionnaire survey followed these principles: (1) no precipitation 48 h before the survey day; (2) subjects were over or equal to 40 years old; (3) subjects were in a good mood and willing to cooperate; (4) people who were shortly exposed to high temperatures were excluded; and (5) no question-and-answer, less interference from the interviewer. A total of 563 questionnaires were distributed, and 552 valid questionnaires were finally obtained after excluding invalid questionnaires, such as those that were blank, incomplete, or where the participant was under 40 years old.

2.3. Methodology

2.3.1. Land Surface Temperature Retrieval

Figure 2 shows the research framework of this study. The Split-Window algorithm was used for land surface temperature (LST) retrieval in ENVI. ArcGIS was easily combined with ENVI for coupled analysis. First, the digital number (DN) was transformed into the corresponding heat radiation intensity for radiometric calibration, then for atmospheric correction via the FLAASH model based on MODTAN [51]. Next, the brightness temperature was obtained through the thermal infrared band. The normalized vegetation index (NDVI) and proportion of vegetation were calculated, and the land surface emissivity (LSE) was obtained from these two factors. Finally, the LST was calculated by substituting the brightness temperature and LSE into the Formula T L [52]:
T L = T 1 + ( λ T / ρ ) ln ε 273.15
where λ is the central wavelength of the TM 6 band (11.5 μm), and ρ = h × c σ = 1.438 × 10 2 K (where the Stefan–Boltzmann constant σ = 1.38 × 10 23 J/K, Planck constant h = 6.626 × 10 34 Js, and speed of light c = 2.998 × 10 8 m s ).

2.3.2. Calculation of Urban Thermal Fields

A sound relevance could be built between the LST and the near-surface air temperature (NSAT), two critical parameters that reflect the interaction mechanism of urban thermal fields [53]. Studies have shown that the LST is highly correlated with temperature in all land types, especially during the daytime [54]. It was of great practical significance to identify the factors impacting urban thermal fields and connect them with spatial patterns for alleviating high temperatures [55,56]. According to on-site measurements, solar radiation is the strongest at 07:00–18:00. Xu et al. found that one of the periods when the impact of hourly high temperature on residents peaks is 11 a.m. [57]. Based on these findings, this current study selected the daytime (8:00–18:00) and typical periods (11:00–15:00) to establish the relationship between the average temperature and LST.
The calculation of the average temperature in the daytime (8:00–18:00) was based on the hourly temperature of 154 surface weather stations. The corresponding LST was obtained by extracting the site location from ArcGIS. Then, SPSS was used for correlation analysis, the Spearman rank correlation coefficient was 0.739, and the p-value (Sig.) was less than 0.05, indicating a strong correlation between the average temperature in the daytime (8:00–18:00) and LST. Therefore, MATLAB was employed to formulate a regression equation, with R2 = 0.55 and RMSE = 0.7:
T D = 17.89 + 0.39 T L
where T D is the average temperature in the daytime (8:00–18:00), and T L is the LST.
Similarly, SPSS was used to analyze the correlation between the average temperature (11:00–15:00) in typical periods and the LST. The Spearman rank correlation coefficient was 0.699, and the p-value (Sig.) was less than 0.05, indicating a strong correlation between them. Finally, the regression equation was established, with R2 = 0.66 and RMSE = 0.7:
T P = 14.54 + 0.54 T L
where T P is the average temperature in typical periods (11:00–15:00), and T L is the LST.

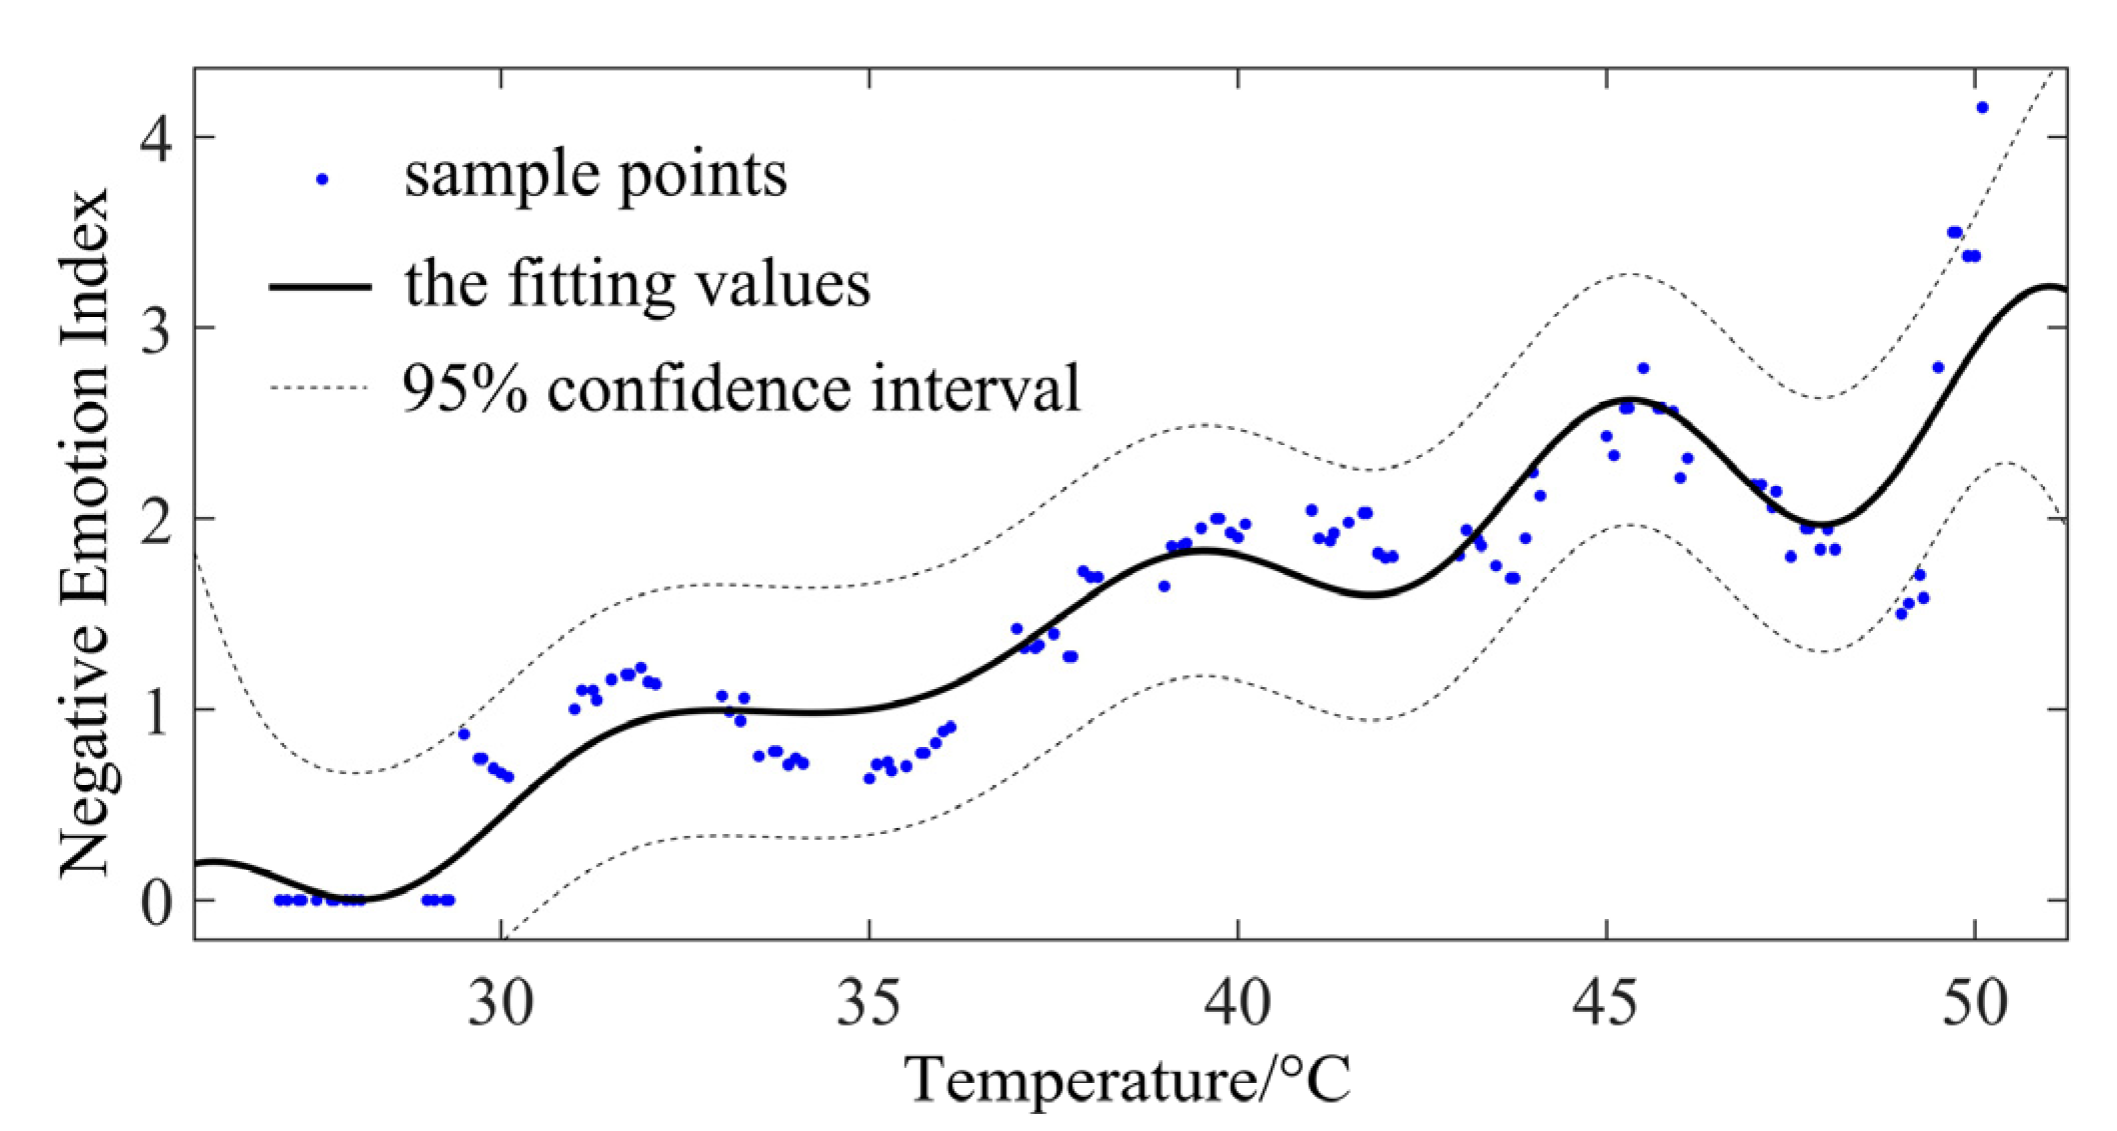
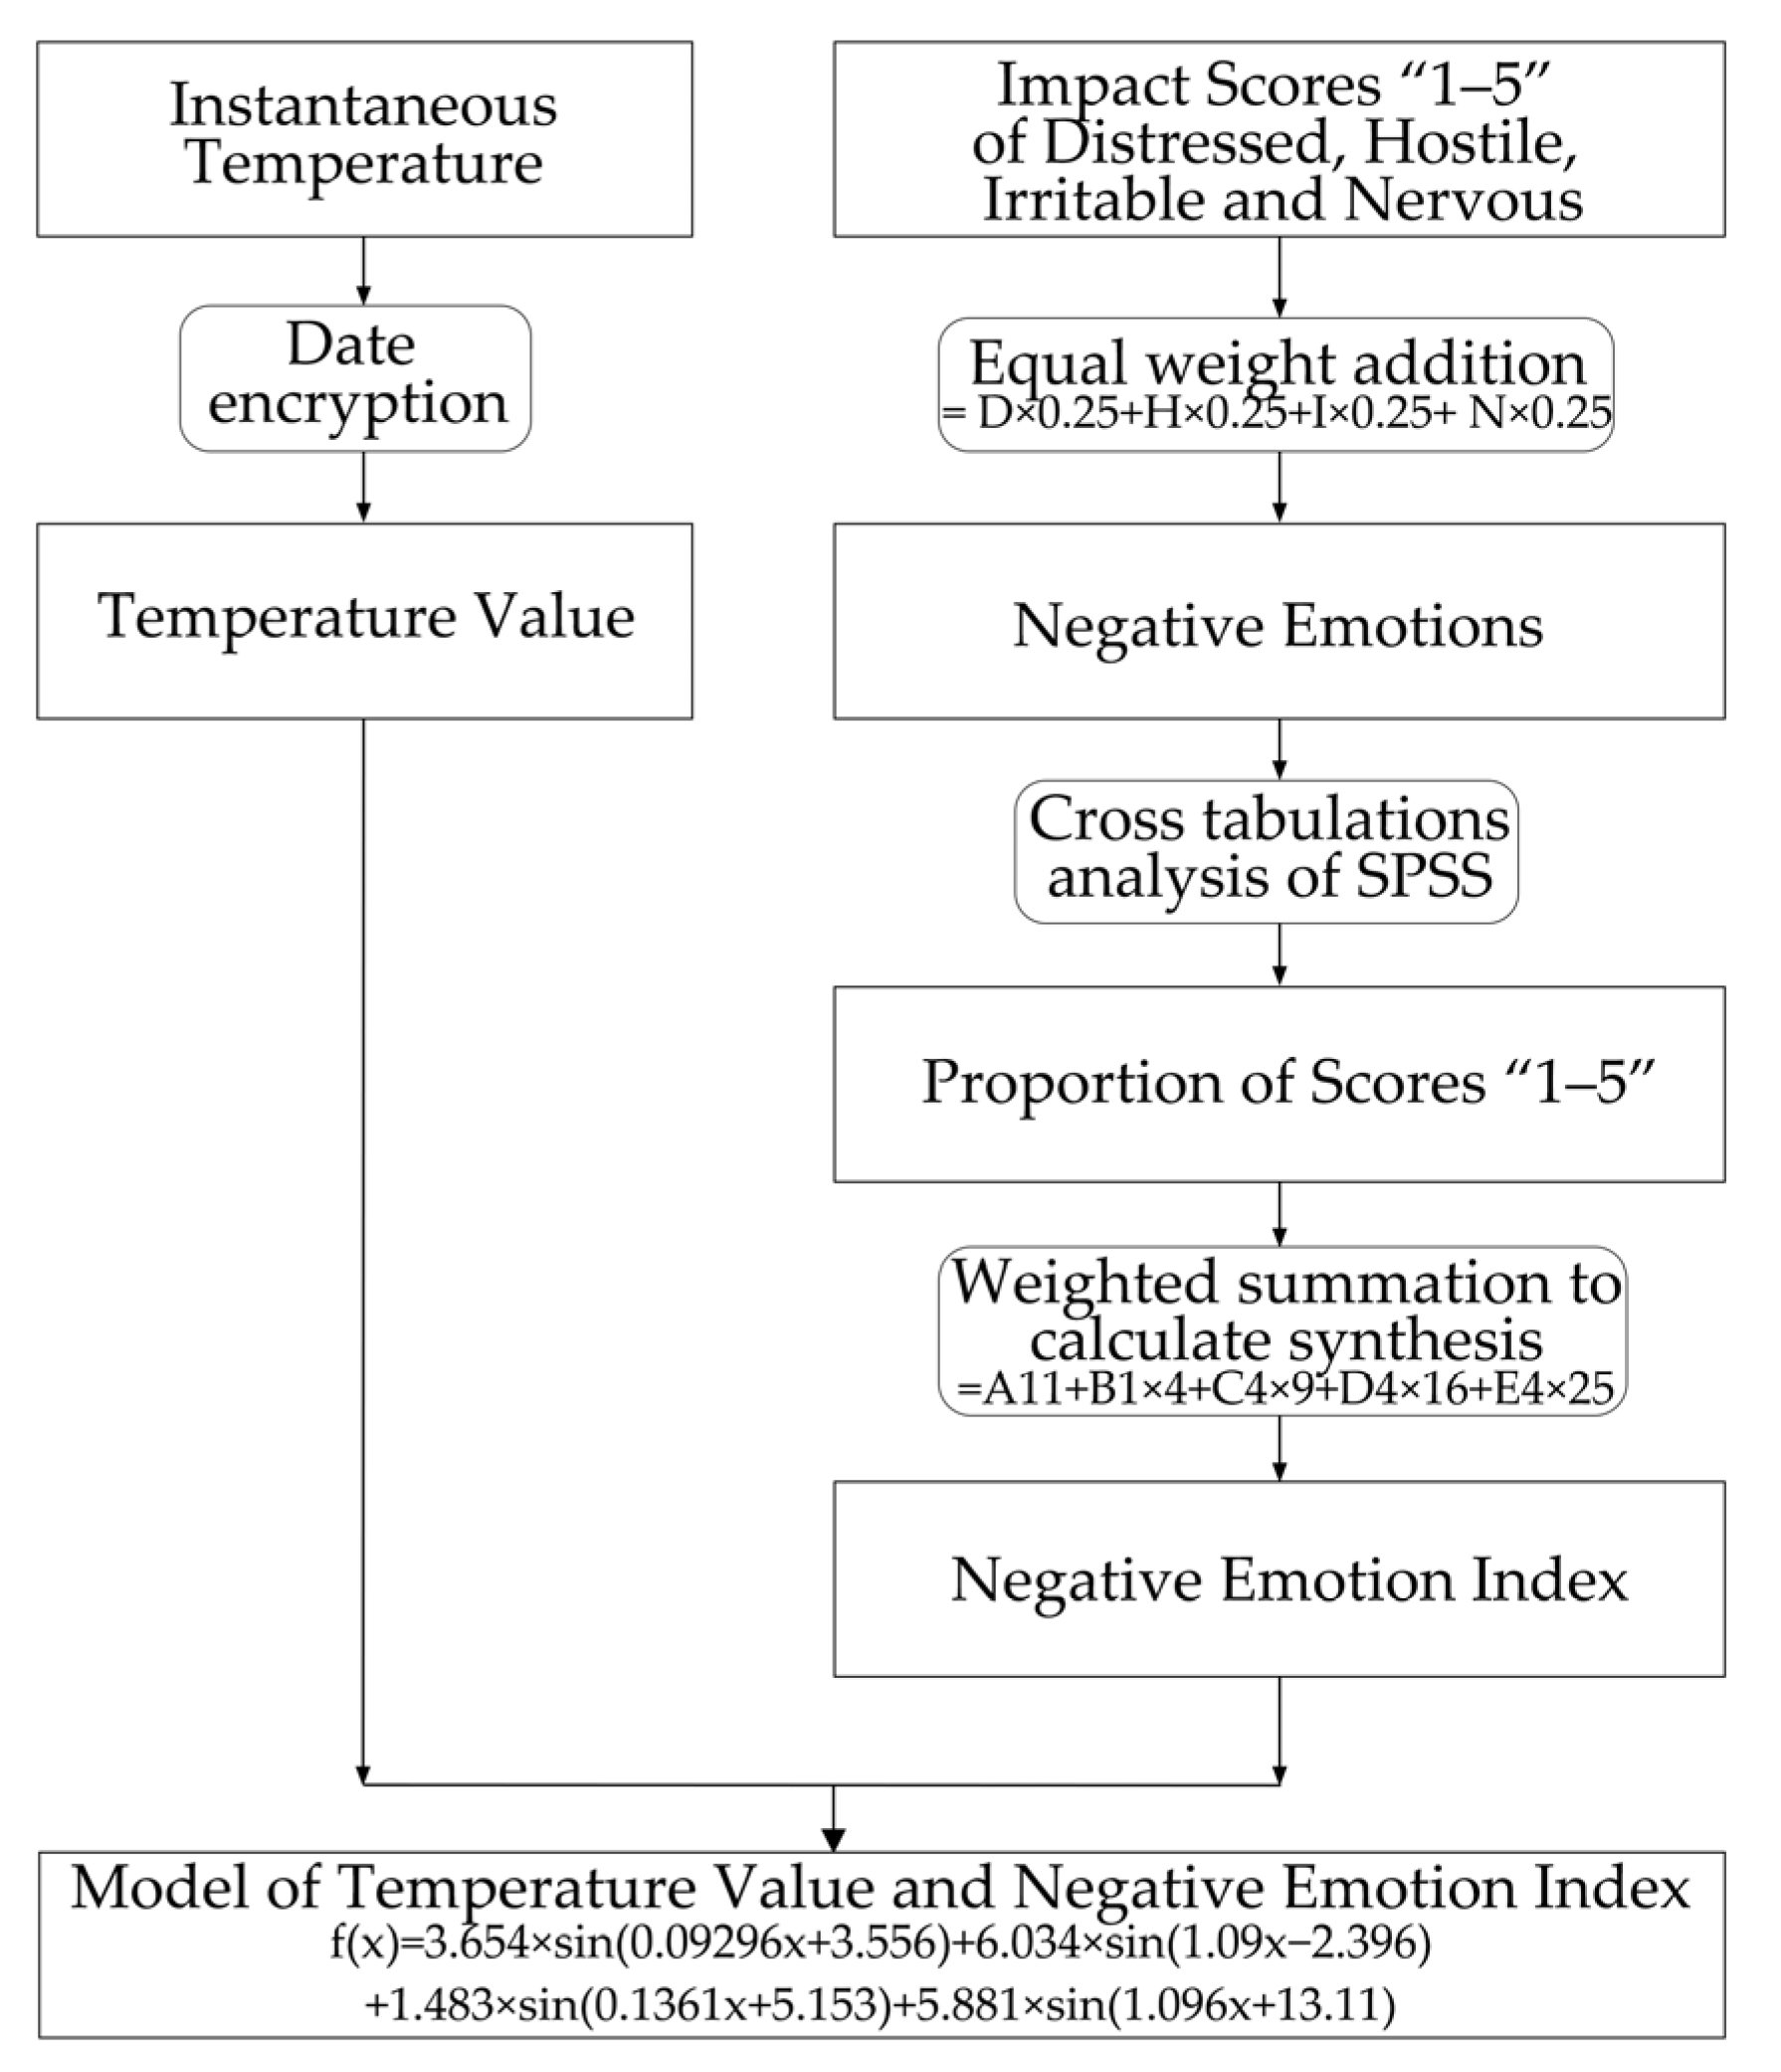
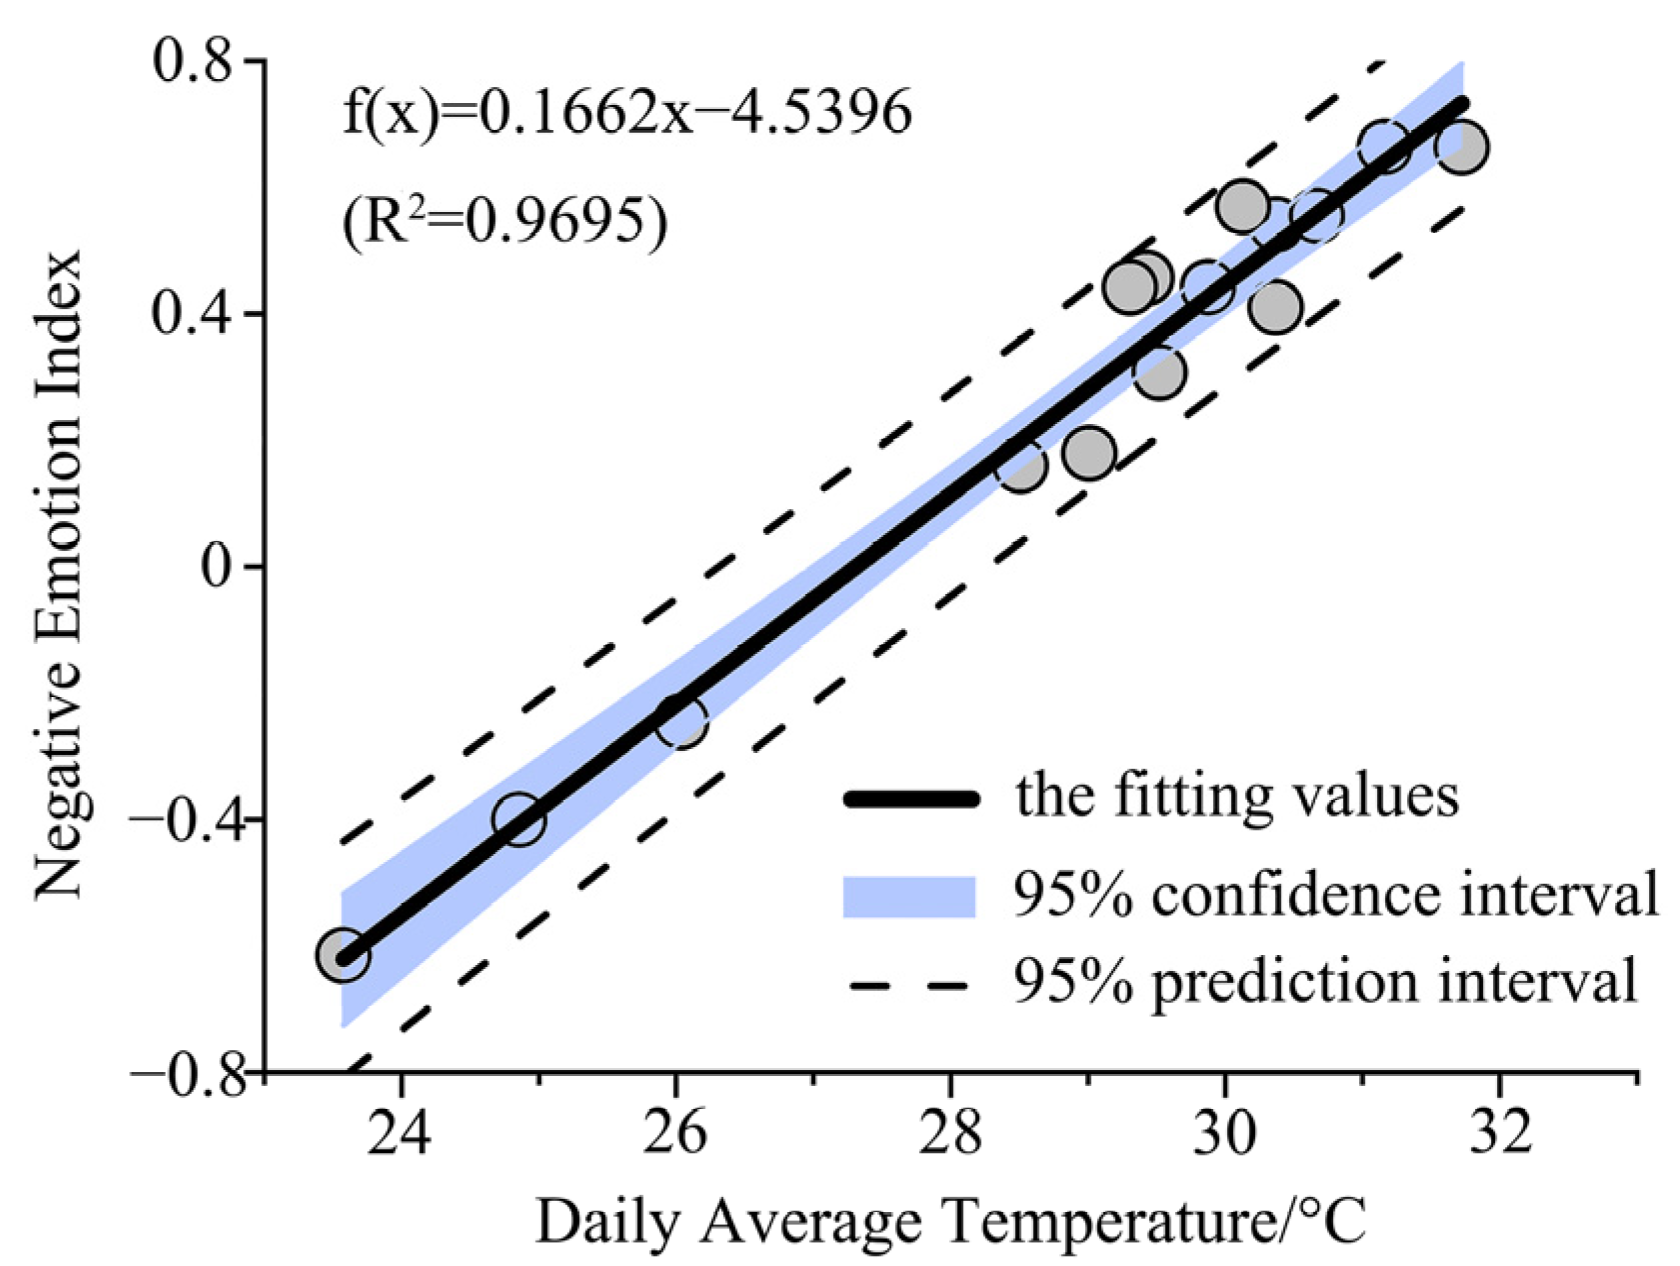
2.3.3. Method for Evaluating the Effects of High Temperature on Negative Emotions

The instantaneous temperature measured by the WS-30 handheld weather station was encrypted. The temperature value was obtained by dividing the temperature interval corresponding to the instantaneous temperature, and then taking the average value of each interval. Negative emotions were obtained by equal weight superposition of the impact scores of distressed, hostile, irritable, and nervous. First, cross tabulations analysis in SPSS was used to obtain the proportion of scores “1–5” of negative emotions in each temperature value. Then, the negative emotion index was a weighted summation of the ratio of scores “1–5”. Finally, a model of the temperature value and negative emotion index was established in MATLAB (Figure 3 and Figure 4), with R2 = 0.88 and RMSE = 0.3:
f ( x 1 ) = 3.654 × sin ( 0.09296 x 1 + 3.556 ) + 6.034 × sin ( 1.09 x 1 2.396 ) + 1.483 × sin ( 0.1361 x 1 + 5.153 ) + 5.881 × sin ( 1.096 x 1 + 13.11 )
where f ( x 1 ) is the negative emotion index, and x 1 is temperature value.
The trend of the negative emotion index affected by daily average temperature was calculated using the linear trend estimation method [58]. The daily average temperature was obtained by averaging the hourly temperatures of the Chinese meteorological stations. The mean value of the negative emotion index was obtained by substituting the hourly temperature into the model (4). Finally, a fitting curve equation of the daily average temperature and negative emotion index was established (Figure 5), with R2 = 0.97 and RMSE = 0.4:
f ( x 2 ) = 0.1662 x 2 4.5396
where f ( x 2 ) is the negative emotion index and x 2 is the daily average temperature.
According to the fitting curve Equation (5), an influence diagram of high temperatures on negative emotions in Hangzhou was obtained using ArcGIS. Medical meteorological experiments set the upper limit of human heat tolerance at 32 °C [59]. Meanwhile, referring to Noelke et al.’s proposed threshold temperature to affect emotion [21], the threshold of emotional health risk was based on a temperature of 32 °C (negative emotion index was 0.8). As the temperature increased by 1 °C, the negative emotion index rose by 0.2. Consequently, an assessment standard of I to VI health risk levels of high temperature’s influence on negative emotions was constructed (Table 2).

2.3.4. Optimized Hot Spot Analysis

Hot spot analysis is efficient for studying the changes in regional spatial patterns. Therefore, the Getis-Ord G i * index was applied to identify the cold and hot spots of emotional health risk during the process of urbanization in order to clarify the features of their spatial evolution. The formula is as follows [60]:
G i * = j = 1 n w i , j x j j = 1 n x j n j = 1 n w i , j j = 1 n x j 2 ( X ¯ ) 2 n n j = 1 n w i , j 2 ( j = 1 n w i j ) n 1
where x j is the attribute value of factor j   w i , j is the spatial weight between factors i and j , and n is the total number of all factors. The spatial correlation of G i * was calculated with | z |   >   2.58 level of significance p < 0.01 , and confidence level 99% of the statistical significance standard, to identify if there is spatial agglomeration and spatial structure, and to prove that certain basic spatial processes are exerting an influence.

3. Results

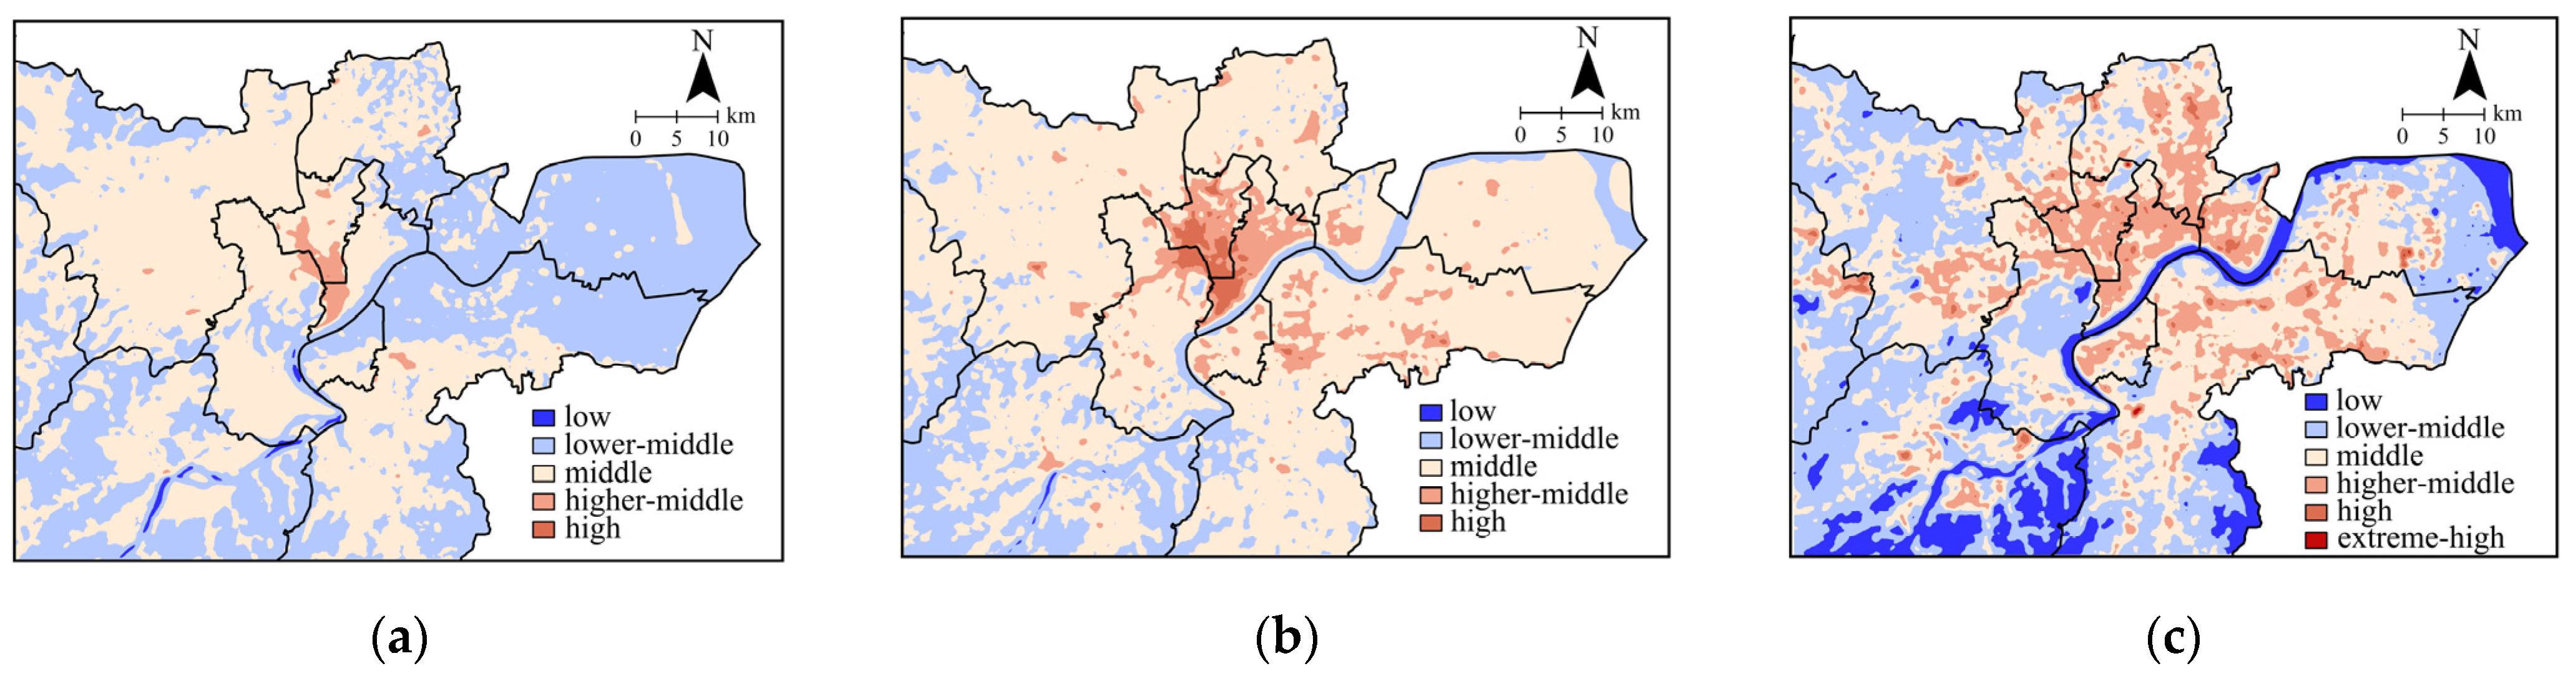
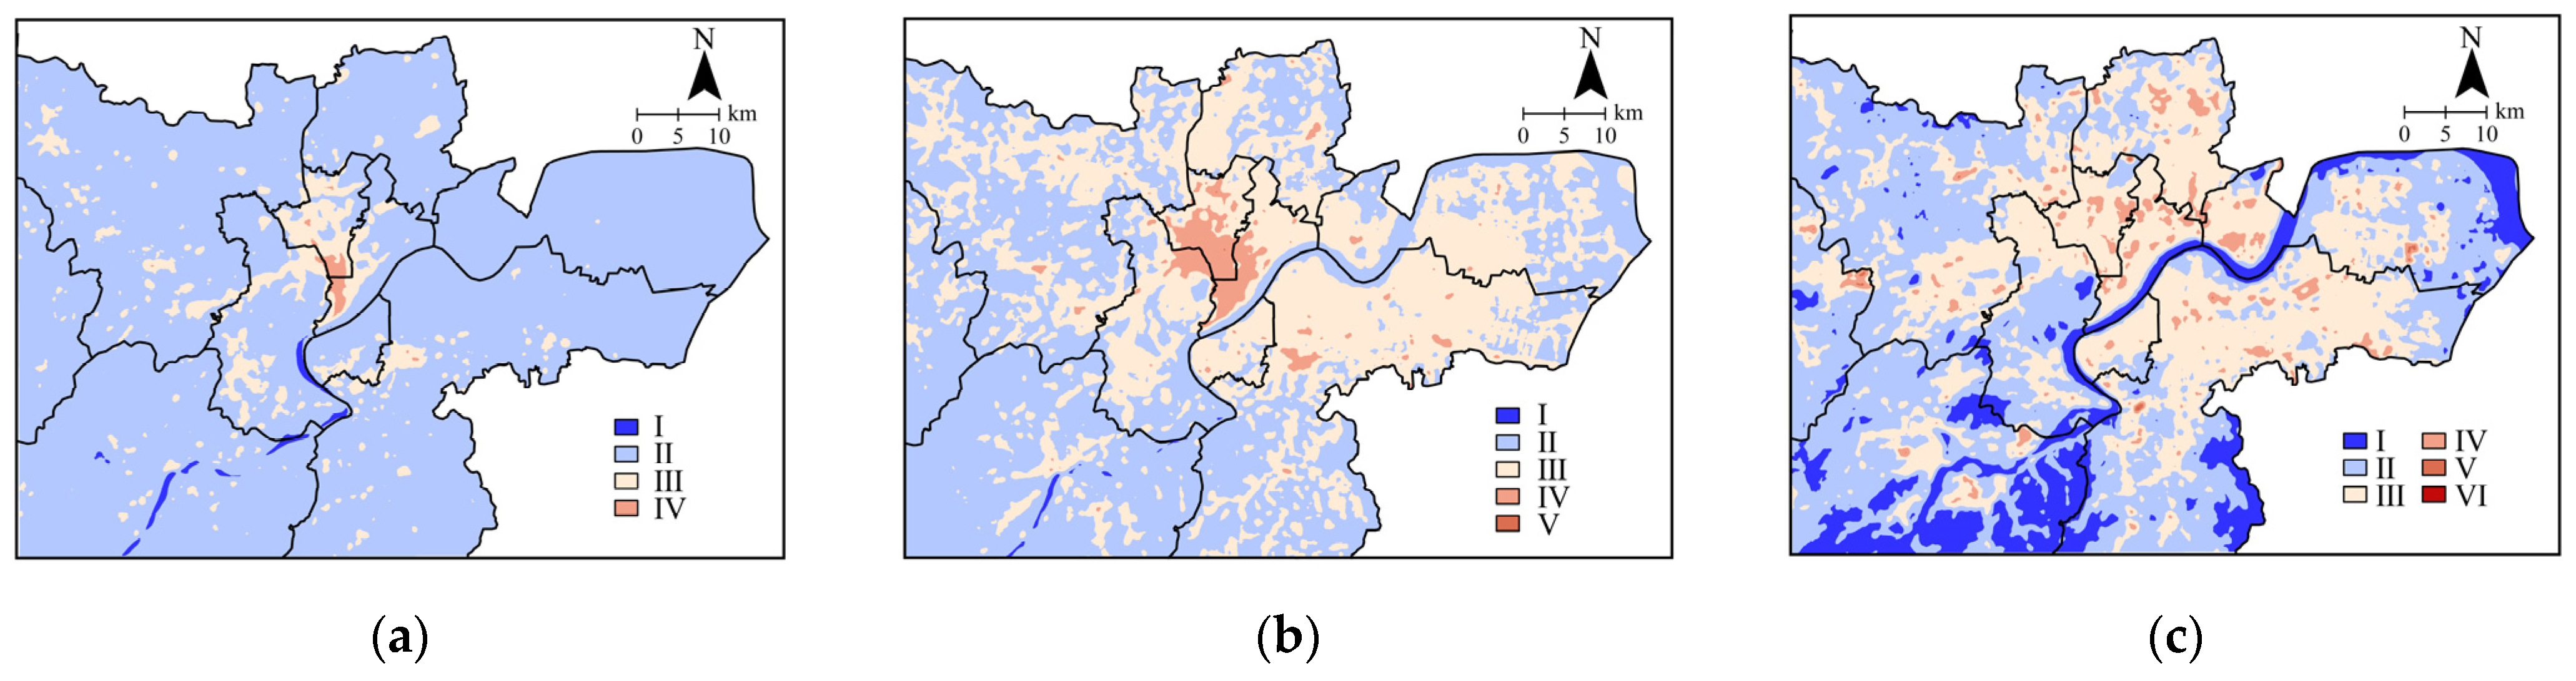
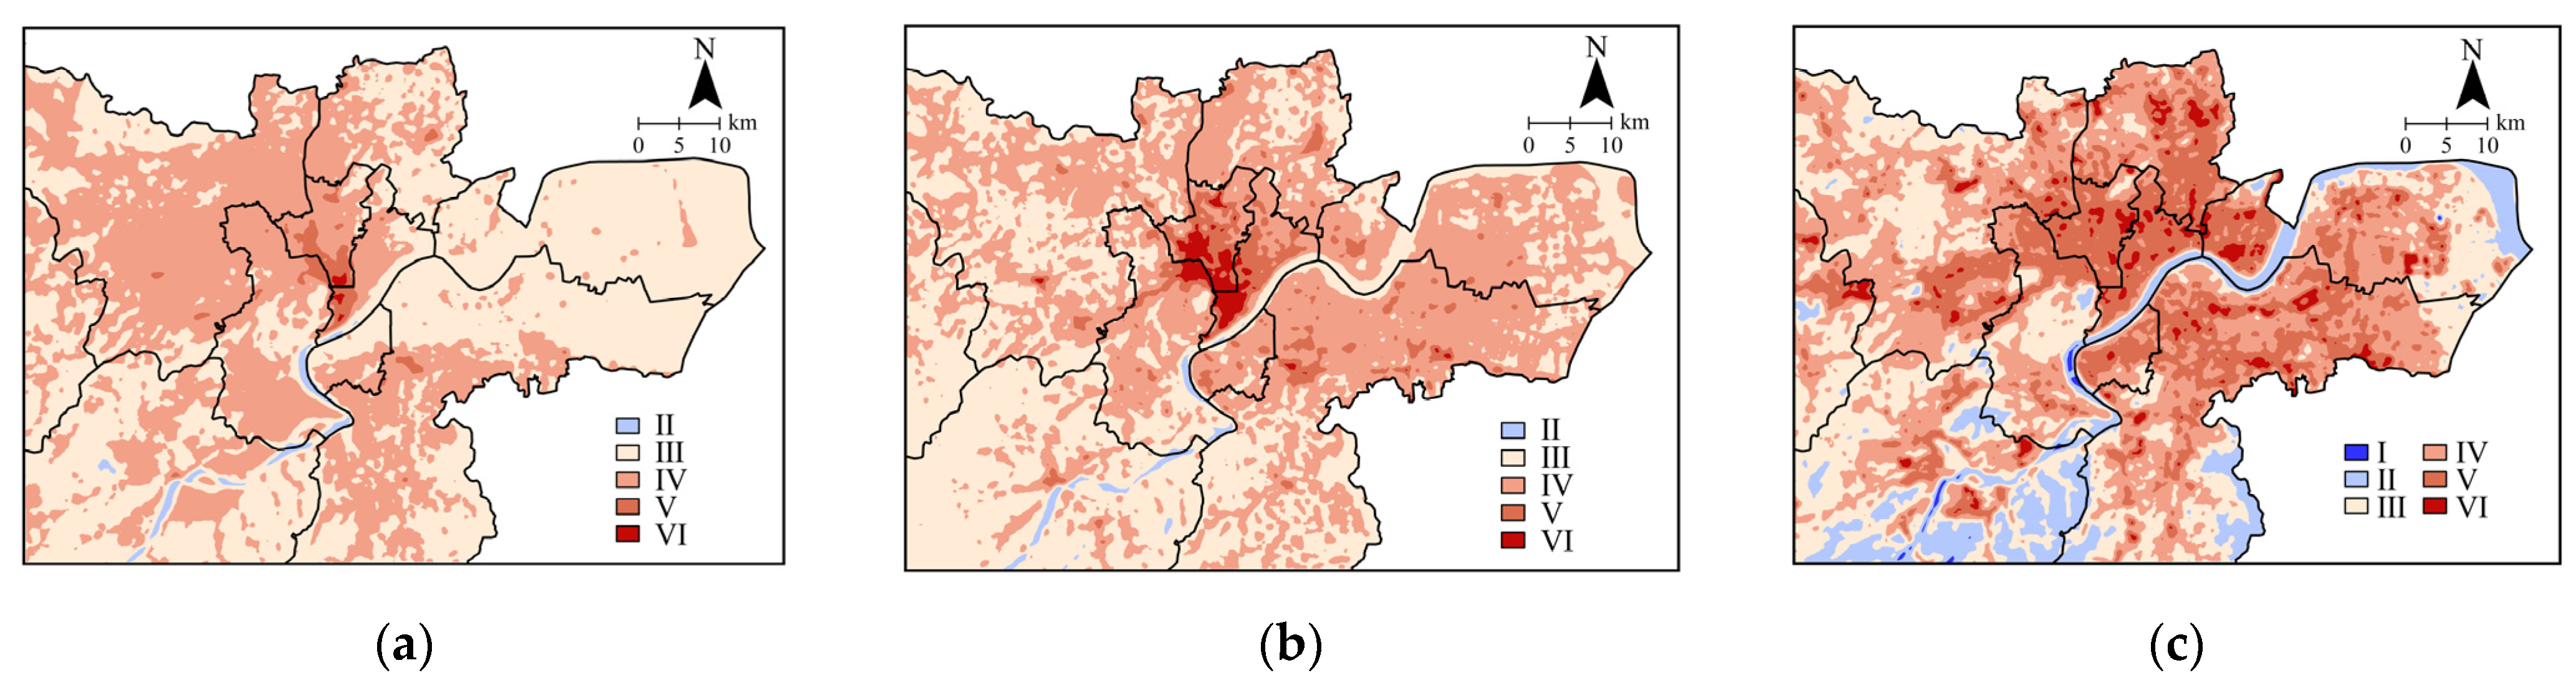
3.1. Spatiotemporal Evolution of Urban Thermal Environment

Based on the regression equations and surface meteorological hourly observation data during daytime and typical periods in Hangzhou, the spatial–temporal distribution map of the urban thermal environment from 1984 to 2020 was drawn (Figure 6 and Figure 7). According to the temperature range of the health risk assessment standard, Hangzhou’s thermal environment was divided into six levels: low-temperature zone, lower-middle-temperature zone, middle-temperature zone, higher-middle-temperature zone, high-temperature zone, and extreme-high-temperature zone. On the whole, the high temperature risks intensified in Hangzhou, showing an overall pattern of gathering first and then scattering. Higher-middle-, high-, and extreme-high-temperature zones increased in both influence area and influence level, aggregating from a cross-shape to a large patch shape, and then dispersed into cracked patch shapes.
In detail, the daytime results showed that, from 1984 to 1998 (Figure 6a,b), high-temperature zones gathered in the center and had a trend of diffusion around, whereas higher-middle- and high-temperature zones were located in the downtown area of Shangcheng District, Gongshu District, and Xihu District, increasing by 273.3 km2. From 1998 to 2020 (Figure 6b,c), higher-middle-, high-, and extreme-high-temperature zones scattered as cracked patches, expanding by 0.9 times in the area. In the meantime (Figure 6b and Figure 7b), higher-middle-, high-, and extreme-high- temperature zones in the same districts had a larger area and a stronger expansion tendency during the typical periods than during the daytime. In 2020, the thermal environment deteriorated the most during typical periods, and the total area of high-middle-, high-, and extreme-high-temperature zones broadened fourfold than the area during the daytime (Figure 6c and Figure 7c). Extreme-high-temperature zones were mainly distributed in Hangzhou’s eastern and northern parts along the Qiantang River. The land cover type was urban construction land and commercial and industrial land, which were more likely to gather heat (Figure 8).

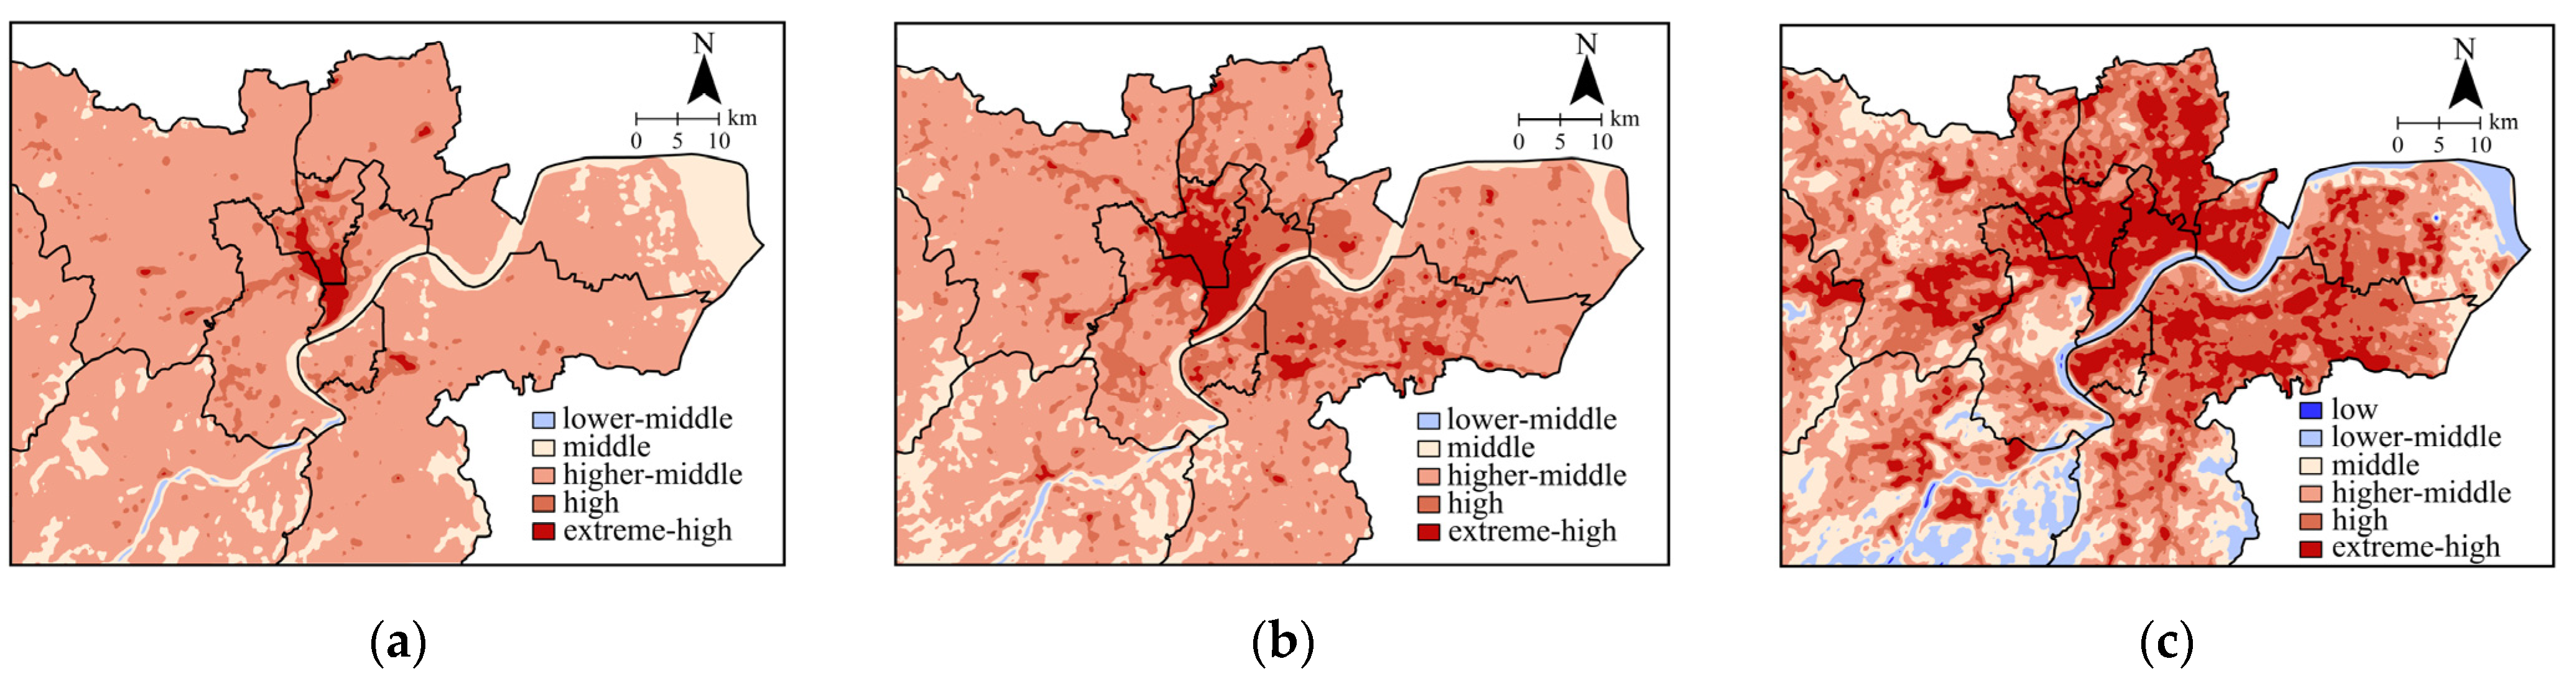
3.2. Assessment of the Health Risk of High Temperature on Negative Emotions

3.2.1. Analysis of the Patterns of Emotional Health Risk

Based on the thermal environment spatial–temporal pattern and emotional equation, the distribution of high temperature’s influence on negative emotions in three years (1984, 1998, and 2020) is shown in Figure 9 and Figure 10. To sum up, the analysis demonstrated that in Hangzhou, residents’ emotional health risk rocketed, peaking at the VI-level in 2020. In the same districts, compared with the emotional health risk during the daytime, the risk during the typical periods increased by 1–2 levels. The evolution of the emotional health risk patterns responded to spatial policy changes in Hangzhou, as seen in the distribution of V and VI levels in Figure 10b,c, with high-risk patches shifting from urban centers to the emerging construction areas on the outskirts.
Analysis of the daytime results showed that, during 1984–1998 (Figure 9a,b), the emotional health risk level of urban centers reached IV and V levels, and the III-level area gradually expanded towards the peripheral Yuhang District, Binjiang District, and Xiaoshan District, with its area increasing by 4.73 times. The main reason was that Hangzhou adopted a “concentric circles” development model, in which urban centers served commercial functions and were transportation hub-based, and with the increasing building density, the surface temperature rose [61]. As a result, residents who commuted and worked there were vulnerable to negative emotions due to the high temperatures. During 1998–2020 (Figure 9b,c), VI-level risk, the highest level, occurred in the national-level development zones in Xiaoshan District and Qiantang District, the IV-level area scattered, and the I-level area broadened. The result of unplanned and poorly managed urban sprawl was declining agricultural and natural land, resulting in remarkable landscape fragmentation [62]. Residents were more likely to develop irritability as impervious areas in emerging built-up areas increased and plant patches decreased. Additionally, on Fuchun Mountain, West Lake, and Xixi Wetland, non-risk zones formed, indicating that the ecological environment could effectively alleviate high urban temperatures, simultaneously easing residents’ negative emotions.
Comparisons of the daytime results in 1984 showed that the proportion of the IV-level area in the typical periods in 1984 increased by 43.07% (Figure 9a and Figure 10a). The V- and VI-level areas gathered in a fan shape in the northern Qiantang River in 1998, with the area proportion of typical periods rising by 5.76% more than the daytime (Figure 9b and Figure 10b). Compared with the daytime in 2020, the proportion of V- and VI-level areas in the typical periods rose by 24.89% (Figure 9c and Figure 10c). With the urban integration of the Hangzhou metropolitan area, residents would cover a larger commuting area, resulting in exposure to high temperatures for a longer time. In urban construction activities, more building materials would be consumed, and the coverage rate of high-density buildings would increase, resulting in a significant reduction in the natural surface coverage of cultivated land, woodland, and lakes. The mitigation effect on the thermal environment was limited, and emotional health risk increased.

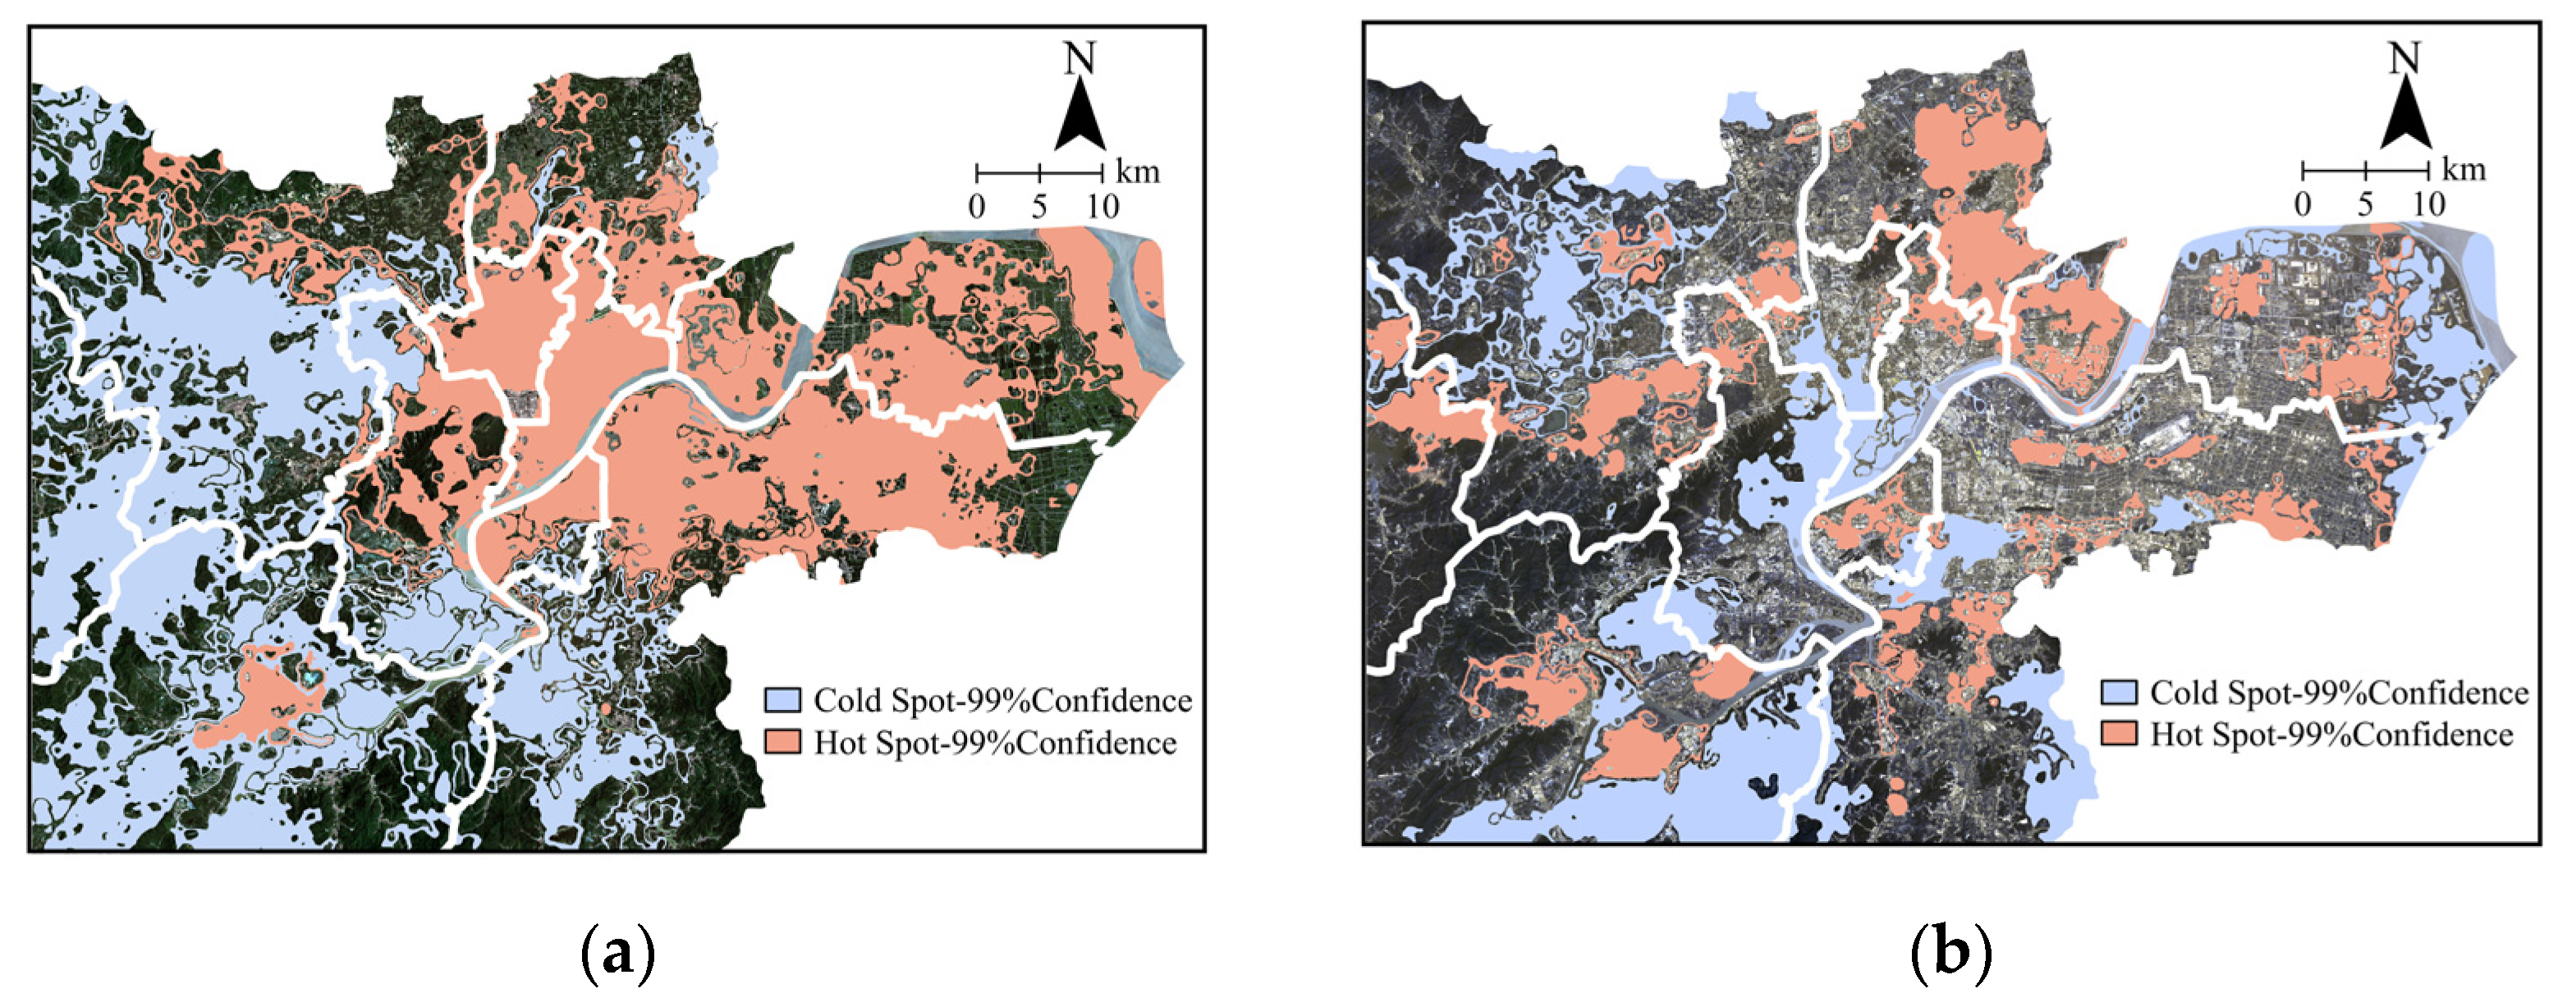
3.2.2. Hot Spot Analysis of Emotional Health Risk

This study made clear the distribution of the hot spots (high value) and cold spots (low value) of statistical significance with 99% confidence in the evolution of emotional health risk during the two periods of 1984 to 1998 and 1998 to 2020 (Figure 11). Overall, hot spots first gathered in the northeastern part and kept deteriorating, and then became scattered all over the study area with multiple centers, whereas cold spots shifted from the west to urban centers and the east. Both cold and hot spots tended to fragment into smaller patches.
From 1984 to 1998 (Figure 11a), hot spots were mostly concentrated in urban centers and the east, presenting a large, concentrated area. The Fifth Master Planning of Hangzhou City linked the urban centers with its sub-center in the northeast into a cluster. Therefore, the hot spot area of negative emotions was closely related to the spatial structure pattern of “one master and three sub-centers”. In the 1990s, Hangzhou’s Economic and Technological Development Area took the lead in terms of urbanization. Yanan Road in Shangcheng District and Hubin Road in Xihu District took on the roles of commerce, business, traffic, and tourism. Xiaoshan Economic and Technological Development Zone and Jiangdong Industrial Park in Qiantang District were responsible for economic radiation and expansion [63]. As a result, it was relatively likely for industry, logistics, and warehousing in urban centers and sub-centers to cause a loss of ecosystem functions, exacerbating heat waves, thereby reducing residents’ comfort and worsening their emotional health risk.
From 1998 to 2020 (Figure 11b), hot spots shifted to the suburbs, with residents’ emotional health risk elevating in the north of Yuhang District, central Fuyang District, and Linping District. According to the Hangzhou Territorial Spatial Planning (2021–2035), the city will progress with multiple urban centers, with each sub-center being built with a unique and innovative positioning, such as Hangzhou Cloud City and Future Sci-Tech City in Yuhang District, Jiangnan New Precinct and Huanggongwang Leisure Resort in Fuyang District, and Qingshanhu Sci-Tech City in Linping District. These spaces with growth potential inside Hangzhou City have significantly impacted the patterns of the urban thermal environment [64], enlarging the area of deteriorated health risk towards the outskirts. In the meantime, cold spots gathered in the urban centers as relatively smaller patches, showing a positive potential for future improvement and upgrade. Moreover, innovative service industries have appeared on urban land, thus alleviating the emotional health risk of residents living in some parts of urban centers.

3.3. Analysis of the Socioeconomic Status of the Middle-Aged and Elderly Population

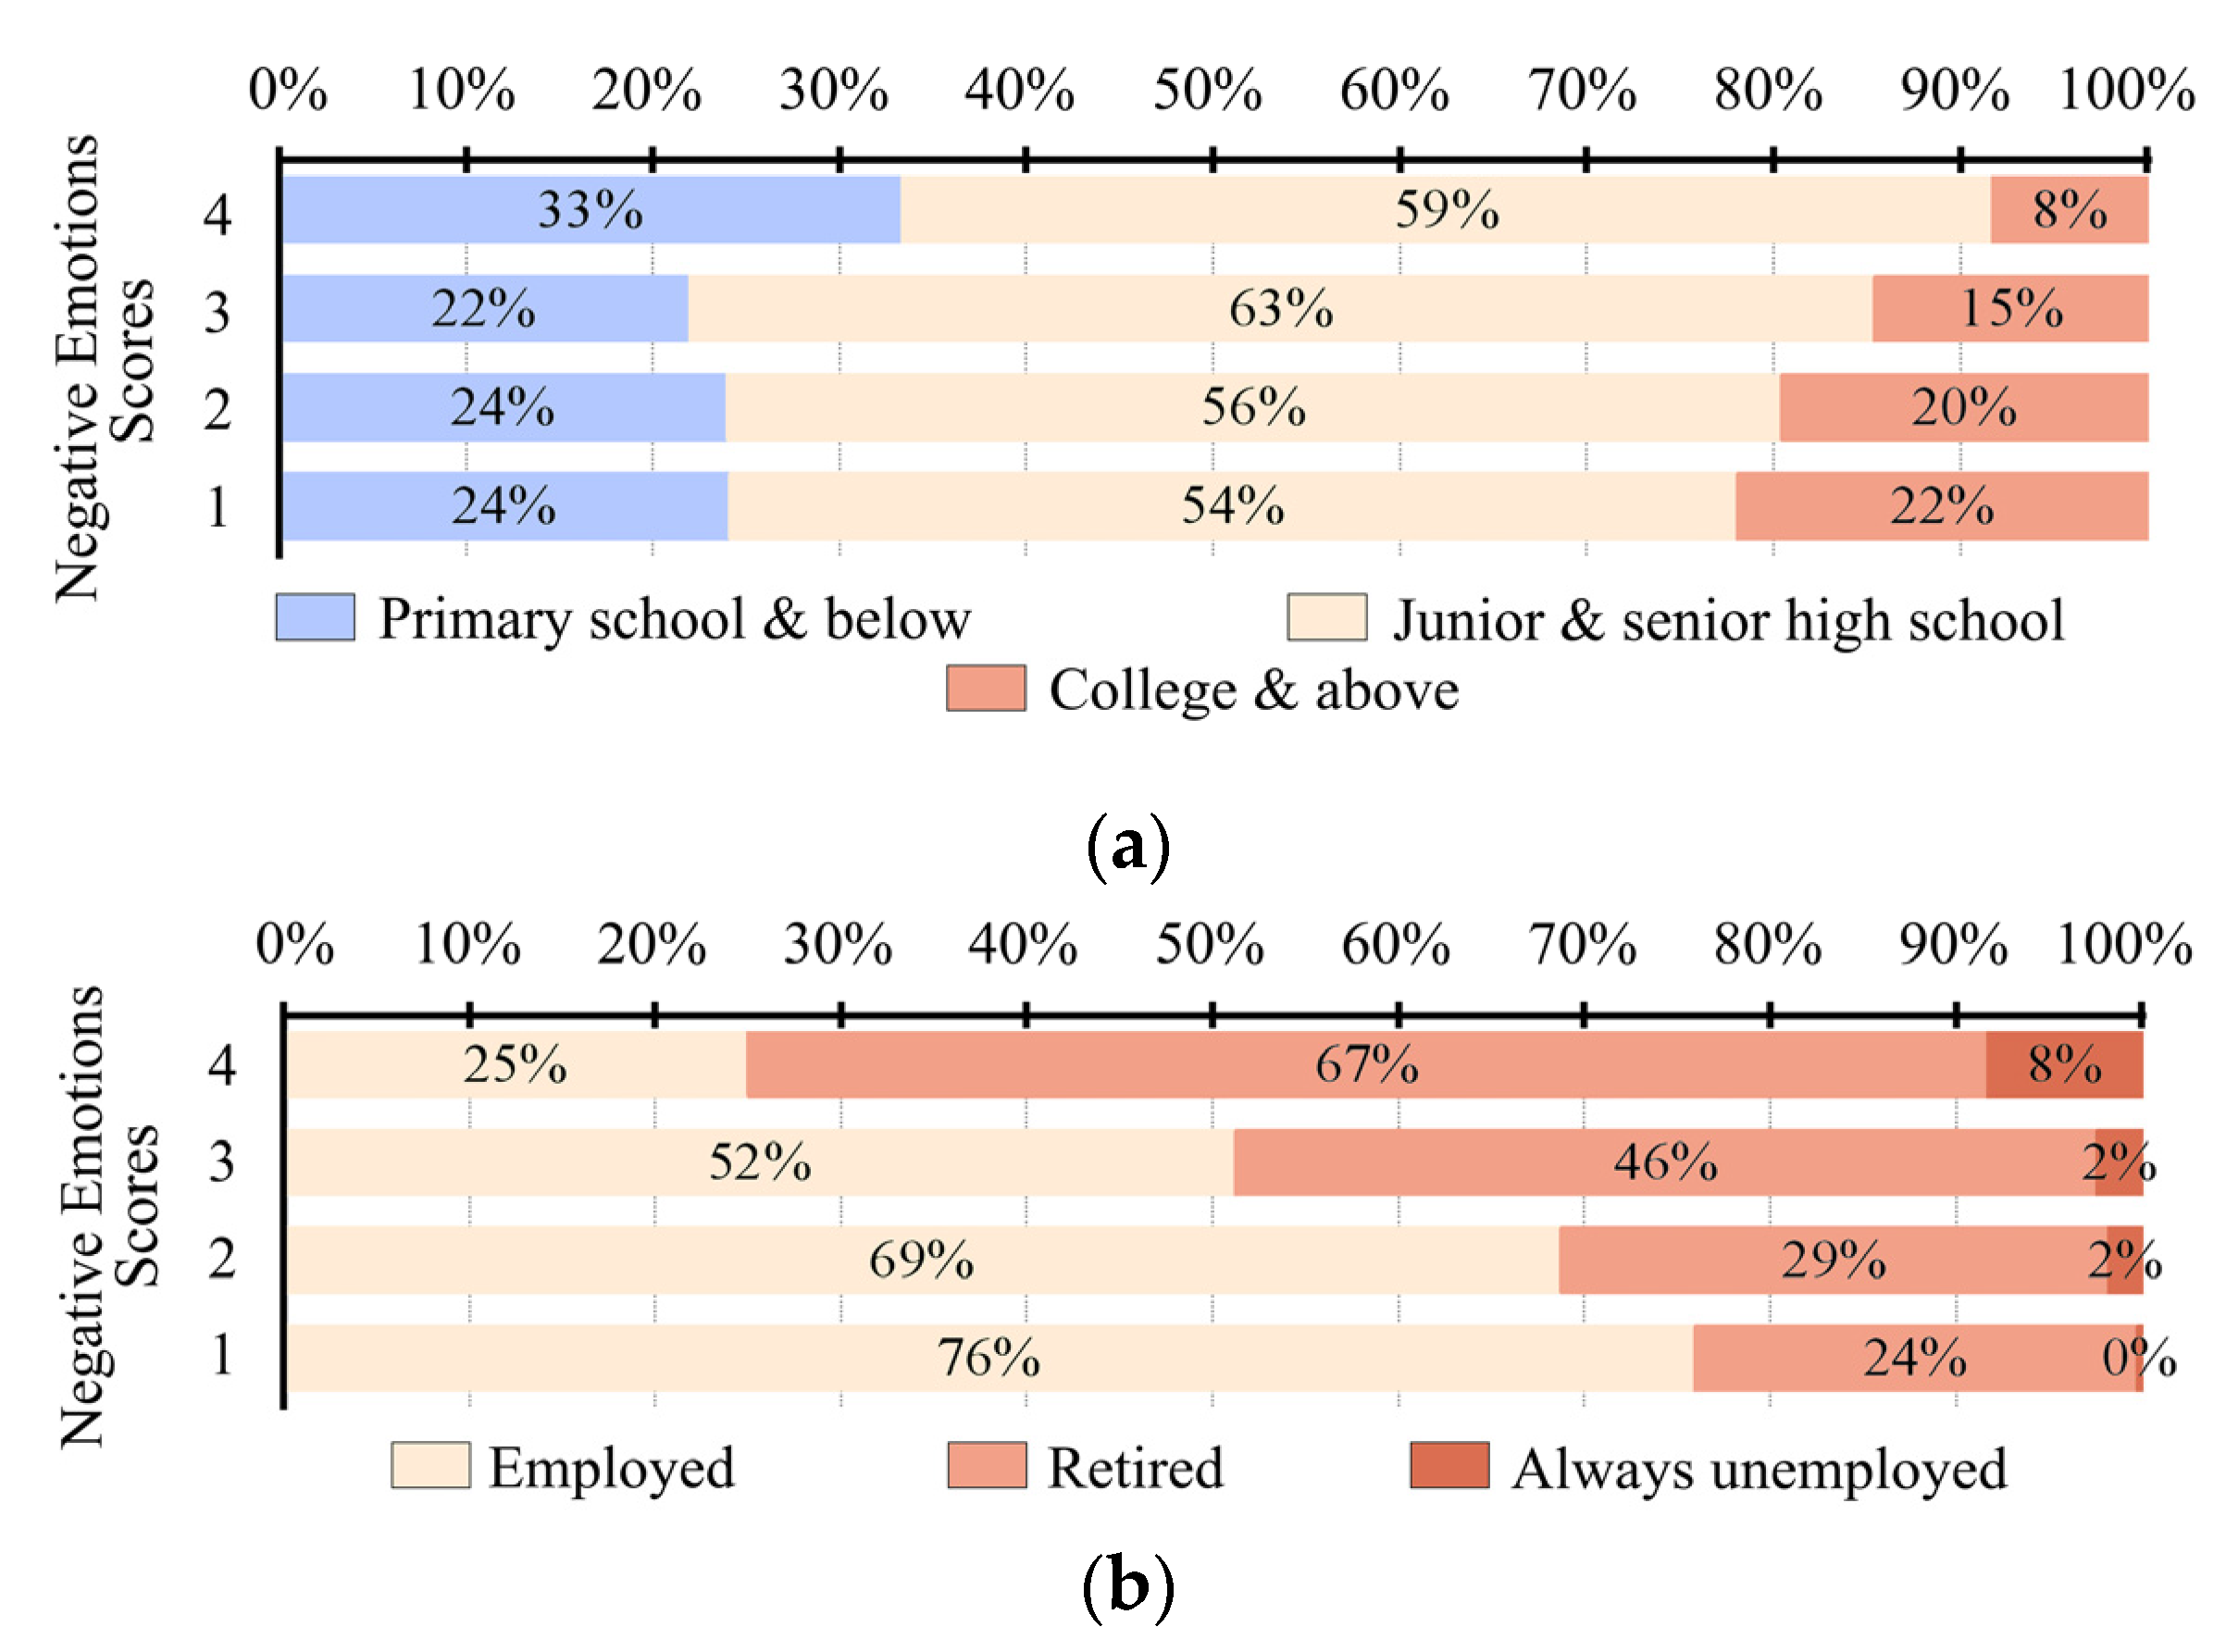
3.3.1. Education Background

This study carried out Crosstab Analysis on the correlation between negative emotions and socioeconomic status. After the questionnaire data were collected and cleaned, negative emotions were obtained by equal weight superposition of the impact scores of distressed, hostile, irritable, and nervous. Among scores “1–5”, the sample size of scores for “5” was too small to be eligible for Crosstab Analysis. Therefore, the impact scores of the high temperatures used in the analysis of the negative emotions of the middle-aged and elderly population were adjusted to “1–4”.
According to the cross-tabulation of education background, as shown in Figure 12a, the proportion of Primary School and Below and Junior and Senior High School increased from 78% (score “1”) to 92% (score “4”). Junior and Senior High School constituted the largest portion, accounting for over 50% of the negative emotion rating of all four levels. However, the percentage of College and Above gradually reduced, plummeting to only 8% in score “4”.
The results showed that the more educated residents were, the less likely they were to face serious emotional health risks, and vice versa. The reason was that being more educated meant having stronger adaptability to the living environment, and being more likely to receive medical and healthcare resources [65]. On the other hand, middle-aged and elderly people who were less educated faced higher emotional health risk. Due to low economic income, the accessibility of community service centers, pocket parks, healing gardens, and other places for cooling, emotional regulation was low, and the awareness of precaution was weak.

3.3.2. Employment Status

The cross-tabulation of employment status showed that the higher the negative emotion level was, the fewer employed people were influenced, as the proportion of score “4” negative emotions was 51% lower than that of score “1” (Figure 12b). As the retired population rocketed in proportion, the percentage of score “4” negative emotions also rose up to 67%. At the same time, as the unemployed population grew slightly, the percentage of score “4” negative emotions climbed to 8%.
The results showed that large proportions of the employed middle-aged and elderly population were exposed to high temperatures in Hangzhou, but fewer people continued to be threatened by emotional health risks. The retired people were mostly over 65 years old, prone to chronic diseases, weaker in their ability to adjust to body temperature, and had difficulty controlling their emotions when exposed to high temperatures. The unemployed middle-aged and elderly population considered their expense in avoiding the summer heat and electricity costs, and there were few adaptive measures to resist heat waves. Moreover, unemployment could also mean fewer social contacts and weaker neighborhood relationships [66], leading to a much higher possibility of emotional health risk.

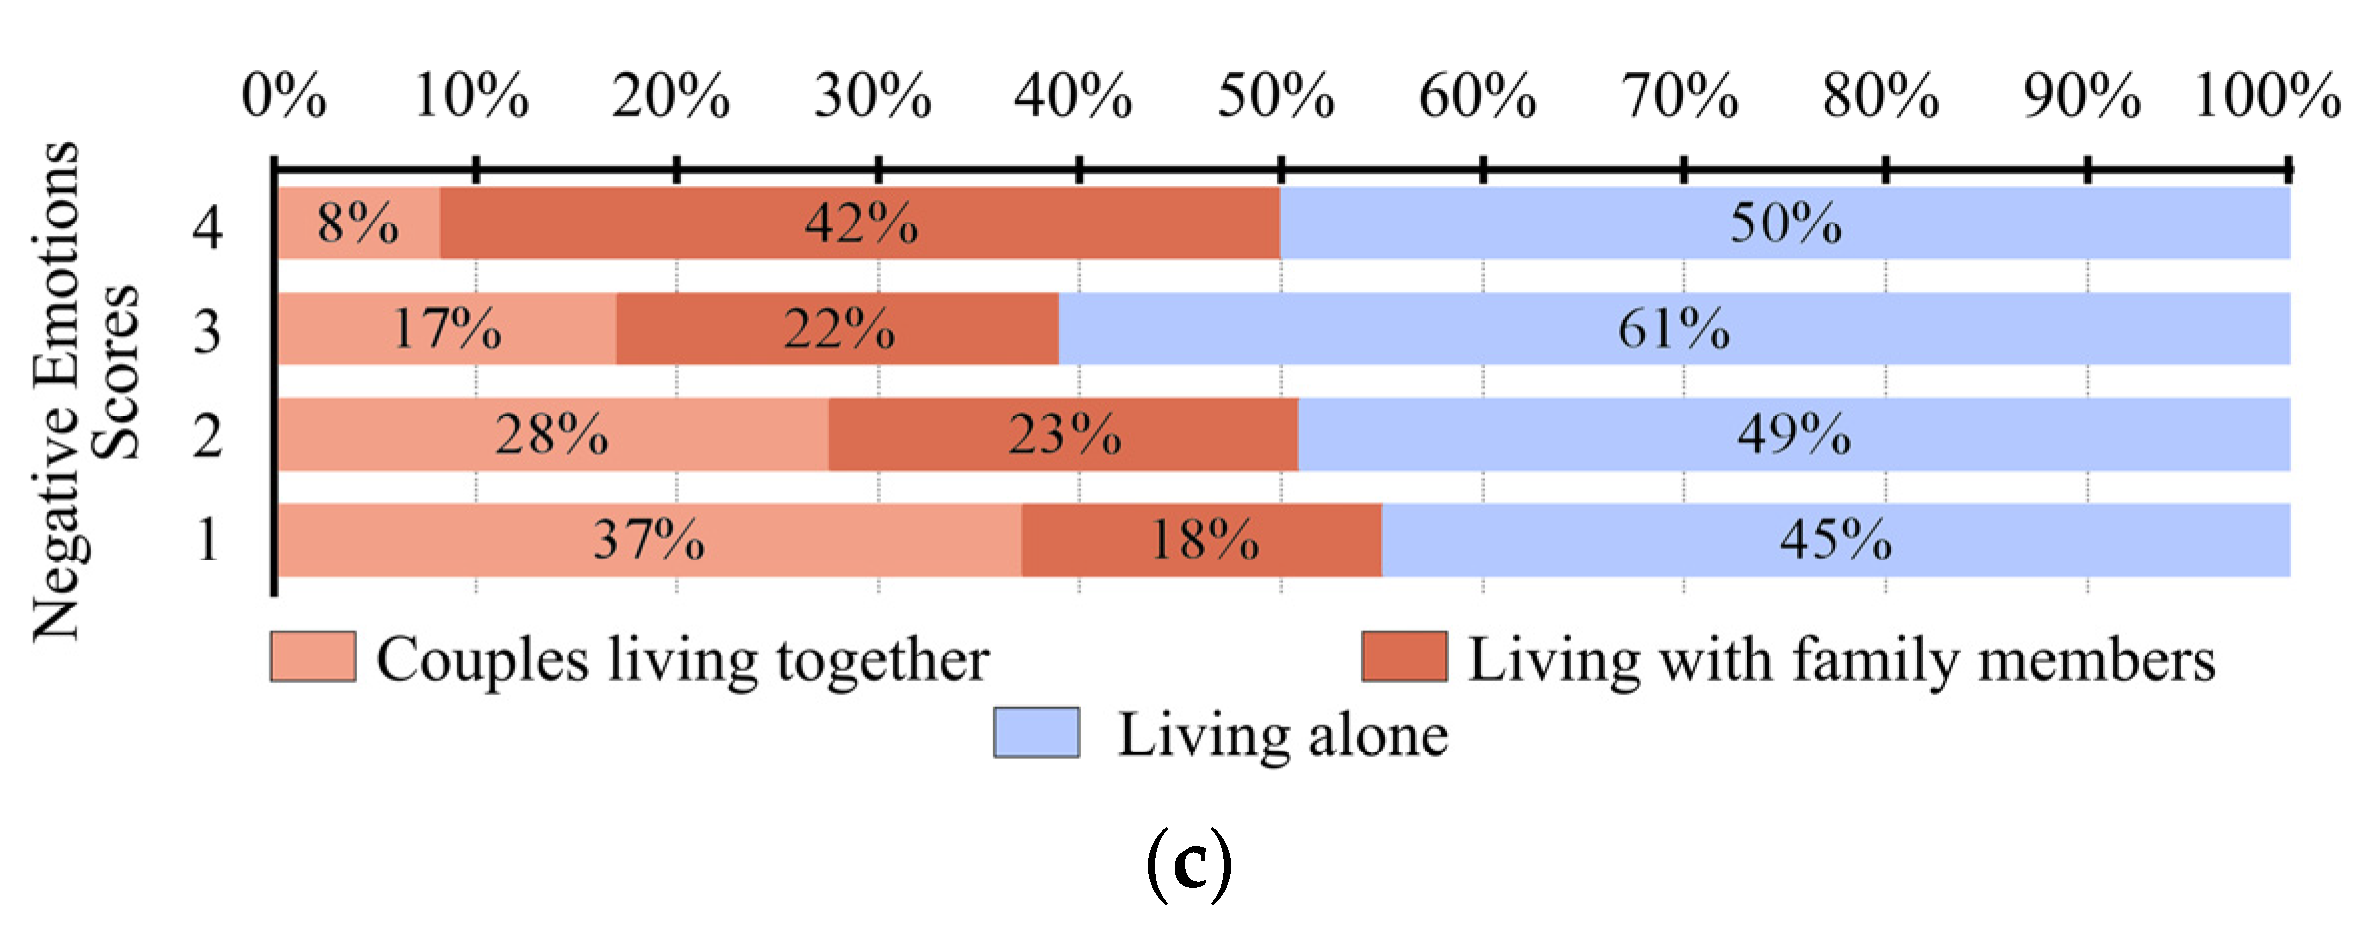
3.3.3. Living Arrangements

According to the cross-tabulation of living arrangements shown in Figure 12c, the emotional health risk of couples living together gradually declined from 37% (score “1”) to 8% (score “4”). In contrast, for living with family members, their negative emotions risk rose from 18% of score “1” to 42% of score “4”. For those living alone, their risk also rose from score “1” to score “4”, with the risk of the middle-aged and elderly population always accounting for about 50%.
According to the results, the middle-aged and elderly couples living together faced lower emotional health risks because their life partners could help protect their physical and mental health [67], and living together could help these couples better deal with or adjust to threats from high temperatures. The middle-aged and elderly population living with family members faced a relatively greater threat, since most of them had high life pressure, and complicated and tense family relations, and faced much higher mental pressure from exposure to high temperatures. On the other hand, the middle-aged and elderly population living alone had difficulty in receiving high-temperature warnings or information on healthcare and protection, resulting in a weaker ability to regulate negative emotions.

4. Discussion

A questionnaire survey and other psychology-related research methods were applied in the present study. To avoid errors from the time lag of the survey, the residents’ real-time emotional expressions and emotional intensity were obtained. Watson et al. comprised the Positive and Negative Affect Schedule (PANAS), in which negative emotions included feeling distressed, upset, hostile, irritable, scared, afraid, ashamed, guilty, nervous, and jittery [48]. According to existing studies on temperature and emotion, a rise in anxiety and stress increases the usage of negative language and aggressive behavior [20,30,31]. In addition, too many issues would hinder emotional performance when the questionnaires were distributed in a hot environment. Finally, four simplified factors (distressed, hostile, irritable, and nervous) closely related to the influence of the urban thermal environment were chosen to efficiently reduce the possibility of questionnaires being rejected in high temperatures. Meanwhile, scores of “1–5” were taken in this study’s emotion scale to make sure that the weighted summation of the negative emotion index was ordered variables. The results of this study showed that a theoretical relational model with a high degree of fitting could be established between the daily average temperature and negative emotion index.
Previous studies analyzed the correlations between temperature and emotion via an overview of the statistics [68,69]. The present study evaluated the spatial distribution of emotional health risk on the urban scale. It found that residents’ emotional health risk was increasing, which was more severe in the typical periods. Regarding the spatial distribution, each level of risk area changed from concentrated to dispersed groups. For the risk evolution, hot spots shifted from urban centers to suburbs, reducing the risk level of urban centers. The results mentioned above were in line with previous studies on how Hangzhou’s polycentric development influenced the urban thermal environment and proved that urban functional zones could affect the thermal environment and improve residents’ comfort [64,70]. Based on Hangzhou’s thermal environment, this study dug deeper into the risk of residents experiencing elevated negative emotions. The significant correlation between Hangzhou’s space policies and the patterns of emotional health risk was proven. The research methods employed in this study can be applied to other studies in related fields.
The emotional health risk due to high temperatures evaluated in the present study was influenced by the education background and living arrangements of the middle-aged and elderly population, consistent with previous studies. However, in terms of employment status, previous studies showed that occupational burnout would likely trigger negative emotions [71], but the results found in this study could help to reduce the emotional health risk. The difference is mainly that the employed people interviewed in this study had not worked in high temperatures, and they went outside during the daytime mostly for leisure or exercise.
Negative emotional hazards need to be mitigated in multiple ways. According to the characteristics of emotional health risk in Hangzhou, the key to lowering emotional health risk is to increase the proportion of green space and water in high-risk areas. Large wetlands, water, and other resources around Hangzhou could be used to build urban ventilation corridors. At the same time, it is urgent to control the risks of emerging development zones, and policies should encourage ecological and intelligent industries. Community management should focus on vulnerable groups with low education levels who are living alone or have discord in their family. According to the individual needs of the middle-aged and elderly population, the community should increase the emotional risk education propaganda and construct nearby public cooling places.
There were also some limitations in the present study. First, climate change will also affect the mental health and emotions of children and adolescents. In the future, it will be necessary to conduct differential analyses on the emotional health risks of different groups. Additionally, the emotional state of urban residents can also be affected by outdoor thermal comfort. How to build an outdoor healing garden to improve the local climate zone and enhance the emotional health of residents remains to be explored. Finally, the collection of data from different districts of Hangzhou was limited. As a result, the questionnaire survey was only used to obtain specific groups of people to rate their emotions subjectively and report their socioeconomic state without carrying out a space-based difference analysis on the emotional health risk of residents in the different district of Hangzhou. Further research could be conducted on the coupling of natural and socioeconomic data on the small scale of the community.

5. Conclusions

Taking Hangzhou City as the study area, the patterns and socioeconomic driving factors of the effect of high temperatures on negative emotions during the daytime and typical periods from 1984 to 2020 were analyzed. The following conclusions could be drawn:
(1) From 1984 to 2020, the thermal environment in Hangzhou showed an evolution pattern of first gathering and then scattering. Higher-middle-, high-, and extreme-high-temperature zones increased in both area and influence level, aggregating from a cross-shape to a large patch shape, then dispersed into cracked patches.
(2) Over the span of these 35 years, residents’ emotional health risk from high temperatures kept rising, peaking at the VI-level during the daytime. In the same districts, compared with the emotional health risk during the daytime, the risk during typical periods increased by 1–2 levels. The risk level for urban center residents first rose and then descended during the daytime and typical periods.
(3) The evolution patterns of the effect of high temperatures on negative emotions responded to spatial policy changes in Hangzhou. They were concentrated in urban centers first, then moving along main roads towards the emerging construction areas in the outskirts. The current polycentric spatial structure of Hangzhou promoted the fragmentation and spread of high-risk patches.
(4) During the period spanning 1984 to 1998, hot spots of negative emotions were mainly located in urban centers, the economic and technological development zone, and industrial parks. From 1998 to 2020, cold spots were concentrated in urban centers, and hot spots were mostly located in development zones, sci-tech cities, higher education parks, and leisure resorts.
(5) Middle-aged and elderly people in Hangzhou, if they were well educated, employed, or living with life partners, had lower emotional health risks under high temperatures. Meanwhile, those who were less educated, retired, always unemployed, living with family members, or living alone had increased risk.
This study explored the effect of high temperatures on negative emotions and used it as a feasible standard to assess residents’ emotional health risks. It could also lay a theoretical foundation for large cities to recognize high-emotional-risk areas and give emotional health precautions. In the next step, specific protective measures could be implemented for particular groups based on their socioeconomic status. Further studies need to be conducted to quantify health risks within cities more accurately.

Author Contributions

Conceptualization, H.H., S.Z. and S.X.; methodology, H.H. and S.Z.; validation, S.X. and C.S.; formal analysis, H.H. and S.Z.; investigation, H.H. and S.Z.; resources, C.S.; data curation, H.H., S.Z. and C.S.; writing—original draft preparation, H.H. and S.Z.; writing—review and editing, H.H. and S.Z.; visualization, H.H. and S.Z. All authors have read and agreed to the published version of the manuscript.

Funding

This research was funded by the National Natural Science Foundation of China, Grant number 31971717; and the Top-notch Academic Programs Project of Jiangsu, Grant number PPZY2015A063.

Institutional Review Board Statement

Not applicable.

Informed Consent Statement

Not applicable.

Data Availability Statement

Not applicable.

Acknowledgments

We acknowledge Wen Bo, Liu Jun-Jie, and Chen Tu-Nong for their invaluable advice.

Conflicts of Interest

The authors declare no conflict of interest.

References

  1. Sun, Y.; Zhang, X.B.; Ren, G.Y.; Zwiers, F.W.; Hu, T. Contribution of urbanization to warming in China. Nat. Clim. Chang. 2016, 6, 706. [Google Scholar] [CrossRef]
  2. Zhang, W.; Villarini, G.; Vecchi, G.A.; Smith, J.A. Urbanization exacerbated the rainfall and flooding caused by hurricane Harvey in Houston. Nature 2018, 563, 384. [Google Scholar] [CrossRef] [PubMed]
  3. Han, L.J.; Zhou, W.Q.; Li, W.F.; Li, L. Impact of urbanization level on urban air quality: A case of fine particles (PM2.5) in Chinese cities. Environ. Pollut. 2014, 194, 163–170. [Google Scholar] [CrossRef] [PubMed]
  4. Gasparrini, A.; Armstrong, B. The Impact of Heat Waves on Mortality. Epidemiology 2011, 22, 68–73. [Google Scholar] [CrossRef] [PubMed] [Green Version]
  5. Li, M.M.; Gu, S.H.; Bi, P.; Yang, J.; Liu, Q.Y. Heat Waves and Morbidity: Current Knowledge and Further Direction-A Comprehensive Literature Review. Int. J. Environ. Res. Public Health 2015, 12, 5256–5283. [Google Scholar] [CrossRef] [Green Version]
  6. Shan, Z.R.; An, Y.H.; Xu, L.E.; Yuan, M. High-Temperature Disaster Risk Assessment for Urban Communities: A Case Study in Wuhan, China. Int. J. Environ. Res. Public Health 2022, 19, 183. [Google Scholar] [CrossRef]
  7. IPCC. AR6 Climate Change 2021: The Physical Science Basis Full Report. Available online: https://www.ipcc.ch/report/ar6/wg1/downloads/report/IPCC_AR6_WGI_Full_Report.pdf (accessed on 10 October 2021).
  8. Mora, C.; Dousset, B.; Caldwell, I.R.; Powell, F.E.; Geronimo, R.C.; Bielecki, C.R.; Counsell, C.W.; Dietrich, B.S.; Johnston, E.T.; Louis, L.V.; et al. Global risk of deadly heat. Nat. Clim. Chang. 2017, 7, 501. [Google Scholar] [CrossRef]
  9. Founda, D.; Santamouris, M. Synergies between Urban Heat Island and Heat Waves in Athens (Greece), during an extremely hot summer (2012). Sci. Rep. 2017, 7, 10973. [Google Scholar] [CrossRef] [Green Version]
  10. Kenny, G.P.; Wilson, T.E.; Flouris, A.D.; Fujii, N. Heat exhaustion. In Handbook of Clinical Neurology—Thermoregulation: From Basic Neuroscience to Clinical Neurology; Romanovsky, A.A., Ed.; Elsevier: Amsterdam, The Netherlands, 2018; Volume 157, pp. 505–529. [Google Scholar]
  11. Fujibe, F.; Matsumoto, J.; Suzuki, H. Regional Features of the Relationship between Daily Heat-Stroke Mortality and Temperature in Different Climate Zones in Japan. Sola 2018, 14, 144–147. [Google Scholar] [CrossRef] [Green Version]
  12. Michelozzi, P.; Accetta, G.; De Sario, M.; D’Ippoliti, D.; Marino, C.; Baccini, M.; Biggeri, A.; Anderson, H.R.; Katsouyanni, K.; Ballester, F.; et al. High Temperature and Hospitalizations for Cardiovascular and Respiratory Causes in 12 European Cities. Am. J. Respir. Crit. Care Med. 2009, 179, 383–389. [Google Scholar] [CrossRef] [Green Version]
  13. Lin, S.; Luo, M.; Walker, R.J.; Liu, X.; Hwang, S.A.; Chinery, R. Extreme High Temperatures and Hospital Admissions for Respiratory and Cardiovascular Diseases. Epidemiology 2009, 20, 738–746. [Google Scholar] [CrossRef] [PubMed]
  14. Yin, Q.; Wang, J.F. The association between consecutive days’ heat wave and cardiovascular disease mortality in Beijing, China. BMC Public Health 2017, 17, 9. [Google Scholar] [CrossRef] [PubMed] [Green Version]
  15. Giorgini, P.; Di Giosia, P.; Petrarca, M.; Lattanzio, F.; Stamerra, C.A.; Ferri, C. Climate Changes and Human Health: A Review of the Effect of Environmental Stressors on Cardiovascular Diseases Across Epidemiology and Biological Mechanisms. Curr. Pharm. Design 2017, 23, 3247–3261. [Google Scholar] [CrossRef]
  16. Kysely, J. Probability estimates of extreme temperature events: Stochastic modelling approach vs. extreme value distributions. Studia Geophys. Geod. 2002, 46, 93–112. [Google Scholar] [CrossRef]
  17. Robine, J.M.; Cheung, S.L.K.; Le Roy, S.; Van Oyen, H.; Griffiths, C.; Michel, J.P.; Herrmann, F.R. Death toll exceeded 70,000 in Europe during the summer of 2003. Comptes Rendus Biol. 2008, 331, 171–178. [Google Scholar] [CrossRef] [PubMed]
  18. Zhang, M.X.; Yang, X.H.; Cleverly, J.; Huete, A.; Zhang, H.; Yu, Q. Heat wave tracker: A multi-method, multi-source heat wave measurement toolkit based on Google Earth Engine. Environ. Modell. Softw. 2022, 147, 13. [Google Scholar] [CrossRef]
  19. Cai, W.J.; Zhang, C.; Suen, H.P.; Ai, S.Q.; Bai, Y.Q.; Bao, J.Z.; Chen, B.; Cheng, L.L.; Cui, X.Q.; Dai, H.C.; et al. The 2020 China report of the Lancet Countdown on health and climate change. Lancet Public Health 2021, 6, E64–E81. [Google Scholar] [CrossRef]
  20. Martin, G.; Reilly, K.; Everitt, H.; Gilliland, J.A. Review: The impact of climate change awareness on children’s mental well-being and negative emotions—A scoping review. Child Adolesc. Ment. Health 2022, 27, 59–72. [Google Scholar] [CrossRef]
  21. Noelke, C.; McGovern, M.; Corsi, D.J.; Jimenez, M.P.; Stern, A.; Wing, I.S.; Berkman, L. Increasing ambient temperature reduces emotional well-being. Environ. Res. 2016, 151, 124–129. [Google Scholar] [CrossRef] [Green Version]
  22. Tan, J.G.; Lu, C.; Chen, Z.H. High Temperature Heat Wave and Human Health; China Meteorological Press: Beijing, China, 2009. [Google Scholar]
  23. Huang, Q.F.; Lu, Y.Q. The Effect of Urban Heat Island on Climate Warming in the Yangtze River Delta Urban Agglomeration in China. Int. J. Environ. Res. Public Health 2015, 12, 8773–8789. [Google Scholar] [CrossRef] [Green Version]
  24. Thompson, R.; Hornigold, R.; Page, L.; Waite, T. Associations between high ambient temperatures and heat waves with mental health outcomes: A systematic review. Public Health 2018, 161, 171–191. [Google Scholar] [CrossRef] [PubMed]
  25. Wang, X.Y.; Barnett, A.G.; Yu, W.W.; FitzGerald, G.; Tippett, V.; Aitken, P.; Neville, G.; McRae, D.; Verrall, K.; Tong, S.L. The impact of heatwaves on mortality and emergency hospital admissions from non-external causes in Brisbane, Australia. Occup. Environ. Med. 2012, 69, 163–169. [Google Scholar] [CrossRef] [PubMed] [Green Version]
  26. Lee, S.; Lee, H.; Myung, W.; Kim, E.J.; Kim, H. Mental disease-related emergency admissions attributable to hot temperatures. Sci. Total Environ. 2018, 616, 688–694. [Google Scholar] [CrossRef] [PubMed]
  27. Sugg, M.M.; Dixon, P.G.; Runkle, J.D. Crisis support-seeking behavior and temperature in the United States: Is there an association in young adults and adolescents? Sci. Total Environ. 2019, 669, 400–411. [Google Scholar] [CrossRef]
  28. Gopinathan, P.M.; Pichan, G.; Sharma, V.M. Role of dehydration in heat stress-induced variations in mental performance. Arch. Environ. Health 1988, 43, 15–17. [Google Scholar] [CrossRef]
  29. Liu, X.N.; Liu, H.; Fan, H.; Liu, Y.Z.; Ding, G.Y. Influence of Heat Waves on Daily Hospital Visits for Mental Illness in Jinan, ChinaA Case-Crossover Study. Int. J. Environ. Res. Public Health 2019, 16, 87. [Google Scholar] [CrossRef] [Green Version]
  30. Burke, M.; Gonzalez, F.; Bayliss, P.; Heft-Neal, S.; Baysan, C.; Basu, S.; Hsiang, S. Higher temperatures increase suicide rates in the United States and Mexico. Nat. Clim. Chang. 2018, 8, 723–729. [Google Scholar] [CrossRef]
  31. Younan, D.; Li, L.F.; Tuvblad, C.; Wu, J.; Lurmann, F.; Franklin, M.; Berhane, K.; McConnell, R.; Wu, A.H.; Baker, L.A.; et al. Long-Term Ambient Temperature and Externalizing Behaviors in Adolescents. Am. J. Epidemiol. 2018, 187, 1931–1941. [Google Scholar] [CrossRef]
  32. Ho, H.C.; Knudby, A.; Chi, G.Q.; Aminipouri, M.; Lai, D.Y.F. Spatiotemporal analysis of regional socio-economic vulnerability change associated with heat risks in Canada. Appl. Geogr. 2018, 95, 61–70. [Google Scholar] [CrossRef]
  33. Fu, H.C.; Deng, F.; Yang, H.; Xu, N.; Zhang, J.H. Assessing heat wave risk of urban agglomeration in the middle-lower Yangtze River based on remote sensing. Resour. Environ. Yangtze Basin 2020, 29, 1174–1182. [Google Scholar] [CrossRef]
  34. Xue, Q.; Xie, M.M.; Guo, Q.; Wang, Y.N.; Wu, R.R.; Liu, Q. Research progress on urban heat wave vulnerability assessment: A geographical perspective. Prog. Geogr. 2020, 39, 685–694. [Google Scholar] [CrossRef]
  35. Park, J.; Chae, Y.; Choi, S.H. Analysis of Mortality Change Rate from Temperature in Summer by Age, Occupation, Household Type, and Chronic Diseases in 229 Korean Municipalities from 2007–2016. Int. J. Environ. Res. Public Health 2019, 16, 1561. [Google Scholar] [CrossRef] [PubMed] [Green Version]
  36. Li, H.; Ge, M.; Pei, Z.H.; He, J.W.; Wang, C.X. Nonlinear associations between environmental factors and lipid levels in middle-aged and elderly population in China: A national cross-sectional study. Sci. Total Environ. 2022, 838, 155962. [Google Scholar] [CrossRef] [PubMed]
  37. Pyrgou, A.; Santamouris, M. Increasing Probability of Heat-Related Mortality in a Mediterranean City Due to Urban Warming. Int. J. Environ. Res. Public Health 2018, 15, 1571. [Google Scholar] [CrossRef] [Green Version]
  38. Cutter, S.L.; Finch, C. Temporal and spatial changes in social vulnerability to natural hazards. Proc. Natl. Acad. Sci. USA 2008, 105, 2301–2306. [Google Scholar] [CrossRef] [Green Version]
  39. Fiscella, K.; Williams, D.R. Health disparities based on socioeconomic inequities: Implications for urban health care. Acad. Med. 2004, 79, 1139–1147. [Google Scholar] [CrossRef]
  40. Xie, P.; Wang, Y.L.; Liu, Y.L.; Peng, J. Incorporating social vulnerability to assess population health risk due to heat stress in China. Acta Geogr. Sinica. 2015, 70, 1041–1051. [Google Scholar] [CrossRef]
  41. Murage, P.; Kovats, S.; Sarran, C.; Taylor, J.; McInnes, R.; Hajat, S. What individual and neighbourhood-level factors increase the risk of heat-related mortality? A case-crossover study of over 185,000 deaths in London using high-resolution climate datasets. Environ. Int. 2020, 134, 7. [Google Scholar] [CrossRef]
  42. Zhou, Z.; Mao, F.Z.; Ma, J.P.; Hao, S.C.; Qian, Z.M.; Elder, K.; Turner, J.S.; Fang, Y. A Longitudinal Analysis of the Association Between Living Arrangements and Health Among Older Adults in China. Res. Aging 2018, 40, 72–97. [Google Scholar] [CrossRef]
  43. Hangzhou Bureau of Statistics. Statistical Yearbook. Available online: http://tjj.hangzhou.gov.cn/col/col1229453592/index.html (accessed on 10 October 2021).
  44. Ye, H.P.; Li, Z.H.; Zhang, N.H.; Leng, X.J.; Meng, D.; Zheng, J.; Li, Y. Variations in the Effects of Landscape Patterns on the Urban Thermal Environment during Rapid Urbanization (1990–2020) in Megacities. Remote Sens. 2021, 13, 3415. [Google Scholar] [CrossRef]
  45. Campbell, S.; Remenyi, T.A.; White, C.J.; Johnston, F.H. Heatwave and health impact research: A global review. Health Place 2018, 53, 210–218. [Google Scholar] [CrossRef] [PubMed]
  46. USGS. EarthExplorer. Available online: https://earthexplorer.usgs.gov/ (accessed on 10 October 2021).
  47. CMDC. Hourly Data from Surface Meteorological Stations in China. Available online: http://data.cma.cn/ (accessed on 1 March 2021).
  48. Watson, D.; Clark, L.A.; Tellegen, A. Development and validation of brief measures of positive and negative affect: The PANAS scales. J. Personal. Soc. Psychol. 1988, 54, 1063–1070. [Google Scholar] [CrossRef]
  49. Huang, L.; Yang, T.Z.; Ji, Z.M. Applicability of the Positive and Negative Affect Scale in Chinese. Chin. Ment. Health J. 2003, 17, 54–56. [Google Scholar] [CrossRef]
  50. Bao, L.; Zhan, G.L.; Li, C.H.; Wang, Y.Q. Reliability and validity of the Chinese version of the positive negative emotion scale in the elderly. China J. Health Psychol. 2020, 28, 617–621. [Google Scholar] [CrossRef]
  51. Wen, S.X.; Wei, Y.C.; Wang, M.H. Improvement of outlier in TM image after FLAASH atmospheric correction. Sci. Surv. Mapp. 2017, 42, 165–171. [Google Scholar] [CrossRef]
  52. Avdan, U.; Jovanovska, G. Algorithm for Automated Mapping of Land Surface Temperature Using LANDSAT 8 Satellite Data. J. Sens. 2016, 2016, 1480307. [Google Scholar] [CrossRef] [Green Version]
  53. Martin, P.; Baudouin, Y.; Gachon, P. An alternative method to characterize the surface urban heat island. Int. J. Biometeorol. 2015, 59, 849–861. [Google Scholar] [CrossRef]
  54. Salata, F.; Golasi, L.; Petitti, D.; Vollaro, E.D.L.; Coppi, M.; Vollaro, A.D.L. Relating microclimate, human thermal comfort and health during heat waves: An analysis of heat island mitigation strategies through a case study in an urban outdoor environment. Sust. Cities Soc. 2017, 30, 79–96. [Google Scholar] [CrossRef]
  55. Marzban, F.; Sodoudi, S.; Preusker, R. The influence of land-cover type on the relationship between NDVI-LST and LST-T-air. Int. J. Remote Sens. 2018, 39, 1377–1398. [Google Scholar] [CrossRef]
  56. Huang, H.C.; Yang, H.L.; Deng, X.; Hao, C.; Liu, Z.F.; Liu, W.; Zeng, P. Analyzing the Influencing Factors of Urban Thermal Field Intensity Using Big-Data-Based GIS. Sust. Cities Soc. 2020, 55, 102024. [Google Scholar] [CrossRef]
  57. Xu, X.Z.; Zheng, Y.F.; Yin, J.F.; Wu, R.J. Characteristics of high temperature and heat wave in Nanjing City and their impacts on human health. Chin. J. Ecol. 2011, 30, 2815–2820. [Google Scholar] [CrossRef]
  58. Liu, W.D.; You, H.L.; Sun, D. Multi-Time Scale Analysis of Megacities Heat Island Effect in Beijing-Tianjin-Hebei Region from 1971 to 2010. Meteorol. Mon. 2016, 42, 598–606. [Google Scholar] [CrossRef]
  59. Beijing Meteorological Service. Meteorological Encyclopedia. Available online: http://bj.cma.gov.cn/qxkp/qxbk/201606/t20160623_608960.html (accessed on 28 June 2022).
  60. Ord, J.K.; Getis, A. Local Spatial Autocorrelation Statistics: Distributional Issues and an Application. Geogr. Anal. 1995, 27, 286–306. [Google Scholar] [CrossRef]
  61. Yang, J.; Yang, Y.X.; Sun, D.Q.; Jin, C.; Xiao, X.M. Influence of urban morphological characteristics on thermal environment. Sust. Cities Soc. 2021, 72, 12. [Google Scholar] [CrossRef]
  62. Cai, Y.B.; Li, H.M.; Ye, X.Y.; Zhang, H. Analyzing Three-Decadal Patterns of Land Use/Land Cover Change and Regional Ecosystem Services at the Landscape Level: Case Study of Two Coastal Metropolitan Regions, Eastern China. Sustainability 2016, 8, 773. [Google Scholar] [CrossRef] [Green Version]
  63. Huang, L.Y.; Shahtahmassebi, A.; Gan, M.Y.; Deng, J.S.; Wang, J.H.; Wang, K. Characterizing spatial patterns and driving forces of expansion and regeneration of industrial regions in the Hangzhou megacity, China. J. Clean Prod. 2020, 253, 15. [Google Scholar] [CrossRef]
  64. Yue, W.Z.; Qiu, S.S.; Xu, H.; Xu, L.H.; Zhang, L.L. Polycentric urban development and urban thermal environment: A case of Hangzhou, China. Landsc. Urban Plan. 2019, 189, 58–70. [Google Scholar] [CrossRef]
  65. Mari-Dell’Olmo, M.; Tobias, A.; Gomez-Gutierrez, A.; Rodriguez-Sanz, M.; de Olalla, P.G.; Camprubi, E.; Gasparrini, A.; Borrell, C. Social inequalities in the association between temperature and mortality in a South European context. Int. J. Public Health 2019, 64, 27–37. [Google Scholar] [CrossRef]
  66. Perry, R.W.; Lindell, M.K. Aged citizens in the warning phase of disasters: Re-examining the evidence. Int. J. Aging Hum. Dev. 1997, 44, 257–267. [Google Scholar] [CrossRef]
  67. Fu, R.; Noguchi, H. Does the positive relationship between health and marriage reflect protection or selection? Evidence from middle-aged and elderly Japanese. Rev. Econ. Househ. 2018, 16, 1003–1016. [Google Scholar] [CrossRef]
  68. Arbuthnott, K.G.; Hajat, S. The health effects of hotter summers and heat waves in the population of the United Kingdom: A review of the evidence. Environ. Health 2017, 16, 119. [Google Scholar] [CrossRef] [PubMed] [Green Version]
  69. Escobar, F.B.; Velasco, C.; Motoki, K.; Byrne, D.V.; Wang, Q.J. The temperature of emotions. PLoS ONE 2021, 16, e0252408. [Google Scholar] [CrossRef]
  70. Chen, Y.; Yang, J.; Yang, R.X.; Xiao, X.M.; Xia, J.H. Contribution of urban functional zones to the spatial distribution of urban thermal environment. Build. Environ. 2022, 216, 10. [Google Scholar] [CrossRef]
  71. Liu, M.X.; Wang, N.; Wang, P.C.; Wu, H.M.; Ding, X.E.; Zhao, F.Q. Negative Emotions and Job Burnout in News Media Workers: A Moderated Mediation Model of Rumination and Empathy. J. Affect. Disord. 2021, 279, 75–82. [Google Scholar] [CrossRef]
Figure 1. Location of the study area in Hangzhou, China.
Buildings 12 01040 g001
Figure 2. Research framework of this study.
Buildings 12 01040 g002
Figure 3. Model of temperature value and negative emotion index.
Buildings 12 01040 g003
Figure 4. Flowchart for building the model of temperature value and negative emotion index.
Buildings 12 01040 g004
Figure 5. Fitting curve equation of the daily average temperature and negative emotion index.
Buildings 12 01040 g005
Figure 6. Distribution of Hangzhou’s thermal environment during the three periods in the daytime: (a) 1984; (b) 1998; (c) 2020.
Buildings 12 01040 g006
Figure 7. Distribution of Hangzhou’s thermal environment during the three periods in the typical periods: (a) 1984; (b) 1998; (c) 2020.
Buildings 12 01040 g007
Figure 8. Land-use map of Hangzhou in 2020.
Buildings 12 01040 g008
Figure 9. Distribution and influence of Hangzhou’s high temperature on negative emotions during the three periods in the daytime: (a) 1984; (b) 1998; (c) 2020.
Buildings 12 01040 g009
Figure 10. Distribution of Hangzhou high temperature’s influence on negative emotions during the three periods in typical periods: (a) 1984; (b) 1998; (c) 2020.
Buildings 12 01040 g010
Figure 11. Distribution of cold and hot spots of emotional health risk during the two periods: (a) 1984–1998; (b) 1998–2020.
Buildings 12 01040 g011
Figure 12. Changing trend of negative emotion scores based on influencing factors: (a) education background; (b) employment status; (c) living arrangements.
Buildings 12 01040 g012aBuildings 12 01040 g012b
Table 1. Background information of the questionnaire.
Personal CharacteristicsOptions
Environment stateDate, Time, Place, Solar Radiation
GenderMale, Female
Age40–49, 50–59, 60–69, 70–79, >80
Education backgroundPrimary school and below, Junior and senior high school, College and above
Employment statusEmployed, Retired, Always unemployed
Living arrangementsCouples living together, Living alone, Living with family members
Outdoor activity time0–10 min, 10–20 min, 20–30 min, 30–40 min, 40–50 min, 50–60 min,
1–1.5 h, 1.5–2 h, 2–2.5 h, 2.5–3 h, >3 h
Activity typeChatting, Exercising, Walking, Resting, Accompanying children, Working, Other
Table 2. Assessment standard of high temperatures’ emotional health risk.
Health Risk LevelTemperature RangeNegative Emotion Index RangeEmotional Expression
Level I<32 °C<0.8No risk, stable
Level II32–33 °C0.8–1Low risk, sensitive
Level III33–34 °C1–1.2Low risk, emotional
Level IV34–35 °C1.2–1.4Medium risk, restless
Level V35–36 °C1.4–1.6High risk, anxious and hostile
Level VI>36 °C>1.6High risk, irritable
Publisher’s Note: MDPI stays neutral with regard to jurisdictional claims in published maps and institutional affiliations.

