Article

Aerodynamic Forces on a Bluff Cylinder in Sinusoidal Streamwise Winds with Different Angles of Attack

1
State Key Laboratory of Mountain Bridge and Tunnel Engineering, Chongqing Jiaotong University, Chongqing 400074, China
2
School of Civil Engineering, Chongqing Jiaotong University, Chongqing 400074, China
3
School of Civil Engineering, Chongqing University, Chongqing 400045, China
*
Authors to whom correspondence should be addressed.
Buildings 2022, 12(7), 1033; https://doi.org/10.3390/buildings12071033
Submission received: 17 May 2022 / Revised: 10 July 2022 / Accepted: 15 July 2022 / Published: 17 July 2022

Abstract

:
In the present study, multiple-fan active control wind tunnel tests are conducted to investigate the aerodynamic forces on a 5:1 rectangular cylinder in sinusoidal streamwise winds with different angles of attack (AoA). The effects of the frequency, amplitude, and AoA of the sinusoidal flow on the statistical parameters, spectral characteristics, and spanwise distributions of drag, lift, and moment coefficients are analyzed. Results show that each force has two components: the one induced by the approaching velocity oscillation and the one induced by wake vortex-shedding—this is quite different from that in the smooth flows, where the fluctuating forces are totally due to wake vortex-shedding. For each force, changes of the two components and their relationship with the frequency, amplitude, and AoA are presented. The drag fluctuations are generally dominated by the approaching velocity oscillations, whereas the lift and moment are more sensitive to wake vortex-shedding. Therefore, the drag force has better spanwise correlations than the lift and moment forces. Meanwhile, at a non-zero AoA, the inflow amplitude has different effects on the vortex-shedding-induced component as that at a zero AoA. The differences of spanwise distributions between the sinusoidal flow cases and the smooth flow cases are analyzed.

1. Introduction

Oncoming flow with sinusoidal fluctuating velocity can be broadly observed in natural environments, such as offshore exploration, power generation, and the rotating wind turbines. Expect for these engineering applications, the sinusoidal fluctuating flow also has academic merits: the broadband turbulence can be equivalently discretized into a series of single-frequency sinusoidal fluctuating flows based on the linear superposition assumption. This assumption was firstly introduced in the aerofoil–aerodynamic to derive several fundamental theories, such as the Theodorsen function [1], the Sears function [2], and the spectral tensor theory [3]. Later, it was extended to bluff-body aerodynamics, for example, in the theoretical models for Scanlan’s flutter derivatives and the aerodynamic admittance functions [4]. In these contexts, the sinusoidal fluctuating flow has shown its advantage in the following aspects:
(i)
Separating the effects of fluctuating winds of different length scales. Since turbulence is broadband in the frequency domain, it is difficult to obtain an in-depth analysis of the frequency-dependent aerodynamics of structures. In contrast, the single-frequency sinusoidal flow is more suitable for investigating different turbulent parameters’ effects separately [5], such as the intensity and the length scale.
(ii)
Determining the aerodynamic admittance functions (AAF). Calculating frequency-by-frequency the power spectral density (PSD) of the aerodynamic forces and the approaching flow, the AAF can be determined through wind tunnel tests in a series of sinusoidal flows. This method was called the “separated frequency-by-frequency method (SFFM)” and was extensively adopted in Chen et al. [6], Ma et al. [7], Yang et al. [8], Wu et al. [9], etc., to identify the AAF of a variety of structures.
Due to engineering and academic values, the effects of sinusoidal flows have been widely studied. The experimental studies on bluff structures under sinusoidal flows were recently summarized in Feshalami et al. [10]. Most of the studies mainly focused on the vortex shedding frequency “lock-on” [11] and the near-wake fluid dynamics [12] for circular cylinders. In addition, there were also some studies, for example, Nomura et al. [13], Chen et al. [14], and Zhao et al. [15] discussed the forces on square cylinders encountering sinusoidal oscillating flows. The aerodynamic forces of streamlined bridge decks in vertical sinusoidal flows were analyzed in Diana et al. [5] and Cigada et al. [16].
Unlike the abovementioned airfoil, circular cylinder, square cylinder, and streamlined bridge decks, a lot of bluff structures (for example, building structures) are relevant to wind engineering applications [17,18] that encounter flow separation and reattachment [19]. Among them, the most representative is the rectangular cylinder with a 5:1 chord-to-depth ratio, which is the topic of the BARC project (a Benchmark on the Aerodynamics of a Rectangular 5:1 Cylinder) announced by the International Association for Wind Engineering (IAWE). Details about the BARC can be found in [20]. After separating at the leading edges, the shear layer will reattach to the side surfaces of a BARC rectangular cylinder. This feature can significantly simplify the study of separated-reattaching flows on bluff bodies. A summary of the results on BARC can be found in [21,22]. Among them, the effects of angle of attack (AoA) on the aerodynamic pressures and forces were investigated in [23]. Mannini et al. [24] conducted similar works in turbulent flows to emphasize the effects of turbulence parameters. Furthermore, the flow field characteristics were also widely analyzed under different conditions, for instance, in [25,26] for smooth flow at zero AoA, in [27,28] for smooth flow at non-zero AoAs. Several studies were conducted in sinusoidal flows. Wu et al. [29] numerically investigated a BARC cylinder’s separated flow and near-wake characteristics in sinusoidal flows. Li et al. [30] studied the aerodynamic pressures of a BARC cylinder in sinusoidal flows at a zero AoA, which were generated by vibrating airfoils. Using an active-controlled multiple-fan system, Wu et al. [9] measured the aerodynamic forces of a BARC cylinder in sinusoidal flows at a zero AoA; their results showed that both the inflow velocity oscillations and wake vortex-shedding contribute to the fluctuations of the drag, lift, and pitching moment forces. The relationships between these two components and the effects of sinusoidal flow parameters were also analyzed.
In summary, most of the BARC studies were conducted in smooth flows and turbulent flows, and the limited studies in sinusoidal flows were only considered at zero AoA. However, the flow direction is more practical to be oblique to the structures, which can be frequently observed in natural winds [31,32] and leading to non-zero AoAs. It is well known that the aerodynamic behavior of a rectangular cylinder at a non-zero AoA is obviously different from that at a zero AoA [28]. When a cylinder is encountering a sinusoidal flow at a non-null AoA, breaking the symmetry of separating-reattaching flow fields between the two lateral sides, the following questions may arise: (i) if the aerodynamic forces have similar behaviors as those at a zero AoA, especially if the aerodynamic forces still have both contributions from inflow velocity oscillations and vortex-shedding as that in the zero AoA case; (ii) how the AoA influences the two contributions and other related aerodynamic characteristics. Nevertheless, little work has been done regarding a BARC cylinder in sinusoidal flows at non-null AoAs.
The objective of this study is to provide a complete description of the aerodynamic behavior of the BARC cylinder in sinusoidal flows at varying AoAs. We conduct a set of experimental tests in a multiple-fan active control wind tunnel and consider AoA in a sufficient range extensively employed in bluff-body aerodynamics. The effects of frequency (fu), amplitude (Δu), and AoA of the sinusoidal flow are systematically described, and emphasis is put on the two components of the fluctuating drag, lift, and moment forces. Meanwhile, the differences between zero AoA and non-zero cases are analyzed. Comprehensive comparisons of the statistical parameters with those in the smooth flows are also provided.
The organization of the paper is as follows. First, the experimental set-ups and the generated sinusoidal flows are described in Section 2. Then, in Section 3, spectral analyses are conducted to explore the two mechanisms contributing to the fluctuating forces. Subsequently, in Section 4, the time-averaged and RMS values of aerodynamic forces are given, and contributions of the two mechanisms to the total forces and their relationships are analyzed. Next, in Section 5, the spanwise distributions related to the two mechanisms are discussed. Finally, the study is concluded in Section 6.

2. Experimental Tests

2.1. Experimental Set-Ups

The experimental tests were carried out in the multiple-fan active control wind tunnel (TJ-6) at Tongji University, Shanghai, China. The test cross section of the wind tunnel is 1.5 m (width) × 1.8 m (height) × 10 m (length). The flow generator consists of 120 individual fans arranged in a 10 (width) by 12 (height) matrix at the front of the tunnel, as shown Figure 1. Through the computer-controlled AC servo-motors, each fan can be programmed independently to rotate at different time-varying speeds, depending only on the input of wind velocity time histories.
The generated sinusoidal flow can be defined by u(t) = U + Δu · sin(2πfut), the velocity oscillated in the along-wind (u-) direction. The time-averaged wind velocity was U = 8 m/s, and the Reynolds number based on the depth D was ReD = 16,080. The oscillation frequency (fu) and reduced amplitude (Δu/U) were in the range of 0.2 ≤ fu ≤ 1.2 Hz and 0 ≤ Δu/U ≤ 0.25, respectively. In the remainder of this paper, the sinusoidal flow configuration with the frequency α and amplitude β will be referred to SF (α,β). For the purpose of comparisons, the smooth flow cases were also generated, which can be regarded as fu = 0 and Δu/U = 0.
The wind velocity was measured without the model in the wind tunnel, using TFI Cobra Probes placed at the same x, z coordinates as the tested cylinder model. To measure the spanwise distributions, the measurement was carried out simultaneously using five Cobra Probes set at different spanwise (y) positions. The sampling frequency of the Cobra Probes was set at 200 Hz.
As shown in Figure 2a,b, the tested rectangular cylinder is 0.15 (chord) × 0.03 (depth) × 1.5 (length) m, with a chord-depth ratio of B/D = 5:1. The model was made of ABS plastics and two thin plates were installed at each end to avoid the end effects (Figure 2c). The pressures at every surface tap were simultaneously measured using DSM 3400 scanners with a frequency of 200 Hz and a sampling time of 60 s. Six scanners were mounted inside the model at six strips (A to F, as shown in Figure 2b) along the model axis. During each test, the angles of attack (AoA) considered in the pressure measurements ranged from 0° to 8°. We carefully repeated the tests in the smooth flow at a zero AoA to ensure the initial symmetry conditions of the experiments. Meanwhile, the initial set-ups were carefully checked to ensure they were consistent for all cases.

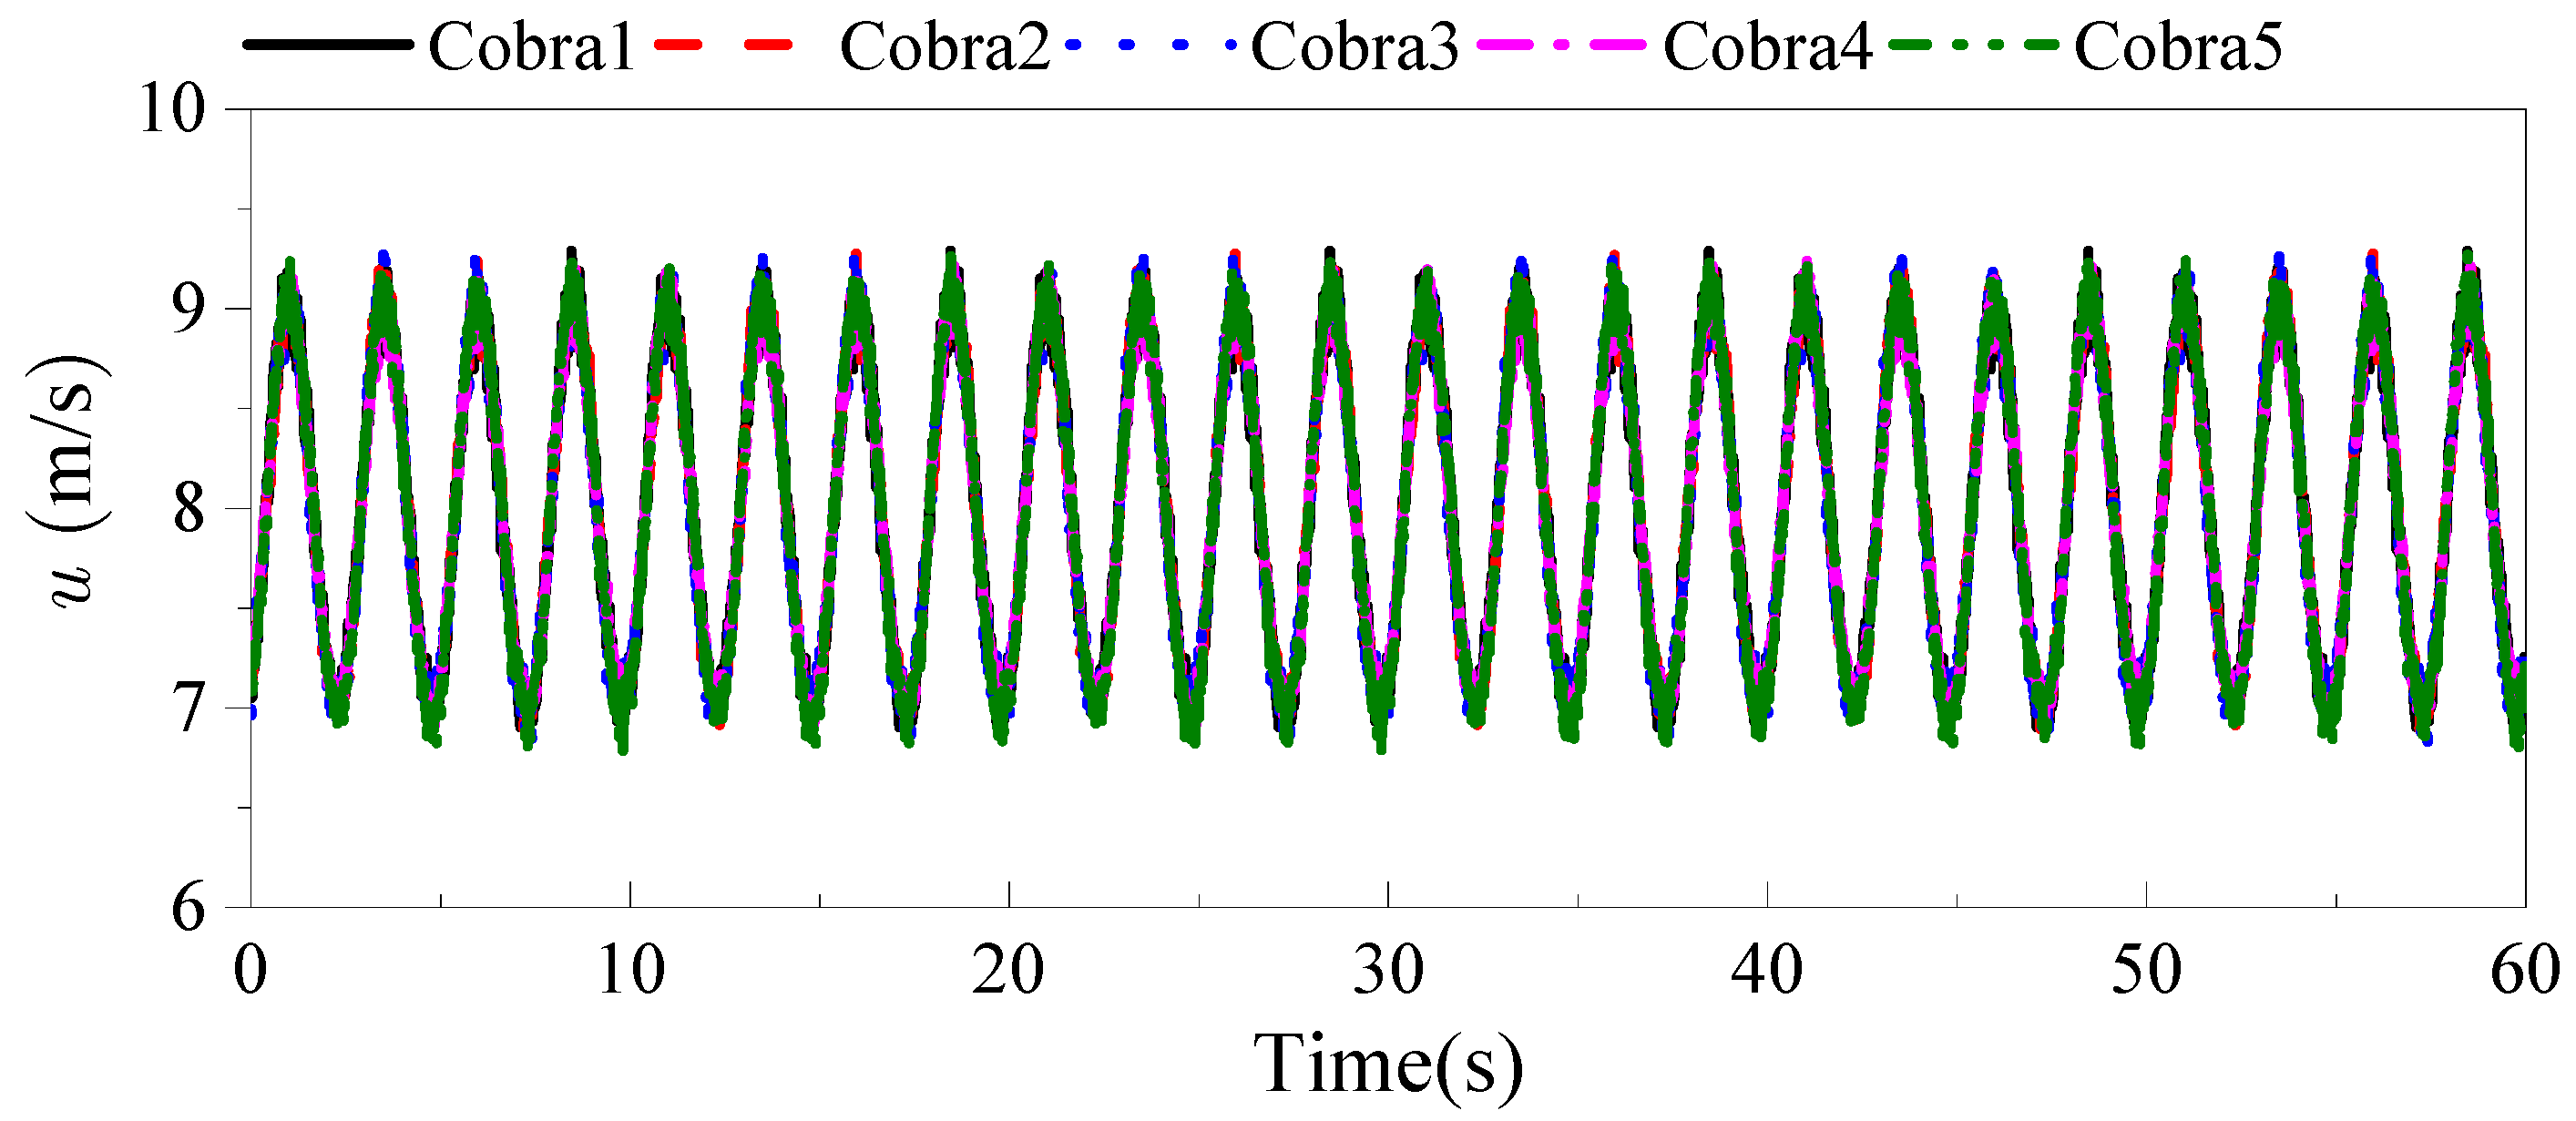
2.2. Characteristics of Sinusoidal Flow

Figure 3 shows the time histories for one of the sinusoidal flows, measured by the five TFI cobra probes shown in Figure 2. It follows that each result overlaps onto a single curve, indicating that the flow field is spanwise fully coherent. Figure 4 shows the power spectra of sinusoidal flows with different frequencies and amplitudes. The spectral distributions are very close to that of a pure sinusoidal wave and thus imply that each sinusoidal flow can be considered harmonic with a single frequency.

3. Spectral Analysis

The drag, lift, and pitching moment forces (FD, FL, and FM) acting on the cylinder are obtained by the integration of the surface pressures of each tap along one strip (see Figure 2). Figure 5 shows the drag coefficient CD = FD/(0.5ρU2D), lift coefficient C L = F L / ( 0.5 ρ U 2 B ) , and pitching moment coefficient C M = F M / ( 0.5 ρ U 2 B 2 ) measured at the center strip (Strip C), where ρ = 1.225 kg/m3 is the air density. Although the approaching wind velocity oscillates harmonically, the aerodynamic forces are distorted and not purely sinusoidal with time.
To further analyze the above phenomenon, Figure 6 shows the power spectra of the fluctuating aerodynamic forces, plotted as the non-dimensional quantity fSm/(C′m)2 against the frequency f, where m = L, D, M. Three cases with different frequencies and amplitudes, SF (0.2, 0.0625), SF (0.6, 0.125) and SF (0.8, 0.25), are chosen for comparison. It is shown that all spectra have two dominant frequency peaks: the lower one flow and the higher one fhigh. The flow coincides with the frequency of the inflow velocity oscillations (fu) and is insensitive to Δu/U and AoA. In contrast, the fhigh seems to be insensitive to flow and has the same values in the spectra of CD, CL, and CM (for a given case), which is an indication of the vortex-shedding frequency (fs). These two frequency peaks reveal that the fluctuating aerodynamic forces have two components: the contribution from the inflow velocity oscillation, and the contribution from the wake vortex shedding. We notice that the spectral characteristics described above are quite different from those in smooth flows, where only the vortex-shedding frequency peak can be observed. This is because the fluctuations of aerodynamic force in smooth flows are fully due to wake vortex-shedding [28,33].
Meanwhile, another frequency peak is observed in the power spectra of CD, CL, and CM for the case SF (0.8, 0.25), which is at the frequency 2fu as shown in Figure 6(c1–c3). This secondary effect appears when the frequency and amplitude of oncoming velocity oscillations are relatively high and may lead to a certain nonlinear behavior of the aerodynamic forces. According to Pan et al. [34], this frequency multiplication phenomenon is caused by the reflection resonance effects when the sinusoidal wind velocity oscillations pass to the boundary wall of the wind tunnel. It is also worth pointing out that Xu et al. [35] revealed that the self-excited forces also contain higher-order components. They showed that the dominant frequency of the self-excited drag force is twice the vibration frequency of the model, different from the buffeting drag force investigated in the present study.
On the other hand, it follows that the higher frequency peak, i.e., the vortex-shedding frequency fs, is dependent on the parameters of the oncoming flow. Figure 7a shows the changes of Strouhal number St with the AoA in typical sinusoidal flows; the results in smooth flows are also shown for comparison. The Strouhal number St = fsD/U is determined from the spectra of lift force, where the vortex shedding frequency fs takes the dominated frequency component in the spectra. It is shown that the St number of different sinusoidal flow cases change with the AoA in a similar trend, which probably indicates a similar fluid pattern in sinusoidal flows with different parameters. At a zero AoA, the St number in the sinusoidal flows is smaller than that in the smooth flow; this agrees with that in Konstantinidis et al. [12] for a circular cylinder. According to the instantaneous flow field analyzed in our previous study [29], the above phenomenon is due to the interactions between the approaching velocity oscillations and the reattaching shear layer, which result in the lag of the timing for the vortices to shed into the wake. Nevertheless, the St number in the sinusoidal flows with non-zero AoAs becomes larger than in the smooth flows. This is because in a flow with only u-velocity fluctuations, the configuration of zero AoA produces large-scale longitudinal vortices, which are symmetrical about the upper and lower surfaces. By contrast, at non-zero AoAs the large-scale vortices become asymmetric between the upper and lower surfaces. Consequently, the vortex-shedding has different evolution processes at zero and non-zero AoA.
The different mechanisms between zero and non-zero AoAs are also evident in the effects of Δu/U. It is observed in Figure 7b for the zero AoA that the St slightly decreases as Δu/U increases. However, as shown in Figure 7c–f for AoA = 2°, 4°, 6°, and 8°, respectively, the St increases significantly with an increase in Δu/U. This result is similar to that of Mannini et al. [24], who reported an increase in St as the intensity of broadband turbulence increases. It is known that increasing turbulence intensity causes the shortening of the separation bubbles, leading to smaller and smaller vortices prevailing in the reattaching zone. Since the smaller vortices are of relatively higher frequency, they can shed downstream at a faster convection speed and result in a higher shedding frequency. Therefore, the St number is increased with the intensity of the approaching flow.
On the other hand, changes of fu have limited influences on St either at zero or non-zero AoAs, which is consistent with the results of Li et al. [30] for a zero AoA. It was concluded in many works in the literature [36,37,38] that the effects of the integral length scale highly depend on the ratio L/D, where L is the longitudinal integral length scale of the flow and D is the characteristic size of the structure. Remind that a sinusoidal flow can be considered as narrow-band turbulence whose nominal length scale equals the wavelength ( L u = U/fu). Likewise, the negligible effect of fu on the St number is related to the range of the nominal length scale.

4. Time-Averaged and Fluctuating Forces

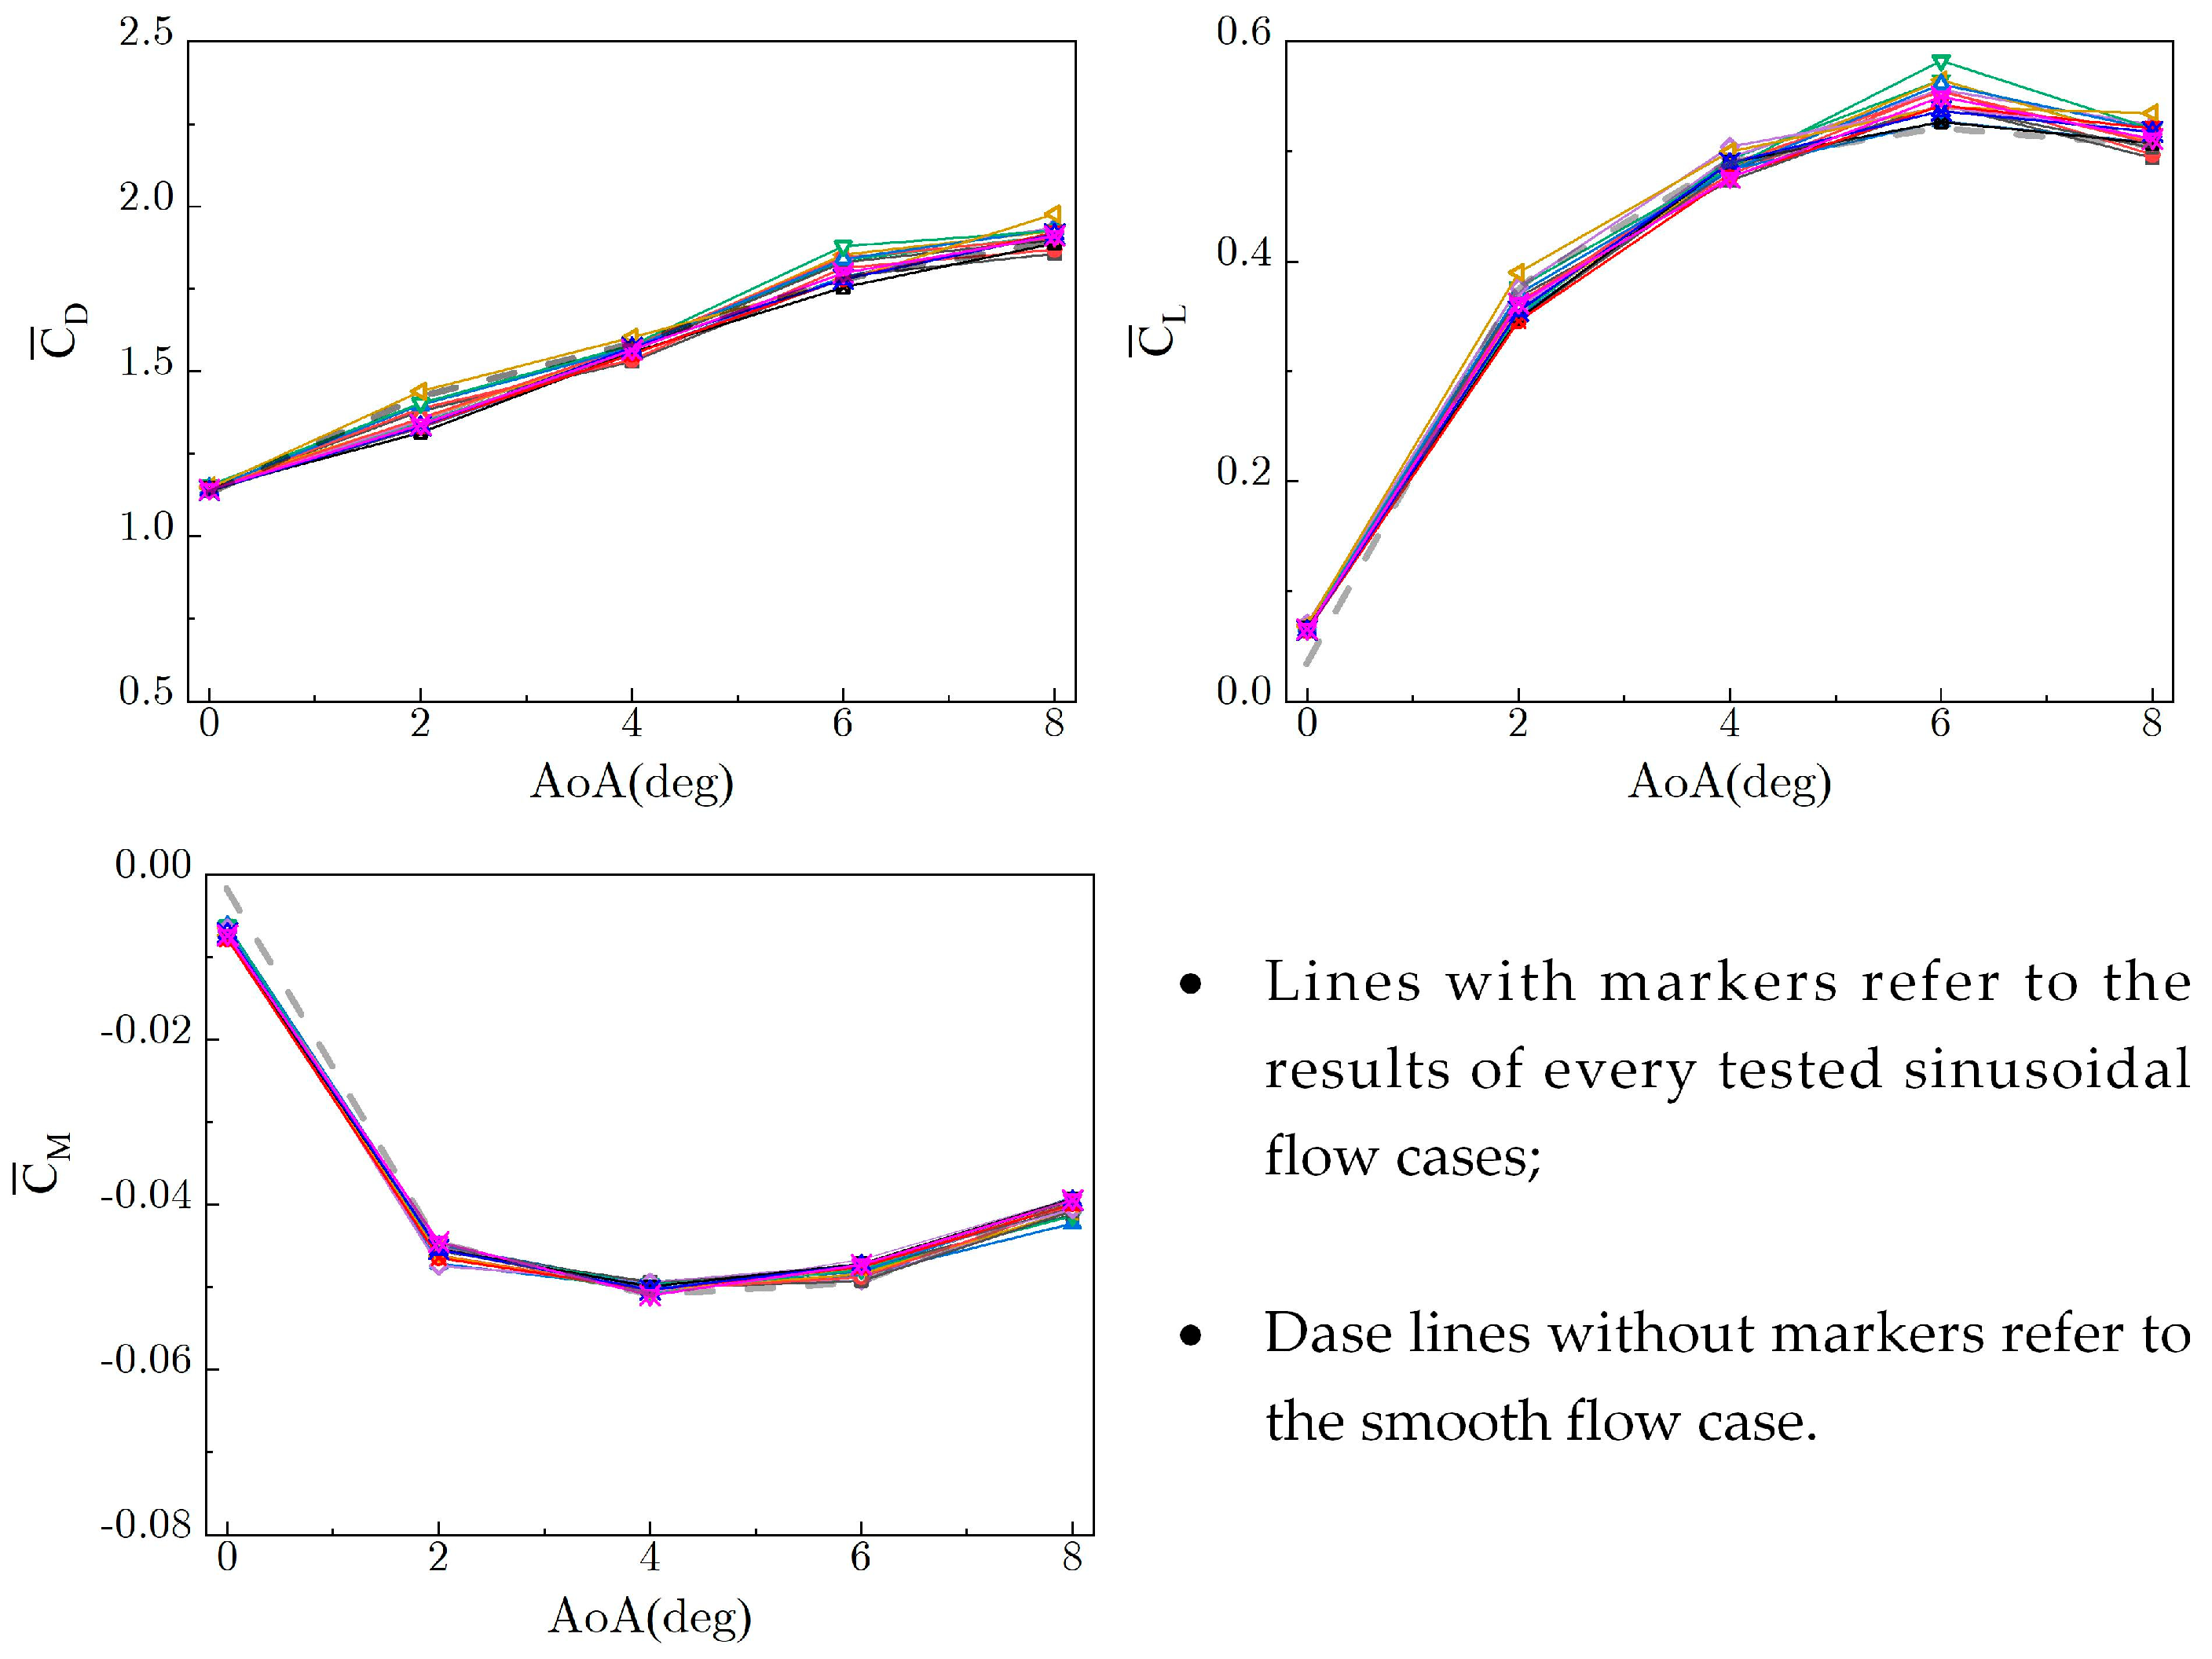
4.1. Effects of the Frequency, Amplitude, and AoA

The time-averaged aerodynamic forces ( C ¯ D , C ¯ L and C ¯ M ) for all sinusoidal flow cases at all AoAs are shown in Figure 8, and the results in the smooth flows are also given. The good collapse of results in each figure suggests that C ¯ D , C ¯ L and C ¯ M are insensitive to the changes in fu and Δu/U. Meanwhile, the C ¯ D , C ¯ L and C ¯ M in the smooth flows are very close to the sinusoidal flow cases. Using vibrating airfoils, Li et al. [30] generated sinusoidal flows with the frequencies 0.4 Hz and 1.0 Hz. They found that the frequency has little effect on the time-averaged pressure coefficients, which comply with the present results. Similar to the St number as discussed above, the insensitivity of time-averaged aerodynamic forces is due to the range of the nominal length scale, which cannot influence the time-averaged flow effectively.
The 3D contours in the left column of Figure 9 indicate the effects of fu and Δu/U on the fluctuating aerodynamic forces ( C D ,   C L and C M ), by taking the condition AoA = 4° for instance. There is a strong dependence of C D ,   C L and C M on Δu/U, which agrees with the work of Pan et al. [34]. It is noted that Zhang et al. [39] pointed out that the aerodynamic derivatives are highly sensitive to the vibration amplitude of the model, which is similar to the sensitivities of fluctuating aerodynamic coefficients to the inflow amplitude. With increasing Δu/U, the increase in C D is nearly linear, while those in   C L and C M exhibit some nonlinear characteristics. The latter is probably an indication of the frequency secondary effects, as shown in Figure 6. On the other hand, little effect of fu on C D ,   C L and C M is observed, once again, due to the frequency range of sinusoidal flows in current tests.
Graphs in the right column of Figure 9 exhibit the envelopes of the results of all sinusoidal flow cases and those for significant cases are presented as curves to depict the effects of AoA. It is noticed that the C D ,   C L and C M in the smooth flows are significantly smaller than those in the sinusoidal flows. This conforms to the effects of Δu/U as discussed above because a smooth flow has the amplitude of velocity oscillation Δu/U = 0. For the time-averaged and RMS aerodynamic forces in the sinusoidal flows, there is a similar variation trend with AoA as in the smooth flows. The trends are consistent with those collected in [24,28]. We conjecture this similarity as a general pattern of the dependence of flow separation-reattachment on AoA under these flow configurations.

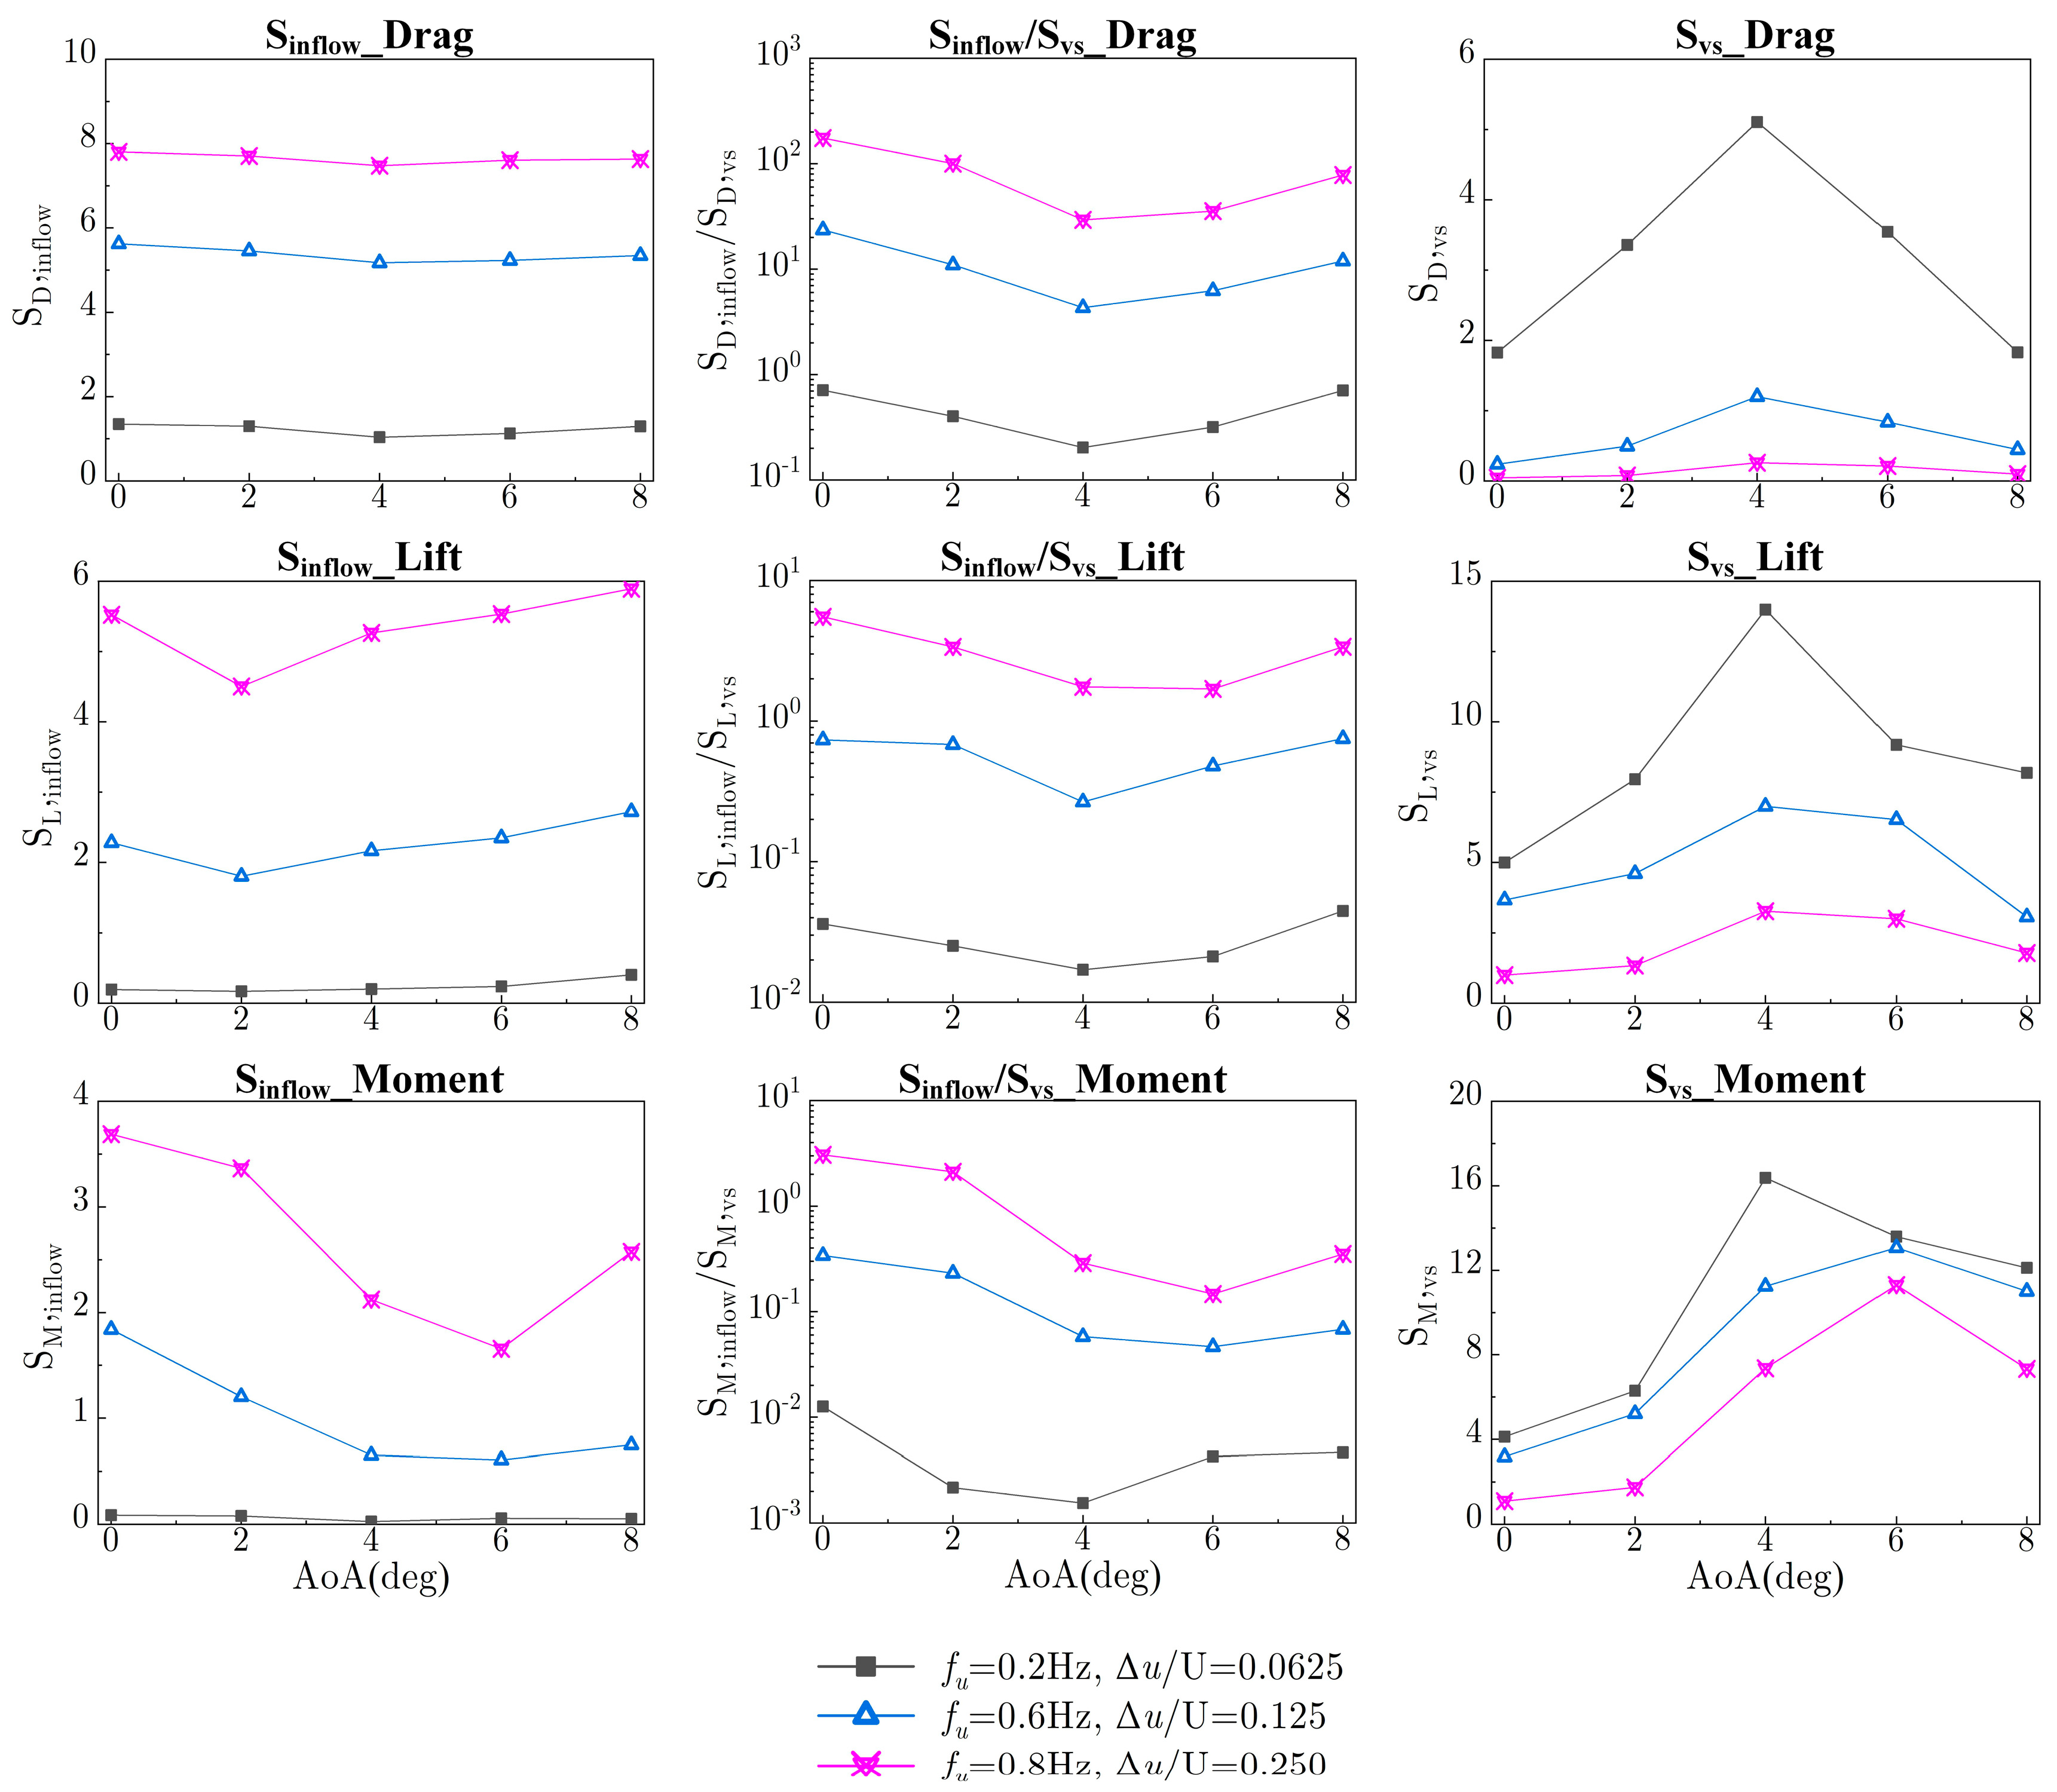
4.2. Contributions of Inflow Velocity Oscillation and Wake Vortex-Shedding

As discussed in Section 3, the drag, lift, and moment are contributed by the inflow velocity oscillation and the wake vortex-shedding. To evaluate the level of each component to the total force fluctuations, here we define the contribution as the integration of the spectra over a small frequency range centered on the given frequency:
  • Sinflow: the integration of PSD centered on the frequency flow = fu, indicating the contribution from inflow velocity oscillation;
  • Svs: the integration of PSD centered on the frequency fhigh = fs, indicating the contribution from wake vortex-shedding.
Taking AoA = 4° for instance, the Sinflow, Svs, and the ratio Sinflow/Svs for the drag, lift, and pitching moment are shown in Figure 10 as functions of fu and Δu/U. Because the fluctuating drag force acts in the direction of the approaching wind velocity fluctuation (u-), the contribution from inflow velocity oscillation is dominant (Sinflow/Svs >> 1) for the drag of the majority of cases, whereas for the lift and moment, the ratio Sinflow/Svs is much smaller than the drag fluctuation for the same case, which perhaps indicates that the lift and moment are more sensitive to vortex shedding than to inflow velocity oscillations. Nevertheless, for the lift force, there is a dependence of Sinflow/Svs on fu, and Δu/U: Svs is predominant when Δu/U < 0.15 or/and fu < 0.8, and vice versa when Δu/U ≥ 0.15 and fu ≥ 0.8. For the pitching moment, Svs is always dominant as the ratio Sinflow/Svs among all cases is less than 0.5.
Another important finding in Figure 10 is the strong dependence of the inflow contribution Sinflow on both fu and Δu/U: either an increase in fu or Δu/U has the effect of increasing Sinflow. In contrast, the vortex-shedding contribution Svs decreases as Δu/U increases but changes little with fu.
To study how the AoA influences the two contributions of drag, lift, and pitching moment, three significant cases with different fu and Δu/U are chosen, for instance. The results are shown in Figure 11. For each force, it is clearly shown that the inflow contribution Sinflow and the ratio Sinflow/Svs exhibit a decrease-then-increase trend as AoA increases from 0° to 8°, likely due to the different variations with AoA for separation bubbles on both lateral sides of the cylinder, whereas the vortex-shedding contribution Svs varies in an inverse trend, once again indicating the competition between the contribution from inflow velocity oscillation and the one from wake vortex shedding.

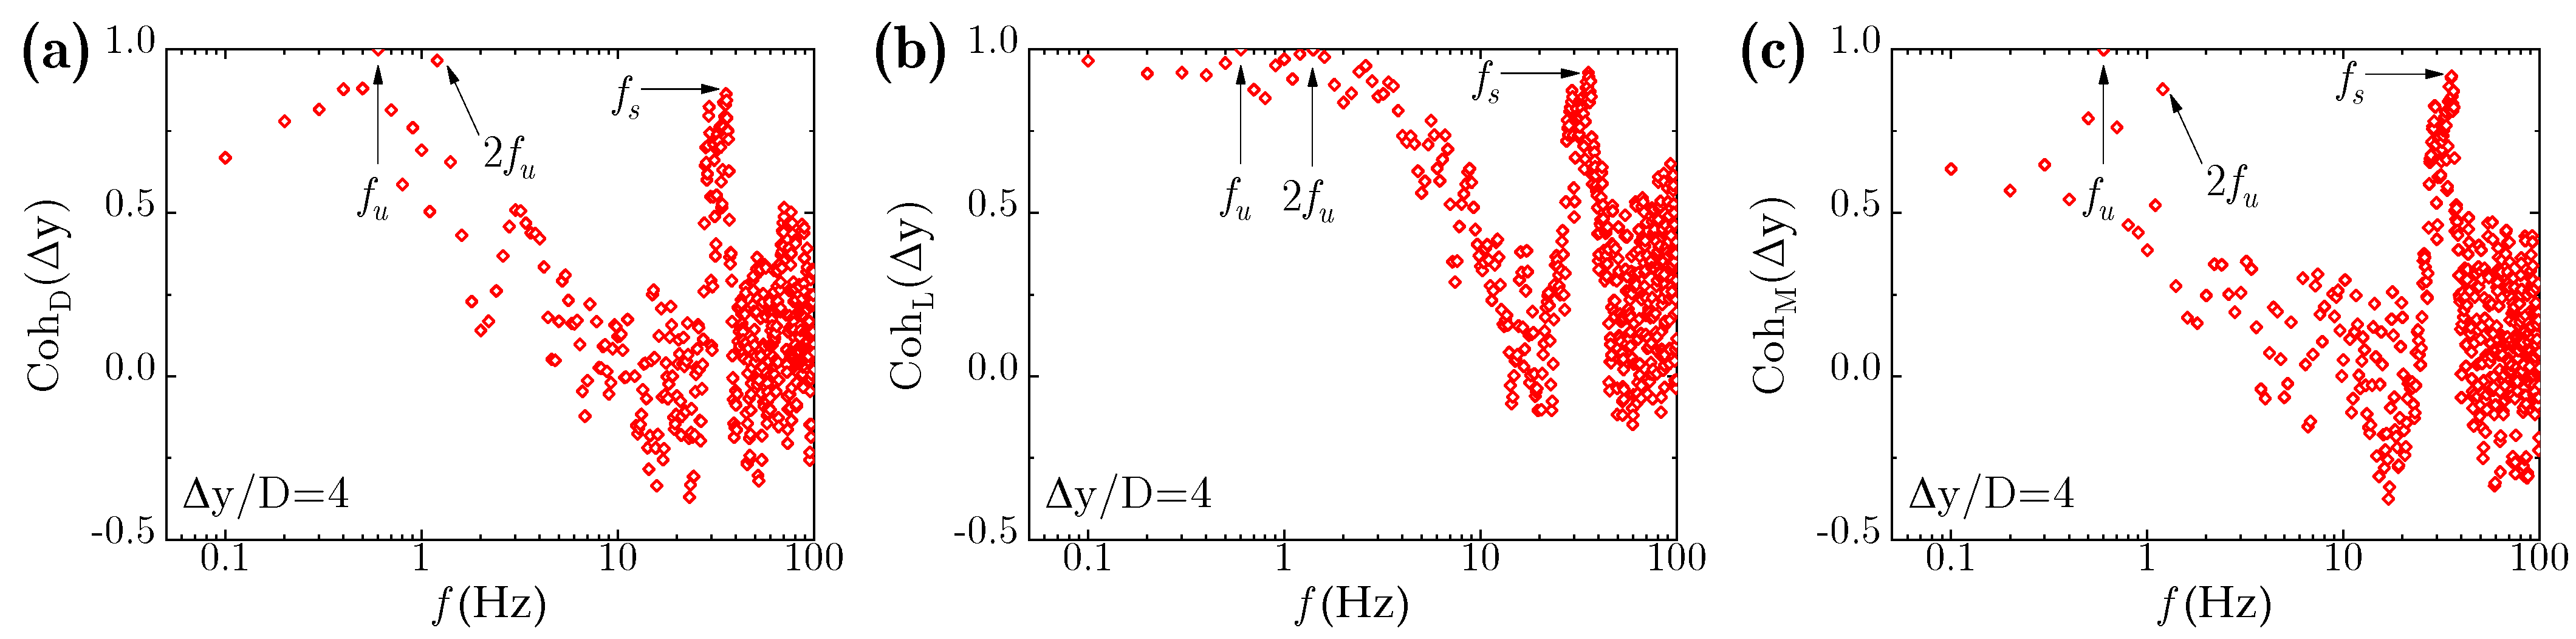
5. Spanwise Characteristics

It should be emphasized that the aerodynamic forces in the present study refer to the results acting on a single strip with a zero span length. Therefore, when analyzing the global sectional forces, it is necessary to consider the correlation between strips. The spanwise correlation is defined by
R F ( Δ y ) = C o v C F t , y 1 , C F t , y 2 C o v C F t , y 1 · C o v C F t , y 2
where CF corresponds to CD, CL, and CM, respectively. Cov[ ] is the operator of covariance; y1 and y2 are the spanwise positions of two pressure strips and Δ y = | y 1 y 2 | .
Figure 12 shows the spanwise correlation coefficients as functions of the reduced distance Δy/D for significant sinusoidal flows at all considered AoAs. It is clearly seen that an increase in Δy/D causes RD, RL, and RM to decrease, whereas for a given case, it follows that RD > RL > RM. The underlying causes of this phenomenon are interpreted as follows: the drag fluctuations are mainly produced by the fluctuating wind velocities inherent in the approaching flow (spanwise full coherent), whereas the main mechanism leading to the fluctuations of lift and pitching moment is wake vortex-shedding (less spanwise-correlated). The drag forces at all AoAs, as shown in Figure 12(b1,c1), have high correlations (very close to 1) along the span. This probably indicates that the drag force can be considered spanwise fully coherent when the frequency and amplitude of the sinusoidal flows are relatively high.
To quantify the effects of fu, Δu/U, and AoA on the spanwise distributions, here we introduce the spanwise integral length:
λ F = 1 D 0 ( Δ y ) max R F ( Δ y ) d Δ y
The spanwise integral length of drag, lift, and pitching moment, non-dimensionalized by plate dimension D, are shown in Figure 13, wherein the left column graphs are the results at AoA = 4°, indicating the effects of fu and Δu/U. An increase in Δu/U has shown to significantly increase λD, λL, and λM, which can be interpreted as follows:
  • First, the contribution of the inflow-induced component (Sinflow) in drag, lift, and pitching moment increase as Δu/U increases (see Figure 10);
  • Secondly, the Sinflow of aerodynamic forces are spanwise fully correlated according to a previous study by the author [9];
In this context, the aerodynamic forces have better correlations in sinusoidal flows with higher amplitudes Δu/U. The increase in λD, λL, and λM with Δu/U can also explain the observation that the spanwise integral lengths in the sinusoidal flows are significantly larger than those in the smooth flows (which can be viewed as Δu/U = 0). In contrast to the strong dependence on Δu/U, the changes in fu seem to have negligible effects on λD, λL, and λM, likely due to the nominal length-scales of sinusoidal flows in current tests being large enough compared to the model size.
The right column of Figure 13 shows the variations of λD, λL, and λM with the AoA by taking significant cases, for instance, envelopes for all the sinusoidal flow cases are also demonstrated. It follows that the effects of AoA are functions of the value of correlation. When the correlation length is larger enough (>8D) than the model size, observed for the λD of all cases and the λL of SF (0.8, 0.25), it is insensitive to the increasing AoA up to 8°. Presumably, a larger AoA is required in these sinusoidal flows to cover the apparent variations in the correlation length. In contrast, an increase in AoA causes significant changes in the correlation length of relatively small values (<8D), as is evident by the λL of resistance cases and the λM of all cases. More precisely, they increase as the AoA increases from 0° to 4° but decreases with further increase in AoA. Once again, the above inflexional profiles could be attributed to the changes in the extent of separation bubbles on either side surface of the model.
Moreover, the coherence of aerodynamic force is analyzed to highlight the spanwise characteristics in the frequency domain. At a spanwise separation of Δy, the coherence function is expressed as
C o h F ( Δ y , f ) = S F ( Δ y , f ) S F y 1 , f S F y 2 , f
where S F ( y 1 ,   f ) and S F ( y 2 ,   f ) are the power spectra at y1 and y2, respectively, S F ( Δ y ,   f ) is the cross-spectrum between them.
Taking the case SF (0.6, 0.125) at 4° for example, the coherence of drag, lift, and pitching moment at the distance Δy/D = 4 are demonstrated in Figure 14. High coherence peaks can be recognized in all plots at the frequencies fu, 2fu, and fs. Outside these regions, the coherence decays rapidly as the frequency grows. It is reasonable to suggest that the high peaks at fu and 2fu are, respectively, indications of the inflow-induced components of aerodynamic forces and the corresponding secondary effects. In contrast, the peak at fs is primarily due to the vortex shedding, which coincides with that in a smooth flow [25].

6. Conclusions

Within the scope of the BARC project, the aerodynamic behaviors of a 5:1 rectangular cylinder in sinusoidal flows at different angles of attack were experimentally investigated. The sinusoidal flows were single frequency with wind velocity fluctuations in the streamwise direction. The effects of frequency (fu), amplitude (Δu/U), and angles of attack (AoA) of the sinusoidal flow on the spectral domain, time-averaged and RMS values, and spanwise distributions of aerodynamic forces were analyzed. Results were compared with the smooth flow cases, and the differences were discussed. The most important findings are summarized as follows.
Spectral analyses indicated the most remarkable difference between the sinusoidal flow cases and the smooth flow cases: in sinusoidal flows, the force (drag, lift, and moment) fluctuations have two components, the one induced by the sinusoidal fluctuating velocities inherent in the approaching flow and the other induced by wake vortex-shedding, whereas in smooth flows, the fluctuating forces are due to wake vortex-shedding. This difference makes the drag, lift, and moment forces in sinusoidal flows have larger RMS values and better spanwise correlations than those in smooth flows. Additionally, for each of the above statistical parameters, there is a similar variation trend with AoA in sinusoidal flow and smooth flows.
Under sinusoidal flows, the competition between the inflow-induced components (Sinflow) and vortex shedding-induced components (Svs) of the total forces was discussed. For drag, lift, and moment forces, the Sinflow component and its ratio to the total fluctuation increase with fu and Δu/U. By contrast, the effects of fu and Δu/U on the Svs component depend on the AoA: at a zero AoA, it is insensitive to fu and Δu/U, whereas at non-zero AoAs, it changes little with fu but decreases as Δu/U increases. This difference is related to the changes of the Strouhal number, which slightly decreases at a zero AoA but significantly increases at non-zero AoAs when the Δu/U is increased.
Additionally, under sinusoidal flows of zero and non-zero AoAs, it generally follows that the drag fluctuations are dominated by the Sinflow component. In contrast, the lift and moment are more sensitive to the Svs component. This makes the drag force have better spanwise correlations than the lift and moment.

Author Contributions

Conceptualization, B.W.; methodology, B.W. and L.Z.; validation, H.Z. and L.Z.; formal analysis, B.W. and J.X.; investigation, J.Z. and J.X.; writing—original draft preparation, B.W.; writing—review and editing, J.X., J.Z. and X.Y.; project administration, J.Z. and H.Z.; funding acquisition, B.W. and J.X. All authors have read and agreed to the published version of the manuscript.

Funding

This work is funded by the National Natural Science Foundation of China (Grant Nos. 52108435, 51978111), China Postdoctoral Science Foundation (Grant No. 2022MD713699), the Natural Science Foundation of Chongqing, China (Grant No. cstc2021jcyj-bshX0061), and the Startup Project for High-level Talents of Chongqing Jiaotong University (Grant No. 21JDKJC-A037).

Institutional Review Board Statement

Not applicable.

Informed Consent Statement

Not applicable.

Data Availability Statement

The data used to support the findings of this study are available from the corresponding author upon request.

Acknowledgments

Bo Wu gratefully acknowledges the faculty of the State Key Laboratory of Disaster Reduction in Civil Engineering at Tongji University for assistance.

Conflicts of Interest

The authors declare no conflict of interest.

References

  1. Theodorsen, T. General Theory of Aerodynamic Instability and the Mechanism of Flutter; No. 496; NASA: Washington, DC, USA, 1935.
  2. Sears, W.R. Some aspects of non-stationary airfoil theory and its practical application. J. Aeronaut. Sci. 1941, 8, 104–108. [Google Scholar] [CrossRef]
  3. Ribner, H.S. Spectral theory of buffeting and gust response: Unification and extension. J. Aeronaut. Sci. 1956, 23, 1075–1077. [Google Scholar] [CrossRef]
  4. Scanlan, R.H. Problematics in Formulation of Wind-Force Models for Bridge Decks. J. Eng. Mech. 1993, 119, 1353–1375. [Google Scholar] [CrossRef]
  5. Diana, G.; Bruni, S.; Cigada, A.; Zappa, E. Complex aerodynamic admittance function role in buffeting response of a bridge deck. J. Wind Eng. Ind. Aerodyn. 2002, 90, 2057–2072. [Google Scholar] [CrossRef]
  6. Chen, Z.Q.; Han, Y.; Hua, X.G.; Luo, Y.Z. Investigation on influence factors of buffeting response of bridges and its aeroelastic model verification for Xiaoguan Bridge. Eng. Struct. 2009, 31, 417–431. [Google Scholar] [CrossRef]
  7. Ma, T.T.; Zhao, L.; Cao, S.Y.; Ge, Y.J.; Miyagi, H. Investigations of aerodynamic effects on streamlined box girder using two-dimensional actively-controlled oncoming flow. J. Wind Eng. Ind. Aerodyn. 2013, 122, 118–129. [Google Scholar] [CrossRef]
  8. Yang, Y.; Li, M.; Ma, C.; Li, S. Experimental investigation on the unsteady lift of an airfoil in a sinusoidal streamwise gust. Phys. Fluids 2017, 29, 51703. [Google Scholar] [CrossRef]
  9. Wu, B.; Li, S.; Zhang, L.; Li, K. Experimental determination of the two-dimensional aerodynamic admittances of a 5:1 rectangular cylinder in streamwise sinusoidal flows. J. Wind Eng. Ind. Aerodyn. 2021, 210, 104525. [Google Scholar] [CrossRef]
  10. Feshalami, B.F.; He, S.; Scarano, F.; Gan, L.; Morton, C. A review of experiments on stationary bluff body wakes. Phys. Fluids 2022, 34, 11301. [Google Scholar] [CrossRef]
  11. Tanida, Y.; Okajima, A.; Watanabe, Y. Stability of a circular cylinder oscillating in uniform flow or in a wake. J. Fluid Mech. 1973, 61, 769–784. [Google Scholar] [CrossRef]
  12. Konstantinidis, E.; Balabani, S.; Yianneskis, M. The effect of flow perturbations on the near wake characteristics of a circular cylinder. J. Fluid Struct. 2003, 18, 367–386. [Google Scholar] [CrossRef]
  13. Nomura, T.; Suzuki, Y.; Uemura, M.; Kobayashi, N. Aerodynamic forces on a square cylinder in oscillating flow with mean velocity. J. Wind Eng. Ind. Aerodyn. 2003, 91, 199–208. [Google Scholar] [CrossRef]
  14. Chen, C.; Fang, F.; Li, Y.; Huang, L.; Chung, C. Fluid forces on a square cylinder in oscillating flows with non-zero-mean velocities. Int. J. Numer. Methods Fluids 2009, 60, 79–93. [Google Scholar] [CrossRef]
  15. Zhao, M.; Cheng, L.; Zhou, T. Three-dimensional numerical simulation of oscillatory flow around a circular cylinder at right and oblique attacks. Ocean Eng. 2011, 38, 2056–2069. [Google Scholar] [CrossRef]
  16. Cigada, A.; Diana, G.; Zappa, E. On the response of a bridge deck to turbulent wind: A new approach. J. Wind Eng. Ind. Aerodyn. 2002, 90, 1173–1182. [Google Scholar] [CrossRef]
  17. Tang, Q.; Xin, J.; Jiang, Y.; Zhou, J.; Li, S.; Chen, Z. Novel identification technique of moving loads using the random response power spectral density and deep transfer learning. Measurement 2022, 195, 111120. [Google Scholar] [CrossRef]
  18. Xin, J.; Jiang, Y.; Zhou, J.; Peng, L.; Liu, S.; Tang, Q. Bridge deformation prediction based on SHM data using improved VMD and conditional KDE. Eng. Struct. 2022, 261, 114285. [Google Scholar] [CrossRef]
  19. Huang, H.; Yan, Z.; Zeng, Y.; Yue, T.; Yan, J.; Fu, H. Experimental study on the pressure distribution of a low aspect-ratio circular cylinder and interference effects of a square cylinder in downburst flows. J. Braz. Soc. Mech. Sci. 2021, 43, 294. [Google Scholar] [CrossRef]
  20. Bartoli, G.; Bruno, L.; Buresti, G.; Ricciarelli, F.; Salvetti, M.V.; Zasso, A. BARC Overview Document. Available online: http://www.aniv-iawe.org/barc (accessed on 28 April 2017).
  21. Bruno, L.; Salvetti, M.V.; Ricciardelli, F. ERCOFTAC QNET-CFD Knowledge Base Wiki: Benchmark on the Aerodynamics of a Rectangular 5:1 Cylinder (BARC). 2017. Available online: http://www.kbwiki.ercoftac.org/w/index.php/Abstr:UFR_2-15 (accessed on 17 August 2019).
  22. Bruno, L.; Salvetti, M.V.; Ricciardelli, F. Benchmark on the Aerodynamics of a Rectangular 5:1 Cylinder: An overview after the first four years of activity. J. Wind Eng. Ind. Aerodyn. 2014, 126, 87–106. [Google Scholar] [CrossRef] [Green Version]
  23. Mannini, C.; Šoda, A.; Schewe, G. Unsteady RANS modelling of flow past a rectangular cylinder: Investigation of Reynolds number effects. Comput. Fluids 2010, 39, 1609–1624. [Google Scholar] [CrossRef] [Green Version]
  24. Mannini, C.; Marra, A.M.; Pigolotti, L.; Bartoli, G. The effects of free-stream turbulence and angle of attack on the aerodynamics of a cylinder with rectangular 5:1 cross section. J. Wind Eng. Ind. Aerodyn. 2017, 161, 42–58. [Google Scholar] [CrossRef]
  25. Bruno, L.; Fransos, D.; Coste, N.; Bosco, A. 3D flow around a rectangular cylinder: A computational study. J. Wind Eng. Ind. Aerodyn. 2010, 98, 263–276. [Google Scholar] [CrossRef] [Green Version]
  26. Mariotti, A.; Siconolfi, L.; Salvetti, M.V. Stochastic sensitivity analysis of large-eddy simulation predictions of the flow around a 5:1 rectangular cylinder. Eur. J. Mech. B Fluids 2017, 62, 149–165. [Google Scholar] [CrossRef]
  27. Mariotti, A.; Salvetti, M.V.; Omrani, P.S.; Witteveen, J.A.S. Stochastic analysis of the impact of free-stream conditions on the aerodynamics of a rectangular 5:1 cylinder. Comput. Fluids 2016, 136, 170–192. [Google Scholar] [CrossRef] [Green Version]
  28. Wu, B.; Li, S.; Li, K.; Zhang, L. Numerical and experimental studies on the aerodynamics of a 5:1 rectangular cylinder at angles of attack. J. Wind Eng. Ind. Aerodyn. 2020, 199, 104097. [Google Scholar] [CrossRef]
  29. Wu, B.; Li, S.; Li, K.; Yang, Q.; Zhang, L.; Qian, G. Large-eddy simulation of the near wake of a 5:1 rectangular cylinder in oscillating flows at Re=670. J. Wind Eng. Ind. Aerodyn. 2020, 196, 104050. [Google Scholar] [CrossRef]
  30. Li, M.; Li, Q.; Shi, H. Aerodynamic pressures on a 5:1 rectangular cylinder in sinusoidal streamwise oscillatory flows with non-zero mean velocities. J. Wind Eng. Ind. Aerodyn. 2021, 208, 104440. [Google Scholar] [CrossRef]
  31. Zhong, Y.; Li, S.; Jin, W.; Yan, Z.; Liu, X.; Li, Y. Frequency Domain Analysis of Alongwind Response and Study of Wind Loads for Transmission Tower Subjected to Downbursts. Buildings 2022, 12, 148. [Google Scholar] [CrossRef]
  32. Jiang, Y.; Zhao, N.; Peng, L.; Xin, J.; Liu, S. Fast simulation of fully non-stationary wind fields using a new matrix factorization assisted interpolation method. Mech. Syst. Signal Processing 2022, 172, 108973. [Google Scholar] [CrossRef]
  33. Liu, X.; Yang, Y.; Sun, Y.; Zhong, Y.; Zhou, L.; Li, S.; Wu, C. Tuned-Mass-Damper-Inerter Performance Evaluation and Optimal Design for Transmission Line under Harmonic Excitation. Buildings 2022, 12, 435. [Google Scholar] [CrossRef]
  34. Pan, T.; Zhao, L.; Cao, S.Y.; Ge, Y.J.; Ozono, S. Analysis of Aerodynamic Load Effect on Thin Plat Section in Multiple Fan Active Control Wind Tunnel. Procedia Eng. 2011, 14, 2481–2488. [Google Scholar] [CrossRef] [Green Version]
  35. Xu, F.Y.; Wu, T.; Ying, X.Y.; Kareem, A. Higher-Order Self-Excited Drag Forces on Bridge Decks. J. Eng. Mech. 2016, 142, 06015007. [Google Scholar] [CrossRef]
  36. Hillier, R.; Cherry, N.J. The effects of stream turbulence on separation bubbles. J. Wind Eng. Ind. Aerodyn. 1981, 8, 49–58. [Google Scholar] [CrossRef]
  37. Li, Q.S.; Melbourne, W.H. The effect of large-scale turbulence on pressure fluctuations in separated and reattaching flows. J. Wind Eng. Ind. Aerodyn. 1999, 83, 159–169. [Google Scholar] [CrossRef]
  38. Li, Q.S.; Melbourne, W.H. An experimental investigation of the effects of free-stream turbulence on streamwise surface pressures in separated and reattaching flows. J. Wind Eng. Ind. Aerodyn. 1995, 54, 313–323. [Google Scholar] [CrossRef]
  39. Zhang, M.; Xu, F.; Zhang, Z.; Ying, X. Energy budget analysis and engineering modeling of post-flutter limit cycle oscillation of a bridge deck. J. Wind Eng. Ind. Aerodyn. 2019, 188, 410–420. [Google Scholar] [CrossRef]
Figure 1. The multiple-fan active control wind tunnel (TJ-6) at Tongji University.
Buildings 12 01033 g001
Figure 2. (a,b) The rectangular model and the pressure taps (cross-section and plan view, unit: mm); (c) the tested model in the wind tunnel.
Buildings 12 01033 g002
Figure 3. Time history of one of the sinusoidal flows.
Buildings 12 01033 g003
Figure 4. Power spectra of sinusoidal flows with different fu and Δu/U.
Buildings 12 01033 g004
Figure 5. Time history of (a): CD, (b): CL, and (c): CM in SF (0.6, 0.125), at AoA = 4°.
Buildings 12 01033 g005
Figure 6. Normalized PSD of CD, CL, and CM in significant sinusoidal flows. (a1a3): Case SF (0.2, 0.0625); (b1b3): Case SF (0.6, 0.125); (c1c3): Case SF (0.8, 0.25).
Buildings 12 01033 g006
Figure 7. Strouhal number: (a) the effects of AoA; (bf) the effects of fu and Δu/U at AoA = 0°, 2°, 4°, 6°, and 8°, respectively.
Buildings 12 01033 g007
Figure 8. Time-averaged CD, CL, and CM of all cases.
Buildings 12 01033 g008
Figure 9. RMS values of CD, CL, and CM. The effects of fu and Δu/U (at AoA = 4°) are shown in the left column, the effects of AoA are shown in the right column.
Buildings 12 01033 g009
Figure 10. Effects of fu and Δu/U on the inflow oscillation-contributions (left column), on the vortex shedding-contributions (right column), and on the ratios between the two contributions for drag, lift, and moment. Results are taken at AoA = 4° for instance.
Buildings 12 01033 g010
Figure 11. Effects of AoA on the inflow oscillation contributions (left column), on the vortex shedding contributions (right column), on the ratios between the two contributions (middle column) for drag, lift, and pitching moment.
Buildings 12 01033 g011
Figure 12. Spanwise correlation coefficients of drag, lift, and pitching moment in typical sinusoidal flows. Top row: SF (0.2, 0.0625); Middle row: SF (0.6, 0.125); Bottom row: SF (0.8, 0.25).
Buildings 12 01033 g012
Figure 13. Spanwise correlation lengths of CD, CL, and CM. The effects of fu and Δu/U (at AoA = 4°) are shown in the left column; the effects of AoA are shown in the right column.
Buildings 12 01033 g013
Figure 14. Coherence functions of (a): CD, (b): CL, and (c): CM in SF (0.6, 0.125) at AoA = 4°.
Buildings 12 01033 g014
Publisher’s Note: MDPI stays neutral with regard to jurisdictional claims in published maps and institutional affiliations.

